effects of tool tilt angle and plunge depth on properties
TRANSCRIPT

Journal of Modern Processes in Manufacturing and Production, Volume 7, No. 4, Autumn 2018
41
Effects of Tool Tilt Angle and Plunge Depth on Properties of
Polycarbonate FSW Joint
Hamidreza Mohammadi Kuhbanani1, Hesameddin Yasemi1, Hamed Aghajani Derazkola2*
1Shahid Dadbin Technical and Vocational University, Kerman, Iran 2Young Researchers and Elites Club, Science and Research Branch, Islamic Azad University, Tehran, Iran
*Email of Corresponding Author: [email protected] Received: August 10, 2019; Accepted: Novamber 3, 2019
Abstract In the present article, the effects of friction stir welding (FSW) tool plunge depth (TPD) and tool tilt angle (TTA) were investigated on the heat generation and the material flow during solid-state joining of polycarbonate (PC) sheet experimentally and simulated with computational fluid dynamics (CFD) method. Simulation results showed that increasing heat input (higher TTA and lower TPD) could increase the size of the stir zone. Results indicate that control of TPD and TTA can improve the material flow near the top surface. The temperature field in the friction stir welding of PC was anti symmetric to the welding line. Due to the results, the heat generation and temperature distribution at the advancing side were more than the retreating side in all joint conditions. According to selected parameters, a strong sample was produced at 1.2 TPD and 2.5 oTTA. This sample had 92% PC tensile strength, 89% PC flexural strength, and 86% of impact energy.
Keywords Friction Stir Welding, PC, Computational Fluid Dynamics, Mechanical Properties 1. Introduction Thermoplastic polymers and their composites are widely employed. In many applications, they replaced metallic materials. This is due to lower material cost, easier and less expensive processing, recyclability, etc. Besides, thermoplastics with high strength to weight ratios are increasingly involved in structural applications. The growing employment and development of new materials are also driven by the spread of Additive Manufacturing processes. The selection of the suitable joining process represents a key aspect for the manufacturing of real components. Common joining techniques e.g. adhesive bonding, mechanical fastening, and even welding processes show different disadvantages and limitations. To this end, advanced welding and joining processes such as laser welding, laser-assisted joining friction stir welding, etc. provide great advantages over common joining processes [1–4]. Friction Stir Welding (FSW) is used to join different materials including metals, thermoplastics, composites and hybrid structures [5-8]. FSW enables great homogeneity of the composition of the weld region with the base material, few internal defects, great process efficiency, and high flexibility. FSW process consists of the stirring action of two sheets exerted by a rotating tool. This makes FSW also suitable for joining most of the thermoplastic materials [9-10]. The literature concerning FSW of metals and especially aluminum alloys is extremely wide, while investigations concerning FSW of polymers are much fewer. Besides, the FSW of polymers (semi-

Effects of Tool Tilt Angle and Plunge Depth on Properties of Polycarbonate FSW Joint, pp. 41-55
42
solid welding) develops quite differently from the FSW of metals (solid-state welding). This is due to the great difference between these materials in terms of mechanical and thermal properties, chemical and physical behaviors. In recent years, the wider employment of thermoplastics polymers and their composites for structural and high-performing applications is driving towards a renewed interest in FSW of polymers and composites. FSW has been applied to a wide range of thermoplastics. The influence of process parameters on the mechanical behavior of FSW welds made on polyethylene (PE) was investigated in [11]. Subsequent research demonstrated that pre-heating of the base material can improve the material flow and consequently the FSW quality. The adoption of low tool rotation speed produced some defects in the stir zone (SZ), which affected the mechanical strength of HDPE welds. This was due to a poor stirring action [12]. On the other hand, extremely high tool rotation speed can cause degradation phenomena and even polymer burning. Saeedy and Givi [13] performed the optimization of the FSW process of HDPE sheets. The welds performed under optimal conditions reached strength of 75% of that of the base material. As the process is based on the stirring action exerted by the tool on the sheets, the geometry dimension and topology of the tool also represents a key aspect for the quality of FSW welds. For example, a tool with a threaded pin can reduce cavities and inclusions in the stir zone as well as improve the consolidation of polypropylene (PP) sheets [14]. When threaded tools are used, the tool rotation direction influences the quality of the welds, as described by Panneerselvam and Lenin [15] for polyamide 6. The results indicated that clockwise rotation improved the strength of the welds and internal material flow. Based on the similarity with the extrusion welding process, some researches involved a stationary shoulder (called “shoe”) to improve the FSW quality of PE joints. FSW has been applied to polymers characterized by very different behaviors e.g. brittle materials such as Polymethylmethacrylate (PMMA) and plastic materials such as Polycarbonate (PC). Polymethylmethacrylate (PMMA) is widely used in different fields. Simões and Rodrigues investigated the thermos-mechanical conditions developing during the FSW of PMMA [16-17]. Investigation of the effects of FSW process parameters on the PMMA joint showed the highest strength. The longitudinal tensile sample of the PMMA lap joint was 64% and the traverse tensile sample was 47% of base material strength. Although Polycarbonate (PC) is more expensive than PMMA, it is often preferred when high mechanical, toughness, and corrosion properties are required. Thus, some researches focused on friction stir spot welding (FSSW) of PC sheets. During the mentioned researches, mechanical properties, control of plunging force, analysis of temperature, effects of tool shoulder diameter and angle of tool pin were investigated [18]. Low values of the plunging speed involved lower plunging force and torque. However, these conditions affected the mechanical behavior of the FSSW welds. The results from the above-mentioned researches indicated that the most influencing parameters for the joint strength and weld extension were the FSSW tool plunge rate, the tool dwell, and the waiting time. On the other hand, the pin diameter influenced the process loads and the axial pressure [19]. So far, few investigations were performed on continuous FSW of PC. This study aims to investigate the effects of FSW process parameters (tool rotational speed, tool traveling speed, tool tilt angle, and tool plunge depth) on the mechanical properties and material flow of PC welds made by FSW. To this end, both the experimental approach and numerical modeling were involved to understand material behavior during the welding process.

Journal of Modern Processes in Manufacturing and Production, Volume 7, No. 4, Autumn 2018
43
2. Process Modeling 2.1. Governing Equations The computational domain in this study includes the workpiece and the tool inserted inside the workpiece. During the simulation tool, the plunge stage and extraction from the joint line are neglected for simplicity. Therefore, the temperature and velocity fields are solved assuming steady-state behavior. The plastic flow in a three dimensional space is represented by the momentum conservation equation in index notation, with i or j = 1, 2 and 3, representing x, y and z directions, respectively [19-20]:
11
i j j ji
i j i j i
u u u uuPρ µ µ ρU
x x x x x x
∂ ∂ ∂∂∂ ∂= − + + − ∂ ∂ ∂ ∂ ∂ ∂ (1)
In Equation (1), u is the velocity, ρ is the density, U1 is the welding velocity, and P is the pressure. µ is referring to non-Newtonian viscosity that can be determined from flow stress and effective strain rate as follows [21-23]:
3eσµε
=&
(2)
The calculation of viscosity requires a local value of strain rate and temperature. In Equation (2), σe indicated the flow stress that proposed by Sheppard and Wright [21-23]:
1
1sinh
n
e
Zσ arc
α A =
(3)
Where A, a and n are material constants and Z is the Zener–Hollomon parameter. The value of constants for AA1100 aluminum alloy are A = 3.51 *1010 S-1, a=1 MPa–1, and n=5.66 [17]. The Zener–Hollomon parameter, Z, represents the temperature compensated effective strain rate and is given by [21-23]:
Q
RTZ εexp = & (4)
Where Q=158.3kJ/mol is the temperature-independent activation energy, R is the universal gas constant, ε&is the effective strain rate and given by [23]:
2
3 ij ijε ε ε =
& (5)
Where εij is the strain rate tensor, defined as [23]:
1
2ji
ijj i
uuε
x x
∂∂= + ∂ ∂ (6)
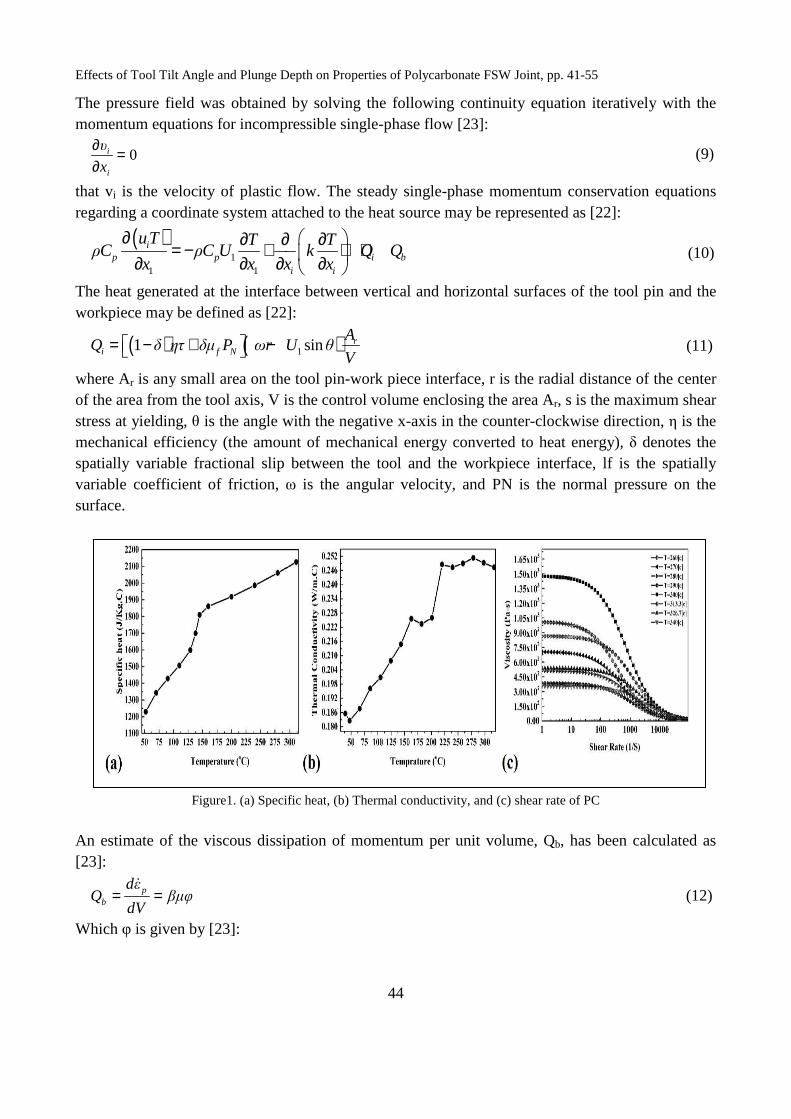
According to the materials physical changes during hot working, achieve the relation with mechanical and thermal properties during FSW in simulation procedure is necessary. Based on this factor, the PC alloy CP, and K parameters are defined in Figure 1.Similarly, for Tungsten [23]:
5 2158 0.106 1.63 10pC T T−= − − ×
(7)
4 270.367 2.29 10 1.25 10K T T− −= − × + × (8)
Effects of Tool Tilt Angle and Plunge Depth on
The pressure field was obtained by solving themomentum equations for incompressible single
0i
i
υ
x
∂ =∂
that vi is the velocity of plastic flow. The steady singleregarding a coordinate system attached to the heat source may be represented as
( )1
1 1
ip p i b
uT T TρC ρC U k Q Q
x x x x
∂ ∂ ∂ ∂= − + + +∂ ∂ ∂ ∂
The heat generated at the interface between vertical and horizontal surfaces of tworkpiece may be defined as [22
( ) (1i f NQ δ ητ δµ P ωr U = − + −
where Ar is any small area on the tool pinof the area from the tool axis, V is the control volume enclosing the area Astress at yielding, θ is the angle with the negative xmechanical efficiency (the amouspatially variable fractional slip between the tool and the workpiece interface, lf is the spatially variable coefficient of friction, ωsurface.
Figure1. (a) Specific heat
An estimate of the viscous dissipation of momentum per unit volume, Q[23]:
pb
dεQ βµφ
dV= =
&
Which φ is given by [23]:
Effects of Tool Tilt Angle and Plunge Depth on Properties of Polycarbonate FSW Joint, pp. 4
44
The pressure field was obtained by solving the following continuity equation iteratively with the momentum equations for incompressible single-phase flow [23]:
is the velocity of plastic flow. The steady single-phase momentum conservation equationsdinate system attached to the heat source may be represented as
p p i bi i
T TC U k Q Q
x x x x
∂ ∂ ∂= − + + + ∂ ∂ ∂ ∂
The heat generated at the interface between vertical and horizontal surfaces of t22]:
)1 sin rAωr U θ
V= − + −
is any small area on the tool pin-work piece interface, r is the radial distaof the area from the tool axis, V is the control volume enclosing the area Ar, s is the maximum shear
is the angle with the negative x-axis in the counter-clockwise direction, he amount of mechanical energy converted to heat energy),
spatially variable fractional slip between the tool and the workpiece interface, lf is the spatially variable coefficient of friction, ω is the angular velocity, and PN is the normal pressure
Specific heat, (b) Thermal conductivity, and (c) shear rate of PC
An estimate of the viscous dissipation of momentum per unit volume, Qb, has been calculated as
41-55
following continuity equation iteratively with the
(9)
phase momentum conservation equations dinate system attached to the heat source may be represented as [22]:
(10)
The heat generated at the interface between vertical and horizontal surfaces of the tool pin and the
(11)
work piece interface, r is the radial distance of the center , s is the maximum shear
clockwise direction, η is the nt of mechanical energy converted to heat energy), δ denotes the
spatially variable fractional slip between the tool and the workpiece interface, lf is the spatially PN is the normal pressure on the
shear rate of PC
, has been calculated as
(12)

Journal of Modern Processes in Manufacturing and Production, Volume 7, No. 4, Autumn 2018
45
2 2 223
3 31 2 1 2
1 2 1 3 1 2 3
2 i
i i
u u uu u u uφ
x x x x x x x=
∂ ∂ ∂∂ ∂ ∂ ∂= + + + + + + ∂ ∂ ∂ ∂ ∂ ∂ ∂ ∑ (13)
In Equation (14), β is an arbitrary constant that indicates the extent of mixing on the atomic scale. The value of µ may tend to 1for a well-mixed system in the molecular scale [23]. The total heat generated at the shoulder/workpiece interface has been partitioned between the workpiece and the tool in the ratio given below [24- 25]:
( )( ) ( )
pworkpiece
p pworkpiece tool
kρCq
kρC kρC+= (14)
Where the subscripts W and T denote the workpiece and the tool, respectively. The analytical expression is based on steady-state one-dimensional heat transfer from a point heat source located at the interface of dissimilar metals. The heat flux into the workpiece is estimated to be 45% of the total heat generated. This relation has been examined experimentally by Lienert et al. [26] and found to be reliable. A heat flux continuity at the shoulder matrix interface yields [22]:
1
p
w
w TTo
JTk
Zq
J J=
+∂∂
(15)
RP and RS represent the tool pin and shoulder radius, respectively and q1 represents the total rate of heat generation at the shoulder–workpiece interface. It is given by [22]:
( ) ( )1 11 sinF Hq η δ τ δµ P ωr U θ= − + − (16)
At the bottom surface, there is a backing plate and the heat transfer coefficient from the bottom of the workpiece is not the same as for free convection. The value of the heat transfer at the bottom of the workpiece was determined by:
( )b a
Bottom
Tk h T T
Z
∂ = −∂
(17)
Where hb is the bottom heat transfer coefficient and Ta is the ambient temperature of 298 K. The heat transfer coefficient at the bottom face depends on the local temperature and is given by the following relation:
( )0.25
0b b ah h T T= − (18)
Where hb0 is the heat transfer parameter for the bottom surface. As Equation (18) shows, this parameter is a constant and it has a different unit compared tothe heat transfer coefficient which is spatially variable. At the top surface, heat transfer is due to both convection and radiation and is given by:
( ) ( )4 4Β a t a
Top
Tk T T h T T
Z
∂− = − + −∂
◌
(19)
B is the Stefan–Boltzmann constant (5.67×10⁻¹⁶ J.K–4.m–2.s–1), ε is the emissivity, and ht is the convective heat transfer coefficient at the top surface. The computed temperature values were found to be insensitive to the values of ht and its value was taken as zero for simplicity. During the simulation, the linear and rotational speed of the tool pin and shoulder were performed separately. The base metal assumed as non-Newtonian fluid with visco-plastic behaviour and density based on
Effects of Tool Tilt Angle and Plunge Depth on
PC. The Tetrahedral/Hybrid elements with Tgeneration of tool and workpiece. The region close to the pin tool and the tool itself required a much finer mesh to evaluate the heat transfer moand workpiece was used to generate the different volume sizes. The sizing function uses a start size, growth rate, and maximum size. For the fine mesh pictured in Figuregrowth rate 1.3 mm, and a maximum size of volumes for the lateral case was 2,243,120 3. Experimental Procedure Friction Stir Welding experiments were conducted on polycarbonate thickness supplied by Arkema Polymer Industry, USA. The sheet was cut into rectangles shape (100×150mm) by a laser cutting machineproperties of the PC sheet.A modified TABRIZexperimental tests. HSS steel made tool with Thermal histories were acquired at given locations USA).
Effects of Tool Tilt Angle and Plunge Depth on Properties of Polycarbonate FSW Joint, pp. 4
46
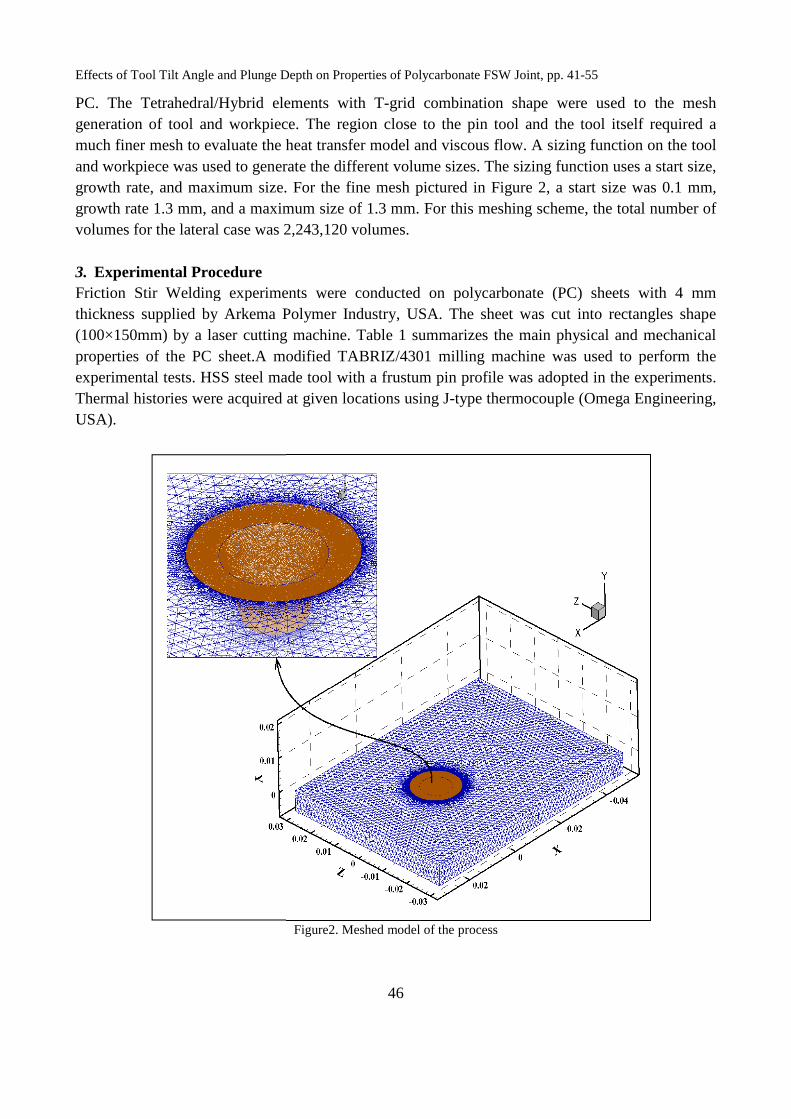
PC. The Tetrahedral/Hybrid elements with T-grid combination shape were used to the mesh generation of tool and workpiece. The region close to the pin tool and the tool itself required a much finer mesh to evaluate the heat transfer model and viscous flow. A sizing function on the tool and workpiece was used to generate the different volume sizes. The sizing function uses a start size,
and maximum size. For the fine mesh pictured in Figure 2, a start size was and a maximum size of 1.3 mm. For this meshing scheme
2,243,120 volumes.
Friction Stir Welding experiments were conducted on polycarbonate (PCthickness supplied by Arkema Polymer Industry, USA. The sheet was cut into rectangles shape
by a laser cutting machine. Table 1 summarizes the main physicalA modified TABRIZ/4301 milling machine was used to perform the
experimental tests. HSS steel made tool with a frustum pin profile was adopted in the experiments. Thermal histories were acquired at given locations using J-type thermocouple (Omega Engineering,
Figure2. Meshed model of the process
41-55
grid combination shape were used to the mesh generation of tool and workpiece. The region close to the pin tool and the tool itself required a
del and viscous flow. A sizing function on the tool and workpiece was used to generate the different volume sizes. The sizing function uses a start size,
a start size was 0.1 mm, For this meshing scheme, the total number of
PC) sheets with 4 mm thickness supplied by Arkema Polymer Industry, USA. The sheet was cut into rectangles shape
summarizes the main physical and mechanical milling machine was used to perform the
frustum pin profile was adopted in the experiments. type thermocouple (Omega Engineering,

Journal of Modern Processes in Manufacturing and Production, Volume 7, No. 4, Autumn 2018
47
Table1. Properties of PC Characteristics Value
Density [g/cm3] 1.22
Ultimate Tensile Strength [MPa] 67
Elongation at fracture [%] 98
Shear Stress [MPa] 101
Flexural Strength [MPa] 80
Hardness (ShoreD) 90
Charpy Notched Impact Strength [kJ/m2] 25.2
Glass transition temperature, Tg [°C] 147
Thermal conductivity at 25oC [W/m⋅K] 0.22
Softening temperature [C] 225
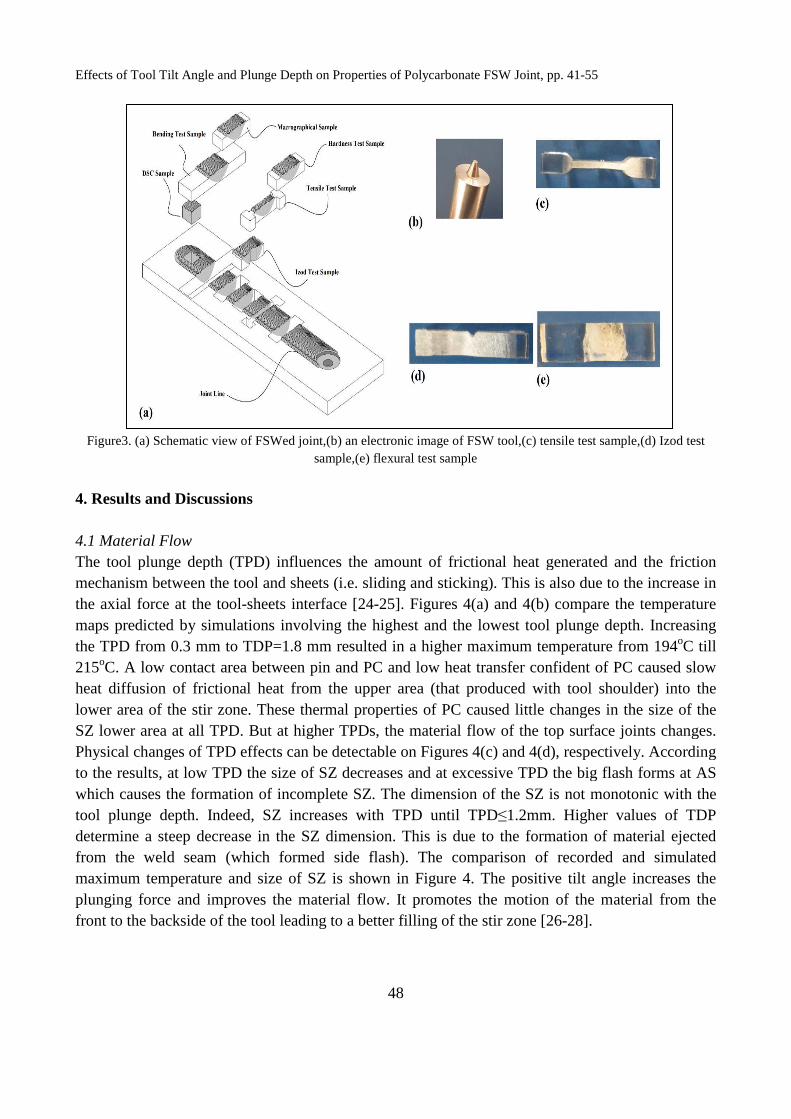
The thermocouple, which was characterized by a 0.5 mm diameter, was embedded into the polycarbonate sheets at different distances (d=5, 10, and 15 mm) from the weld seam. To this end, holes were drilled at given locations and Testor's cement was used to bond the thermocouple inside the holes. Different characterization tests were performed on the welded specimens. A servo-controlled universal testing machine (SANTAM, Co. Tehran, Iran) with a load cell of 200 kN was adopted for quasi-static tests. Tensile and bending tests were conducted ata constant speed of 1 mm/min. The tensile tests were conducted according to the ASTM D638 standard. The notched IZOD impact tests were carried out according to the ASTM D256 standard. Material flow analyses have been carried out using a video visual measurement machine (MUMA, 3D Family, Xinbei City, Taiwan). A schematic of the FSW system is reported in Figure 3 with the FSW tool and mechanical testing samples. The experimental plan involved the variation of different process parameters
including the tool rotation speed (ω), the welding speed (V), the tool plunge depth, and tilt angle.
Table 1 summarizes the levels varied among the experiments and simulations.
Table2. FSW Parameters Process parameters Value
ω [rpm] 2200
V [mm/min] 105
TPD [mm] 0.3, 0.6, 0.9, 1.2, 1.5, 1.8
α [degree] 0.5, 1.0, 1.5, 2.0, 2.5, 3.0, 3.5, 4.0
Effects of Tool Tilt Angle and Plunge Depth on
Figure3. (a) Schematic view of FSWed joint
4. Results and Discussions
4.1 Material Flow The tool plunge depth (TPD) influences the amount of frictional heat generated and the friction mechanism between the tool and sheets (i.e. sliding and sticking). This is also due to the increase in the axial force at the tool-sheets interface maps predicted by simulations involving the highest and the lowest tool plunge depth. Increasing the TPD from 0.3 mm to TDP=1.8215oC. A low contact area between pin and PC and low heat transfer confident of PC caused slow heat diffusion of frictional heat from lower area of the stir zone. These thermal properties of PC caused little changes SZ lower area at all TPD. But at higher TPDs, the material flow of the top surface joints changes.Physical changes of TPD effects can be detectable on Figures to the results, at low TPD the size of SZ decreasewhich causes the formation of incomplete SZ. The dimension of the SZ tool plunge depth. Indeed, SZ increadetermine a steep decrease in the SZ dimension. This is due to the formation of material ejected from the weld seam (which formed side flash). The comparison of recorded and simulated maximum temperature and size of SZ plunging force and improves the material flow. front to the backside of the tool leading to a better filling of the stir zone
Effects of Tool Tilt Angle and Plunge Depth on Properties of Polycarbonate FSW Joint, pp. 4
48
Schematic view of FSWed joint,(b) an electronic image of FSW tool,(c) tensile test samplesample,(e) flexural test sample
The tool plunge depth (TPD) influences the amount of frictional heat generated and the friction mechanism between the tool and sheets (i.e. sliding and sticking). This is also due to the increase in
sheets interface [24-25]. Figures 4(a) and 4(b) compare the temperature maps predicted by simulations involving the highest and the lowest tool plunge depth. Increasing
1.8 mm resulted in a higher maximum temperaow contact area between pin and PC and low heat transfer confident of PC caused slow
heat diffusion of frictional heat from the upper area (that produced with tool shoulder) into stir zone. These thermal properties of PC caused little changes
But at higher TPDs, the material flow of the top surface joints changes.Physical changes of TPD effects can be detectable on Figures 4(c) and 4(d), respectively. According
at low TPD the size of SZ decreases and at excessive TPD the big flash forms at AS formation of incomplete SZ. The dimension of the SZ is not monotonic with the
tool plunge depth. Indeed, SZ increases with TPD until TPD≤1.2mm. Higher values of TDP the SZ dimension. This is due to the formation of material ejected
from the weld seam (which formed side flash). The comparison of recorded and simulated nd size of SZ is shown in Figure 4. The positive tilt angle increases the
plunging force and improves the material flow. It promotes the motion of the material from the front to the backside of the tool leading to a better filling of the stir zone [26-28
41-55
tensile test sample,(d) Izod test
The tool plunge depth (TPD) influences the amount of frictional heat generated and the friction mechanism between the tool and sheets (i.e. sliding and sticking). This is also due to the increase in
compare the temperature maps predicted by simulations involving the highest and the lowest tool plunge depth. Increasing
higher maximum temperature from 194oC till ow contact area between pin and PC and low heat transfer confident of PC caused slow
upper area (that produced with tool shoulder) into the stir zone. These thermal properties of PC caused little changes in the size of the
But at higher TPDs, the material flow of the top surface joints changes. , respectively. According
and at excessive TPD the big flash forms at AS not monotonic with the Higher values of TDP
the SZ dimension. This is due to the formation of material ejected from the weld seam (which formed side flash). The comparison of recorded and simulated
ositive tilt angle increases the t promotes the motion of the material from the
28].

Journal of Modern Processes in Manufacturing and Production
Figure4. Simulation results of surface heat flux of joint that FSWed at view of the joint that FSWed at 0.3mm TPD and
temperature of FSWed joints at different TPD which (e) recorded and (f) simulated. (g) Relation with the size of SZ and
This parameter also influences the heat produced. The temperature distributions simulated for different tilt angles in SZ are depicted in Figures of α from 0.5o to 4o degrees causes an increase of the maximum temperature by almost from α=0.5o till 215oC at α=4o). The maximum temperature was observed in behind the tool. Low values of α
in front of the tool to extrude at the backside leading to defect development into the SZ.
Figure5. Simulation results
f Modern Processes in Manufacturing and Production, Volume 7, No. 4, Autumn 201
49
Simulation results of surface heat flux of joint that FSWed at (a) 0.3mm and (b) 1.8mm TPD
mm TPD and (d) surface flow of the joint that FSWed at temperature of FSWed joints at different TPD which (e) recorded and (f) simulated. (g) Relation with the size of SZ and
TPD
This parameter also influences the heat produced. The temperature distributions simulated for les in SZ are depicted in Figures 5(a)-5(c). The simulation indicate
causes an increase of the maximum temperature by almost ). The maximum temperature was observed in
behind the tool. Low values of α involved lower plunging load. This partially inhibits the material in front of the tool to extrude at the backside leading to defect development into the SZ.
Simulation results of maximum temperature at (a) 0.5, (b) 2 and (c) 4 degrees
2018
mm TPD. (c) Cross-section surface flow of the joint that FSWed at 1.8mm TPD. Maximum
temperature of FSWed joints at different TPD which (e) recorded and (f) simulated. (g) Relation with the size of SZ and
This parameter also influences the heat produced. The temperature distributions simulated for (c). The simulation indicates that an increase
causes an increase of the maximum temperature by almost 17% (185oC ). The maximum temperature was observed in correspondence of the
involved lower plunging load. This partially inhibits the material in front of the tool to extrude at the backside leading to defect development into the SZ.
degrees TTA

Effects of Tool Tilt Angle and Plunge Depth on
The longitudinal section of welds made with temperature maps indicate that the temperature of the upper “layers” is much higher than that of the lower “layers” behind the SZ. The upper “layer” interacts with the tool shoulder that is much larger than the pin. On the upper side, the tool has a for a longer time. Both these aspects contribute to increasthe upper and lower “layers”. The low heat generation in formation of the tunnel into the SZ root (Figure formation of the SZ (Figure 6d). The crosslow and high values of α.
Figure6. Simulation results of longitudinal of maximum temperature flux at view of joints that FSWed at
The welds produced with α=0.5°ones were characterized by an SZ with a convex shape of the root. On the other hand, the welds made with α=4° were characterized by a concave shape at the base of the weld rootmorphology of the welds revealed that increasing the value of maximum temperature of the process. increase of α resulted in a steep decrease material ejected from the weld seam (Fi
Effects of Tool Tilt Angle and Plunge Depth on Properties of Polycarbonate FSW Joint, pp. 4
50
The longitudinal section of welds made with α=0.5o and α=4o tilt are shown in Figure temperature maps indicate that the temperature of the upper “layers” is much higher than that of the
he upper “layer” interacts with the tool shoulder that is much larger n the upper side, the tool has a higher peripheral speed and interacts with the material
longer time. Both these aspects contribute to increasing the temperature differences between The low heat generation in the lower area “layers” of SZ leads to the
ormation of the tunnel into the SZ root (Figure 6c). High values of α also resulted in d). The cross-sections reveal that similar tunnel voids are produced for
Simulation results of longitudinal of maximum temperature flux at (a) 0.5, (b) 2 degrees TTA Crossview of joints that FSWed at (c) 0.5, (d) 2 degrees TTA
0.5° and α=4° showed a different morphology of the SZSZ with a convex shape of the root. On the other hand, the welds
were characterized by a concave shape at the base of the weld rootmorphology of the welds revealed that increasing the value of α produced amaximum temperature of the process. Also, it increased the dimension of the SZ for
resulted in a steep decrease in the SZ dimension. This was due to material ejected from the weld seam (Figure 7).
41-55
tilt are shown in Figure 6. The temperature maps indicate that the temperature of the upper “layers” is much higher than that of the
he upper “layer” interacts with the tool shoulder that is much larger higher peripheral speed and interacts with the material
the temperature differences between lower area “layers” of SZ leads to the
α also resulted in the incomplete sections reveal that similar tunnel voids are produced for
degrees TTA Cross-section
showed a different morphology of the SZ. The former SZ with a convex shape of the root. On the other hand, the welds
were characterized by a concave shape at the base of the weld root. The α produced an increase in the
it increased the dimension of the SZ for α≤2.5°. Further the SZ dimension. This was due to the great amount of

Journal of Modern Processes in Manufacturing and Production
Figure7. Maximum temperature of FSWed joints at different TTA which
4.2 Mechanical Properties of Joint 4.2.1 Tensile Strength The result indicates that processing conditions involving excessive heat input resulted in welds with lower strength. On the other hand, processing conditions involving low heat input were affected by the development of planar cracks around SZ. This determined the decrease offor low tool rotation and high travelling speeds. The highest tensile strength of the welds was 62MPa that was near 92% of the base materialstirring, while high TPD values induced defects affected the mechanical behaviour of the welds; thus, the highest strength was achieved at intermediate values of TPD=1.2mm8). The fracture surface of the strongest joint is depicted in Figure shows divergent lines. These lines radiating outward from the fracture origin are called “hackled regions”. Hackled regions show the crack propagation direction and parea [27-29]. Hackles lines are very similar to river lines that appear in metallic materials [29-30].
Figure8. Relation with tensile strength and
f Modern Processes in Manufacturing and Production, Volume 7, No. 4, Autumn 201
51
Maximum temperature of FSWed joints at different TTA which (a) recorded and (with the size of SZ and TTA
oint
that processing conditions involving excessive heat input resulted in welds with lower strength. On the other hand, processing conditions involving low heat input were affected by the development of planar cracks around SZ. This determined the decrease offor low tool rotation and high travelling speeds. The highest tensile strength of the welds was
of the base material. Low values of TPD produced a poor material stirring, while high TPD values induced a great amount of material ejected from the SZ. Both these defects affected the mechanical behaviour of the welds; thus, the highest strength was achieved at
mm. Similarly, the highest strength was achieved for racture surface of the strongest joint is depicted in Figure 8c. The surface is rough and
shows divergent lines. These lines radiating outward from the fracture origin are called “hackled regions”. Hackled regions show the crack propagation direction and point back toward the origin
]. Hackles lines are very similar to river lines that appear in the
Relation with tensile strength and (a) TPD and (b) TTA (c) SEM image of the fracture surface of the joint that FSWed 2oTTA and 1.2 TPD
2018
(b) simulated (c) Relation
that processing conditions involving excessive heat input resulted in welds with lower strength. On the other hand, processing conditions involving low heat input were affected by the development of planar cracks around SZ. This determined the decrease of the tensile strength for low tool rotation and high travelling speeds. The highest tensile strength of the welds was
Low values of TPD produced a poor material mount of material ejected from the SZ. Both these
defects affected the mechanical behaviour of the welds; thus, the highest strength was achieved at the highest strength was achieved for α=2.5° (Figure
c. The surface is rough and shows divergent lines. These lines radiating outward from the fracture origin are called “hackled
oint back toward the origin the fracture surface of
fracture surface of the joint that
Effects of Tool Tilt Angle and Plunge Depth on
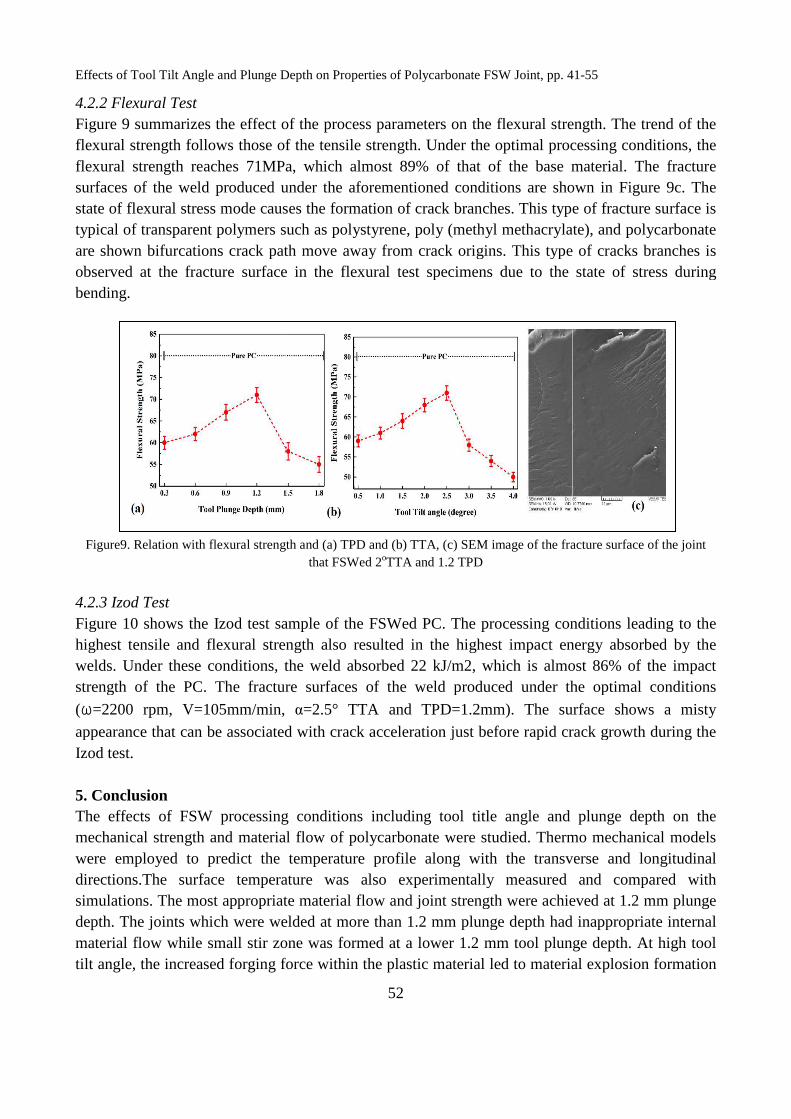
4.2.2 Flexural Test Figure 9 summarizes the effect of the process parameters on the flexural strength. The trendflexural strength follows those of the tensile strength. Under the optimal pflexural strength reaches 71MPasurfaces of the weld produced under the aforementioned conditions state of flexural stress mode causes the fotypical of transparent polymers such as polystyrene, poly (methyl methacrylate), and polycarbonateare shown bifurcations crack path move away from crack origins. This type of cracks branches observed at the fracture surface in the flexural test specimens due to the state of stress during bending.
Figure9. Relation with flexural strength and
4.2.3 Izod Test Figure 10 shows the Izod test sample of highest tensile and flexural strength also resulted in the highest impact energy absorbed by the welds. Under these conditions, the weld absorbed strength of the PC. The fracture surfaces of
(ω=2200 rpm, V=105mm/min,
appearance that can be associated with crack acceleration just Izod test. 5. Conclusion The effects of FSW processing conditions including tool title angle and plunge depth on the mechanical strength and materialwere employed to predict the temperature profile along with the transverse and longitudinal directions.The surface temperature was also experimentally measured and compared with simulations. The most appropriate material flow and joint strength were achieved at depth. The joints which were welded at more than material flow while small stir zone was formed at tilt angle, the increased forging force within the plastic material led to material explosion formation
Effects of Tool Tilt Angle and Plunge Depth on Properties of Polycarbonate FSW Joint, pp. 4
52
the effect of the process parameters on the flexural strength. The trendthose of the tensile strength. Under the optimal processing conditions, the
MPa, which almost 89% of that of the base materialweld produced under the aforementioned conditions are shown in Fig
state of flexural stress mode causes the formation of crack branches. This type of fracture surface is typical of transparent polymers such as polystyrene, poly (methyl methacrylate), and polycarbonateare shown bifurcations crack path move away from crack origins. This type of cracks branches bserved at the fracture surface in the flexural test specimens due to the state of stress during
Relation with flexural strength and (a) TPD and (b) TTA, (c) SEM image of the fracture surface of the joint that FSWed 2oTTA and 1.2 TPD
shows the Izod test sample of the FSWed PC. The processing conditions leading to the highest tensile and flexural strength also resulted in the highest impact energy absorbed by the
the weld absorbed 22 kJ/m2, which is almost strength of the PC. The fracture surfaces of the weld produced under the optimal conditions
, α=2.5° TTA and TPD=1.2mm). The surface shows
appearance that can be associated with crack acceleration just before rapid crack growth during
The effects of FSW processing conditions including tool title angle and plunge depth on the mechanical strength and material flow of polycarbonate were studied. Thermowere employed to predict the temperature profile along with the transverse and longitudinal
urface temperature was also experimentally measured and compared with most appropriate material flow and joint strength were achieved at
The joints which were welded at more than 1.2 mm plunge depth had inappropriate internal material flow while small stir zone was formed at a lower 1.2 mm tool plunge dtilt angle, the increased forging force within the plastic material led to material explosion formation
41-55
the effect of the process parameters on the flexural strength. The trend of the rocessing conditions, the
of that of the base material. The fracture shown in Figure 9c. The
rmation of crack branches. This type of fracture surface is typical of transparent polymers such as polystyrene, poly (methyl methacrylate), and polycarbonate are shown bifurcations crack path move away from crack origins. This type of cracks branches is bserved at the fracture surface in the flexural test specimens due to the state of stress during
(c) SEM image of the fracture surface of the joint
FSWed PC. The processing conditions leading to the highest tensile and flexural strength also resulted in the highest impact energy absorbed by the
which is almost 86% of the impact weld produced under the optimal conditions
The surface shows a misty
rapid crack growth during the
The effects of FSW processing conditions including tool title angle and plunge depth on the Thermo mechanical models
were employed to predict the temperature profile along with the transverse and longitudinal urface temperature was also experimentally measured and compared with most appropriate material flow and joint strength were achieved at 1.2 mm plunge
mm plunge depth had inappropriate internal mm tool plunge depth. At high tool
tilt angle, the increased forging force within the plastic material led to material explosion formation

Journal of Modern Processes in Manufacturing and Production
of defects, while a lower tool tilt angle does not extrude the material to form a complete stir zone. A tilt angle of 2.5o was also found preferable to obtain sound weldments with improved strength. The highest tensile strength (62MPa)attained for joints processed at 2.5and 2200 rpm tool rotational speed
Figure10. Relation with impact energy and
6. References
[1] Aghajani Derazkola, H., Habibnia, M.Behavior and Material Flow during Friction Stir Welding of AAMechanical Engineering. 14: 251
[2] Elyasi, M., Aghajani Derazkolaparameters on mechanical quality of AAMechanical Engineering. 15: 379
[3] Aghajani Derazkola, H., Elyasitool plunge depth on microstructure and texture evolution of AAInternational Journal of Advanced Design and Manufacturing Technology
[4] Aghajani Derazkola, H., Elyasiintermetallic compounds in friction stir welding of AAprocesses in materials. 9(3): 219
[5] Elyasi, M., Aghajanai Derazkolaon properties friction stir welding of AInstitution of Mechanical Engineers1241.
[6] Aghajanai Derazkola, H. andMicrostructure, Strength and Nanocomposites Prepared by Biomedical Materials. 79: 246
[7] Elyasi, M., Aghajanai Derazkola, H.microstructure evolution and hardness in friction stir welding of AAA441 AISI steel. Modares Mechanical Engineering
f Modern Processes in Manufacturing and Production, Volume 7, No. 4, Autumn 201
53
while a lower tool tilt angle does not extrude the material to form a complete stir zone. A ound preferable to obtain sound weldments with improved strength. The
), flexural strength (71MPa), and impact energy 2.5o tilt angle, 1.2 mm plunge depth, 105 mm
rpm tool rotational speed.
Relation with impact energy and (a) TPD and (b) TTA, (c) SEM image of the fracture surface of the joint that FSWed 2oTTA and 1.2 TPD
Habibnia, M. and Jamshidi Aval, H. 2015. Study on Frictional Heat Behavior and Material Flow during Friction Stir Welding of AA1100 Aluminum Alloy
251-261. Aghajani Derazkola, H. and Hosseinzadeh, M. 2015. Effects of friction stir welding
parameters on mechanical quality of AA1100 aluminum alloy to A441 AISI steel joint379-390.
Elyasi, M. and Hosseinzadeh, M. 2016. Effects of friction stir welding tool plunge depth on microstructure and texture evolution of AA1100International Journal of Advanced Design and Manufacturing Technology.
Elyasi, M. and Hosseinzadeh, M. 2015.Formation of defects and intermetallic compounds in friction stir welding of AA1100 alloy to A441
219-233. Aghajanai Derazkola, H. and Hosseinzadeh, M. 2016. Investigations of tool t
on properties friction stir welding of A441 AISI to AA1100 aluminiumInstitution of Mechanical Engineers, Part B: Journal of Engineering Manufacture
and Simchi, A. 2018. Effects of Alumina trength and Wear Resistance of Poly (Methyl repared by Friction Stir Processing. Journal of the Mechanical Behavior of
246-253. ghajanai Derazkola, H. and Hosseinzadeh, M. 2015.
microstructure evolution and hardness in friction stir welding of AA1100Modares Mechanical Engineering. 14: 97-107.
2018
while a lower tool tilt angle does not extrude the material to form a complete stir zone. A ound preferable to obtain sound weldments with improved strength. The
and impact energy (22 kJ/m2) were mm/min traverse speed,
(c) SEM image of the fracture surface of the joint that
Study on Frictional Heat Aluminum Alloy. Modares
Effects of friction stir welding AISI steel joint. Modares
cts of friction stir welding 1100 to A441 AISI joint.
. 9: 13-20. Formation of defects and 441 AISI steel. Advanced
Investigations of tool tilt angle aluminium, Proceedings of the
Journal of Engineering Manufacture. 230(7): 1234-
lumina Nanoparticles on the ethyl Methacrylate)-based
rocessing. Journal of the Mechanical Behavior of
Study on joint zone 1100 aluminum alloy to

Effects of Tool Tilt Angle and Plunge Depth on Properties of Polycarbonate FSW Joint, pp. 41-55
54
[8]Aghajani Derazkola, H., Elyasi, M. and Hosseinzadeh, M. 2014. Feasibility Study on Aluminum Alloys and A441 AISI Steel Joints by Friction Stir Welding. International Journal of Advanced Design and Manufacturing Technology.7: 99-109.
[9] Mironov, S., Sato, S. Y. and Kokawa H. 2018.Friction-stir welding and processing of Ti-6Al-4V titanium alloy: A review.Journal of Materials Science and Technology. 34(1): 58-72.
[10] Smith, C., Bendzsak, G., North, T., Hinrichs, J., Noruk, J. and Heideman, R. 1999. Heat and Material Flow Modeling of the Friction Stir Welding Process. 11th International Conference on Computer Technology in Welding, Detroit. United State.
[11] Arici, A. and Selale, S. 2007.Effects of tool tilt angle on tensile strength and fracture locations of friction stir welding of polyethylene. Science and Technology of Welding and Joining. 12: 536-539.
[12] Aydin, M. 2010.Effects of welding parameters and pre-heating on the friction stir welding of UHMW-polyethylene. Polymer-Plastics Technology and Engineering. 49: 595-601.
[13] Saeedy, S. and BesharatiGivi, M.K. 2011. Investigation of the effects of critical process parameters of friction stir welding of polyethylene. Journal of Engineering Manufacture, Proceedings of the Institution of Mechanical Engineers Part B. 225(8): 1305-1310.
[14] Panneerselvam, K. and Lenin, K. 2013. Lenin Effects and defects of the polypropylene plate for different parameters in friction stir welding process. International Journal of Renewable Energy Technology. 2(2): 143-152.
[15] Panneerselvam, K. and Lenin, K. 2014. Joining of Nylon 6 plate by friction stir welding process using threaded pin profile. Materials & Design. 53: 302-307.
[16] Aghajanai Derazkola, H. and Simchi, A. 2018. Experimental and thermomechanical analysis of the effect of tool pin profile on the friction stir welding of poly (methyl methacrylate) sheets. Journal of Manufacturing Processes. 34(A): 412-423.
[17] Elyasi, M. and Aghajanai Derazkola, H. 2018.Experimental and Thermomechanical Study on FSW of PMMA Polymer T-joint. International Journal of Advanced Manufacturing Technology. 98(1-4): 1445-1456.
[18] Aghajanai Derazkola, H., Simchi, A. and Lambiase, F. 2019. Friction Stir Welding of Polycarbonate Lap Joints: Relationship between Processing Parameters and Mechanical Properties. Polymer Testing. 79: 105999.
[19] Aghajanai Derazkola, H. and Simchi, A. 2018. Experimental and Thermomechanical Analysis of Friction Stir Welding of Poly (Methyl Methacrylate) Sheets. Science and Technology of Welding and Joining. 23(3): 209-218.
[20] Aghajani Derazkola, H. 2017. Effects of tool linear and rotational speed on material flow and heat generation of poly methyl methacrylate (PMMA) friction stir welding. Journal of Simulation and Analysis of Novel Technologies in Mechanical Engineering. 9(4): 687-700.
[21] Aghajani Derazkola, H. and Khodabakhshi, F. 2019. Intermetallic compounds (IMCs) formation during dissimilar friction-stir welding of AA5005 aluminum alloy to St-52 steel: numerical modeling and experimental study. International Journal of Advanced Manufacturing Technology. 100(9-12): 2401-2422.

Journal of Modern Processes in Manufacturing and Production, Volume 7, No. 4, Autumn 2018
55
[22] Aghajani Derazkola, H. and Jamshidi Aval, H. 2015. Study on heat generation and distribution during friction stir welding of AA1100 aluminum alloy. International Journal of Advanced Design and Manufacturing Technology. 8: 9-17.
[23] Aghajani Derazkola, H., Elyasi, M. and Hosseinzadeh, M. 2015. CFD Modeling of Friction Stir Welding of AA1100 Aluminum Alloy to A441 AISI Steel Butt Joint. Journal of Advanced Materials and Processing. 3(3): 47–59.
[24] Aghajani Derazkola, H., Khodabakhshi, F. and Simchi, A. 2018. Friction-stir lap-joining of aluminium-magnesium/poly-methyl-methacrylate hybrid structures: thermo-mechanical modelling and experimental feasibility study. Science and Technology of Welding and Joining. 23(1): 35-49.
[25] Aghajani Derazkola, Kashiry Fard, R. H. and Khodabakhshi, F. 2018. Effects of processing parameters on the characteristics of dissimilar friction-stir-welded joints between AA5058 aluminum alloy and PMMA polymer. Welding in the World. 62(1): 117-130.
[26] Aghajani Derazkola, H. and Khodabakhshi, F. 2019. A novel fed friction-stir (FFS) technology for nanocomposite joining. Science and Technology of Welding and Joining. https://doi.org/10.1080/13621718.2019.1631534.
[27] Aghajani Derazkola, H. and Khodabakhshi, F. 2019.Underwater submerged dissimilar friction-stir welding of AA5083 aluminum alloy and A441 AISI steel. International Journal of Advanced Manufacturing Technology. 102(9-12): 4383-4395.
[28] Aghajani Derazkola, H. and Simchi, A. 2019. An investigation on the dissimilar friction stir welding of T-joints between AA5754 aluminum alloy and poly (methyl methacrylate). Thin-Walled Structures. 135: 376-384.
[29] Aghajanai Derazkola, H. and Elyasi, M. 2018. The influence of process parameters in friction stir welding of Al-Mg alloy and polycarbonate. Journal of Manufacturing Processes. 35: 88-98.
[30] Aghajani Derazkola, H. 2017. Simulation of Tool Rotation and Travelling Speed Effects on Friction Stir Welding of Ti-6Al-4V. Journal of Modern Processes in Manufacturing and Production. 6(4): 81-98.