effects of trophy hunting on lion and leopard...
TRANSCRIPT

Contributed Paper
Effects of Trophy Hunting on Lion and LeopardPopulations in TanzaniaC. PACKER,∗†† H. BRINK,† B. M. KISSUI,‡ H. MALITI,§ H. KUSHNIR,∗ AND T. CARO¶∗Department of Ecology, Evolution & Behavior, University of Minnesota, Saint Paul, MN 55108, U.S.A.†Durrell Institute of Conservation and Ecology, University of Kent, Canterbury, Kent CT2 7NR, U.K.‡African Wildlife Foundation, Arusha, Tanzania§Tanzania Wildlife Research Institute, Arusha, Tanzania¶Department of Wildlife, Fish & Conservation Biology, University of California, Davis, CA 95616, U.S.A.
Abstract: Tanzania holds most of the remaining large populations of African lions (Panthera leo) and has
extensive areas of leopard habitat (Panthera pardus), and both species are subjected to sizable harvests by sport
hunters. As a first step toward establishing sustainable management strategies, we analyzed harvest trends
for lions and leopards across Tanzania’s 300,000 km2 of hunting blocks. We summarize lion population
trends in protected areas where lion abundance has been directly measured and data on the frequency of
lion attacks on humans in high-conflict agricultural areas. We place these findings in context of the rapidly
growing human population in rural Tanzania and the concomitant effects of habitat loss, human-wildlife
conflict, and cultural practices. Lion harvests declined by 50% across Tanzania between 1996 and 2008, and
hunting areas with the highest initial harvests suffered the steepest declines. Although each part of the country
is subject to some form of anthropogenic impact from local people, the intensity of trophy hunting was the
only significant factor in a statistical analysis of lion harvest trends. Although leopard harvests were more
stable, regions outside the Selous Game Reserve with the highest initial leopard harvests again showed the
steepest declines. Our quantitative analyses suggest that annual hunting quotas be limited to 0.5 lions and 1.0
leopard/1000 km2 of hunting area, except hunting blocks in the Selous Game Reserve, where harvests should
be limited to 1.0 lion and 3.0 leopards/1000 km2.
Keywords: harvests, Panthera leo, Panthera pardus, population trends, sport hunting
Efectos de la Cacerıa Deportiva sobre Poblaciones de Leones y Leopardos en Tanzania
Resumen: Tanzania mantiene la mayorıa de las poblaciones remanentes de leones Africanos (Pantheraleo) y tiene extensas areas de habitat de leopardo (Panthera pardus), y ambas especies son sujetas a cosechas
considerables por cazadores deportivos. Como un primer paso hacia el establecimiento de estrategias de
manejo sustentable, analizamos las tendencias de cosecha de leones y leopardos en los 300,000 km2 de
bloques de cacerıa de Tanzania. Sintetizamos las tendencias poblacionales de leones en areas protegidas
donde la abundancia de leones ha sido medida directamente, ası como datos sobre la frecuencia de ataques
de leones sobre humanos en areas agrıcolas altamente conflictivas. Ubicamos estos resultados en el contexto
de la poblacion humana en rapido crecimiento en Tanzania rural y los efectos concomitantes de la perdida
de habitat, el conflicto humanos-vida silvestre y las practicas culturales. Las cosechas de leones han declinado
50% en Tanzania entre 1996 y 2008, y las areas de cacerıa con las cosechas iniciales mas altas sufrieron
las declinaciones mas pronunciadas. Aunque cada parte del paıs esta sujeto a alguna forma de impacto
antropogenico por habitantes locales, la intensidad de la cacerıa deportiva fue el unico factor significativo
en el analisis estadıstico de las tendencias poblacionales de leones. Aunque las cosechas de leopardos fueron
mas estables, regiones fuera de la Reserva de Caza Selous con las cosechas iniciales de leopardos mas altas
tambien mostraron las declinaciones mas pronunciadas. Nuestros analisis cuantitativos sugieren que las
††email [email protected] submitted July 14, 2009; revised manuscript accepted April 13, 2010.
1Conservation Biology, Volume **, No. **, ***–***C©2010 Society for Conservation BiologyDOI: 10.1111/j.1523-1739.2010.01576.x

2 Trophy Hunting of Lions and Leopards
cuotas anuales de cacerıa se limiten a 0.5 leones y 1.0 leopardo/1000 km2 de area de cacerıa, excepto
los bloques de cacerıa en la Reserva de Caza Selous, donde las cosechas deben limitarse a 1.0 leon y 3.0
leopardos/1000 km2.
Palabras Clave: cacerıa deportiva, Panthera leo, Panthera pardus, cosechas, tendencias poblacionales
Introduction
Although habitat loss and retaliatory killing are gener-ally considered the primary threats to large felids acrossAfrica (Ray et al. 2005; IUCN 2006; Bauer et al. 2008),hunting can also deplete animal populations (e.g., Milner-Gulland et al. 2003; Fryxell et al. 2010), especially infelids in which sexually selected infanticide is common(e.g.,Whitman et al. 2004; Caro et al. 2009). For exam-ple, excessive trophy hunting appears to have causedlarge-scale declines in African lions (Panthera leo), Amer-ican cougars (Felis concolor), and possibly African leop-ards (Panthera pardus) (Packer et al. 2009). Acrossseven countries (lions) and 11 U.S. states (cougars), ju-risdictions with the highest sport-hunting harvests per1000 km2 of habitat subsequently showed the steep-est proportional declines in harvests. The growing useof dogs to hunt leopards in Zimbabwe, and decliningleopard harvests in Zambia and Zimbabwe (Purchase &Mateke 2008; Balme 2009; Packer et al. 2009; Balme et al.2010) have also raised concerns about leopard manage-ment and trophy hunting.
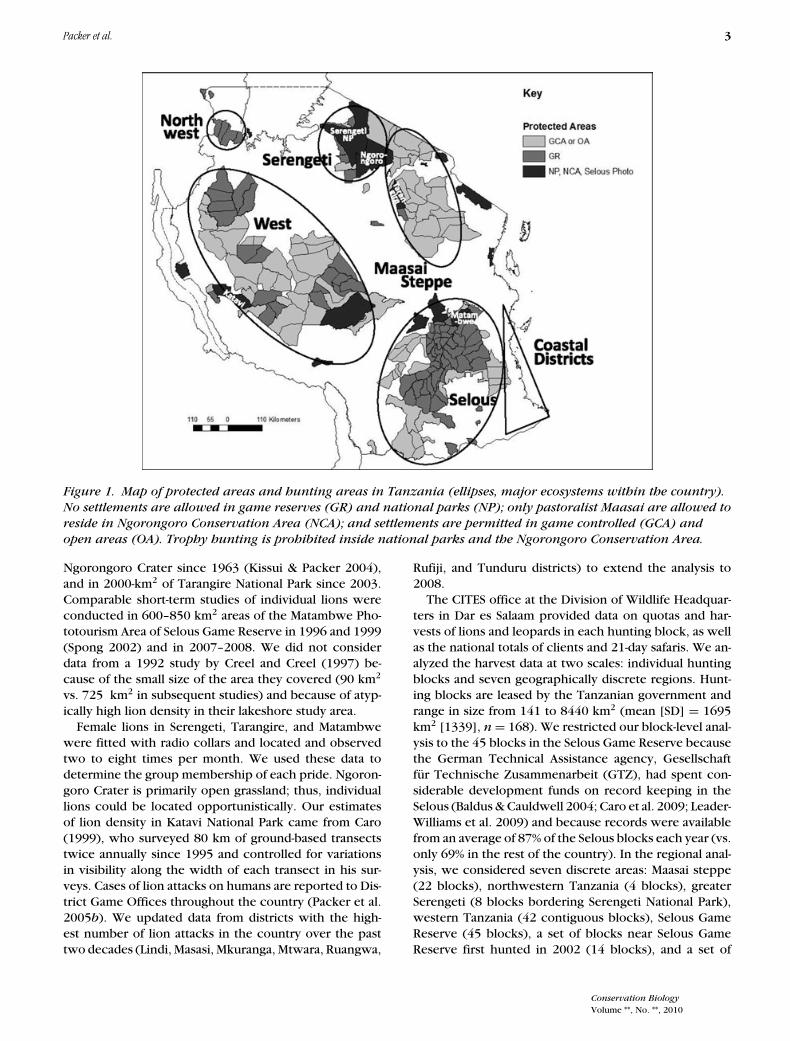
Tanzania has an extensive network of national parks(38,365 km2, including Ngorongoro Conservation Area),game reserves (102,049 km2), and game-controlled areas(202,959 km2), and has more lions than any other coun-try in Africa. Four of the continent’s six largest remainingpopulations of lions occur in Tanzania in the Serengeti,Maasai Steppe, Selous, and western Tanzania (Fig. 1).Leopards are common throughout Tanzania, and thecountry has been granted one of the highest export quo-tas for leopard trophies by CITES. In addition, Tanzaniais the most popular destination for sport hunting of lionsand leopards (http://www.unep-wcmc.org/citestrade/)in the world. An average of 243 wild lion trophies wereexported per year between 1996 and 2006. In Zimbabweand Zambia 96 and 55 trophies/year, respectively, wereexported, and no other country exported more than 20per year (Packer et al. 2009). Tanzania also exportedan average of 303 wild leopard trophies/year, whereasZimbabwe exported 300 per year and no other countryexported more than 100 per year.
Lions and leopards throughout Africa are subjectto widespread loss of habitat, prey depletion, andhuman–animal conflicts that are associated with rapid hu-man population growth (e.g., Ray et al. 2005; Woodroffe& Frank 2005; IUCN 2008). In Tanzania, human popula-tion growth has been particularly high along the bordersof the wildlife areas (Fig. 2a), and deforestation has ac-celerated in the past 15 years (Packer et al. 2009) with
concomitant declines in herbivore populations (Stoneret al. 2007). Thus, there is an urgent need for quantitativeanalysis to establish sustainable harvest practices, whiletaking care to disentangle the impacts of trophy huntingfrom these other anthropogenic factors. Trophy-huntingquotas for lions and leopards have never been based onrigorous quantitative analysis of harvest patterns in anycountry (Packer et al. 2009).
Data on lion population trends in Tanzania are availablefrom long-term studies conducted in a small number ofprotected areas where trophy hunting is not permitted(e.g., Kissui & Packer 2004; Packer et al. 2005a), butno comparable population data exist for leopards. Thepopulation status of both species is unknown in all ofthe country’s hunting blocks. Nevertheless, three factorsallow Tanzania’s trophy harvests to be used as indirectmeasures of population trends (Packer et al. 2009). First,hunting companies invest enormous effort into locatinglions and leopards, and most animals are shot at baitedstations. Male lions frequently scavenge (Schaller 1972)and are thus especially susceptible to baiting. Second,clients must purchase a “21-day safari package” to begranted permission to hunt lions or leopards in Tanzania.Sales have grown by 60% over the past decade, and overallquotas for lions and leopards have also risen (Fig. 2b).Third, a substantial proportion of Tanzania’s lion trophiesin 2006–2008 consisted of subadult males (see Fig. 5 inPacker et al. 2009), which is a sign of over-exploitation(e.g., Allendorf & Hard 2009). Therefore, any decline inharvest likely reflects declining population size.
We assessed whether trophy hunting has had measure-able effects on the abundance of lions and leopards inTanzania. We tested whether hunting areas with the high-est harvest levels subsequently showed signs of overhunt-ing. Additionally, we used data from long-term studies oflions conducted in Tanzania’s phototourism areas to ex-amine whether any of these largely unhunted populationshave been affected by trophy hunting. We also evaluatedthe potential effects of other anthropogenic factors, suchas conversion of natural vegetation to agriculture, humanpopulation density and growth, the presence of ritualand retaliatory killings, and proximity of wildlife habitatto human-occupied areas.
Methods
Continuous, long-term records of individual lions havebeen collected in 2700 km2 of Serengeti National Parksince 1966 (Packer et al. 2005a), in the 250-km2 floor of
Conservation Biology
Volume **, No. **, 2010
Packer et al. 3
Figure 1. Map of protected areas and hunting areas in Tanzania (ellipses, major ecosystems within the country).
No settlements are allowed in game reserves (GR) and national parks (NP); only pastoralist Maasai are allowed to
reside in Ngorongoro Conservation Area (NCA); and settlements are permitted in game controlled (GCA) and
open areas (OA). Trophy hunting is prohibited inside national parks and the Ngorongoro Conservation Area.
Ngorongoro Crater since 1963 (Kissui & Packer 2004),and in 2000-km2 of Tarangire National Park since 2003.Comparable short-term studies of individual lions wereconducted in 600–850 km2 areas of the Matambwe Pho-totourism Area of Selous Game Reserve in 1996 and 1999(Spong 2002) and in 2007–2008. We did not considerdata from a 1992 study by Creel and Creel (1997) be-cause of the small size of the area they covered (90 km2
vs. 725 km2 in subsequent studies) and because of atyp-ically high lion density in their lakeshore study area.
Female lions in Serengeti, Tarangire, and Matambwewere fitted with radio collars and located and observedtwo to eight times per month. We used these data todetermine the group membership of each pride. Ngoron-goro Crater is primarily open grassland; thus, individuallions could be located opportunistically. Our estimatesof lion density in Katavi National Park came from Caro(1999), who surveyed 80 km of ground-based transectstwice annually since 1995 and controlled for variationsin visibility along the width of each transect in his sur-veys. Cases of lion attacks on humans are reported to Dis-trict Game Offices throughout the country (Packer et al.2005b). We updated data from districts with the high-est number of lion attacks in the country over the pasttwo decades (Lindi, Masasi, Mkuranga, Mtwara, Ruangwa,
Rufiji, and Tunduru districts) to extend the analysis to2008.
The CITES office at the Division of Wildlife Headquar-ters in Dar es Salaam provided data on quotas and har-vests of lions and leopards in each hunting block, as wellas the national totals of clients and 21-day safaris. We an-alyzed the harvest data at two scales: individual huntingblocks and seven geographically discrete regions. Hunt-ing blocks are leased by the Tanzanian government andrange in size from 141 to 8440 km2 (mean [SD] = 1695km2 [1339], n = 168). We restricted our block-level anal-ysis to the 45 blocks in the Selous Game Reserve becausethe German Technical Assistance agency, Gesellschaftfur Technische Zusammenarbeit (GTZ), had spent con-siderable development funds on record keeping in theSelous (Baldus & Cauldwell 2004; Caro et al. 2009; Leader-Williams et al. 2009) and because records were availablefrom an average of 87% of the Selous blocks each year (vs.only 69% in the rest of the country). In the regional anal-ysis, we considered seven discrete areas: Maasai steppe(22 blocks), northwestern Tanzania (4 blocks), greaterSerengeti (8 blocks bordering Serengeti National Park),western Tanzania (42 contiguous blocks), Selous GameReserve (45 blocks), a set of blocks near Selous GameReserve first hunted in 2002 (14 blocks), and a set of
Conservation Biology
Volume **, No. **, 2010

4 Trophy Hunting of Lions and Leopards
Figure 2. Human population growth and demand for
lion and leopard trophies in Tanzania. (a) Annual
population growth from 1988 to 2002 in wards
located each distance from national parks and game
reserves (numbers above bars, number of wards;
lines, SE). Wards <5 km from protected areas grew
faster than those 5–25 or >25 km away (p < 0.001).
(b) Total number of 21-day safaris (double line, solid
squares) and total quotas for lions (solid diamonds)
and leopards (open circles) across all of Tanzania’s
hunting blocks.
blocks near Selous hunted since 1996 (7 blocks). Foreach hunted area, we defined the initial hunting inten-sity as the average annual number of animals harvestedper 1000 km2 in 1996–1999. We then calculated the har-vest regression coefficient for 1996 through 2008. Theannual rate of change in lion harvest was the regressioncoefficient divided by the initial intensity. Because therate of change approaches zero at high initial intensities,we log-transformed all data sets where initial intensitiesexceeded 3 trophies·1000 km−2·year−1.
We estimated potential habitat loss with data from1997 on land conversion to agriculture within or adjacentto each wildlife area (FAO 2002). We used data from the
national census (Tanzanian National Bureau of Statistics2002) to measure human population density in 2002 andthe rate of human population growth in each ward be-tween 1988 and 2002). Ward-level growth rates were cal-culated from photographs of 1988 ward-boundary mapsstored at the National Bureau of Statistics in Dar es Salaam.For most areas, quantitative data were not available forprey loss, extent of retaliatory killing, ritual killing, or dis-ease, so we noted only presence or absence of each factor(Table 1) and whether felids living in phototourism areaswere affected by trophy hunting (e.g., Tarangire lions reg-ularly move into hunting blocks from the national park).As a measure of overall exposure to anthropogenic ef-fects of local people, we distinguished between huntingblocks that were completely surrounded by other hunt-ing blocks and blocks that abutted non-wildlife areas andwere thus located along an “edge.” Proportion of edgeis the total area of edge blocks in a particular ecosystemdivided by the total hunted area in that ecosystem.
For the analysis of the regional trophy harvests, weconstructed a priori candidate models to test the ef-fects of hunting intensity, agriculture, human popula-tion density, human population change, and “edge ef-fects” (Table 2). We sought the best model(s) to accountfor harvest trends in each species. Statistics were runin PROC REG in SAS (version 9.1, SAS Institute 2002).We performed model selection with Kullback–Leibler(K–L) information–theoretic approach with Akaike’s in-formation criterion corrected for small sample size (AICc)(Burnham & Anderson 2002; Anderson & Burnham2002). For each candidate model, we used the residualsum of squares (RSS) to calculate the values for AICc:�AICc = (AICi − min AIC), where min AIC is the min-imum AIC value of all models, ωi is the Akaike weight(weight of evidence that model i is the best approximat-ing model given the data and the set of candidate models)(Burnham & Anderson 2002).
Mean harvest intensities and harvest trends were testedfor normality by regressing the residuals against normalprobability curves. We detected no significant deviationsor evidence of kurtosis.
Results
Across the five long-term lion studies in nonconsump-tive protected areas, lion numbers remained the samein one population (Matambwe), increased in one pop-ulation (Serengeti), and decreased in three populations(Tarangire, Katavi, and Ngorongoro), and the frequencyof lion attacks on humans also declined in the agriculturalareas of coastal Tanzania (Fig. 3).
The Serengeti and Ngorongoro lions suffered from se-vere disease outbreaks (Table 1). Whereas the Serengetipopulation recovered quickly (Packer et al. 2005a), the
Conservation Biology
Volume **, No. **, 2010

Packer et al. 5
Tabl
e1.
Sum
mar
yof
thre
ats
toTa
nzan
ia’s
lion
and
leop
ard
popu
latio
ns.
Siz
eLio
nLio
nLeopa
rdLeopa
rdP
roport
ion
Hu
ma
nH
um
an
of
Su
rvey
popu
lati
on
ha
rvest
/h
arv
est
ha
rvest
/a
gri
cult
ure
popu
lati
on
popu
lati
on
Reta
lia
tory
Rit
ua
l
Type
of
eco
syst
em
are
aor
ha
rvest
10
00
km
2/
tren
da
10
00
km
2/
in1
99
7den
sity
per
gro
wth
Pre
yli
on
lion
Pro
port
ion
Eco
syst
em
an
dsi
tea
rea
(km
2)
(km
2)
Yea
rstr
en
da
(r2
,p)
yr
19
96
–1
99
9b
(r2
,p)
yr
19
96
–1
99
9(%
)km
2in
20
02
19
88
–2
00
2(%
)lo
ssb
kil
lin
gb
kil
lin
gD
isea
seedge
Gre
ater
Sere
nge
ti
Ngo
ron
goro
Cra
ter
ph
oto
tou
rism
250
250
1989
–200
9−0
.23
0.02
7N
09.
779.
53N
YN
YN
SESe
ren
geti
Nat
ion
alP
ark
ph
oto
tou
rism
25,0
002,
700
1989
–200
9+0
.74
<0.
001
Y0.
6713
.35
3.59
YY
YY
Y
Sere
nge
tib
lock
s(8
)tr
op
hy
hu
nti
ng
25,0
0011
,597
1996
–200
8−0
.44
0.02
62.
06−0
.25
ns
2.30
6.89
11.1
43.
72Y
YY
Y10
0%
Maa
sai
Step
pe
Tar
angi
reN
atio
nal
Par
kp
ho
toto
uri
sm52
,836
2,00
020
03–2
009
−0.6
40.
031
Y0
15.5
22.
95Y
YN
Y
Maa
saiS
tep
pe
blo
cks
(24)
tro
ph
yh
un
tin
g52
,836
50,0
3619
96–2
008
−0.0
4n
s.0.
54−0
.15
ns
1.36
16.9
9.04
4.96
YY
N69
%
Gre
ater
Selo
us
Mat
amb
we
Ph
oto
-Are
ap
ho
toto
uri
sm90
,089
c72
519
97–2
009
−0.2
0n
s.Y
0.02
2.95
1.26
YY
NY
Selo
us
gam
ere
serv
etr
op
hy
hu
nti
ng
90,0
8944
,244
1996
–200
8−0
.51
0.00
62.
62+0
.05
ns
2.45
2.01
2.51
1.06
YY
N34
%
blo
cks
(45)
Selo
us:
old
blo
cks
(7)
tro
ph
yh
un
tin
g90
,089
13,7
7419
96–2
008
−0.1
0n
s.1.
36+0
.13
ns
0.64
17.1
13.0
52.
40Y
YY
100%
Selo
us:
new
blo
cks
(16)
tro
ph
yh
un
tin
g90
,089
17,2
9520
02–2
008
−0.4
10.
119
2.00
−0.0
3n
s1.
7212
.57.
601.
43Y
YY
100%
Wes
tern
Tan
zan
ia
Kat
aviN
atio
nal
Par
kp
ho
toto
uri
sm14
3,13
84,
300d
1995
–200
9−0
.50
0.01
6Y
0.40
4.35
2.97
YY
YY
Wes
tern
blo
cks
(54)
tro
ph
yh
un
tin
g14
3,13
812
1,55
119
96–2
008
−0.5
70.
004
1.42
−0.1
0n
s1.
085.
086.
614.
15Y
YY
76%
No
rth
wes
tT
anza
nia
No
rth
wes
tern
blo
cks
(4)
tro
ph
yh
un
tin
g4,
240
3,99
519
96–2
008
−0.4
50.
034
2.26
−0.1
1n
s4.
112.
4528
.43
4.34
YY
N10
0%
Sou
thea
stT
anza
nia
Co
asta
ldis
tric
tsag
ricu
ltu
re58
,704
58,7
0419
90–2
008
±0.2
40.
05e
Y42
.932
.62
2.51
YY
NY
aTre
nds
are
ba
sed
on
an
nu
alli
on
surv
eys
inth
eph
oto
tou
rism
are
as
an
don
lion
an
dle
opa
rdh
arv
est
sin
the
hu
nti
ng
are
as
over
the
yea
rssp
eci
fied
inea
chro
w.
bA
bbre
via
tion
s:N
,n
oth
rea
t;Y
,th
rea
tpre
sen
t.cTota
la
rea
of
ph
oto
tou
rism
are
as:
29
96
km
2.
dA
rea
repea
tedly
surv
eyed
(80
km
of
gro
un
dtr
an
sect
s).
eN
um
ber
of
lion
att
ack
son
hu
ma
ns,
r2a
nd
pa
refo
rth
equ
adra
tic
term
.
Conservation Biology
Volume **, No. **, 2010

6 Trophy Hunting of Lions and Leopards
Table 2. Akaike information criterion (AIC) test of the contribution of each variable to lion-harvest trends and leopard-harvest trends in sixsport-hunting areas.∗
Model K AICc �AICc ωi
Lion harvest
lion trophy hunting 2 −46.64 0.00 0.922
null model 1 −39.31 7.33 0.024
proportion edge 2 −38.02 8.62 0.012
lion trophy hunting + proportion edge 3 −37.65 8.99 0.010
proportion agriculture 2 −37.43 9.21 0.009
Leopard harvest
log leopard trophy hunting 2 −37.85 0.00 0.637
null model 1 −35.37 2.48 0.184
proportion agriculture 2 −33.29 4.56 0.065
log leopard trophy hunting + proportion edge 3 −31.93 5.92 0.033
Human population change 2 −31.81 6.04 0.031
∗The model with the lowest AIC and highest Akaike weight (ωi) values is the best model, although any model with a ΔAIC value of <2 would
be considered a plausible alternative. Models with ΔAIC greater than the null model can be disregarded (Burnham & Anderson 2002) (K =df). All the same variables were tested for both species, but only the top five models for each are reported.
abundance of Ngorongoro Crater lions remained belowcarrying capacity due to recurrent epizootics (Kissui &Packer 2004). This population also suffered mortalityfrom Maasai herders (Kissui et al. 2009).
The Matambwe and Serengeti study populations wereexposed to modest levels of trophy hunting, whereas theTarangire population spent 4–6 months of the year out-side the National Park, where they are subject to highlevels of retaliatory killing in response to cattle depre-dation (Kissui 2008) and to trophy hunting. In contrast,Katavi lions were relatively sedentary, and their numberswere low as a result of high trophy harvests in the sur-rounding hunting blocks (Kiffner et al. 2009).
Lion harvests declined significantly in four of sevenhunting areas across the country: the northwest, thewest, around Serengeti National Park, and inside SelousGame Reserve (Fig. 4; Table 1). Record keeping was mostthorough inside the Selous Game Reserve and providedthe best opportunity for a block-by-block analysis. The“retention scheme” in Selous also provided higher lev-els of antipoaching and infrastructure development thanany other hunting area in the country (Baldus & Cauld-well 2004; Leader-Williams et al. 2009), so we consideredhunting trends in this area separate from other areas.
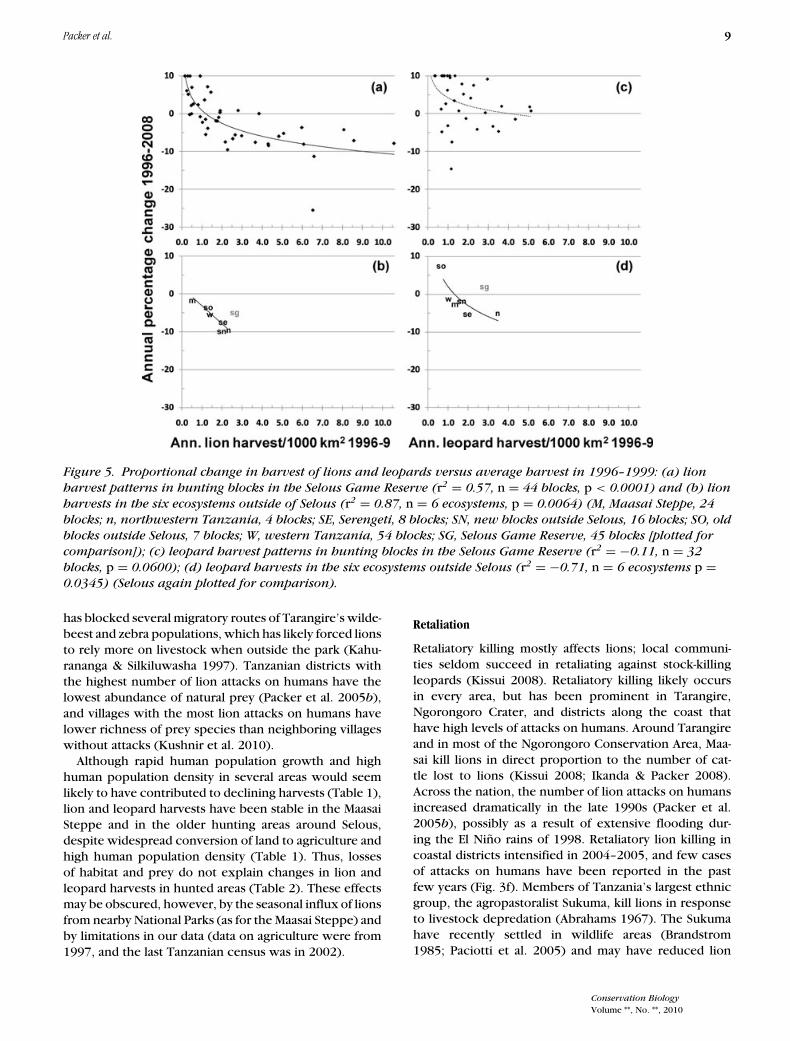
Lion harvests inside the Selous Game Reserve declinedmost steeply in blocks that experienced the highest le-gal harvest per 1000 km2 in 1996–1999 (Fig. 5a). Humansettlement is not permitted inside Tanzanian Game Re-serves, so none of these blocks suffered any loss of habitatfrom agriculture or deforestation. Lion harvests did notdecline more rapidly in the “edge” blocks of the Selousthan in blocks that were completely surrounded by otherhunting blocks. In the remaining six hunting areas, re-gions with the highest initial trophy harvests per 1000km2 again showed the steepest proportional declines inharvest (Fig. 5b). No other variable (e.g., agriculture, hu-man population density, etc.) had a statistically significanteffect (Table 2).
In contrast to lions, leopard harvests have not shownstatistically significant harvest trends in any of the sevenhunting areas (Fig. 4). Nevertheless, harvests in the north-west declined by about 10% per year since 1996, and har-vests around Serengeti declined 5% per year. Within theSelous Game Reserve, hunting harvests declined moresteeply in the blocks with the highest harvest level in1996–1999, but this trend was not significant (Fig. 5c).Across the rest of the country, the proportional declinein leopard harvest was significantly higher in areas withthe highest initial harvests (Fig. 5d), and trophy huntingwas the only important variable (Table 2).
Reports by hunting operators and tour guides insideSelous indicate leopard abundance has increased in thepast 5 years. Selous hunting blocks with the highest av-erage lion harvests in 1996–2008 showed the largest in-creases in leopard harvests (Packer et al. 2009).
Discussion
Trophy hunting appears to have been the primary driverof a decline in lion abundance in the country’s trophy-hunting areas and is likely affecting lion abundance inKatavi National Park and possibly Tarangire NationalPark. In contrast, lion abundance was unchanged in twoof the three phototourism areas that are only minimallyaffected by trophy hunting; lion abundance has fallenin Ngorongoro Crater even though the area is protectedfrom hunting. We lacked independent estimates for leop-ard population trends, but trophy hunting may have sim-ilarly driven a decline in leopard abundance in severalareas outside Selous. In contrast to the conclusions ofIUCN (2006) and Bauer et al. (2008), reports, we wereunable to detect any consistent impact from habitat lossor human–carnivore conflict in hunting areas, althoughretaliatory killing was substantial in several of the pro-tected areas.
Conservation Biology
Volume **, No. **, 2010

Packer et al. 7
Figure 3. Long-term data on lion population density in (a) Matambwe Phototourism Area, Selous Game Reserve,
(b) Serengeti National Park, (c) Tarangire National Park, (d) Katavi National Park (SE), and (e) Ngorongoro
Crater and on (f) the number of lion attacks in Lindi, Masasi, Mkuranga, Mtwara, Ruangwa, Rufiji, and Tunduru
districts (reported to the Tanzanian Wildlife Authorities) (solid lines, total population density; dotted lines, adult
density; diamonds, annual surveys; lines without diamonds, continuous observations).
Trophy Hunting
In Tanzania the Selous Game Reserve is the largest con-tiguous hunting area uninhabited by humans and is thus
the area most exclusively affected by trophy hunting(Caro et al. 2009). The simulation models of Whitmanet al. (2004) predicted that removing 10% of ≥4 year-old-male lions each year would cause an eventual 50%
Conservation Biology
Volume **, No. **, 2010

8 Trophy Hunting of Lions and Leopards
Figure 4. Average number of
lions (heavy lines, diamonds)
and leopards harvested (thin
lines, circles) in major hunting
areas (solid regression line,
statistically significant declines
between 1996 and 2008;
dashed regression line, not
significant).
decline in the total population. The average annual har-vest in Selous was 2.62 males per 1000 km2 in 1996–1999,which would have comprised 9.4% of 27.9 adult malesper 1000 km2 in the Matambwe phototourism sector. Inthe Katavi–Rukwa ecosystem, an average of 10.8 maleswere shot each year between 1996 and 2008, a periodwhen an estimated average of 38 adult males occupiedthe entire area (Caro 2008; Kiffner et al. 2009), makingannual harvests about 28.4% of males. Thus it is plausi-ble that trophy hunting has reduced the lion populationinside Katavi National Park, as suggested by Kiffner andcolleagues (2009). High lion harvest around Zimbabwe’sHwange National Park has had measureable effects onthe population inside the Park (Loveridge et al. 2007,2009), whereas seasonal movements of lions originatingfrom Tarangire National Park may have helped sustainharvests in nearby hunting blocks—an effect that coun-ters extensive human population growth and habitat lossin the Maasai Steppe.
At least three factors may be responsible for sta-bility of leopard harvests. First, widespread declinesin lion abundance could have released leopards frominterspecific competition (Crooks & Soule 1999), andleopards seem to have benefited from declining lionnumbers in Selous Game Reserve (Packer et al. 2009),although we have only anecdotal reports that leopardshave increased in the Selous. Second, about 30% of Tan-
zania’s documented leopard trophies are female (Sponget al. 2000). Packer et al. (2009) showed that cougar pop-ulations can theoretically withstand higher levels of har-vest of females than males, and the same pattern shouldoccur in any other polygynous species with sexually se-lected infanticide. Third, hunting companies might haveput more effort into shooting leopards as lions becamemore difficult to locate in their hunting blocks.
Loss of Habitat and Prey
As seen elsewhere (Wittemyer et al. 2008), human pop-ulation growth is highest in wards located <5 km fromTanzania’s wildlife protected areas (Fig. 2a). Tanzania haslost >37% of woodland and forest habitat since 1990(Packer et al. 2009), and bushmeat poaching has in-creased throughout the country (Jambiya et al. 2007),further reducing the prey base for lions and leopards.Bushmeat poachers operate within Katavi National Park(Caro 2008), the western edge of the Serengeti ecosystem(Sinclair et al. 2008), and in most hunting areas around thecountry (Caro & Andimile 2009). In northern SerengetiNational Park, lions were largely extirpated in the 1980sby poachers setting snares for herbivores (Sinclair et al.2003). Matambwe lions have died after eating poisonedcarcasses set out to kill crocodiles in Selous. Conver-sion of rangeland to agriculture in the Maasai Steppe
Conservation Biology
Volume **, No. **, 2010
Packer et al. 9
Figure 5. Proportional change in harvest of lions and leopards versus average harvest in 1996–1999: (a) lion
harvest patterns in hunting blocks in the Selous Game Reserve (r2 = 0.57, n = 44 blocks, p < 0.0001) and (b) lion
harvests in the six ecosystems outside of Selous (r2 = 0.87, n = 6 ecosystems, p = 0.0064) (M, Maasai Steppe, 24
blocks; n, northwestern Tanzania, 4 blocks; SE, Serengeti, 8 blocks; SN, new blocks outside Selous, 16 blocks; SO, old
blocks outside Selous, 7 blocks; W, western Tanzania, 54 blocks; SG, Selous Game Reserve, 45 blocks [plotted for
comparison]); (c) leopard harvest patterns in hunting blocks in the Selous Game Reserve (r2 = −0.11, n = 32
blocks, p = 0.0600); (d) leopard harvests in the six ecosystems outside Selous (r2 = −0.71, n = 6 ecosystems p =0.0345) (Selous again plotted for comparison).
has blocked several migratory routes of Tarangire’s wilde-beest and zebra populations, which has likely forced lionsto rely more on livestock when outside the park (Kahu-rananga & Silkiluwasha 1997). Tanzanian districts withthe highest number of lion attacks on humans have thelowest abundance of natural prey (Packer et al. 2005b),and villages with the most lion attacks on humans havelower richness of prey species than neighboring villageswithout attacks (Kushnir et al. 2010).
Although rapid human population growth and highhuman population density in several areas would seemlikely to have contributed to declining harvests (Table 1),lion and leopard harvests have been stable in the MaasaiSteppe and in the older hunting areas around Selous,despite widespread conversion of land to agriculture andhigh human population density (Table 1). Thus, lossesof habitat and prey do not explain changes in lion andleopard harvests in hunted areas (Table 2). These effectsmay be obscured, however, by the seasonal influx of lionsfrom nearby National Parks (as for the Maasai Steppe) andby limitations in our data (data on agriculture were from1997, and the last Tanzanian census was in 2002).
Retaliation
Retaliatory killing mostly affects lions; local communi-ties seldom succeed in retaliating against stock-killingleopards (Kissui 2008). Retaliatory killing likely occursin every area, but has been prominent in Tarangire,Ngorongoro Crater, and districts along the coast thathave high levels of attacks on humans. Around Tarangireand in most of the Ngorongoro Conservation Area, Maa-sai kill lions in direct proportion to the number of cat-tle lost to lions (Kissui 2008; Ikanda & Packer 2008).Across the nation, the number of lion attacks on humansincreased dramatically in the late 1990s (Packer et al.2005b), possibly as a result of extensive flooding dur-ing the El Nino rains of 1998. Retaliatory lion killing incoastal districts intensified in 2004–2005, and few casesof attacks on humans have been reported in the pastfew years (Fig. 3f). Members of Tanzania’s largest ethnicgroup, the agropastoralist Sukuma, kill lions in responseto livestock depredation (Abrahams 1967). The Sukumahave recently settled in wildlife areas (Brandstrom1985; Paciotti et al. 2005) and may have reduced lion
Conservation Biology
Volume **, No. **, 2010

10 Trophy Hunting of Lions and Leopards
abundance in several hunting areas. Sukuma poisoned 22lions in 2005–2006 in one block near the Selous (R. Shal-lom, personal communication). Sukuma have also killedlions in Maswa Reserve (adjacent to the Serengeti) andin the Katavi–Rukwa ecosystem. Nevertheless, the num-ber of lions killed by sport hunters has been stable inthe Maasai Steppe, despite intensive retaliatory killing oflions from the Tarangire National Park. Thus, retaliationis unlikely to be the major cause of the overall decline inlion harvests in hunting areas (Table 2).
Ritual Killing
Leopards are not killed in rituals. Maasai kill lions for ritualpurposes (Ala-mayo), but such incidents are uncommonin the Serengeti-Ngorongoro ecosystem (∼2 per year)relative to retaliatory killing (3–4 per year) (Ikanda &Packer 2008) and trophy harvests (11.5 per year). Ritualkilling appears to be rare in Tarangire compared withretaliatory killing (Kissui 2008). The Datoga rituals aresimilar to those of the Maasai (Wilson 1952; Klima 1965),and, like the Sukuma, they have recently settled in wildlifeareas in central and western Tanzania. Lion killings by theDatoga have been documented north of the Selous andin the West, but precise impacts on lions are difficultto evaluate. Sukuma conduct ritual killings in westernTanzania, the extent of which is unknown.
Disease
Diseases of lions have been studied only in Serengeti andNgorongoro Crater, and no quantitative data are availableon diseases of leopards in Tanzania. Severe drought ledto fatal infections of canine distemper virus and babesiain Serengeti lions in 1994 and Ngorongoro Crater lions in2001 (Munson et al. 2008), and the Ngorongoro Craterlions also suffered from two undiagnosed epizootics in1994 and 1998 (Kissui & Packer 2004) (Figs. 3b & e). TheNgorongoro Crater population appears to be immuno-compromised by a high degree of inbreeding (Kissui &Packer 2004); a similar situation in South Africa’s Hluh-luwe iMfolozi Park was ameliorated by translocating un-related animals into the park population (Trinkel et al.2008). Thus, chronic vulnerability to disease largely re-sults from inbreeding in small, isolated lion populations,and disease outbreaks are unlikely to have contributed tothe persistent population declines in any of the huntingareas.
Harvest for Body Parts and Edge Effects
Although lion teeth and claws have long been sold inlocal markets and Sukuma use lion parts as medicine,there are so far no reports of lion bones being exportedfrom Tanzania as substitutes for tiger bones in traditionalChinese medicines.
Hunting areas located adjacent to human-dominatedareas did not have larger declines in lions or leopards than
hunting areas that were buffered from human-dominatedareas, suggesting that the overall effects of local peoplehave been less severe than the effect of sport hunting.
Recommendations
Sport hunters are extremely efficient in locating theirquarry, lion and leopard trophy hunting specifically tar-gets adult males, and each male replacement has pro-found effects on the reproduction of multiple females.Tanzania currently allows about 500 lions and 400 leop-ards per year to be killed for sport in an area of300,000 km2 (1.67 lions and 1.33 leopards/1000 km2).The proportion of male lions removed by trophy huntersin the mid- to late 1990s was unsustainable (28%/year insome areas).
Lion hunting should not exceed 1.0 lions/1000 km2 inthe Selous Game Reserve (Fig. 5a), whereas an upper limitof 0.5 lions/1000 km2 should be imposed for the rest ofthe country (Fig. 5b). Within the Selous, leopard harvestsincreased 2%/year despite an annual average offtake of2.9 leopards/1000 km2 (Fig. 5c); thus, an upper limit of3.0 leopards/1000 km2 would be prudent. In the rest ofthe country, leopard quotas should not exceed 1.0 leop-ard/1000 km2 (Fig. 5d). If these recommendations wereadopted, national quotas would total about 180 lions and400 leopards/year. These numbers still exceed currentharvest levels, but, if they were adopted, hunting effortwould be distributed more evenly across the country.
A strict age minimum would help ensure safe harvestlevels despite uncertainties about local population sizes(Whitman et al. 2004, 2007). Restricting harvest to malelions that are ≥5 years old may be sufficient to minimizethe population impacts of trophy hunting, even if ev-ery ≥5-year-old male was removed every year (Whitmanet al. 2004, 2007). Lion ages can be reliably estimated infield conditions (Whitman & Packer 2007), and Mozam-bique’s Niassa Reserve has successfully implemented a6-year age minimum for hunted lions (Begg & Begg 2009),and a few Tanzanian hunting companies have voluntarilyset a 6-year age minimum. A safe minimum age for leop-ards may be 7 years (Packer et al. 2009). Age-assessmentcriteria, however, are not yet available for leopards, andit is unknown whether leopard ages can be estimatedreliably in the field.
Lions and leopards are CITES-listed species; thus, ev-ery precaution should be taken to prevent harvesting thatcould cause populations to decline. We therefore recom-mend, first, that Tanzania reduce quotas to 0.5 lion (or 1.0in Selous) and 1.0 leopard (or 3.0 in Selous)/1000 km2.Comparable statistical analysis should be performed inother range states, as sustainable offtake rates are likelyto vary between countries. Second, professional huntersand clients in every range state should be educated as to
Conservation Biology
Volume **, No. **, 2010

Packer et al. 11
how to estimate ages of lions (Whitman & Packer 2007).Third, the age of each trophy lion should be indepen-dently validated by post-mortem photographs illustratingphysical features that indicate age (e.g., nose coloration)and tooth x-rays (pulp cavities enclose by year 4 in lions)and physical measurement of tooth wear (Whitman &Packer 2007). Fourth, underage trophy lions should notbe exported. Fifth, similar age-assessment criteria and ex-port policies should also be developed for leopards.
Trophy hunting has been considered essential for pro-viding economic incentives to conserve large carnivores(e.g., Baker 1997; Hurt & Ravn 2000; Child 2004; Lindseyet al. 2006; Dickson et al. 2009). Nevertheless, successfulconservation clearly requires that hunting harvests notexceed sustainable levels.
Acknowledgments
We thank the Wildlife Division of the Ministry for NaturalResources and Tourism for hunting-area data and autho-rization of our study; the Tanzanian Wildlife ResearchInstitute, Tanzanian National Parks, Ngorongoro Conser-vation Area Authority, and Tanzanian Commission for Sci-ence and Technology for permission to conduct field re-search; G. Schaller for advice; and M. Borgerhoff Mulderand two anonymous referees for comments. Long-termresearch in the Serengeti and Ngorongoro is funded byNSF (National Science Foundation) Long Term Researchin Environmental Biology grants DEB-9903416 & DEB-0343960; in Tarangire by African Wildlife Foundation,Wildlife Conservation Society (WCS), and Panthera; inMatambwe by National Geographic Society (NGS) andPanthera; in Katavi-Rukwa by Columbus Zoo, NGS, andUniversity of California-Davis; and in the coastal agricul-tural districts of Tanzania by NSF Biocomplexity grantBE-0308486, WCS, Wildlife Protection Fund of Tanzania,and Panthera.
Literature Cited
Abrahams, R. 1967. The people of Greater Unyamwezi, Tanzania:Nyamwezi, Sukuma, Sumbwa, Kimbu, Konongo. InternationalAfrican Institute, London.
Allendorf, F. W., and J. J. Hard. 2009. Human-induced evolutioncaused by unnatural selection through harvest of wild ani-mals. Proceedings National Academy of Sciences, USA 106:9987–9994.
Anderson, D. R., and K. P. Burnham. 2002. Avoiding pitfalls when us-ing information-theoretic methods. Journal of Wildlife Management66:912–918.
Baker, J. E. 1997. Trophy hunting as a sustainable use of wildliferesources in southern and eastern Africa. Journal of SustainableTourism 5:306–321.
Baldus, R. D., and A. E. Cauldwell. 2004. Tourist hunting and its role indevelopment of wildlife management areas in Tanzania. Game andWildlife Science, 21: 519–614.
Balme, G. A. 2009. The conservation biology of a nominally protectedleopard population. Ph.D. thesis. University of KwaZulu-Natal, West-ville, South Africa.
Balme, G. A., L. T. B. Hunter, P. Goodman, H. Ferguson, J. Craigie,and R. Slotow. 2010. An adaptive management approach to trophyhunting of leopards Panthera pardus: a case study from KwaZulu-Natal, South Africa. Pages 341–352 In press in D. W. Macdonaldand A. J. Loveridge, editors. Biology and conservation of wild felids.Oxford University Press, Oxford, United Kingdom.
Bauer, H., K. Nowell, and C. Packer. 2008. Panthera leo. IUCN redlist of threatened species. Version 2010.1. International Unionfor Conservation of Nature, Gland, Switzerland. Available fromhttp://www.iucnredlist.org/apps/redlist/details/15951/0 (accessedMay 2010).
Begg, C., and K. Begg. 2009. Monitoring of lion and leopard trophies inNiassa National Reserve, Mozambique: 2008 hunting season. NiassaCarnivore Project, Maputo, Mozambique.
Brandstrom, P. 1985. The agro-pastoral dilemma: underutilization oroverexploitation of land among the Sukuma of Tanzania. AfricanStudies Program, University of Uppsala, Uppsala, Sweden.
Burnham, K. P., and D. R. Anderson. 2002. Model selection and mul-timodal inference: a practical information-theoretic approach. 2ndedition. Springer-Verlag, New York.
Caro, T. 1999. Conservation monitoring: estimating mammal densitiesin woodland habitats. Animal Conservation 2:305–315.
Caro, T. 2008. Decline of large mammals in the Katavi-Rukwa ecosystemof western Tanzania. African Zoology 43:99–116.
Caro, T., and M. Andimile. 2009. Does Tanzania have a bushmeat crisis?Miombo 33:7–9/17.
Caro, T., C. R. Young, A. E. Cauldwell, and D. D. E. Brown. 2009. Animalbreeding systems and big game hunting: models and application.Biological Conservation 142:909–929.
Child, B. 2004. Parks in transition: ciodiversity, rural development andthe bottom line. Earthscan, London.
Creel, S., and N. M. Creel. 1997. Lion density and population structure inthe Selous Game Reserve: evaluation of hunting quotas and offtake.African Journal of Ecology 35:85–93.
Crooks, K. R., and M. E. Soule. 1999. Mesopredator release and avifaunalextinctions in a fragmented ecosystem. Nature 400:563–566.
Dickson, B., J. Hutton, and W. M. Adams. 2009. Recreational hunting,conservation and rural livelihoods. Blackwell, Oxford, United King-dom.
FAO (Food and Agricultural Organization). 2002. Tanzania the-matic agricultural metadata (Africover). FAO, Nairobi, Kenya.Available from http://www.africover.org/system/metadata.php?metadataid=81 Downloaded in May 2010.
Fryxell, J. M., C. Packer, K. McCann, E. J. Solberg, and B.-E. Sæther.2010. Harvest cycles and the sustainability of wildlife populations.Science 328:903–906.
Hurt, R., and P. Ravn. 2000. Hunting and its benefits: an overview ofhunting in Africa with special reference to Tanzania. Pages 295–314in H. H. T. Prins, J. G. Grootenhuis, and T. T. Dolan, editors, Wildlifeconservation by sustainable use. Kluwer, London.
Ikanda, D., and C. Packer. 2008. Ritual vs. retaliatory killing of Africanlions in the Ngorongoro Conservation Area, Tanzania. EndangeredSpecies Research 6:67–74.
IUCN (International Union for Conservation of Nature). 2006.Conservation strategy for the lion (Panthera leo) in east-ern and southern Africa. IUCN, Gland, Switzerland. Avail-able from http://www.catsg.org/catsgportal/bulletin-board/05_strategies/Lion%20Conserv%20Strat%20E&S%20Africa%202006.pdf(accessed May 2010).
Jambiya, G., S. Milledge, and N. Mtango. 2007. ‘Night time spinach’:conservation and livelihood implications of wild meat use in refugeesituations in north-western Tanzania. TRAFFIC East/Southern Africa,Dar es Salaam, Tanzania.
Kahurananga, J., and F. Silkiluwasha. 1997. The migration of zebra andwildebeest between Tarangire national park and Simanjiro plains,Northern Tanzania, in 1972 and recent trends. African Journal ofEcology 35:179–185.
Conservation Biology
Volume **, No. **, 2010

12 Trophy Hunting of Lions and Leopards
Kiffner, C., B. Meyer, M. Muhlenberg, and M. Waltert. 2009. Plentyof prey, few predators: what limits lions in Katavi National Park,Western Tanzania? Oryx 43:52–59.
Kissui, B. M. 2008. Livestock predation by lions, leopards, spotted hye-nas, and their vulnerability to retaliatory killing in the Maasai steppe,Tanzania. Animal Conservation 11:422–432.
Kissui, B., A. Mosser, and C. Packer. 2009. Persistence and local extinc-tion of lion prides in the Ngorongoro Crater, Tanzania. PopulationEcology 52:103–111.
Kissui, B. M., and C. Packer. 2004. Top-down regulation of a top preda-tor: lions in the Ngorongoro Crater. Proceedings of the Royal SocietySeries B 271:1867–1874.
Klima, G. 1965. The Barabaig: East African cattle herders. WavelandPress, Prospect Heights, Illinois.
Kushnir, H., H. Leitner, D. Ikanda, and C. Packer. 2010. Human andecological risk factors for unprovoked lion attacks on humans insoutheastern Tanzania. Human Dimensions of Wildlife 15: in press.
Leader-Williams, N., R. D. Baldus, and R. J. Smith. 2009. The influ-ence of corruption on the conduct of recreational hunting. Pages296–316 in B. Dickson, J. Hutton and W. M. Adams, editors,Recreational hunting, conservation and rural livelihoods. Blackwell,Oxford.
Lindsey, P. A., R. Alexander, L. G. Frank, A. Mathieson, and S. S.Romanach. 2006. Potential of trophy hunting to create incen-tives for wildlife conservation in Africa where alternative wildlife-based land uses may not be viable. Animal Conservation 9:283–298.
Loveridge, A., C. Packer, and A. Dutton. 2009. Science and the recre-ational hunting of lions. Pages 110–124 in B. Dickson, J. Hutton andW. M. Adams, editors, Recreational hunting, conservation and rurallivelihoods. Blackwell, Oxford, United Kingdom.
Loveridge, A. J., A. W. Searle, F. Murindagomo, and D. W. Macdonald.2007. The impact of sport-hunting on the population dynamics of anAfrican lion population in a protected area. Biological Conservation134:548–558.
Milner-Gulland, E. J., et al. 2003. Reproductive collapse in saiga antelopeharems. Nature 422:135.
Munson, L., K. A. Terio, R. Kock, T. Mlengeya, M. E. Roelke, E. Dubovi,B. Summers, A. R. E. Sinclair, and C. Packer. 2008. Climate ex-tremes and co-infections determine mortality during epidemics inAfrican lions. Public Library of Science ONE 3 DOI:10.1371/journal.pone.0002545.
Paciotti, B., C. Hadley, C. Holmes, and M. Borgerhoff Mulder. 2005.Grass-roots justice in Tanzania. American Scientist 93:58–65.
Packer, C., R. Hilborn, A. Mosser, B. Kissui, J. Wilmshurst, M. Borner,G. Hopcraft, and A. R. E. Sinclair. 2005a. Ecological change, groupterritoriality and non-linear population dynamics in Serengeti lions.Science 307:390–393.
Packer, C., D. Ikanda, B. Kissui, and H. Kushnir. 2005b. Ecology: lionattacks on humans in Tanzania. Nature 436:927–928.
Packer, C., et al. 2009. Sport hunting, predator control and con-servation of large carnivores. Public Library of Science ONE 4DOI:10.1371/journal.pone.0005941.
Purchase, G., and C. Mateke. 2008. The state of knowledge regard-ing leopard (Panthera pardus) in three range states (Mozambique,Zambia and Zimbabwe) in the context of improving managementof trophy hunting. Report. CAMPFIRE Association of Zimbabwe,Harare.
Ray, J. C., L. T. B. Hunter, and J. Zigouris. 2005. Setting conservationand research priorities for larger African carnivores. Working paper24. Wildlife Conservation Society, New York.
SAS Institute. 2008. SAS. Version 9.1. SAS Institute, Cary, North Carolina.Schaller, G. B. 1972. The Serengeti lion. University of Chicago Press,
Chicago.Sinclair, A. R .E., S. A. R. Mduma, and J. S. Brashares. 2003. Patterns of
predation in a diverse predator system. Nature 425:288–290.Sinclair, A. R. E., C. Packer, S. Mduma, and J. Fryxell. 2008. Serengeti
III: human impacts on ecosystem dynamics. University of ChicagoPress, Chicago.
Spong, G. 2002. Space use in lions Panthera leo in the Selous GameReserve: social and ecological factors. Behavioral Ecology and So-ciobiology 52:303–307.
Spong, G., L. Hellborg, and S. Creel. 2000. Sex ratio of leopards taken introphy hunting: genetic data from Tanzania. Conservation Genetics1:169–171.
Stoner, C. J., T. Caro, S. Mduma, C. Mlingwa, G. Sabuni, and M. Borner.2007. Assessment of the effectiveness of protection strategies inTanzania based on a decade of survey data for large herbivores.Conservation Biology 21:635–646.
Tanzanian National Bureau of Statistics. 2002. 2002 Tanzanian nationalcensus. Dar es Salaam, Tanzania.
Trinkel, M., et al. 2008. Translocating lions into an inbred lion popula-tion in the Hluhluwe-iMfolozi Park, South Africa. Animal Conserva-tion 11:138–143.
Whitman, K. L., and C. Packer. 2007. A hunter’s guide to aging lions ineastern and southern Africa. Safari Press, Long Beach, California.
Whitman, K., H. Quadling, A. Starfield, and C. Packer. 2004. Sustainabletrophy hunting in African lions. Nature 428:175–178.
Whitman, K., A. Starfield, H. Quadling, and C. Packer. 2007. Model-ing the effects of trophy selection and environmental disturbanceon a simulated population of African lions. Conservation Biology21:591–601.
Wilson, G.McL. 1952. The Tatoga of Tanganyika 1&2. Tanganyika Notes& Records 33:34–56.
Wittemyer, G., P. Elsen, W. T. Bean, A. Coleman, O. Burton, and J.S. Brashares. 2008. Accelerated human population growth at pro-tected area edges. Science 321:123–126.
Woodroffe, R., and L. G. Frank. 2005. Lethal control of African lions(Panthera leo): local and regional population impacts. Animal Con-servation 8:91–98.
Conservation Biology
Volume **, No. **, 2010