effects of various small-molecule anesthetics on vesicle...
TRANSCRIPT
Effects of Various Small-Molecule Anesthetics on Vesicle Fusion: A Study UsingTwo-Photon Fluorescence Cross-Correlation Spectroscopy
Trinh T. Nguyen, Jody L. Swift, Melanie C. Burger, and David T. Cramb*Department of Chemistry, UniVersity of Calgary, 2500 UniVersity DriVe N.W., Calgary, Alberta T2N 1N4, Canada
ReceiVed: February 5, 2009; ReVised Manuscript ReceiVed: June 5, 2009
Currently, the molecular mechanism for membrane fusion remains unconfirmed. The most compelling suggestedmechanism is the stalk hypothesis, which states that membrane fusion proceeds via stalk formation/hemifusion,among other steps. Because the stalk would have a very high radius of curvature, small lipophilic moleculescould enhance fusion by lowering the energy barrier to stalk formation. We previously showed that the generalanesthetic halothane is capable of inducing membrane fusion in 1,2-dileoyl-sn-3-glycero-3-phospocholine(DOPC) vesicles. In the present study, we examined other small molecules, general anesthetics (chloroform,isoflurane, enflurane, and sevoflurane), to determine whether they exhibit fusion properties with model lipidmembranes similar to those of halothane. We employed both two-photon excitation fluorescence cross-correlation spectroscopy (TPE-FCCS) and steady-state fluorescence dequenching (FD) assays. Using volatilegeneral anesthetics as novel fusion agents, we also aimed to gain a better understanding of the membranefusion mechanism at a molecular level. We found that lipid mixing or lipid rearrangement, which is requiredfor the formation of the fusion-state intermediates and the fusion pore, rather than the association of lipidvesicles, is rate-limiting. In addition, halothane and chloroform were found to induce lipid mixing(rearrangement) to a greater extent than isoflurane, enflurane, and sevoflurane. Finally, it is proposed that theefficiency of these general anesthetics as fusion agents is related to their partition coefficients, water solubilities,polarities, and molecular volumes, all of which affect the ability of each anesthetic to perturb the contactingbilayer membranes of fusing vesicles.
Introduction
Membrane fusion is the process in which two phospholipidbilayers merge together in an aqueous environment to form asingle mixed lipid bilayer.1 Fusion is an essential mechanismin the function of eukaryotic cells and is involved in the transportof food and waste, intercellular communication, sexual repro-duction, and the asexual transfer of genetic material.2 Moreover,membrane fusion is believed to be the crucial event in the originof life, which has attracted the interest of researchers to developa model explaining the fusion process.1 Although the exactmechanism of membrane fusion has been under debate for manyyears, it is now generally accepted that both proteins and lipidsplay important roles in the process of fusion, as the rearrange-ment of lipid structures is an essential step in the fusionmechanism.3 The current supported mechanism for membranefusion includes the following stages: aggregation/contact, stalkformation/hemifusion, trans-monolayer contact, and finally theformation of a fusion pore, which is followed by the completemixing of the vesicle contents (Figure 1A4).5 Figure 1A showsthat a bilayer will have both positive and negative curvatureduring stalk formation and that these highly curved states canact as barriers to fusion.
Considerable recent work has helped to elucidate importantsteps in vesicle fusion. Cummings and Vanderlick6 haveillustrated that vesicle aggregation kinetics can be described asa two-step process: step one involves vesicle-vesicle collision,whereas step two involves the union of the membrane. It wasdeduced for the crypdin-4 peptide-mediated aggregation of lipidvesicles that the union of the membrane is rate-limiting.6
Additionally, studies examining the kinetics of the lipid mixingin membrane fusion have indicated the presence of kineticallylong-lived intermediates that progress to a hemifusion state,which is followed by a rate-determining step toward theformation of a fusion pore.7 Almost all of the previous vesiclefusion kinetics studies have employed lipid bilayers that containproteins.
In contrast, we chose to examine vesicles made from a singletype of lipid, 1,2-dileoyl-sn-3-glycero-3-phospocholine (DOPC),which could provide insight into the lipid bilayer properties thateffect fusion. Our recent work in this area has shown that thepresence of halothane (CF3CHClBr), an anesthetic that isregularly used in veterinary medicine and in drug-proteinbinding studies,8 can induce changes in the electrostatic interac-tions within the bilayer, which results in thinning of supportedbilayers.9,10 Halothane was also found to be capable of quenchinggramicidin D fluorescence, with the maximum interactionbetween halothane and gramicidin D occurring within the lipidbilayer.8
In addition, we have previously demonstrated that fluores-cence correlation spectroscopy (FCS) can be used to examinesteps in lipid vesicle fusion.11 FCS is a powerful tool that iswidely used for the dynamic characterization of biomoleculesin vitro. Two-photon excitation fluorescence cross-correlationspectroscopy (TPE-FCCS) is capable of measuring the associa-tion and dissociation of two species labeled with differentfluorescent labels over time within a defined focal volume.Concentrations of bound and individual unbound labeled speciescan be determined from the amplitude of the cross- andautocorrelation analyses respectively. The diffusion coefficientsof these species can also be extracted from the correlation decay,* Corresponding author. E-mail: [email protected].
J. Phys. Chem. B 2009, 113, 10357–10366 10357
10.1021/jp901089k CCC: $40.75 2009 American Chemical SocietyPublished on Web 07/06/2009
Dow
nloa
ded
by U
NIV
OF
CA
LG
AR
Y o
n O
ctob
er 2
9, 2
009
| http
://pu
bs.a
cs.o
rg
Pub
licat
ion
Dat
e (W
eb):
Jul
y 6,
200
9 | d
oi: 1
0.10
21/jp
9010
89k

and therefore their respective hydrodynamic radii can bedetermined using the Stokes-Einstein relationship.12,13
Previously, we demonstrated halothane’s ability to enhancemembrane fusion in model DOPC vesicles in the absence ofmembrane proteins,11 which supports the idea that lipids playan essential role in the mechanism of membrane fusion. In thepresent study, we investigated whether other small lipophilicmolecules, namely, the general anesthetics chloroform, isoflu-rane, enflurane, and sevoflurane (Figure 1B), shared similarfusion-/hemifusion-enhancing properties on DOPC vesicles.With this type of study we aim to understand the interactions
between general anesthetics and lipid membranes and gain abetter knowledge of the mechanism which explains anestheticinduced membrane fusion.
It is predicted that enhanced membrane fusion/hemifusionin the presence of anesthetics is dependent on where theanesthetic incorporates into the bilayer and on the lipophilicityof the anesthetic. The general anesthetic halothane was previ-ously shown to localize in the bilayer just below the headgroupregion.14 Baber et al.15 also showed that halothane, enflurane,and isoflurane localize evenly in the hydrocarbon region of thebilayer near the membrane-solution interface.15 The presenceof these general anesthetics below the headgroup of the bilayerperturbs the membrane. This perturbation can lead to a lateralswelling perpendicular to the bilayer plane16 and can alsoincrease the occurrence of lipid rearrangement, resulting in agreater potential for the formation of fusion intermediates thatcan progress into fusion pore states.11,15,17 Moreover, if othergeneral anesthetics incorporate into the bilayer in a mannersimilar to halothane,15 we would expect to observe similarfusogenic properties. Finally, one might expect that the potencyof these general anesthetics as fusion agents is related to theirpartition coefficients, polarities, and molecular volumes.
Materials and Methods
1,2-Dileoyl-sn-3-glycero-3-phospocholine (DOPC) and lis-samine [red label; 1,2-dioleoyl-sn-glycero-3-phosphoetha-nolamine-N-(lissamine rhodamine B sulfonyl) (ammoniumsalt)] were obtained from Avanti Lipids. �-BODIPY-C5-HPC(530/550) [2-(4,4-difluoro-5,7-diphenyl-4-bora-3a,4a-diaza-s-indacene-3-pentanoyl)-1-hexadecanoyl-sn-glycero-3-phos-phocholine, which from now on will be referred to asBODIPY] and Oregon Green (green label; Oregon Green 4881, 2-dihexadecanoyl-sn-glycero-3-phosphoethanolamine) wereobtained from Invitrogen. 1-Bromo-1-chloro-2,2,2-trifluoro-ethane (halothane), 2-chloro-1,1,2-trifluoroethyl difluorom-ethyl ether (enflurane), 1-chloro-2,2,2-trifluoroethyl difluo-romethyl ether (isoflurane), and 1,2,2,2-tetrafluoroethyldifluoromethyl ether (sevoflurane) were purchased from AlfaAesar. Spectroscopic-grade chloroform was purchased fromSigma. All lipids, fluorescent labels, and anesthetics werenot purified further prior to use. Stock solutions of DOPC(∼3.5 × 10⁻³ M), BODIPY (1.08 × 10⁻⁵ M), Oregon Green(9.21 × 10⁻⁵ M), and lissamine (7.86 × 10⁻⁵ M) wereprepared in chloroform and were stored at -20 °C until use.Quartz sample chambers were used throughout all experiments.
Fluorescence Dequenching (FD) Assay.18 Appropriate amountsof DOPC and BODIPY stock solutions were used to yieldDOPC and BODIPY concentrations of 0.1 mM and 5 µM,respectively. N2 gas was used to evaporate all the solvent, andthe dried labeled lipid was resuspended in a phosphate-bufferedsaline (PBS) buffer containing 320 mM sucrose.11 UnlabeledDOPC vesicles were produced similarly. To produce largeunilamellar vesicles (LUVs), both labeled and unlabeled sampleswere stirred in the dark for 30 min at room temperature to allowfor the complete resuspension of the lipid into the buffer. Afteradequate mixing, the samples were alternately sonicated andstirred until they became clear (approximately five cycles), afterwhich they were stored in the dark at 4 °C for no more than 7days. Prior to experimentation, samples were extruded19 usingan Avanti Polar Lipids Inc. miniextruder equipped with a 100-nm nuclepore track-etch membrane purchased from WhatmanNuclepore.
A 5:1 (v/v) ratio of unlabeled to labeled DOPC LUVs waspipetted into a 10-mm-path-length fluorescence cuvette. The
Figure 1. (A) Illustration of the mechanism of vesicle fusion.4 Outermembrane contact results in lipid mixing of the outer membrane leaflet,which produces the fusion stalk and hemifusion state. The subsequentsteps included trans-monolayer contact and subsequent lipid mixing inthe formation of the fusion pore and complete membrane fusion.Reproduced with permission from ref 4. (B) Space-filling structures ofthe phospholipid and anesthetics used in this study. The space-fillingmolecular models were drawn using PyMol (DeLano Scientfic, SanCarlos, CA).
10358 J. Phys. Chem. B, Vol. 113, No. 30, 2009 Nguyen et al.
Dow
nloa
ded
by U
NIV
OF
CA
LG
AR
Y o
n O
ctob
er 2
9, 2
009
| http
://pu
bs.a
cs.o
rg
Pub
licat
ion
Dat
e (W
eb):
Jul
y 6,
200
9 | d
oi: 1
0.10
21/jp
9010
89k
sample was then inverted several times to ensure completemixing, and an emission spectrum was obtained. An anesthetic[halothane, chloroform, enflurane, isoflurane, or sevoflurane (2%v/v)] was added to the cuvette, and the sample was inverted 10times to ensure rapid mixing.9,14 In the case of chloroform, thisproduced a saturated solution (∼70 mM). Fluorescence experi-ments were conducted using a Varian Cary Eclipse fluorescencespectrometer. The instrument was set to a medium scan speed,and both emission and excitation slit widths were set to 5 nm.Emission spectra were obtained by exciting the sample at 480nm and collecting the emission from 490 to 700 nm. Spectrawere obtained every 5 min after anesthetic addition for 15 min,then every 15 min for 90 min, and finally every 30 min thereafteruntil a total of 360 min had elapsed.11 We also measured themaximum extent of dequenching by collecting fluorescence datafrom a solution with the BODIPY label dispersed evenly amongall of the vesicles in an effective dilution by 5. This allowedfor a direct comparison with the above data.
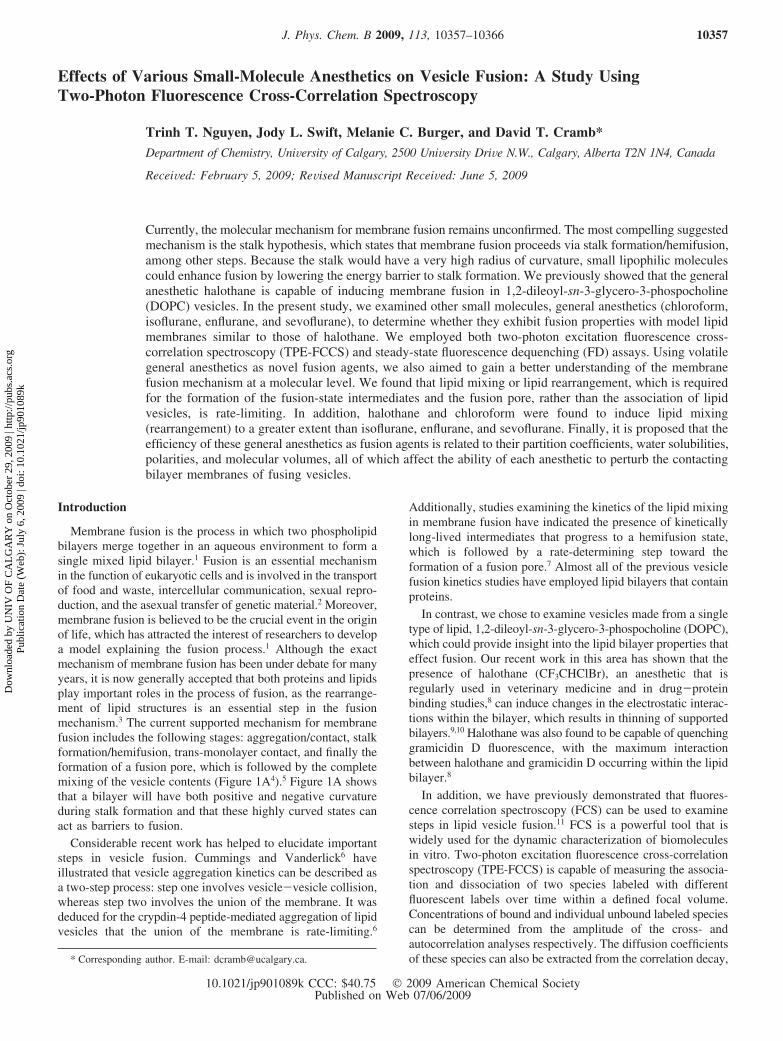
All spectra that were collected were plotted and fitted usingOrigin Pro 7.0. To determine the BODIPY fluorescence de-quenching (FD) contributions from the dimer and monomerpeaks, the data were fit using the sum of two Gaussianfunctions,11 as illustrated in Figure 2. The dimer peak centerwas held fixed at 16979 cm-1, the monomer peak center was
held fixed at 17952 cm-1, and the ratio of the peak areas wasdetermined for each spectrum.
Data Reduction. Previous work that utilized the BODIPYFD assay11 examined fluorescence data by plotting the ratio ofintegrated fluorescence of monomer to dimer (Amonomer/Adimer)as a function of time. The shape of the plot was then comparedto normalized TPE-FCCS data to confirm the occurrence offusion/hemifusion. However, rate constants of fusion/hemifusionobtained by the two methods could not be directly comparedwith each other. Therefore, the proposed fusion/hemifusionmechanism of the BODIPY dequenching assay was furtherinvestigated to produce rate constants that were directlycomparable to those obtained by TPE-FCCS. Assuming thatthe fusion/hemifusion of an unlabeled vesicle with a labeledvesicle is the only fusion/hemifusion event that is occurring earlyin the reaction, the following equation can be used to representfusion/hemifusion kinetics in the FD assay
where DOPC(D) represents a labeled DOPC vesicle containingBODIPY dimers that fuses with an unlabeled DOPC vesicle toproduce a larger DOPC vesicle (DOPC2(M)) that containsBODIPY monomers and some dimers. The increase in monomerintensity (equivalent to the monomer concentration) can berepresented by the differential rate law
The reaction can also be described with respect to the changein dimer concentration using the equation
If the concentration of unlabeled vesicles is in excess, eq 3 canbe reduced to the pseudo-first-order rate law
The integrated rate law of eq 4 is
The increase in the concentration of DOPC2(M) due to the lossof dimer can be represented by the equation
Substitution of eq 5 into eq 6 yields
However, we must consider and account for the initial presenceof monomer, as the initial labeled vesicle will contain not onlyBODIPY dimers, but some monomer as well. Therefore
Figure 2. Fluorescence emission spectrum for DOPC (0.1 mM, lipid)vesicles labeled with �-BODIPY-C5-HPC (5 µM) excited at 480 nm.(A) Emission spectrum containing contributions from BODIPY mono-mers and dimers, which are modeled by Gaussian peaks (green andblue curves, respectively). The sum of the Gaussian peaks producesthe fit (red curve) to the raw data (black curve). (B) Schematic of thefusion of an unlabeled vesicle and a labeled vesicle in the presence ofa fusion agent (anesthetic). The fusion of the two vesicles separatessome of the BODIPY dimer molecules into monomers.
DOPC(D) + DOPC f DOPC2(M) (1)
d[DOPC2(M)]
dt) k[DOPC(D)][DOPC] (2)
d[DOPC(D)]
dt) -k[DOPC(D)][DOPC] (3)
d[[DOPC(D)]
dt) k'[DOPC(D)] (4)
[DOPC(D)] ) [DOPC(D)]0e-k't (5)
[DOPC2(M)] ) [DOPC(D)]0 - [DOPC(D)] (6)
[DOPC2(M)] ) [DOPC(D)]0 - [DOPC(D)]0e-k't (7)
Effects of Small-Molecule Anesthetics on Vesicle Fusion J. Phys. Chem. B, Vol. 113, No. 30, 2009 10359
Dow
nloa
ded
by U
NIV
OF
CA
LG
AR
Y o
n O
ctob
er 2
9, 2
009
| http
://pu
bs.a
cs.o
rg
Pub
licat
ion
Dat
e (W
eb):
Jul
y 6,
200
9 | d
oi: 1
0.10
21/jp
9010
89k

Equation 8 can then be rearranged and simplified to yield
where the concentrations of DOPC2(M) and DOPC(D) arerepresented by the corresponding areas under the BODIPYemission peak intensities.
TPE-FCCS Measurements. Appropriate amounts of lissa-mine and Oregon Green lipid labels were added to DOPC toproduce concentrations of 400 and 250 nM, respectively. Alarger concentration of lissamine was required because of agreater loss during extrusion.11 Labeled vesicles were producedin PBS, using the previously outlined procedure.11 Prior toexperimentation, the respectively labeled samples were extruded,and 500 µL of each was pipetted into an Eppendorf tube. Then,2% (v/v) anesthetic was added, and the sample was inverted10 times to ensure complete mixing. Next, 400 µL of the samplewas placed into a quartz sample chamber and was immediatelyplaced on the inverted microscope. Fluorescence autocorrelationand cross-correlation decays were collected every 5 min for thefirst 15 min after anesthetic addition, then every 15 min for 90min, and finally every 30 min thereafter until a total of 360min had elapsed.
Samples were excited at 780 nm, by a 100-fs pulsed SpectraPhysics Tsunami Ti:sapphire laser operated at 82 MHz. Thelaser power was set to 30 mW with a neutral density filter. In-depth instrumental information and parameters were providedpreviously by Swift et al.11
Data Reduction. Assuming a Gaussian two-photon excitation(TPE) volume, autocorrelation decay curves were modeled andfitted using the equation20
where D is the diffusion coefficient, τ is the lag time, G(0) isthe correlation amplitude, r0 is the radius of the laser beam,and z0 is the depth of the focal volume. The size of the volumeof excitation was calibrated using 5.9 nM, 40 nm FluoSpheres(Invitrogen) and was determined to be 3.4 ( 0.8 fL.
Cross-correlation decays were modeled and fitted using theequation20
where the subscripts i, j, and ij are for red-labeled, green-labeled,and dual-color-labeled diffusing species, respectively, and Gx(0)is the cross-correlation amplitude.
Complete separation between the two detection channels ofOregon Green and lissamine emissions is not possible, as someof the Oregon Green emission will be detected the lissamine(red) channel. To account for this unspecific crosstalk, theparticle brightness for each fluorophore in each detection channelmust be considered.12 Therefore, the concentration of the dual-color-labeled species, Cij, can be defined by the equation12
where Fi and Fj are the average fluorescence intensities fromthe green and red detection channels, respectively, in countsper second. Gx(0,t) represents the individual amplitudes of thecross-correlation decay curve at a given time t. ηii is the apparentbrightness of the green fluorophore, ηjj is the apparent brightnessof the red fluorophore, and ηij is the crosstalk of the greenfluorophore in the red detection channel, all expressed in countsper molecule per second.
The chemical equation used to represent the fusion/hemifusionkinetics of the association of an equimolar distribution of vesicleslabeled with red and green dyes in the TPE-FCCS assay is
where R and G represent red- and green-labeled vesicles, respec-tively, and RG represents the fused/hemifused red and greenvesicles. RR is the result of the fusion/hemifusion of two red-labeled vesicles, and GG is the result of the fusion/hemifusion oftwo green-labeled vesicles. Thus, in the TPE-FCCS fusion/hemifusion assay, one has a mixture of fused/hemifused species,some with twice the brightness of the original and some with thesame brightness.
Equation 12 accounts for crosstalk of green fluorescence inthe red detection channel. However, eq 12 does not distinguishthat some of the fused/hemifused species will have twice thebrightness, when same-colored vesicles fuse together. Subse-quently, their brightness will factor into the interpretation ofthe G(0) values for both the auto- and cross-correlation decays.Therefore, for the cross-correlation decays, the follow relation-ship was established
where NRG is the number of red-green fused/hemifused species,NR is the number of monomer red species, NG is the number ofmonomer green species, and N2R is the number of red-red fused/hemifused species. Assuming that the brightness does not changeas a function of binding, the absolute particle brightnesses for thetwo fluorescent species (ηii and ηjj) cancel out in eq 14. Moreover,when NG ) NR, we can further simplify eq 14 to obtain
Note that NR,total ) NR + NRG + 2N2R ) NR(initial), which appliesonly in the case of the fusion/hemifusion of monomers to formdimers
[DOPC2(M)] ) [DOPC2(M)]0 + ([DOPC(D)]0 -
[DOPC(D)]0e-k't) (8)
[DOPC2(M)] - [DOPC2(M)]0
[DOPC(D)]0) 1 - e-k't (9)
G(τ) ) G(0)(1 + 8Dτr0
2 )-1(1 + 8Dτz0
2 )-1/2(10)
Gij(τ) ) Gx(0)(1 + 8Dτr0
2 )-1(1 + 8Dτz0
2 )-1/2(11)
Cij(t) )8⟨Fi⟩⟨Fj⟩Gx(0, t)
ηiiηjjVeff-
Ci,0ηij
ηjj(12)
4R + 4G f 2RG + RR + GG (13)
Gij(0) )∑
k
ηkiiηkjjNRG
∑k
ηkiiNkG ∑k
ηkjjNkR
)
ηiiηjjNRG
[ηii(NR + NRG) + 2ηiiN2R][ηjj(N2R + NRG) + 2ηjjN2R](14)
Gij(0) )NRG
(NR + NRG + 2N2R)2(15)
Gij(0) )NRG
[NR(initial)]2(16)
10360 J. Phys. Chem. B, Vol. 113, No. 30, 2009 Nguyen et al.
Dow
nloa
ded
by U
NIV
OF
CA
LG
AR
Y o
n O
ctob
er 2
9, 2
009
| http
://pu
bs.a
cs.o
rg
Pub
licat
ion
Dat
e (W
eb):
Jul
y 6,
200
9 | d
oi: 1
0.10
21/jp
9010
89k

Therefore, theoretically, the cross-correlation amplitude should startat zero and increase to a value of 1/(2NR)2 for the formation ofdimers. Our data show that the cross-correlation amplitude doesnot start at zero, because some green fluorescence leaks into thered channel, which results in a low apparent cross-correlation thatis not real.
We can examine the autocorrelation decays in a similarfashion, using the same assumptions as previously applied inthe analysis of the cross-correlations decays, which results inthe following equation for the red channel
Simplifying eq 17 yields
Equation 17 can be applied similarly to the green channel,substituting the corresponding number of particles and particlebrightness for the green fluorophore. Thus, as red or greenmonomers fuse together to form dimers, the amplitudes of theautocorrelation functions in the two channels will remainconstant. However, at longer time scales, higher-order fusion/hemifusion events might occur, which could cause a slightincrease in the autocorrelation amplitudes to be observed. Allfitting of the data was performed using Origin Pro 7.0.
Results
Lipid Mixing: Fluorescence Dequenching Fusion/Hemi-fusion Assay. The fluorescence dequenching (FD) assay wasderived from a fluorescence resonance energy transfer (FRET)fusion/hemifusion assay that utilized the FRET donor-acceptorpair of BODIPY 500-PC and BODIPY 530-PE.18 In thepreviously published FRET assay, lipid vesicles containing bothFRET donors and acceptors were fused with unlabeled lipidvesicles containing no fluorescent probes. The resultant dilutionof the donor-acceptor pairs would lead to an increase in thedistances between the FRET donor-acceptor pairs, thus reduc-ing the intensity of the FRET signal.
BODIPY is known to dimerize at high concentrations(0.5-2.5 mol %), and therefore, it can be used in an FD fusion/hemifusion assay similar to previously used FRET assays.11
Indeed, we have previously demonstrated that the fluorescencedequenching assay is a valid reporter on lipid mixing, bycomparing FD results with those from contents mixing.11 Figure2A shows a fluorescence emission spectrum composed ofmonomer and dimer emissions from BODIPY 530/550 incor-porated into DOPC vesicles. The blue and green peaks representthe Gaussian deconvolutions corresponding to the BODIPYdimer and monomer, respectively, which emit at slightlydifferent wavelengths. Because of the spectral overlap betweenthe two, the excimer (dimer) peak appears to increase, but this
is not actually the case. The red plot in Figure 2A is the fitobtained from the sum of the blue and green Gaussian peaks,whereas the black plot is the experimental data. Figure 2B showsa schematic of the FD assay, which involves the fusion/hemifusion a nonfluorescently labeled lipid vesicle with a vesiclethat contains a high concentration of the BODIPY probe. Thisprocess can be interpreted in the following way (as illustratedin Figure 14): As membrane hemifusion proceeds, lipid mixingof the contacting (proximal) monolayers of the vesicles occursas part of the initial stalk formation. Eventually, the stalkexpands, and mixing of the inner (distal) lipid monolayersresults. The lipid rearrangement required to produce the fusionstalk and fusion pore can be monitored using the FD assay, asfusion/hemifusion of the unlabeled vesicles results in a dilutionof BODIPY dimers within the labeled vesicles. The increase inlipid concentration separates the BODIPY dimers into mono-mers, and an increase in monomer intensity can be observed.
Emission spectra from a mixture of labeled and unlabeledvesicles were collected over time in the presence of eitherchloroform or sevoflurane. Examples are presented in Figure3A,B. It is clear that the monomer peak intensity increases withtime in both cases; however, the effect is much more pronounced
G(0) )∑
k
ηk2Nk
( ∑k
ηkNk)2)
ηjj2(NR + NRG) + 4ηjj
2N2R
[ηjj(NR + NRG) + 2ηjjN2R]2)
NR + NRG + 4N2R
[NR(initial)]2(17)
G(0) ) 1NR(initial)
+2N2R
[NR(initial)]2) 1
NR(initial)+
12NR(initial)
) 32
1NR(initial)
(18)
Figure 3. (A) Fluorescence spectra of BODIPY (5 µM) labeled DOPC(0.1 mM, lipid) vesicles mixed with unlabeled vesicles as a functionof time after chloroform (2% v/v) addition. There is an increase inmonomer fluorescence as fusion occurs between labeled and unlabeledvesicles. (B) Fluorescence spectra of BODIPY (5 µM) labeled DOPC(0.1 mM, lipid) vesicles mixed with unlabeled vesicles as a functionof time after sevoflurane (2% v/v) addition. All samples were excitedat 480 nm, and spectra were collected over time using a Varian CaryEclipse fluorescence spectrometer.
Effects of Small-Molecule Anesthetics on Vesicle Fusion J. Phys. Chem. B, Vol. 113, No. 30, 2009 10361
Dow
nloa
ded
by U
NIV
OF
CA
LG
AR
Y o
n O
ctob
er 2
9, 2
009
| http
://pu
bs.a
cs.o
rg
Pub
licat
ion
Dat
e (W
eb):
Jul
y 6,
200
9 | d
oi: 1
0.10
21/jp
9010
89k

in the case where chloroform was used as the fusion agent. Overthe span of 120 min, the monomer peak intensity increased225% in the case of chloroform, compared to sevoflurane, whosemonomer peak intensity increased only by 21%. The percentincreases of monomer intensity for the remaining anestheticswere 227%, 37%, and 33% for halothane, isoflurane, andenflurane, respectively.
By plotting the ratios of the monomer and dimer peakcontributions, according to eq 9, one can compare the effective-ness of each anesthetic as a fusion/hemifusion-inducing agent,as illustrated in Figure 4. The data shown in Figure 4 can beseparated into two distinct categories: anesthetics that inducedthe greatest amount of lipid mixing (halothane and chloroform),evidenced by the largest increases in monomer fluorescenceintensity, and anesthetics that induced little or no lipid mixing(isoflurane, enflurane, and sevoflurane), resulting in smallerchanges in monomer fluorescence intensity. Assuming that theunlabeled vesicles were in excess, the data for each anestheticin Figure 4 were fit using eq 9 (red curve), and correspondingrate constants for the lipid mixing stage of the fusion mechanismwere obtained. Note that these are the true rate constants, k, ask′ values determined from the fits were divided by the initialunlabeled vesicle concentration, consistent with eqs 3 and 4.The rate constants of lipid mixing for the various anestheticswere similar within the experimental error for chloroform,halothane, and isoflurane and were found to be greater than therate constants for both enflurane and sevoflurane (Table 1).
It is possible that anesthetics induce bilayer swelling. Thisswelling could effectively dilute the fluorescent labels, thusaltering the monomer/dimer peak ratios. To determine whetherthere was any contribution from bilayer swelling to the increasein monomer intensity, the FD assay was conducted in theabsence of the unlabeled DOPC vesicles. Assuming theconcentration of the fluorescent probe to be the same in eachvesicle, one would expect no change in monomer fluorescenceintensity to be observed upon addition of anesthetic, unless someswelling of the bilayer occurred. The results from the fusion/hemifusion of fluorescently labeled and unlabeled DOPCvesicles (squares) and from fusion/hemifusion in the absenceof unlabeled vesicles (circles) for the anesthetics halothane,chloroform, and isoflurane (black, green, and red, respectively)are summarized in Figure 5. Upon comparison of the results, itis clear that the increase in monomer fluorescence intensity isvastly reduced in the absence of unlabeled lipid vesicles.
It is also possible that an aqueous solution saturated withchloroform would promote significant lipid exchange withoutfusion, or even possible dissolution of the vesicles. Similarly,nanoclusters of alcohols in water have been suggested bymolecular dynamics simulations.21,22 Therefore, further experi-ments were performed to determine whether this was the case.The results are presented in the Supporting Information andsummarized here. We found no evidence of fluorescent labeltransfer between vesicles via the chloroform-saturated aqueoussolution. In contrast, we found evidence of vesicles decreasingin number and increasing in size and brightness in thechloroform-saturated solution. This is an indication of associa-tion, rather than dissolution.
Early Stages in Vesicle Fusion: FCCS Assay. Although theabove fluorescence dequenching assay is simple, it does notdistinguish lipid mixing events from vesicle-vesicle association.We therefore chose to apply an assay that reports on vesicleassociation rates. As described previously by Swift et al.,11 FCCSamplitudes can be used to determine the concentration ofassociated vesicles versus time after addition of a fusion-enhancing agent. An example of the cross-correlation data fromthe present study is shown in Figure 6, which shows “before”and “after” anesthetic count-rate trajectories (Figure 6A,B); atypical FCCS decay, with fit to eq 11 (Figure 6C); and a pictorialrepresentation of the vesicle association process (Figure 6D).The amplitude of the cross-correlation decay curve is propor-tional to the number of the associated/bound red-green specieswithin the TPE volume, and the resultant concentration ofassociated/bound species can be plotted as a function of timeafter anesthetic addition (Figure 7). Assuming that the associa-tion and fusion/hemifusion of vesicles can be described as asimple binary reaction, the fusion/hemifusion kinetics can bemodeled with a second-order integrated rate law using eqs 16and 17. Fluorescence resonance energy transfer (FRET) betweenthe red and green labels in associated vesicles would complicatethe FCCS analysis. However, we see no evidence of FRETtaking place. This conclusion can be gleaned from the count-rate trajectories in Figure 6A,B, where the fluorescence leveldoes not change after the addition of anesthetic. If FRET wereoccurring, one would expect a decrease in the green channeland an increase in the red channel.
The average association plots for each anesthetic (three trials,averaged) are shown in Figure 7A. It can be seen that, withinthe experimental error, the data for all of the anesthetics arequite similar, as the maximum concentration of associatedred-green vesicles for all anesthetics ranges between ap-proximately 1 × 10⁻¹⁰ and 2 × 10⁻¹⁰ M. The second-orderkinetic data in Figure 7A were linearized by plotting the inverseconcentration of associated red and green vesicles as a functionof time, as shown in Figure 7B. The slope of the linearizeddata yields the rate constant for the association of red and greenvesicles with each other. At long experiment times, higher-orderfusion/hemifusion events are probable, and the resultant databecome difficult to interpret. Therefore, short time scales (lessthan 30 min) were examined. The rate constants obtained fromthe slopes of the linearized second-order data for chloroform,halothane, isoflurane, enflurane, and sevoflurane are summarizedin Table 1.
Finally, we can support the assumptions made in ourderivation of the association kinetics of red and green fluores-cently labeled vesicles, which resulted in eqs 17 and 18, byplotting the amplitudes of the autocorrelation functions (G(0))for both the red and green detection channels as functions oftime (Figure 8). It is clear from Figure 8 that the amplitudes of
Figure 4. Kinetic curves for the fusion of BODIPY (5 µM) labeledand unlabeled DOPC (0.1 mM, lipid) vesicles induced by variousanesthetics (2% v/v). Vesicle samples were excited at 480 nm, theresultant fluorescence spectra were collected, and emission contributionsfrom the BODIPY monomer and dimer were deconvoluted as shownin Figure 2. A ratio of emission peak areas was plotted as a functionof time, and these curves were fit with eq 9; the results of the fits aresummarized in Table 1.
10362 J. Phys. Chem. B, Vol. 113, No. 30, 2009 Nguyen et al.
Dow
nloa
ded
by U
NIV
OF
CA
LG
AR
Y o
n O
ctob
er 2
9, 2
009
| http
://pu
bs.a
cs.o
rg
Pub
licat
ion
Dat
e (W
eb):
Jul
y 6,
200
9 | d
oi: 1
0.10
21/jp
9010
89k

the autocorrelation functions for both the red and green detectionchannels remain relatively constant for the duration of theexperiment. The slow progressive increases in the G(0) valuesat longer times suggest higher-order (i.e., more than twovesicles) association events.6
Discussion
Recent work by Weinreb and Lentz17 demonstrated thecomplexity of the vesicle fusion process. They proposed a modelin which a rapid association step is followed by rate-limitingstalk-formation steps. Further, they detailed the possibility offusion occurring through two sequential intermediate states andsuggested that, within these states, lipid mixing, contents mixing,and contents leakage can all occur simultaneously.17 Our workaimed to probe two different stages in the fusion mechanism:the initial aggregation or contact of vesicles and the process oflipid mixing toward complete vesicle fusion.
Upon comparison of the rate constants in Table 1, the generaltrend of association being faster than lipid mixing is clear. Weconclude that this behavior arises as follows: FCCS reports onthe initial association steps, because only associated vesiclesregister a cross-correlation signal. This can be compared withthe fluorescence dequenching assay, which reports only onchanges in the fluorescent-lipid concentration and therefore isnot sensitive to association without lipid mixing. The averagerate constant for lipid mixing is 4 orders of magnitude lowerthan that for association. Interestingly, anesthetics increase boththe association and lipid mixing rates, but apparently not in thesame way.
Lipid Mixing and Anesthetics. Lipid mixing can be associ-ated with hemifusion and/or full fusion.17 The extent (i.e.,maximum amount) of lipid mixing, as shown in Figure 4 andsummarized in Table 1, follows the trend halothane > chloroform
> isoflurane > enflurane > sevoflurane. In contrast, the trendobserved for the lipid mixing rate constants was chloroform ≈halothane ≈ isoflurane > enflurane ≈ sevoflurane. Whencomparing the extent of lipid mixing due to each anesthetic withthe rate constant for lipid mixing, the trends observed are quitesimilar. The differences observed in the extent and rate constantsof lipid mixing for each of the anesthetics should be due totheir molecular properties. One might expect that the anestheticposition and/or quantity in the bilayer would be important inthis respect. Therefore, trends of lipid mixing as a function ofbilayer partitioning, molecular volume, and electric dipolemoment were examined.
Oil/water partition coefficients were determined by taking theratio23 of known oil/gas and water/gas partition coefficients.24,25
Table 2 summarizes the known octanol/water partition coef-ficients, calculated oil/water partition coefficients, and watersolubilities for all of the anesthetics used. It is notable that anincreasing partition coefficient is correlated with increases inthe extent of lipid mixing and the lipid mixing rate constant.An exception to this trend is chloroform, which has the lowestpartition coefficient, highest lipid mixing rate constant, and thesecond largest extent of lipid mixing. The discrepancy forchloroform can be explained by examining the solubilities ofthe different anesthetics in water. The solubility of chloroformis 66.6 mM,24 which is more than 4 times greater than those ofenflurane and isoflurane. Therefore, under our experimentalconditions, a higher concentration of chloroform would bepresent in the aqueous liposome solution. Subsequently, morechloroform would be available to partition into the bilayer andwould likely account for chloroform appearing to behavedifferently than the other anesthetics.
The polarity (electric dipole moment) is correlated with theanesthetic position in the bilayer. Species with larger dipolemoments tend to sequester near the headgroup region, whereasless polar anesthetics sequester closer to the tails.26 Theanesthetics with the largest dipole moments (∼2 D), isofluraneand sevoflurane, have the lowest rate constants and extents oflipid mixing. Halothane and chloroform have intermediate dipolemoments (∼1 D).
The molecular volumes of the anesthetics can affect theirabilities to localize and change locations within a bilayer. Amolecule with a smaller volume could be more versatile inaccommodating bilayers with the increased radii of curvaturenecessary for stalk formation and fusion.
It seems likely that the anesthetics that influence bilayerbending rigidity the most will have the greatest effect on lipidmixing (or fusion). These anesthetics appear to be chloroformand halothane. Interestingly, earlier work from our group showedsome evidence in support of this hypothesis. Atomic forcemicroscopy of halothane-containing unilamellar DOPC vesiclesindicates that they do not collapse as readily on a mica surfaceas DOPC vesicles that are free of halothane.27 This suggests
TABLE 1: Summary of Rate Constants Obtained from Steady-State Fluorescence Dequenching (FD) Lipid Mixing andTwo-Photon Excitation Cross-Correlation Spectroscopy (TPE-FCCS) Association Assays, Molecular Dipoles, and MolarVolumes, and Oil/Water Partition Coefficients (Pow) for the General Anesthetics Halothane, Chloroform, Isoflurane, Enflurane,and Sevoflurane
anestheticFD lipid mixing
rate constant (M-1 min-1)FCCS association
rate constant (M-1 min-1)extent of lipid
mixing (%) µ (D)molar
volume (Å3) Pow
halothane 2.10 ((0.35) × 104 5.79 ((2.12) × 107 59 1.537,38 66 313chloroform 2.62 ((0.70) × 104 2.18 ((0.89) × 108 51 1.039 8040 61isoflurane 1.92 ((0.18) × 104 1.72 ((0.68) × 109 21 2.041 12740 168enflurane 1.22 ((0.18) × 104 2.53 ((0.77) × 108 15 0.741 12240 124sevoflurane 1.05 ((0.03) × 104 9.57 ((3.86) × 107 11 2.337 13340 148
Figure 5. Comparison of normalized kinetic curves for the fusion ofBODIPY (5 µM) labeled and unlabeled DOPC (0.1 mM, lipid) vesiclesinduced by 2% v/v anesthetic concentration of halothane (black squares),chloroform (red squares), and isoflurane (green squares), previouslyshown in Figure 4, to respective controls that contained no unlabeledvesicles (black, red, and green circles).
Effects of Small-Molecule Anesthetics on Vesicle Fusion J. Phys. Chem. B, Vol. 113, No. 30, 2009 10363
Dow
nloa
ded
by U
NIV
OF
CA
LG
AR
Y o
n O
ctob
er 2
9, 2
009
| http
://pu
bs.a
cs.o
rg
Pub
licat
ion
Dat
e (W
eb):
Jul
y 6,
200
9 | d
oi: 1
0.10
21/jp
9010
89k

that, with halothane incorporated, the vesicles might be underless curvature strain. Additionally, when halothane was addedto a preformed supported planar bilayer, the lipid featuresformed resembled those of large vesicles, further suggestingthat the thermodynamic-minimum structure for halothane-containing DOPC bilayers is curved.
As shown in Figure 5, a negligible change in monomerfluorescence was observed during the fusion/hemifusion of thetwo labeled vesicles. Therefore, we can assume that the largeincreases in monomer fluorescence that were observed in theFD assay can be attributed to lipid mixing of an unlabeled lipidvesicle with a fluorescently labeled lipid vesicle and not tobilayer swelling caused by the uptake of anesthetics into thelipid bilayer. However, it is possible that the less potent fusionagents (isoflurane, enflurane, and sevoflurane) do not actuallyinduce complete fusion, but instead cause hemifusion. Hemi-fusion is a process in which the contacting lipid membraneleaflets mix, but the inner lipid membrane leaflets remain intact;therefore, no mixing of intervesicular contents occurs, as shownin the third panel of Figure 1.4,6 We therefore chose to reportour findings as lipid mixing and only speculate that the lowerextent of lipid mixing could be associated with hemifusion.
Further, with the FD assay, it would be difficult to distinguishbetween stalk-formation- and pore-formation-induced lipidmixing. Because the data are best fit with a simple single rateconstant, we suggest that this represents stalk formation as beingrate-limiting. Otherwise, we would expect more complex kineticplots. This would be similar to the first step in the stalk modelproposed by Weinreb and Lentz.17 Although they used adifferent lipid system, the rates are quite comparable, with thekinetics in the study about 10-fold slower for lipid mixing. Thisdifference could be rationalized by the differences in lipidsystem and in the mechanism of induction.
Vesicle Association and Anesthetics. As stated above, theanesthetics that enhanced lipid mixing to the greatest degreewere not the same as those that enhanced vesicle association.This suggests that a molecule’s position in the bilayer influencesits macroscopic effect. The rate constants obtained for the FCCSassociation assay, summarized in Table 1, were found to be
Figure 6. (A) Fluorescence count-rate trajectories for 400 nM lissamine-labeled (red) and 250 nM Oregon Green-labeled (green) DOPC (0.1 mM,lipid) vesicles prior to addition of halothane. (B) Fluorescence count-rate trajectories 60 min after addition of halothane (2% v/v). Note the increasein high-amplitude spikes in both channels, indicative of association. (C) Sample cross-correlation decay curve obtained using halothane as a fusionagent. The amplitude of the cross-correlation decay (Gx0) is proportional to the concentration of physically linked red- and green-labeled fluorescentspecies. (D) Schematic depiction of the vesicle association/fusion process. Samples were excited at 780 nm at a laser power of 30 mW.
Figure 7. (A) Average kinetic curves for the association of lissamine(400 nM) and Oregon Green (250 nM) labeled DOPC (0.1 mM, lipid)vesicles induced by various anesthetics (2% v/v) obtained via fluores-cence cross-correlation spectroscopy (FCCS). Concentrations of as-sociated red and green vesicles were obtained from the amplitudes ofcross-correlation decays. (B) Linearized data from A. The rate constantsfor the association of red and green vesicles were obtained from theslopes of the linearized data and are summarized in Table 1.
10364 J. Phys. Chem. B, Vol. 113, No. 30, 2009 Nguyen et al.
Dow
nloa
ded
by U
NIV
OF
CA
LG
AR
Y o
n O
ctob
er 2
9, 2
009
| http
://pu
bs.a
cs.o
rg
Pub
licat
ion
Dat
e (W
eb):
Jul
y 6,
200
9 | d
oi: 1
0.10
21/jp
9010
89k

rather different for each anesthetic. The rate constants for theassociation of labeled vesicles were found to follow the trendisoflurane > enflurane ≈ chloroform > sevoflurane ≈ halothane.The large differences in the vesicle association rate constantsobtained for the general anesthetics indicate that some anesthet-ics decrease the energy barrier for vesicle association to a greaterextent than other anesthetics. Clearly, this trend cannot beexplained by partition coefficients and water solubilities alone,indicating that there must be additional properties that have aneffect on the association rates, possibly by affecting thehydration of the bilayer headgroups.9 Wen et al.28 previouslyillustrated the ability of halothane and isoflurane to increasethe dehydration of surfactants and trigger the formation ofmicelles. Therefore, it can be extrapolated that anesthetics suchas halothane and isoflurane might also disturb the water ofhydration surrounding biological membranes.28
It is of note that the vesicle association rate constants obtainedusing general anesthetics as fusion agents coincide well withrate constants previously reported for Ca2+-induced fusion ofDOPC/cardiolipin LUVs (2.1 × 10⁸ M-1 min-1)29 and Ca2+-induced aggregation of phosphatidylserine (PS) LUVs [(2.6-4.68)× 109 M-1 min-1],30 which further supports the claim that somegeneral anesthetics can be utilized as novel fusion agents, asthe partitioning of an anesthetic into the bilayer would perturbthe contacting monolayers of the associated vesicles, thereforeincreasing the probability of lipid mixing and subsequent fusionpore fomation.31 It is significant that, whereas the extent of lipidmixing varies with anesthetic (FD assay), the association eventsremain constant (TPE-FCCS assay). Thus, we can be confidentthat the measured lipid mixing is not due to sample variation.
Finally, it is clear from Figure 7A that the maximumconcentrations of associated red and green vesicles were thesame within the experimental error for all of the anestheticsexamined. This suggests that, during the time scale of the
experiments, eventually, all of the anesthetics induced the samenumber of association events between red and green vesicles.
Conclusions
We have demonstrated that some general anesthetics (i.e.,halothane and chloroform) have a greater propensity to inducemembrane fusion in model DOPC lipid membranes, which isrelated to their respective partition coefficients, aqueous solubili-ties, polarities, and sizes. Small molecules (anesthetics) thatinduce membrane fusion likely do so through the perturbationof the contacting monolayers of the associated vesicles, whichresults in a reduction of the energy barrier for stalk formation,likely through changes in the bending modulus of the bilayer.Our work further supports the theory that lipid rearrangementfor stalk formation is the rate-limiting step in the membranefusion mechanism of simple vesicles.
Acknowledgment. The authors are grateful to NSERC, CIPI,and AIF for funding this project.
Supporting Information Available: Descriptions of experi-ments designed to examine whether or not liposomes remainintact in a chloroform environment. This material is availablefree of charge via the Internet at http://pubs.acs.org.
References and Notes
(1) Markin, V. S.; Albanesi, J. P. Biophys. J. 2002, 82, 693–712.(2) Horton, R.; Moran, L.; Ochs, R.; Rawn, D.; Scrimgeour, G.
Principles of Biochemistry; Neil Patterson Publishers/Prentice-Hall, Inc.:Englewood Cliffs, NJ, 1992.
(3) Chernomordik, L.; Kozlov, M. M.; Zimmerberg, J. J. Membr. Biol.1995, 146, 1–14.
(4) Langosch, D.; Hofmann, M.; Ungermann, C. Cell. Mol. Life Sci.2007, 64, 850–864.
(5) Lee, J.; Lentz, B. Proc. Natl. Acad. Sci. U.S.A. 1998, 95, 9274–9279.
(6) Cummings, J. E.; Vanderlick, T. K. Biochim. Biophys. Acta:Biomembr. 2007, 1768, 1796–1804.
(7) Floyd, D. L.; Ragains, J. R.; Skehel, J. J.; Harrison, S. C.; vanOijen, A. M. Proc. Natl. Acad. Sci. U.S.A. 2008, 105, 15382–15387.
(8) Carnini, A.; Nguyen, T. T.; T., C. D. Can. J. Chem. 2007, 85, 513–519.
(9) Leonenko, Z. V.; Cramb, D. T. Can. J. Chem. 2004, 82, 1128–1138.
(10) Leonenko, Z. V.; Finot, E.; Cramb, D. Biochim. Biophys. Acta:Biomembr. 2006, 1758, 487–492.
(11) Swift, J. L.; Carnini, A.; Dahms, T. E. S.; Cramb, D. T. J. Phys.Chem. B 2004, 108, 11133–11138.
(12) Heinze, K.; Koltermann, A.; Schwille, P. Proc. Natl. Acad. Sci.U.S.A. 2000, 97, 10377–10382.
(13) Schwille, P.; Meyer-Almes, F.; Rigler, R. Biophys. J. 1997, 72,1878–1886.
(14) Carnini, A.; Phillips, H.; Shamrakov, L.; Cramb, D. Can. J. Chem.2004, 82, 1139–1149.
(15) Baber, J.; Ellena, J. F.; Cafiso, D. S. Biochemistry 1995, 34, 6533–6539.
(16) Norgrady, T. Medicinal Chemistry: A Biochemical Approach, 2nded.; Oxford University Press: New York, 1988.
(17) Weinreb, G.; Lentz, B. R. Biophys. J. 2007, 92, 4012–4029.(18) Malinin, V. S.; Haque, M. E.; Lentz, B. R. Biochemistry 2001, 40,
8292–8299.(19) Szoka, F.; Olson, F.; Heath, T.; Vail, W.; Mayhew, E.; Papahad-
jopoulos, D. Biochim. Biophys. Acta 1980, 601, 559–571.(20) Swift, J. L.; Heuff, R.; Cramb, D. T. Biophys. J. 2006, 90, 1396–
1410.(21) Dougan, L.; Bates, S. P.; Hargreaves, R.; Fox, J. P.; Crain, J.;
Finney, J. L.; Reat, V.; Soper, A. K. J. Chem. Phys. 2004, 121, 6456–6462.
(22) Dixit, S.; Crain, J.; Poon, W. C. K.; Finney, J. L.; Soper, A. K.Nature 2002, 416, 829–832.
(23) Okuda, C. J. Biochem. 1982, 92, 357–363.(24) Roth, S. H.; Miller, K. W. Molecular and Cellular Mechanisms of
Anesthetics; Plenum Medical Book Compay: New York, 1986.(25) Wallin, R. F.; Regan, B. M.; Napoli, M. D.; Stern, I. J. Anesthesia
Analgesia 1975, 54, 758–766.
Figure 8. Plot of autocorrelation amplitudes [G(0) values] of bothred and green detection channels over time of a solution of lissamine(400 nM) and Oregon Green (250 nM) labeled DOPC (0.1 mM, lipid)vesicles after the addition of halothane (2% v/v). The constant amplitudeobserved is consistent with eq 18.
TABLE 2: Summary of Partition Coefficients at 37°C,Logarithms of Octanol/Water Partition Coefficients(Poctanol/water), and Water Solubilities for the General AnestheticsHalothane, Chloroform, Isoflurane, Enflurane, and Sevoflurane
partition coefficients (37 °C)
anestheticsolubility
(mM) oil/gas water/gas oil/water log Poctanol/water
halothane 20.932 19724 0.6324 313 2.7033
chloroform 66.624 23324 3.824 61 1.9734
isoflurane 1524 90.824 0.5424 168 2.4635
enflurane 1524 96.524 0.7824 124 2.1935
sevoflurane 636 53.425 0.3625 148 2.2835
Effects of Small-Molecule Anesthetics on Vesicle Fusion J. Phys. Chem. B, Vol. 113, No. 30, 2009 10365
Dow
nloa
ded
by U
NIV
OF
CA
LG
AR
Y o
n O
ctob
er 2
9, 2
009
| http
://pu
bs.a
cs.o
rg
Pub
licat
ion
Dat
e (W
eb):
Jul
y 6,
200
9 | d
oi: 1
0.10
21/jp
9010
89k
(26) MacCallum, J. L.; Tieleman, D. P. Interactions between smallmolecules and lipid bilayers. In Computational Modeling of MembraneBilayers; Elsevier Academic Press Inc: San Diego, CA, 2008; Vol. 60, pp227-256.
(27) Shamrakov, L. G.; Cramb, D. T. Can. J. Chem. 2005, 83, 1190–1194.
(28) Wen, X. G.; Verrall, R. E.; Liu, G. J. J. Phys. Chem. B 1999, 103,2620–2626.
(29) Lentz, B. R.; Lee, J. K. Mol. Membr. Biol. 199916, 279–296.
(30) Wilschut, J.; Duzgunes, N.; Fraley, R.; Papahadjopoulos, D.Biochemistry 1980, 19, 6011–6021.
(31) Lee, J.; Lentz, B. R. Biochemistry 1997, 36, 6251–6259.(32) Ogata, Y.; Sugihara, K.; Sakka, T.; Iwasaki, M. J. Fluorine Chem.
1992, 57, 285–292.
(33) Urban, B. W.; Bleckwenn, M.; Barann, M. Pharmacol. Therapeut.2006, 111, 729–770.
(34) Hansch, C.; Vittoria, A.; Silipo, C.; Jow, P. Y. C. J. Med. Chem.1975, 18, 546–548.
(35) Franks, N. P.; Lieb, W. R. Anesthesiology 1996, 84, 716–720.(36) Sekiya, A.; Misaki, S. J. Fluorine Chem. 2000, 101, 215–221.(37) Zubrzycki, I. Z.; Xu, Y.; Tang, P. Anesthesiology 2000, 93, A121.(38) Liu, R. Y.; Meng, Q. C.; Xi, J.; Yang, J. S.; Ha, C. E.; Bhagavan,
N. V.; Eckenhoff, R. G. Biochem. J. 2004, 380, 147–152.(39) Wormald, C. J.; Johnson, P. W. J. Chem. Soc., Faraday Trans.
1998, 94, 1267–1270.(40) Braswell, L. M.; Kitz, R. J. J. Neurochem. 1977, 29, 665–671.(41) Liu, R. Y.; Eckenhoff, R. G. Anesthesiology 2005, 102, 799–805.
JP901089K
10366 J. Phys. Chem. B, Vol. 113, No. 30, 2009 Nguyen et al.
Dow
nloa
ded
by U
NIV
OF
CA
LG
AR
Y o
n O
ctob
er 2
9, 2
009
| http
://pu
bs.a
cs.o
rg
Pub
licat
ion
Dat
e (W
eb):
Jul
y 6,
200
9 | d
oi: 1
0.10
21/jp
9010
89k