effects of waterjet treatment on surface · effects of waterjet treatment on surface integrity of...
TRANSCRIPT
KIMA Schriftenreihe
Band 11Herausgeber: Univ. Prof. Dr.-Ing. C. Schindler
Mohd Azmir Mohd Azhari
Effects of Waterjet Treatment on SurfaceIntegrity of Metals and its Optimization
B
and
11
Moh
d Az
mir
Moh
d Az
hari
– Ef
fect
s of
Wat
erje
t Tre
atm
ent o
n Su
rface
Inte
grity
of M
etal
s an
d its
Opt
imiz
atio
n
ISBN 978-3-943995-60-2ISSN 1614-6220

KIMA Schriftenreihe
Band 11Herausgeber: Univ. Prof. Dr.-Ing. C. Schindler
Mohd Azmir Mohd Azhari
Effects of Waterjet Treatment on SurfaceIntegrity of Metals and its Optimization

Herausgeber: Fachbereich Maschinenbau und Verfahrenstechnik Lehrstuhl für Konstruktion im Maschinen- und Apparatebau Univ. Prof. Dr.-Ing. C. Schindler Postfach 3049 Technische Universität Kaiserslautern, Gebäude 42 67653 Kaiserslautern
Verlag: Technische Universität Kaiserslautern
Druck: Technische Universität Kaiserslautern Hauptabteilung 5 Abteilung 5.6 Foto-Repro-Druck
D-386
© Fachbereich Maschinenbau und Verfahrenstechnik, Kaiserslautern 2014
Alle Rechte vorbehalten, auch das des auszugsweisen Nachdrucks, der auszugsweisen oder vollständigenWiedergabe (Photographie, Mikroskopie), der Speicherung in Datenverarbeitungsanlagen und das derÜbersetzung.
Als Manuskript gedruckt. Printed in Germany.
ISSN 1614-6220ISBN 978-3-943995-60-2
Bibliografische Information der Deutschen NationalbibliothekDie Deutsche Nationalbibliothek verzeichnet diese Publikation in der Deutschen Nationalbibliografie; detaillierte bibliografische Daten sind im Internet überhttp://dnb.d-nb.de abrufbar.
Effects of Waterjet Treatment on Surface
Integrity of Metals and its Optimization
Vom Fachbereich Maschinenbau und Verfahrenstechnik
der Technischen Universität Kaiserslautern
zur Verleihung des akademischen Grades
Doktor-Ingenieur (Dr.-Ing.)
genehmigte Dissertation
von
M.Sc. Mohd Azmir Mohd Azhari
aus Perak, Malaysia
Vorsitzender: Prof. Dr.-Ing. Siegfried Ripperger
Berichterstatter: Prof. Dr.-Ing. Christian Schindler
Prof. Dr.-Ing. Eberhard Kerscher
Dekan: Prof. Dr.-Ing. Bernd Sauer
Tag der Einreichung: 18. September 2013
Tag der Mündlichen Prüfung: 11. Dezember 2013
Kaiserslautern, Mai 2014
D 386


Acknowledgement III
Acknowledgement
First of all, I would like to express my deepest gratitude to the Almighty God, for His
blessings, I am finally able to complete this work. I would like to take this opportunity
to wish my sincere thanks to my ‘Doktorvater’, Prof. Dr.-Ing. Christian Schindler, for
his support and encouragement. I would also like to express my appreciation to Prof.
Dr.-Ing. Eberhard Kerscher for being able to examine this work as well as giving me
the opportunity to work under him during the last 3 months of my stay in Germany.
I would like to give credits to those who are directly or indirectly involved in the
completion of this work especially colleagues from ‘Lehrstuhl für Konstruktion im
Maschinen- und Apparatebau (KIMA) and ‘Arbeitsgruppe Werkstoffprüfung (AWP),
Technische Universität Kaiserslautern. The technical support from Lehrstuhl für
Fertigungstechnik und Betriebsorganisation (FBK) and Lehrstuhl für Messtechnik und
Sensorik (MTS), Technische Universität Kaiserslautern, is gratefully acknowledged.
I would also like to take this opportunity to thank Universiti Malaysia Pahang and
Government of Malaysia in providing financial support during my stay in Germany.
Last but not least, my most heartfelt gratitude is reserved to my mom and family for
their undying patience, trust and belief in my endeavour.

To Fauzana, Afeef, Fatini and Aleena
Table of contents V
Table of contents
List of symbols and abbreviations ........................................................................ VII
Kurzfassung .............................................................................................................. X
Zusammenfassung ................................................................................................. XII
1 Introduction ...................................................................................................... 1
2 State of the art .................................................................................................. 3
2.1 Methods of mechanical surface treatment ..................................................... 3
2.1.1 Shot peening process ............................................................................. 4
2.1.2 Laser shock peening process ............................................................... 12
2.1.3 Waterjet peening process ..................................................................... 15
2.2 Mechanics of waterjet impact ...................................................................... 17
2.2.1 Liquid erosion mechanisms .................................................................. 20
2.2.2 Strengthening mechanisms .................................................................. 24
2.3 Effect of waterjet impact on surface............................................................. 26
2.3.1 Roughness ............................................................................................ 26
2.3.2 Erosion .................................................................................................. 29
2.4 Effect of waterjet impact on sub-surface ...................................................... 33
2.4.1 Hardness .............................................................................................. 33
2.4.2 Microstructures ..................................................................................... 36
2.5 Effect of waterjet impact on fatigue life ........................................................ 38
2.6 Summary of state of the art ......................................................................... 42
3 Problem specification and scientific approach ........................................... 45
4 Research methodology ................................................................................. 48
4.1 Materials ...................................................................................................... 48
4.2 Experimental setup ...................................................................................... 52
4.2.1 Equipment ............................................................................................. 52
4.2.2 Experimental design ............................................................................. 53
4.2.3 Experimental procedure ........................................................................ 54
4.3 Analysis of test samples .............................................................................. 55
4.3.1 Surface roughness measurement ......................................................... 55
4.3.2 Hardness measurement ........................................................................ 56
VI Table of contents
4.3.3 Microstructural analysis ........................................................................ 57
4.4 Fatigue test .................................................................................................. 58
5 Results and discussions ............................................................................... 61
5.1 Effect of waterjet peening on surface .......................................................... 61
5.1.1 Roughness ............................................................................................ 61
5.1.2 Erosion .................................................................................................. 65
5.1.3 Comparisons of surface effects between both materials ....................... 77
5.2 Erosion mechanisms ................................................................................... 79
5.3 Effect of waterjet peening on sub-surface ................................................... 94
5.3.1 Hardness .............................................................................................. 94
5.3.2 Microstructures ................................................................................... 101
5.4 Effect of waterjet peening on fatigue life .................................................... 108
5.4.1 Fatigue life performance ..................................................................... 108
5.4.2 Surface fracture analysis .................................................................... 112
6 Optimization of the waterjet peening process ........................................... 116
6.1 Design of experiment ................................................................................. 116
6.2 Response surface methodology ................................................................ 117
6.3 Analysis of results...................................................................................... 120
6.3.1 Roughness .......................................................................................... 120
6.3.2 Hardness ............................................................................................ 124
6.3.3 Optimization ........................................................................................ 134
6.3.4 Fatigue results .................................................................................... 135
7 Conclusions .................................................................................................. 140
7.1 Evaluation of surface effects ..................................................................... 140
7.2 Evaluation of sub-surface effects .............................................................. 141
7.3 Evaluation of fatigue effects ...................................................................... 141
7.4 Optimization of waterjet peening process .................................................. 142
8 Summary and outlook ................................................................................. 143
Literature ............................................................................................................... 145
List of symbols and abbreviations VII
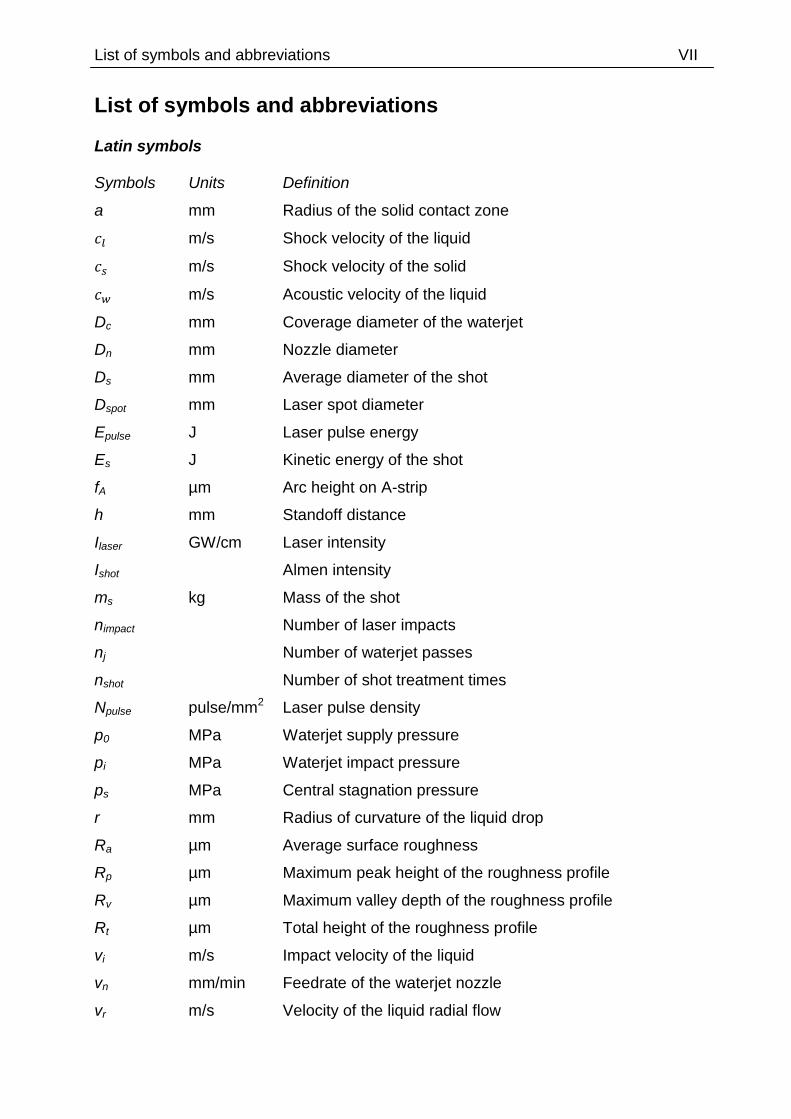
List of symbols and abbreviations
Latin symbols Symbols Units Definition
a mm Radius of the solid contact zone
m/s Shock velocity of the liquid
m/s Shock velocity of the solid
m/s Acoustic velocity of the liquid
Dc mm Coverage diameter of the waterjet
Dn mm Nozzle diameter
Ds mm Average diameter of the shot
Dspot mm Laser spot diameter
Epulse J Laser pulse energy
Es J Kinetic energy of the shot
fA µm Arc height on A-strip
h mm Standoff distance
Ilaser GW/cm Laser intensity
Ishot Almen intensity
ms kg Mass of the shot
nimpact Number of laser impacts
nj Number of waterjet passes
nshot Number of shot treatment times
Npulse pulse/mm2 Laser pulse density
p0 MPa Waterjet supply pressure
pi MPa Waterjet impact pressure
ps MPa Central stagnation pressure
r mm Radius of curvature of the liquid drop
Ra µm Average surface roughness
Rp µm Maximum peak height of the roughness profile
Rv µm Maximum valley depth of the roughness profile
Rt µm Total height of the roughness profile
vi m/s Impact velocity of the liquid
vn mm/min Feedrate of the waterjet nozzle
vr m/s Velocity of the liquid radial flow

VIII List of symbols and abbreviations
vs m/s Velocity of the shot
tp min Peening duration
z µm Depth of the residual stress below the surface
z0 µm Assumed value of the residual stress depth
Greek symbols
Symbols Units Definition
° Contact angle of the liquid drop
s Duration of the water-hammer pressure
ε Strain
θ ° Inclination angle of the nozzle
kg/m3 Density of the liquid
kg/m3 Density of the solid
σr MPa Residual stress
σr,s MPa Residual stress at the surface
σr,max MPa Maximum residual stress
σUTS MPa Ultimate tensile strength
σYS MPa Yield strength
Abbreviations AWJP Abrasive waterjet peening
CAD/CAM Computer-aided design/ computer-aided manufacturing
CEMS Conversion electron Mössbauer spectroscopy
CJA Cavitating jet in air
CJW Cavitating jet in water
KIMA Chair of Design in Mechanical Engineering
LASIK Laser in situ keratomileusis
LSP Laser shock peening
NC Numerical control
OJP Oil jet peening
PC Personal computer
RCW Rounded cut wire
Ref. Reference
TEM Transmission electron microscopy

List of symbols and abbreviations IX
WCP Water cavitation peening
WJP Waterjet peening
WWJ Water-waterjet
XRD X-ray diffraction
3D Three dimensional
X Kurzfassung
Kurzfassung
Die Arbeit befasst sich mit den Auswirkungen des mehrfachen Überfahrens der
Werkstückoberfläche mit dem Wasserstrahl und anderen Einflussfaktoren, wie
Vorschub, Wasserdruck und Düsenabstand auf die Wasserstrahlbehandlung von
Metalloberflächen. Hierzu wurde die Oberflächenbeschaffenheit vor und nach der
Wasserstrahlbearbeitung herangezogen. Eine Erhöhung der Anzahl der Überfahrten
mit dem Wasserstrahl und eine Erhöhung des Drucks führen zu einer höheren
Rauheit, einer größeren Erosion, sowie einer höheren Härte. Die
Vorschubgeschwindkeit hat eine gegenteilige Wirkung auf die genannten
Oberflächeneigenschaften. Es lässt sich ein bestimmter Düsenabstand finden, bei
dem die maximale Oberflächenrauheit, Erosion und Härte entsteht. Durch
Untersuchungen der Mikrostrukturen der bearbeiteten Oberflächen wurden
Erkenntnisse über den Mechanismus des Materialabtrags sowie den Beginn und die
Weiterentwicklung von Schädigungen gewonnen. Basierend auf der Methode der
statistischen Versuchsplanung wurde außerdem die Oberflächenbehandlung mit
Wasserstrahl optimiert. Ebenfalls entwickelte Empirische Modelle zeigen eine sehr
gute Korrelation zwischen gemessenen und erwarteten Ergebnissen. Eine geeignete
Auswahl der Parameter zur praktischen Anwendung kann darauf basierend erfolgen.
Abstract
The study addresses the effect of multiple jet passes and other parameters namely
feedrate, water pressure and standoff distance in waterjet peening of metallic
surfaces. An analysis of surface integrity was used to evaluate the performance of
different parameters in the process. An increase in the number of jet passes and
pressure leads to a higher roughness and more erosion and also a higher hardness.
In contrast, the feedrate shows a reverse effect on those surface characteristics.
There exists a specific value of standoff distance that results in the maximum surface
roughness, erosion as well as hardness. Analysis of the surface microstructure gave
a good insight into the mechanism material removal process involving initial and
evolved damage. Also, the waterjet peening process was optimized based on the
design of experiment approach. The developed empirical models had shown
reasonable correlations between the measured and predicted responses. A proper

Kurzfassung XI
selection of waterjet peening parameters can be formulated to be used in practical
works.
XII Zusammenfassung
Zusammenfassung
Für die Wasserstrahl-Technologie gibt es verschiedene Anwendungen, wie zum
Beispiel Trennen, Oberflächenbehandlung, Reinigung, Entfernung von
Beschichtungen und Randschichtverfestigung (Waterjet peening, WJP). WJP ist eine
relativ neue Anwendung der Wasserstrahl-Technologie. Es handelt sich hierbei um
eine mechanische Verstärkung der Oberfläche, welche durch hochfrequente Stöße
der Wassertropfen mit der Werkstück-Oberfläche und der daraus bedingten lokalen
plastischen Verformung bewirkt wird. Dadurch werden hohe Druckeigenspannungen
in die Oberfläche induziert, was eine größere Oberflächenhärte und längere
Lebensdauer der Komponenten bedingt. Es ist bekannt, dass
Hochdruckwasserstrahlen in der Lage sind, eine starke Beschädigung der
Oberfläche des Werkstoffs durch Erosion zu verursachen. Diese ist durch den Stoß
der sich mit hoher Geschwindigkeit bewegende Flüssigkeitsmasse mit der
Werkstückoberfläche bedingt. Die vorliegende Arbeit befasst sich mit den
Auswirkungen des mehrfachen Überfahrens der Werkstückoberfläche mit dem
Wasserstrahl und anderen Einflussfaktoren, wie Vorschub, Wasserdruck und
Düsenabstand auf den WJP Prozess für Edelstahl X5CrNi18-10 (Werkstoffnummer
1.4301) und Stahl C45 (Werkstoffnummer 1.0503). Eine Analyse der
Oberflächenbeschaffenheit in Bezug auf die Oberflächenrauheit, Abtragung, Härte
und Mikrostrukturen wird verwendet, um den Einfluss verschiedener Parameter auf
den WJP zu bewerten.
Eine Erhöhung der Anzahl der Überfahrten mit dem Wasserstrahl führt zu einer
höheren Rauheit und Erosion auf der Oberfläche durch die wiederholte Belastung
der Oberfläche mit dem Strahl. Ein hoher Wasserdruck bewirkt aufgrund der höheren
kinetischen Energie der Wassermoleküle ebenfalls eine größere Oberflächenrauheit
und verstärkte Erosion. Dahingegen zeigt eine Steigung des Vorschubs eine
umgekehrte Wirkung auf Oberflächenrauheit und Erosionsrate. Für den Düseabstand
existiert ein bestimmter Abstand, bei dem der Strahl hauptsächlich aus
Wassertröpfchen besteht, wodurch sich eine maximale Oberflächenrauheit und
Erosion ergibt. Die Erosion und der Materialabtrag sind bei Stahl C45 (UNS G10450)
höher als bei Edelstahl X5CrNi18-10 (UNS S30400), was in der geringeren Härte des
Stahls C45 begründet ist. Die Mikrostruktur gibt Aufschluss über den Mechanismus
des Materialabtrags, der anfänglichen und sich entwickelnde Beschädigung.
Zusammenfassung XIII
Die Härte sinkt mit steigendem Abstand der Düse zur Oberfläche. Ein mehrfaches
Überfahren der Oberfläche mit dem Strahl und eine Erhöhung des Drucks führen zu
einer größeren Härte und einer größeren Tiefenwirkung. Im Gegensatz dazu hat eine
Erhöhung des Vorschubs eine geringere Härte zur Folge. Für einen bestimmten
Düsenabstand wir die Härte maximal. Die wassergestrahlten Proben weisen eine
geringere Schwingfestigkeit als die unbearbeiteten Proben auf, was wahrscheinlich
durch die erhöhte Oberflächenrauheit bzw. Kerbwirkung bedingt wird. Für die
Dauerfestigkeit spielt die Oberflächenrauheit eine größere Rolle als die Erhöhung der
Härte.
In der Arbeit wurde zudem die Wasserstrahl-Randschichtverfestigung basierend auf
der Methode der statistischen Versuchsplanung optimiert. Diese basiert auf den
Response-Surface-Methoden unter Verwendung des experimentellen Ansatzes nach
Box-Behnken. Dabei wurde die Aluminiumlegierung AlMg1 (Werkstoffnummer
3.3315) als Probenmaterial gewählt. In diesem Zusammenhang wurden empirische
Modelle entwickelt, um die Oberflächenrauheit und die Härte vorherzusagen. Die
empirischen Modelle zeigen eine sehr gute Korrelation zwischen den gemessenen
und erwarteten Ergebnissen. Eine geeignete Auswahl der Parameter zur praktischen
Anwendung kann darauf basierend erfolgen.

This page is intentionally left blank.
1 Introduction 1
1 Introduction
The technology and applications of high pressure waterjet have been studied for
many decades (as early as 1960s) [1]. It has been used extensively in various
industry-related applications including machining, surface preparation, cleaning,
coating removal and surface treatment like waterjet peening (WJP). In general, water
is compressed to an ultrahigh pressure up to about 700 MPa and discharged from a
small orifice typically between 0.2 to 0.4 mm in diameter [1, 2]. If abrasive is used, it
is then mixed with the stream of high-velocity water in a chamber before entering the
nozzle. The system produces a high velocity water stream up to 900 m/s, with or
without abrasive particles causing damage to materials by shearing, cracking,
erosion, cavitation, delamination and plastic deformation [2].
In a machining process, high-pressure waterjet is used to cut a workpiece. With an
addition of abrasive particles, the machining capability of the waterjet is significantly
improved. Various machining processes can be performed including cutting, drilling,
milling, etc. A wide range of materials and thicknesses can be cut with good cutting
quality and small taper. However, different processing parameters and material
properties have to be carefully assessed as to produce the desired cutting qualities.
Using only water at a relatively low pressure, cleaning of surfaces from dirt or coats
can be achieved [3]. High pressure waterjet also is used successfully to mill coal into
powders [4].
Waterjet peening (WJP) is a relatively new application of the waterjet technology [5].
It is a mechanical surface strengthening process where high-frequent impact of water
drops on the surface of metal components, which causes local plastic deformation.
As a result, high compressive residual stresses are induced in the surface-near layer
of the workpiece, which leads to enhanced surface hardness and fatigue life [6]. With
an addition of abrasive particles, a higher amount of compressive residual stresses is
induced but with a significant increase in roughness of metal surfaces [1].
In the Chair of Design in Mechanical Engineering (KIMA), University of
Kaiserslautern, there were a few research projects conducted in the field of waterjet
technology. Several studies were carried out on the simulation and performance of
the cutting jet [7, 8, 9, 10, 11]. The waterjet technology has also been introduced in a

2 1 Introduction
medical-related application. Few studies were reported about its potential application
[12, 13, 14, 15].
The present study attempts to investigate the effect of the waterjet peening process
on the material surfaces. The work consists of eight chapters. The present chapter
briefly introduces the waterjet technology in general. Chapter 2 reviews the current
state of the art on several mechanical surface treatment processes including shot,
laser shock and waterjet peening. However, the basic concept of the waterjet
peening process is discussed in detail. Also, some results from the previous
literatures on the effect of the waterjet peening process are reported. The motivation
and the scope of the present study are explained in Chapter 3. Chapter 4 describes
the experimental and analytical procedures in conducting the study. Chapter 5
presents the main results in the characterization of the waterjet peening process. The
effects of the process on the materials surface, sub-surface and the fatigue
performance are discussed. The optimization of the waterjet peening process is
presented in Chapter 6. Chapter 7 discusses the conclusions based on the results
and the recommendations for future works. Lastly, a summary and outlook for future
research is presented in Chapter 8.

2 State of the art 3
2 State of the art
In today’s practice, mechanical surface treatments have been widely applied
particularly in the spring-manufacturing, automotive and aerospace industries.
Furthermore, these processes are known to be well established in ancient times
concerning metallic materials where evidently hammering was the first mechanical
method used to make particular components to final shape and strength [16]. It was
realized that the failure due to fatigue depends on many factors, and very often it
develops from particular surface areas of engineering parts. So, it seems possible to
improve the fatigue strength of metallic components by the application of suitable
mechanical surface strengthening processes [16].
2.1 Methods of mechanical surface treatment
Various mechanical treatment processes can be applied to enhance the surface
characteristics of engineering components. These treatments use physical processes
to determine the resulting surface condition. The compressive stresses are mainly
induced into ductile metals mechanically by localized plastic deformation within the
outer surface region [17]. Mechanical surface treatment processes usually available
in today’s industry can be roughly divided into cutting and non-cutting methods [18].
However, the main focus of cutting methods is on producing a final shape of a
product, while achieving optimal surface layer states is only a secondary objective.
Therefore, the present study is confined to describing the non-cutting methods which
serve to primarily enhance the surface layer state. A summary of these methods is
shown in Table 2-1. The methods are generally divided into groups based on the
movement between the tools and the workpiece and also the nature of the impacting
force, i.e. either a static or an impulsive tool impact. In the present study, the
description of methods without relative movement is limited to impulsive impact,
which has a repetitive irregular pattern as in shot and waterjet peening as well as a
repetitive regular pattern as in laser shock peening process.
4 2 State of the art
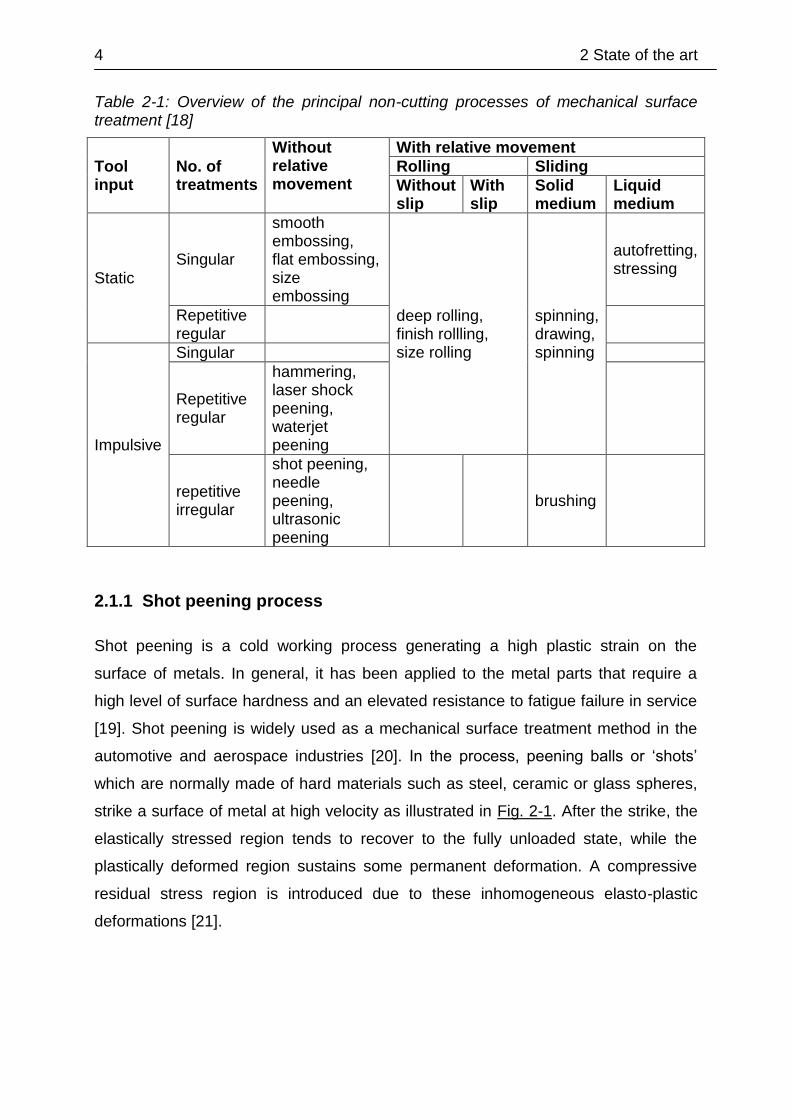
Table 2-1: Overview of the principal non-cutting processes of mechanical surface treatment [18]
Tool input
No. of treatments
Without relative movement
With relative movement
Rolling Sliding
Without slip
With slip
Solid medium
Liquid medium
Static Singular
smooth embossing, flat embossing, size embossing
deep rolling, finish rollling, size rolling
spinning, drawing, spinning
autofretting, stressing
Repetitive regular
Impulsive
Singular
Repetitive regular
hammering, laser shock peening, waterjet peening
repetitive irregular
shot peening, needle peening, ultrasonic peening
brushing
2.1.1 Shot peening process
Shot peening is a cold working process generating a high plastic strain on the
surface of metals. In general, it has been applied to the metal parts that require a
high level of surface hardness and an elevated resistance to fatigue failure in service
[19]. Shot peening is widely used as a mechanical surface treatment method in the
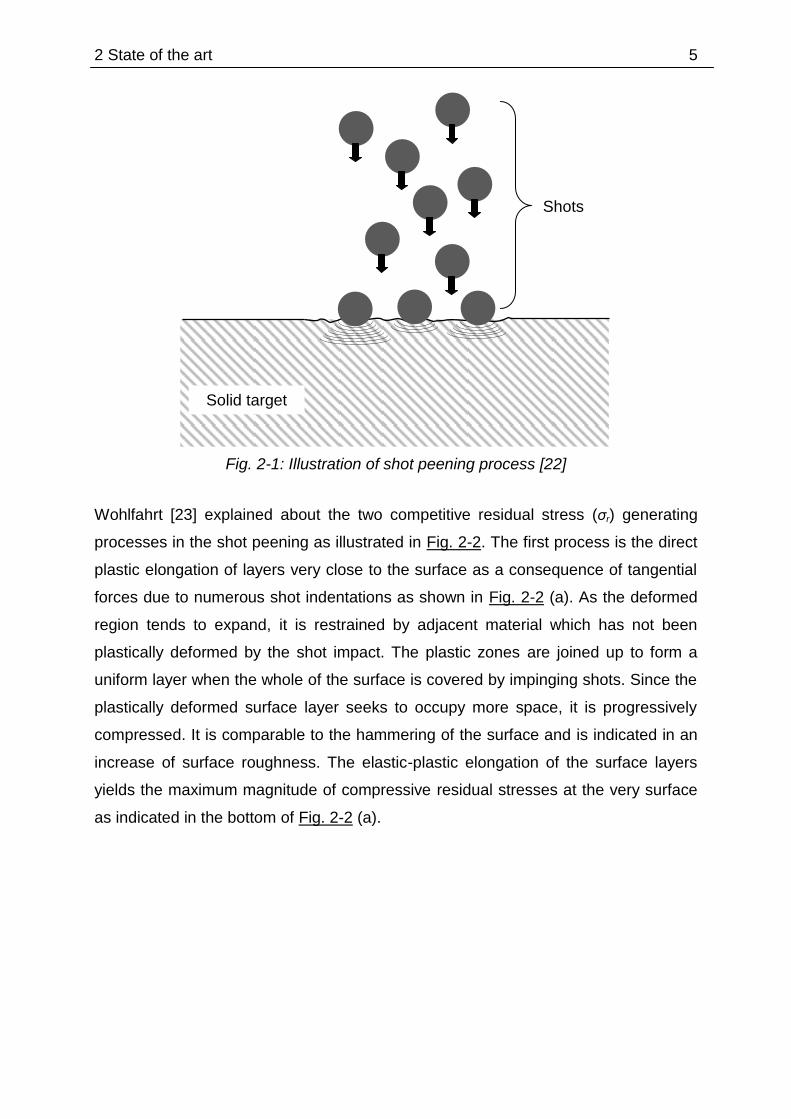
automotive and aerospace industries [20]. In the process, peening balls or ‘shots’
which are normally made of hard materials such as steel, ceramic or glass spheres,
strike a surface of metal at high velocity as illustrated in Fig. 2-1. After the strike, the
elastically stressed region tends to recover to the fully unloaded state, while the
plastically deformed region sustains some permanent deformation. A compressive
residual stress region is introduced due to these inhomogeneous elasto-plastic
deformations [21].
2 State of the art 5
Fig. 2-1: Illustration of shot peening process [22]
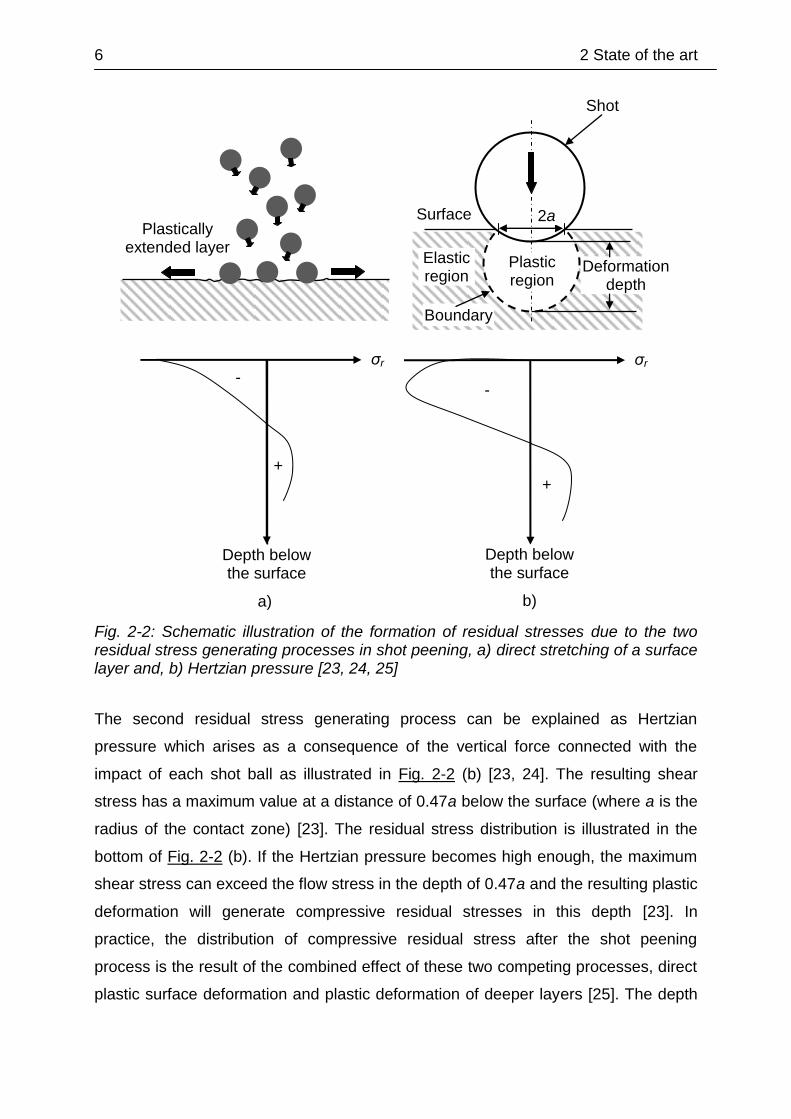
Wohlfahrt [23] explained about the two competitive residual stress (σr) generating
processes in the shot peening as illustrated in Fig. 2-2. The first process is the direct
plastic elongation of layers very close to the surface as a consequence of tangential
forces due to numerous shot indentations as shown in Fig. 2-2 (a). As the deformed
region tends to expand, it is restrained by adjacent material which has not been
plastically deformed by the shot impact. The plastic zones are joined up to form a
uniform layer when the whole of the surface is covered by impinging shots. Since the
plastically deformed surface layer seeks to occupy more space, it is progressively
compressed. It is comparable to the hammering of the surface and is indicated in an
increase of surface roughness. The elastic-plastic elongation of the surface layers
yields the maximum magnitude of compressive residual stresses at the very surface
as indicated in the bottom of Fig. 2-2 (a).
Shots
Solid target
6 2 State of the art
Fig. 2-2: Schematic illustration of the formation of residual stresses due to the two residual stress generating processes in shot peening, a) direct stretching of a surface layer and, b) Hertzian pressure [23, 24, 25]
The second residual stress generating process can be explained as Hertzian
pressure which arises as a consequence of the vertical force connected with the
impact of each shot ball as illustrated in Fig. 2-2 (b) [23, 24]. The resulting shear
stress has a maximum value at a distance of 0.47a below the surface (where a is the
radius of the contact zone) [23]. The residual stress distribution is illustrated in the
bottom of Fig. 2-2 (b). If the Hertzian pressure becomes high enough, the maximum
shear stress can exceed the flow stress in the depth of 0.47a and the resulting plastic
deformation will generate compressive residual stresses in this depth [23]. In
practice, the distribution of compressive residual stress after the shot peening
process is the result of the combined effect of these two competing processes, direct
plastic surface deformation and plastic deformation of deeper layers [25]. The depth
σr -
+
Depth below the surface
Plastically extended layer
a)
σr
-
+
Depth below the surface
Deformation depth
Surface
Shot
Elastic region
Boundary
Plastic region
2a
b)
2 State of the art 7
of the induced compressive residual stress may be up to a few hundred micrometers
below the treated surface [24, 26, 27].
The introduction of compressive residual stress by surface plastic deformation is
usually regarded as the major factor in increasing the fatigue strength. The
magnitude and depth of the compressive stress depends upon the kinetic energy of
the impacting particles, the yield strength of the peened material and the relative
hardness of the shots and the peened material [26]. Since, the kinetic energy of the
shots, Es, is given by Eq. (2-1).
(2-1)
where ms and vs are the mass and velocity of the shot particle respectively. Thus, the
velocity of the shots is regarded as one of the most significant parameters in the shot
peening process [28].
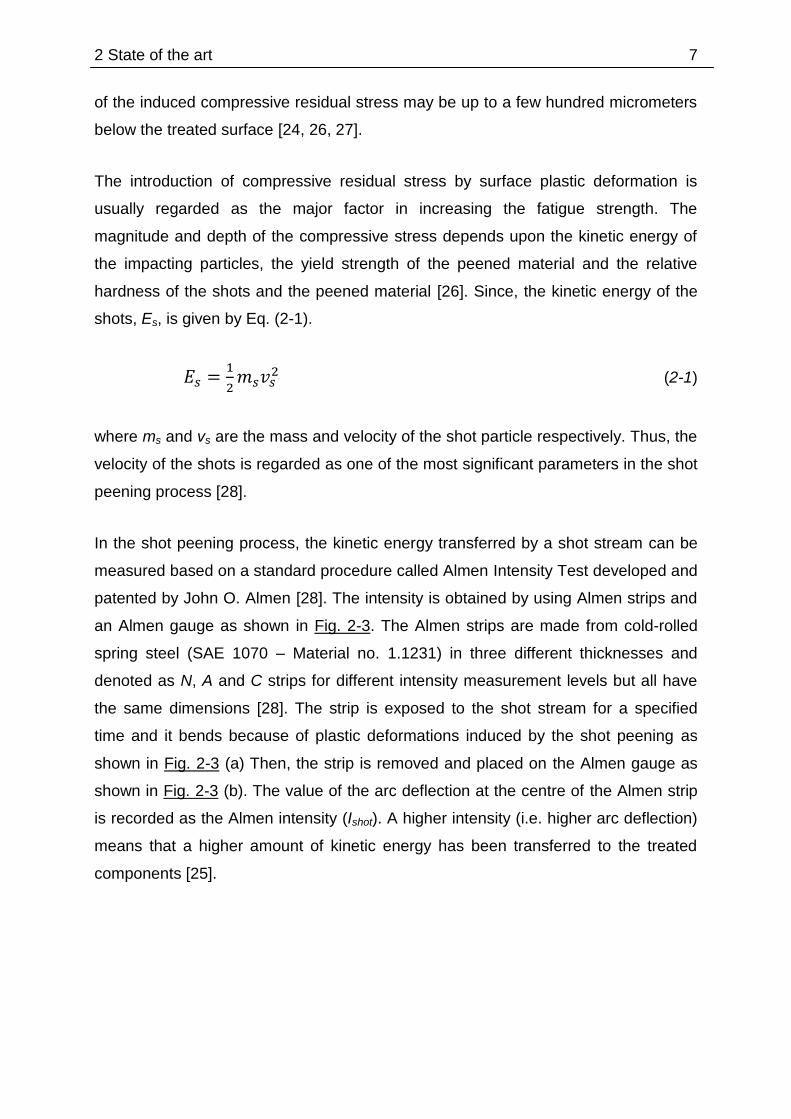
In the shot peening process, the kinetic energy transferred by a shot stream can be
measured based on a standard procedure called Almen Intensity Test developed and
patented by John O. Almen [28]. The intensity is obtained by using Almen strips and
an Almen gauge as shown in Fig. 2-3. The Almen strips are made from cold-rolled
spring steel (SAE 1070 – Material no. 1.1231) in three different thicknesses and
denoted as N, A and C strips for different intensity measurement levels but all have
the same dimensions [28]. The strip is exposed to the shot stream for a specified
time and it bends because of plastic deformations induced by the shot peening as
shown in Fig. 2-3 (a) Then, the strip is removed and placed on the Almen gauge as
shown in Fig. 2-3 (b). The value of the arc deflection at the centre of the Almen strip
is recorded as the Almen intensity (Ishot). A higher intensity (i.e. higher arc deflection)
means that a higher amount of kinetic energy has been transferred to the treated
components [25].

8 2 State of the art
Fig. 2-3: a) The Almen strip is peened on an Almen holder, b) the Almen arc height is measured using the Almen gauge [29]
A lot of investigations have been conducted to study the effect of shot peening in the
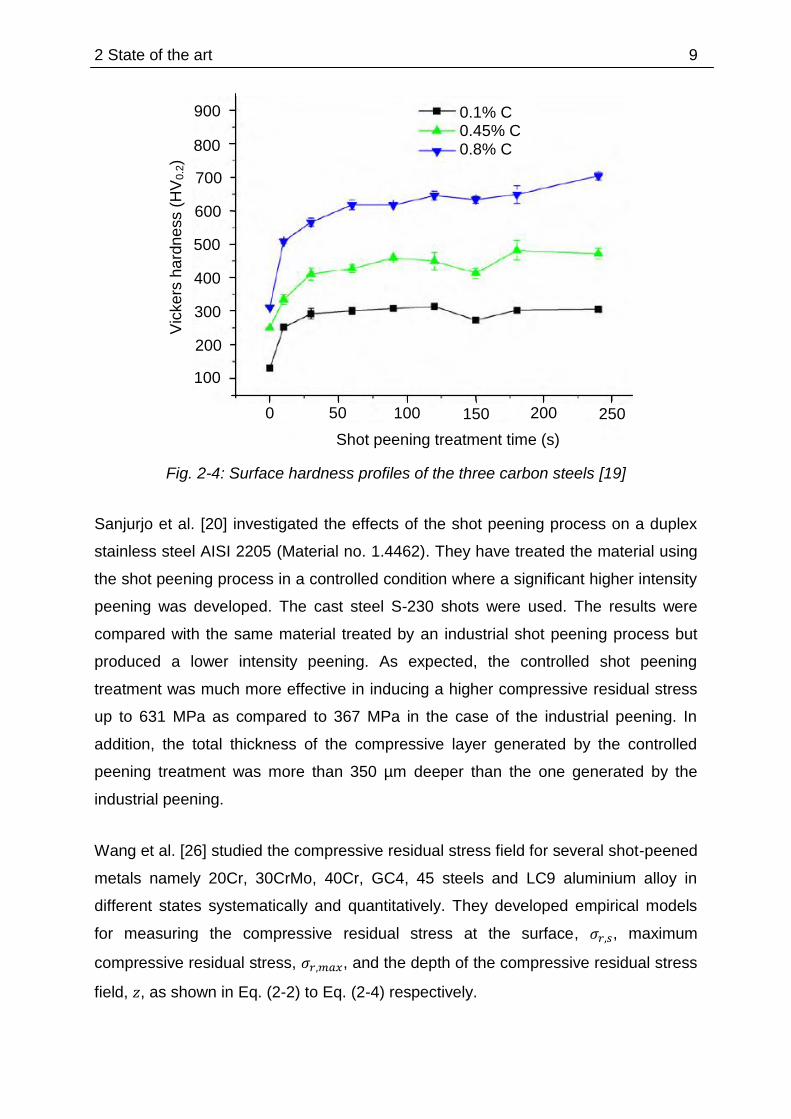
formation of a residual stress field and its effect to the fatigue life. Lee et al. [19]
investigated the effect of the cementite phase on the surface hardening of carbon
steel with three different carbon contents, i.e. 0.1 %C, 0.45 %C, and 0.8 %C, under
the shot peening process. All specimens were treated at different peening durations
(tp) using rounded cut wire (RCW) hardened steel shots with an average diameter
(Ds) of 250 µm. The results show that the surface hardness increases with an
increase in carbon content of the steels as shown in Fig. 2-4. They concluded that
the surface hardening of the carbon steels in the shot peening is achieved through
both the grain refinement and carbon dissolution following the spheroidization of the
cementite phase. They observed a higher degree of the grain refinement and also a
higher amount of dissolved cementite into the ferrite in the steels with higher carbon
contents. This renders the ferrite supersaturated with carbon, upon which the degree
of surface hardening markedly increases.
76.2 mm
19.1 mm
Blast nozzle
Shots
40 mm
31.8 mm 15.9 mm
Almen strip
a) b)
Almen holder
Almen gauge
2 State of the art 9
Fig. 2-4: Surface hardness profiles of the three carbon steels [19]
Sanjurjo et al. [20] investigated the effects of the shot peening process on a duplex
stainless steel AISI 2205 (Material no. 1.4462). They have treated the material using
the shot peening process in a controlled condition where a significant higher intensity
peening was developed. The cast steel S-230 shots were used. The results were
compared with the same material treated by an industrial shot peening process but
produced a lower intensity peening. As expected, the controlled shot peening
treatment was much more effective in inducing a higher compressive residual stress
up to 631 MPa as compared to 367 MPa in the case of the industrial peening. In
addition, the total thickness of the compressive layer generated by the controlled
peening treatment was more than 350 µm deeper than the one generated by the
industrial peening.
Wang et al. [26] studied the compressive residual stress field for several shot-peened
metals namely 20Cr, 30CrMo, 40Cr, GC4, 45 steels and LC9 aluminium alloy in
different states systematically and quantitatively. They developed empirical models
for measuring the compressive residual stress at the surface, , maximum
compressive residual stress, , and the depth of the compressive residual stress
field, , as shown in Eq. (2-2) to Eq. (2-4) respectively.
Shot peening treatment time (s)
Vic
kers
ha
rdn
ess (
HV
0.2)
900
800
500
400
300
200
100
600
700
0 50 100 150 200 250
0.1% C 0.45% C 0.8% C
10 2 State of the art
( ) (2-2)
( )
( ) (2-3)
( (
)) (2-4)
where is the yield strength, is the ultimate tensile strength, is the peening
intensity (i.e. arc height on A-strip) and is the assumed value of which equals to
0.01 mm for Ti-alloy and Al-alloy, 0.09 mm for steel with = 870 – 1000 MPa and
0.04 mm for other steels.
The effect of hardness, fatigue strength and surface roughness of nitrogen austenitic
stainless steel in primary shot peening and double shot peening was investigated by
Singh et al. [30]. Initially, both specimens were peened with glass shots however
zirconium micro-shots were used for double shot peening. They found that a double
shot peening process reduces the surface roughness without significant change in
the residual stress. As a result, the fatigue life increases mainly due to the
improvement in surface finish from the double shot peening process. Furthermore,
Torres and Voorwald [31] evaluated the fatigue life of AISI 4340 steel, used for
aircraft landing gears, under four different peening intensities (i.e four different
peening pressures were applied from 8 to 45 psi). Steel shots (S 230) with an
average diameter of 0.7 mm were used. They found that at the highest stress there is
no change in the number of cycles until failure except in the specimen treated with
the lowest peening intensity as shown in Fig. 2-5. However, there is an increase in
the fatigue life for medium and high cycles. They also found that the best fatigue life
conditions were found in the intermediate peening intensities. Perhaps, a lower
fatigue life at the highest intensity was due to an effect of overpeening. The surface
experiences some defects in the form of microcracks which may act as crack
initiation in the fatigue test.

2 State of the art 11
Fig. 2-5: S-N curves on the base and shot peened specimens [31]
Zhang et al. [32] investigated the influence of different shot peening media namely
Zirblast B30, Ce-ZrO2 and glass beads on the fatigue performance of the high-
strength wrought magnesium alloy AZ80. They found that peening with Ce-ZrO2
shots resulted in the fewest surface defects, lowest roughness, highest maximum
compressive residual stress and highest improvement of the fatigue strength. The
different responses in surface integrity of the peened magnesium alloy are possibly
due the different properties of the peening media. Since Ce-ZrO2 has a higher
density and size than Zirblast B30 and glass beads, thus it has to travel at a
significantly lower velocity in order to achieve a similar peening intensity.
Consequently, less surface damage was produced from a lower kinetic energy of Ce-
ZrO2 shots.
Lee at al. [33] studied the influence of shot peening on the microstructure, surface
roughness and corrosion resistance of AISI 304 stainless steel. Based on
microstructures at the surface, they found the formation of nano-sized grains, multi-
directional mechanical twins and strain-induced martensite. Also, the plastically
deformed region with multi-directional mechanical twins and slip bands on the
surface layer was formed to a depth of 200–250 µm. The hardness was increased by
about 40 % with respect to the as-received specimen up to a depth of 300 µm.
However, the surface roughness was increased significantly after the shot peening
Number of cycles
Str
ess (
MP
a)
140000
1300
1000
900
800 Level 5
1100
1200
104 105 106 107
Base material
8 psi
13 psi
18 psi
45 psi
Level 4
Level 3
Level 2
Level 1
12 2 State of the art
treatment which leads to a lower corrosion resistance mainly because the practical
area for corrosion per unit area also increases with increasing surface roughness.
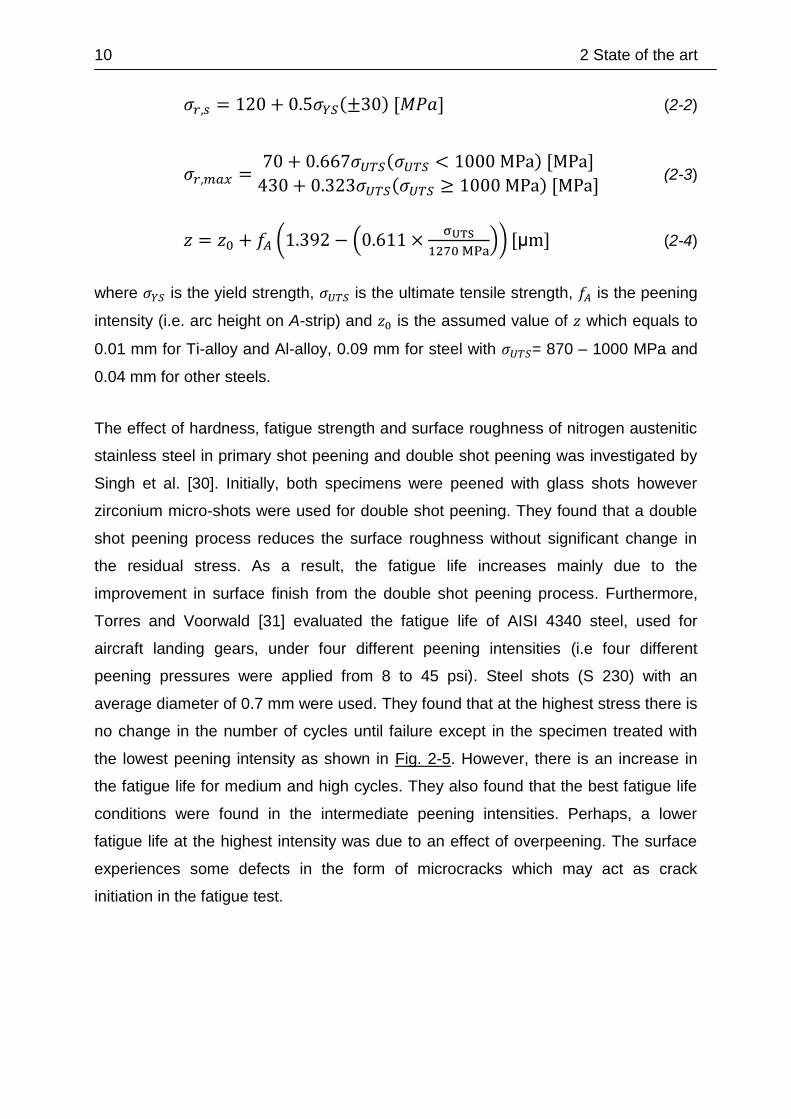
Shen et al. [34] studied the effect of plasma nitriding of AISI 304 austenitic stainless
steel with a pre-shot peening process. The material was peened with industrial steel
shots having a diameter of 0.8 mm. They found that the substrate suffered severe
deformation and the grain boundary became obscure within the outmost layer below
20 µm in depth. Beyond that depth, a huge change in the substructure within the
grains and different systems of slip bands were observed for most of the grains as
illustrated in Fig. 2-6.
Fig. 2-6: Cross-sectional morphologies of shot-peened austenitic stainless steel 304 sample [34]
2.1.2 Laser shock peening process
In principle, laser shock peening (LSP) is similar to other peening processes with the
aim of enhancing the fatigue life of engineering components. It is the latest peening
technology initially introduced in the aerospace industry [22]. In the process, a laser
beam is directed toward the surface of a metal component coated with an ablative
layer (e.g. paint or tape) and covered with a thin layer of transparent material, usually
water as illustrated in Fig. 2-7. This creates high energy plasma that generates a
pressure shock wave and propagates the compressive stress through the
material [22]. The material will experience an extensive plastic deformation when the
magnitude of the shock wave exceeds its dynamic yield strength. After the flow of the
30 µm
Eroded surface
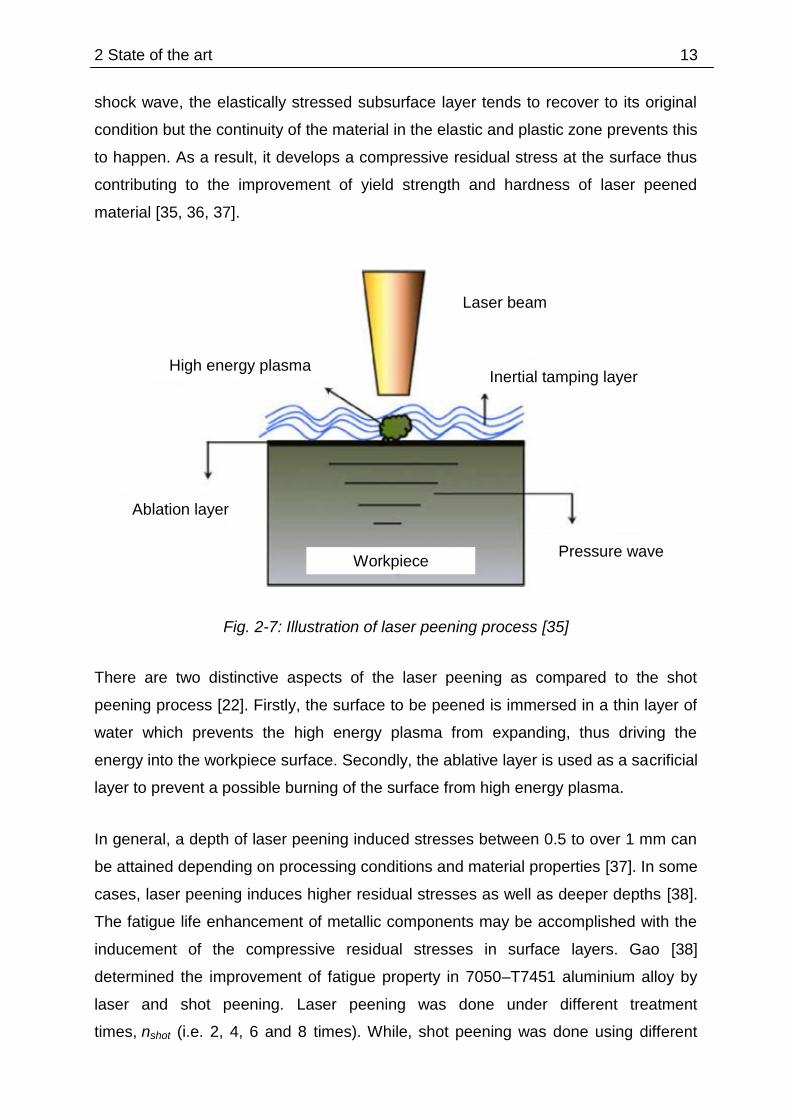
2 State of the art 13
shock wave, the elastically stressed subsurface layer tends to recover to its original
condition but the continuity of the material in the elastic and plastic zone prevents this
to happen. As a result, it develops a compressive residual stress at the surface thus
contributing to the improvement of yield strength and hardness of laser peened
material [35, 36, 37].
Fig. 2-7: Illustration of laser peening process [35]
There are two distinctive aspects of the laser peening as compared to the shot
peening process [22]. Firstly, the surface to be peened is immersed in a thin layer of
water which prevents the high energy plasma from expanding, thus driving the
energy into the workpiece surface. Secondly, the ablative layer is used as a sacrificial
layer to prevent a possible burning of the surface from high energy plasma.
In general, a depth of laser peening induced stresses between 0.5 to over 1 mm can
be attained depending on processing conditions and material properties [37]. In some
cases, laser peening induces higher residual stresses as well as deeper depths [38].
The fatigue life enhancement of metallic components may be accomplished with the
inducement of the compressive residual stresses in surface layers. Gao [38]
determined the improvement of fatigue property in 7050–T7451 aluminium alloy by
laser and shot peening. Laser peening was done under different treatment
times, nshot (i.e. 2, 4, 6 and 8 times). While, shot peening was done using different
Inertial tamping layer
Pressure wave
Laser beam
High energy plasma
Ablation layer
Workpiece

14 2 State of the art
shots (i.e. glass beads, ceramic beads and cast steel shots). The author found that
the laser peening had produced the depth of compressive residual stress layer up to
1200 µm compared to only 250 µm for shot peening. Moreover, the fatigue strength
of the laser peened specimen was increased by 42 % with respect to the as-
machined specimen, while there was an increase of 35 % in fatigue strength for the
shot peened specimen.
Other researchers reported the effect of laser shock peening without a coat or
ablation layer in the workpiece material [39, 40]. The laser beam is directly in contact
with the workpiece surface, thus requiring the use of a smaller output power as to
avoid severe melting of the surface. Maawad et al. [39] investigated the high cycle
fatigue performance of titanium alloy after a laser shock peening process without
coating. They varied few parameters in the laser shock peening process namely the
laser pulse energy (Epulse), laser spot diameter (Dspot) and laser pulse density (Npulse).
They also compared the results with a similar material treated by a shot peening
process. The outcomes indicated that the laser shock peening process without
coating produced a better performance of high cycle fatigue than the conventional
shot peening process due to a larger amount of compressive residual stress and a
deeper strengthening layer. However, the laser shock peening process without
coating produced a higher surface roughness caused by easily induced surface
vaporization and later on re-solidification of the molten droplets. Furthermore,
Sathyajith [40] reported the effect of laser peening without coating on aluminium alloy
6061-T6. Their results show that the laser peening without coating had significantly
improved the surface compressive stress and hardness with a little increase in
surface roughness.
Lim et al. [41] investigated the enhancement of abrasion and corrosion resistance of
duplex stainless steel using a pulsed Nd:YAG laser in the laser shock peening
process. They treated the surface at a condition which may result in the maximum
increase of surface hardness because a higher abrasion resistance may be achieved
for metals with a higher surface hardness. They found that the compressive residual
stress at the laser peened sample was enhanced by about three times from that of
unpeened material with the depth profile extended up to about 0.8 mm. They also
found that at the optimal process parameters, wear volume and corrosion rate of
duplex stainless steel were reduced by 39% and 74.2%, respectively which a lower

2 State of the art 15
density and size of corrosion pits were produced on wear track as a result of laser
shock peening.
Peyre et al. [42] compared the performance of laser and shot peening in surface
modifications of 316L stainless steel. In the laser peening process, the laser
intensities (Ilaser) as well as number of laser impacts (nimpact) were varied accordingly.
The results show that the work hardening levels consistently increase with higher
laser intensities and number of laser impacts. Furthermore, the microstructures of
laser peened specimens show a lot of deformation twins and persistent slip bands
especially for specimens treated with higher laser intensities and numbers of impacts
as shown in Fig. 2-8. They also found that the laser peening treatment generated
lower residual stresses and work hardening levels than shot peening treatment
possibly due to the nature of laser peening process which involves no contact.
Fig. 2-8: Microstructures of laser peened surfaces show a) deformation twins and slip bands (one activated system) at 4 GWcm-2 laser intensity and 3 number of laser impacts, b) a presence of three deformation systems in the same grain at 8 GWcm-2 laser intensity and 6 number of laser impacts [42]
2.1.3 Liquid peening process
In the liquid peening process, high impacts of water droplets are used to impinge a
metal surface thus causing local plastic deformation. Mostly water is used but some
researchers performed experiments with oil. Others used a water-oil emulsion. A
Slip bands
10 µm b)
Slip bands
Twins
20 µm a)

16 2 State of the art
basic principle of water jet peening is shown schematically in Fig. 2-9. The nozzle is
moved at a desired feedrate (traverse speed), vn, in the linear direction across the
surface to be peened. The process parameters that may influence the residual stress
formation and coverage area are the traverse speed of the nozzle, vn, the water
pressure p0, at the nozzle entrance, the nozzle to specimen's surface distance (i.e.,
standoff distance, h), the nozzle diameter, Dn and the inclination angle of attack, θ. pi
is the impact pressure that strikes the metal surfaces. Water pressure (or jet flow
rate) at the nozzle entrance, nozzle geometry (e.g. nozzle diameter), inclination angle
of attack and pitch are the main parameters influencing the jet coherence as well as
the peening power. Whereas, standoff distance and traverse speed of the nozzle are
the main parameters affecting the interaction between the jet and the workpiece
surfaces [8].
Fig. 2-9: Basic principle of water jet peening
Quite a number of research in WJP process has been conducted to study its
potential applications and associated sciences. Chillman et al. [43] explored the
effects of high pressure WJP at 600 MPa on the surface finish and integrity of the
titanium alloy (Ti–6Al–4V). They varied the traverse rates (vn) and the standoff
distance (h). They found that WJP at 600 MPa induces a plastic deformation to
higher depths in the subsurface layer and also a higher degree of plastic
Pressurized water
po
Coverage diameter, Dc
Waterjet
Nozzle diameter, Dn
Nozzle feedrate, vn
Nozzle
Inclination angle, θ
pi
Standoff distance, h
Workpiece
2 State of the art 17
deformation. Grinspan and Gnanamoorthy [44] substituted water with oil in a peening
process (OJP) of aluminium alloy where the depth of residual stress was noticed to
be more than 250 μm below the surface.
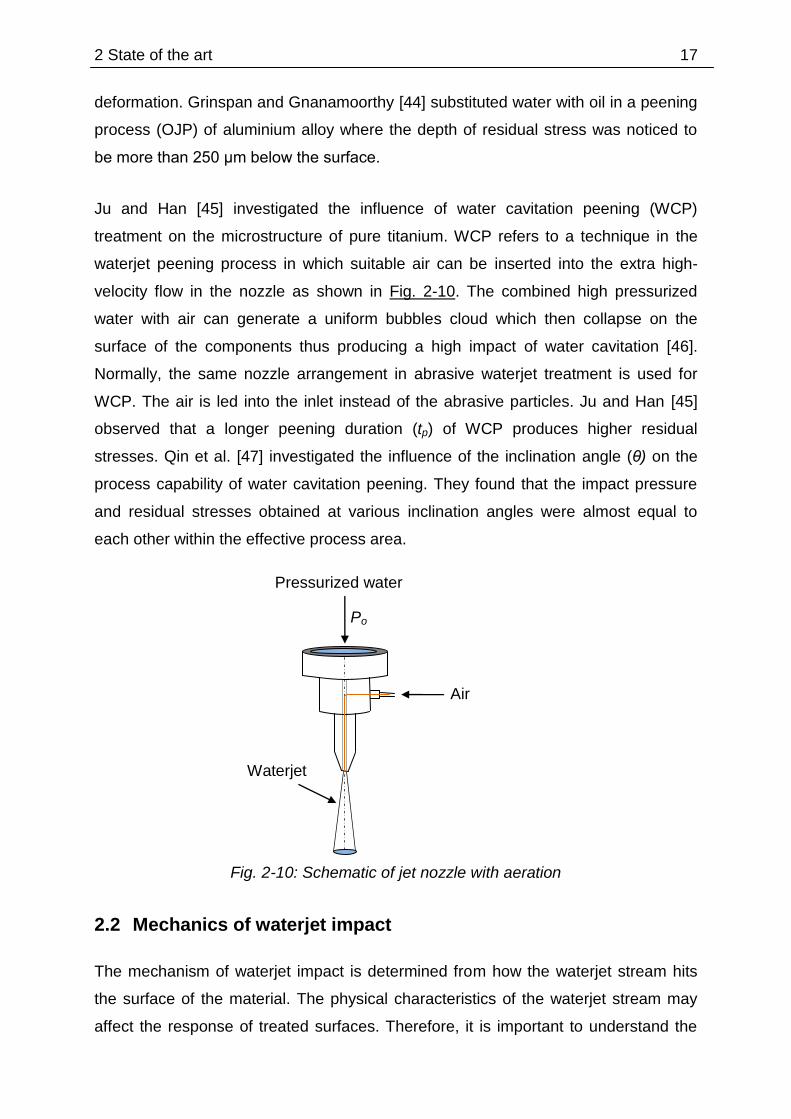
Ju and Han [45] investigated the influence of water cavitation peening (WCP)
treatment on the microstructure of pure titanium. WCP refers to a technique in the
waterjet peening process in which suitable air can be inserted into the extra high-
velocity flow in the nozzle as shown in Fig. 2-10. The combined high pressurized
water with air can generate a uniform bubbles cloud which then collapse on the
surface of the components thus producing a high impact of water cavitation [46].
Normally, the same nozzle arrangement in abrasive waterjet treatment is used for
WCP. The air is led into the inlet instead of the abrasive particles. Ju and Han [45]
observed that a longer peening duration (tp) of WCP produces higher residual
stresses. Qin et al. [47] investigated the influence of the inclination angle (θ) on the
process capability of water cavitation peening. They found that the impact pressure
and residual stresses obtained at various inclination angles were almost equal to
each other within the effective process area.
Fig. 2-10: Schematic of jet nozzle with aeration
2.2 Mechanics of waterjet impact
The mechanism of waterjet impact is determined from how the waterjet stream hits
the surface of the material. The physical characteristics of the waterjet stream may
affect the response of treated surfaces. Therefore, it is important to understand the
Pressurized water
Po
Waterjet
Air
18 2 State of the art
physical representation of the waterjet stream as it exits from the nozzle until it hits
the workpiece.
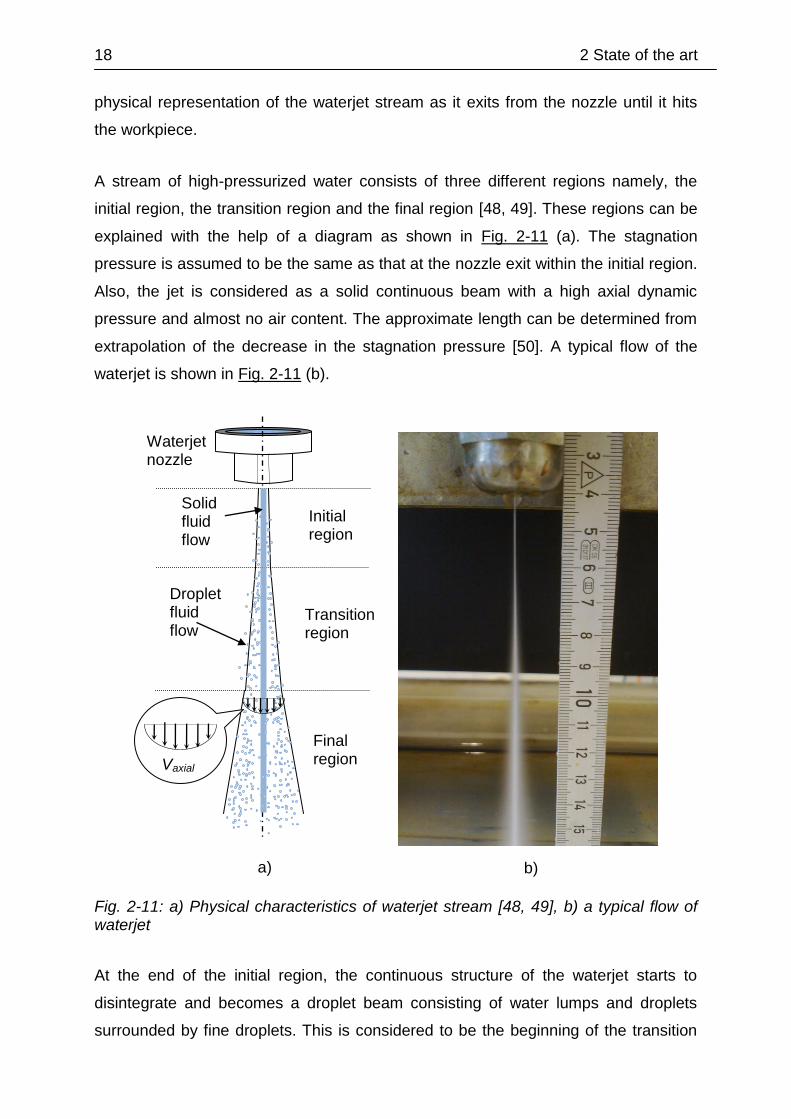
A stream of high-pressurized water consists of three different regions namely, the
initial region, the transition region and the final region [48, 49]. These regions can be
explained with the help of a diagram as shown in Fig. 2-11 (a). The stagnation
pressure is assumed to be the same as that at the nozzle exit within the initial region.
Also, the jet is considered as a solid continuous beam with a high axial dynamic
pressure and almost no air content. The approximate length can be determined from
extrapolation of the decrease in the stagnation pressure [50]. A typical flow of the
waterjet is shown in Fig. 2-11 (b).
Fig. 2-11: a) Physical characteristics of waterjet stream [48, 49], b) a typical flow of waterjet
At the end of the initial region, the continuous structure of the waterjet starts to
disintegrate and becomes a droplet beam consisting of water lumps and droplets
surrounded by fine droplets. This is considered to be the beginning of the transition
a)
Waterjet nozzle
Initial region
Transition region
Final region
Solid fluid flow
Droplet fluid flow
b)
Vaxial
2 State of the art 19
region. The breakup of the waterjet stream into droplets is mainly due to the
interaction of the waterjet with the surrounding air. The velocities of the water lumps
and droplets remain largely unchanged within this region. However, continuous
interactions between the waterjet and surrounding air result in more disintegration of
the droplets as the jet travels further in the transition region. This will lead to a
reduction in droplets velocities and also a widening of the effective flow field i.e. a
diverging of water stream. It is also believed that the size of droplets becomes
smaller as it is closer to the outer boundary between the jet and the ambient air. This
is due to the fact that the outer boundary contains a higher concentration of air and
the jet is in constant friction with it. As a result, the axial velocity of the jet reduces as
it moves away from the centre of the nozzle to the extent it exhibits almost zero
velocity as shown in Fig. 2-11 (a). In other words, within this region there exists a
mist zone where the droplets show a zero velocity [51]. Finally, the waterjet enters
the final region where there is a noticeable decrease in the droplets velocities as the
droplets break up into finer droplets. Within this region, the jet has dissipated most of
the energy to effectively modify the features of material surfaces.
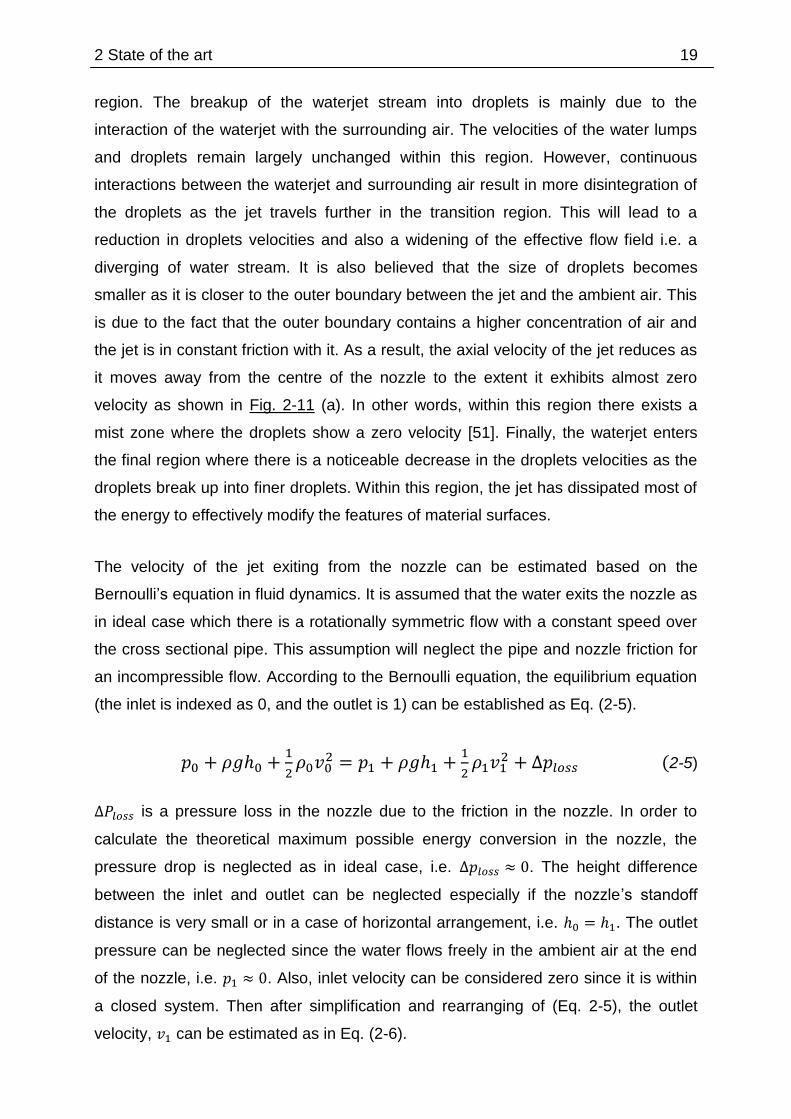
The velocity of the jet exiting from the nozzle can be estimated based on the
Bernoulli’s equation in fluid dynamics. It is assumed that the water exits the nozzle as
in ideal case which there is a rotationally symmetric flow with a constant speed over
the cross sectional pipe. This assumption will neglect the pipe and nozzle friction for
an incompressible flow. According to the Bernoulli equation, the equilibrium equation
(the inlet is indexed as 0, and the outlet is 1) can be established as Eq. (2-5).
(2-5)
is a pressure loss in the nozzle due to the friction in the nozzle. In order to
calculate the theoretical maximum possible energy conversion in the nozzle, the
pressure drop is neglected as in ideal case, i.e. . The height difference
between the inlet and outlet can be neglected especially if the nozzle’s standoff
distance is very small or in a case of horizontal arrangement, i.e. . The outlet
pressure can be neglected since the water flows freely in the ambient air at the end
of the nozzle, i.e. . Also, inlet velocity can be considered zero since it is within
a closed system. Then after simplification and rearranging of (Eq. 2-5), the outlet
velocity, can be estimated as in Eq. (2-6).
20 2 State of the art
√
(2-6)
This is the theoretical maximum possible velocity. In actual case due to the friction,
the rate may be somehow lower. In this case due to the very low pressure at the
outlet, the water can be assumed to be incompressible. The velocity, , can be
considered as the water impact velocity, , when it hits the material surface [52, 53].
However, the fluid flow associated with high-speed impinging droplets is rather
complicated and still not fully understood [54].
2.2.1 Liquid erosion mechanisms
It is known that highly pressurized water is able to cause severe damage to the
surface of target materials by means of erosion. This is caused by the collision of a
high-velocity liquid mass with a solid target that generates short high-pressure
transients. An extensive review on the liquid impact was summarized by Field [55]
from his own works and that of other researchers [52, 56, 57, 58, 59, 60]. The impact
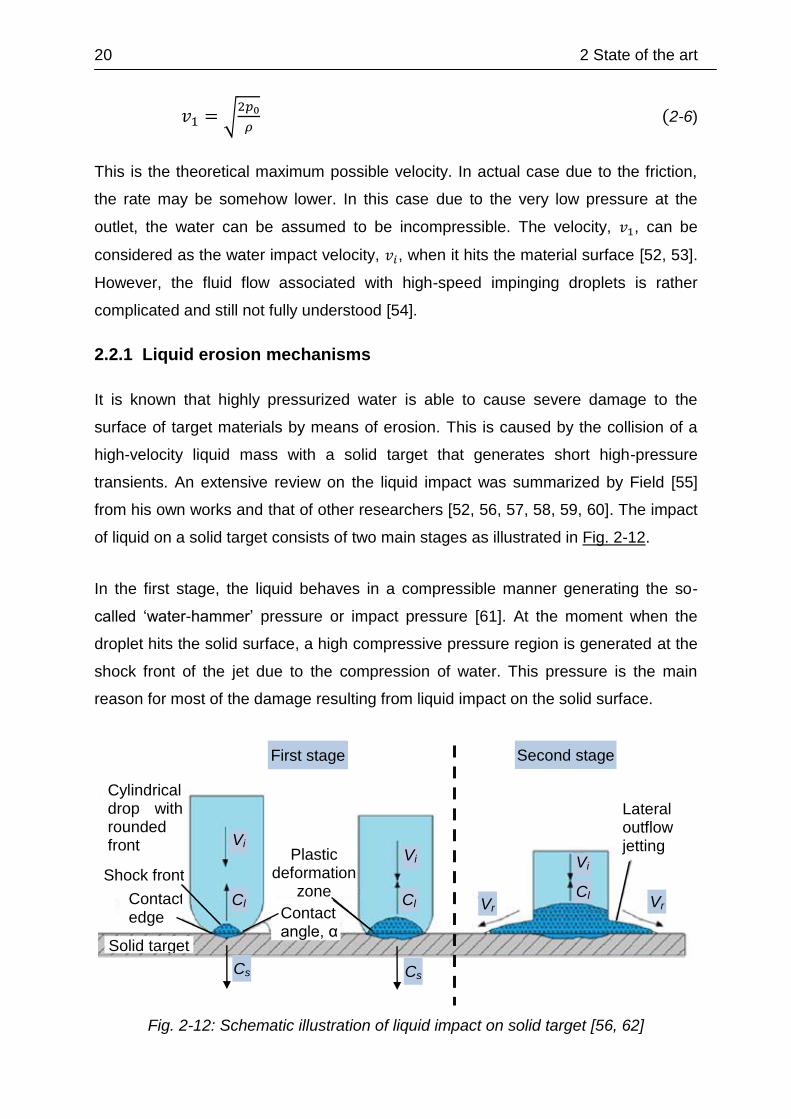
of liquid on a solid target consists of two main stages as illustrated in Fig. 2-12.
In the first stage, the liquid behaves in a compressible manner generating the so-
called ‘water-hammer’ pressure or impact pressure [61]. At the moment when the
droplet hits the solid surface, a high compressive pressure region is generated at the
shock front of the jet due to the compression of water. This pressure is the main
reason for most of the damage resulting from liquid impact on the solid surface.
Fig. 2-12: Schematic illustration of liquid impact on solid target [56, 62]
Lateral outflow jetting
Plastic deformation
zone Shock front
Contact edge Contact
angle, α
Vi
Cl Cl
Vi
Cl
Vi
Vr Vr
Second stage First stage
Cs Cs
Cylindrical drop with rounded front
Solid target
2 State of the art 21
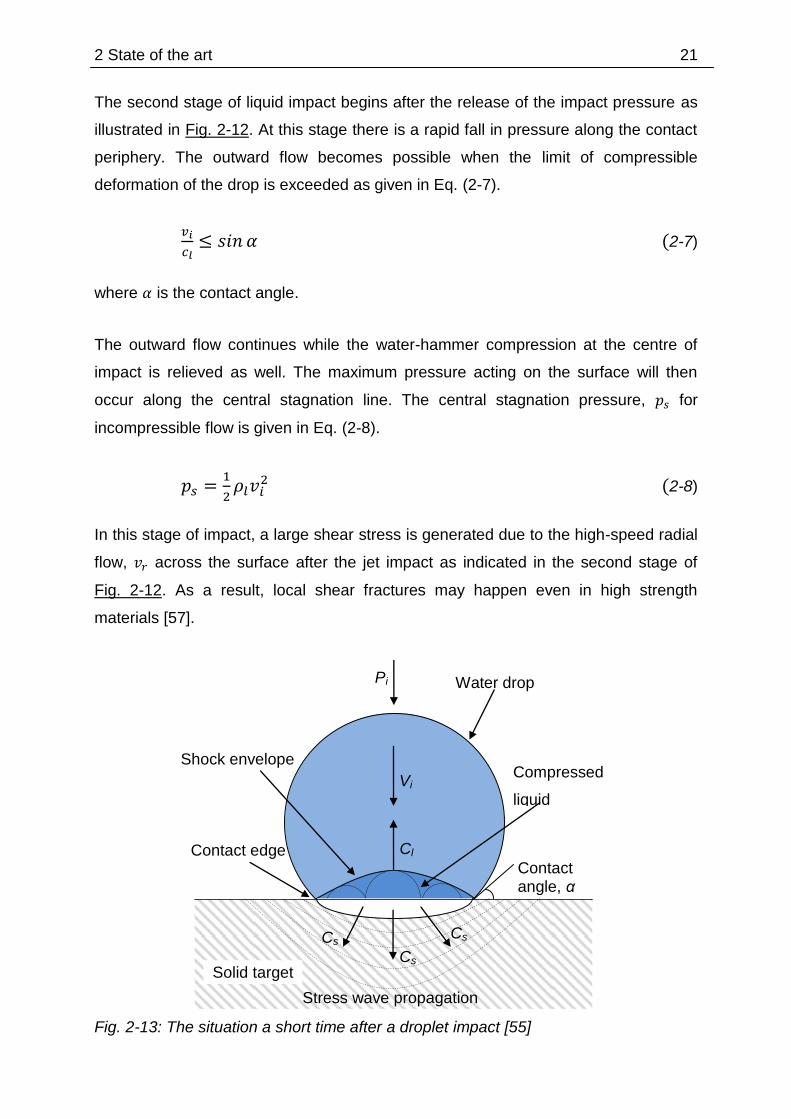
The second stage of liquid impact begins after the release of the impact pressure as
illustrated in Fig. 2-12. At this stage there is a rapid fall in pressure along the contact
periphery. The outward flow becomes possible when the limit of compressible
deformation of the drop is exceeded as given in Eq. (2-7).
(2-7)
where is the contact angle.
The outward flow continues while the water-hammer compression at the centre of
impact is relieved as well. The maximum pressure acting on the surface will then
occur along the central stagnation line. The central stagnation pressure, for
incompressible flow is given in Eq. (2-8).
(2-8)
In this stage of impact, a large shear stress is generated due to the high-speed radial
flow, across the surface after the jet impact as indicated in the second stage of
Fig. 2-12. As a result, local shear fractures may happen even in high strength
materials [57].
Fig. 2-13: The situation a short time after a droplet impact [55]
Water drop
Contact edge Contact angle, α
Shock envelope Compressed
liquid
Cl
Vi
Pi
Solid target
Stress wave propagation
Cs Cs
Cs
22 2 State of the art
The situation a short time just after the impact is illustrated in Fig. 2-13.The shock
envelope is made up of many wavelets. The liquid behind the envelope is
compressed and the solid target beneath this area is subjected to a high pressure.
This high pressure impact is maintained while the shock wave moves supersonically
from the edge of the contact area between the impacting droplet and the solid target
into the material with respect to the shock speed [55, 56, 57, 60].
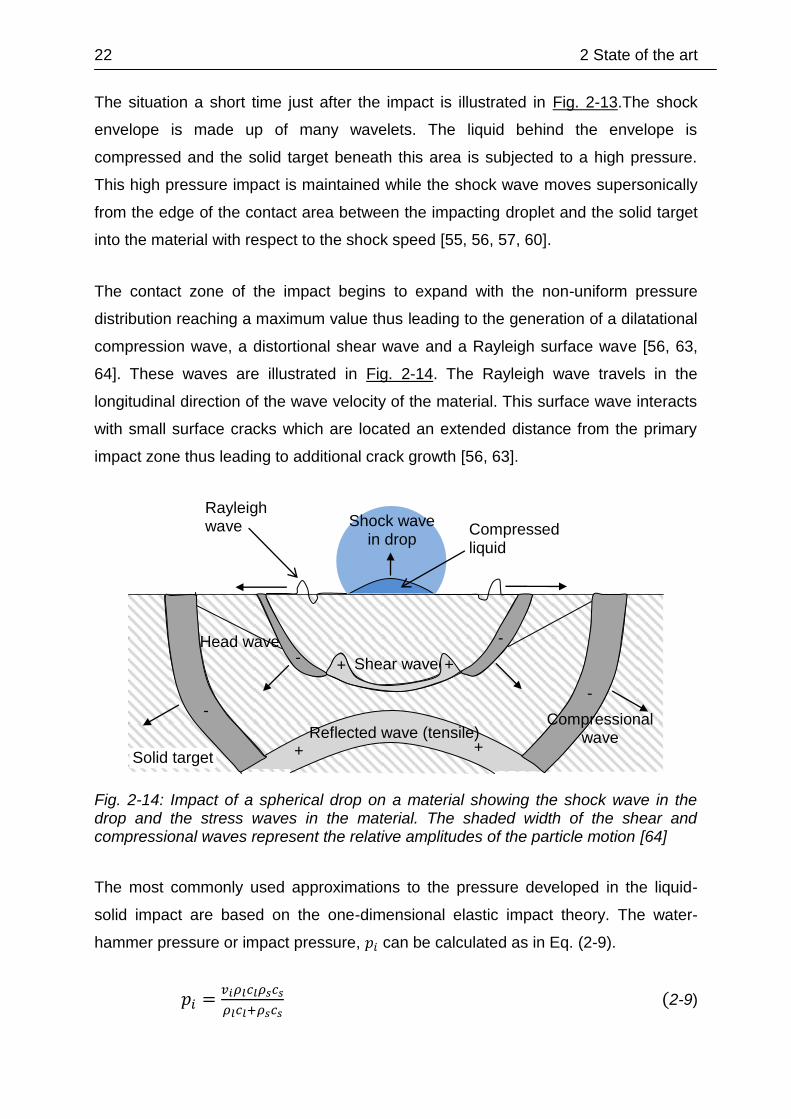
The contact zone of the impact begins to expand with the non-uniform pressure
distribution reaching a maximum value thus leading to the generation of a dilatational
compression wave, a distortional shear wave and a Rayleigh surface wave [56, 63,
64]. These waves are illustrated in Fig. 2-14. The Rayleigh wave travels in the
longitudinal direction of the wave velocity of the material. This surface wave interacts
with small surface cracks which are located an extended distance from the primary
impact zone thus leading to additional crack growth [56, 63].
Fig. 2-14: Impact of a spherical drop on a material showing the shock wave in the drop and the stress waves in the material. The shaded width of the shear and compressional waves represent the relative amplitudes of the particle motion [64]
The most commonly used approximations to the pressure developed in the liquid-
solid impact are based on the one-dimensional elastic impact theory. The water-
hammer pressure or impact pressure, can be calculated as in Eq. (2-9).
(2-9)
Rayleigh wave Compressed
liquid
Solid target
-
+ +
-
- + +
-
Reflected wave (tensile) Compressional
wave
Shear wave
Shock wave in drop
Head wave

2 State of the art 23
where is the impact velocity of the liquid. and are the densities and the
shock velocities of the liquid and the solid, respectively. For an impact on a rigid
target which is true for most metals, the values of is an order of magnitude larger
than for water. Therefore, the impact pressure can be sufficiently approximated
as in Eq. (2-10).
(2-10)
In case of a high velocity liquid impact, an appropriate shock velocity can be used to
calculate the impact pressure. This can be expressed with the term of the acoustic
velocity, as shown in Eq. (2-11).
(2-11)
where the acoustic velocity, for water is about 1500 ms-1. While, is a constant
which has a value close to 2 for water in the high impact velocity range ( up to 1000
ms-1).
The duration of its impact depends on the time taken by the released waves to pass
through the compressed liquid. The very short duration of the water-hammer
pressure pulse, can be calculated as in Eq. (2-12).
(2-12)
where is the radius of curvature of the drop (liquid mass) in the region of contact.
Therefore, it can be summarized that the erosion of material surface results from
both stages of liquid impact. During the initial stage, the maximum compressive
stress acts along the central line of impact thus producing a central depression crater
as well as various cracks. Later, the compressive stress diminishes and the outward
flow begins to exert a tensile stress at some critical value of the liquid/solid contact
angle. The erosion of the material surface by an impacting liquid may result from the
impact pressure, or from the shearing effects of high-velocity outward flow, or from
the both [52, 56, 57, 58, 59, 60, 61].

24 2 State of the art
2.2.2 Strengthening mechanisms
The properties of metal are directly related to its dislocation motions. The
strengthening mechanism of metal depends on this relationship. Dislocations are
defects in the orderly arrangement within an atomic structure of a metal. The plastic
deformation of a metal corresponds to the motion of dislocations. In other words, a
metal is able to plastically deform if the dislocations inside it are able to move.
Therefore, the mechanical strength may be improved by reducing the ability of
dislocations to move. It is because hardness and strength are related to the ease
with which plastic deformation can be made to occur. That is to say that a larger
mechanical force will be required to initiate plastic deformation. On the contrary, a
higher ability of dislocation to move results in a larger tendency of a metal to deform,
as a result it becomes softer and weaker. In general, it can be said that all
strengthening techniques rely on this simple principle which is to restrict the
dislocation motion thus producing a harder and stronger material [17, 65, 66].
The strengthening of metals can be achieved through a few mechanisms for example
by grain size reduction, solid-solution alloying and strain hardening [17, 65, 66].
However, these are the strengthening mechanisms for single phase metals and may
require some increase in temperature. The strengthening of multiphase alloys is
more complex wherein the mechanical properties are dependent on the
characteristics of the microstructure. The development of a microstructure generally
involves some type of phase transformation which is a change in the number and/or
character of the metallic phases [17]. Since the materials used in the present study
are both ferrous alloys (i.e. austenitic stainless steel 304 and ferritic carbon steel
1045), therefore the discussion is limited to the strengthening mechanism based on
phase transformations particularly martensitic transformation as it happens principally
in Fe-C alloys systems. However, the strain hardening mechanism is also discussed
here since it happens in the peening processes. Of course, in the real sense the
alloys are deformed and strengthened in conjunction with one another, for example,
an alloy may be collectively strengthened based on strain hardening and phase
transformation [17].
The strain hardening is sometimes called work hardening or cold working because
the temperature during the deformation process occurs at a much lower temperature

2 State of the art 25
relatively to the melting temperature of the metal and in most cases at room
temperature [17]. It is the strengthening process of a metal by plastic deformation.
When a material is permanently deformed, the dislocation motion moves until it is
stopped by something else in the crystalline lattice. The dislocation motion can be
effectively restricted by another dislocation since they cannot pass through each
other [65]. As a result, the dislocations will be mounted up against each other and
became interlocked. This may prevent any further permanent deformation without the
use of significantly higher energy thus considerably enhancing the strength of the
material under subsequent loading.
Fig. 2-15: The typical stress-strain diagram of a metal [17, 65]
Theoretically, strain hardening can be explained based on a typical stress-strain
diagram of a metal as shown in Fig. 2-15. The original stress-strain behaviour is
shown as a blue line. Its original yield strength is indicated as σYS. Initially, a certain
amount of stress is applied beyond its original yield strength to point A. When the
stress is released, the material returns to a state of zero stress along a path parallel
to the elastic loading line (green line) due to elastic strain recovery. Upon reloading,
the material follows the same path up to the original stress-strain curve (red dotted
line). However, the material’s elastic limit has been increased to σYS’. Therefore, the
material becomes stronger during the process since its new yield strength, σYS’ is
now substantially higher than the original yield strength, σYS. However, the total
elongation available has now diminished thus decreasing its ductility and formability.
Str
ess,
σ
Strain, ε
σYS
σUTS σYS‘
Original stress-strain curve
Unloading
Reloading
A
26 2 State of the art
Martensitic transformation involves a change in the crystal structure by shear
movements of atoms [67]. This reaction is found in many alloy systems, but the
principal and most important system is the Fe-C alloy. Martensite is a metastable
phase which has the same composition as the austenite from which it forms [17].
Martensite forms without a change in composition, therefore diffusion is not required
for the transformation to occur. It is for this reason that martensite can form at such a
low temperature by adequate loadings. The most important characteristic of
martensite is its potential of very high hardness. In some way, this hardness is
directly related to the fundamental characteristic of martensite, but somehow it is
caused by the severe distortions that accompany the formation of the martensite.
2.3 Effect of waterjet impact on surface
2.3.1 Roughness
It is widely known that the surface roughness plays a critical role in determining the
fatigue life of engineering components. Thus, a lot of studies have been conducted to
investigate the effect of waterjet impact on material surfaces. Arola et al. [68] studied
the effect of waterjet peening (WJP) and abrasive waterjet peening (AWJP) on the
surface topographies of commercially pure titanium and a titanium alloy (Ti6Al4V).
Based on a comparison of the standard roughness parameters for each material,
they found that the surface texture resulting from AWJP was primarily dependent on
the treatment conditions, not the material. However, a minimal increase in roughness
occurred in the treatment of the pure titanium as expected from its comparatively
lower yield strength than the titanium alloy. There were also changes of roughness
through WJP of both materials, however the changes were far less significant than
those resulting from AWJP. This is to be expected as AWJP invokes a combination
of erosion and localized plastic deformation as a result of abrasive particle impact
thus increasing the surface roughness. On the effect of peening parameters, they
found that the increase in kinetic energy achieved with the use of large abrasives and
high jet pressures resulted in more substantial erosion of the surface.
Arola and Hall [69] further investigated the effect of parameters on particle deposition
in abrasive waterjet surface treatment of commercially pure titanium. Based on the
results, they found that the surface texture was mostly influenced by the level of the
2 State of the art 27
jet pressure and the abrasive particle size. As expected, the surface roughness
increased linearly with the jet pressure and the abrasive particle size. They explained
that an increase in kinetic energy of the jet resulting from the mass and/or velocity of
the abrasives increased the potential for material removal. Furthermore, some of the
abrasive particles remain embedded in the surface upon jet impact which may cause
a change in surface roughness. Arola and McCain [70] explored the feasibility of
using AWJP as a new method of surface preparation for metal orthopaedic implants.
The surface roughness resulting from AWJP of the titanium alloy (Ti6Al4V) was
significantly lower than the surface of titanium with plasma spray coating used for
cementless fixation in metal orthopaedic implants.
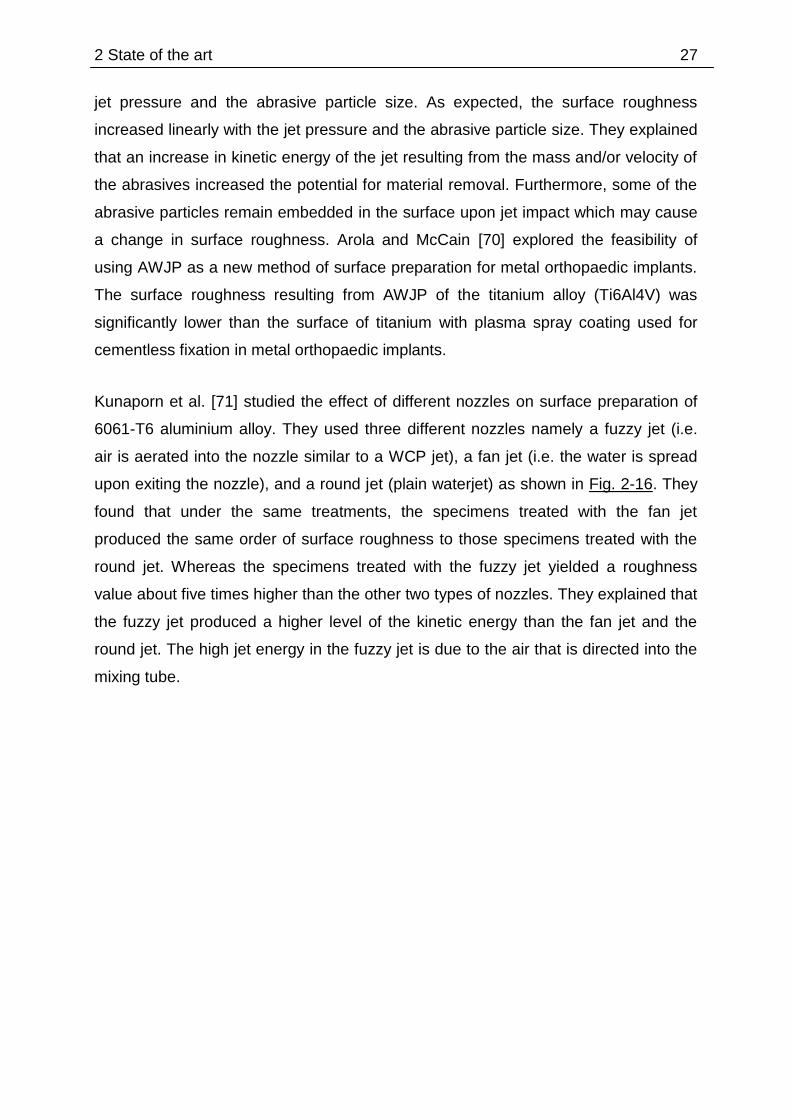
Kunaporn et al. [71] studied the effect of different nozzles on surface preparation of
6061-T6 aluminium alloy. They used three different nozzles namely a fuzzy jet (i.e.
air is aerated into the nozzle similar to a WCP jet), a fan jet (i.e. the water is spread
upon exiting the nozzle), and a round jet (plain waterjet) as shown in Fig. 2-16. They
found that under the same treatments, the specimens treated with the fan jet
produced the same order of surface roughness to those specimens treated with the
round jet. Whereas the specimens treated with the fuzzy jet yielded a roughness
value about five times higher than the other two types of nozzles. They explained that
the fuzzy jet produced a higher level of the kinetic energy than the fan jet and the
round jet. The high jet energy in the fuzzy jet is due to the air that is directed into the
mixing tube.
28 2 State of the art
Fig. 2-16: The stream of waterjet exiting the, a) fuzzy jet, b) fan jet, and c) round jet nozzles [71]
Kunaporn et al. [72] also investigated the effect of peening parameters on the surface
texture using only a fan jet and round jet nozzles. However, a different aluminium
alloy was used (7075-T6). Generally, the removal characteristics within the impact
zone are found to predominantly dependent on the standoff distance [73]. The water
peening using the round jet nozzle caused a rougher surface than those using the
fan jet nozzle for standoff distance higher than 36 mm. However, the fan jet nozzle
had a significant effect on the surface roughness at a standoff distance less than
30 mm. Little changes of surface finish were noticed in the specimens waterpeened
at the standoff distance higher than 44 mm using both nozzles. While, increasing the
peening duration by lowering the nozzle traverse rate yielded an increase in surface
roughness [74]. Furthermore, the waterjet treatment under the same peening
duration yielded a similar surface roughness although the nozzle traverse rate was
different [72]. Possibly, under the same peening duration, the resulting kinetic energy
of the jet on those specimen surfaces is equal. The surface roughness may also not
change if the materials are under an elastic pre-stress condition during an abrasive
waterjet peening process [75].
a) b) c)
2 State of the art 29
2.3.2 Erosion
It is understood that the surface erosion is directly related to the surface roughness.
High erosion of the surface tends to produce a high roughness as well since more
material has been removed. Therefore, it is not surprising to see surfaces subjected
to waterjet treatment producing high roughness values while generating more erosion
of the surface.
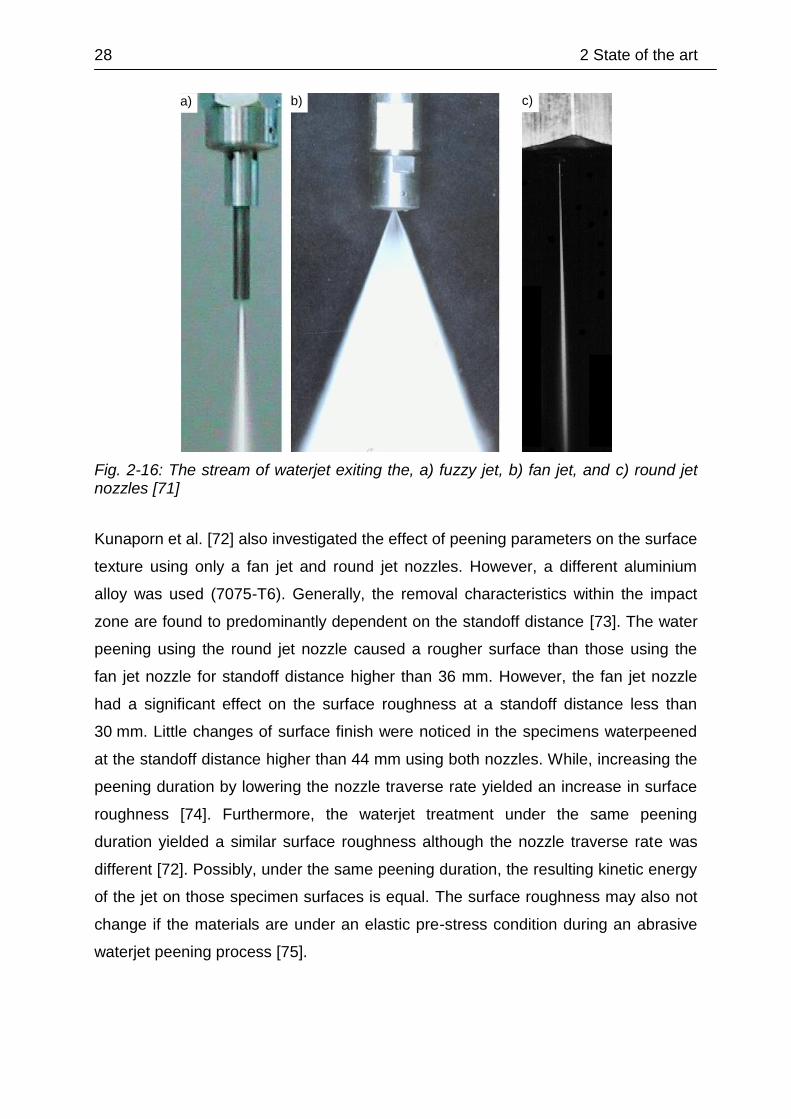
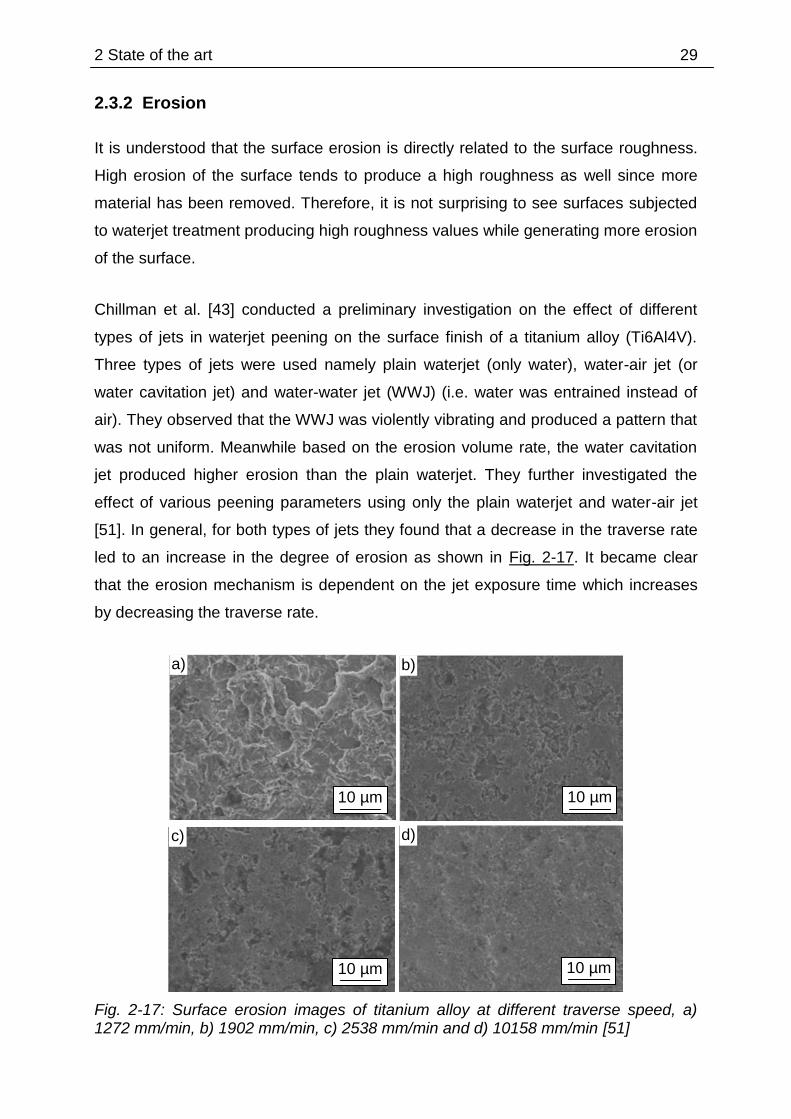
Chillman et al. [43] conducted a preliminary investigation on the effect of different
types of jets in waterjet peening on the surface finish of a titanium alloy (Ti6Al4V).
Three types of jets were used namely plain waterjet (only water), water-air jet (or
water cavitation jet) and water-water jet (WWJ) (i.e. water was entrained instead of
air). They observed that the WWJ was violently vibrating and produced a pattern that
was not uniform. Meanwhile based on the erosion volume rate, the water cavitation
jet produced higher erosion than the plain waterjet. They further investigated the
effect of various peening parameters using only the plain waterjet and water-air jet
[51]. In general, for both types of jets they found that a decrease in the traverse rate
led to an increase in the degree of erosion as shown in Fig. 2-17. It became clear
that the erosion mechanism is dependent on the jet exposure time which increases
by decreasing the traverse rate.
Fig. 2-17: Surface erosion images of titanium alloy at different traverse speed, a) 1272 mm/min, b) 1902 mm/min, c) 2538 mm/min and d) 10158 mm/min [51]
10 µm
a)
10 µm
c)
10 µm
d)
10 µm
b)
30 2 State of the art
With respect to the standoff distance, the two types of jets gave a different effect on
the erosion. For the case of plain waterjet, no erosion was evident at small standoff
distances (< 38 mm). However, the erosion rate continued to increase up to a
distance of 100 mm and continued to decrease beyond that. For the case of water-air
jet with a low air flow rate, the erosion became much more uniform regardless of
standoff distances [51]. While, a high air flow rate led to a decrease in the erosion for
standoff distances higher than 38 mm. They explained the relationship between the
standoff distance and the erosion from the jet structure point of views. The amount of
air flow rate aerated into the jet flow had a direct impact on the ability of the jet to
remove material. The injection of a low air flow rate produced an increase in erosion
rate (about 2 - 4 times) compared with the plain waterjet. It is due to an increase in
the erosive nature of the jet by accelerating the breakdown of water into droplets.
However, too much air may saturate the jet thus leading to a loss of velocity droplet
particularly at increased standoff distance.
In contrast, Oka et al. [76] found that the maximum damage rates were commonly
observed for standoff distances from 120 to 200 mm in waterjet peening of aluminium
alloy 5083 regardless of pressures. Again, they pointed to the nature of the jet
structure. A very short standoff distance causes a low material removal possibly
because of a formation of water column instead of water droplets. The water column
only presses the specimen without imposing cyclic stresses onto it. Therefore, its
impact frequency is too low to cause large erosion at the very short standoff distance.
The impact frequency increases as the standoff distance increases thus inducing a
proportional increase in the damage rate. However, the standoff distance at the
maximum damage rate did not coincide with the maximum impact frequency. They
speculated that the droplet velocity might as well influence the damage rate of a
material under waterjet impingement. The calculated droplet velocity was constant at
the maximum value up to a standoff distance of 200 mm and it gradually decreased
beyond that. Therefore, a combination of maximum droplet velocity and medium
impact frequency produces the highest damage rate. Although, the maximum impact
frequency was found at a standoff distance more than 200 mm, but the droplet
velocity was reduced thus decreasing the damage rate.
The effect of a pulsating waterjet impact on aluminium surface using a fan jet nozzle
has been investigated by Foldyna et al. [77]. An acoustic generator of pressure
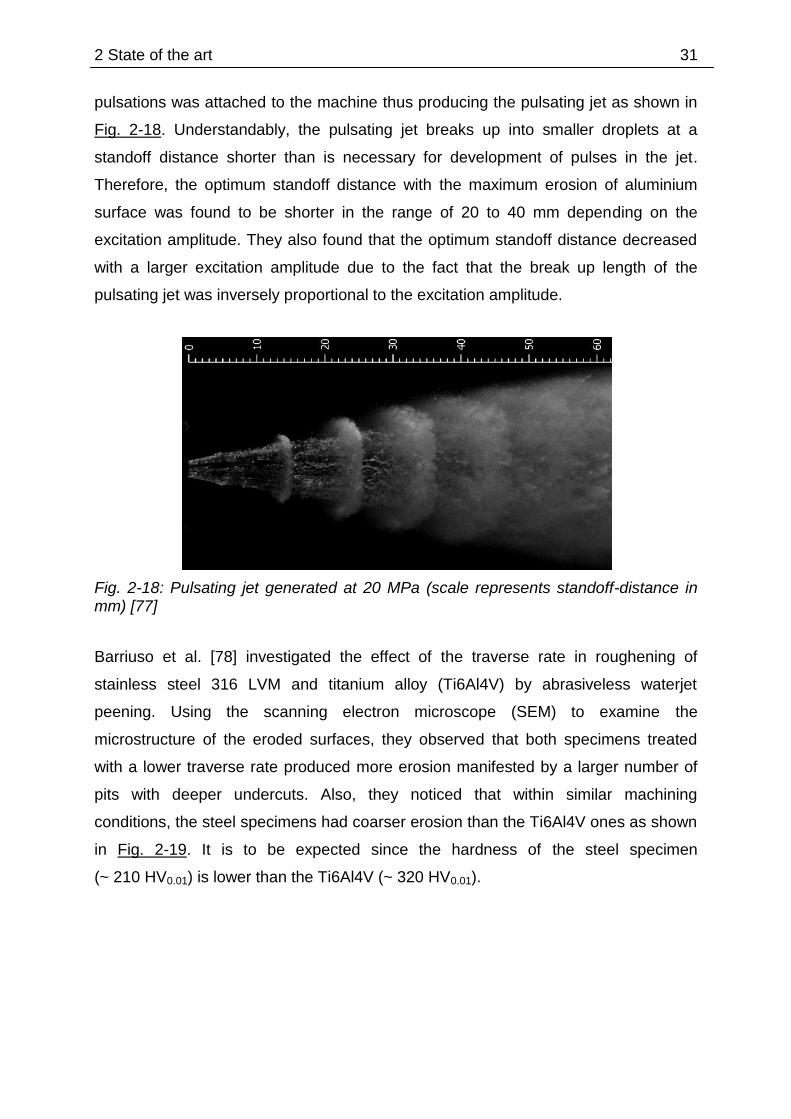
2 State of the art 31
pulsations was attached to the machine thus producing the pulsating jet as shown in
Fig. 2-18. Understandably, the pulsating jet breaks up into smaller droplets at a
standoff distance shorter than is necessary for development of pulses in the jet.
Therefore, the optimum standoff distance with the maximum erosion of aluminium
surface was found to be shorter in the range of 20 to 40 mm depending on the
excitation amplitude. They also found that the optimum standoff distance decreased
with a larger excitation amplitude due to the fact that the break up length of the
pulsating jet was inversely proportional to the excitation amplitude.
Fig. 2-18: Pulsating jet generated at 20 MPa (scale represents standoff-distance in mm) [77]
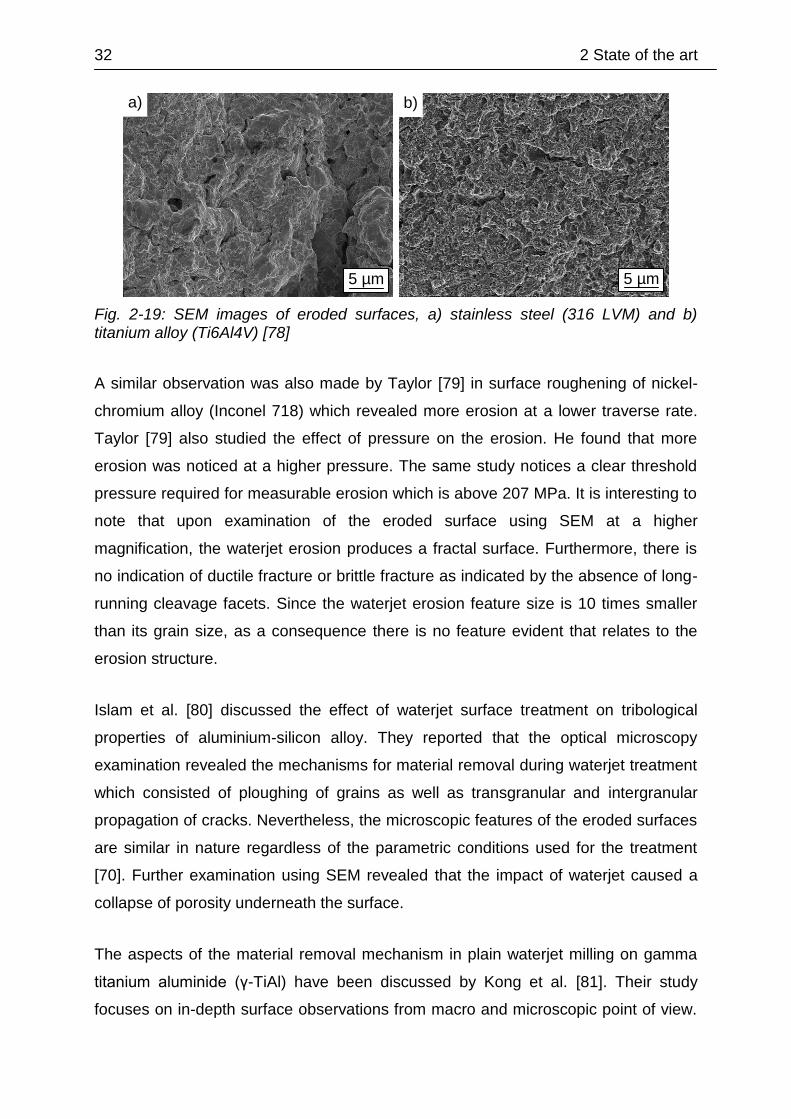
Barriuso et al. [78] investigated the effect of the traverse rate in roughening of
stainless steel 316 LVM and titanium alloy (Ti6Al4V) by abrasiveless waterjet
peening. Using the scanning electron microscope (SEM) to examine the
microstructure of the eroded surfaces, they observed that both specimens treated
with a lower traverse rate produced more erosion manifested by a larger number of
pits with deeper undercuts. Also, they noticed that within similar machining
conditions, the steel specimens had coarser erosion than the Ti6Al4V ones as shown
in Fig. 2-19. It is to be expected since the hardness of the steel specimen
(~ 210 HV0.01) is lower than the Ti6Al4V (~ 320 HV0.01).
32 2 State of the art
Fig. 2-19: SEM images of eroded surfaces, a) stainless steel (316 LVM) and b) titanium alloy (Ti6Al4V) [78]
A similar observation was also made by Taylor [79] in surface roughening of nickel-
chromium alloy (Inconel 718) which revealed more erosion at a lower traverse rate.
Taylor [79] also studied the effect of pressure on the erosion. He found that more
erosion was noticed at a higher pressure. The same study notices a clear threshold
pressure required for measurable erosion which is above 207 MPa. It is interesting to
note that upon examination of the eroded surface using SEM at a higher
magnification, the waterjet erosion produces a fractal surface. Furthermore, there is
no indication of ductile fracture or brittle fracture as indicated by the absence of long-
running cleavage facets. Since the waterjet erosion feature size is 10 times smaller
than its grain size, as a consequence there is no feature evident that relates to the
erosion structure.
Islam et al. [80] discussed the effect of waterjet surface treatment on tribological
properties of aluminium-silicon alloy. They reported that the optical microscopy
examination revealed the mechanisms for material removal during waterjet treatment
which consisted of ploughing of grains as well as transgranular and intergranular
propagation of cracks. Nevertheless, the microscopic features of the eroded surfaces
are similar in nature regardless of the parametric conditions used for the treatment
[70]. Further examination using SEM revealed that the impact of waterjet caused a
collapse of porosity underneath the surface.
The aspects of the material removal mechanism in plain waterjet milling on gamma
titanium aluminide (γ-TiAl) have been discussed by Kong et al. [81]. Their study
focuses on in-depth surface observations from macro and microscopic point of view.
5 µm
a) b)
5 µm
2 State of the art 33
Based on macroanalyisis of jet footprint, they found that at a low water-hammer
pressure the jet did not form continuous erosion traces onto the workpiece and thus
its erosion was inhomogeneous. Whereas, at higher water hammer pressure the
erosion became significantly continuous. At microscopic features, they observed two
different levels of material removal mechanism. Firstly, the initial damage or low level
surface damage occurred through few stages namely a plastic deformation, stress
wave propagation and generation of micropits. Secondly, the evolved damage or
subsequent combined erosion stages resulted in mainly granular cracking and
fracture as well as lamellar fracture of the material. Furthermore, Huang et al. [62]
looked at the mechanisms of damage initiation in a titanium alloy (Ti6Al4V) subjected
to water droplet impact. On the macroscopic scale of the damage, they observed
similar erosion features as explained by Kong et al. [81]. However, under microscopic
view, they found some distinct erosion features where the damage initiation was
achieved through grain tilting and preferential grain boundary damage.
2.4 Effect of waterjet impact on the sub-surface
2.4.1 Hardness
It is known that the waterjet peening process causes an increase in the strength on
the material sub-surface due to work hardening and phase transformation. The
increase in material strength can be measured through the amount of induced
residual stresses and hardness. Although, the hardness value represents only the
surface resistance of the material against plastic deformation, it is widely employed
mainly because of its simple test method. Furthermore, the value of hardness and
residual stress induced from a peening process can be correlated. Under peening
processes, the material surface shows an increase in the hardness as well as in the
compressive residual stress. Although the profile and the magnitude are not similar
between the hardness and the compressive residual stress, however the depth of the
hardening and the strengthening layers shows a little difference. [30, 39, 82]
The effect of waterjet peening conditions on the improvement of residual stress on
the surface of stainless steel 304 has been investigated by Hirano et al. [83]. Using a
surface layer removal technique, they measured the residual stresses by X-ray
diffraction from the surface to a depth of 250 µm. They found that the initial residual

34 2 State of the art
stress at the surface was tensile in nature from 60 to 100 MPa. After WJP, the
residual stresses were compressive in nature with the maximum stress at the surface
of about 500 MPa and decreased with an increase in surface depth. They also found
that the residual stress was still compressive at a depth of about 250 µm. In terms of
the influence of various WJP conditions, they found that the residual stress increased
with the peening duration. Whereas, increasing the pressure induced a higher
amount of residual stress on the material surface. While, the maximum residual
stress improvement was achieved at a standoff distance of about 30 mm.
Tönshoff et al. [5] measured the amount of induced compressive residual stresses on
case hardened steel 16MnCr5E under waterjet peening impact. With increasing
peening duration, they observed that the amount of compressive residual stress
increased up to a maximum level of about 560 MPa. However, for longer peening
durations, a distinct decrease of compressive residual stress was noticed.
Interestingly, they also observed that somehow the water pressure had no influence
on the level of the maximum compressive residual stress, but higher water pressures
shifted the maximum to shorter peening durations. The increase in surface hardness
was also related to longer peening durations [5]. In contrast, Arola et al. [68] noted
that the induced compressive residual stresses resulting from waterjet peening of
titanium alloy Ti6Al4V and pure titanium increased with the water pressure. However,
the amount of residual stresses resulting from WJP of the pure titanium was higher
than the Ti6Al4V. They explained that the lower yield strength of the pure titanium
enabled more extensive near-surface deformation and resulted in a larger
compressive residual stress.
In water cavitation peening (WCP) of steel 1045, the maximum compressive stress
induced was up to 215 MPa with a depth of strengthening layer up to 110 µm [84].
Whereas, in WCP of steel 1070, Qin et al. [47] observed an increase in compressive
stress of around 600 MPa from the original compressive stress of 350 MPa. By
varying the inclination angles of the nozzle, they however found that the induced
residual stresses were almost uniform and equibiaxial as shown in Fig. 2-20. In
contrast Daniewicz and Cummings [85] found a higher increase in compressive
residual stresses measured in parallel to the rolling direction than those measured
transversely to the rolling direction. They argued that it might be a result of
crystallographic texture influences on the measurements. They further found that a

2 State of the art 35
decrease in the magnitude of the compressive residual stress with an increase in the
water pressure which is in disagreement with the trend observed by Arola et al. [68].
This decrease in surface compressive residual stress was potentially the result of a
higher surface roughness due to an increase in the water pressure which eventually
reduces the accuracy of X-ray diffraction (XRD) residual stress measurements.
Fig. 2-20: The relationship between the inclination angle of WCP and residual stress in, a) X direction, and b) Y direction [47]
Grinspan and Gnanamoothy [82] treated aluminium alloys 6063-T6 and 6061-T4 with
oil jet peening. They found the magnitude of induced surface compressive residual
stress decreased with increasing in standoff distance in both materials possibly due
to reduction in impact pressure with increasing standoff distance. The increase of
compressive residual stress was higher in 6063-T6 than 6061-T4 due to the former
higher yield strength. The depth of induced compressive residual stress in both
samples was more than 200 µm. In case of hardness, they found that the surface
hardness increased by 34 - 44% compared to unpeened material hardness. While
the hardened layers extended up to a depth of approximately 350 and 400 µm for
both materials respectively. In oil jet treatment of another material steel 1040, they
found the surface compressive residual stress increased with decreasing nozzle
traverse rate with a depth of the strengthening layer of about 50 µm [86]. While, the
increase in hardness was about 14 - 22% of the base material hardness. Kunaporn
et al. [71] found that the hardness increased in some conditions by about 10-15%
from the base material hardness during waterjet treatment of aluminium alloy 6061-
T6. The degree of surface hardening was extended to a depth of about 200 µm.
- 300
- 400
- 600
- 500
0 2 4 6 8 0 2 4 6 8
Distance from centre, mm
Resid
ua
l str
ess,
MP
a
a) b)
Original
0° inclination angle
30° inclination angle
45° inclination angle
60° inclination angle
90° inclination angle
Original
0° inclination angle
30° inclination angle
45° inclination angle
60° inclination angle
90° inclination angle
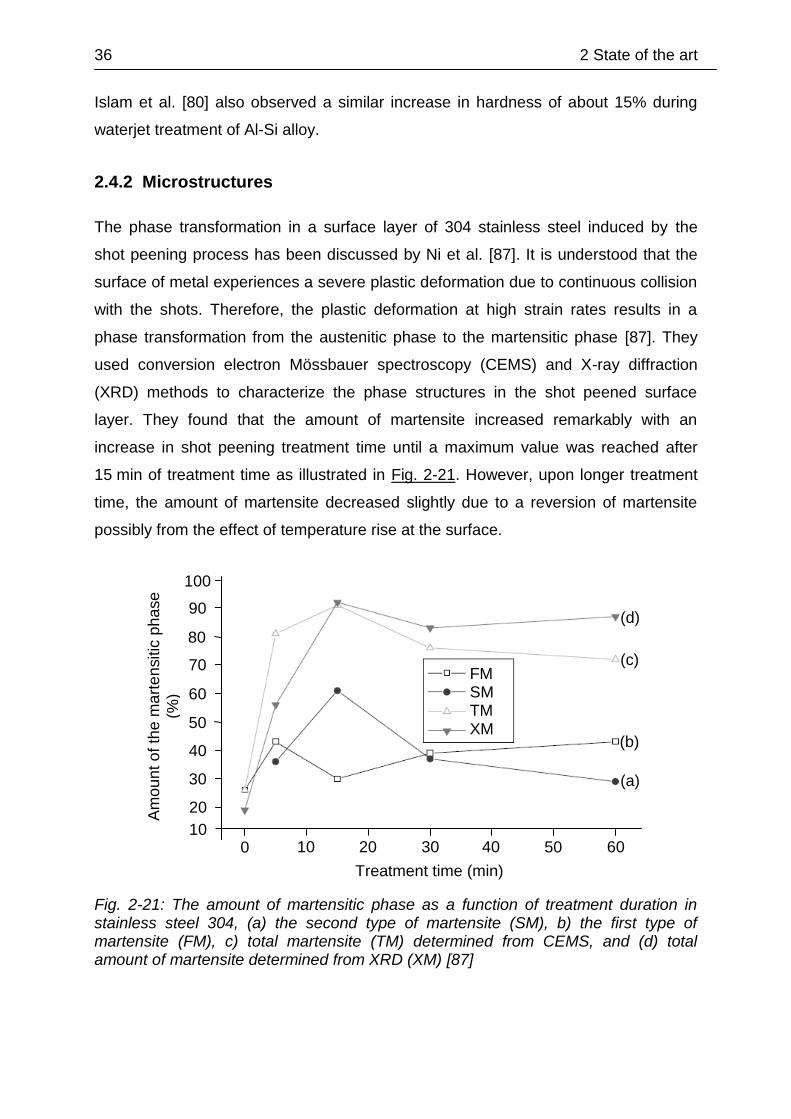
36 2 State of the art
Islam et al. [80] also observed a similar increase in hardness of about 15% during
waterjet treatment of Al-Si alloy.
2.4.2 Microstructures
The phase transformation in a surface layer of 304 stainless steel induced by the
shot peening process has been discussed by Ni et al. [87]. It is understood that the
surface of metal experiences a severe plastic deformation due to continuous collision
with the shots. Therefore, the plastic deformation at high strain rates results in a
phase transformation from the austenitic phase to the martensitic phase [87]. They
used conversion electron Mössbauer spectroscopy (CEMS) and X-ray diffraction
(XRD) methods to characterize the phase structures in the shot peened surface
layer. They found that the amount of martensite increased remarkably with an
increase in shot peening treatment time until a maximum value was reached after
15 min of treatment time as illustrated in Fig. 2-21. However, upon longer treatment
time, the amount of martensite decreased slightly due to a reversion of martensite
possibly from the effect of temperature rise at the surface.
Fig. 2-21: The amount of martensitic phase as a function of treatment duration in stainless steel 304, (a) the second type of martensite (SM), b) the first type of martensite (FM), c) total martensite (TM) determined from CEMS, and (d) total amount of martensite determined from XRD (XM) [87]
Treatment time (min)
Am
ou
nt o
f th
e m
art
en
sitic
ph
ase
(%)
90
50
20
10
(d)
60
80
0 10 50 60
FM SM TM XM
20 30 40
30
40
70
100
(c)
(b)
(a)
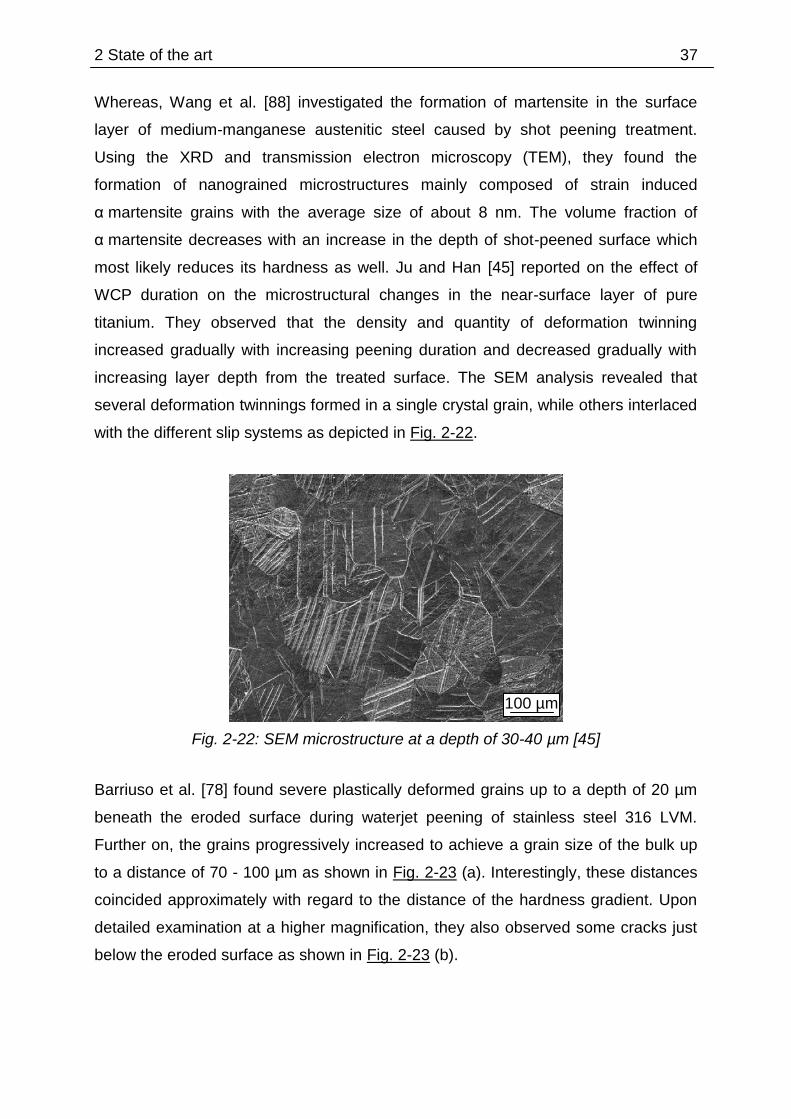
2 State of the art 37
Whereas, Wang et al. [88] investigated the formation of martensite in the surface
layer of medium-manganese austenitic steel caused by shot peening treatment.
Using the XRD and transmission electron microscopy (TEM), they found the
formation of nanograined microstructures mainly composed of strain induced
α martensite grains with the average size of about 8 nm. The volume fraction of
α martensite decreases with an increase in the depth of shot-peened surface which
most likely reduces its hardness as well. Ju and Han [45] reported on the effect of
WCP duration on the microstructural changes in the near-surface layer of pure
titanium. They observed that the density and quantity of deformation twinning
increased gradually with increasing peening duration and decreased gradually with
increasing layer depth from the treated surface. The SEM analysis revealed that
several deformation twinnings formed in a single crystal grain, while others interlaced
with the different slip systems as depicted in Fig. 2-22.
Fig. 2-22: SEM microstructure at a depth of 30-40 µm [45]
Barriuso et al. [78] found severe plastically deformed grains up to a depth of 20 µm
beneath the eroded surface during waterjet peening of stainless steel 316 LVM.
Further on, the grains progressively increased to achieve a grain size of the bulk up
to a distance of 70 - 100 µm as shown in Fig. 2-23 (a). Interestingly, these distances
coincided approximately with regard to the distance of the hardness gradient. Upon
detailed examination at a higher magnification, they also observed some cracks just
below the eroded surface as shown in Fig. 2-23 (b).
100 µm
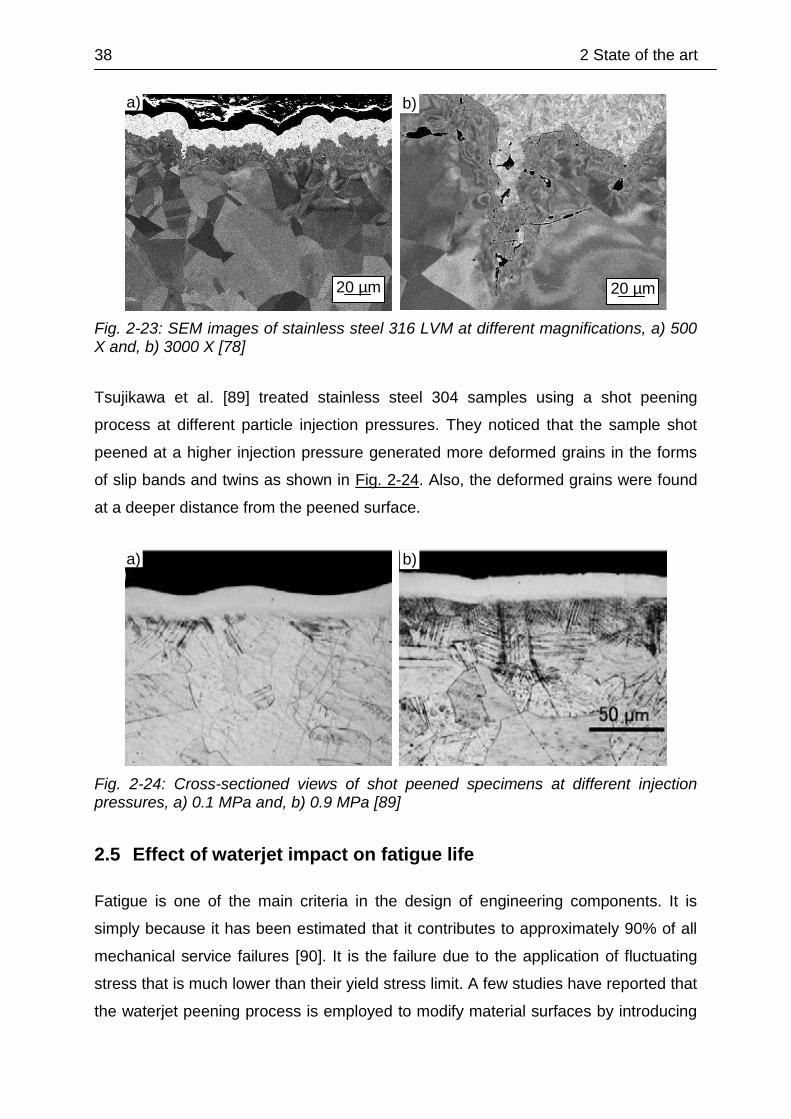
38 2 State of the art
Fig. 2-23: SEM images of stainless steel 316 LVM at different magnifications, a) 500 X and, b) 3000 X [78]
Tsujikawa et al. [89] treated stainless steel 304 samples using a shot peening
process at different particle injection pressures. They noticed that the sample shot
peened at a higher injection pressure generated more deformed grains in the forms
of slip bands and twins as shown in Fig. 2-24. Also, the deformed grains were found
at a deeper distance from the peened surface.
Fig. 2-24: Cross-sectioned views of shot peened specimens at different injection pressures, a) 0.1 MPa and, b) 0.9 MPa [89]
2.5 Effect of waterjet impact on fatigue life
Fatigue is one of the main criteria in the design of engineering components. It is
simply because it has been estimated that it contributes to approximately 90% of all
mechanical service failures [90]. It is the failure due to the application of fluctuating
stress that is much lower than their yield stress limit. A few studies have reported that
the waterjet peening process is employed to modify material surfaces by introducing
a) b)
a)
20 µm
b)
20 µm
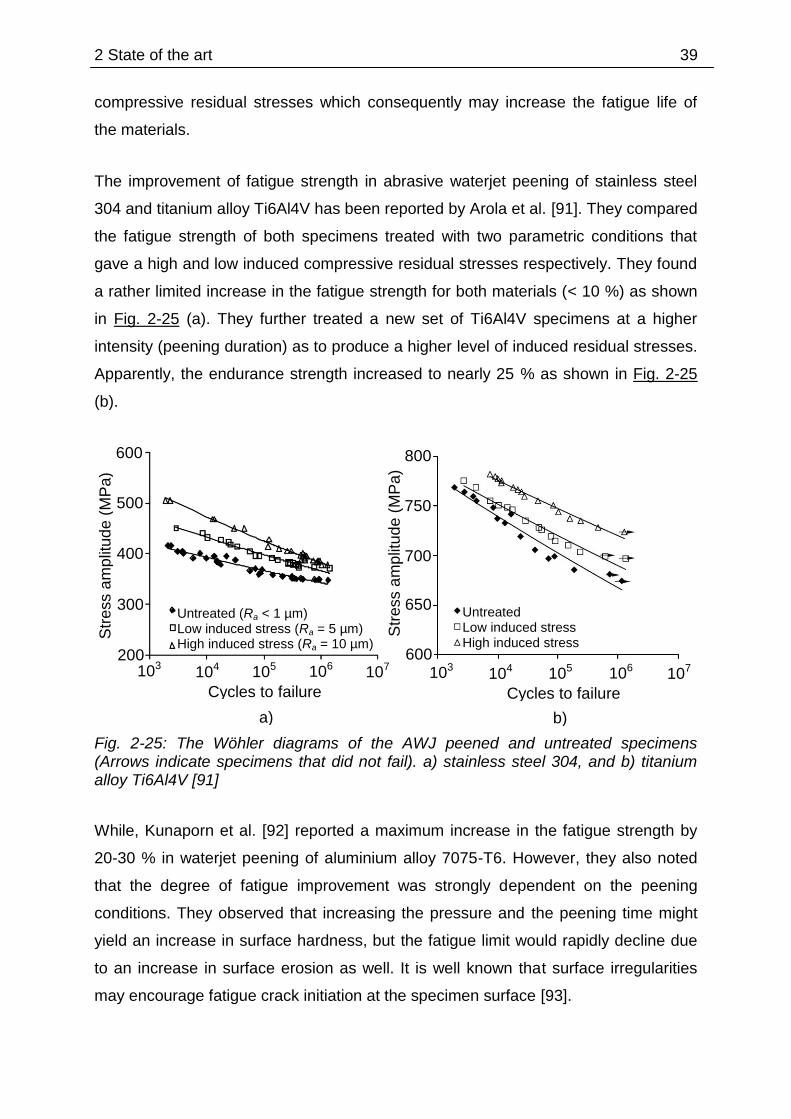
2 State of the art 39
compressive residual stresses which consequently may increase the fatigue life of
the materials.
The improvement of fatigue strength in abrasive waterjet peening of stainless steel
304 and titanium alloy Ti6Al4V has been reported by Arola et al. [91]. They compared
the fatigue strength of both specimens treated with two parametric conditions that
gave a high and low induced compressive residual stresses respectively. They found
a rather limited increase in the fatigue strength for both materials (< 10 %) as shown
in Fig. 2-25 (a). They further treated a new set of Ti6Al4V specimens at a higher
intensity (peening duration) as to produce a higher level of induced residual stresses.
Apparently, the endurance strength increased to nearly 25 % as shown in Fig. 2-25
(b).
Fig. 2-25: The Wöhler diagrams of the AWJ peened and untreated specimens (Arrows indicate specimens that did not fail). a) stainless steel 304, and b) titanium alloy Ti6Al4V [91]
While, Kunaporn et al. [92] reported a maximum increase in the fatigue strength by
20-30 % in waterjet peening of aluminium alloy 7075-T6. However, they also noted
that the degree of fatigue improvement was strongly dependent on the peening
conditions. They observed that increasing the pressure and the peening time might
yield an increase in surface hardness, but the fatigue limit would rapidly decline due
to an increase in surface erosion as well. It is well known that surface irregularities
may encourage fatigue crack initiation at the specimen surface [93].
600
500
300
400
Cycles to failure
Str
ess a
mp
litud
e (
MP
a)
a) b)
200 103 104 105 106 107
Cycles to failure
103 104 105 106 107
800
750
650
700
Str
ess a
mp
litud
e (
MP
a)
600
Untreated (Ra < 1 µm) Low induced stress (Ra = 5 µm) High induced stress (Ra = 10 µm)
Untreated Low induced stress High induced stress
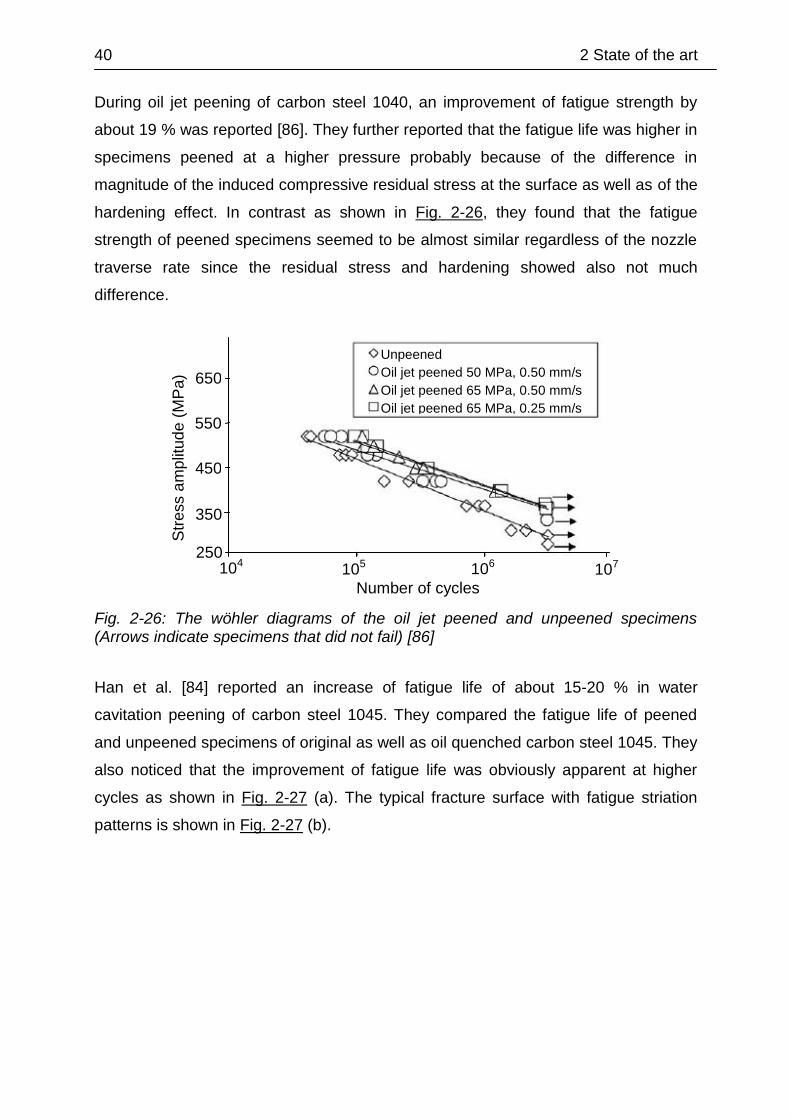
40 2 State of the art
During oil jet peening of carbon steel 1040, an improvement of fatigue strength by
about 19 % was reported [86]. They further reported that the fatigue life was higher in
specimens peened at a higher pressure probably because of the difference in
magnitude of the induced compressive residual stress at the surface as well as of the
hardening effect. In contrast as shown in Fig. 2-26, they found that the fatigue
strength of peened specimens seemed to be almost similar regardless of the nozzle
traverse rate since the residual stress and hardening showed also not much
difference.
Fig. 2-26: The wöhler diagrams of the oil jet peened and unpeened specimens (Arrows indicate specimens that did not fail) [86]
Han et al. [84] reported an increase of fatigue life of about 15-20 % in water
cavitation peening of carbon steel 1045. They compared the fatigue life of peened
and unpeened specimens of original as well as oil quenched carbon steel 1045. They
also noticed that the improvement of fatigue life was obviously apparent at higher
cycles as shown in Fig. 2-27 (a). The typical fracture surface with fatigue striation
patterns is shown in Fig. 2-27 (b).
650
550
350
450
Number of cycles
Str
ess a
mp
litud
e (
MP
a)
250 104 105 106 107
Unpeened
Oil jet peened 50 MPa, 0.50 mm/s
Oil jet peened 65 MPa, 0.50 mm/s
Oil jet peened 65 MPa, 0.25 mm/s
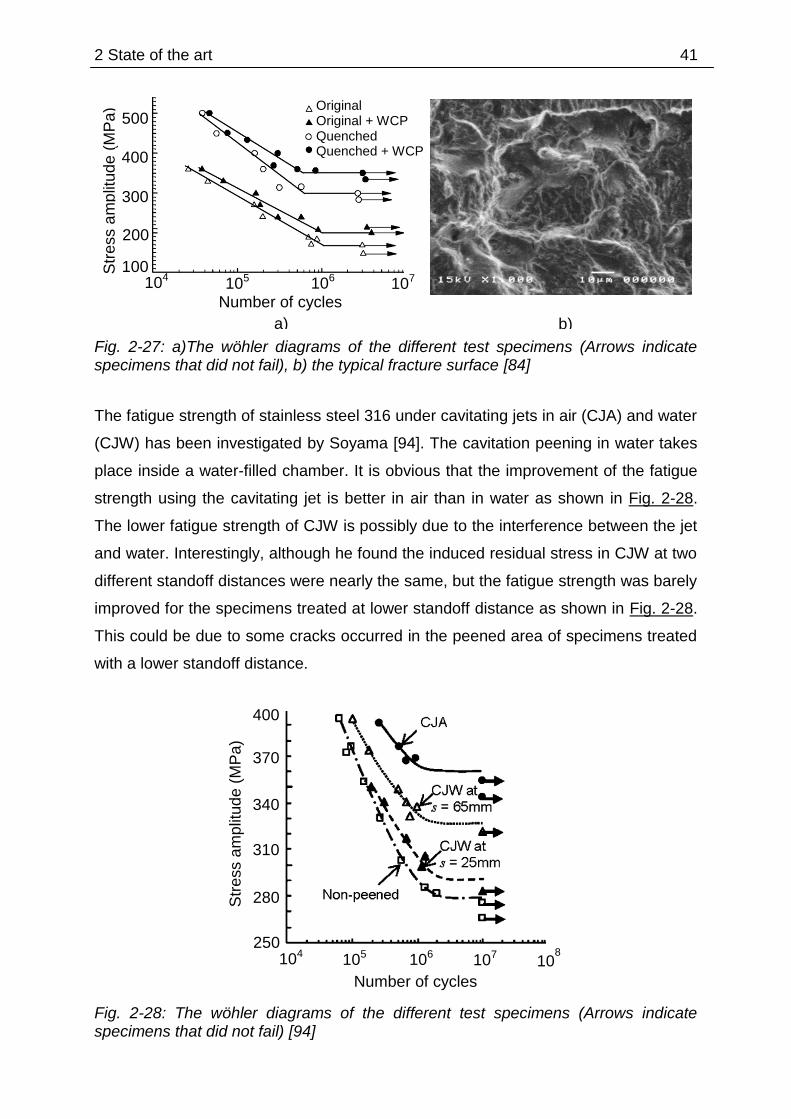
2 State of the art 41
Fig. 2-27: a)The wöhler diagrams of the different test specimens (Arrows indicate specimens that did not fail), b) the typical fracture surface [84]
The fatigue strength of stainless steel 316 under cavitating jets in air (CJA) and water
(CJW) has been investigated by Soyama [94]. The cavitation peening in water takes
place inside a water-filled chamber. It is obvious that the improvement of the fatigue
strength using the cavitating jet is better in air than in water as shown in Fig. 2-28.
The lower fatigue strength of CJW is possibly due to the interference between the jet
and water. Interestingly, although he found the induced residual stress in CJW at two
different standoff distances were nearly the same, but the fatigue strength was barely
improved for the specimens treated at lower standoff distance as shown in Fig. 2-28.
This could be due to some cracks occurred in the peened area of specimens treated
with a lower standoff distance.
Fig. 2-28: The wöhler diagrams of the different test specimens (Arrows indicate specimens that did not fail) [94]
370
280
Number of cycles
250 104 105 106 107
310
340
Str
ess a
mp
litud
e (
MP
a)
400
108
b)
Number of cycles
Str
ess a
mp
litud
e (
MP
a)
500
a)
400
200
300
100 104 105 106 107
Original Original + WCP Quenched Quenched + WCP
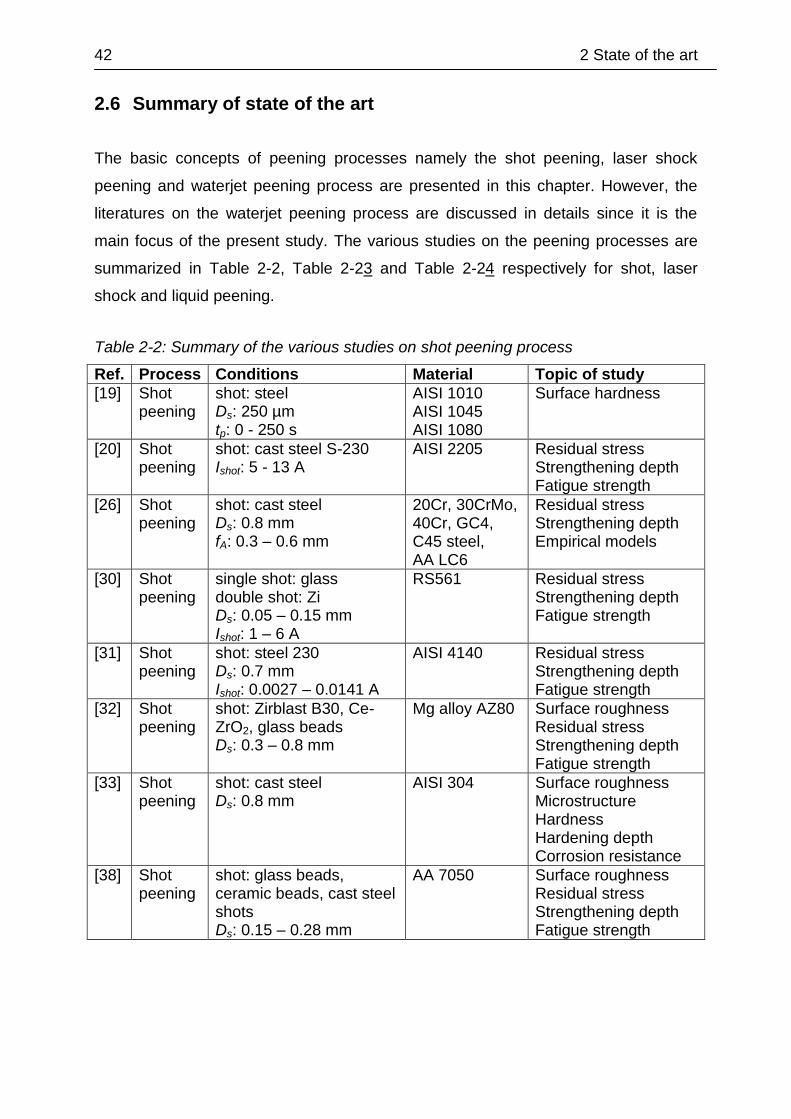
42 2 State of the art
2.6 Summary of state of the art
The basic concepts of peening processes namely the shot peening, laser shock
peening and waterjet peening process are presented in this chapter. However, the
literatures on the waterjet peening process are discussed in details since it is the
main focus of the present study. The various studies on the peening processes are
summarized in Table 2-2, Table 2-23 and Table 2-24 respectively for shot, laser
shock and liquid peening.
Table 2-2: Summary of the various studies on shot peening process
Ref. Process Conditions Material Topic of study
[19] Shot peening
shot: steel Ds: 250 µm tp: 0 - 250 s
AISI 1010 AISI 1045 AISI 1080
Surface hardness
[20] Shot peening
shot: cast steel S-230 Ishot: 5 - 13 A
AISI 2205 Residual stress Strengthening depth Fatigue strength
[26] Shot peening
shot: cast steel Ds: 0.8 mm fA: 0.3 – 0.6 mm
20Cr, 30CrMo, 40Cr, GC4, C45 steel, AA LC6
Residual stress Strengthening depth Empirical models
[30] Shot peening
single shot: glass double shot: Zi Ds: 0.05 – 0.15 mm Ishot: 1 – 6 A
RS561 Residual stress Strengthening depth Fatigue strength
[31] Shot peening
shot: steel 230 Ds: 0.7 mm Ishot: 0.0027 – 0.0141 A
AISI 4140 Residual stress Strengthening depth Fatigue strength
[32] Shot peening
shot: Zirblast B30, Ce-ZrO2, glass beads Ds: 0.3 – 0.8 mm
Mg alloy AZ80 Surface roughness Residual stress Strengthening depth Fatigue strength
[33] Shot peening
shot: cast steel Ds: 0.8 mm
AISI 304 Surface roughness Microstructure Hardness Hardening depth Corrosion resistance
[38] Shot peening
shot: glass beads, ceramic beads, cast steel shots Ds: 0.15 – 0.28 mm
AA 7050 Surface roughness Residual stress Strengthening depth Fatigue strength
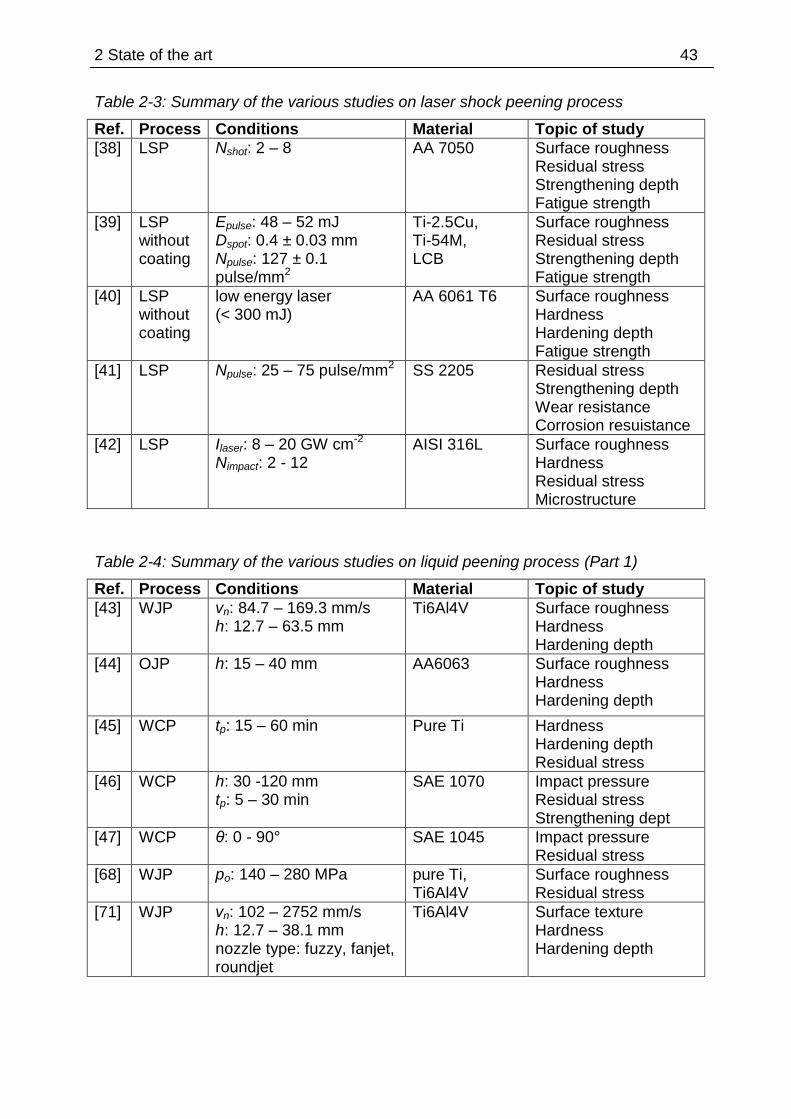
2 State of the art 43
Table 2-3: Summary of the various studies on laser shock peening process
Ref. Process Conditions Material Topic of study
[38] LSP Nshot: 2 – 8 AA 7050 Surface roughness Residual stress Strengthening depth Fatigue strength
[39] LSP without coating
Epulse: 48 – 52 mJ Dspot: 0.4 ± 0.03 mm Npulse: 127 ± 0.1 pulse/mm2
Ti-2.5Cu, Ti-54M, LCB
Surface roughness Residual stress Strengthening depth Fatigue strength
[40] LSP without coating
low energy laser (< 300 mJ)
AA 6061 T6 Surface roughness Hardness Hardening depth Fatigue strength
[41] LSP Npulse: 25 – 75 pulse/mm2 SS 2205 Residual stress Strengthening depth Wear resistance Corrosion resuistance
[42] LSP Ilaser: 8 – 20 GW cm-2
Nimpact: 2 - 12 AISI 316L Surface roughness
Hardness Residual stress Microstructure
Table 2-4: Summary of the various studies on liquid peening process (Part 1)
Ref. Process Conditions Material Topic of study
[43] WJP vn: 84.7 – 169.3 mm/s h: 12.7 – 63.5 mm
Ti6Al4V Surface roughness Hardness Hardening depth
[44] OJP h: 15 – 40 mm AA6063 Surface roughness Hardness Hardening depth
[45] WCP tp: 15 – 60 min Pure Ti Hardness Hardening depth Residual stress
[46] WCP h: 30 -120 mm tp: 5 – 30 min
SAE 1070 Impact pressure Residual stress Strengthening dept
[47] WCP θ: 0 - 90° SAE 1045 Impact pressure Residual stress
[68] WJP po: 140 – 280 MPa pure Ti, Ti6Al4V
Surface roughness Residual stress
[71] WJP vn: 102 – 2752 mm/s h: 12.7 – 38.1 mm nozzle type: fuzzy, fanjet, roundjet
Ti6Al4V Surface texture Hardness Hardening depth
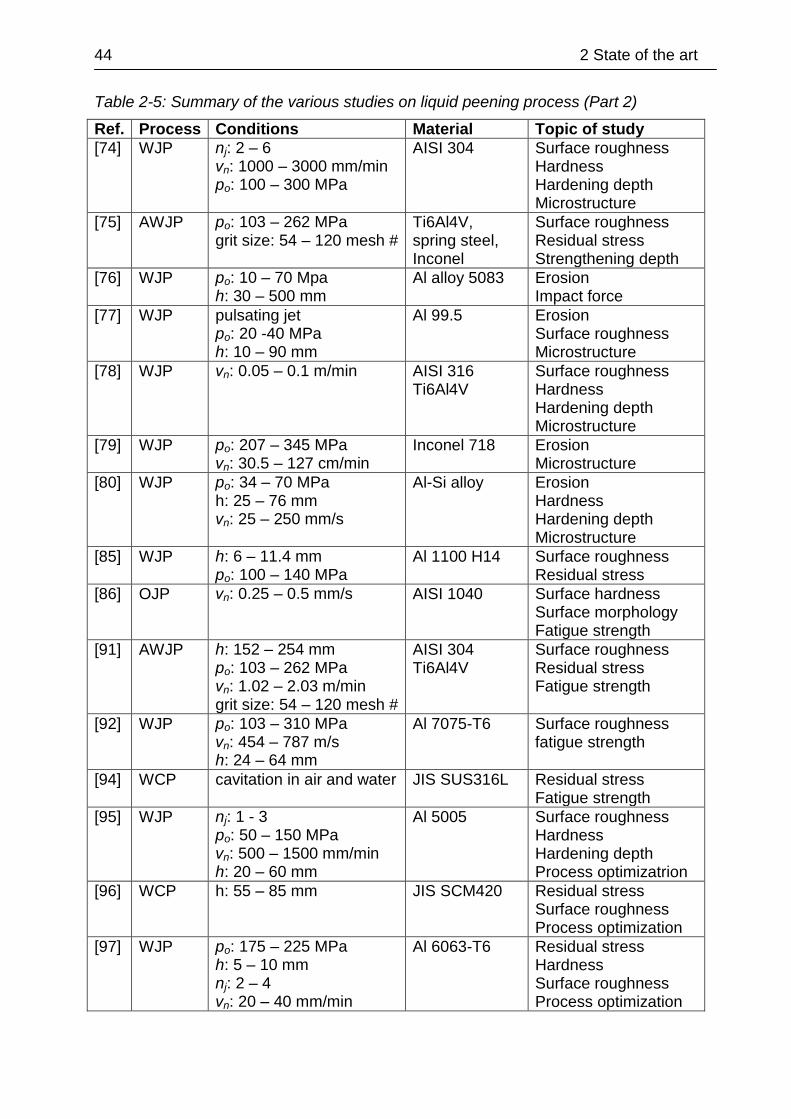
44 2 State of the art
Table 2-5: Summary of the various studies on liquid peening process (Part 2)
Ref. Process Conditions Material Topic of study
[74] WJP nj: 2 – 6 vn: 1000 – 3000 mm/min po: 100 – 300 MPa
AISI 304 Surface roughness Hardness Hardening depth Microstructure
[75] AWJP po: 103 – 262 MPa grit size: 54 – 120 mesh #
Ti6Al4V, spring steel, Inconel
Surface roughness Residual stress Strengthening depth
[76] WJP po: 10 – 70 Mpa h: 30 – 500 mm
Al alloy 5083 Erosion Impact force
[77] WJP pulsating jet po: 20 -40 MPa h: 10 – 90 mm
Al 99.5 Erosion Surface roughness Microstructure
[78] WJP vn: 0.05 – 0.1 m/min AISI 316 Ti6Al4V
Surface roughness Hardness Hardening depth Microstructure
[79] WJP po: 207 – 345 MPa vn: 30.5 – 127 cm/min
Inconel 718 Erosion Microstructure
[80] WJP po: 34 – 70 MPa h: 25 – 76 mm vn: 25 – 250 mm/s
Al-Si alloy Erosion Hardness Hardening depth Microstructure
[85] WJP h: 6 – 11.4 mm po: 100 – 140 MPa
Al 1100 H14 Surface roughness Residual stress
[86] OJP vn: 0.25 – 0.5 mm/s AISI 1040 Surface hardness Surface morphology Fatigue strength
[91] AWJP h: 152 – 254 mm po: 103 – 262 MPa vn: 1.02 – 2.03 m/min grit size: 54 – 120 mesh #
AISI 304 Ti6Al4V
Surface roughness Residual stress Fatigue strength
[92] WJP po: 103 – 310 MPa vn: 454 – 787 m/s h: 24 – 64 mm
Al 7075-T6 Surface roughness fatigue strength
[94] WCP cavitation in air and water JIS SUS316L Residual stress Fatigue strength
[95] WJP nj: 1 - 3 po: 50 – 150 MPa vn: 500 – 1500 mm/min h: 20 – 60 mm
Al 5005 Surface roughness Hardness Hardening depth Process optimizatrion
[96] WCP h: 55 – 85 mm JIS SCM420 Residual stress Surface roughness Process optimization
[97] WJP po: 175 – 225 MPa h: 5 – 10 mm nj: 2 – 4 vn: 20 – 40 mm/min
Al 6063-T6 Residual stress Hardness Surface roughness Process optimization
3 Problem specification and scientific approach 45
3 Problem specification and scientific approach
The material surface plays an important role in the response of the engineering
components. Surfaces are often subjected to various surface treatment processes to
achieve certain qualities that are not available from the primary manufacturing
processes [98]. The process is conducted for various reasons including to improve
the performance of materials, change physical properties, vary appearance and alter
dimensions. A diverse range of thermal, mechanical and chemical treatments has
been developed to modify the surface characteristics [99]. Various surface treatment
processes have been used for a wide range of materials from semiconductors to
metals, ceramics, polymers, bio and nanomaterials [100].
The quality and performance of a product is directly related to its surface integrity
produced from different surface treatment processes. Surface integrity comprises the
topography (e.g. roughness, erosion), the mechanical properties (e.g. residual stress,
hardness), metallurgical states (e.g. phase transformation, microstructure) and other
related property variations of the work material during surface processing procedures
[101]. Therefore, alteration of the surface integrity especially in the mechanical
related applications has a significant effect on fatigue strength and lifetime of
engineering components.
A fatigue failure under cyclic loads is most commonly originated at the near-surface
area where it has the highest stress concentrations and tensile stresses resulting
from production processes. A major method of increasing fatigue performance is by
imposing compressive residual stresses within a thin outer surface layer. As a result,
the possibility of crack initiation leading to fatigue failure is reduced. The method may
offer some positive effects by enhancing the fatigue strength of the components than
the usage of highly alloyed and more expensive materials [5].
The shot peening and the laser shock peening processes are widely established in
the industry. However, there are possible disadvantages of the shot peening process
including defects and rough peened surfaces which have shown to be detrimental to
fatigue crack initiation [102]. While in the laser shock peening, there are possibilities
of thermal effects such as melting of the metal surface, especially for alloys of a low

46 3 Problem specification and scientific approach
melting point [103]. The waterjet peening process may overcome the limitations of
other peening processes, particularly leaving a clean and smooth surface with low
surface roughness as well as the absence of thermal effects [44]. Over the past
decade, the WJP process has shown to be a promising method in the mechanical
surface strengthening process. A lot of research has been conducted to study its
potential applications and associated sciences. However, a detailed knowledge in
this process is not comprehensively reported in the literature. Therefore, there is a
need to widen the knowledge in the field of the waterjet peening process by
conducting more research.
Considerable works have been done in investigating the effect of various WJP
process parameters on the inducement of residual stresses on metallic surfaces.
However, all the works were carried out in a single-pass treatment. There is a
possibility that the residual stress can be introduced in a higher amount and/or
deeper below the surface if the metallic surfaces are treated repeatedly with multiple
passes. As shown in studies on traditional machining processes, particularly grinding,
it became clear that there is a variation in magnitude of residual stress with respect to
the depth of the residual stress distribution in multiple passes grinding technique
[104]. It was also revealed that as the number of grinding passes increases, the
normal grinding force increases as well, which resulted in a higher amount of
compressive residual stresses being induced [105]. Furthermore, a study on
multipass abrasive waterjet cutting has shown its superiority over a single-pass
cutting where it produces better surface quality and penetration depth [106]. It is thus
essential to investigate the effect of multiple passes treatment in the WJP process.
The main objective of the present study is to evaluate the response of different
materials namely, stainless steel 304 and carbon steel 1045 when they are subjected
to multiple passes treatment in the WJP process. Additionally, the effect of other
parameters in WJP such as feedrate, standoff distance and water pressure is also
discussed.
Furthermore, little attention has been paid to the optimization of the waterjet peening
process. It is known that increasing the energy and frequency of water drops may
lead to a higher increase in hardness as well as a deeper hardening layer [74].
Unfortunately, it may also increase the roughness of the material surfaces which is
detrimental to its fatigue life. Therefore, it is important to find a balance between the
3 Problem specification and scientific approach 47
increase in hardness and also roughness of the material surfaces. In order to have
good increase in hardness within acceptable roughness of the peened surfaces, it is
necessary to employ optimization techniques to find the optimal waterjet peening
conditions. Also, workable models between the hardness as well as the roughness
and the peening parameters can be developed in order to plan the process in
advance with high rates of reproducibility. For this reason, the response surface
methodology can conveniently be employed. Therefore, a special chapter in the
present thesis is specifically dedicated to discuss about the optimization of WJP
parameters on aluminium alloy 5005 as an example and also the development of
workable empirical models for surface roughness (Ra) and hardness.
48 4 Research methodology
4 Research methodology
4.1 Materials
A total of three different materials was selected in the present work. Both ferrous and
non-ferrous materials were chosen namely austenitic stainless steel 304, carbon
steel 1045 and aluminium alloy 5005. These materials were primarily chosen
because of their wide usage as mentioned in the literatures and also their availability
in the laboratory. Both ferrous alloys were used for extensive investigations on the
effect of waterjet peening parameters mainly due to their relatively higher strength
compared to aluminium. Furthermore, both materials were treated using a similar set
of parametric levels in order to make an appropriate comparison of their responses
under the waterjet peening process. The non-ferrous alloy was used for the study of
optimization in the waterjet peening process because of its much lower strength than
the ferrous alloys. Therefore, the aluminium alloy 5005 was treated with a different
set of parametric levels so that a proper assessment on the optimization of its
performance could be done. The details about the experimentation and optimization
in the waterjet peening process of aluminium alloy 5005 are explained in Chapter 6.
The austenitic stainless steel 304 (X5CrNi18-10, material no. 1.4301) was selected
as the first test material. Austenitic steels are commonly used for stainless
applications because of their excellent formability even at room temperature [107].
Stainless steel 304 is the most common of austenitic grades which is used in
chemical processing equipments and heat exchangers for food, dairy, and beverage
industries. Austenitic stainless steel is also used in medical applications. In fact,
Arola et al. [91] studied the influence of abrasive waterjet peening on austenitic
stainless steel (AISI 304). With the use of abrasive particles, the treated surfaces
produced quite high values of Ra up to 14 µm even with a single jet pass [91]. It is
known that rough surfaces are expected to encourage fatigue crack initiation thus
accelerating the failure of a component. Therefore, it is of interest to treat the same
material but without the use of abrasives in the waterjet peening process so that
smoother surfaces can be produced. The typical chemical composition and
mechanical properties of austenitic stainless steel 304 are given in Table 4-1 and
Table 4-2 respectively.
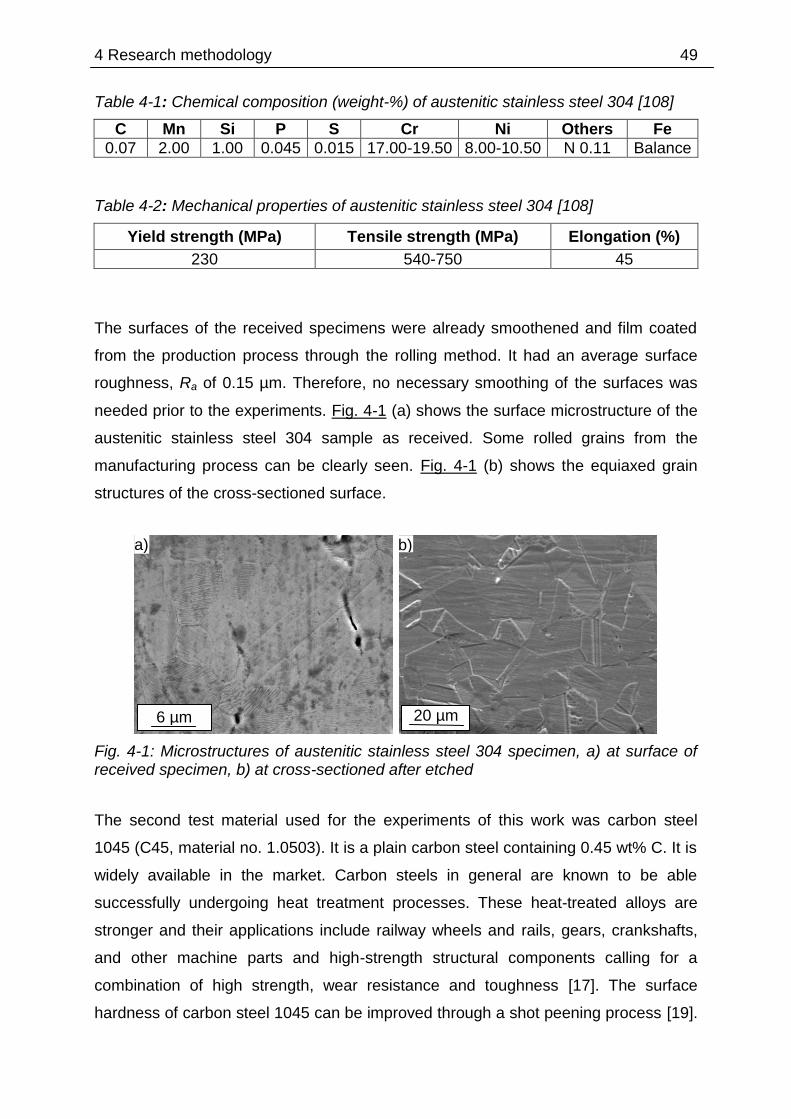
4 Research methodology 49
Table 4-1: Chemical composition (weight-%) of austenitic stainless steel 304 [108]
C Mn Si P S Cr Ni Others Fe
0.07 2.00 1.00 0.045 0.015 17.00-19.50 8.00-10.50 N 0.11 Balance
Table 4-2: Mechanical properties of austenitic stainless steel 304 [108]
Yield strength (MPa) Tensile strength (MPa) Elongation (%)
230 540-750 45
The surfaces of the received specimens were already smoothened and film coated
from the production process through the rolling method. It had an average surface
roughness, Ra of 0.15 µm. Therefore, no necessary smoothing of the surfaces was
needed prior to the experiments. Fig. 4-1 (a) shows the surface microstructure of the
austenitic stainless steel 304 sample as received. Some rolled grains from the
manufacturing process can be clearly seen. Fig. 4-1 (b) shows the equiaxed grain
structures of the cross-sectioned surface.
Fig. 4-1: Microstructures of austenitic stainless steel 304 specimen, a) at surface of received specimen, b) at cross-sectioned after etched
The second test material used for the experiments of this work was carbon steel
1045 (C45, material no. 1.0503). It is a plain carbon steel containing 0.45 wt% C. It is
widely available in the market. Carbon steels in general are known to be able
successfully undergoing heat treatment processes. These heat-treated alloys are
stronger and their applications include railway wheels and rails, gears, crankshafts,
and other machine parts and high-strength structural components calling for a
combination of high strength, wear resistance and toughness [17]. The surface
hardness of carbon steel 1045 can be improved through a shot peening process [19].
20 µm
b)
6 µm
a)

50 4 Research methodology
Furthermore, its strength can also be improved using a water cavitation peening
process (WCP) [84]. In case of WCP, the cavitating bubbles which collapse on the
surface of the component produced a higher amount of compressive stress [84].
However, a higher level of the kinetic energy produced in the cavitating jet had also
yielded a significantly high value of roughness on the material surface [71].
Therefore, it is an interesting topic to study the response of the same material when it
is subjected to a pure waterjet peening process. A smoother surface can be expected
since the plain waterjet produces a lower level of the kinetic energy than the
cavitating jet [71]. The typical chemical composition and mechanical properties of
carbon steel 1045 are given in Table 4-3 and Table 4-4 respectively.
Table 4-3: Chemical composition (weight-%) of carbon steel 1045 [108]
C Mn Si P S Cr Ni Mo Others Fe
0.42-0.50 0.50-0.80 0.40 0.045 0.045 0.40 0.40 0.10 Cr+Mo+Ni
0.63 Balance
Table 4-4: Mechanical properties of carbon steel 1045 [108]
Yield strength (MPa) Tensile strength (MPa) Elongation (%)
230-305 530-580 15-16
The microstructures of carbon 1045 are shown Fig. 4-2. The surface has been
polished up to a level of mirror surface as shown in Fig. 4-2 (a) using a lapping
machine. As a result, it has a very low average surface roughness, Ra of 0.07 µm.
The cross-sectioned microstructures show the ferrite and pearlite constituents as
seen in Fig. 4-2 (b).
Fig. 4-2: Microstructures of carbon steel 1045 specimen, a) at surface of received specimen, b) at cross-sectioned after etched
70 µm
a)
30 µm
b)
Pearlite
Ferrite
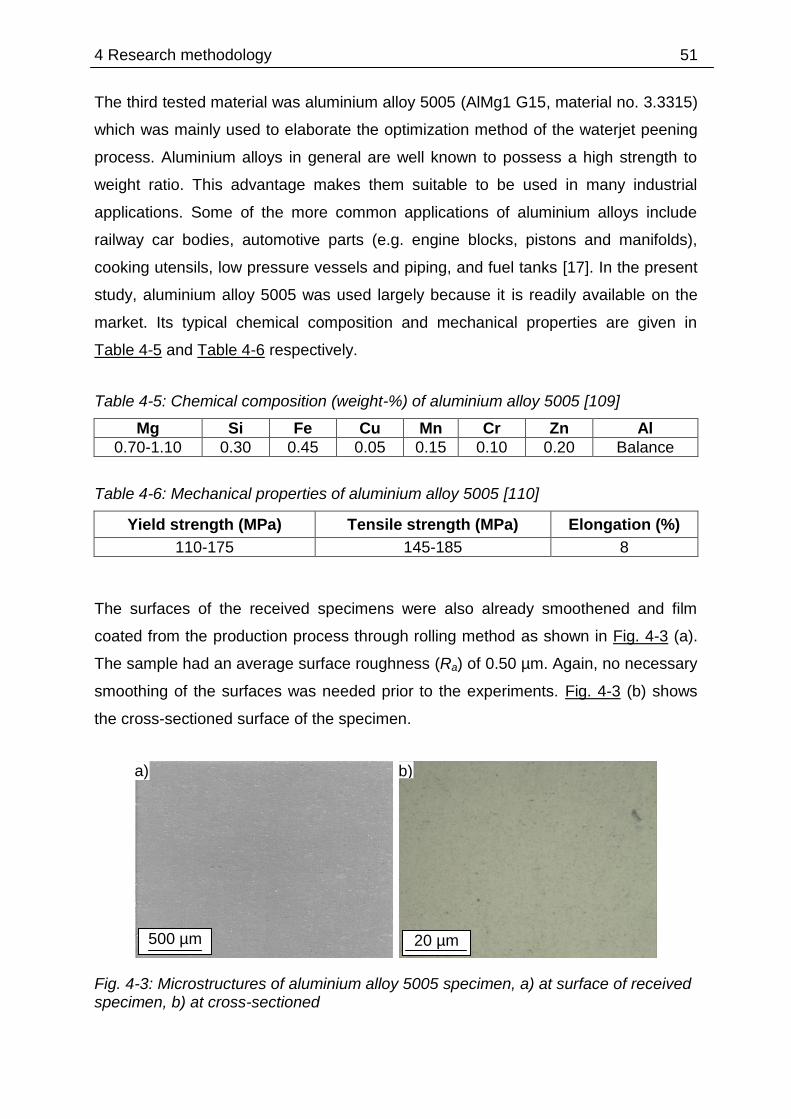
4 Research methodology 51
The third tested material was aluminium alloy 5005 (AlMg1 G15, material no. 3.3315)
which was mainly used to elaborate the optimization method of the waterjet peening
process. Aluminium alloys in general are well known to possess a high strength to
weight ratio. This advantage makes them suitable to be used in many industrial
applications. Some of the more common applications of aluminium alloys include
railway car bodies, automotive parts (e.g. engine blocks, pistons and manifolds),
cooking utensils, low pressure vessels and piping, and fuel tanks [17]. In the present
study, aluminium alloy 5005 was used largely because it is readily available on the
market. Its typical chemical composition and mechanical properties are given in
Table 4-5 and Table 4-6 respectively.
Table 4-5: Chemical composition (weight-%) of aluminium alloy 5005 [109]
Mg Si Fe Cu Mn Cr Zn Al
0.70-1.10 0.30 0.45 0.05 0.15 0.10 0.20 Balance
Table 4-6: Mechanical properties of aluminium alloy 5005 [110]
Yield strength (MPa) Tensile strength (MPa) Elongation (%)
110-175 145-185 8
The surfaces of the received specimens were also already smoothened and film
coated from the production process through rolling method as shown in Fig. 4-3 (a).
The sample had an average surface roughness (Ra) of 0.50 µm. Again, no necessary
smoothing of the surfaces was needed prior to the experiments. Fig. 4-3 (b) shows
the cross-sectioned surface of the specimen.
Fig. 4-3: Microstructures of aluminium alloy 5005 specimen, a) at surface of received specimen, b) at cross-sectioned
500 µm
a)
20 µm
b)
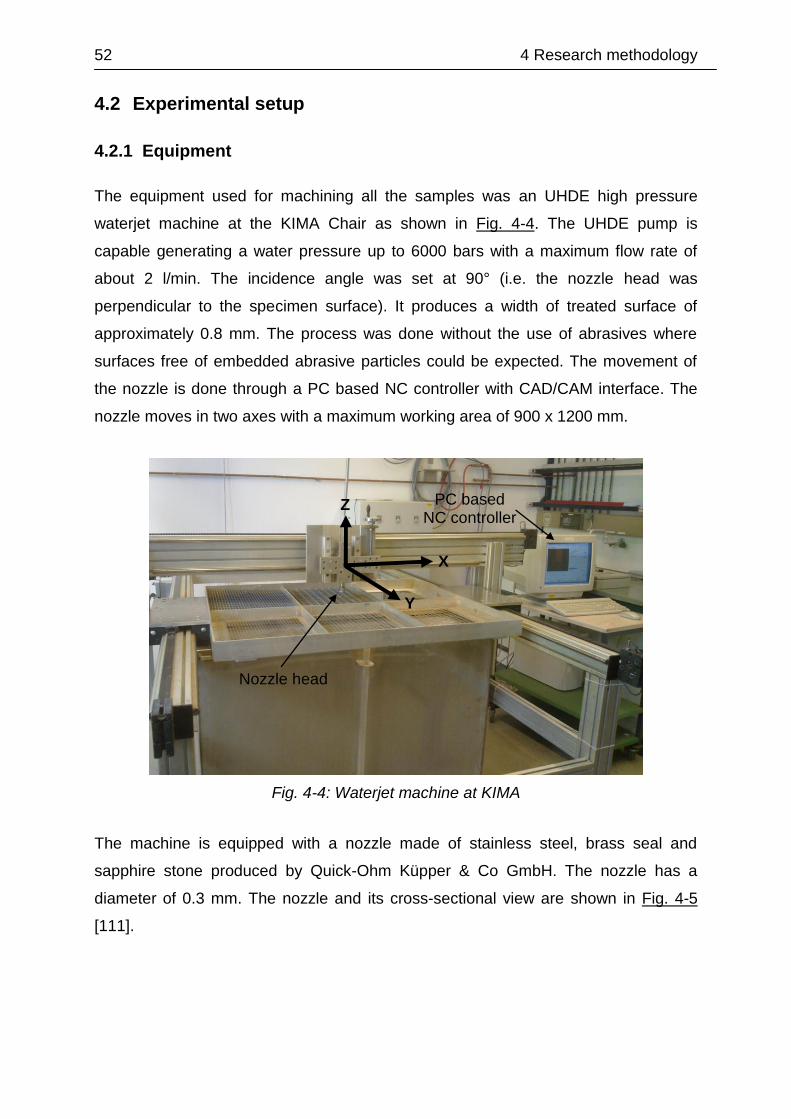
52 4 Research methodology
4.2 Experimental setup
4.2.1 Equipment
The equipment used for machining all the samples was an UHDE high pressure
waterjet machine at the KIMA Chair as shown in Fig. 4-4. The UHDE pump is
capable generating a water pressure up to 6000 bars with a maximum flow rate of
about 2 l/min. The incidence angle was set at 90° (i.e. the nozzle head was
perpendicular to the specimen surface). It produces a width of treated surface of
approximately 0.8 mm. The process was done without the use of abrasives where
surfaces free of embedded abrasive particles could be expected. The movement of
the nozzle is done through a PC based NC controller with CAD/CAM interface. The
nozzle moves in two axes with a maximum working area of 900 x 1200 mm.
Fig. 4-4: Waterjet machine at KIMA
The machine is equipped with a nozzle made of stainless steel, brass seal and
sapphire stone produced by Quick-Ohm Küpper & Co GmbH. The nozzle has a
diameter of 0.3 mm. The nozzle and its cross-sectional view are shown in Fig. 4-5
[111].
Nozzle head
Y
X
Z PC based NC controller
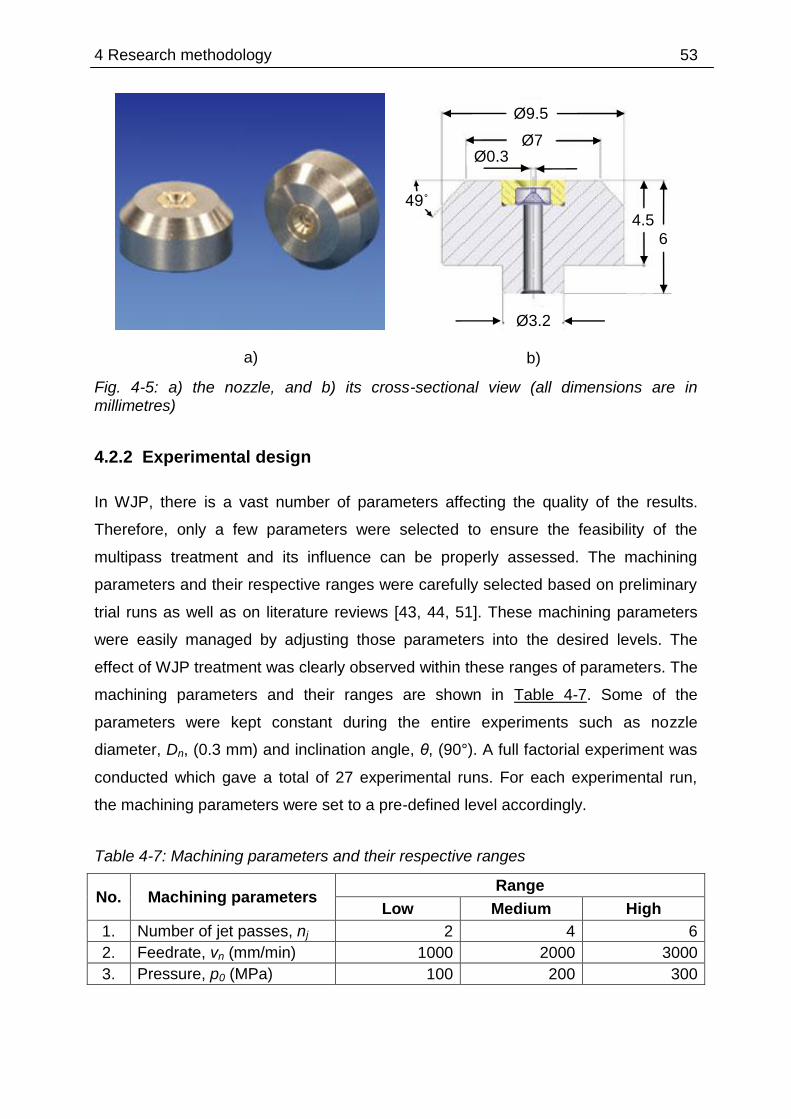
4 Research methodology 53
Fig. 4-5: a) the nozzle, and b) its cross-sectional view (all dimensions are in millimetres)
4.2.2 Experimental design
In WJP, there is a vast number of parameters affecting the quality of the results.
Therefore, only a few parameters were selected to ensure the feasibility of the
multipass treatment and its influence can be properly assessed. The machining
parameters and their respective ranges were carefully selected based on preliminary
trial runs as well as on literature reviews [43, 44, 51]. These machining parameters
were easily managed by adjusting those parameters into the desired levels. The
effect of WJP treatment was clearly observed within these ranges of parameters. The
machining parameters and their ranges are shown in Table 4-7. Some of the
parameters were kept constant during the entire experiments such as nozzle
diameter, Dn, (0.3 mm) and inclination angle, θ, (90°). A full factorial experiment was
conducted which gave a total of 27 experimental runs. For each experimental run,
the machining parameters were set to a pre-defined level accordingly.
Table 4-7: Machining parameters and their respective ranges
No. Machining parameters Range
Low Medium High
1. Number of jet passes, nj 2 4 6
2. Feedrate, vn (mm/min) 1000 2000 3000
3. Pressure, p0 (MPa) 100 200 300
a) b)
Ø9.5
Ø7
Ø3.2
6 4.5
49˚
Ø0.3
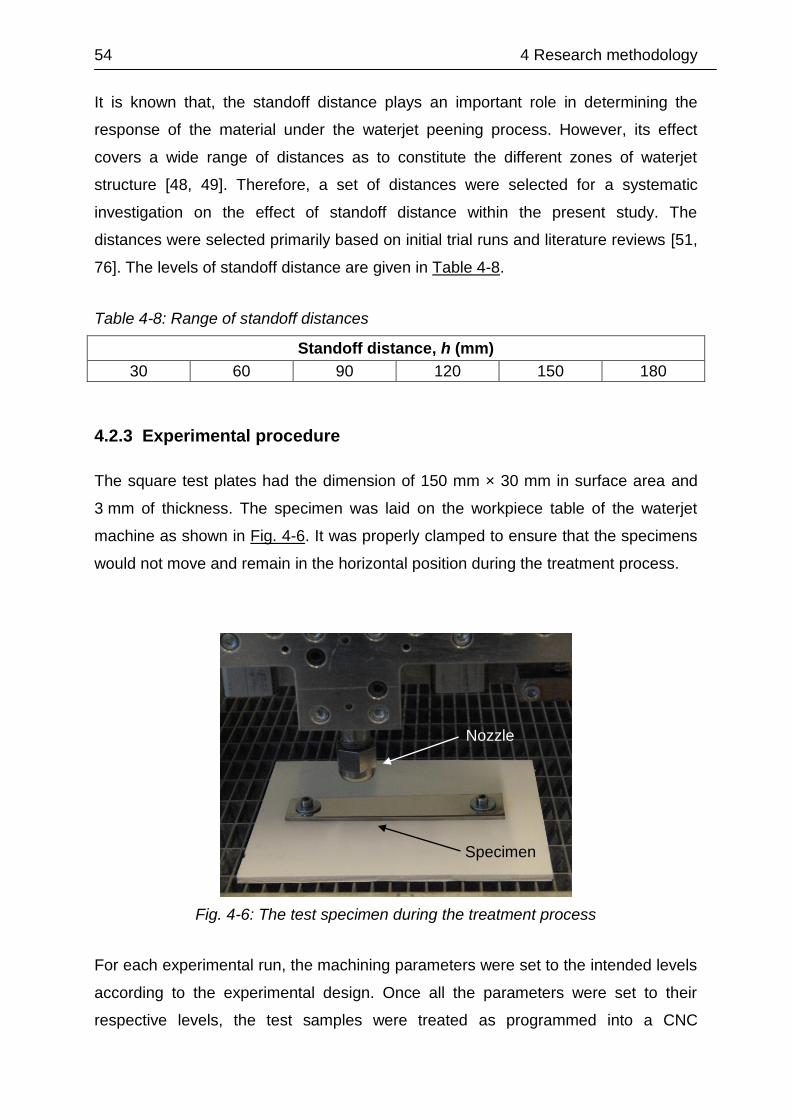
54 4 Research methodology
It is known that, the standoff distance plays an important role in determining the
response of the material under the waterjet peening process. However, its effect
covers a wide range of distances as to constitute the different zones of waterjet
structure [48, 49]. Therefore, a set of distances were selected for a systematic
investigation on the effect of standoff distance within the present study. The
distances were selected primarily based on initial trial runs and literature reviews [51,
76]. The levels of standoff distance are given in Table 4-8.
Table 4-8: Range of standoff distances
Standoff distance, h (mm)
30 60 90 120 150 180
4.2.3 Experimental procedure
The square test plates had the dimension of 150 mm × 30 mm in surface area and
3 mm of thickness. The specimen was laid on the workpiece table of the waterjet
machine as shown in Fig. 4-6. It was properly clamped to ensure that the specimens
would not move and remain in the horizontal position during the treatment process.
Fig. 4-6: The test specimen during the treatment process
For each experimental run, the machining parameters were set to the intended levels
according to the experimental design. Once all the parameters were set to their
respective levels, the test samples were treated as programmed into a CNC
Nozzle
Specimen
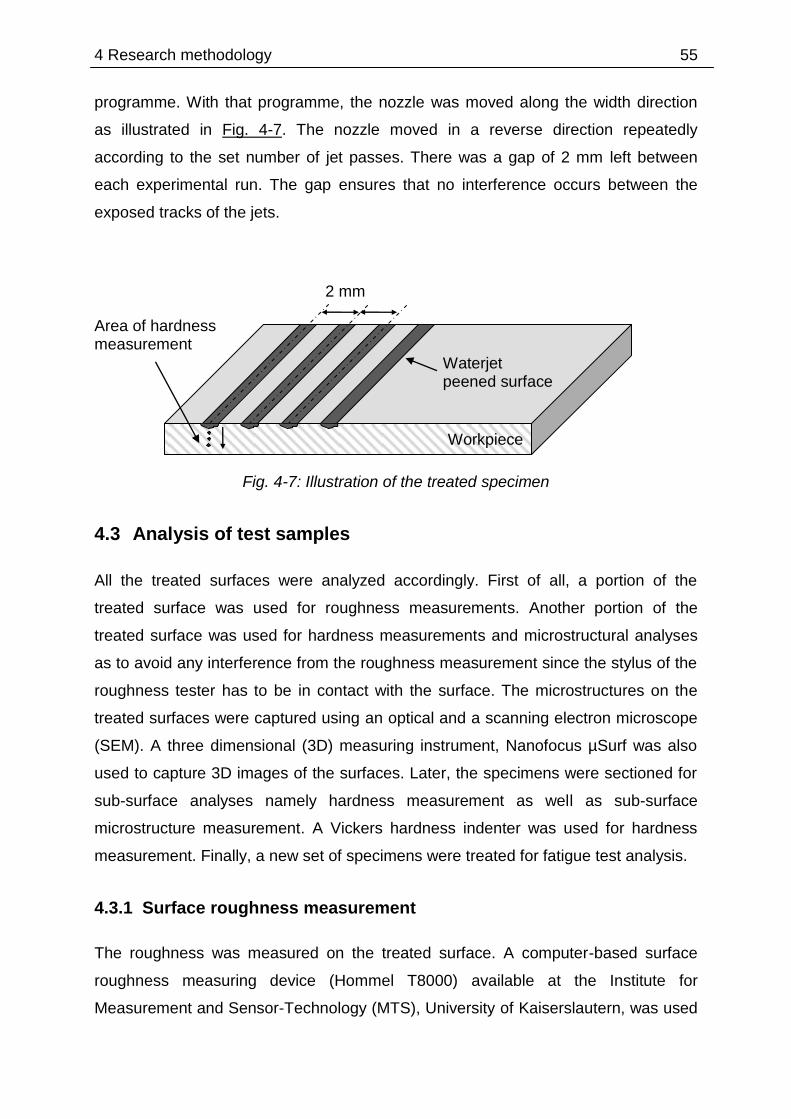
4 Research methodology 55
programme. With that programme, the nozzle was moved along the width direction
as illustrated in Fig. 4-7. The nozzle moved in a reverse direction repeatedly
according to the set number of jet passes. There was a gap of 2 mm left between
each experimental run. The gap ensures that no interference occurs between the
exposed tracks of the jets.
Fig. 4-7: Illustration of the treated specimen
4.3 Analysis of test samples
All the treated surfaces were analyzed accordingly. First of all, a portion of the
treated surface was used for roughness measurements. Another portion of the
treated surface was used for hardness measurements and microstructural analyses
as to avoid any interference from the roughness measurement since the stylus of the
roughness tester has to be in contact with the surface. The microstructures on the
treated surfaces were captured using an optical and a scanning electron microscope
(SEM). A three dimensional (3D) measuring instrument, Nanofocus µSurf was also
used to capture 3D images of the surfaces. Later, the specimens were sectioned for
sub-surface analyses namely hardness measurement as well as sub-surface
microstructure measurement. A Vickers hardness indenter was used for hardness
measurement. Finally, a new set of specimens were treated for fatigue test analysis.
4.3.1 Surface roughness measurement
The roughness was measured on the treated surface. A computer-based surface
roughness measuring device (Hommel T8000) available at the Institute for
Measurement and Sensor-Technology (MTS), University of Kaiserslautern, was used
2 mm
Workpiece
Waterjet peened surface
Area of hardness measurement
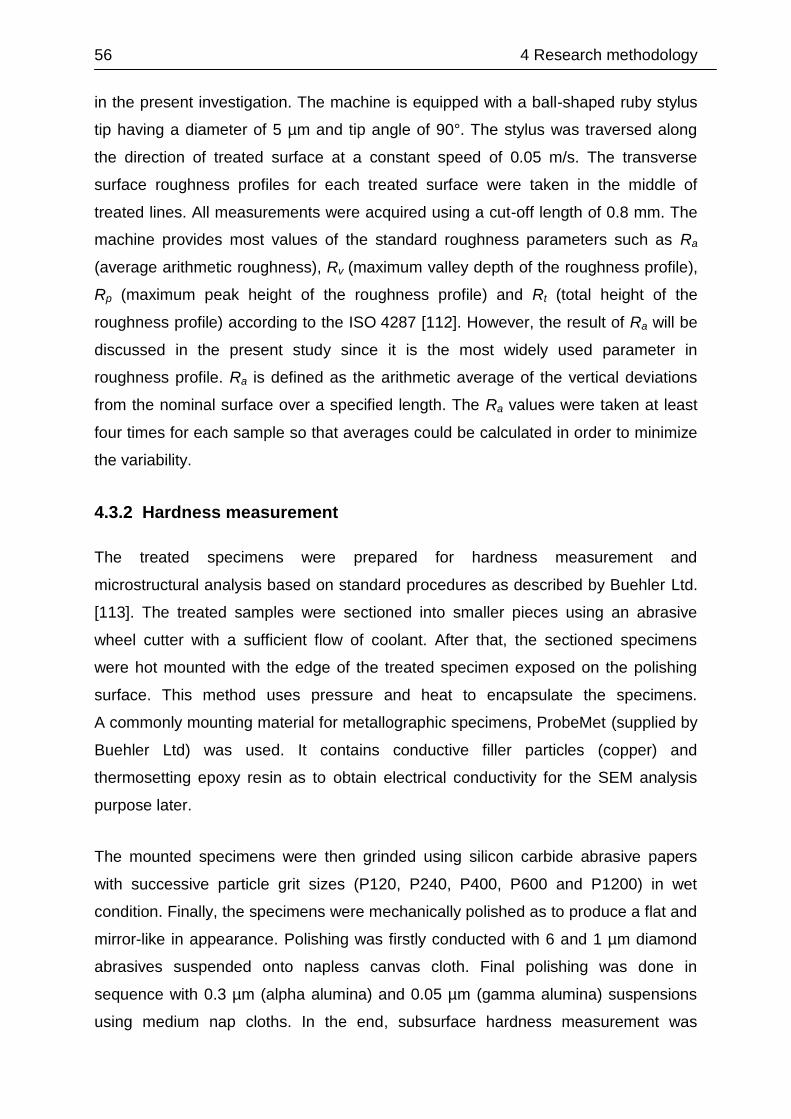
56 4 Research methodology
in the present investigation. The machine is equipped with a ball-shaped ruby stylus
tip having a diameter of 5 µm and tip angle of 90°. The stylus was traversed along
the direction of treated surface at a constant speed of 0.05 m/s. The transverse
surface roughness profiles for each treated surface were taken in the middle of
treated lines. All measurements were acquired using a cut-off length of 0.8 mm. The
machine provides most values of the standard roughness parameters such as Ra
(average arithmetic roughness), Rv (maximum valley depth of the roughness profile),
Rp (maximum peak height of the roughness profile) and Rt (total height of the
roughness profile) according to the ISO 4287 [112]. However, the result of Ra will be
discussed in the present study since it is the most widely used parameter in
roughness profile. Ra is defined as the arithmetic average of the vertical deviations
from the nominal surface over a specified length. The Ra values were taken at least
four times for each sample so that averages could be calculated in order to minimize
the variability.
4.3.2 Hardness measurement
The treated specimens were prepared for hardness measurement and
microstructural analysis based on standard procedures as described by Buehler Ltd.
[113]. The treated samples were sectioned into smaller pieces using an abrasive
wheel cutter with a sufficient flow of coolant. After that, the sectioned specimens
were hot mounted with the edge of the treated specimen exposed on the polishing
surface. This method uses pressure and heat to encapsulate the specimens.
A commonly mounting material for metallographic specimens, ProbeMet (supplied by
Buehler Ltd) was used. It contains conductive filler particles (copper) and
thermosetting epoxy resin as to obtain electrical conductivity for the SEM analysis
purpose later.
The mounted specimens were then grinded using silicon carbide abrasive papers
with successive particle grit sizes (P120, P240, P400, P600 and P1200) in wet
condition. Finally, the specimens were mechanically polished as to produce a flat and
mirror-like in appearance. Polishing was firstly conducted with 6 and 1 µm diamond
abrasives suspended onto napless canvas cloth. Final polishing was done in
sequence with 0.3 µm (alpha alumina) and 0.05 µm (gamma alumina) suspensions
using medium nap cloths. In the end, subsurface hardness measurement was

4 Research methodology 57
conducted on the polished specimens using a computer-controlled Buehler OmniMet
MHT hardness tester available at the Institute for Manufacturing Technology and
Production Systems, University of Kaiserslautern. The Vickers hardness was
obtained as a function of depth with 10 gf load over a 15 s indentation period. An
average of at least four hardness data was recorded at every depth. It was acquired
on the cross-section of the specimen at different depths starting from roughly 25 µm
beneath the eroded surface as shown in Fig. 4-8. The measurements were continued
at 10 different depths until a far distance of 1000 µm (i.e. 25, 50, 75, 100, 150, 200,
300, 500, 750 and 1000 µm).
Fig. 4-8: Hardness measurement on a cross-sectioned specimen
4.3.3 Microstructural analysis
A microstructural analysis is divided into two parts. A scanning electron microscope
was used to characterize both the surface and the sub-surface microstructures. A
Philips - XL 40 scanning electron microscope available at the MTS Institute, was
used with an accelerating voltage of 20 kV. A secondary electron image (SEI) was
primarily employed for the characterization of the microstructures. The image
magnifications were adjusted accordingly as to capture both macro and micro scales
of the microstructures. While, a non-contact optical 3D measurement (Nanofocus
μSurf) explorer also available at the MTS Institute, was used for the measurement
and analysis of surfaces. The 3D structures of the surfaces were acquired using a
10× objective lens which covered a measuring field of about 1600 µm × 1600 µm.
50 µm
70 µm 25
µm 25
µm 25
µm 25
µm

58 4 Research methodology
The specimens from the hardness measurement were reused for the sub-surface
microstructure investigation. However, the specimens were prepared again as to
avoid the effect of material deformation from the hardness indentation. After final
polishing of the specimens, etching was conducted using the recommended chemical
solutions. Etching is mainly conducted to reveal particular structural characteristics of
metals. V2A etchant (supplied by Buehler Ltd.) was used to etch the polished
specimens of austenitic stainless steel 304. It was done by immersing the specimens
in the solution for about 30 seconds at 50° C. While, for carbon steel 1045, the most
common etchant, 3% Nital (also supplied by Buehler Ltd.) was used. The specimens
were immersed in the solution for duration about 50 seconds at room temperature.
4.4 Fatigue test
The final test was conducted to analyze the fatigue performance after treatment
under different waterjet peening conditions. Its objective is to measure the
effectiveness of the waterjet peening process in improving the fatigue strength of the
metallic samples. Due to some constraints, only the austenitic stainless steel 304 and
the aluminium alloy 5005 were used for the fatigue test. Though the fatigue
performance for the other material (i.e. carbon steel 1045) is not expected to be the
same, it is believed that the general trend of the results may somehow show a
similarity under the waterjet peening treatment. Furthermore, the fatigue test results
for the same materials under other peening processes from the work of previous
researchers are reported in Chapter 5.4.
The fatigue test specimens were prepared according to the dimensions as shown in
Fig. 4-9 (a). The plate has a thickness of 3 mm. Three different conditions were used
in the waterjet treatment of the fatigue specimens. The conditions were selected
based on three different numbers of jet passes i.e. 2, 4 and 6. The rest of the
parameters were kept constant i.e. pressure = 200 MPa, feedrate = 2000 mm/min,
nozzle diameter = 0.3 mm and standoff distance = 30 mm. The waterjet peening was
conducted on both sides of the specimens in the region where it experienced the
highest stress (i.e. in the middle of the specimen) up to a length of 15 mm as shown
in Fig. 4-9 (b). The effective coverage width of waterjet peening on the surface was
about 0.4 mm. Therefore, for a complete coverage of the surface, the nozzle was
moved in a gap distance of 0.4 mm over the length of 15 mm. A minimum of 14
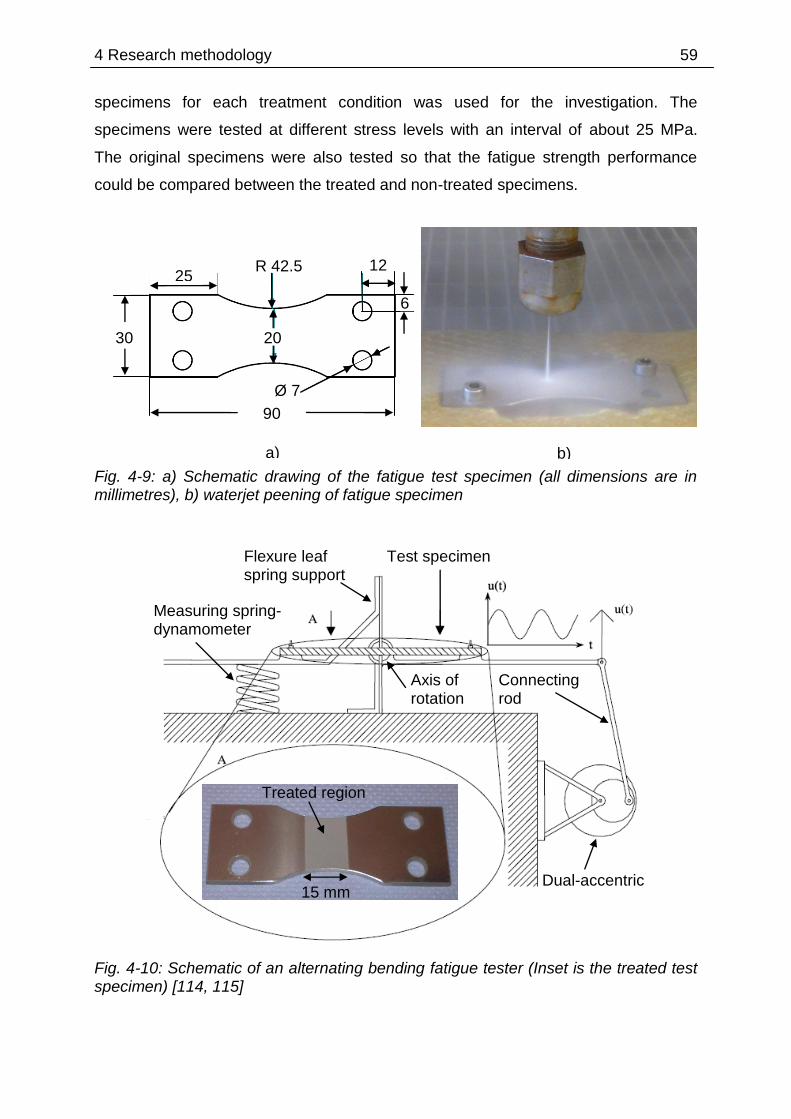
4 Research methodology 59
specimens for each treatment condition was used for the investigation. The
specimens were tested at different stress levels with an interval of about 25 MPa.
The original specimens were also tested so that the fatigue strength performance
could be compared between the treated and non-treated specimens.
Fig. 4-9: a) Schematic drawing of the fatigue test specimen (all dimensions are in millimetres), b) waterjet peening of fatigue specimen
Fig. 4-10: Schematic of an alternating bending fatigue tester (Inset is the treated test specimen) [114, 115]
Treated region
15 mm
Measuring spring-dynamometer
Dual-accentric
Test specimen
Axis of rotation
Connecting rod
Flexure leaf spring support
b) a)
90
30 20
25 R 42.5 12
Ø 7
6

60 4 Research methodology
The fatigue tests were conducted at room temperature on an alternating bending
fatigue test machine type PWO (manufactured by Schenck GbmH) available at the
Working Group of Material Testing, University of Kaiserslautern. It is an alternating
bending fatigue machine which is able to perform dynamic fatigue test in accordance
with the German standard DIN 50142 [114]. The machine displacement is controlled
through a crank-linkage mechanism as illustrated in Fig. 4-10. This produces a
sinusoidal waveform with a frequency of 23 Hz. The test was conducted at various
bending stress levels. The test was continuously run up to failure or 10 × 106 cycles,
depending on whichever occurred first. The fatigue life responses of the treated and
non-treated specimens were achieved by plotting the number of cycles to failure
versus the maximum applied bending stress. Later, the fracture surfaces of the
specimens were examined using SEM to characterize the failure features.
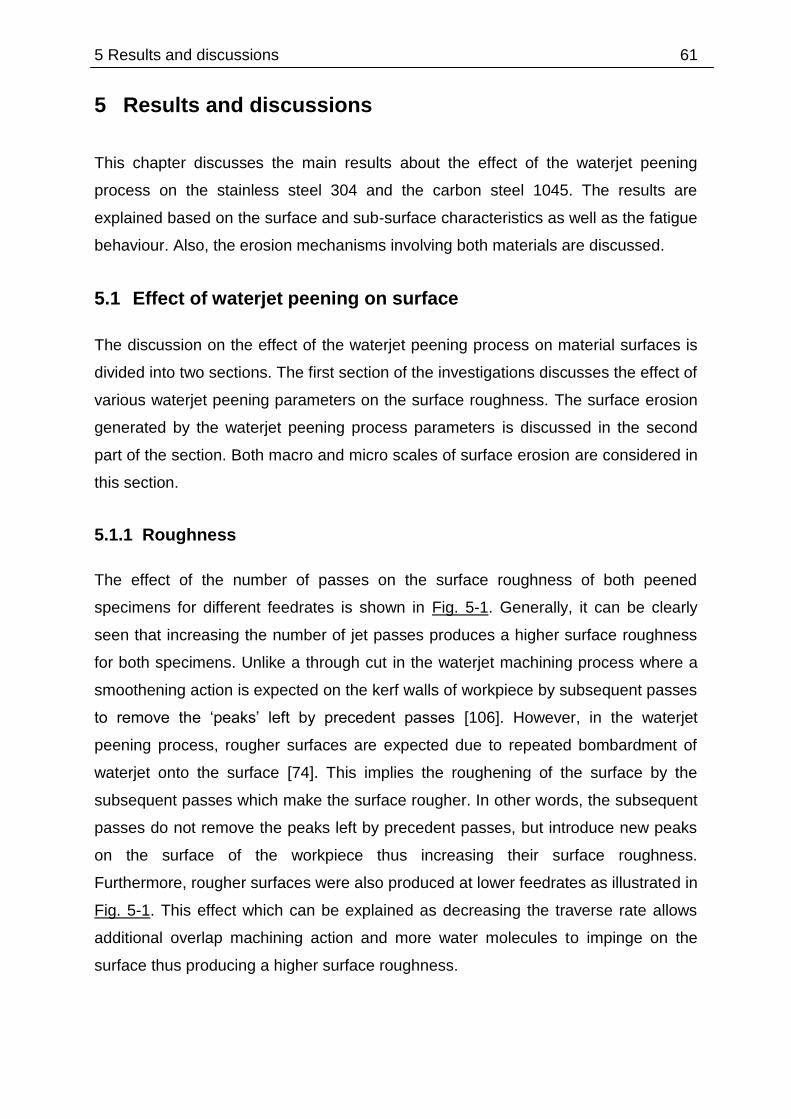
5 Results and discussions 61
5 Results and discussions
This chapter discusses the main results about the effect of the waterjet peening
process on the stainless steel 304 and the carbon steel 1045. The results are
explained based on the surface and sub-surface characteristics as well as the fatigue
behaviour. Also, the erosion mechanisms involving both materials are discussed.
5.1 Effect of waterjet peening on surface
The discussion on the effect of the waterjet peening process on material surfaces is
divided into two sections. The first section of the investigations discusses the effect of
various waterjet peening parameters on the surface roughness. The surface erosion
generated by the waterjet peening process parameters is discussed in the second
part of the section. Both macro and micro scales of surface erosion are considered in
this section.
5.1.1 Roughness
The effect of the number of passes on the surface roughness of both peened
specimens for different feedrates is shown in Fig. 5-1. Generally, it can be clearly
seen that increasing the number of jet passes produces a higher surface roughness
for both specimens. Unlike a through cut in the waterjet machining process where a
smoothening action is expected on the kerf walls of workpiece by subsequent passes
to remove the ‘peaks’ left by precedent passes [106]. However, in the waterjet
peening process, rougher surfaces are expected due to repeated bombardment of
waterjet onto the surface [74]. This implies the roughening of the surface by the
subsequent passes which make the surface rougher. In other words, the subsequent
passes do not remove the peaks left by precedent passes, but introduce new peaks
on the surface of the workpiece thus increasing their surface roughness.
Furthermore, rougher surfaces were also produced at lower feedrates as illustrated in
Fig. 5-1. This effect which can be explained as decreasing the traverse rate allows
additional overlap machining action and more water molecules to impinge on the
surface thus producing a higher surface roughness.

62 5 Results and discussions
Fig. 5-1: Effect of number of passes on surface roughness for different feedrates at a pressure of 200 MPa and a standoff distance of 30 mm (Stainless steel 304 and carbon steel 1045 are represented by solid and dashed lines respectively)
The effect of the number of passes on the surface roughness for different pressures
is shown in Fig. 5-2. It is obvious that the effect of the number of passes shows a
similar trend like the previous case where a higher number of jet passes results in a
rougher surface. Furthermore, it is clear that the surface roughness increases with an
increase in the water supply pressure as illustrated in the diagram. It is known that
the water supply pressure is directly proportional to the impingement velocity of the
water droplet [116]. Therefore, it can be anticipated that a higher water supply
pressure increases the kinetic energy of the water molecules and enhances their
capability for material removal thus increasing the surface roughness. In comparison
with Arola et al. [68], but utilizing a single pass treatment in abrasiveless WJP of a
pure titanium and titanium alloy (Ti6Al4V), they found only a mild increase in surface
roughness with an increase in WJP pressure. This is also true for the present case
but only at a minimum of 2 jet passes as shown in the diagram. At a higher number
of jet passes, there are significant changes of surface roughness for different
pressures.
Number of passes
2 4 6
15
12
9
6
3
0
1000 mm/min (304)
1000 mm/min (1045)
2000 mm/min (304)
2000 mm/min (1045)
3000 mm/min (304)
3000 mm/min (1045) A
ve
rage
su
rface
roug
hn
ess (
µm
)
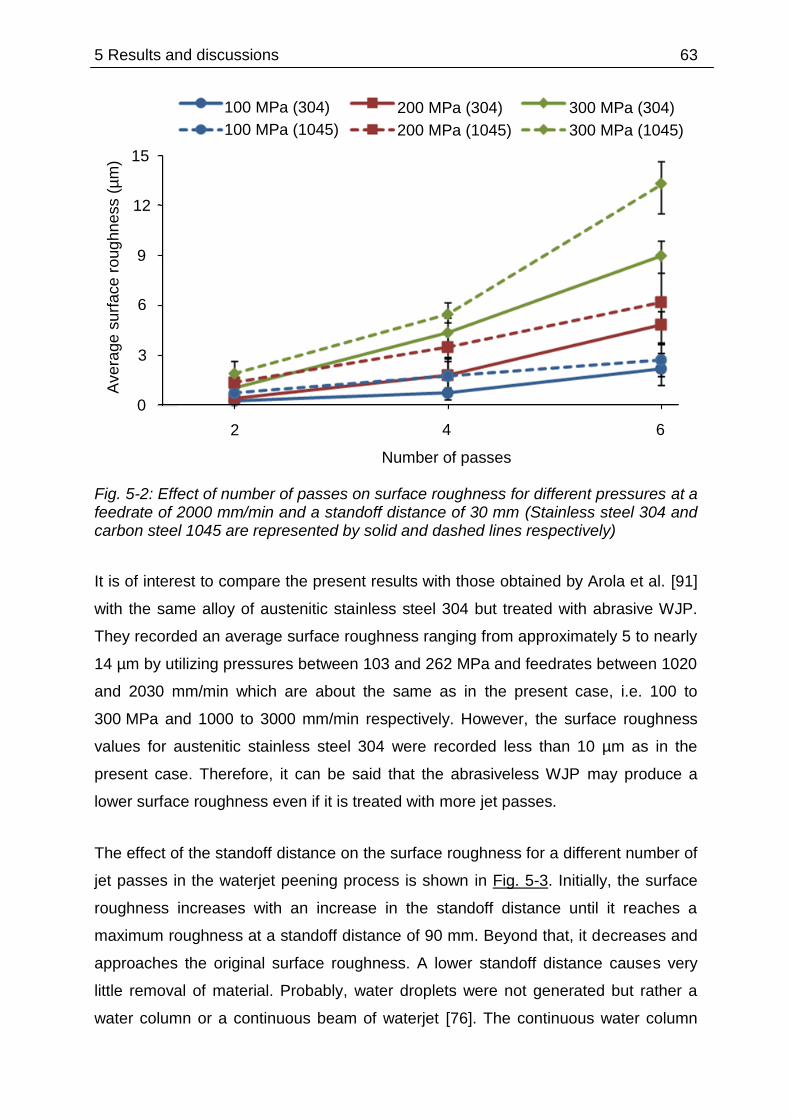
5 Results and discussions 63
Fig. 5-2: Effect of number of passes on surface roughness for different pressures at a feedrate of 2000 mm/min and a standoff distance of 30 mm (Stainless steel 304 and carbon steel 1045 are represented by solid and dashed lines respectively)
It is of interest to compare the present results with those obtained by Arola et al. [91]
with the same alloy of austenitic stainless steel 304 but treated with abrasive WJP.
They recorded an average surface roughness ranging from approximately 5 to nearly
14 µm by utilizing pressures between 103 and 262 MPa and feedrates between 1020
and 2030 mm/min which are about the same as in the present case, i.e. 100 to
300 MPa and 1000 to 3000 mm/min respectively. However, the surface roughness
values for austenitic stainless steel 304 were recorded less than 10 µm as in the
present case. Therefore, it can be said that the abrasiveless WJP may produce a
lower surface roughness even if it is treated with more jet passes.
The effect of the standoff distance on the surface roughness for a different number of
jet passes in the waterjet peening process is shown in Fig. 5-3. Initially, the surface
roughness increases with an increase in the standoff distance until it reaches a
maximum roughness at a standoff distance of 90 mm. Beyond that, it decreases and
approaches the original surface roughness. A lower standoff distance causes very
little removal of material. Probably, water droplets were not generated but rather a
water column or a continuous beam of waterjet [76]. The continuous water column
Number of passes
2 4 6
Ave
rage
su
rface
roug
hn
ess (
µm
) 15
12
9
6
3
0
100 MPa (304)
100 MPa (1045)
200 MPa (304)
200 MPa (1045)
300 MPa (304)
300 MPa (1045)
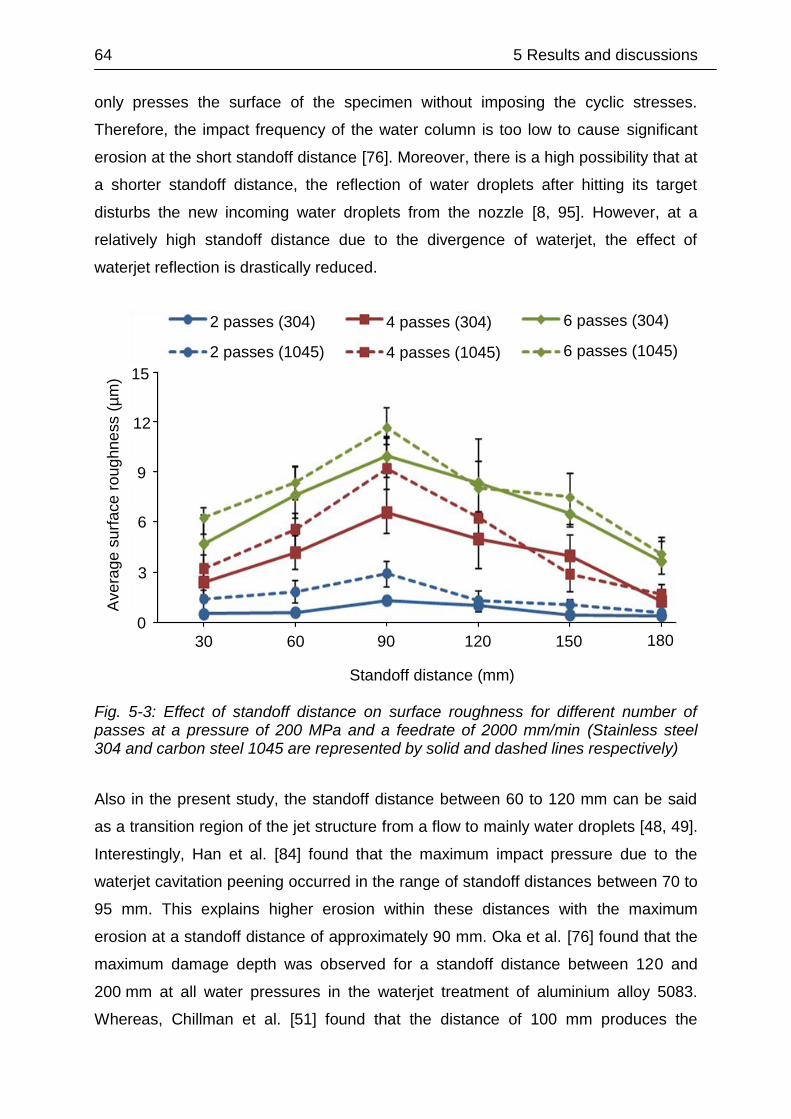
64 5 Results and discussions
only presses the surface of the specimen without imposing the cyclic stresses.
Therefore, the impact frequency of the water column is too low to cause significant
erosion at the short standoff distance [76]. Moreover, there is a high possibility that at
a shorter standoff distance, the reflection of water droplets after hitting its target
disturbs the new incoming water droplets from the nozzle [8, 95]. However, at a
relatively high standoff distance due to the divergence of waterjet, the effect of
waterjet reflection is drastically reduced.
Fig. 5-3: Effect of standoff distance on surface roughness for different number of passes at a pressure of 200 MPa and a feedrate of 2000 mm/min (Stainless steel 304 and carbon steel 1045 are represented by solid and dashed lines respectively)
Also in the present study, the standoff distance between 60 to 120 mm can be said
as a transition region of the jet structure from a flow to mainly water droplets [48, 49].
Interestingly, Han et al. [84] found that the maximum impact pressure due to the
waterjet cavitation peening occurred in the range of standoff distances between 70 to
95 mm. This explains higher erosion within these distances with the maximum
erosion at a standoff distance of approximately 90 mm. Oka et al. [76] found that the
maximum damage depth was observed for a standoff distance between 120 and
200 mm at all water pressures in the waterjet treatment of aluminium alloy 5083.
Whereas, Chillman et al. [51] found that the distance of 100 mm produces the
30 60 90 120 180 150
Standoff distance (mm)
Ave
rage
su
rface
roug
hn
ess (
µm
) 15
12
9
6
3
0
2 passes (304)
2 passes (1045)
4 passes (304)
4 passes (1045)
6 passes (304)
6 passes (1045)

5 Results and discussions 65
highest erosion in the waterjet surface processing of the titanium alloy Ti6Al4V.
A further increase in standoff distance results in a lower surface roughness. This is
said to be the final region of waterjet structures where there is a noticeable decrease
in the droplet velocities as the droplets break up into finer ones. Within this region,
the jet has dissipated most of the energy to effectively modify the features of material
thus lowering the amount of surface erosion.
It is also interesting to note that the effects of feedrate and pressure in the surface
roughness are more prominent at a higher number of jet passes. As shown in
Fig. 5-1 to Fig. 5-3, there are significant changes of surface roughness at a higher
number of jet passes for different feedrates, pressures and standoff distances
respectively. It is possible that during the initial jet passes, the impact of the jet only
resulted in initiating some cracks without significantly sheared the material at the
surface. The cracks did not considerably change the value of roughness since most
materials were not removed. However, at subsequent jet passes, besides initiating
some new cracks, the previous cracks might easily propagate leading to removal of
more fragments of material. As a result, a noticeable increase in roughness could be
observed since most materials at the surface were removed. Furthermore, in the
cavitation erosion test, the erosion rates typically exhibit two different regimes based
on the cavitation exposure time [117]. The erosion rate is almost negligible within the
first regime or the incubation period. While, there is an accelerated erosion rate
within the second regime. It is to note that a lower number of jet passes represents a
lower exposure time. Beyond that, there were accelerated surface erosion
particularly at the highest number of jet passes which constituted the highest
exposure time. Based on the surface roughness, it can be suggested that 2 - 4 jet
passes is the incubation period of the surface erosion in the present study.
Furthermore, Oka et al. [76] reported that the incubation period decreases with an
increase in water pressure. It means that the slope of the surface roughness
increases rapidly with an increase in water pressure as shown in Fig. 5-2.
5.1.2 Erosion
A further analysis of the peened surfaces is based on SEM images. A lower
magnification of SEM images was used so that macroscale erosion of jet tracks could
be observed. The SEM images were taken at a magnification of about 70 times. The

66 5 Results and discussions
erosion tracks on the austenitic stainless steel 304 workpiece surface produced by
different feedrates are shown in Fig. 5-4 to Fig. 5-6. The arrows indicate the direction
of the jet nozzle feedrate. It is clear that the erosion decreases with an increase in
the nozzle feedrate.
Fig. 5-4: Erosion tracks of austenitic stainless steel 304 for different number of passes, a) 2 passes, b) 4 passes and c) 6 passes, at a feedrate of 1000 mm/min, a pressure of 200 MPa and a standoff distance of 30 mm
Fig. 5-5: Erosion tracks of austenitic stainless steel 304 for different number of passes, a) 2 passes, b) 4 passes and c) 6 passes, at a feedrate of 2000 mm/min, a pressure of 200 MPa and a standoff distance of 30 mm
Fig. 5-6: Erosion tracks of austenitic stainless steel 304 for different number of passes, a) 2 passes, b) 4 passes and c) 6 passes, at a feedrate of 3000 mm/min, a pressure of 200 MPa and a standoff distance of 30 mm
At higher feedrates, there exists limited erosion with small isolated pockets as shown
in Fig. 5-5 and Fig. 5-6. Moreover, the erosion tracks were discontinuous and almost
negligible particularly for erosion tracks at a higher feedrate and a lower number of
a)
500 µm
c)
500 µm
850 µm
b)
500 µm
a)
500 µm
c)
500 µm
850 µm
b)
500 µm
a)
500 µm
c)
500 µm
850 µm
b)
500 µm
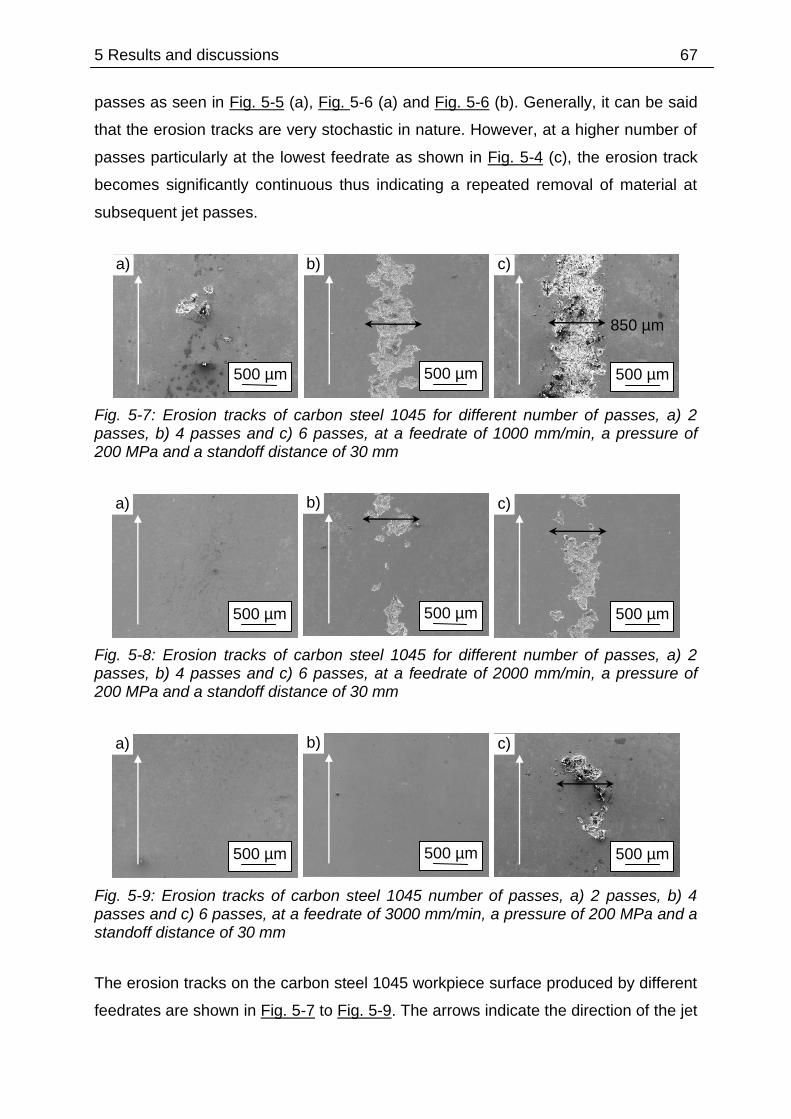
5 Results and discussions 67
passes as seen in Fig. 5-5 (a), Fig. 5-6 (a) and Fig. 5-6 (b). Generally, it can be said
that the erosion tracks are very stochastic in nature. However, at a higher number of
passes particularly at the lowest feedrate as shown in Fig. 5-4 (c), the erosion track
becomes significantly continuous thus indicating a repeated removal of material at
subsequent jet passes.
Fig. 5-7: Erosion tracks of carbon steel 1045 for different number of passes, a) 2 passes, b) 4 passes and c) 6 passes, at a feedrate of 1000 mm/min, a pressure of 200 MPa and a standoff distance of 30 mm
Fig. 5-8: Erosion tracks of carbon steel 1045 for different number of passes, a) 2 passes, b) 4 passes and c) 6 passes, at a feedrate of 2000 mm/min, a pressure of 200 MPa and a standoff distance of 30 mm
Fig. 5-9: Erosion tracks of carbon steel 1045 number of passes, a) 2 passes, b) 4 passes and c) 6 passes, at a feedrate of 3000 mm/min, a pressure of 200 MPa and a standoff distance of 30 mm
The erosion tracks on the carbon steel 1045 workpiece surface produced by different
feedrates are shown in Fig. 5-7 to Fig. 5-9. The arrows indicate the direction of the jet
a)
500 µm
b)
500 µm
c)
500 µm
a)
500 µm
b)
500 µm
c)
500 µm
a)
500 µm
b)
500 µm
c)
850 µm
500 µm
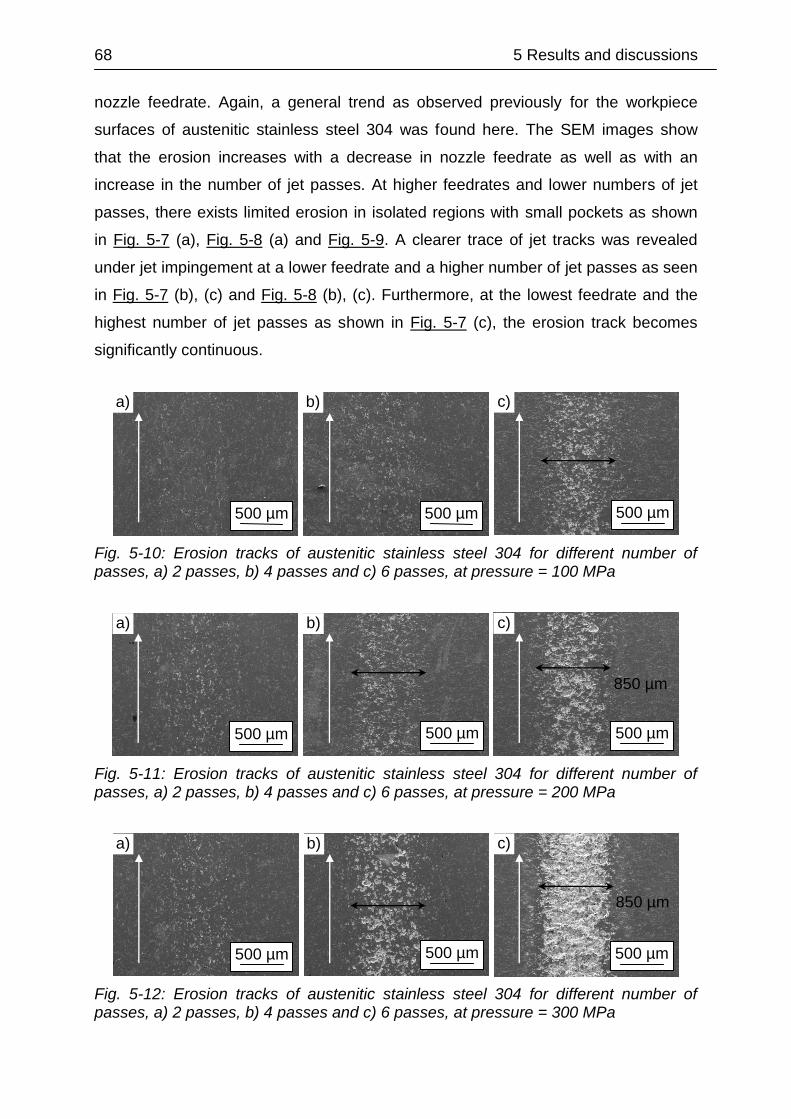
68 5 Results and discussions
nozzle feedrate. Again, a general trend as observed previously for the workpiece
surfaces of austenitic stainless steel 304 was found here. The SEM images show
that the erosion increases with a decrease in nozzle feedrate as well as with an
increase in the number of jet passes. At higher feedrates and lower numbers of jet
passes, there exists limited erosion in isolated regions with small pockets as shown
in Fig. 5-7 (a), Fig. 5-8 (a) and Fig. 5-9. A clearer trace of jet tracks was revealed
under jet impingement at a lower feedrate and a higher number of jet passes as seen
in Fig. 5-7 (b), (c) and Fig. 5-8 (b), (c). Furthermore, at the lowest feedrate and the
highest number of jet passes as shown in Fig. 5-7 (c), the erosion track becomes
significantly continuous.
Fig. 5-10: Erosion tracks of austenitic stainless steel 304 for different number of passes, a) 2 passes, b) 4 passes and c) 6 passes, at pressure = 100 MPa
Fig. 5-11: Erosion tracks of austenitic stainless steel 304 for different number of passes, a) 2 passes, b) 4 passes and c) 6 passes, at pressure = 200 MPa
Fig. 5-12: Erosion tracks of austenitic stainless steel 304 for different number of passes, a) 2 passes, b) 4 passes and c) 6 passes, at pressure = 300 MPa
a)
500 µm
c)
500 µm
850 µm
b)
500 µm
a)
500 µm
c)
500 µm
850 µm
b)
500 µm
a)
500 µm
b)
500 µm
c)
500 µm

5 Results and discussions 69
The erosion tracks on the austenitic stainless steel 304 workpiece surface produced
by different pressures are shown in Fig. 5-10 to Fig. 5-12. The arrows indicate the
direction of the jet nozzle feedrate. From the figures, it is clear that the erosion
increases with an increase in the water pressure. At lower pressures, there exists
limited erosion with small isolated pockets as shown in Fig. 5-10 and Fig. 5-11.
Moreover, the erosion tracks were discontinuous and almost negligible particularly for
erosion tracks at a lower pressure and number of passes as seen in Fig. 5-10 (a), (b)
and Fig. 5-11 (a). The erosion tracks are also very stochastic in nature. However, the
erosion track becomes significantly continuous at the highest number of jet passes
and the highest pressure as shown in Fig. 5-12 (c), thus indicating a higher energy of
jet as well as a repeated action of material removal at subsequent jet passes.
The erosion tracks of ferritic steel 1045 subjected to waterjet treatment at different
pressures are shown in Fig. 5-13 to Fig. 5-15. The arrows indicate the direction of the
jet nozzle feedrate. Overall, all surfaces examined show different degrees of
damage. It is obvious that the pressure as well as the number of jet passes
demonstrate a similar effect on the surface erosion as seen in the waterjet peening of
austenitic stainless steel 304. The erosion increases with an increase in the water
pressure and also the number of jet passes.
Furthermore, it is to notice that every surface micrograph treated with 2 jet passes
regardless of feedrates and pressures produces a very small amount of erosion. Also
the value of surface roughness is very low with less than 3 µm in every case as
shown in Fig. 5-1 and Fig. 5-2. Almost all the original surfaces remain intact since the
erosion was inhomogeneous and discontinuous hence they were not detrimental to
the original surface. This shows that 2 jet passes may not really produce
considerable erosion to the surface in spite of different feedrates and pressures. This
indicates that in the present study a threshold number of jet passes for the material
erosion can be considered at about 2 jet passes. Also this can be said as the
incubation period of the surface erosion in the present study.

70 5 Results and discussions
Fig. 5-13: Erosion tracks of carbon steel 1045 for different number of passes, a) 2 passes, b) 4 passes and c) 6 passes, at a pressure of 100 MPa, a feedrate of 2000 mm/min and a standoff distance of 30 mm
Fig. 5-14: Erosion tracks of carbon steel 1045 for different number of passes, a) 2 passes, b) 4 passes and c) 6 passes, at a pressure of 200 MPa, a feedrate of 2000 mm/min and a standoff distance of 30 mm
Fig. 5-15: Erosion tracks of carbon steel 1045 for different number of passes, a) 2 passes, b) 4 passes and c) 6 passes, at a pressure of 300 MPa, a feedrate of 2000 mm/min and a standoff distance of 30 mm
As previously discussed, increasing the number of jet passes only increases the
surface roughness slightly for specimens treated at either higher feedrates or lower
pressures as illustrated in Fig. 5-1 and Fig. 5-2 respectively. Also, their surfaces
experience only minimal erosion with small craters as shown in Fig. 5-6 and Fig. 5-10
as well as Fig. 5-9 and Fig. 5-13 respectively for the stainless steel 304 and the
carbon steel 1045. This could be possibly due to the shock absorption of a water film
formed on the bottom of the crater from previous jet passes [76]. As a result, these
water films absorb the water impact from subsequent jet passes and minimize the
a)
500 µm
b)
500 µm
c)
850 µm
500 µm
a)
500 µm
b)
500 µm
c)
850 µm
500 µm
a)
500 µm
b)
500 µm
c)
500 µm
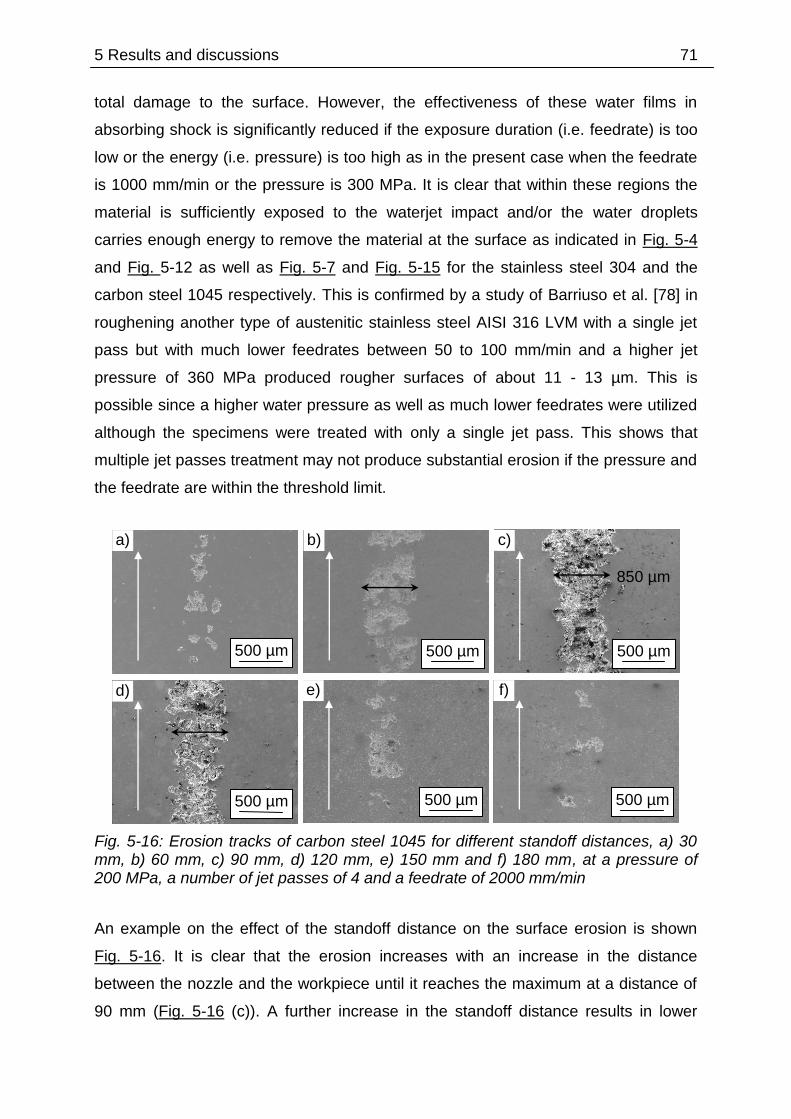
5 Results and discussions 71
total damage to the surface. However, the effectiveness of these water films in
absorbing shock is significantly reduced if the exposure duration (i.e. feedrate) is too
low or the energy (i.e. pressure) is too high as in the present case when the feedrate
is 1000 mm/min or the pressure is 300 MPa. It is clear that within these regions the
material is sufficiently exposed to the waterjet impact and/or the water droplets
carries enough energy to remove the material at the surface as indicated in Fig. 5-4
and Fig. 5-12 as well as Fig. 5-7 and Fig. 5-15 for the stainless steel 304 and the
carbon steel 1045 respectively. This is confirmed by a study of Barriuso et al. [78] in
roughening another type of austenitic stainless steel AISI 316 LVM with a single jet
pass but with much lower feedrates between 50 to 100 mm/min and a higher jet
pressure of 360 MPa produced rougher surfaces of about 11 - 13 µm. This is
possible since a higher water pressure as well as much lower feedrates were utilized
although the specimens were treated with only a single jet pass. This shows that
multiple jet passes treatment may not produce substantial erosion if the pressure and
the feedrate are within the threshold limit.
Fig. 5-16: Erosion tracks of carbon steel 1045 for different standoff distances, a) 30 mm, b) 60 mm, c) 90 mm, d) 120 mm, e) 150 mm and f) 180 mm, at a pressure of 200 MPa, a number of jet passes of 4 and a feedrate of 2000 mm/min
An example on the effect of the standoff distance on the surface erosion is shown
Fig. 5-16. It is clear that the erosion increases with an increase in the distance
between the nozzle and the workpiece until it reaches the maximum at a distance of
90 mm (Fig. 5-16 (c)). A further increase in the standoff distance results in lower
a)
500 µm
b)
500 µm
c)
500 µm
850 µm
500 µm
d)
500 µm
e)
500 µm
f)
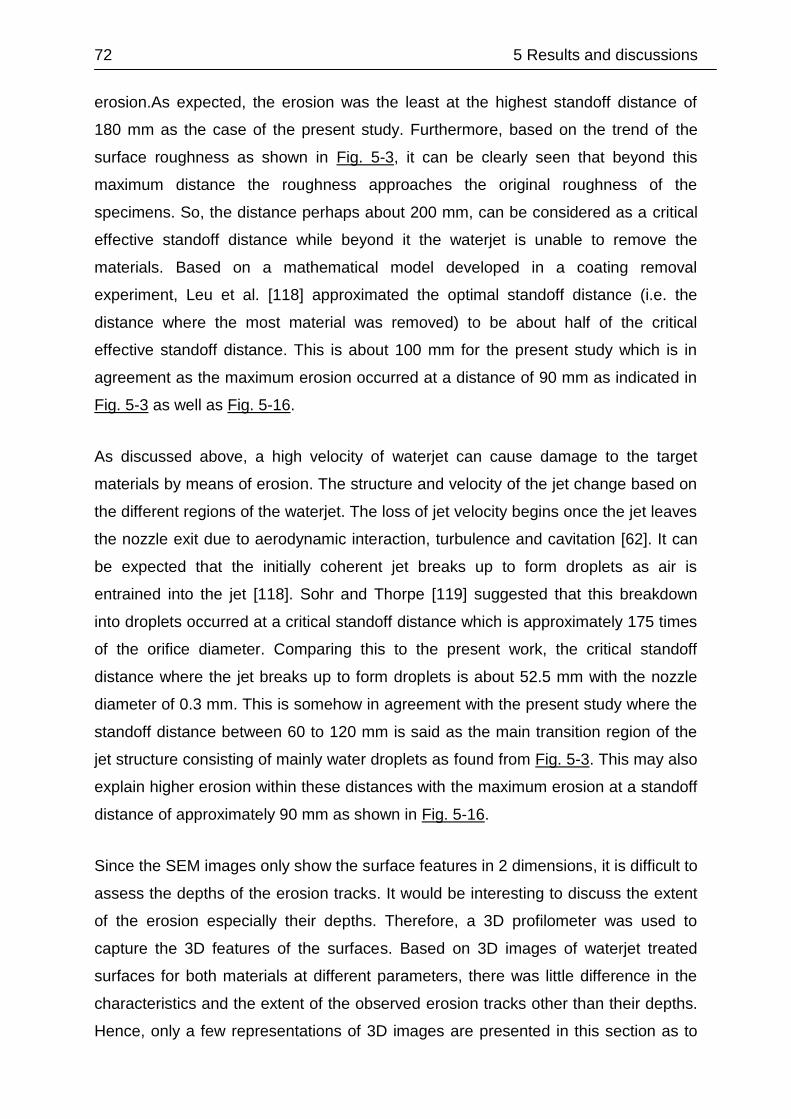
72 5 Results and discussions
erosion.As expected, the erosion was the least at the highest standoff distance of
180 mm as the case of the present study. Furthermore, based on the trend of the
surface roughness as shown in Fig. 5-3, it can be clearly seen that beyond this
maximum distance the roughness approaches the original roughness of the
specimens. So, the distance perhaps about 200 mm, can be considered as a critical
effective standoff distance while beyond it the waterjet is unable to remove the
materials. Based on a mathematical model developed in a coating removal
experiment, Leu et al. [118] approximated the optimal standoff distance (i.e. the
distance where the most material was removed) to be about half of the critical
effective standoff distance. This is about 100 mm for the present study which is in
agreement as the maximum erosion occurred at a distance of 90 mm as indicated in
Fig. 5-3 as well as Fig. 5-16.
As discussed above, a high velocity of waterjet can cause damage to the target
materials by means of erosion. The structure and velocity of the jet change based on
the different regions of the waterjet. The loss of jet velocity begins once the jet leaves
the nozzle exit due to aerodynamic interaction, turbulence and cavitation [62]. It can
be expected that the initially coherent jet breaks up to form droplets as air is
entrained into the jet [118]. Sohr and Thorpe [119] suggested that this breakdown
into droplets occurred at a critical standoff distance which is approximately 175 times
of the orifice diameter. Comparing this to the present work, the critical standoff
distance where the jet breaks up to form droplets is about 52.5 mm with the nozzle
diameter of 0.3 mm. This is somehow in agreement with the present study where the
standoff distance between 60 to 120 mm is said as the main transition region of the
jet structure consisting of mainly water droplets as found from Fig. 5-3. This may also
explain higher erosion within these distances with the maximum erosion at a standoff
distance of approximately 90 mm as shown in Fig. 5-16.
Since the SEM images only show the surface features in 2 dimensions, it is difficult to
assess the depths of the erosion tracks. It would be interesting to discuss the extent
of the erosion especially their depths. Therefore, a 3D profilometer was used to
capture the 3D features of the surfaces. Based on 3D images of waterjet treated
surfaces for both materials at different parameters, there was little difference in the
characteristics and the extent of the observed erosion tracks other than their depths.
Hence, only a few representations of 3D images are presented in this section as to
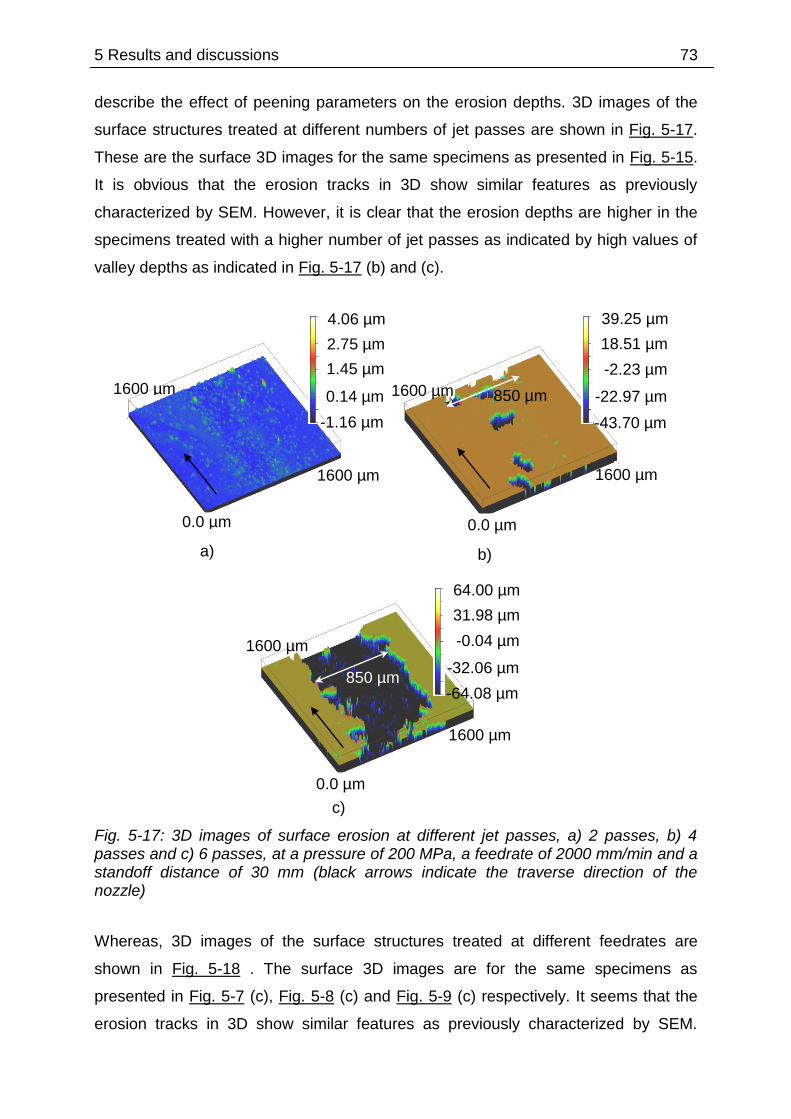
5 Results and discussions 73
describe the effect of peening parameters on the erosion depths. 3D images of the
surface structures treated at different numbers of jet passes are shown in Fig. 5-17.
These are the surface 3D images for the same specimens as presented in Fig. 5-15.
It is obvious that the erosion tracks in 3D show similar features as previously
characterized by SEM. However, it is clear that the erosion depths are higher in the
specimens treated with a higher number of jet passes as indicated by high values of
valley depths as indicated in Fig. 5-17 (b) and (c).
Fig. 5-17: 3D images of surface erosion at different jet passes, a) 2 passes, b) 4 passes and c) 6 passes, at a pressure of 200 MPa, a feedrate of 2000 mm/min and a standoff distance of 30 mm (black arrows indicate the traverse direction of the nozzle)
Whereas, 3D images of the surface structures treated at different feedrates are
shown in Fig. 5-18 . The surface 3D images are for the same specimens as
presented in Fig. 5-7 (c), Fig. 5-8 (c) and Fig. 5-9 (c) respectively. It seems that the
erosion tracks in 3D show similar features as previously characterized by SEM.
1600 µm
1600 µm
0.0 µm
4.06 µm
-1.16 µm
1.45 µm
0.14 µm
a)
2.75 µm
1600 µm
1600 µm
0.0 µm
39.25 µm
-43.70 µm
18.51 µm
-2.23 µm
-22.97 µm
b)
850 µm
1600 µm
0.0 µm
64.00 µm
-64.08 µm
31.98 µm
-0.04 µm
-32.06 µm
c)
1600 µm
850 µm
74 5 Results and discussions
Basically, the erosion becomes less continuous as the feedrate increases. It is
interesting to note that the depth of the valley are about the same for the specimen
treated at lower feedrates of 1000 and 2000 mm/min as shown in Fig. 5-18 (a) and
Fig. 5-18 (b) respectively. However, the high of the peak is higher for the specimen
treated with the lowest feedrate. Perhaps, this feature contributes to a higher value of
the roughness in the specimen treated with a lower feedrate. In addition, it is good to
note that the depth of the craters under waterjet impingement at particularly lower
feedrates may be the same but its erosion is not homogeneous over the treated
surface.
Fig. 5-18: 3D images of surface erosion at different feedrates, a) 1000 mm/min, b) 2000 mm/min c) 3000 mm/min, at a pressure of 200 MPa, a number of jet passes of 4 and a standoff distance of 30 mm (black arrows indicate the traverse direction of the nozzle)
3D images of the surface structures for the same specimens treated at different
pressures are shown in Fig. 5-19. The images were taken on the same erosion
1600 µm
1600 µm
0.0 µm
26.51 µm
-54.14 µm
6.35 µm
-13.81 µm
-33.98 µm
b)
850 µm
1600 µm
0.0 µm
22.11 µm
-39.09 µm
6.81 µm
-8.49 µm
-23.79 µm
c)
1600 µm
1600 µm
1600 µm
0.0 µm
33.75 µm
-53.74 µm
-10.00 µm
-31.87 µm
a)
11.87 µm
850 µm

5 Results and discussions 75
tracks as presented in Fig. 5-13 (c), Fig. 5-14 (c) and Fig. 5-15 (c) respectively.
Again, the erosion tracks in 3D show similar features as previously characterized by
SEM. Generally, the surface erosion is more continuous as the pressure increases.
Also, the erosion depths are higher in the specimens treated with a higher pressure
as indicated by high values of valley depths.
Fig. 5-19: 3D images of surface erosion at different pressures, a) 100 MPa, b) 200 MPa and c) 300 MPa, at a feedrate of 2000 mm/min, a number of jet passes of 4 and a standoff distance of 30 mm (black arrows indicate the traverse direction of the nozzle)
3D images of the surface structures for the same specimens treated at different
standoff distances are shown in Fig. 5-20. The images were taken on the same
erosion tracks as presented in Fig. 5-16. However, only the 3D images with the
highest erosion (i.e. at standoff distances of 60, 90 and 120 mm) are presented here
since there was little difference in the characteristics of the eroded surfaces from
previously presented 3D images. A similar feature of the erosion tracks in 3D was
1600 µm
1600 µm
0.0 µm
7.19 µm
-18.80 µm
-2.56 µm
-12.30 µm
a)
0.69 µm
1600 µm
1600 µm
0.0 µm
34.44 µm
-56.39 µm
11.73 µm
0.38 µm
-33.68 µm
b)
850 µm
1600 µm
0.0 µm
64.00 µm
-64.08 µm
31.98 µm
-0.04 µm
-32.06 µm
c)
1600 µm
850 µm

76 5 Results and discussions
observed from previously characterized images by SEM. The erosion was noticed
the most at a standoff distance of 90 mm as shown in Fig. 5-20 (b) with the deepest
valley.
Fig. 5-20: 3D images of surface erosion at different standoff distances, a) 60 mm, b) 90 mm and c) 120 mm, at a pressure of 200 MPa, a number of jet passes of 4 and a feedrate of 2000 mm/min (black arrows indicate the traverse direction of the nozzle)
It is also interesting to discuss about the effect of the number of jet passes on the
erosion track width. On macro-scale erosion as seen above, some of the eroded
surfaces do not display a clear erosion track width since it happened as a small
pocket. However, the width of the erosion track can be clearly seen on the treated
surfaces that display a continuous removal of the material especially in the
specimens treated with a higher number of jet passes. An almost constant erosion
track width of approximately 850 µm was produced in those treated jet specimens. In
the present case, it can be expected that the effective coverage area from the jet with
a nozzle diameter of 0.3 mm is about 850 µm. Likewise, it can be seen that the
1600 µm
1600 µm
0.0 µm
34.52 µm
-69.68 µm
-8.47 µm
-17.58 µm
-43.63 µm
b)
850 µm
1600 µm
0.0 µm
19.82 µm
-49.07 µm
-2.60 µm
-14.62 µm
-31.85 µm
c)
1600 µm
850 µm
1600 µm
1600 µm
0.0 µm
24.32 µm
-36.94 µm
-6.30 µm
-21.62 µm
a)
9.02 µm

5 Results and discussions 77
traces of the surface erosion such as craters are also located within this width in the
specimens treated with a lower number of jet passes. This shows that the material
removal on the surface under the waterjet impingement only happens within the
effective coverage area. It is believed that the erosion track will not appreciably get
wider with even more jet passes but certainly the erosion track depth will notably get
deeper. Also, the randomly formed craters on the surface during previous jet passes
may easily combine to form larger craters at subsequent jet passes. As a result,
uniform erosion with full removal of materials is developed over the surface within the
jet effective coverage area.
5.1.3 Comparisons of surface effects between both materials
It is good to compare about the results of surface roughness and erosion for both
materials (i.e. stainless steel 304 and carbon steel 1045) studied in the present work.
It is known that the material properties (i.e. strength, hardness, ductility, fatigue
resistance, etc.) affect the surface erosion of a material. Krella and Czyniewski [120]
commented that an increase in the material strength and hardness tend to increase
the cavitation erosion resistance. However, they also noted that there was no straight
correlation between the material hardness and the incubation period. In case of the
present study, a similar conclusion can be made where there is no clear correlation
between the incubation period and the hardness of the materials. It is to note that the
stainless steel 304 has a higher hardness than the carbon steel 1045 (i.e. 230 HV0.01
versus 145 HV0.01). however, it can be seen from Fig. 5-2 and Fig. 5-3 that both
materials show a relatively similar behaviour in regard to the incubation period at
about 2 – 4 jet passes.
In general, carbon steel 1045 has produced a higher value of surface roughness than
stainless steel 304 as shown in Fig. 5-1, Fig. 5-2 and Fig. 5-3. This can be expected
since the carbon steel has a lower hardness than the stainless steel. Therefore, it
has a lower erosion resistance thus producing a higher roughness of the surface.
Interestingly, the increase of roughness in the carbon steel 1045 can be considered
moderate in comparison to the stainless steel 304 within the same parametric
conditions although the hardness of the former is slightly more than half of the latter.
Also, the degree of erosion observed in the carbon steel 1045 is only slightly more
severe with a continuous erosion surface particularly at a higher pressure and more
78 5 Results and discussions
number of jet passes as shown in Fig. 5-15 (b) and Fig. 5-15 (c) than in the stainless
steel 304 as shown in Fig. 5-12 (b) and Fig. 5-12 (c). Possibly, since the carbon steel
1045 has a lower original roughness than stainless steel 304 (i.e. 0.07 µm versus
0.15 µm) this results in a lower increase of roughness after the waterjet treatment. It
is known that an initially smooth surface is favourable to the erosion resistance [121].
However, the erosion behaviour of the material surface under the waterjet impact is
very complex. A lot of factors may influence its behaviour. It can be said that a lower
material hardness is no guarantee to a lower erosion resistance. Additionally, there is
no simple relation between the amount of material loss during cavitation erosion and
the mechanical properties of a material, such as hardness, strength and toughness
[122]. In contrast, Lee [123] found a relationship between the materials’ hardness
and the erosion rate. The erosion rate decreased with an increase in the material
hardness. However, the same author pointed out that the erosion rate for a simple
two-phase alloy system is strongly related to the amount of primary ferrite in the
microstructure rather than its hardness. While, Mann and Arya [124] commented that
the hardness of coatings played a crucial role in improving the erosion resistance
especially during the incubation period for coated materials.
Richman and McNaughton [125] suggested that material removal rates are
correlated with cyclic deformation parameters, a strong indication that the damage in
the cavitation erosion is a fatigue process. They established the relationship between
the erosion behaviour with the fatigue strength coefficient. The fatigue strength
coefficient is inversely proportional to the erosion depth. Based on the database of
cyclic deformation parameters for various metals, the stainless steel 304 displays a
higher value of the fatigue strength coefficient than carbon steel, thus it has a higher
erosion resistance [125]. Furthermore, Feller and Kharrazi [126] reported that the
erosion resistance strongly influenced by the binding energy and the crystal structure
of the base material. They explained that single phase alloys had high erosion
resistance due to high covalent bonding and low stacking fault energy. The
predominant mode of deformation is thus planar slip due to the low stacking fault
energy which prevents recombination of partial dislocations necessary for cross-slip
[127]. In other words, the surface distortion is largely confined to the grain-boundary
regions, thereby limiting the area susceptible to erosion [128].
5 Results and discussions 79
While, the second-phase particles in multi-phase alloys were preferentially removed
because of the initiation of deformation and cracks at the particle-matrix interfaces.
Also according to Preece and Macmillan [128], the material in these alloys is
removed by lateral growth of flat-bottomed pits that develops because of the large
numbers of dislocation sources. This results in the near-surface highly localized
stress concentrations which lead to the initiation of cracks. This may explain why
more erosion had occurred in the carbon steel 1045 than the stainless steel 304. It is
to note that the former consists of multi-phases (i.e. ferrite and pearlite phases) while
the latter consists of a single austenite phase. Furthermore, Heathcock et al. [127]
attributed the low erosion resistance of ferritic steels to the strain rate sensitivity of
the body-centered cubic lattice structure. The high strain rates generated from
waterjet peening treatment may result in a rapid brittle fracture along both
transgranular and intergranular paths [127].
Another possible reason of good erosion resistance of the stainless steel 304 is due
to the phase transformation that may occur during waterjet treatment [120, 127]. It is
known that the phase transformation needs energy which typically occurs during
heating resulted from highly localized impact of water droplets [120]. The energy
generated will be absorbed or dissipated by the solid material to change its
dislocation structure and transform its austenite into martensite phase [120, 127,
129]. As a result of a high work-hardening rate of the stainless steel 304, it is thus
expected to have a higher erosion resistance. In general, the alteration of phase and
dislocation structure may finally change the material properties and change the
erosion resistance of the material. The details discussions on the erosion
mechanisms for both materials are reported in the following section.
5.2 Erosion mechanisms
A further investigation of SEM images at a higher magnification gives details of the
erosion nature. Since, the erosion features under the microscopic observation for
different surfaces displayed relatively similar characteristics; only several magnified
images at selected locations are presented here. Nevertheless, various surface
damage mechanisms can be clearly seen from these images. In general, the erosion
mechanisms for both materials (i.e. austenitic stainless steel 304 and carbon steel
1045) show quite similar features since both materials are ductile metals. As
80 5 Results and discussions
explained by Hancox and Brunton [57], yielding in ductile metals can be expected to
begin locally at average impact pressures appreciably below the average flow stress
for the metals. The regions which are yielded previously were further deformed and
pitted by the liquid flow. As a result, the material removal from the surface happens
by the impingement of the liquid flow against the edges of the surface fractures [57].
The detail discussions on the erosion mechanisms will be presented with the help of
SEM images at higher magnifications. The SEM Images for both materials are used
interchangeably throughout this section.
Several magnified SEM images of the stainless steel 304 were captured at different
locations of the erosion tracks. The images represent the effect of different waterjet
peening parameters as shown in Fig. 5-4 to Fig. 5-6. The magnified images are
shown in Fig. 5-21 to Fig. 5-24 respectively for different numbers of jet passes,
feedrates, pressures and standoff distances. Clearly, severe erosion happens
particularly at the highest number of jet passes, the lowest feedrate, the highest
pressure and the standoff distance of 90 mm as displayed in Fig. 5-21 (c), Fig. 5-22
(a), Fig. 5-23 (c) and Fig. 5-24 (b) respectively where the original surfaces are no
longer present as evidenced by a larger size of the pit with more undercuts. A similar
observation was noticed by Barriuso et al. [78] in roughening of metallic biomaterials
using abrasiveless waterjet peening where they observed a large number of pits with
undercuts as well as some larger intrusions, which are more abundant and larger as
in those treated with the lower feedrate. Besides, erosion of material was observed
appearing like hills and valleys as well as some parts of relatively flat indentations
and rolled-up grains around the crater as similarly observed by Oka et al. [76] in
waterjet treatment of aluminium alloy. It can be anticipated that increasing the
number of jet passes causes the removal of the material tip repetitively thus eroding
the surface further. Furthermore, decreasing the feedrate allows additional overlap of
the waterjet action and more water molecules to impinge on the surface hence
resulting in severe erosion. Moreover, it implies smaller impingement time of the
waterjet on the same point of the specimen. Whereas, a higher pressure generates a
higher kinetic energy of water molecules hence eroding the surfaces more efficiently.

5 Results and discussions 81
Fig. 5-21: Details of surface erosion for different number of jet passes a pressure of 200 MPa, a feedrate of 2000 mm/min, and a standoff distance of 30 mm, a) 2 jet passes, b) 4 jet passes, and c) 6 jet passes
Fig. 5-22: Details of surface erosion for different feedrates at a pressure of 200 MPa, ,a number of jet passes of 4 and a standoff distance of 30 mm, a) 1000 mm/mm, b) 2000 mm/min, and c) 3000 mm/min
Fig. 5-23: Details of surface erosion for different pressures at a feedrate of 2000 mm/min, a number of jet passes of 4 and a standoff distance of 30 mm, a) 100 MPa, b) 200 MPa, and c) 300 MPa
Fig. 5-24: Details of surface erosion for different standoff distances at a pressure of 200 MPa, a feedrate of 2000 mm/min and a number of jet passes of 2, a) 60 mm, b) 90 mm, and c) 120 mm
a)
6 µm
b)
6 µm
c)
6 µm
a)
6 µm
b)
6 µm
c)
6 µm
a)
6 µm
b)
6 µm
c)
6 µm
a)
6 µm
b)
6 µm
c)
6 µm
82 5 Results and discussions
It is also interesting to discuss about the effect of the waterjet parameters on the
micro-scale erosion pattern. Generally, all surfaces experience a certain degree of
erosion during the waterjet impingement at different parameters. The surfaces with
severe erosion show a similarity where the original surface is no longer present.
However, the eroded surfaces treated with different numbers of jet passes display a
relatively different pattern. A shape like a mountain hill terrace was produced and it
became clearly visible especially at a higher number of jet passes as illustrated in
Fig. 5-21 (b) and Fig. 5-21 (c). Comparing these figures, it seems that the latter
shows a deeper slope of terrace due to the additional erosion from more waterjet
passes. This specific pattern is not found on the other eroded surfaces treated with
different parameters as shown in Fig. 5-22 to Fig. 5-24. This is a strong indication
that the erosion mechanism during the waterjet impingement process is somehow
like a fatigue process especially under the multiple jet passes treatment [128, 130].
This will be further discussed in the next paragraphs.
As discussed above, during subsequent jet passes with more water impacts, old
cracks are further propagated thus forming a network of cracks as well as the
initiation of new cracks. Adler and Hooker [131] suggested that the hydraulic
penetration mode of fracture dominates the subsequent erosion process. This
damage is due to the hydraulic stresses generated by the penetration of the water
during the subsequent impacts into the enlarged impact zone. The most favourable
structure for the hydraulic penetration effect is the original sites of the lateral outflow
fracture and pitting [131]. This leads to crack propagation and eventually pitting as
well as material removal. As shown in Fig. 5-21 (b), with more water impacts at a
higher jet passes, the previously formed small craters may easily combine to form a
larger crater. As a result, a bigger crater is developed with full removal of materials
over the surface. With even further jet passes, more fractures can be expected with
full removal of the material fragments as shown in Fig. 5-21 (c).
In general, the material removal occurs at two levels, i.e., initial and evolved damage
[74, 81]. Due to the highly stochastic nature of the plastic deformation in material
surfaces, it is hard to capture its initial damage perfectly. However, a possibly initial
damage image was captured on a surface treated with the lowest jet pass number as
indicated in Fig. 5-25 and Fig. 5-26 respectively for the stainless steel 304 and the
carbon steel 1045. The images were captured on the treated surface (i.e. Fig. 5-4 (a)
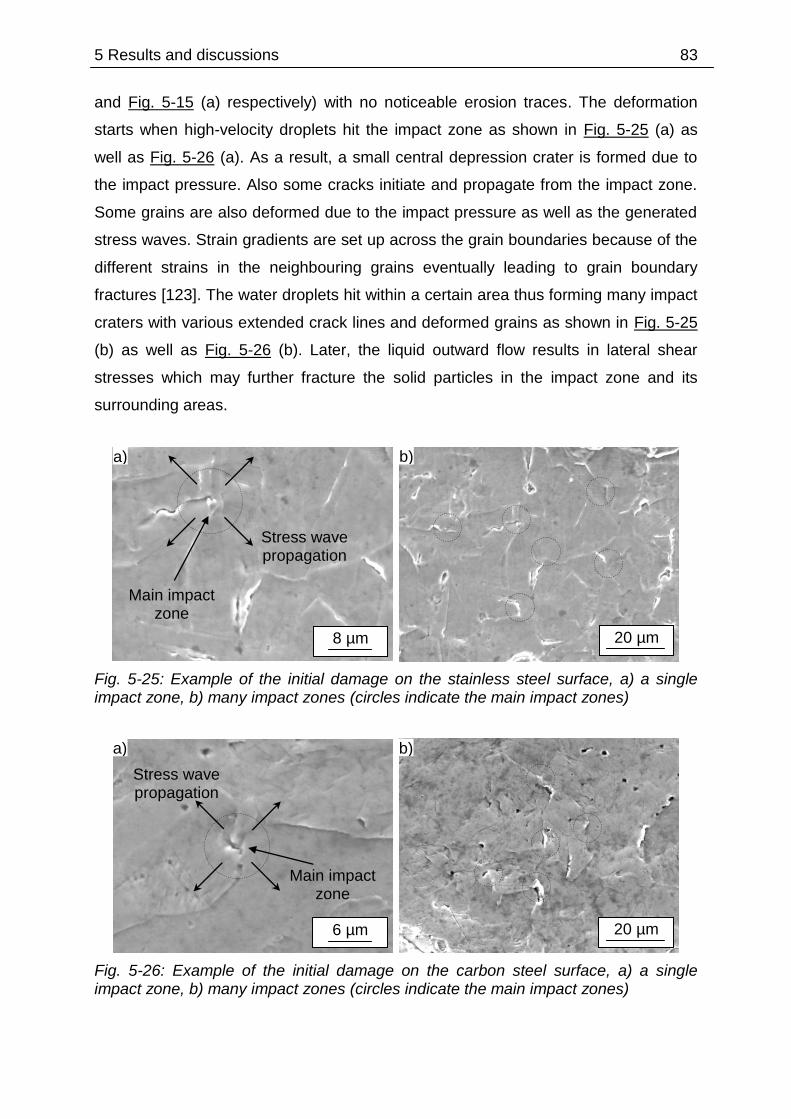
5 Results and discussions 83
and Fig. 5-15 (a) respectively) with no noticeable erosion traces. The deformation
starts when high-velocity droplets hit the impact zone as shown in Fig. 5-25 (a) as
well as Fig. 5-26 (a). As a result, a small central depression crater is formed due to
the impact pressure. Also some cracks initiate and propagate from the impact zone.
Some grains are also deformed due to the impact pressure as well as the generated
stress waves. Strain gradients are set up across the grain boundaries because of the
different strains in the neighbouring grains eventually leading to grain boundary
fractures [123]. The water droplets hit within a certain area thus forming many impact
craters with various extended crack lines and deformed grains as shown in Fig. 5-25
(b) as well as Fig. 5-26 (b). Later, the liquid outward flow results in lateral shear
stresses which may further fracture the solid particles in the impact zone and its
surrounding areas.
Fig. 5-25: Example of the initial damage on the stainless steel surface, a) a single impact zone, b) many impact zones (circles indicate the main impact zones)
Fig. 5-26: Example of the initial damage on the carbon steel surface, a) a single impact zone, b) many impact zones (circles indicate the main impact zones)
a)
6 µm
Main impact zone
Stress wave propagation
b)
20 µm
a)
8 µm
Main impact zone
Stress wave propagation
b)
20 µm

84 5 Results and discussions
The examples of the evolved damage surface are shown in Fig. 5-27. The images
were captured on various locations of the eroded surfaces of the carbon steel 1045.
Various surface damage mechanisms can be seen from these images. Deep cavities
are formed when the pits from the individual fractures are combined together as
shown in Fig. 5-27 (a) and (b). Besides, the surface erosion was observed appearing
like hills and valleys as well as some parts of relatively flat indentations and rolled-up
grains around the crater as shown in Fig. 5-27 (c). The surface cracks are possibly
propagated mainly along the grain boundaries as evidenced by tilting of a grain as
indicated in Fig. 5-27 (d).
Fig. 5-27: Example of the evolved damage on the carbon steel surface, a) full removal of material with deep cavities, b) lateral outflow jetting, c) rolled-up grains, and d) fractures along grain boundaries
It is also important to discuss about the effect of lateral outflow jetting in
characterizing the erosion track. As discussed above, there are shear forces due to
the outward flow impinging against projections in the impact surface which may result
in local shear fractures [57]. It can be clearly seen that the surface outside the deep
fractures (i.e. edges of the erosion track) is increasingly broken by a pitting action as
c)
20 µm
Lateral outflow jetting
Rolled-up grain
d)
20 µm
Main impact zone
Lateral outflow jetting
Fractures along grain boundaries
a)
20 µm
Deep cavity
b)
20 µm
Lateral outflow jetting
Rim
Deep cavity
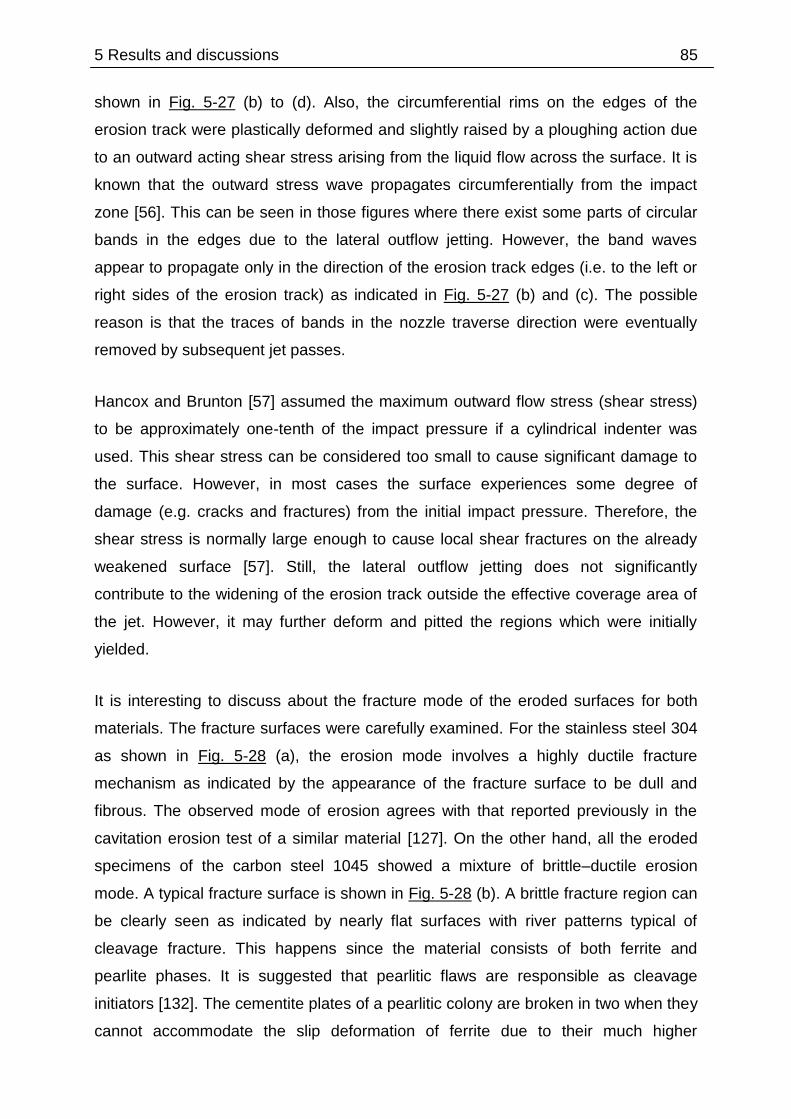
5 Results and discussions 85
shown in Fig. 5-27 (b) to (d). Also, the circumferential rims on the edges of the
erosion track were plastically deformed and slightly raised by a ploughing action due
to an outward acting shear stress arising from the liquid flow across the surface. It is
known that the outward stress wave propagates circumferentially from the impact
zone [56]. This can be seen in those figures where there exist some parts of circular
bands in the edges due to the lateral outflow jetting. However, the band waves
appear to propagate only in the direction of the erosion track edges (i.e. to the left or
right sides of the erosion track) as indicated in Fig. 5-27 (b) and (c). The possible
reason is that the traces of bands in the nozzle traverse direction were eventually
removed by subsequent jet passes.
Hancox and Brunton [57] assumed the maximum outward flow stress (shear stress)
to be approximately one-tenth of the impact pressure if a cylindrical indenter was
used. This shear stress can be considered too small to cause significant damage to
the surface. However, in most cases the surface experiences some degree of
damage (e.g. cracks and fractures) from the initial impact pressure. Therefore, the
shear stress is normally large enough to cause local shear fractures on the already
weakened surface [57]. Still, the lateral outflow jetting does not significantly
contribute to the widening of the erosion track outside the effective coverage area of
the jet. However, it may further deform and pitted the regions which were initially
yielded.
It is interesting to discuss about the fracture mode of the eroded surfaces for both
materials. The fracture surfaces were carefully examined. For the stainless steel 304
as shown in Fig. 5-28 (a), the erosion mode involves a highly ductile fracture
mechanism as indicated by the appearance of the fracture surface to be dull and
fibrous. The observed mode of erosion agrees with that reported previously in the
cavitation erosion test of a similar material [127]. On the other hand, all the eroded
specimens of the carbon steel 1045 showed a mixture of brittle–ductile erosion
mode. A typical fracture surface is shown in Fig. 5-28 (b). A brittle fracture region can
be clearly seen as indicated by nearly flat surfaces with river patterns typical of
cleavage fracture. This happens since the material consists of both ferrite and
pearlite phases. It is suggested that pearlitic flaws are responsible as cleavage
initiators [132]. The cementite plates of a pearlitic colony are broken in two when they
cannot accommodate the slip deformation of ferrite due to their much higher
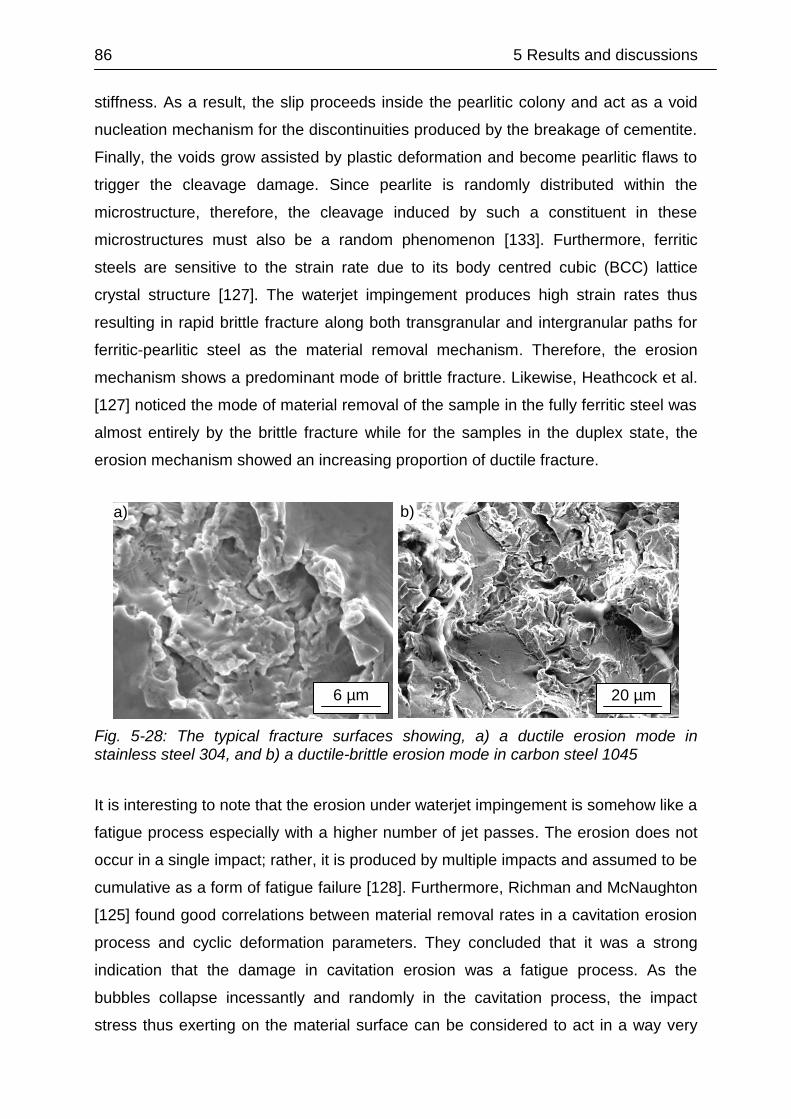
86 5 Results and discussions
stiffness. As a result, the slip proceeds inside the pearlitic colony and act as a void
nucleation mechanism for the discontinuities produced by the breakage of cementite.
Finally, the voids grow assisted by plastic deformation and become pearlitic flaws to
trigger the cleavage damage. Since pearlite is randomly distributed within the
microstructure, therefore, the cleavage induced by such a constituent in these
microstructures must also be a random phenomenon [133]. Furthermore, ferritic
steels are sensitive to the strain rate due to its body centred cubic (BCC) lattice
crystal structure [127]. The waterjet impingement produces high strain rates thus
resulting in rapid brittle fracture along both transgranular and intergranular paths for
ferritic-pearlitic steel as the material removal mechanism. Therefore, the erosion
mechanism shows a predominant mode of brittle fracture. Likewise, Heathcock et al.
[127] noticed the mode of material removal of the sample in the fully ferritic steel was
almost entirely by the brittle fracture while for the samples in the duplex state, the
erosion mechanism showed an increasing proportion of ductile fracture.
Fig. 5-28: The typical fracture surfaces showing, a) a ductile erosion mode in stainless steel 304, and b) a ductile-brittle erosion mode in carbon steel 1045
It is interesting to note that the erosion under waterjet impingement is somehow like a
fatigue process especially with a higher number of jet passes. The erosion does not
occur in a single impact; rather, it is produced by multiple impacts and assumed to be
cumulative as a form of fatigue failure [128]. Furthermore, Richman and McNaughton
[125] found good correlations between material removal rates in a cavitation erosion
process and cyclic deformation parameters. They concluded that it was a strong
indication that the damage in cavitation erosion was a fatigue process. As the
bubbles collapse incessantly and randomly in the cavitation process, the impact
stress thus exerting on the material surface can be considered to act in a way very
b)
20 µm
a)
6 µm

5 Results and discussions 87
similar to that of low cycle strain fatigue [122]. In other word, at low impact energy,
the average stress may be too low to cause general fractures, but some deformation
is produced by each impact in regions of stress concentration [57]. The amount of
deformation is accumulated and after certain number of impacts the fractures can be
detected. Together with the effect of jet outward flow, striation marks can be
observed especially at the rims of the impact craters as shown in Fig. 5-29. Kamkar
et al. [134] suggested that the striation marks confirm the transgranular nature of
crack propagation mechanism. It indicates the intrinsic cyclic damaging mechanism
associated with water droplets impingement erosion.
Fig. 5-29: Striation marks indicating cyclic ductile propagation mode of, a) stainless steel 304, and b) carbon steel 1045
In order to get further information about the grain erosion, some of the eroded
surfaces of the carbon steel 1045 were mildly etched for about 15 seconds with 3%
Nital. The SEM images of etched specimen in the middle and at the edge of erosion
track are shown in Fig. 5-30 (a) and (b), respectively. It is clear that the water impact
produces deformation in the grains. However, the cracks are more concentrated at
the ferritic-pearlitic grain boundaries as indicated as bold black arrows in Fig. 5-30 (a)
and (b). Also, it can be noticed that some cracks also occur within the ferrite grains.
With further water impact, damage continues by a tunnelling mechanism until
complete ferrite grains are removed thus leaving the harder pearlite grains [123].
With even further water impact, tunnelling is extensive enough to remove the surface
pearlite colonies thus leaving a completely eroded surface.
a)
3 µm
Striations
b)
8 µm
Striations
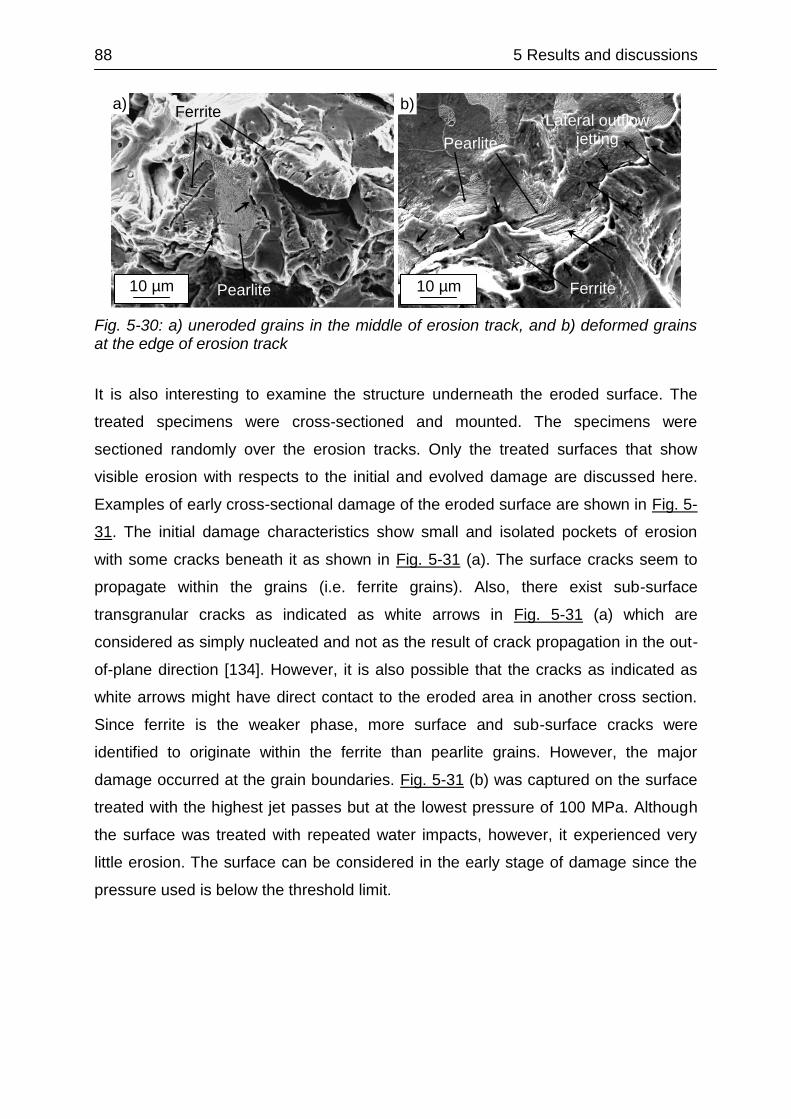
88 5 Results and discussions
Fig. 5-30: a) uneroded grains in the middle of erosion track, and b) deformed grains at the edge of erosion track
It is also interesting to examine the structure underneath the eroded surface. The
treated specimens were cross-sectioned and mounted. The specimens were
sectioned randomly over the erosion tracks. Only the treated surfaces that show
visible erosion with respects to the initial and evolved damage are discussed here.
Examples of early cross-sectional damage of the eroded surface are shown in Fig. 5-
31. The initial damage characteristics show small and isolated pockets of erosion
with some cracks beneath it as shown in Fig. 5-31 (a). The surface cracks seem to
propagate within the grains (i.e. ferrite grains). Also, there exist sub-surface
transgranular cracks as indicated as white arrows in Fig. 5-31 (a) which are
considered as simply nucleated and not as the result of crack propagation in the out-
of-plane direction [134]. However, it is also possible that the cracks as indicated as
white arrows might have direct contact to the eroded area in another cross section.
Since ferrite is the weaker phase, more surface and sub-surface cracks were
identified to originate within the ferrite than pearlite grains. However, the major
damage occurred at the grain boundaries. Fig. 5-31 (b) was captured on the surface
treated with the highest jet passes but at the lowest pressure of 100 MPa. Although
the surface was treated with repeated water impacts, however, it experienced very
little erosion. The surface can be considered in the early stage of damage since the
pressure used is below the threshold limit.
a)
10 µm
Ferrite
Pearlite
Pearlite
b)
10 µm Ferrite
Lateral outflow jetting

5 Results and discussions 89
Fig. 5-31: Cross-sectioned images of erosion tracks taken from figures, a) Fig. 5-15 (a), and b) Fig. 5-13 (c)
Additionally, more cross-sectional images were captured at different erosion tracks
as shown in Fig. 5-32. The damage features at these locations show somehow the
typical evolved damage characteristics under the waterjet treatment. Overall, the
cross-sectional views show a similar damage characteristic as discussed above
where the erosion tracks are deeper and wider for the specimens treated at a higher
jet passes and higher pressure. The cross-sectional views of the erosion tracks
treated with different jet passes are shown in Fig. 5-32 (a) and (b). Increasing the
number of jet passes, the erosion tracks were widened and deepened as shown in
Fig. 5-32 (a) with the width and depth of about 480 and 60 µm respectively. Also,
there exist two main craters which are separated by unbroken fragments as indicated
in the inset of Fig. 5-32 (a). A major portion of the unbroken fragments are made up
of pearlite grains since they appear to be a more resistant constituent and less prone
to be damaged by the cavitation erosion process [117]. With further jet passes, the
unbroken fragments will probably be removed because cracks propagate beneath
them in ferrite grains or at grain boundaries and the craters be joined thus forming a
larger crater. This can be seen in the erosion track treated at the highest jet passes
with a width and depth about 750 µm and 125 µm, respectively, as indicated in
Fig. 5-32 (b). A further examination of the damage features as indicated in the inset
of Fig. 5-32 (b) shows various damage mechanisms including cracks along the grain
boundaries (indicated black arrow) as well as within the grains (indicated white
arrows). However, the pictures seem to suggest that the damage is concentrated
along the grain boundaries. As damage progresses, the primary ferrites were eroded
before the pearlite. This comes as no surprise since the grain boundaries are zones
a)
1.1 Cracks in main crater
30 µm
b)
50 µm
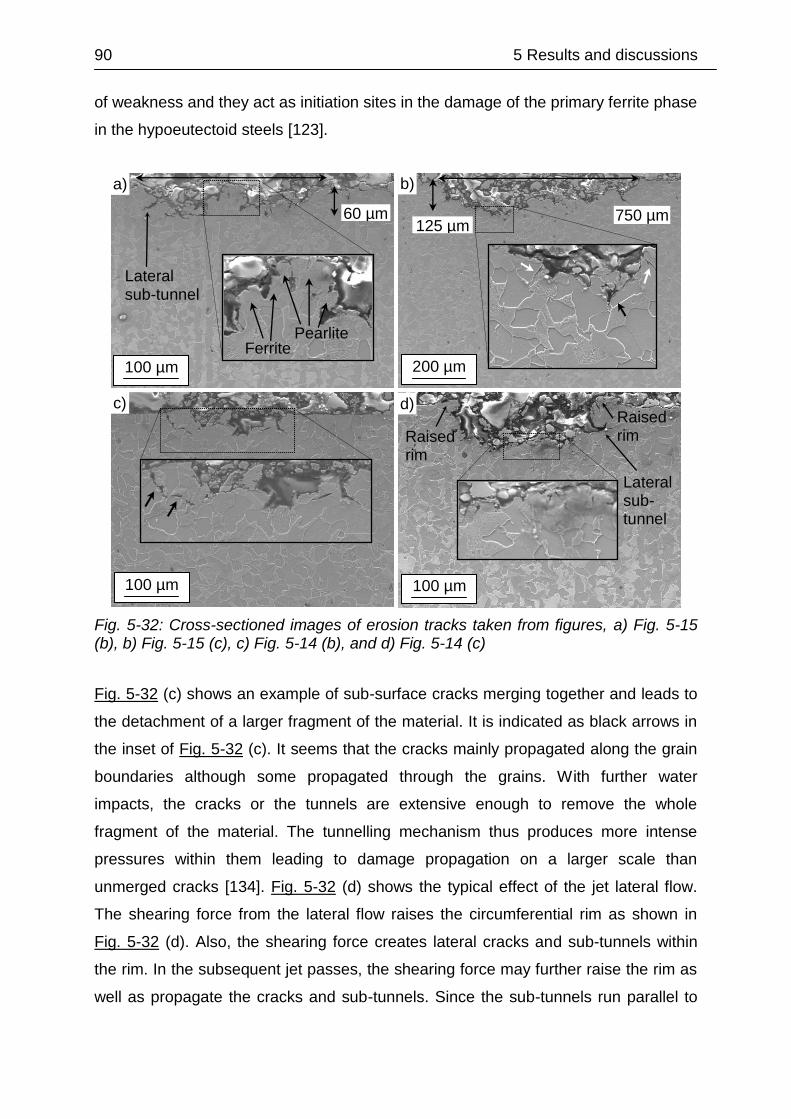
90 5 Results and discussions
of weakness and they act as initiation sites in the damage of the primary ferrite phase
in the hypoeutectoid steels [123].
Fig. 5-32: Cross-sectioned images of erosion tracks taken from figures, a) Fig. 5-15 (b), b) Fig. 5-15 (c), c) Fig. 5-14 (b), and d) Fig. 5-14 (c)
Fig. 5-32 (c) shows an example of sub-surface cracks merging together and leads to
the detachment of a larger fragment of the material. It is indicated as black arrows in
the inset of Fig. 5-32 (c). It seems that the cracks mainly propagated along the grain
boundaries although some propagated through the grains. With further water
impacts, the cracks or the tunnels are extensive enough to remove the whole
fragment of the material. The tunnelling mechanism thus produces more intense
pressures within them leading to damage propagation on a larger scale than
unmerged cracks [134]. Fig. 5-32 (d) shows the typical effect of the jet lateral flow.
The shearing force from the lateral flow raises the circumferential rim as shown in
Fig. 5-32 (d). Also, the shearing force creates lateral cracks and sub-tunnels within
the rim. In the subsequent jet passes, the shearing force may further raise the rim as
well as propagate the cracks and sub-tunnels. Since the sub-tunnels run parallel to
b)
125 µm 750 µm
200 µm
c)
100 µm
d)
Lateral sub-tunnel
Raised rim
Raised rim
100 µm
Lateral sub-tunnel
60 µm
a)
100 µm
Pearlite Ferrite
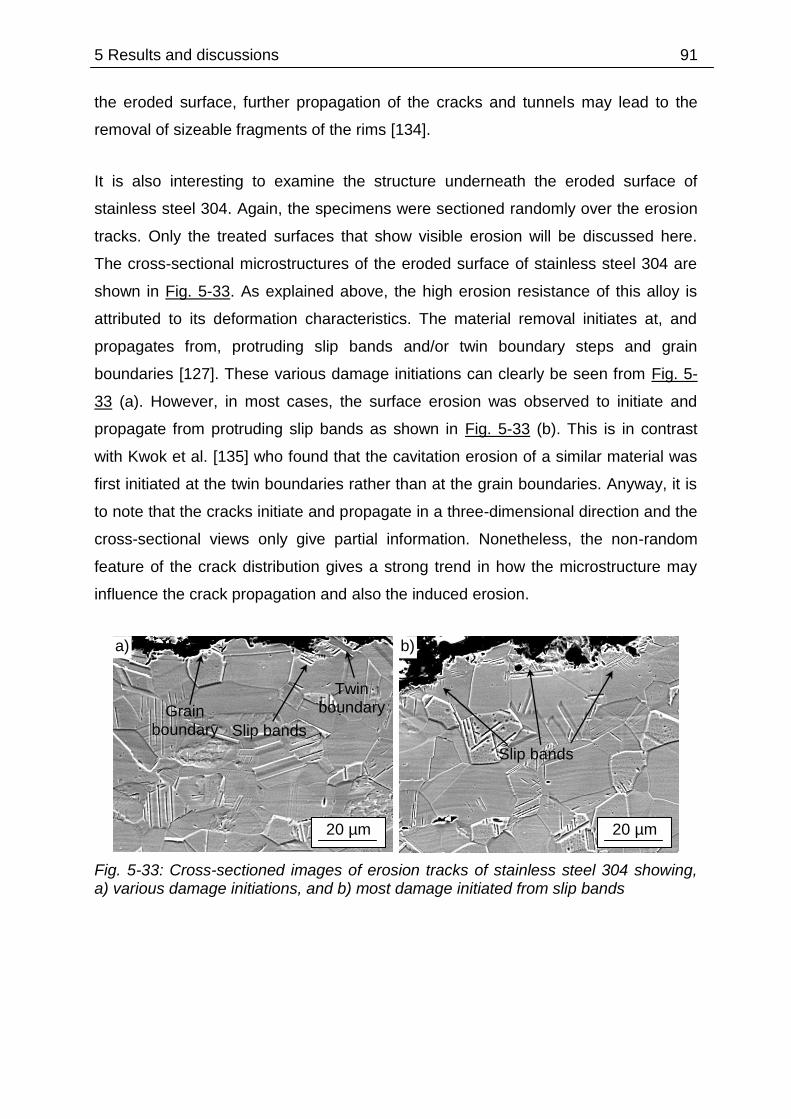
5 Results and discussions 91
the eroded surface, further propagation of the cracks and tunnels may lead to the
removal of sizeable fragments of the rims [134].
It is also interesting to examine the structure underneath the eroded surface of
stainless steel 304. Again, the specimens were sectioned randomly over the erosion
tracks. Only the treated surfaces that show visible erosion will be discussed here.
The cross-sectional microstructures of the eroded surface of stainless steel 304 are
shown in Fig. 5-33. As explained above, the high erosion resistance of this alloy is
attributed to its deformation characteristics. The material removal initiates at, and
propagates from, protruding slip bands and/or twin boundary steps and grain
boundaries [127]. These various damage initiations can clearly be seen from Fig. 5-
33 (a). However, in most cases, the surface erosion was observed to initiate and
propagate from protruding slip bands as shown in Fig. 5-33 (b). This is in contrast
with Kwok et al. [135] who found that the cavitation erosion of a similar material was
first initiated at the twin boundaries rather than at the grain boundaries. Anyway, it is
to note that the cracks initiate and propagate in a three-dimensional direction and the
cross-sectional views only give partial information. Nonetheless, the non-random
feature of the crack distribution gives a strong trend in how the microstructure may
influence the crack propagation and also the induced erosion.
Fig. 5-33: Cross-sectioned images of erosion tracks of stainless steel 304 showing, a) various damage initiations, and b) most damage initiated from slip bands
a)
20 µm
Twin boundary
Slip bands
Grain boundary
b)
20 µm
Slip bands
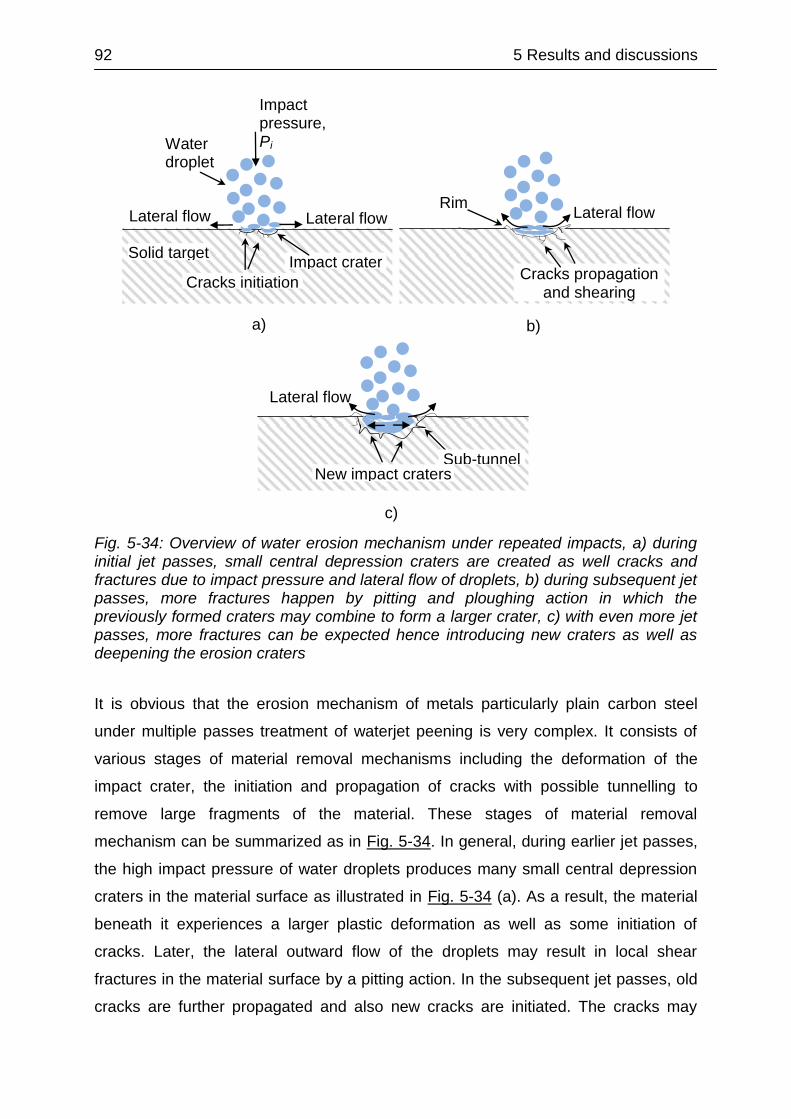
92 5 Results and discussions
Fig. 5-34: Overview of water erosion mechanism under repeated impacts, a) during initial jet passes, small central depression craters are created as well cracks and fractures due to impact pressure and lateral flow of droplets, b) during subsequent jet passes, more fractures happen by pitting and ploughing action in which the previously formed craters may combine to form a larger crater, c) with even more jet passes, more fractures can be expected hence introducing new craters as well as deepening the erosion craters
It is obvious that the erosion mechanism of metals particularly plain carbon steel
under multiple passes treatment of waterjet peening is very complex. It consists of
various stages of material removal mechanisms including the deformation of the
impact crater, the initiation and propagation of cracks with possible tunnelling to
remove large fragments of the material. These stages of material removal
mechanism can be summarized as in Fig. 5-34. In general, during earlier jet passes,
the high impact pressure of water droplets produces many small central depression
craters in the material surface as illustrated in Fig. 5-34 (a). As a result, the material
beneath it experiences a larger plastic deformation as well as some initiation of
cracks. Later, the lateral outward flow of the droplets may result in local shear
fractures in the material surface by a pitting action. In the subsequent jet passes, old
cracks are further propagated and also new cracks are initiated. The cracks may
a)
Water droplets
Impact crater
Lateral flow
Impact pressure, Pi
Solid target
Lateral flow
Cracks initiation
b)
Rim
Cracks propagation and shearing
Lateral flow
c)
Sub-tunnel New impact craters
Lateral flow
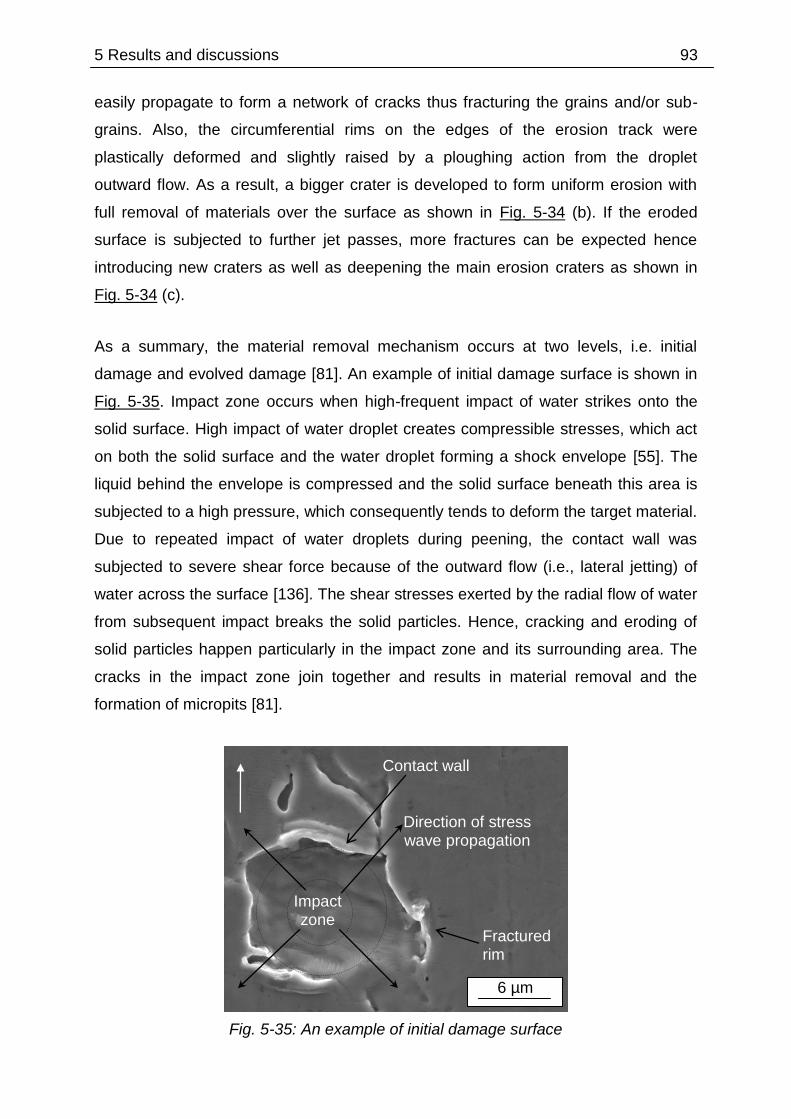
5 Results and discussions 93
easily propagate to form a network of cracks thus fracturing the grains and/or sub-
grains. Also, the circumferential rims on the edges of the erosion track were
plastically deformed and slightly raised by a ploughing action from the droplet
outward flow. As a result, a bigger crater is developed to form uniform erosion with
full removal of materials over the surface as shown in Fig. 5-34 (b). If the eroded
surface is subjected to further jet passes, more fractures can be expected hence
introducing new craters as well as deepening the main erosion craters as shown in
Fig. 5-34 (c).
As a summary, the material removal mechanism occurs at two levels, i.e. initial
damage and evolved damage [81]. An example of initial damage surface is shown in
Fig. 5-35. Impact zone occurs when high-frequent impact of water strikes onto the
solid surface. High impact of water droplet creates compressible stresses, which act
on both the solid surface and the water droplet forming a shock envelope [55]. The
liquid behind the envelope is compressed and the solid surface beneath this area is
subjected to a high pressure, which consequently tends to deform the target material.
Due to repeated impact of water droplets during peening, the contact wall was
subjected to severe shear force because of the outward flow (i.e., lateral jetting) of
water across the surface [136]. The shear stresses exerted by the radial flow of water
from subsequent impact breaks the solid particles. Hence, cracking and eroding of
solid particles happen particularly in the impact zone and its surrounding area. The
cracks in the impact zone join together and results in material removal and the
formation of micropits [81].
Fig. 5-35: An example of initial damage surface
Impact zone
Direction of stress wave propagation
Contact wall
Fractured rim
6 µm
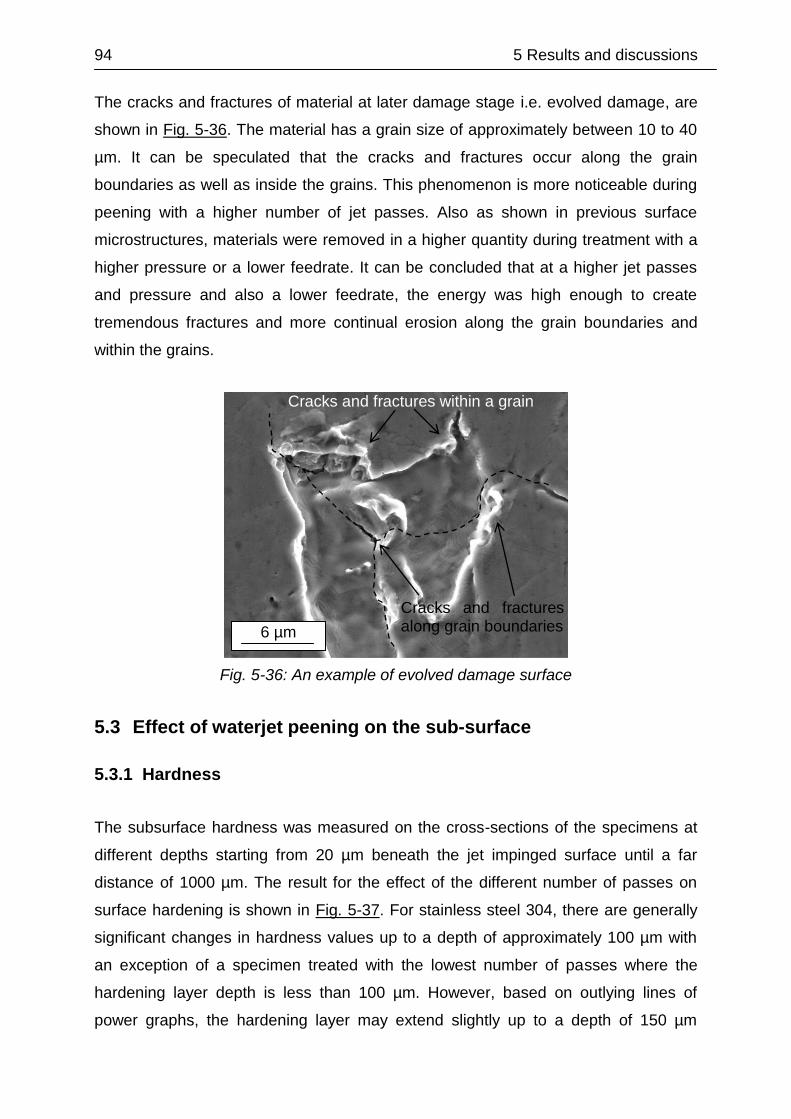
94 5 Results and discussions
The cracks and fractures of material at later damage stage i.e. evolved damage, are
shown in Fig. 5-36. The material has a grain size of approximately between 10 to 40
µm. It can be speculated that the cracks and fractures occur along the grain
boundaries as well as inside the grains. This phenomenon is more noticeable during
peening with a higher number of jet passes. Also as shown in previous surface
microstructures, materials were removed in a higher quantity during treatment with a
higher pressure or a lower feedrate. It can be concluded that at a higher jet passes
and pressure and also a lower feedrate, the energy was high enough to create
tremendous fractures and more continual erosion along the grain boundaries and
within the grains.
Fig. 5-36: An example of evolved damage surface
5.3 Effect of waterjet peening on the sub-surface
5.3.1 Hardness
The subsurface hardness was measured on the cross-sections of the specimens at
different depths starting from 20 µm beneath the jet impinged surface until a far
distance of 1000 µm. The result for the effect of the different number of passes on
surface hardening is shown in Fig. 5-37. For stainless steel 304, there are generally
significant changes in hardness values up to a depth of approximately 100 µm with
an exception of a specimen treated with the lowest number of passes where the
hardening layer depth is less than 100 µm. However, based on outlying lines of
power graphs, the hardening layer may extend slightly up to a depth of 150 µm
Cracks and fractures along grain boundaries
Cracks and fractures within a grain
6 µm
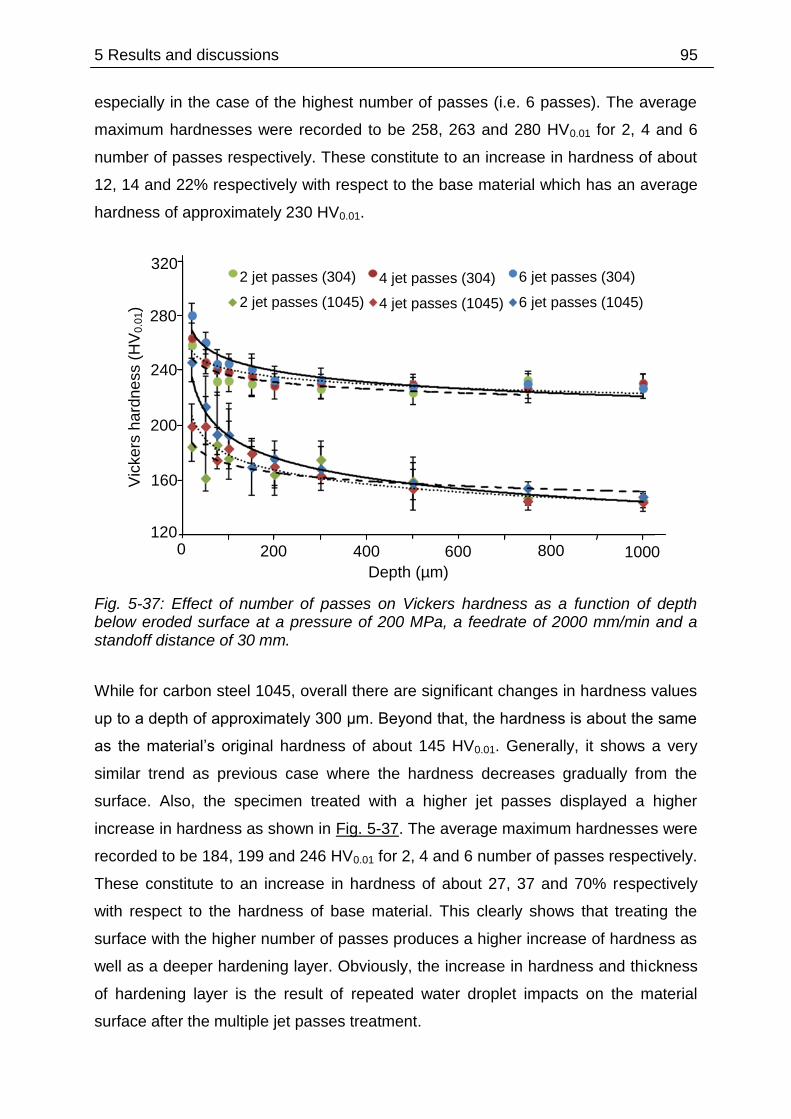
5 Results and discussions 95
especially in the case of the highest number of passes (i.e. 6 passes). The average
maximum hardnesses were recorded to be 258, 263 and 280 HV0.01 for 2, 4 and 6
number of passes respectively. These constitute to an increase in hardness of about
12, 14 and 22% respectively with respect to the base material which has an average
hardness of approximately 230 HV0.01.
Fig. 5-37: Effect of number of passes on Vickers hardness as a function of depth below eroded surface at a pressure of 200 MPa, a feedrate of 2000 mm/min and a standoff distance of 30 mm.
While for carbon steel 1045, overall there are significant changes in hardness values
up to a depth of approximately 300 μm. Beyond that, the hardness is about the same
as the material’s original hardness of about 145 HV0.01. Generally, it shows a very
similar trend as previous case where the hardness decreases gradually from the
surface. Also, the specimen treated with a higher jet passes displayed a higher
increase in hardness as shown in Fig. 5-37. The average maximum hardnesses were
recorded to be 184, 199 and 246 HV0.01 for 2, 4 and 6 number of passes respectively.
These constitute to an increase in hardness of about 27, 37 and 70% respectively
with respect to the hardness of base material. This clearly shows that treating the
surface with the higher number of passes produces a higher increase of hardness as
well as a deeper hardening layer. Obviously, the increase in hardness and thickness
of hardening layer is the result of repeated water droplet impacts on the material
surface after the multiple jet passes treatment.
320
280
240
200
160
120 0 400 600 800
Depth (µm)
2 jet passes (304)
2 jet passes (1045)
Vic
kers
ha
rdn
ess (
HV
0.0
1)
200 1000
4 jet passes (304)
4 jet passes (1045)
6 jet passes (304)
6 jet passes (1045)

96 5 Results and discussions
It is interesting to relate the effect of work hardening in the material erosion
resistance. Obviously, the surface has been hardened after early jet passes as
discussed above. This increase in hardness may contribute to the initial erosion
resistance of the material. Duraiselvam et al. [137] suggested that after long
exposure periods, a material loss could be promoted due to the removal of the work
hardened layer by brittle fracture. As a result, the erosion increased with an increase
in the number of jet passes which results in a higher exposure time as discussed
above. The surface hardness had also increased with an increase in the number of
jet passes. However, it is believed that the hardened layer was not completely
removed at the subsequent jet passes. Furthermore, a new hardened layer was
introduced and resulted in a higher increase in the surface hardness.
The effect of feedrate on Vickers hardness as a function of depth below eroded
surface is shown in Fig. 5-38. Generally, a similar trend is also noticed with hardness
decreasing gradually from the surface. Also, a higher hardness gradient is found in a
specimen treated with a lower feedrate. For stainless steel 304, the data shows that
there is an increase in average maximum hardness of about 27, 14 and 12% for
feedrates of 1000, 2000 and 3000 mm/min respectively as compared to the base
material. In contrast, the average increases of maximum hardness are about 50, 37
and 22 % respectively for carbon steel 1045. The hardness gradient has a similar
depth profile like the previous ones. The hardness gradient for the specimens treated
with the slowest feedrate of 1000 mm/min shows higher depth of about 300 and 400
µm for stainless steel 304 and carbon steel 1045 respectively. Interestingly for
stainless steel 304, samples treated with 2000 and 3000 mm/min show a similar
hardness gradient trend in which their graph lines are almost overlapping. As
discussed above, the feedrate of over 2000 mm/min is beyond its threshold limit
where its effectiveness in treating the material is very much reduced. As a result, the
hardness profiles do not differ significantly between feedrates of 2000 and 3000
mm/min. In addition, decreasing the traverse rate allows more water molecules to
impinge on the surface, therefore, introducing higher amount of compressive residual
stresses and leading to a higher hardness.

5 Results and discussions 97
Fig. 5-38: Effect of feedrate on Vickers hardness as a function of depth below eroded surface at a pressure of 200 MPa, a number of jet passes of 4 and a standoff distance of 30 mm.
The effect of pressure on Vickers hardness as a function of depth below eroded
surface is shown in Fig. 5-39. Again, for both materials, a similar trend with hardness
decreasing gradually from the surface is noticed. Furthermore, a higher hardness
gradient is found in a specimen treated with a higher pressure. For stainless steel
304, the graph shows that there is an increase in average maximum hardness of
about 16, 27 and 31% for pressures of 100, 200 and 300 MPa respectively as
compared to the base material. The depth of the hardened layer is extended up to
250 µm. While, for carbon steel 1045, there is an increase in hardness up to a depth
of 300 µm. The average increases in maximum hardness are about 21, 35 and 70%
for pressures of 100, 200 and 300 MPa respectively as compared to the base
material. Likewise, the specimens treated with a higher pressure also displayed a
higher increase in hardness. Possibly, a higher pressure generates a higher kinetic
energy of water molecules thus inducing a higher magnitude of residual stress over
the surface [74]. Interestingly for carbon steel 1045, the hardness profiles do not
differ significantly between the specimens treated with the lowest pressure and the
original specimen. Perhaps as discussed above, at the lowest pressure, the water
droplets do not carry enough impact energy to plastically deform the material at the
surface in order to increase its hardness.
320
280
240
200
160
120 0 400 600 800
Depth (µm)
1000 mm/min (304)
1000 mm/min (1045) V
ickers
ha
rdn
ess (
HV
0.0
1)
200 1000
2000 mm/min (304)
2000 mm/min (1045)
3000 mm/min (304)
3000 mm/min (1045)

98 5 Results and discussions
Fig. 5-39: Effect of pressure on Vickers hardness as a function of depth below eroded surface at a feedrate of 2000 mm/min, a number of jet passes of 4 and a standoff distance of 30 mm.
The effect of standoff distance on Vickers hardness as a function of depth below
eroded surface is shown in Fig. 5-40. A similar trend with hardness decreasing
gradually from the surface can be noticed. For stainless steel 304, there is an
increase in average maximum hardness of about 13, 21 and 18% for standoff
distances of 60, 90 and 120 mm respectively as compared to the base material. The
depth of hardened layer is less than 200 µm. While, for carbon steel 1045, there is an
increase in hardness up to a depth of 300 µm. The average increases in maximum
hardness are about 34, 60 and 37% for standoff distances of 60, 90 and 120 mm
respectively as compared to the base material. For both specimens, a standoff
distance of 90 mm resulted in the highest increase in hardness. As expected, this
standoff distance is believed to carry the highest impact pressure thus deforming the
surface the most.
320
280
240
200
160
120 0 400 600 800
Depth (µm)
100 MPa (304)
100 MPa (1045) V
ickers
ha
rdn
ess (
HV
0.0
1)
200 1000
200 MPa (304)
200 MPa (1045)
300 MPa (304)
300 MPa (1045)
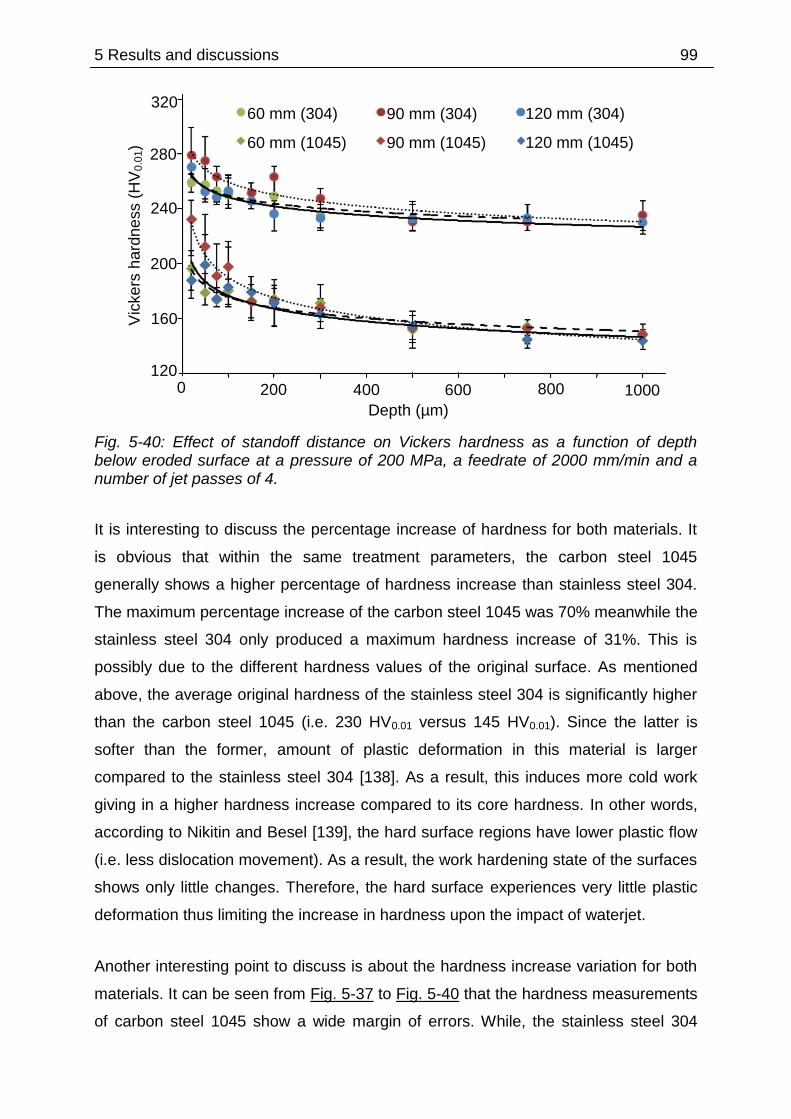
5 Results and discussions 99
Fig. 5-40: Effect of standoff distance on Vickers hardness as a function of depth below eroded surface at a pressure of 200 MPa, a feedrate of 2000 mm/min and a number of jet passes of 4.
It is interesting to discuss the percentage increase of hardness for both materials. It
is obvious that within the same treatment parameters, the carbon steel 1045
generally shows a higher percentage of hardness increase than stainless steel 304.
The maximum percentage increase of the carbon steel 1045 was 70% meanwhile the
stainless steel 304 only produced a maximum hardness increase of 31%. This is
possibly due to the different hardness values of the original surface. As mentioned
above, the average original hardness of the stainless steel 304 is significantly higher
than the carbon steel 1045 (i.e. 230 HV0.01 versus 145 HV0.01). Since the latter is
softer than the former, amount of plastic deformation in this material is larger
compared to the stainless steel 304 [138]. As a result, this induces more cold work
giving in a higher hardness increase compared to its core hardness. In other words,
according to Nikitin and Besel [139], the hard surface regions have lower plastic flow
(i.e. less dislocation movement). As a result, the work hardening state of the surfaces
shows only little changes. Therefore, the hard surface experiences very little plastic
deformation thus limiting the increase in hardness upon the impact of waterjet.
Another interesting point to discuss is about the hardness increase variation for both
materials. It can be seen from Fig. 5-37 to Fig. 5-40 that the hardness measurements
of carbon steel 1045 show a wide margin of errors. While, the stainless steel 304
320
280
240
200
160
120 0 400 600 800
Depth (µm)
60 mm (304)
60 mm (1045) V
ickers
ha
rdn
ess (
HV
0.0
1)
200 1000
90 mm (304)
90 mm (1045)
120 mm (304)
120 mm (1045)

100 5 Results and discussions
shows a relatively small margin of errors. It seems that the changes in the
microstructures (residual stress, work hardening) of the stainless steel 304 are more
stable thus leading to a small variation in hardness measurements. As reported by
Nikitin and Besel [139], a hard microstructure results in a stable residual state. As
discussed above, the austenite phase in the stainless steel 304 may transform into
the martensite phase under the work hardening process [87, 88, 89]. According to
Lee et al. [19], for the carbon steel 1045, the cementite phase in the pearlitic
microstructure is spheroidized and dissolved into the ferrite thus refining the ferrite
grains. It is known that amongst them, the martensite is the hardest phases [140].
Therefore, it is possible that the stainless steel 304 achieves a stable work hardening
state due to a harder martensite phase. Another possible reason of high variation in
hardness measurement of carbon steel 1045 is due to its multiple phases
microstructure. The ferrite phase is softer than pearlite/ spheroidite phase [141].
Therefore, the hardness measurement on different phases of carbon steel 1045
microstructures (i.e. ferrite, pearlite/ spheroidite) may result in quite significant
variation of hardness values especially using a small load of Vickers indenter.
Similarly, Autenrieth et al. [142] found a wide range of scatter in the hardness data
during a micro cutting process of the same material which was attributed to the
influence of variations in the phase composition and different grain orientations within
the sampled volume of the material.
Furthermore, it is also interesting to compare the performance of the same materials
but treated with other peening processes. In shot peening of austenitic stainless steel
S30432, there was an increase in hardness of more than 50% of the substrates’
value with a depth of hardening layer of 250 µm [143]. While, in hammer peening of
stainless steel 304L, the hardness increased about 78% of the original hardness with
a depth of hardening layer of 500 µm [144]. Whereas, in shot peening of steel with
carbon content of 0.45%, the surface hardness increased about 76% after the
treatment [19]. While, in laser shock peening of AISI 1045 steel, the hardness
increased by more than double of the original hardness with a hardening layer depth
of 100 – 150 µm [145]. It seems that from literatures, carbon steel 1045 experienced
a higher percentage of hardness increase than stainless steel 304 under peening
processes. This is in agreement with the present study where carbon steel 1045
displayed a higher degree of hardness increase than stainless steel 304. However,
5 Results and discussions 101
the hardness increase in both materials used in the present study is relatively lower
than other peening processes.
5.3.2 Microstructures
The subsurface microstructures were acquired using scanning electron microscope
(SEM) from cross-sectioned specimens of stainless steel 304. The cross-sectional
microstructures were captured up to a depth of approximately 350 µm. Additionally,
the magnified pictures at just below the eroded surface (≈ 50 m), at a depth
approximately 150 µm and at a depth approximately 250 µm were also captured.
These depths were selected based on the analysis of hardness profiles as presented
above. The locations of magnified pictures were selected randomly as to show
appropriate features of grains as well as to avoid some artifacts in the
microstructures.
The subsurface morphologies of peened samples for the different numbers of jet
passes are shown in Fig. 5-41. Cross-sectional microstructures of all samples
indicate that the substrate experienced a certain degree of plastic deformation. The
density and quantity of deformed grains decrease gradually with increasing layer
depth from the treated surface. It is evidenced as shown in the top inset pictures
where more grains suffered significant deformation through different systems of slip
bands as compared to the middle and bottom inset pictures. Similar observation was
made in shot peening of the same material. The outmost layer of the substrate
suffered severe deformation and the grain boundary became obscure [34]. Amounts
of slip bands are more abundant and severe in the specimen treated with the higher
number of passes as illustrated in Fig. 5-41 (c) as compared to the specimens
treated with a lower jet passes as shown in Fig. 5-41 (a) and (b). Also the
deformation of grains is extended up to a depth of 150 µm as shown in the middle
inset picture with a small amount of slip bands. There is no noticeable deformation
beyond that depth since there is an absence of slip bands as shown in the bottom
inset picture. This is in agreement with the subsurface hardness measurement which
show the gradient of hardness up to a depth of 150 µm for the specimen treated with
6 jet passes. The specimens treated with 2 and 4 jet passes show a significant
deformation only just below the eroded surfaces as shown in the top inset pictures of
Fig. 5-41 (a) and (b) respectively with little slip bands. This shows that the thickness
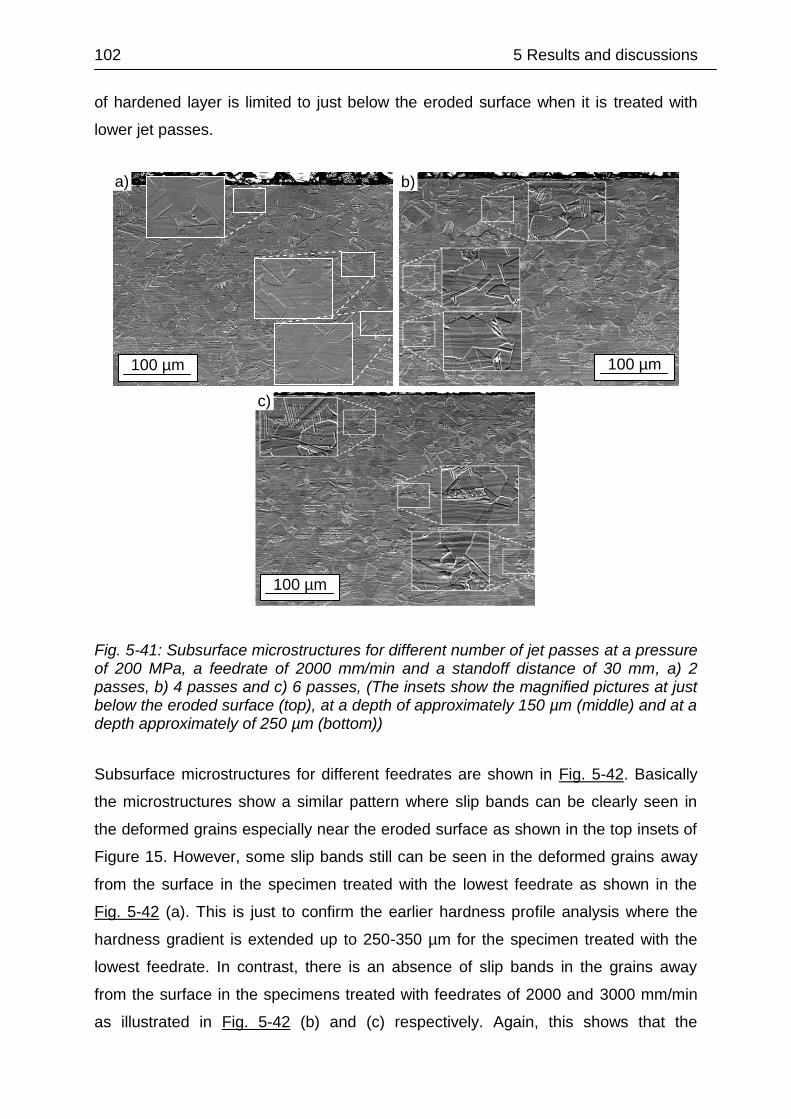
102 5 Results and discussions
of hardened layer is limited to just below the eroded surface when it is treated with
lower jet passes.
Fig. 5-41: Subsurface microstructures for different number of jet passes at a pressure of 200 MPa, a feedrate of 2000 mm/min and a standoff distance of 30 mm, a) 2 passes, b) 4 passes and c) 6 passes, (The insets show the magnified pictures at just below the eroded surface (top), at a depth of approximately 150 µm (middle) and at a depth approximately of 250 µm (bottom))
Subsurface microstructures for different feedrates are shown in Fig. 5-42. Basically
the microstructures show a similar pattern where slip bands can be clearly seen in
the deformed grains especially near the eroded surface as shown in the top insets of
Figure 15. However, some slip bands still can be seen in the deformed grains away
from the surface in the specimen treated with the lowest feedrate as shown in the
Fig. 5-42 (a). This is just to confirm the earlier hardness profile analysis where the
hardness gradient is extended up to 250-350 µm for the specimen treated with the
lowest feedrate. In contrast, there is an absence of slip bands in the grains away
from the surface in the specimens treated with feedrates of 2000 and 3000 mm/min
as illustrated in Fig. 5-42 (b) and (c) respectively. Again, this shows that the
100 µm
a) b)
100 µm
c)
100 µm

5 Results and discussions 103
deformation of grains is limited up to 100 µm close to the surface as discussed above
where the depth of hardening layers for those specimens is about 100 µm. Overall,
this is in agreement with Ju and Han [45] in water cavitation peening (WCP) of pure
titanium where they found the density and quantity of deformed grains increase
gradually with increasing WCP duration and decrease gradually with increasing layer
depth from the treated surface. It is to note that a higher feedrate implies smaller
impingement duration of the waterjet on the same point of the specimen. Therefore,
less deformed grains are found in the specimens treated with higher feedrates.
Fig. 5-42: Subsurface microstructures for different feedrates at a pressure of 200 MPa, a number of jet passes of 4 and a standoff distance of 30 mm, a) 1000 mm/min, b) 2000 mm/min and c) 3000 mm/min, (The insets show the magnified pictures at just below the eroded surface (top), at a depth of approximately 150 µm (middle) and at a depth of approximately 250 µm (bottom))
The subsurface morphologies of peened samples for the different pressures are
shown in Fig. 5-43. Cross-sectional microstructures of all samples indicate that the
substrate experienced a certain degree of plastic deformation even up to a depth of
250 µm as shown in the bottom insets of Fig. 5-43. Generally, this is in agreement
c)
100 µm
b
)
b)
100 µm
a)
100 µm
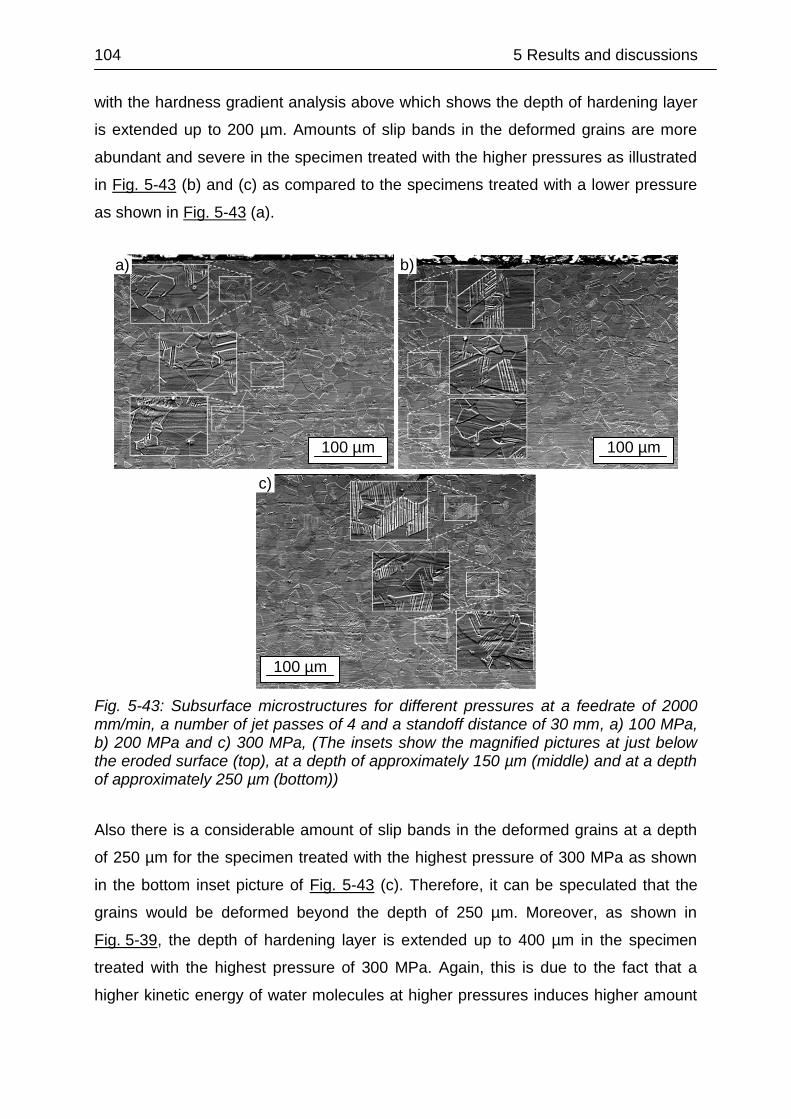
104 5 Results and discussions
with the hardness gradient analysis above which shows the depth of hardening layer
is extended up to 200 µm. Amounts of slip bands in the deformed grains are more
abundant and severe in the specimen treated with the higher pressures as illustrated
in Fig. 5-43 (b) and (c) as compared to the specimens treated with a lower pressure
as shown in Fig. 5-43 (a).
Fig. 5-43: Subsurface microstructures for different pressures at a feedrate of 2000 mm/min, a number of jet passes of 4 and a standoff distance of 30 mm, a) 100 MPa, b) 200 MPa and c) 300 MPa, (The insets show the magnified pictures at just below the eroded surface (top), at a depth of approximately 150 µm (middle) and at a depth of approximately 250 µm (bottom))
Also there is a considerable amount of slip bands in the deformed grains at a depth
of 250 µm for the specimen treated with the highest pressure of 300 MPa as shown
in the bottom inset picture of Fig. 5-43 (c). Therefore, it can be speculated that the
grains would be deformed beyond the depth of 250 µm. Moreover, as shown in
Fig. 5-39, the depth of hardening layer is extended up to 400 µm in the specimen
treated with the highest pressure of 300 MPa. Again, this is due to the fact that a
higher kinetic energy of water molecules at higher pressures induces higher amount
a)
100 µm
c)
100 µm
b)
100 µm
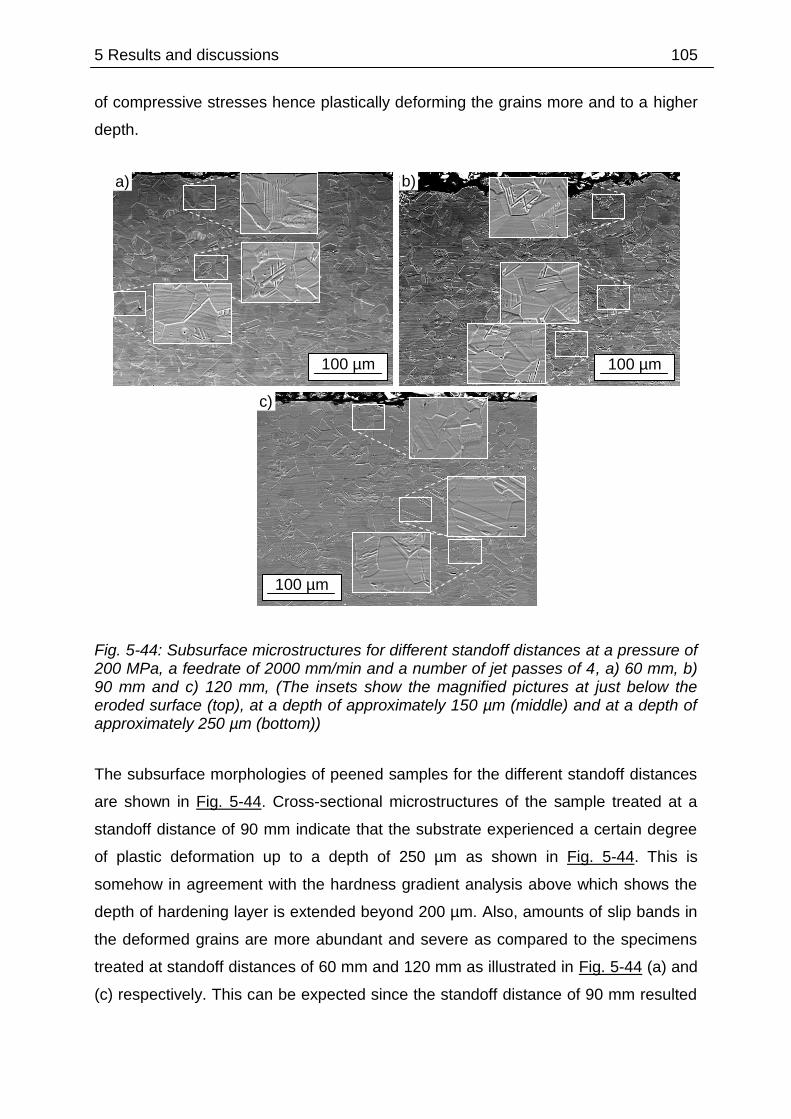
5 Results and discussions 105
of compressive stresses hence plastically deforming the grains more and to a higher
depth.
Fig. 5-44: Subsurface microstructures for different standoff distances at a pressure of 200 MPa, a feedrate of 2000 mm/min and a number of jet passes of 4, a) 60 mm, b) 90 mm and c) 120 mm, (The insets show the magnified pictures at just below the eroded surface (top), at a depth of approximately 150 µm (middle) and at a depth of approximately 250 µm (bottom))
The subsurface morphologies of peened samples for the different standoff distances
are shown in Fig. 5-44. Cross-sectional microstructures of the sample treated at a
standoff distance of 90 mm indicate that the substrate experienced a certain degree
of plastic deformation up to a depth of 250 µm as shown in Fig. 5-44. This is
somehow in agreement with the hardness gradient analysis above which shows the
depth of hardening layer is extended beyond 200 µm. Also, amounts of slip bands in
the deformed grains are more abundant and severe as compared to the specimens
treated at standoff distances of 60 mm and 120 mm as illustrated in Fig. 5-44 (a) and
(c) respectively. This can be expected since the standoff distance of 90 mm resulted
a)
100 µm
c)
100 µm
b)
100 µm
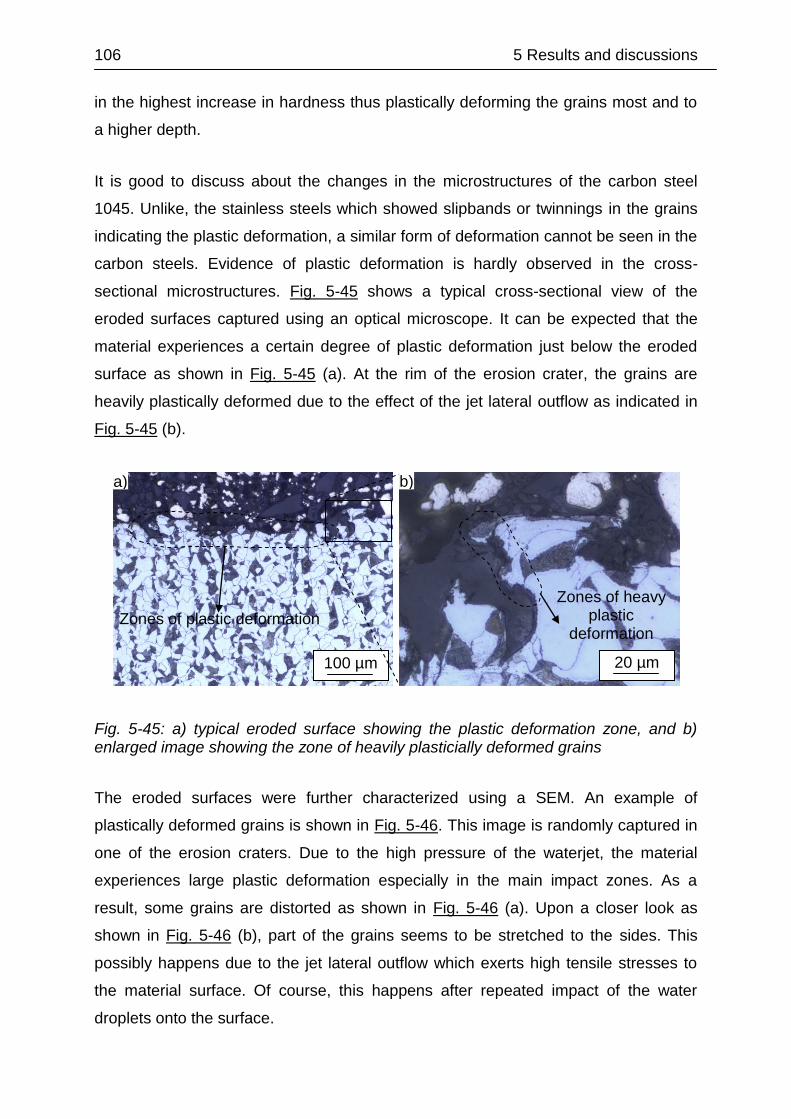
106 5 Results and discussions
in the highest increase in hardness thus plastically deforming the grains most and to
a higher depth.
It is good to discuss about the changes in the microstructures of the carbon steel
1045. Unlike, the stainless steels which showed slipbands or twinnings in the grains
indicating the plastic deformation, a similar form of deformation cannot be seen in the
carbon steels. Evidence of plastic deformation is hardly observed in the cross-
sectional microstructures. Fig. 5-45 shows a typical cross-sectional view of the
eroded surfaces captured using an optical microscope. It can be expected that the
material experiences a certain degree of plastic deformation just below the eroded
surface as shown in Fig. 5-45 (a). At the rim of the erosion crater, the grains are
heavily plastically deformed due to the effect of the jet lateral outflow as indicated in
Fig. 5-45 (b).
Fig. 5-45: a) typical eroded surface showing the plastic deformation zone, and b) enlarged image showing the zone of heavily plasticially deformed grains
The eroded surfaces were further characterized using a SEM. An example of
plastically deformed grains is shown in Fig. 5-46. This image is randomly captured in
one of the erosion craters. Due to the high pressure of the waterjet, the material
experiences large plastic deformation especially in the main impact zones. As a
result, some grains are distorted as shown in Fig. 5-46 (a). Upon a closer look as
shown in Fig. 5-46 (b), part of the grains seems to be stretched to the sides. This
possibly happens due to the jet lateral outflow which exerts high tensile stresses to
the material surface. Of course, this happens after repeated impact of the water
droplets onto the surface.
a)
100 µm
Zones of plastic deformation
b)
20 µm
Zones of heavy plastic
deformation
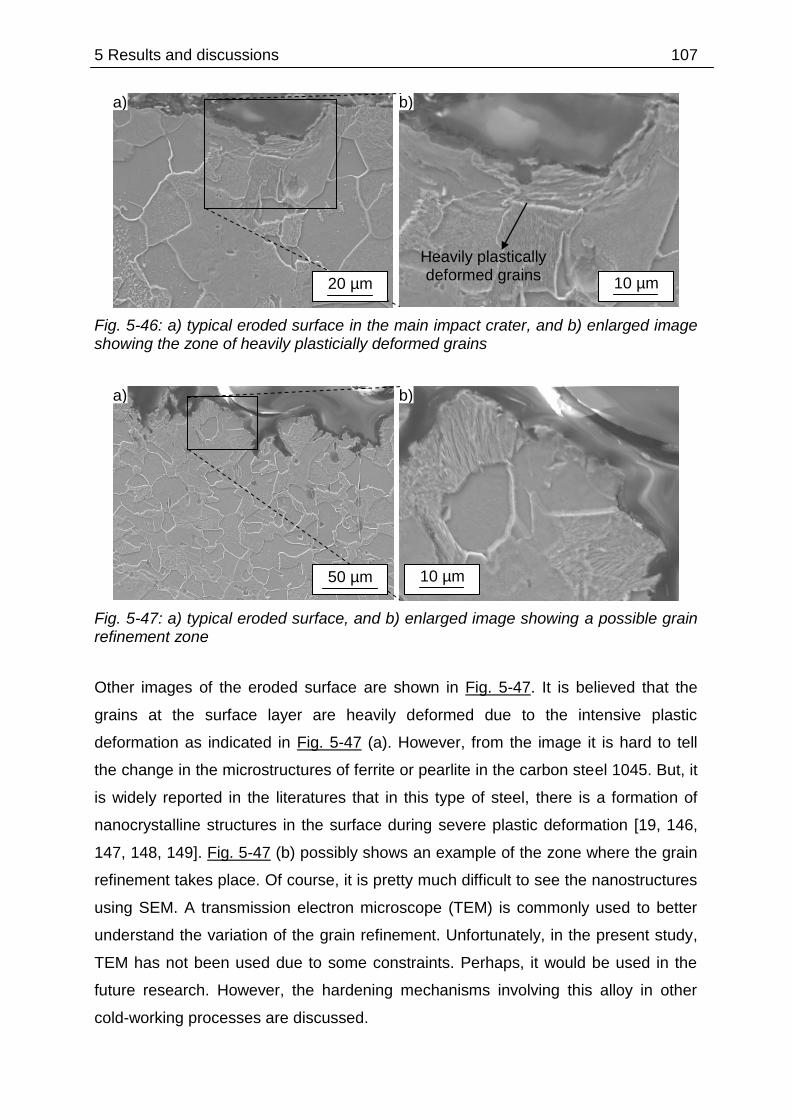
5 Results and discussions 107
Fig. 5-46: a) typical eroded surface in the main impact crater, and b) enlarged image showing the zone of heavily plasticially deformed grains
Fig. 5-47: a) typical eroded surface, and b) enlarged image showing a possible grain refinement zone
Other images of the eroded surface are shown in Fig. 5-47. It is believed that the
grains at the surface layer are heavily deformed due to the intensive plastic
deformation as indicated in Fig. 5-47 (a). However, from the image it is hard to tell
the change in the microstructures of ferrite or pearlite in the carbon steel 1045. But, it
is widely reported in the literatures that in this type of steel, there is a formation of
nanocrystalline structures in the surface during severe plastic deformation [19, 146,
147, 148, 149]. Fig. 5-47 (b) possibly shows an example of the zone where the grain
refinement takes place. Of course, it is pretty much difficult to see the nanostructures
using SEM. A transmission electron microscope (TEM) is commonly used to better
understand the variation of the grain refinement. Unfortunately, in the present study,
TEM has not been used due to some constraints. Perhaps, it would be used in the
future research. However, the hardening mechanisms involving this alloy in other
cold-working processes are discussed.
b)
10 µm
a)
50 µm
Heavily plastically deformed grains
b)
10 µm
a)
20 µm
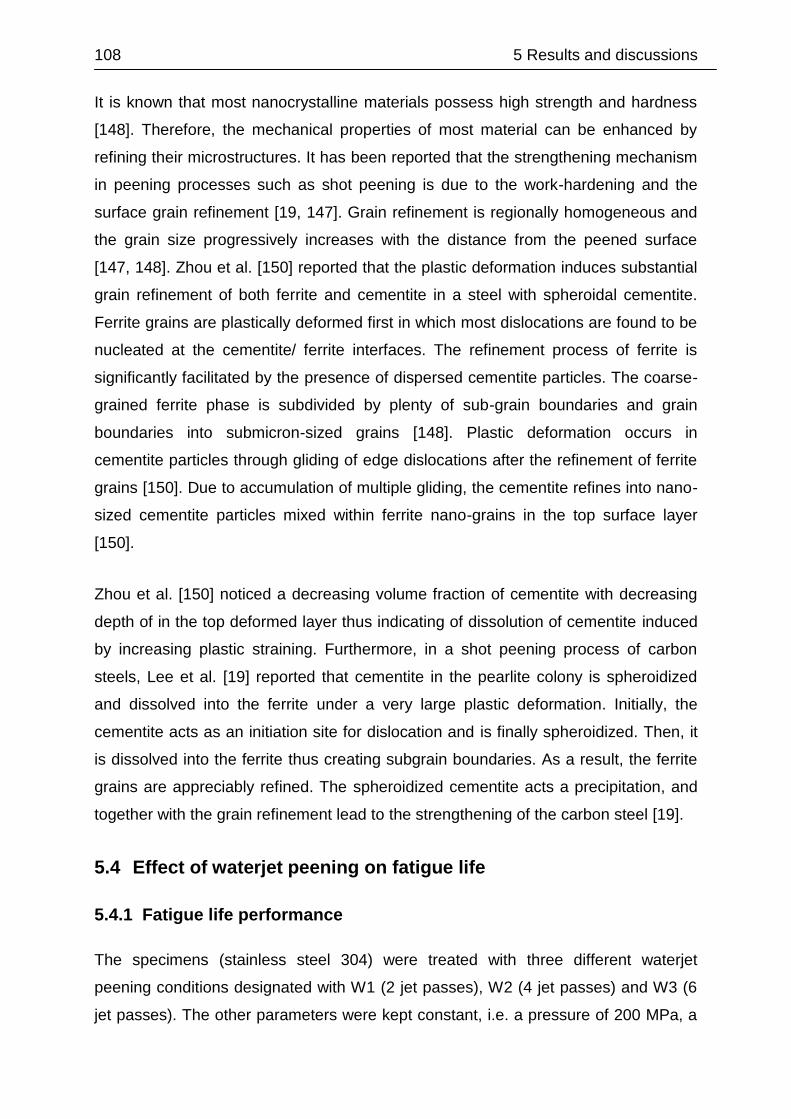
108 5 Results and discussions
It is known that most nanocrystalline materials possess high strength and hardness
[148]. Therefore, the mechanical properties of most material can be enhanced by
refining their microstructures. It has been reported that the strengthening mechanism
in peening processes such as shot peening is due to the work-hardening and the
surface grain refinement [19, 147]. Grain refinement is regionally homogeneous and
the grain size progressively increases with the distance from the peened surface
[147, 148]. Zhou et al. [150] reported that the plastic deformation induces substantial
grain refinement of both ferrite and cementite in a steel with spheroidal cementite.
Ferrite grains are plastically deformed first in which most dislocations are found to be
nucleated at the cementite/ ferrite interfaces. The refinement process of ferrite is
significantly facilitated by the presence of dispersed cementite particles. The coarse-
grained ferrite phase is subdivided by plenty of sub-grain boundaries and grain
boundaries into submicron-sized grains [148]. Plastic deformation occurs in
cementite particles through gliding of edge dislocations after the refinement of ferrite
grains [150]. Due to accumulation of multiple gliding, the cementite refines into nano-
sized cementite particles mixed within ferrite nano-grains in the top surface layer
[150].
Zhou et al. [150] noticed a decreasing volume fraction of cementite with decreasing
depth of in the top deformed layer thus indicating of dissolution of cementite induced
by increasing plastic straining. Furthermore, in a shot peening process of carbon
steels, Lee et al. [19] reported that cementite in the pearlite colony is spheroidized
and dissolved into the ferrite under a very large plastic deformation. Initially, the
cementite acts as an initiation site for dislocation and is finally spheroidized. Then, it
is dissolved into the ferrite thus creating subgrain boundaries. As a result, the ferrite
grains are appreciably refined. The spheroidized cementite acts a precipitation, and
together with the grain refinement lead to the strengthening of the carbon steel [19].
5.4 Effect of waterjet peening on fatigue life
5.4.1 Fatigue life performance
The specimens (stainless steel 304) were treated with three different waterjet
peening conditions designated with W1 (2 jet passes), W2 (4 jet passes) and W3 (6
jet passes). The other parameters were kept constant, i.e. a pressure of 200 MPa, a

5 Results and discussions 109
feedrate of 2000 mm/min and a standoff distance of 30 mm. The different treatment
conditions resulted in average surface roughnesses of 0.86, 2.20 and 3.43 µm for the
specimens of W1, W2 and W3 respectively as summarized in Table 5-1.
Table 5-1: Average surface roughness of treated and non-treated specimens
Specimens Surface roughness, Ra (µm) Surface hardness, HV0.01
(% increase)
Original 0.14 – 0.16 224 – 243
W1 0.78 – 0.94 249 – 265 (12%)
W2 1.60 – 2.62 255 – 275 (14%)
W3 2.34 – 4.86 275 – 289 (22%)
It is to note that the original specimen has an average surface roughness of 0.15 µm.
The treated surfaces are shown in Fig. 5-48. It can be seen that the waterjet
treatment covers the whole regions uniformly with the highest erosion for specimen
W3 followed by W2 and W1. It was also found that the maximum increases of
hardness in the surface were about 12%, 14% and 22% with respect to the base
material for the specimens of W1, W2 and W3 respectively [74].
Fig. 5-48: Surfaces of fatigue specimens, a) original, b) W1, c) W2 and d) W3. (Insets are magnified images)
30 µm
300 µm
a)
30 µm
300 µm
b)
30 µm
300 µm
c)
30 µm
300 µm
d)

110 5 Results and discussions
The results of the fatigue tests are plotted as the stress amplitudes versus N (number
of cycles). The S-N curves are shown in Fig. 5-49. Overall, the waterjet treated
specimens show a lower fatigue strength than the original specimens. Specimens
with the highest increase in hardness and also surface roughness (i.e. specimen W3)
resulted in the largest decrease in fatigue strength. This was followed by specimens
W2. It is interesting to note that, the specimens W1 do not show a decrease in
fatigue strength as compared to the original ones. Perhaps, it demonstrates a very
marginal increase in the fatigue strength. However, the increase in the fatigue
strength could not be conclusively said since only a limited number of specimens
were tested. In comparison with Arola et al. [91] in abrasive waterjet peening of the
same material, an increase in the fatigue strength of the treated specimen was
discored. However, the increase in the fatigue strength was rather limited less than
10% with respect to the untreated specimen. In contrast, no noticeable increase in
the fatigue strength was observed in the present study. Possibly, the amount of
compressive residual stress introduced over the specimen surface was very much
lower than Arola et al. [91]. This is to be expected since no abrasive particles were
used in the present study unlike Arola et al. [91]. It is known that using abrasive
particles in the waterjet peening might introduce a higher compressive residual stress
than a pure waterjet [68].
Fig. 5-49: Stress versus N diagrams for stainless steel 304
550
500
450
400
350
300
250 104 105 106 107
N
Untreated
W1
W2
W3
Be
nd
ing
str
ess a
mp
litud
e (
MP
a)
Untreated (run-out)
W1 (run-out)
W2 (run-out)
W3 (run-out)
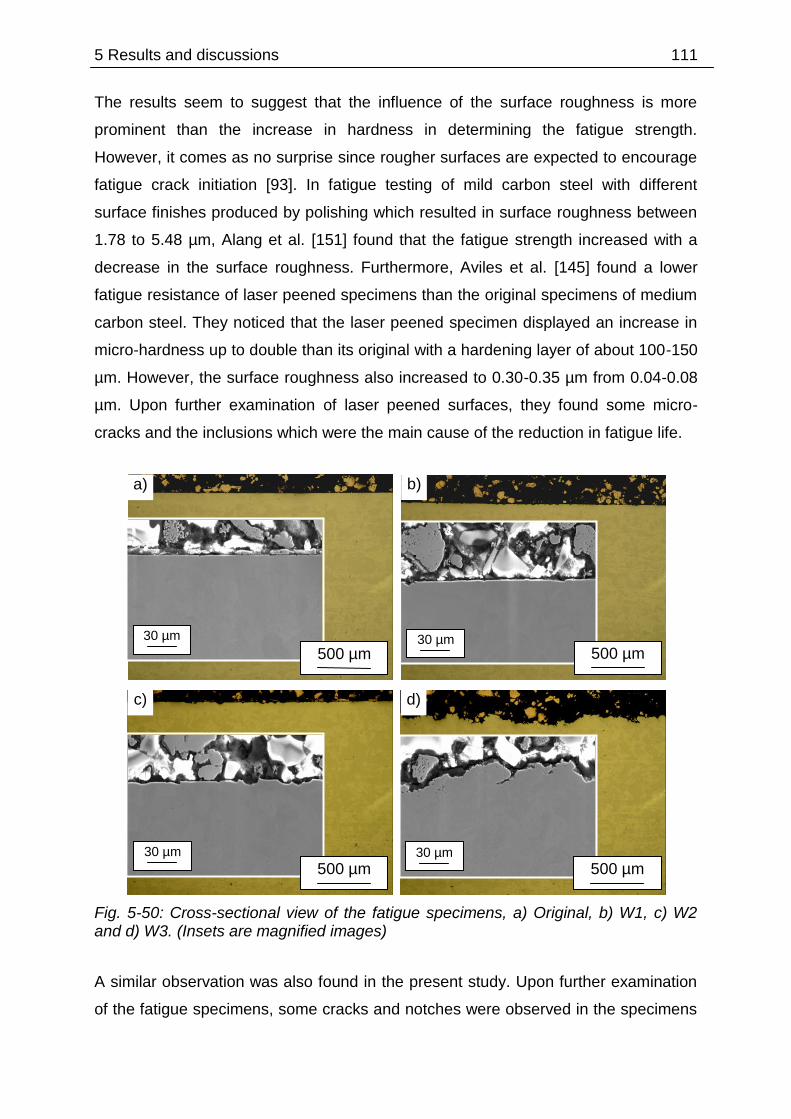
5 Results and discussions 111
The results seem to suggest that the influence of the surface roughness is more
prominent than the increase in hardness in determining the fatigue strength.
However, it comes as no surprise since rougher surfaces are expected to encourage
fatigue crack initiation [93]. In fatigue testing of mild carbon steel with different
surface finishes produced by polishing which resulted in surface roughness between
1.78 to 5.48 µm, Alang et al. [151] found that the fatigue strength increased with a
decrease in the surface roughness. Furthermore, Aviles et al. [145] found a lower
fatigue resistance of laser peened specimens than the original specimens of medium
carbon steel. They noticed that the laser peened specimen displayed an increase in
micro-hardness up to double than its original with a hardening layer of about 100-150
µm. However, the surface roughness also increased to 0.30-0.35 µm from 0.04-0.08
µm. Upon further examination of laser peened surfaces, they found some micro-
cracks and the inclusions which were the main cause of the reduction in fatigue life.
Fig. 5-50: Cross-sectional view of the fatigue specimens, a) Original, b) W1, c) W2 and d) W3. (Insets are magnified images)
A similar observation was also found in the present study. Upon further examination
of the fatigue specimens, some cracks and notches were observed in the specimens
30 µm
500 µm
c)
30 µm 500 µm
b)
30 µm
500 µm
a)
30 µm
500 µm
d)
112 5 Results and discussions
as shown in Fig. 5-48 as well as Fig. 5-50. It is clear that with increasing number of
jet passes, the number of surface defects increased significantly. As a result, the
higher roughness of the surface decreases the fatigue time for crack initiation.
It is also to note that no measurements of residual stresses were conducted for the
peened fatigue specimens in the present study. Therefore, the relationship between
the induced residual stresses and the fatigue strength cannot be established.
However, it is expected that the compressive residual stress is also introduced the
most in the specimens that displays the highest increase in the hardness (i.e.
specimen W3) as similarly observed in [32, 145, 152]. Also, this specimen produced
the highest amount of surface defects as shown in Fig. 5-48 (d) and Fig. 5-50 (d).
The initiation of cracks in peened specimens is dependent on the positive effect of
compressive residual stresses and the negative effect of surface defects [153]. In the
present case, the benefit of compressive residual stresses was possibly defeated by
the negative effect of surface defects thus leading to the overpeening effect. The high
amount of microcracks in the surface may just act as the crack initiation and easily
propagate during the fatigue test. Similar results were also found in shot peening
process [32, 152, 154] as well as laser shock peening process [145].
5.4.2 Surface fracture analysis
The broken specimens were later examined using SEM to determine the crack
initiation mechanisms. Since broken surfaces for different specimens tested at
different loads displayed little difference, only selected SEM images of the broken
specimens will be reported and discussed. The fractured surfaces of W1 specimen
are shown in Fig. 5-51. It can be seen that the crack initiations started mainly at both
upper and lower corners as shown in Fig. 5-51 (b) since these were the areas with
the highest stress concentrations. Similarly, the fatigue test of the untreated
specimens revealed that the cracks initiated at only these areas. However, it can also
be noticed that the cracks also initiated at the surface as shown in Fig. 5-51 (c). As
expected, this was possible since the surface experienced slight erosion due to the
waterjet treatment. Therefore, the notches on the surface act as the sites for the
cracks initiation. The residual fracture surface in the middle of the specimen shows a
typical ductile fracture mode with fatigue striation patterns as shown in Fig. 5-51 (d).
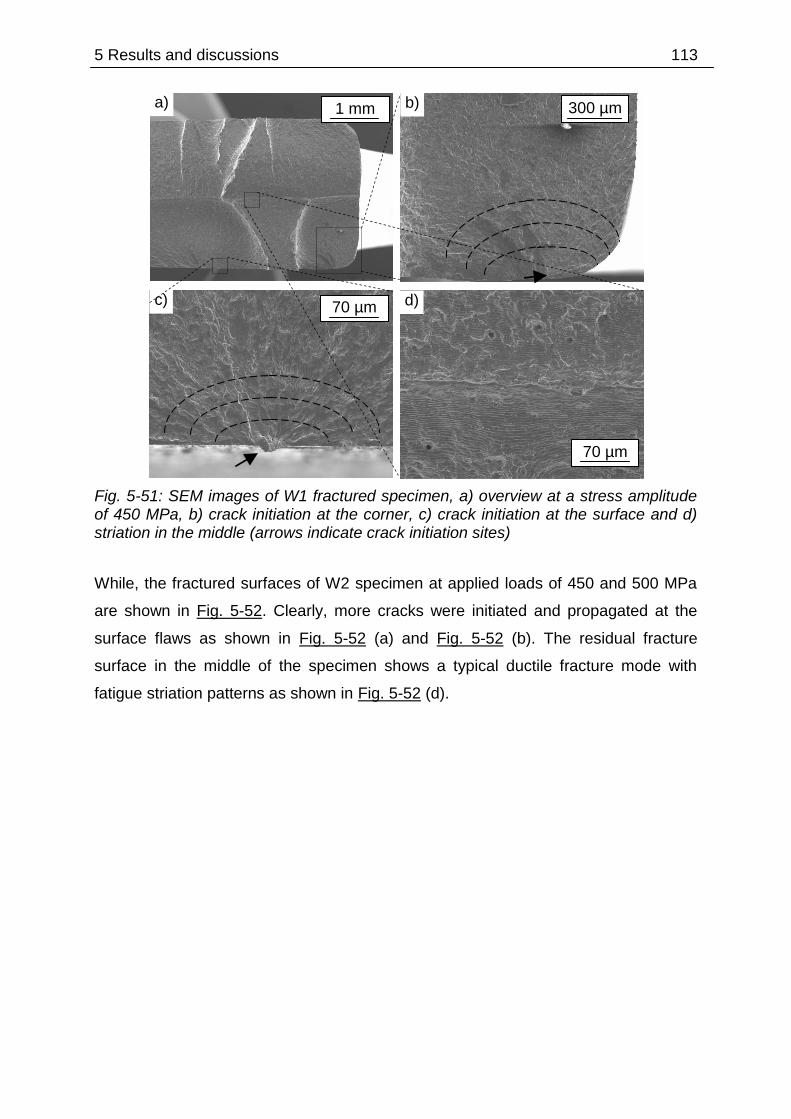
5 Results and discussions 113
Fig. 5-51: SEM images of W1 fractured specimen, a) overview at a stress amplitude of 450 MPa, b) crack initiation at the corner, c) crack initiation at the surface and d) striation in the middle (arrows indicate crack initiation sites)
While, the fractured surfaces of W2 specimen at applied loads of 450 and 500 MPa
are shown in Fig. 5-52. Clearly, more cracks were initiated and propagated at the
surface flaws as shown in Fig. 5-52 (a) and Fig. 5-52 (b). The residual fracture
surface in the middle of the specimen shows a typical ductile fracture mode with
fatigue striation patterns as shown in Fig. 5-52 (d).
a) b)
c) d)
70 µm
300 µm 1 mm
70 µm
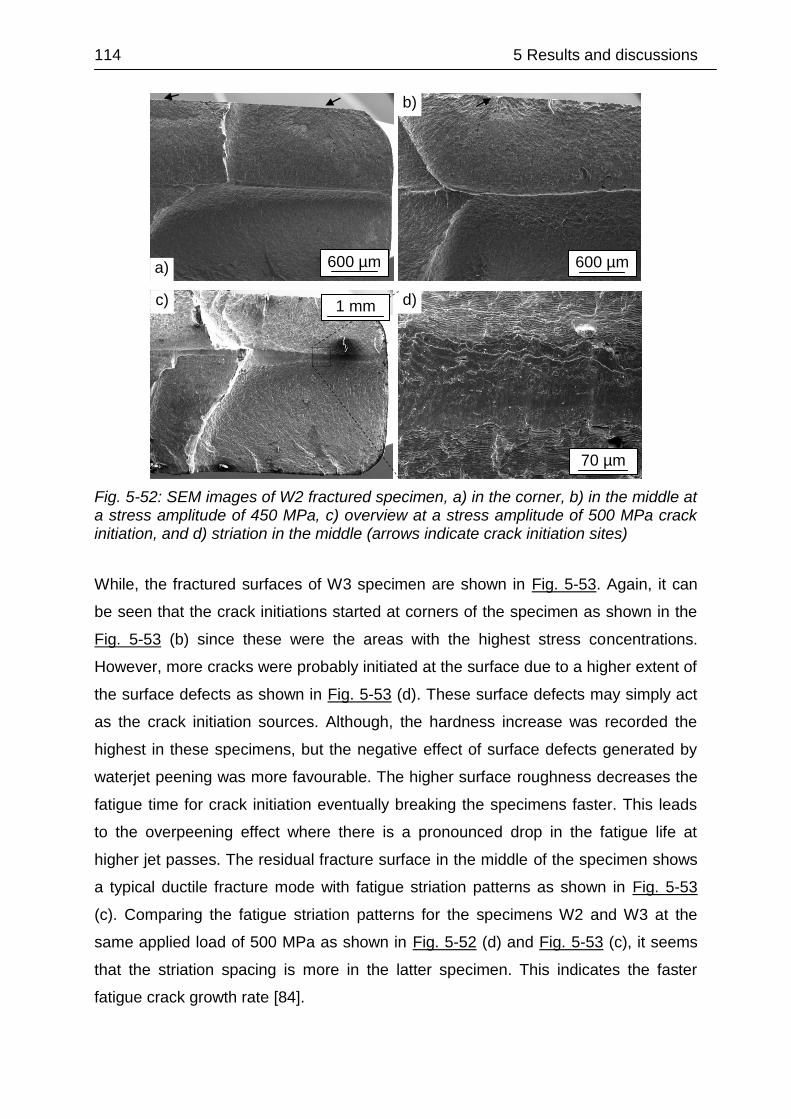
114 5 Results and discussions
Fig. 5-52: SEM images of W2 fractured specimen, a) in the corner, b) in the middle at a stress amplitude of 450 MPa, c) overview at a stress amplitude of 500 MPa crack initiation, and d) striation in the middle (arrows indicate crack initiation sites)
While, the fractured surfaces of W3 specimen are shown in Fig. 5-53. Again, it can
be seen that the crack initiations started at corners of the specimen as shown in the
Fig. 5-53 (b) since these were the areas with the highest stress concentrations.
However, more cracks were probably initiated at the surface due to a higher extent of
the surface defects as shown in Fig. 5-53 (d). These surface defects may simply act
as the crack initiation sources. Although, the hardness increase was recorded the
highest in these specimens, but the negative effect of surface defects generated by
waterjet peening was more favourable. The higher surface roughness decreases the
fatigue time for crack initiation eventually breaking the specimens faster. This leads
to the overpeening effect where there is a pronounced drop in the fatigue life at
higher jet passes. The residual fracture surface in the middle of the specimen shows
a typical ductile fracture mode with fatigue striation patterns as shown in Fig. 5-53
(c). Comparing the fatigue striation patterns for the specimens W2 and W3 at the
same applied load of 500 MPa as shown in Fig. 5-52 (d) and Fig. 5-53 (c), it seems
that the striation spacing is more in the latter specimen. This indicates the faster
fatigue crack growth rate [84].
b)
600 µm
d) c) 1 mm
70 µm
a) 600 µm

5 Results and discussions 115
Fig. 5-53: SEM images of W3 fractured specimen, a) overview at a stress amplitude of 500 MPa, b) crack initiation at the corner, c) crack initiation at the surface and d) overview at a stress amplitude of 350 MPa (arrows indicate crack initiation sites)
It is obvious that the fatigue strength under waterjet peening treatment is directly
related to the surface quality of the peened specimens as well as the location of
these defects. The surface defects act as stress concentration sites which magnify
the applied stresses according to the severity of the surface flaws, unlike bulk defects
which are more shielded by the surrounding materials [155]. This severity depends
on the size and shape of the surface defects. Sharper and deeper surface defects
may increase the concentration of stress at their crack tips that are more likely to act
as crack initiation sites [156]. A similar conclusion can be drawn as shown in the
present study where surfaces with more and severe defects result in higher crack
initiation sources thus lowering the fatigue strength of the material.
a) b)
c) d)
300 µm
600 µm
1 mm
70 µm

116 6 Optimization of the waterjet peening process
6 Optimization of the waterjet peening process
This chapter discusses the usage of a method to optimize the waterjet peening
process. The aluminium alloy 5005 was used as an example specimen. For a robust
process design, there is a need to focus on the optimization of parameters by
reducing the measured variation of quality characteristics. Therefore, a design of
experiment based on the response surface methodology can be utilized for the
process optimization. These collections of mathematical and statistical techniques
are useful for modelling and analysis in applications where a response of interest is
influenced by several factors and the objective is to optimize this response [157].
6.1 Design of experiment
Design of experiments (DOE) was first introduced by Fisher in the early 1920s
intended to study the effects of multiple variables simultaneously and most
economically using a statistical technique [158]. The process of DOE is carried out
for quality improvement purposes. Using DOE, all combinations of the factors
included in an experimental study are able to be laid out for investigation purposes. If
the number of possible combinations is too large, then a fraction of the total
possibilities is conducted such that all factors will be evenly present. Fisher devised
the first method that made it possible to analyze the effect of more than one factor at
a time [158]. The combinations are created using a matrix, which allows each factor
an equal number of test conditions. Statistical calculations such as mean and
ANalysis Of VAriance (ANOVA) are used to analyze the results of such experiments.
By studying the effects of individual factors on the results, the best factor combination
can be determined. When applied to product or process design, the method helps to
seek out the best design among the many alternatives.
The various methods of DOE can be used to solve scientific problems which involve
determining a proper combination of factors, ingredients, parameters and variables
rather than innovations or a single identifiable cause. In general, it is applicable to
any situation that depends on many influencing factors. It is a method that
scientifically gives the best option when facing with many possibilities. It is possible to
investigate one factor at a time to determine the effect of the factor but it is not
necessarily true since factors are interacting with each other in real-life application.
6 Optimization of the waterjet peening process 117
Real behaviour of the factors can be studied when the influences of all factors have
an equal opportunity to be present. Therefore, it is recommended to apply the DOE
technique to capture such effects. The number of necessary experiments depends
on the number of factors and their levels. Generally, the larger the number of factors,
the bigger is the reduction from the total possibilities in a full factorial experiment.
There are very few studies on waterjet peening that have explored on finding the
optimal conditions for various waterjet peening parameters affecting the quality
characteristics. Macodiyo and Soyama [96] investigated the effects of fatigue
strength of carburized chrome-molybdenum steel subjected to surface treatment by
cavitation peening. They used a design of experiment (DOE) based on the response
surface methodology (RSM) to model optimal conditions for the critical factors such
as processing times and cavitation number affecting fatigue strength. They found that
the cavitation number yielded better results in improving the fatigue strength of
chrome-molybdenum steel and the models used in the DOE were in agreement with
the experiments performed. Furthermore, Rajesh and Babu [97] established
empirical models of waterjet peening of aluminium alloy based on Taguchi’s
experimental design. They noticed only a slight deviation in the results predicted with
the models compared to the results obtained from the experiments.
6.2 Response surface methodology
In the present work, the response surface methodology (RSM) was selected as the
method for the experimental design. It is an empirical modelling approach for
determining the relationship between various processing parameters and responses
[159]. The Box–Behnken design is a widely used experimental design for RSM due
to its simplicity [160]. It requires only parameters at three different levels and it is
based on the combination of the factorial with incomplete block designs for each
independent parameter. Therefore, this design gives desirable statistical properties
and most importantly with only a fraction of the experiments required for three-level
factorials [160].
A statistical method known as multiple linear regression is widely used in building the
empirical models in RSM. It is a statistical technique for investigating and modelling
the relationship between variables, where an equation is established to relate the
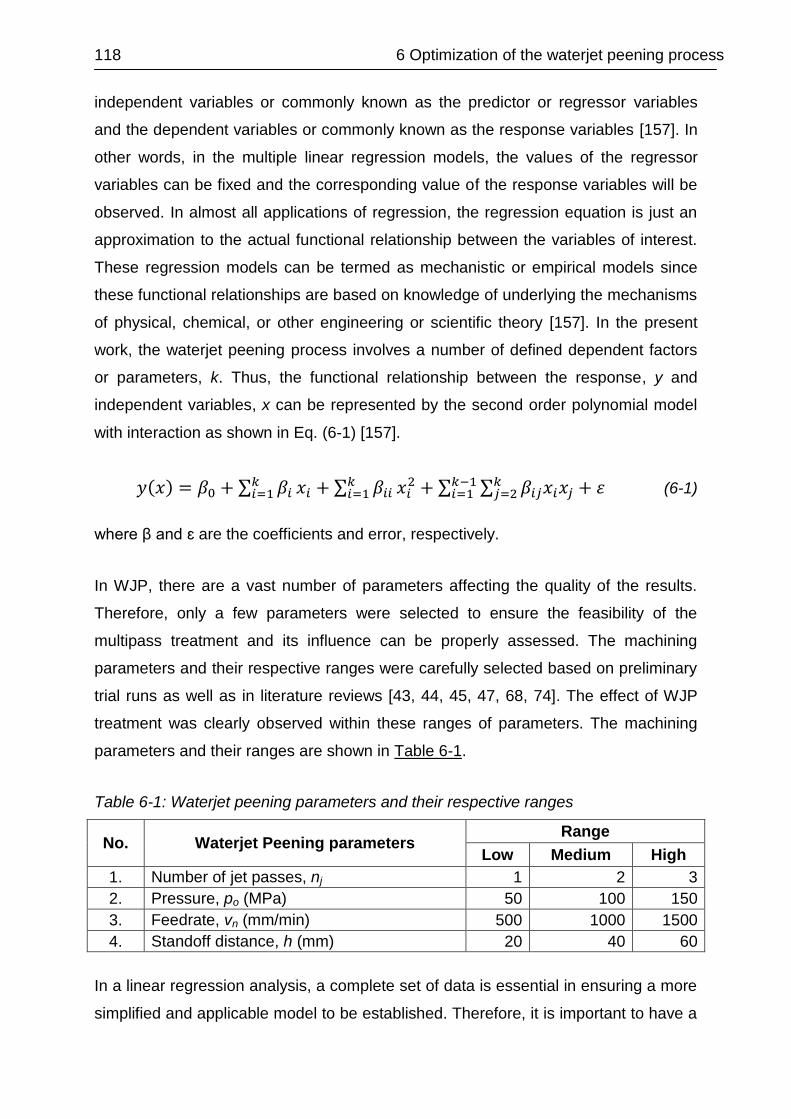
118 6 Optimization of the waterjet peening process
independent variables or commonly known as the predictor or regressor variables
and the dependent variables or commonly known as the response variables [157]. In
other words, in the multiple linear regression models, the values of the regressor
variables can be fixed and the corresponding value of the response variables will be
observed. In almost all applications of regression, the regression equation is just an
approximation to the actual functional relationship between the variables of interest.
These regression models can be termed as mechanistic or empirical models since
these functional relationships are based on knowledge of underlying the mechanisms
of physical, chemical, or other engineering or scientific theory [157]. In the present
work, the waterjet peening process involves a number of defined dependent factors
or parameters, k. Thus, the functional relationship between the response, y and
independent variables, x can be represented by the second order polynomial model
with interaction as shown in Eq. (6-1) [157].
( ) ∑ ∑
∑ ∑
(6-1)
where β and ԑ are the coefficients and error, respectively.
In WJP, there are a vast number of parameters affecting the quality of the results.
Therefore, only a few parameters were selected to ensure the feasibility of the
multipass treatment and its influence can be properly assessed. The machining
parameters and their respective ranges were carefully selected based on preliminary
trial runs as well as in literature reviews [43, 44, 45, 47, 68, 74]. The effect of WJP
treatment was clearly observed within these ranges of parameters. The machining
parameters and their ranges are shown in Table 6-1.
Table 6-1: Waterjet peening parameters and their respective ranges
No. Waterjet Peening parameters Range
Low Medium High
1. Number of jet passes, nj 1 2 3
2. Pressure, po (MPa) 50 100 150
3. Feedrate, vn (mm/min) 500 1000 1500
4. Standoff distance, h (mm) 20 40 60
In a linear regression analysis, a complete set of data is essential in ensuring a more
simplified and applicable model to be established. Therefore, it is important to have a

6 Optimization of the waterjet peening process 119
good method of data collection. The best way of collecting data is using a designed
experiment where a set of parameters or factors and their levels can be manipulated.
In the present study, the Box-Behnken experimental design was used to create a
sufficient set of data.
The total number of experiments is based on the number of parameters and their
levels [157]. Since in the present case, there is a total of four parameters with each at
three levels, therefore a total number of 29 experiments is required based on the
Box-Behnken experimental design. In determining the total number of experiments,
the experimental design is divided into blocks representing the number of interactions
between any 2 parameters. In each block, a certain number of parameters are put
through all combinations for the factorial design, while the other parameters are kept
at the central values. For instance, the Box-Behnken design for 4 parameters
involves six blocks, in each of which 2 parameters are varied through the 4 possible
combinations of high and low. This gives the total number of experiments of 24 (i.e. 6
blocks multiply with 4 possible combinations in each block). With additional of 5
experimental runs at a centre point, the total number of experiments becomes 29.
A centre point (i.e. in which all factors are at their central values) was included in the
experimental design. The experimental run at the centre point is included as to
improve the accuracy and repeatability of the experimental design. The experimental
runs for the centre point were repeated 5 times (i.e. at experimental runs number 1,
10, 14, 15 and 19). A software for design of experiments, Design-Expert®, was used
for analyzing the experimental results based on the response surface methodology
approach.A total of 29 experimental runs were carried out in the present study as
shown in Table 6-2.
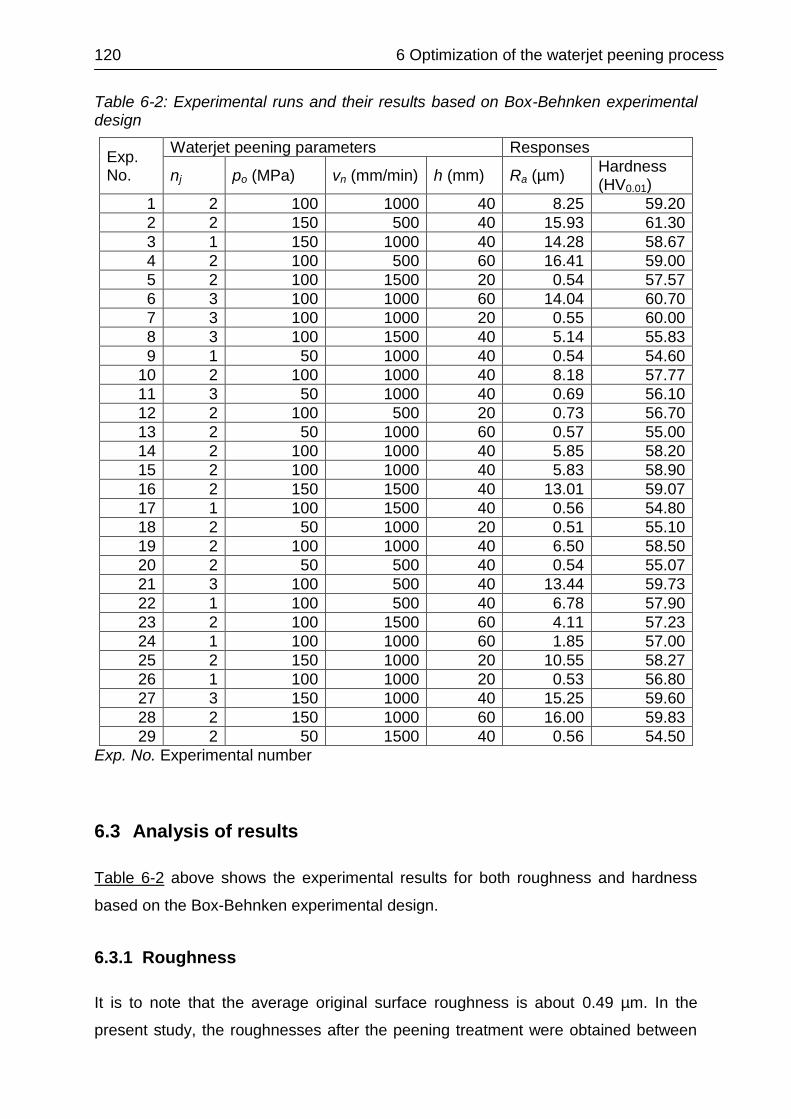
120 6 Optimization of the waterjet peening process
Table 6-2: Experimental runs and their results based on Box-Behnken experimental design
Exp. No.
Waterjet peening parameters Responses
nj po (MPa) vn (mm/min) h (mm) Ra (µm) Hardness (HV0.01)
1 2 100 1000 40 8.25 59.20
2 2 150 500 40 15.93 61.30
3 1 150 1000 40 14.28 58.67
4 2 100 500 60 16.41 59.00
5 2 100 1500 20 0.54 57.57
6 3 100 1000 60 14.04 60.70
7 3 100 1000 20 0.55 60.00
8 3 100 1500 40 5.14 55.83
9 1 50 1000 40 0.54 54.60
10 2 100 1000 40 8.18 57.77
11 3 50 1000 40 0.69 56.10
12 2 100 500 20 0.73 56.70
13 2 50 1000 60 0.57 55.00
14 2 100 1000 40 5.85 58.20
15 2 100 1000 40 5.83 58.90
16 2 150 1500 40 13.01 59.07
17 1 100 1500 40 0.56 54.80
18 2 50 1000 20 0.51 55.10
19 2 100 1000 40 6.50 58.50
20 2 50 500 40 0.54 55.07
21 3 100 500 40 13.44 59.73
22 1 100 500 40 6.78 57.90
23 2 100 1500 60 4.11 57.23
24 1 100 1000 60 1.85 57.00
25 2 150 1000 20 10.55 58.27
26 1 100 1000 20 0.53 56.80
27 3 150 1000 40 15.25 59.60
28 2 150 1000 60 16.00 59.83
29 2 50 1500 40 0.56 54.50
Exp. No. Experimental number
6.3 Analysis of results
Table 6-2 above shows the experimental results for both roughness and hardness
based on the Box-Behnken experimental design.
6.3.1 Roughness
It is to note that the average original surface roughness is about 0.49 µm. In the
present study, the roughnesses after the peening treatment were obtained between

6 Optimization of the waterjet peening process 121
0.51 to 16.42 µm. Based on the roughness level of all experimental runs, the results
can be divided into three different groups. The first group consists of experimental
runs with a low roughness below 1 µm. The experimental runs in the second group
have a range of roughness between 1 to 10 µm. Finally, the third group refers to the
experimental runs which have a high roughness of more than 10 µm.
About 11 experimental runs produce roughnesses below 1 µm. An example of a 3D
image of the surface structure in this group is shown in Fig. 6-1. The erosion on the
surfaces are hardly to be observed and they are comparable to the original surface.
The amount of removed material is nearly zero. A further analysis for experimental
run number 5 shows that the maximum depth of the pit was 2.90 µm. In comparison,
the original surface has the maximum depth of the pit about 2.79 µm. Nevertheless,
the maximum depth of the pit within this group varies from 2.80 to 4.50 µm.
Fig. 6-1: 3D images of surface structures for experimental run number 5 (Ra = 0.54 µm)
About 9 experimental runs have roughnesses between 1 to 10 µm. An example of 3D
image of surface structure in this group is shown in Fig. 6-2 for the experimental run
number 22. In this group, there is significant erosion over the surfaces. However, the
erosion track is not continuous as shown in Fig. 6-2. Furthermore, no constant width
of erosion track is produced on the surface. There is a moderate removal of material
with high values of the valley-to-peak between 34.50 to 73.67 µm.
0.000
1989.1
[µm]
2004.7
[µm]
50.11
25.30
0.48
-24.34
-49.15
[µm]
0.000
1989.1
[µm]
2004.7
[µm]
50.11
25.30
0.48
-24.34
-49.15
[µm]
1600 µm
1600 µm
0.0 µm
50.11 [µm]
0.48
-49.15
Direction of nozzle traverse
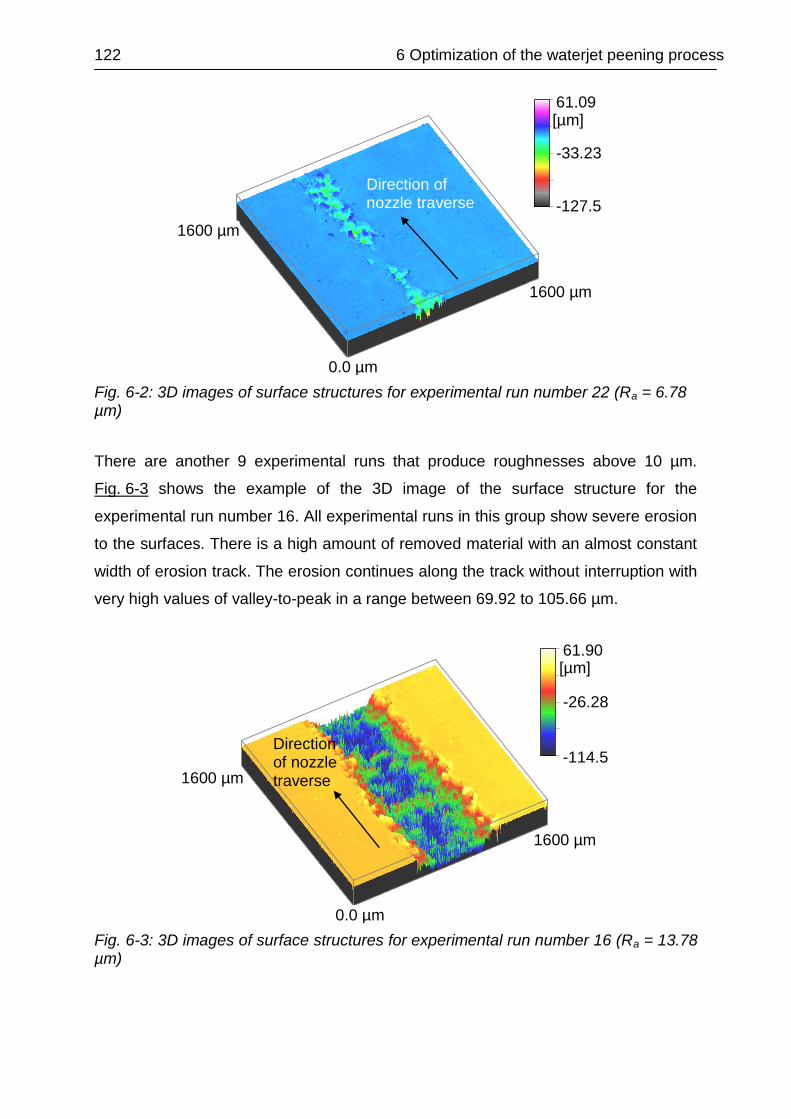
122 6 Optimization of the waterjet peening process
Fig. 6-2: 3D images of surface structures for experimental run number 22 (Ra = 6.78 µm)
There are another 9 experimental runs that produce roughnesses above 10 µm.
Fig. 6-3 shows the example of the 3D image of the surface structure for the
experimental run number 16. All experimental runs in this group show severe erosion
to the surfaces. There is a high amount of removed material with an almost constant
width of erosion track. The erosion continues along the track without interruption with
very high values of valley-to-peak in a range between 69.92 to 105.66 µm.
Fig. 6-3: 3D images of surface structures for experimental run number 16 (Ra = 13.78 µm)
0.000
1975.0
[µm]
1990.6
[µm]
61.90
17.81
-26.28
-70.37
-114.45
[µm]
1600 µm
1600 µm
0.0 µm
0.000
1975.0
[µm]
1990.6
[µm]
61.90
17.81
-26.28
-70.37
-114.45
[µm]
61.90 [µm]
-26.28
-114.5 Direction of nozzle traverse
0.000
1987.5
[µm]
1998.4
[µm]
61.09
13.93
-33.23
-80.39
-127.54
[µm]
1600 µm
1600 µm
0.0 µm
0.000
1987.5
[µm]
1998.4
[µm]
61.09
13.93
-33.23
-80.39
-127.54
[µm]
61.09 [µm]
-33.23
-127.5
Direction of nozzle traverse
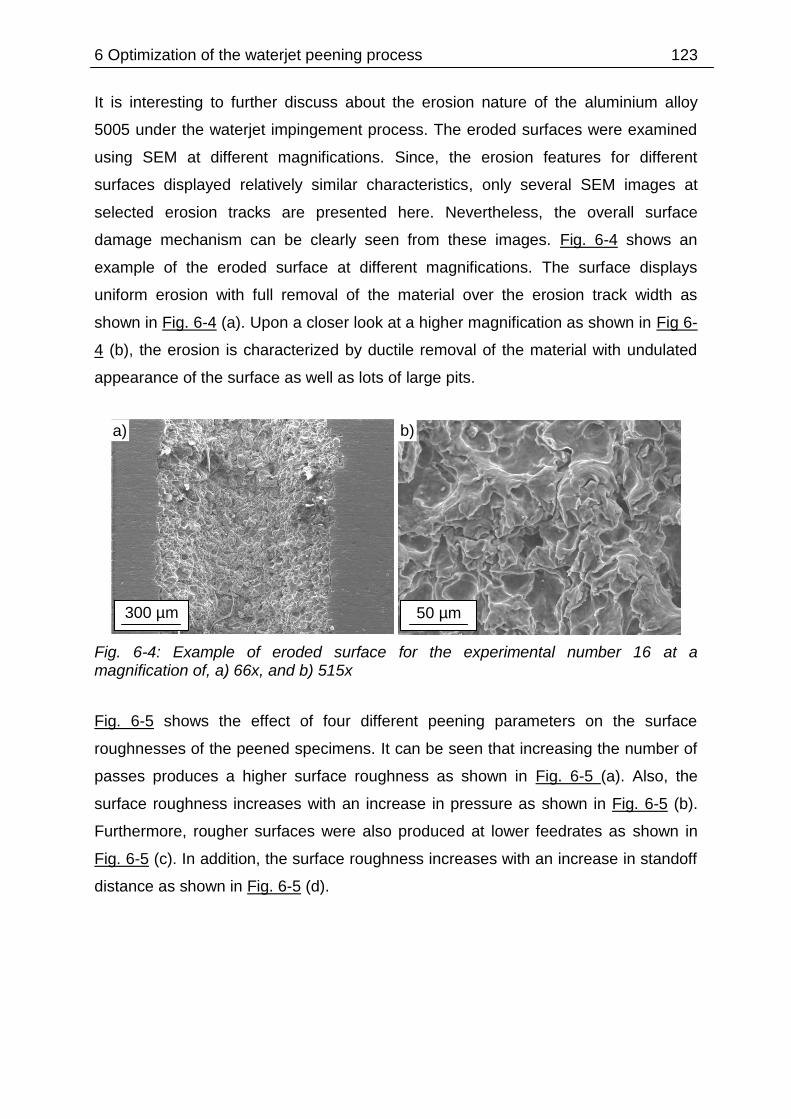
6 Optimization of the waterjet peening process 123
It is interesting to further discuss about the erosion nature of the aluminium alloy
5005 under the waterjet impingement process. The eroded surfaces were examined
using SEM at different magnifications. Since, the erosion features for different
surfaces displayed relatively similar characteristics, only several SEM images at
selected erosion tracks are presented here. Nevertheless, the overall surface
damage mechanism can be clearly seen from these images. Fig. 6-4 shows an
example of the eroded surface at different magnifications. The surface displays
uniform erosion with full removal of the material over the erosion track width as
shown in Fig. 6-4 (a). Upon a closer look at a higher magnification as shown in Fig 6-
4 (b), the erosion is characterized by ductile removal of the material with undulated
appearance of the surface as well as lots of large pits.
Fig. 6-4: Example of eroded surface for the experimental number 16 at a magnification of, a) 66x, and b) 515x
Fig. 6-5 shows the effect of four different peening parameters on the surface
roughnesses of the peened specimens. It can be seen that increasing the number of
passes produces a higher surface roughness as shown in Fig. 6-5 (a). Also, the
surface roughness increases with an increase in pressure as shown in Fig. 6-5 (b).
Furthermore, rougher surfaces were also produced at lower feedrates as shown in
Fig. 6-5 (c). In addition, the surface roughness increases with an increase in standoff
distance as shown in Fig. 6-5 (d).
a)
300 µm
b)
50 µm

124 6 Optimization of the waterjet peening process
Fig. 6-5: Effect of, a) number of passes, b) pressure, c) feedrate, and d) standoff distance on Ra
6.3.2 Hardness
On the basis of the three different groups as discussed above, the effect of surface
roughness on hardness was analyzed. It is to note that the base material has an
average hardness of approximately 53.58 HV0.01. The change in hardness as a
function of the depth below the eroded surface for a few experimental runs which
produced roughnesses below 1 µm is shown in Fig. 6-6. The roughnesses for trial 13,
18 and 20 are 0.57, 051 and 054 µm, respectively. Overall, there are almost no
changes in hardness values along the depth. It may seem to be a very small change
of hardness gradients near to the surface. But, the error bars are quite long to
strongly suggest that there is any change in hardness gradients in the present study.
150 50 100
b) Pressure (MPa)
3 1 2
0
15
20
Rou
ghn
ess (
µm
)
a) Number of passes
5
10
1500 500 1000
c) Feedrate (mm/min)
60 20 40
d) Standoff distance (mm)
0
15
20
Rou
ghn
ess (
µm
)
5
10
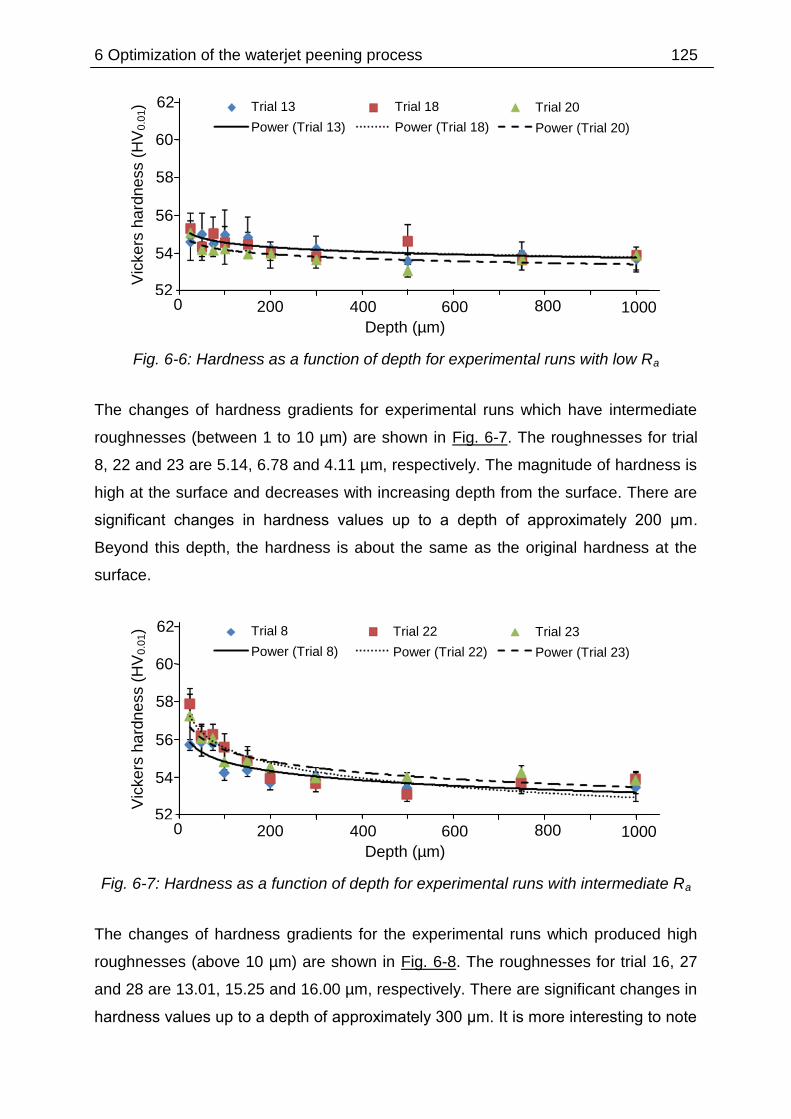
6 Optimization of the waterjet peening process 125
Fig. 6-6: Hardness as a function of depth for experimental runs with low Ra
The changes of hardness gradients for experimental runs which have intermediate
roughnesses (between 1 to 10 µm) are shown in Fig. 6-7. The roughnesses for trial
8, 22 and 23 are 5.14, 6.78 and 4.11 µm, respectively. The magnitude of hardness is
high at the surface and decreases with increasing depth from the surface. There are
significant changes in hardness values up to a depth of approximately 200 μm.
Beyond this depth, the hardness is about the same as the original hardness at the
surface.
Fig. 6-7: Hardness as a function of depth for experimental runs with intermediate Ra
The changes of hardness gradients for the experimental runs which produced high
roughnesses (above 10 µm) are shown in Fig. 6-8. The roughnesses for trial 16, 27
and 28 are 13.01, 15.25 and 16.00 µm, respectively. There are significant changes in
hardness values up to a depth of approximately 300 μm. It is more interesting to note
62
60
58
56
54
52 0 400 600 800
Depth (µm)
Trial 8
Power (Trial 8)
Vic
ke
rs h
ard
ne
ss (
HV
0.0
1)
200 1000
Trial 22
Power (Trial 22)
Trial 23
Power (Trial 23)
62
60
58
56
54
52 0 400 600 800
Depth (µm)
Trial 13
Power (Trial 13) V
ickers
ha
rdn
ess (
HV
0.0
1)
200 1000
Trial 18
Power (Trial 18)
Trial 20
Power (Trial 20)
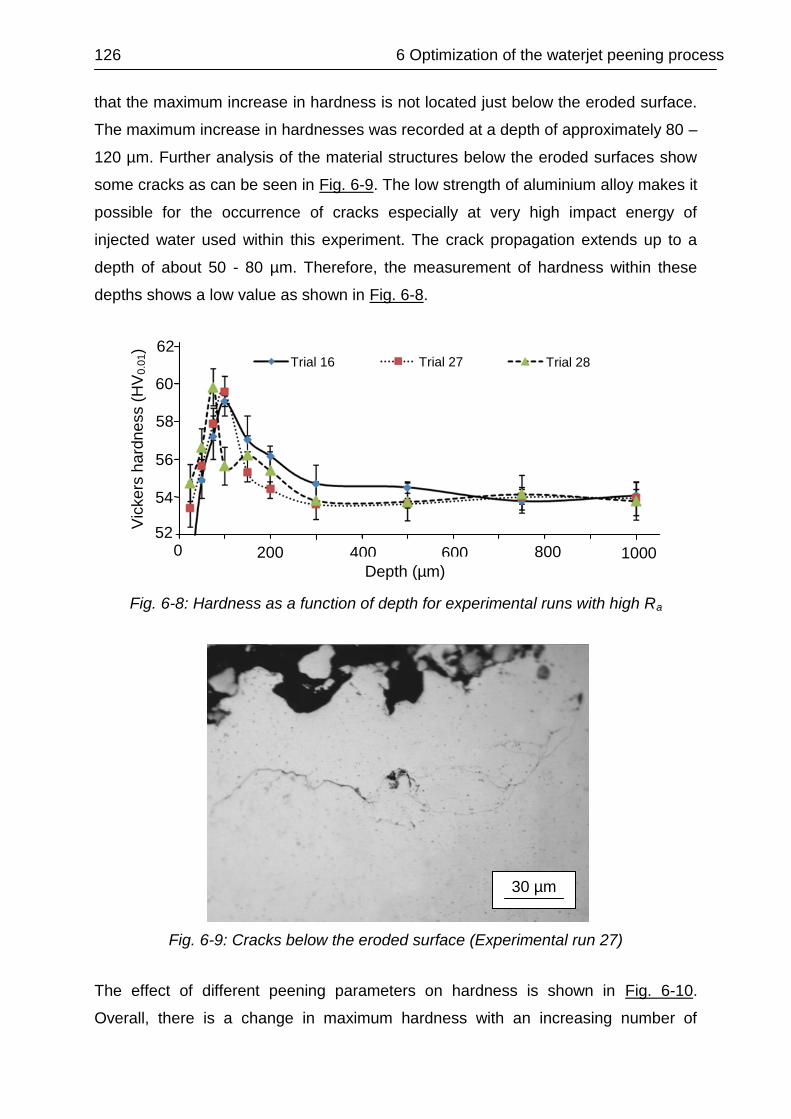
126 6 Optimization of the waterjet peening process
that the maximum increase in hardness is not located just below the eroded surface.
The maximum increase in hardnesses was recorded at a depth of approximately 80 –
120 µm. Further analysis of the material structures below the eroded surfaces show
some cracks as can be seen in Fig. 6-9. The low strength of aluminium alloy makes it
possible for the occurrence of cracks especially at very high impact energy of
injected water used within this experiment. The crack propagation extends up to a
depth of about 50 - 80 µm. Therefore, the measurement of hardness within these
depths shows a low value as shown in Fig. 6-8.
Fig. 6-8: Hardness as a function of depth for experimental runs with high Ra
Fig. 6-9: Cracks below the eroded surface (Experimental run 27)
The effect of different peening parameters on hardness is shown in Fig. 6-10.
Overall, there is a change in maximum hardness with an increasing number of
30 µm
62
60
58
56
54
52 0 400 600 800
Depth (µm)
Trial 16
Vic
kers
ha
rdn
ess (
HV
0.0
1)
200 1000
Trial 27 Trial 28
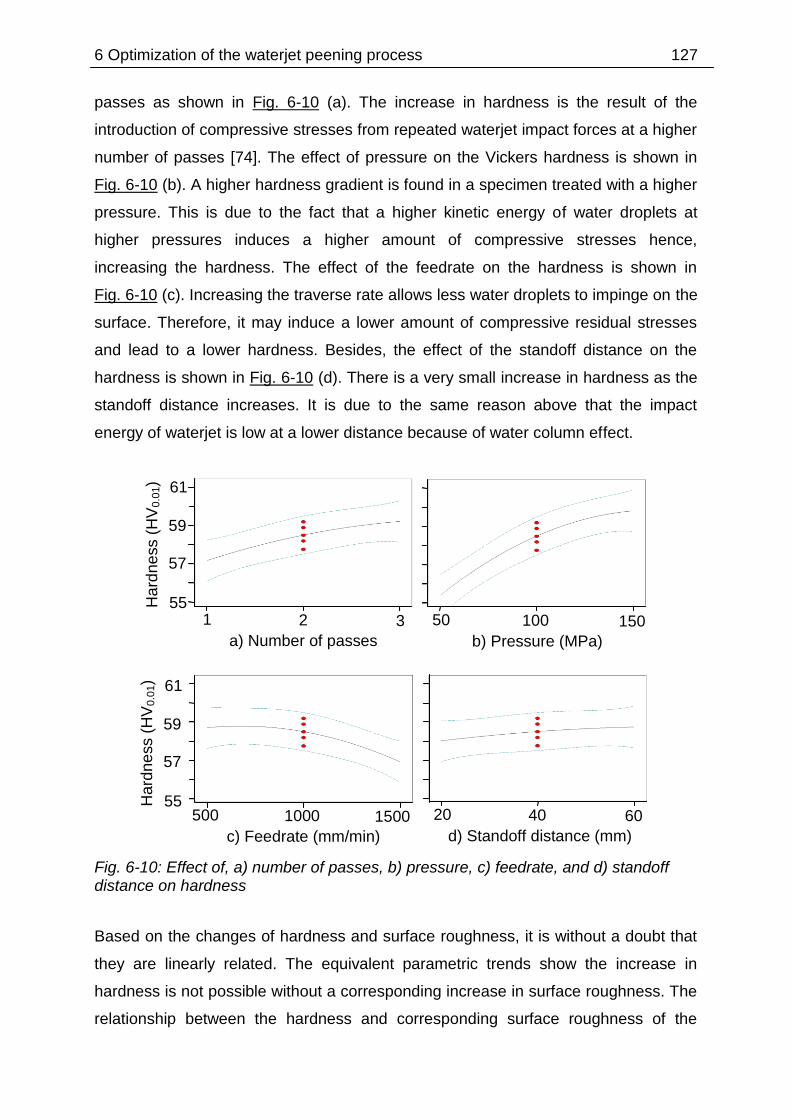
6 Optimization of the waterjet peening process 127
passes as shown in Fig. 6-10 (a). The increase in hardness is the result of the
introduction of compressive stresses from repeated waterjet impact forces at a higher
number of passes [74]. The effect of pressure on the Vickers hardness is shown in
Fig. 6-10 (b). A higher hardness gradient is found in a specimen treated with a higher
pressure. This is due to the fact that a higher kinetic energy of water droplets at
higher pressures induces a higher amount of compressive stresses hence,
increasing the hardness. The effect of the feedrate on the hardness is shown in
Fig. 6-10 (c). Increasing the traverse rate allows less water droplets to impinge on the
surface. Therefore, it may induce a lower amount of compressive residual stresses
and lead to a lower hardness. Besides, the effect of the standoff distance on the
hardness is shown in Fig. 6-10 (d). There is a very small increase in hardness as the
standoff distance increases. It is due to the same reason above that the impact
energy of waterjet is low at a lower distance because of water column effect.
Fig. 6-10: Effect of, a) number of passes, b) pressure, c) feedrate, and d) standoff distance on hardness
Based on the changes of hardness and surface roughness, it is without a doubt that
they are linearly related. The equivalent parametric trends show the increase in
hardness is not possible without a corresponding increase in surface roughness. The
relationship between the hardness and corresponding surface roughness of the
150 50 100
b) Pressure (MPa)
3 1 2
Hard
ne
ss (
HV
0.0
1)
a) Number of passes
55
57
59
61
1500 500 1000
c) Feedrate (mm/min)
60 20 40
d) Standoff distance (mm)
Hard
ne
ss (
HV
0.0
1)
55
57
59
61

128 6 Optimization of the waterjet peening process
waterjet peened AA 5005 is shown in Fig. 6-11. Similarly, a higher residual stress
was found in the specimens with a higher surface roughness [91]. Unsurprisingly, the
parametric combinations that give a high energy of waterjet (e.g. high pressure, etc)
may induce a high degree of compressive residual stress and hardness. Also, due to
the high energy of the waterjet, significant erosion of the surface may be occurred.
Fig. 6-11: Relationship between the average surface roughness and hardness resulting from waterjet peening of AA 5005
Based on the experimental data set in Table 6-2, the surface roughness (Ra) and the
hardness (HV) empirical models were developed. The Ra model describes the
average roughness on the surface while the HV model shows the maximum of the
hardness value below the surface. The hardness for every trial run was measured
across the specimen depth. An average of at least four hardness data was recorded
at every depth. Therefore, for the purpose of developing a model for hardness, only a
single value of hardness is needed for every trial run. So only the maximum hardness
(average) value at a certain depth for each trial run was recorded in Table 6-2. Thus,
the empirical model for hardness is capable to predict only the maximum hardness
after the peening process regardless of the depth of hardening layer. The coefficients
of regression were determined using the stepwise method of the Design Expert
software. The two models were based on the 29 experimental runs conducted
62
56
54
52 0 3
Surface roughness, Ra (µm)
Vic
kers
ha
rdn
ess (
HV
0.0
1)
12 6 9 15 18
60
58
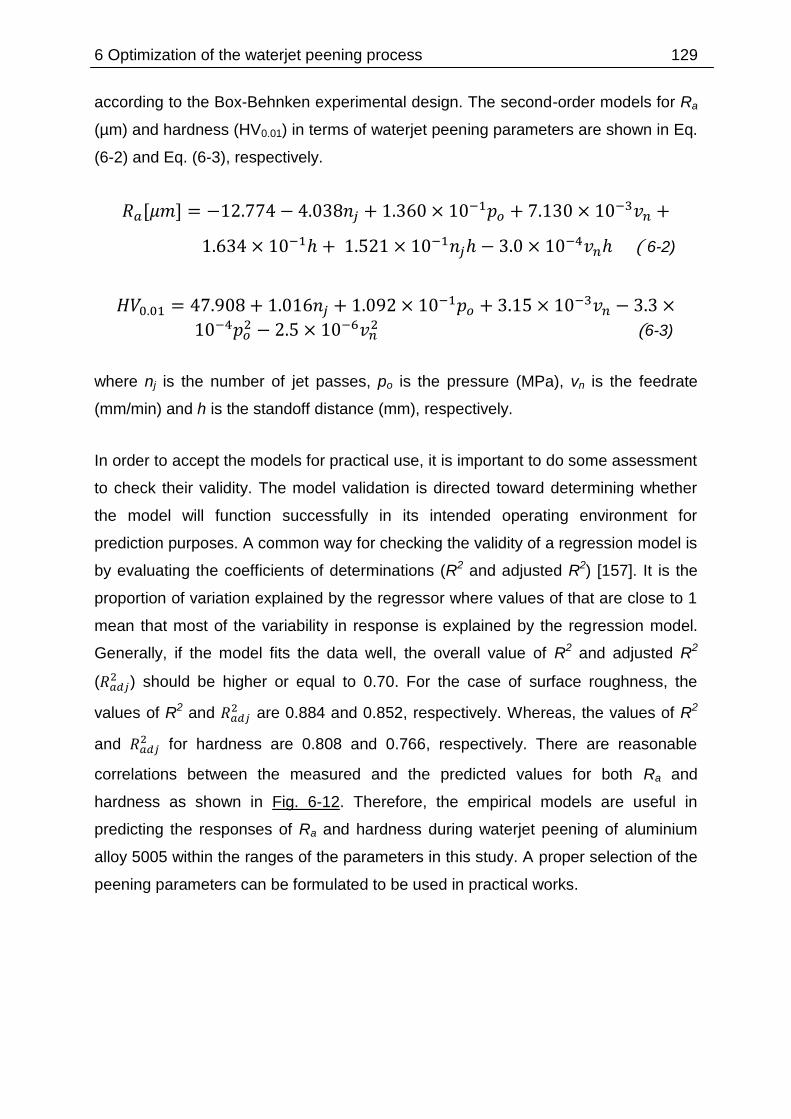
6 Optimization of the waterjet peening process 129
according to the Box-Behnken experimental design. The second-order models for Ra
(µm) and hardness (HV0.01) in terms of waterjet peening parameters are shown in Eq.
(6-2) and Eq. (6-3), respectively.
( 6-2)
(6-3)
where nj is the number of jet passes, po is the pressure (MPa), vn is the feedrate
(mm/min) and h is the standoff distance (mm), respectively.
In order to accept the models for practical use, it is important to do some assessment
to check their validity. The model validation is directed toward determining whether
the model will function successfully in its intended operating environment for
prediction purposes. A common way for checking the validity of a regression model is
by evaluating the coefficients of determinations (R2 and adjusted R2) [157]. It is the
proportion of variation explained by the regressor where values of that are close to 1
mean that most of the variability in response is explained by the regression model.
Generally, if the model fits the data well, the overall value of R2 and adjusted R2
( ) should be higher or equal to 0.70. For the case of surface roughness, the
values of R2 and are 0.884 and 0.852, respectively. Whereas, the values of R2
and for hardness are 0.808 and 0.766, respectively. There are reasonable
correlations between the measured and the predicted values for both Ra and
hardness as shown in Fig. 6-12. Therefore, the empirical models are useful in
predicting the responses of Ra and hardness during waterjet peening of aluminium
alloy 5005 within the ranges of the parameters in this study. A proper selection of the
peening parameters can be formulated to be used in practical works.
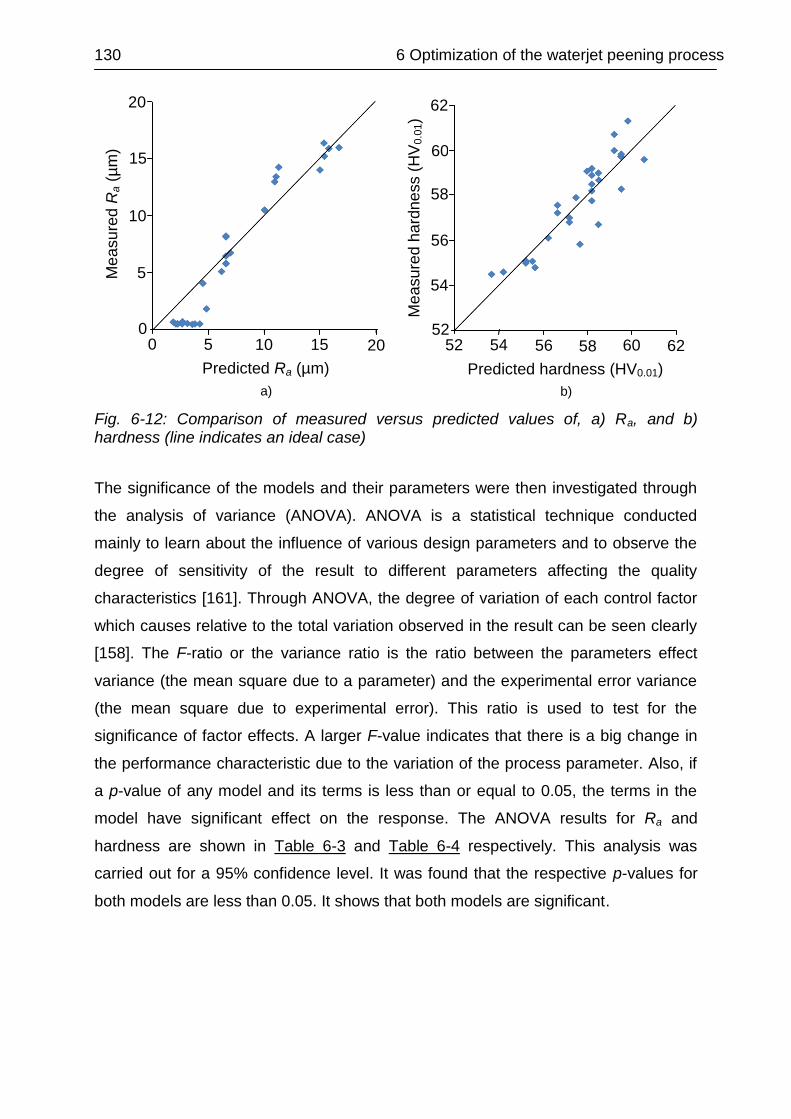
130 6 Optimization of the waterjet peening process
Fig. 6-12: Comparison of measured versus predicted values of, a) Ra, and b) hardness (line indicates an ideal case)
The significance of the models and their parameters were then investigated through
the analysis of variance (ANOVA). ANOVA is a statistical technique conducted
mainly to learn about the influence of various design parameters and to observe the
degree of sensitivity of the result to different parameters affecting the quality
characteristics [161]. Through ANOVA, the degree of variation of each control factor
which causes relative to the total variation observed in the result can be seen clearly
[158]. The F-ratio or the variance ratio is the ratio between the parameters effect
variance (the mean square due to a parameter) and the experimental error variance
(the mean square due to experimental error). This ratio is used to test for the
significance of factor effects. A larger F-value indicates that there is a big change in
the performance characteristic due to the variation of the process parameter. Also, if
a p-value of any model and its terms is less than or equal to 0.05, the terms in the
model have significant effect on the response. The ANOVA results for Ra and
hardness are shown in Table 6-3 and Table 6-4 respectively. This analysis was
carried out for a 95% confidence level. It was found that the respective p-values for
both models are less than 0.05. It shows that both models are significant.
b)
62
60
58
56
54
52 52 54 56
Predicted hardness (HV0.01)
Me
asu
red h
ard
ne
ss (
HV
0.0
1)
62 58 60
a)
20
15
10
5
0 0 5
Predicted Ra (µm)
Me
asu
red R
a (
µm
)
20 10 15

6 Optimization of the waterjet peening process 131
Table 6-3: ANOVA results for surface roughness (Ra)
Source Sum of squares
Degree of freedom
Mean square
F-value p value
(Prob > F)
Model 884.046 6 147.341 27.826 < 0.0001
n 50.307 1 50.307 9.501 0.0054
p 555.016 1 555.016 104.816 < 0.0001
u 74.551 1 74.507 14.079 0.0011
h 130.482 1 130.482 24.641 < 0.0001
nh 37.027 1 37.027 6.992 0.0148
uh 36.663 1 36.663 6.923 0.0152
Residual 116.493 22 5.295 - -
Lack of fit 110.627 18 6.146 4.191 0.0872
Pure error 5.866 4 1.466 - -
Cor total 1000.539 28 - - -
Prob Probability, Cor total Corrected total Corrected total=Total Sum of squares (SS) for the model terms + Residual SS and Corrected total = Sum of degrees of freedom (df) of all the model terms + residual df
Based on the p-value for the Ra model as shown in Table 6-3, all the model terms are
significant with pressure having the highest degree of significance followed by
standoff distance, feedrate and number of passes. Furthermore, the interactions
either between the number of passes and the standoff distance as well as between
the feedrate and the standoff distance are also significant but they have a low degree
of significance on the surface roughness. It is also good to note that as discussed
above, none of the experimental runs with roughnesses below 10 µm were treated
with the highest pressure of 150 MPa. This simply confirms that the pressure is the
most significant parameter in influencing the surface roughness in this experiment.
Hence, treating the surfaces with the highest pressure will certainly produce
extensively rougher surfaces.
The p-value of the lack of fit test is 0.08. It is insignificant since its value is more than
0.05 thus indicating that all the data in this study fit the model adequately. The
individual influence of each parameter on Ra was discussed above. However, it is
interesting to discuss about the significant interaction effects between the number of
passes and the standoff distance as well as between the feedrate and the standoff
distance. As shown in Table 6-3, both interactions are significant as indicated by the
p-values which are less than 0.05. The effect of interaction between the number of
passes and the standoff distance on Ra is shown in Fig. 6-13. It can be observed that
at a lower number of passes, Ra shows only marginal changes at different levels of
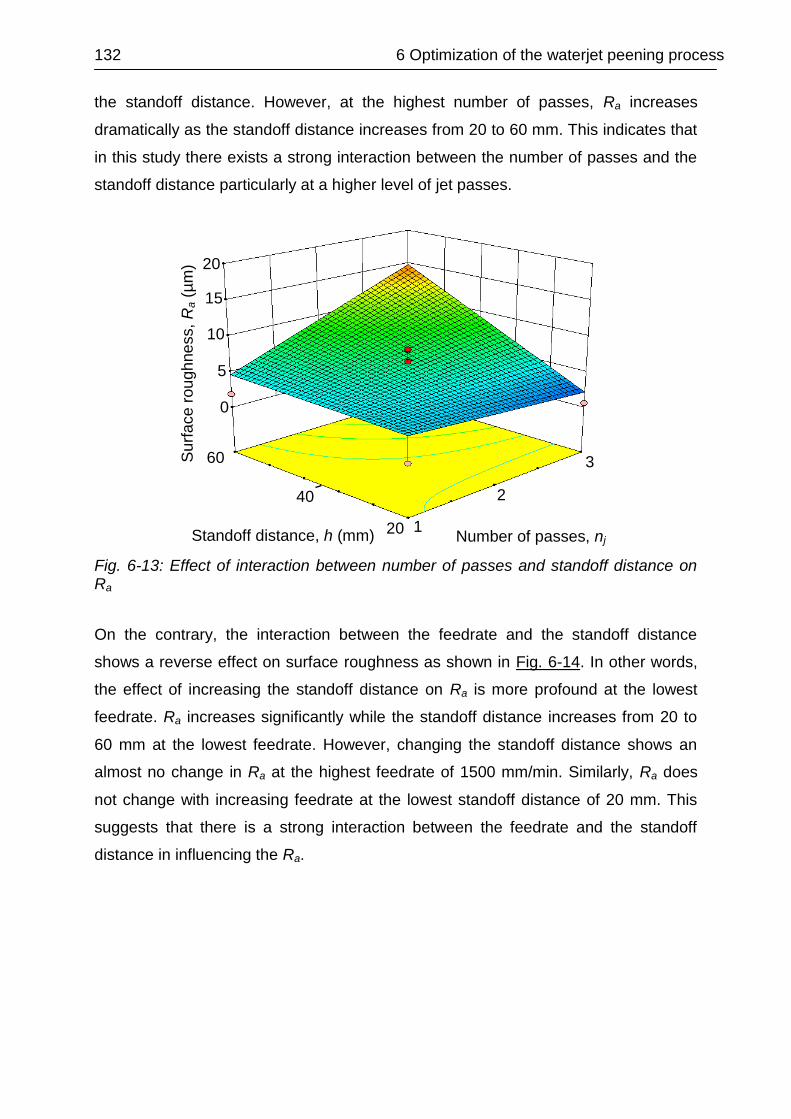
132 6 Optimization of the waterjet peening process
the standoff distance. However, at the highest number of passes, Ra increases
dramatically as the standoff distance increases from 20 to 60 mm. This indicates that
in this study there exists a strong interaction between the number of passes and the
standoff distance particularly at a higher level of jet passes.
Fig. 6-13: Effect of interaction between number of passes and standoff distance on Ra
On the contrary, the interaction between the feedrate and the standoff distance
shows a reverse effect on surface roughness as shown in Fig. 6-14. In other words,
the effect of increasing the standoff distance on Ra is more profound at the lowest
feedrate. Ra increases significantly while the standoff distance increases from 20 to
60 mm at the lowest feedrate. However, changing the standoff distance shows an
almost no change in Ra at the highest feedrate of 1500 mm/min. Similarly, Ra does
not change with increasing feedrate at the lowest standoff distance of 20 mm. This
suggests that there is a strong interaction between the feedrate and the standoff
distance in influencing the Ra.
Number of passes, nj Standoff distance, h (mm) 1
2
3 60
20
0 0
5
15
10
20
Su
rface r
ou
gh
ne
ss,
Ra (
µm
)
40

6 Optimization of the waterjet peening process 133
Fig. 6-14: Effect of interaction between feedrate and standoff distance on Ra
Whereas, based on the p-value for the HV model as shown in Table 6-4, all the
parameters are significant except the standoff distance. Again, the pressure has the
highest degree of significance followed by the number of passes and the feedrate. As
presented in Table 6-2, the highest HV recorded was at the highest pressure of 150
MPa. Also, the values of HV were notably higher at the highest pressure. This simply
confirms that the pressure is the most significant parameter in influencing the HV in
this experiment.
The p-value of the lack of fit test is 0.13. It is insignificant since its value is more than
0.05 thus indicating that all the data fit the model adequately in this study. The
individual influence of each parameter on HV has been explained above. However, it
is interesting to discuss the insignificant effect of the standoff distance in influencing
the HV. There is a possibility that the chosen range of standoff distance (i.e. 20 – 60
mm) in this study gives only a marginal effect to the HV. As found by Oka et al. [76]
in waterjet treatment of aluminium alloy 5083, the value for the impingement force
was constant at a standoff distance of less than 100 mm. Therefore, it gave an
almost constant hardening effect to the surface of the material. Furthermore,
Grinspan and Gnanamoorthy [82] found only a slight increase in HV for oil jet peened
aluminium alloy 6063-T6 at different standoff distances between 25 and 40 mm.
There was less than 4 % difference of the hardness increase from the original
hardness.
Feedrate, vn (mm/min) Standoff distance, h (mm) 500
1000
1500 60
20
0
5
10
15
20
Su
rface r
ou
gh
ne
ss,
Ra (
µm
)
40

134 6 Optimization of the waterjet peening process
Table 6-4: ANOVA results for hardness (HV)
Source Sum of squares
Degree of freedom
Mean square
F-value p-value
(Prob > F)
Model 86.254 6 17.251 19.319 < 0.0001
n 12.383 1 12.383 13.867 0.0011
p 57.948 1 57.948 64.894 < 0.0001
u 9.541 1 9.541 10.684 0.0034
h 4.590 1 4.590 5.140 0.0331
P2 2.625 1 2.625 2.940 0.0999
u2 20.538 23 0.893 - -
Residual 19.266 19 1.014 3.189 0.1347
Lack of Fit 1.272 4 0.318 - -
Pure error 106.793 28 - - -
Cor total 86.254 6 17.251 19.319 < 0.0001
Prob Probability, Cor total Corrected total Corrected total=Total Sum of squares (SS) for the model terms + Residual SS and Corrected total = Sum of degrees of freedom (df) of all the model terms + residual df
6.3.3 Optimization
Based on the developed models, an analysis on multiple response optimizations was
conducted to achieve optimum results. The target is to find the optimal set of
parameters within the tested range in the present study that can produce a minimum
surface roughness and a maximum hardness simultaneously. Different sets of
optimal parameters were obtained using the desirability function approach in the
Design Expert software for the optimization of multiple response processes. Different
desirability functions were used based on different importance criteria of roughness
and hardness. The criteria of the desirability function are intended to achieve different
sets of optimal parameters that may produce roughnesses below 10 µm. A total of
five experimental runs was selected and performed for optimal sets of parameters as
shown in Table 6-5. Furthermore, these different combinations of optimal parameters
were used to validate the robustness of the developed empirical models. The results
of optimization for actual and predicted Ra as well as HV based on different
importance criteria for each response are shown in Table 6-5. The predicted
responses for both Ra and HV were calculated from the empirical models. From the
Design Expert software, the minimum overall desirability function was found to be
82%. All responses were predicted to be within these desired limits. Overall, the
predicted and actual responses for both Ra and HV are satisfactory with good
reliability. It shows that the models are workable in predicting the responses of Ra
and HV in the present research.
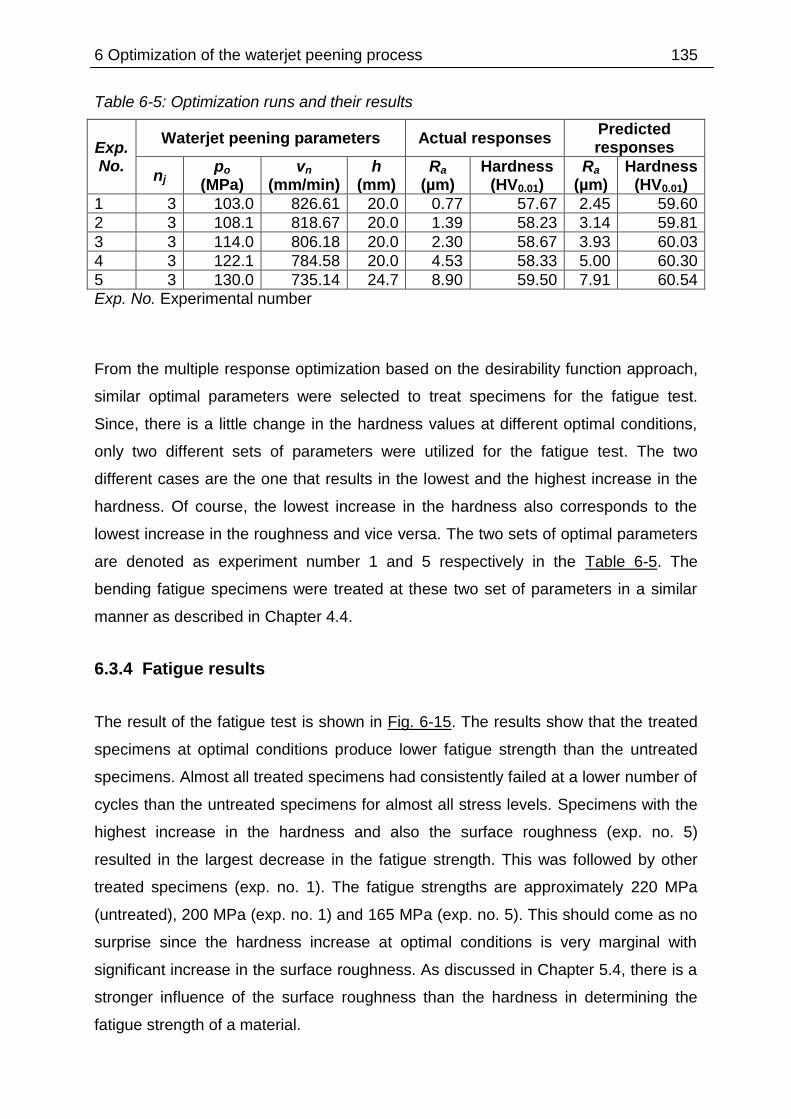
6 Optimization of the waterjet peening process 135
Table 6-5: Optimization runs and their results
Exp. No.
Waterjet peening parameters Actual responses Predicted responses
nj po
(MPa) vn
(mm/min) h
(mm) Ra
(µm) Hardness
(HV0.01) Ra
(µm) Hardness
(HV0.01)
1 3 103.0 826.61 20.0 0.77 57.67 2.45 59.60
2 3 108.1 818.67 20.0 1.39 58.23 3.14 59.81
3 3 114.0 806.18 20.0 2.30 58.67 3.93 60.03
4 3 122.1 784.58 20.0 4.53 58.33 5.00 60.30
5 3 130.0 735.14 24.7 8.90 59.50 7.91 60.54
Exp. No. Experimental number
From the multiple response optimization based on the desirability function approach,
similar optimal parameters were selected to treat specimens for the fatigue test.
Since, there is a little change in the hardness values at different optimal conditions,
only two different sets of parameters were utilized for the fatigue test. The two
different cases are the one that results in the lowest and the highest increase in the
hardness. Of course, the lowest increase in the hardness also corresponds to the
lowest increase in the roughness and vice versa. The two sets of optimal parameters
are denoted as experiment number 1 and 5 respectively in the Table 6-5. The
bending fatigue specimens were treated at these two set of parameters in a similar
manner as described in Chapter 4.4.
6.3.4 Fatigue results
The result of the fatigue test is shown in Fig. 6-15. The results show that the treated
specimens at optimal conditions produce lower fatigue strength than the untreated
specimens. Almost all treated specimens had consistently failed at a lower number of
cycles than the untreated specimens for almost all stress levels. Specimens with the
highest increase in the hardness and also the surface roughness (exp. no. 5)
resulted in the largest decrease in the fatigue strength. This was followed by other
treated specimens (exp. no. 1). The fatigue strengths are approximately 220 MPa
(untreated), 200 MPa (exp. no. 1) and 165 MPa (exp. no. 5). This should come as no
surprise since the hardness increase at optimal conditions is very marginal with
significant increase in the surface roughness. As discussed in Chapter 5.4, there is a
stronger influence of the surface roughness than the hardness in determining the
fatigue strength of a material.
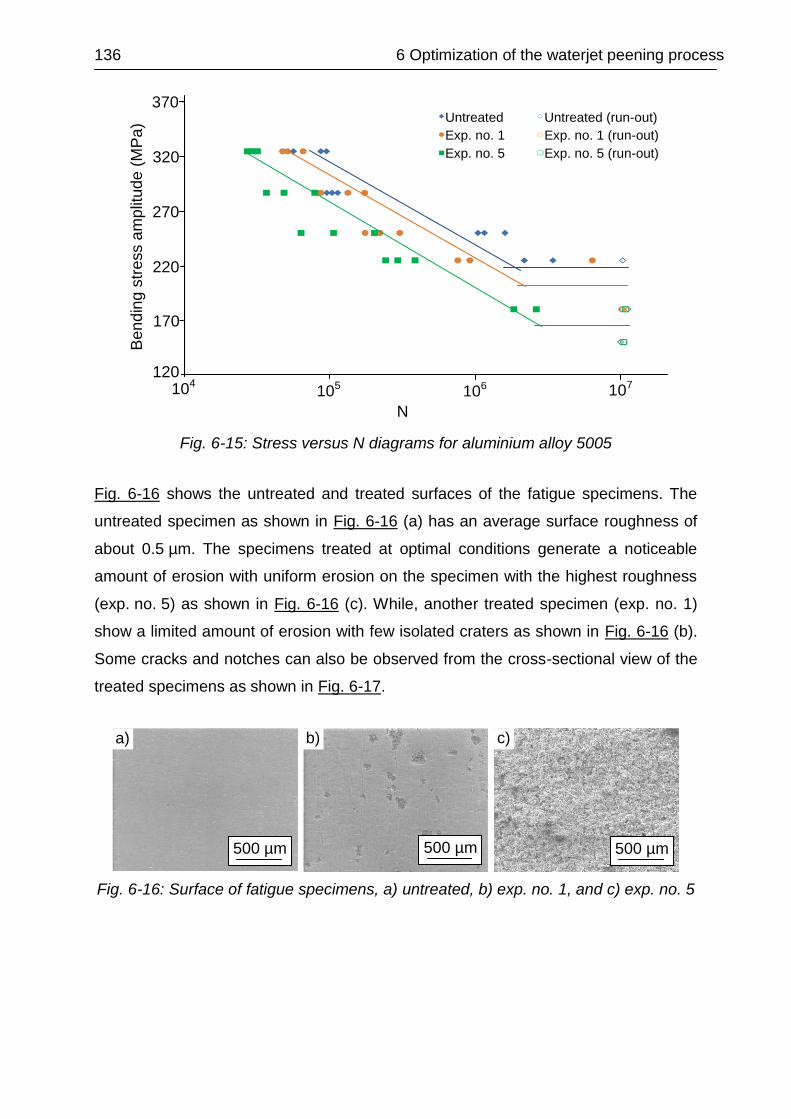
136 6 Optimization of the waterjet peening process
Fig. 6-15: Stress versus N diagrams for aluminium alloy 5005
Fig. 6-16 shows the untreated and treated surfaces of the fatigue specimens. The
untreated specimen as shown in Fig. 6-16 (a) has an average surface roughness of
about 0.5 µm. The specimens treated at optimal conditions generate a noticeable
amount of erosion with uniform erosion on the specimen with the highest roughness
(exp. no. 5) as shown in Fig. 6-16 (c). While, another treated specimen (exp. no. 1)
show a limited amount of erosion with few isolated craters as shown in Fig. 6-16 (b).
Some cracks and notches can also be observed from the cross-sectional view of the
treated specimens as shown in Fig. 6-17.
Fig. 6-16: Surface of fatigue specimens, a) untreated, b) exp. no. 1, and c) exp. no. 5
a)
500 µm
b)
500 µm
c)
500 µm
370
320
270
220
170
120 104 105 106 107
N
Untreated
Exp. no. 1
Exp. no. 5
Be
nd
ing
str
ess a
mp
litud
e (
MP
a) Untreated (run-out)
Exp. no. 1 (run-out)
Exp. no. 5 (run-out)
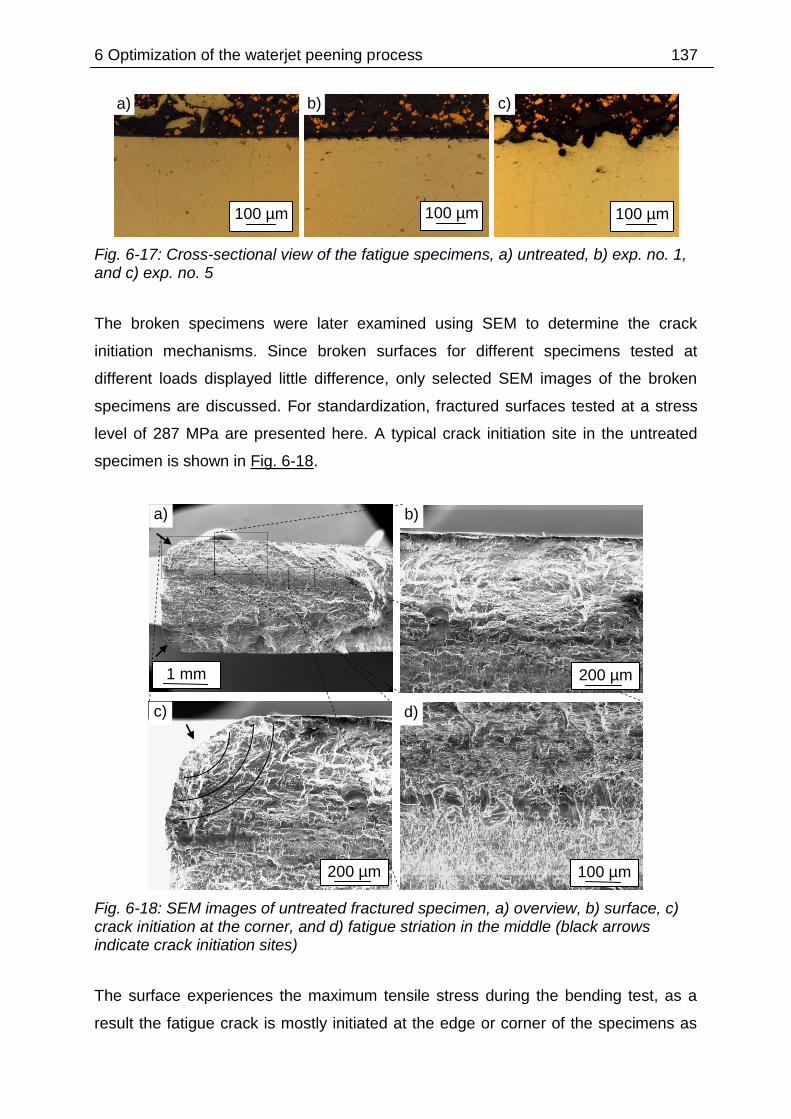
6 Optimization of the waterjet peening process 137
Fig. 6-17: Cross-sectional view of the fatigue specimens, a) untreated, b) exp. no. 1, and c) exp. no. 5
The broken specimens were later examined using SEM to determine the crack
initiation mechanisms. Since broken surfaces for different specimens tested at
different loads displayed little difference, only selected SEM images of the broken
specimens are discussed. For standardization, fractured surfaces tested at a stress
level of 287 MPa are presented here. A typical crack initiation site in the untreated
specimen is shown in Fig. 6-18.
Fig. 6-18: SEM images of untreated fractured specimen, a) overview, b) surface, c) crack initiation at the corner, and d) fatigue striation in the middle (black arrows indicate crack initiation sites)
The surface experiences the maximum tensile stress during the bending test, as a
result the fatigue crack is mostly initiated at the edge or corner of the specimens as
a) b)
c) d)
100 µm
1 mm
200 µm
200 µm
a)
100 µm
b)
100 µm
c)
100 µm
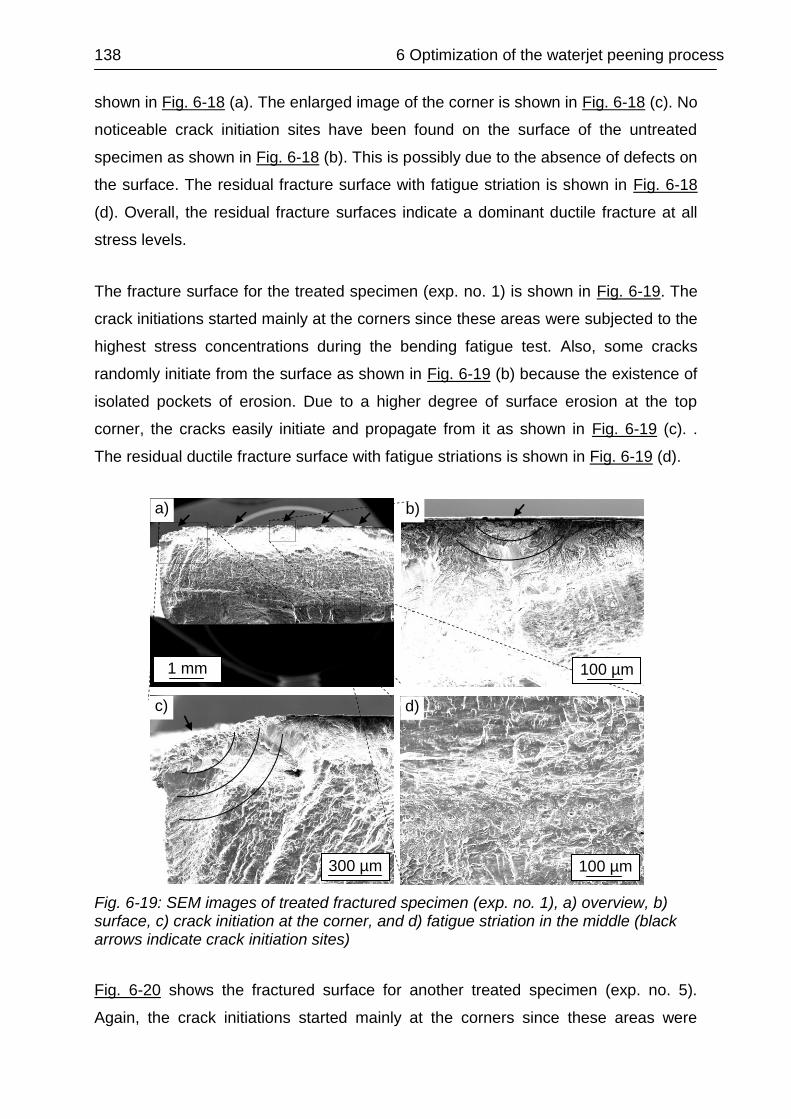
138 6 Optimization of the waterjet peening process
shown in Fig. 6-18 (a). The enlarged image of the corner is shown in Fig. 6-18 (c). No
noticeable crack initiation sites have been found on the surface of the untreated
specimen as shown in Fig. 6-18 (b). This is possibly due to the absence of defects on
the surface. The residual fracture surface with fatigue striation is shown in Fig. 6-18
(d). Overall, the residual fracture surfaces indicate a dominant ductile fracture at all
stress levels.
The fracture surface for the treated specimen (exp. no. 1) is shown in Fig. 6-19. The
crack initiations started mainly at the corners since these areas were subjected to the
highest stress concentrations during the bending fatigue test. Also, some cracks
randomly initiate from the surface as shown in Fig. 6-19 (b) because the existence of
isolated pockets of erosion. Due to a higher degree of surface erosion at the top
corner, the cracks easily initiate and propagate from it as shown in Fig. 6-19 (c). .
The residual ductile fracture surface with fatigue striations is shown in Fig. 6-19 (d).
Fig. 6-19: SEM images of treated fractured specimen (exp. no. 1), a) overview, b) surface, c) crack initiation at the corner, and d) fatigue striation in the middle (black arrows indicate crack initiation sites)
Fig. 6-20 shows the fractured surface for another treated specimen (exp. no. 5).
Again, the crack initiations started mainly at the corners since these areas were
a) b)
c) d)
100 µm
1 mm
300 µm
100 µm
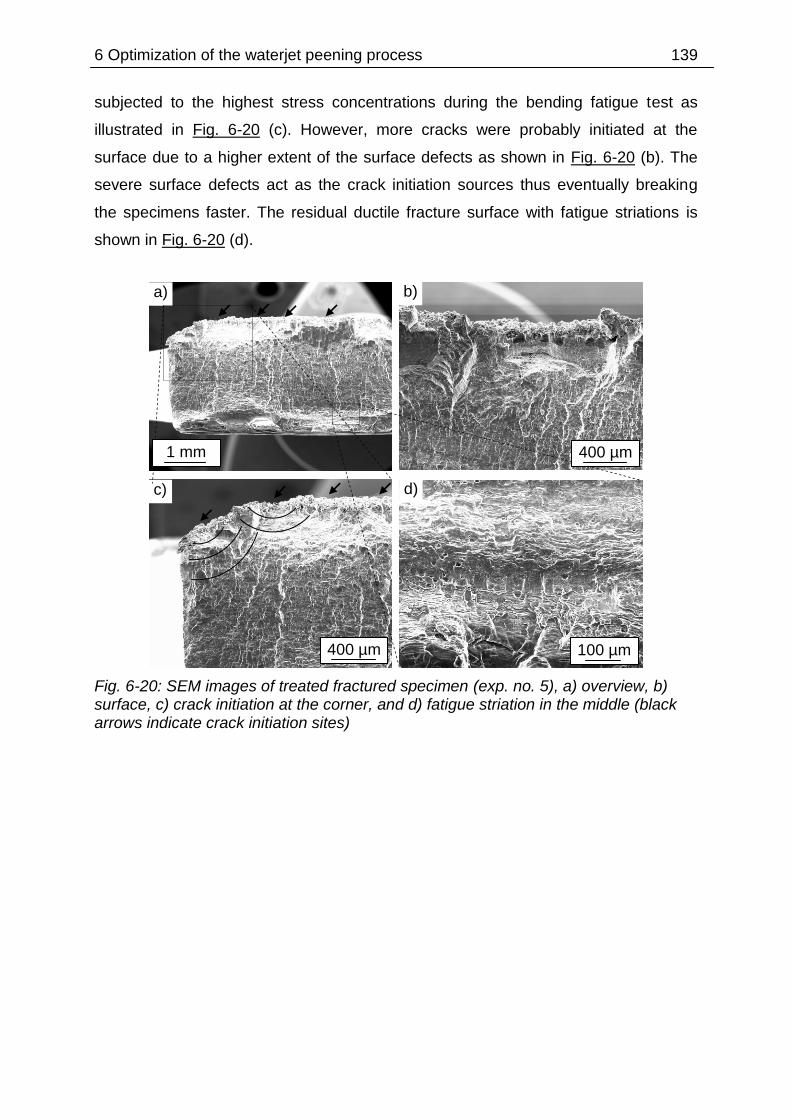
6 Optimization of the waterjet peening process 139
subjected to the highest stress concentrations during the bending fatigue test as
illustrated in Fig. 6-20 (c). However, more cracks were probably initiated at the
surface due to a higher extent of the surface defects as shown in Fig. 6-20 (b). The
severe surface defects act as the crack initiation sources thus eventually breaking
the specimens faster. The residual ductile fracture surface with fatigue striations is
shown in Fig. 6-20 (d).
Fig. 6-20: SEM images of treated fractured specimen (exp. no. 5), a) overview, b) surface, c) crack initiation at the corner, and d) fatigue striation in the middle (black arrows indicate crack initiation sites)
a) b)
c) d)
100 µm
1 mm
400 µm
400 µm
140 7 Conclusions
7 Conclusions
7.1 Evaluation of surface effects
The surface roughness and erosion of austenitic steel 304 and carbon steel 1045
under waterjet peening process was investigated. Also, the effect of multiple jet
passes treatment as well as other parameters such as feedrate, water pressure and
standoff distance was examined. Based on the results, the following conclusions can
be drawn.
- For both materials, increasing the number of jet passes produced a higher surface
roughness as well as wider and deeper erosion tracks. Rougher surfaces and more
erosion can be expected due to repeated bombardment of waterjet onto the
surface. Furthermore, rougher surfaces were also produced at lower feedrates due
to additional overlap machining action and more water molecules to impinge on the
surface.
- Furthermore, the surface roughness and erosion increased with an increase in
water supply pressure because of a higher kinetic energy of the water molecules
thus enhancing their capability for material removal. Whereas, the standoff distance
of about 90 mm produced the maximum surface roughness and erosion for both
materials probably at this distance the jet structure consists of mainly water
droplets.
- Generally, with carbon steel 1045, a higher value of surface roughness was
observed than with stainless steel 304. This is possible due to a lower material
hardness of the carbon steel 1045 thus lowering its erosion resistance.
- In general, the erosion mechanisms especially under multiple jet passes treatment
happened in various stages. During earlier jet passes, the high impact pressure of
water droplets produces many small central depression craters in the material
surface thus initiating some cracks. Later, the lateral outward flow of the droplets
further results in local shear fractures in the material surface by a pitting action.
During subsequent jet passes, old cracks are further propagated and new cracks
are initiated. The previously formed craters may easily combine to form a larger
crater thus developing a bigger crater to form uniform erosion with full removal of
materials over the surface.
7 Conclusions 141
7.2 Evaluation of sub-surface effects
The following conclusions can be drawn on the effect of various waterjet peening
parameters on sub-surface of austenitic steel 304 and carbon steel 1045.
- For both materials, the hardness shows a general trend of decreasing gradually
from the surface into the sub-surface. Also, the specimens treated with a higher jet
passes displayed a higher increase in hardness as well as a deeper hardening
layer. Similarly, a higher hardness gradient was also found in a specimen treated
with a higher pressure. In contrast, a lower feedrate produced a higher increase in
hardness gradient. As expected, a standoff distance of 90 mm resulted in the
highest increase in hardness probably due to the highest impact pressure at this
distance thus deforming the surface the most.
- The carbon steel 1045 showed a higher percentage of hardness increase than
stainless steel 304. It is possible because of the higher hardness value of the
original surface of stainless steel 304, it has a lower plastic flow thus restricting the
dislocation movement.
- Also, the hardness increase variation in the stainless steel 304 had shown a
relatively small margin of errors. This is probably due to a more stable work
hardening state of stainless still 304 during phase transformation.
- Cross-sectional microstructures of stainless steel 304 samples indicated that the
substrate experienced a certain degree of plastic deformation. The density and
quantity of slip bands in the deformed grains decreased gradually with increasing
layer depth from the treated surface.
7.3 Evaluation of fatigue effects
The following conclusions can be drawn on the effect of the waterjet peening process
on the fatigue life of austenitic steel 304 and aluminium alloy 5005.
- Overall, the waterjet treated specimens had shown lower fatigue strength than the
original specimens. Specimens with the highest increase in hardness as well as
surface roughness resulted in the largest decrease in the fatigue strength.
- The results suggested that the influence of the surface roughness was more
prominent than the increase in hardness in determining the fatigue strength since
142 7 Conclusions
rougher surfaces are expected to encourage fatigue crack initiation. The specimens
with more surface defects decreased the fatigue time for crack initiation.
- Based on the SEM images of the broken specimens, the crack initiations started
mainly at both upper and lower corners of the specimens. However, more cracks
were probably initiated at the surface due to a higher extent of the surface defects.
- Although, there was an increase in the hardness, but the fatigue life decreased due
the surface defects thus leading to the overpeening effect.
7.4 Optimization of waterjet peening process
Based on the Box-Behnken experimental design approach, the following conclusions
on the effect of waterjet peening process of aluminium alloy 5005 can be drawn.
- The equivalent parametric trends show that the increase in hardness is not possible
without a corresponding increase in surface roughness. The surface roughness and
hardness are linearly related. Understandably, the parametric combinations that
give a high energy of waterjet may induce a high degree of hardness as well as
significant surface erosion.
- The developed empirical models for surface roughness (Ra) and hardness (HV)
have reasonable correlations between the measured and predicted responses with
acceptable R2 and . A proper selection of peening parameters can be
formulated to be used in practical works.
Different sets of optimal parameters were generated based on different desirability
functions for each response. The predicted and actual responses for optimized Ra
and HV are satisfactory with good reliability. It shows that the models are workable
in predicting the responses of Ra and HV in the present research.
8 Summary and outlook 143
8 Summary and outlook
The present study addresses the effect of multiple jet passes and other parameters
such as feedrate, water pressure and standoff distance in waterjet peening (WJP) of
metallic surfaces. An analysis of surface integrity in terms of surface roughness,
erosion, hardness, microstructures and fatigue strength was used to evaluate the
performance of different parameters in the WJP process. An increase in the number
of jet passes as well as pressure leads to a higher roughness and more erosion of
the surface and also to a higher hardness. However, the feedrate shows a reverse
effect on surface roughness, erosion and hardness. For the standoff distance, there
exists a specific distance that results in the maximum surface roughness, erosion
and hardness. The surface microstructures show the mechanism of material removal
process involving initial and evolved damages. Furthermore, the damage is more
concentrated along the grain boundaries. The shearing force from the jet lateral flow
raised the circumferential rims and created lateral cracks and sub-tunnels which
might eventually be removed in the subsequent jet passes. The waterjet treated
specimens had produced lower fatigue strength than the untreated specimens most
probably due to the formation of a high degree of surface erosion. The influence of
the surface roughness is more prominent than the increase in the hardness in
determining the fatigue strength since rougher surfaces are expected to encourage
fatigue crack initiation.
Also in the present study, the waterjet peening process is optimized using the design
of experiment (DOE) approach. The DOE method is based on the response surface
methodology utilizing the Box–Behnken experimental design approach. Workable
empirical models were developed to predict the surface roughness and hardness.
The developed empirical models show reasonable correlations between the
measured and predicted responses with acceptable coefficients of determinations. A
proper selection of WJP parameters can be formulated to be used in practical works.
Overall, the present study has shown some potential for future works especially in
the application of multiple jet passes in the waterjet peening process. It has been
shown that the treated surfaces with multiple jet passes may produce a smaller
roughness and erosion compared to the abrasive waterjet and also the water
144 8 Summary and outlook
cavitation process. However, the surface hardness has somehow shown a limited
increase compared to other waterjet peening processes. With a proper combination
of other parameters and the number of jet passes, an optimum performance can be
achieved. Furthermore, based on the fatigue result, the effect of surface erosion is
more prominent than the increase in the hardness with multiple jet passes treatment.
It would be interesting if the surface erosion can be minimized while achieving an
optimum increase of hardness. Multiple jet passes can be conveniently applied by
performing a polishing action on the surface with the subsequent passes. Firstly, the
material surface is treated with sufficient kinetic energy during the initial jet passes so
that an optimum compressive residual stress and hardness can be induced with
suitable erosion. Finally, much lower kinetic energy of the jet is used during
subsequent passes hence only unstable fragments of material introduced from
previous erosion are removed. As a result, the surface can be smoothened while
maintaining the initially hardened layer. Consequently, the smoother surface of the
treated specimen may produce higher fatigue strength since fatigue crack initiation is
discouraged with the formation of smoother surface.

Literature 145
Literature
[1] FOLKES, J.: Waterjet—An innovative tool for manufacturing. Journal of
Materials Processing Technology, 209 (2009), pp. 6181-6189.
[2] HASHISH, M.; STEELE, D.E.; BOTHELL, D.H.: Machining with super-pressure (690
MPa) waterjets. International Journal of Machine Tools and Manufacture, 37
(1997), pp. 465-479.
[3] DAOMING, G.; JIE, C.: ANFIS for high-pressure waterjet cleaning prediction.
Surface and Coatings Technology, 201 (2006), pp. 1629-1634.
[4] CUI, L.; AN, L.; GONG, W.; JIANG, H.: A novel process for preparation of ultra-
clean micronized coal by high pressure water jet comminution technique. Fuel,
86 (2007), pp. 750-757.
[5] TÖNSHOFF, H.K.; KROOS, F.; MARZENELL, C.: High-pressure water peening-a
new mechanical surface-strengthening process. CIRP Annals-Manufacturing
Technology, 46 (1997), pp. 113-116.
[6] MOCHIZUKI, M; ENOMOTO, K.; SAKATA, S.; KUROSAWA, K.; SAITO, H.; TSUJIMURA,
H.; ICHIE, K.: A study on residual stress improvement by water jet peening.
Proceedings of the 5th International Conference on Shot Peening, (1993),
Oxford, pp. 247-256.
[7] SCHINDLER, C.; SEVERIN, F; WIND, M.: CFD-Simulation von Flachstrahldüsen-
strömungen, O+P Zeitschrift für Fluidtechnik, 4 (2007), pp. 178-182.
[8] CADAVID-GIRALDO, R.: Cutting with fluidjets of small diameter, Dissertation,
Fachbereich Maschinenbau und Verfahrenstechnik, Technische Universität
Kaiserslautern, 2004.
[9] CADAVID, R.; WÜSTENBERG, D.; LOUIS, H.; PUDE, F.; SENNE, T.: Effect of helium
atmospheres on abrasive suspension water jets. International Journal of
Advanced Manufacturing Technology, 26 (2005), pp. 1246-1254.
[10] WEISS, M.: Trennen von Faser-Nicht Faserverbunden mit
hochdruckwasserstrahlen am Beispiel von Nadelvliesboden, Dissertation,
Fachbereich Maschinenbau und Verfahrenstechnik, Technische Universität
Kaiserslautern, 2000.
146 Literature
[11] WEISS, M.; WÜSTENBERG, D.; MOMBER, A.W.: Hydro-erosive separation of
plastic fibers from textile compounds. Journal of Material Cycles and Waste
Management, 5 (2003), pp. 84-88.
[12] GROß, I.: Schneiden der Hornhaut am Auge mit Wasserstrahl, Dissertation,
Fachbereich Maschinenbau und Verfahrenstechnik, Technische Universität
Kaiserslautern, 2003.
[13] LOOF, C.: Entwicklung eines Hydrokeratoms für die LASIK-Chirurgie,
Fachbereich Maschinenbau und Verfahrenstechnik, Dissertation, Technische
Universität Kaiserslautern, 2008.
[14] LOOF, C.; SCHINDLER, C.: Development of a microkeratome for LASIK-surgery
based on high pressure water jet technology. Proceedings of 6th Conference
on Mechanical Engineering, (2008), Budapest, pp. 1-10.
[15] SCHINDLER, C; LOOF, C.: Hornhautschnitt mit Hochdruckwasserstrahl für die
LASIK-OP. Medizintechnik, 129 (2009), pp. 103-108.
[16] KLOOS, K.E.; MACHERAUCH, E.: Development Of Mechanical Surface
Strengthening Processes From The Beginning Until Today. Proceedings of 3rd
International Conference on Shot Peening, (1987), Garmisch-Partenkirchen,
pp. 3-27.
[17] CALLISTER, W.D.: Fundamentals of materials science and engineering: an
integrated approach. 5th edition, John Wiley & Sons, New York, 2001.
[18] SCHULZE, V.: Modern mechanical surface treatment. Wiley-Vch, Weinheim,
2006.
[19] LEE, W.; CHO, K.; KIM, K.; MOON, K.; LEE, Y.: The effect of the cementite phase
on the surface hardening of carbon steels by shot peening. Materials Science
and Engineering: A, 527, (2010), pp. 5852-5857.
[20] SANJURJO, P.; RODRÍGUEZ, C.; PARIENTE, I.; BELZUNCE, F.; CANTELI, A.: The
influence of shot peening on the fatigue behaviour of duplex stainless steels.
Procedia Engineering, 2 (2010), pp. 1539-1546.
[21] MIAO, H.; DEMERS, D.; LAROSE, S.; PERRON, C.; LÉVESQUE, M.: Experimental
study of shot peening and stress peen forming. Journal of Materials
Processing Technology, (2010), pp. 2089-2102.
Literature 147
[22] BREUER, D.: Vacuum/Surface Treatment Laser Peening- Advanced Residual
Stress Technology. Industrial Heating, 74 (2007), pp. 48-50.
[23] WOHLFAHRT, H.: The influence of peening conditions on the resulting
distribution of residual stress. Proceedings of the International Conference on
Shot Peening, (1984), Chicago, pp. 316-331.
[24] AL-OBAID, Y.F.: A rudimentary analysis of improving fatigue life of metals by
shot-peening. Journal of applied mechanics, 57 (1990), pp. 307-312.
[25] MIAO, H.Y.: Numerical and theoritical study of shot peening and stress forming
process, University of Montreal, Dissertation, 2010.
[26] WANG, S.; LI, Y.; YAO, M.; WANG, R: Compressive residual stress introduced by
shot peening. Journal of Materials Processing Technology, 73 (1998), pp. 64-
73.
[27] WILLIAM, S.: Practical application of shot peening. The shot peener, 5 (1992),
pp. 1-4.
[28] KIRK, D.: Shot peening. Aircraft Engineering and Aerospace Technology, 71
(1999), pp. 349-361.
[29] GARIEPY, A.; LAROSE, S.; PERRON, C.; BOCHER, P.; LEVESQUE, M.: On the effect
of the peening trajectory in shot peen forming. Finite Element in Analysis and
Design, 69 (2013), pp. 48-61.
[30] SINGH, L.; KHAN, R.A.; AGGARWAL, M.L.: Effect of shot peening on hardening
and surface roughness of nitrogen austenitic stainless steel. International
Journal of Engineering Science, 2 (2010), pp. 818-826.
[31] TORRES, M.A.S.; VOORWALD, H.J.C.: An evaluation of shot peening, residual
stress and stress relaxation on the fatigue life of AISI 4340 steel. International
Journal of Fatigue, 24 (2002), pp. 877-886.
[32] ZHANG, P.; LINDEMANN, J.; LEYENS, C.: Shot peening on the high-strength
wrought magnesium alloy AZ80—Effect of peening media. Journal of Materials
Processing Technology, 210 (2010), pp. 445-450.
[33] LEE, H.; KIM, D.; JUNG, J.; PYOUN, Y.; SHIN, K.: Influence of peening on the
corrosion properties of AISI 304 stainless steel. Corrosion Science, 51 (2009),
pp. 2826-2830.
148 Literature
[34] SHEN, L.; WANG, L.; WANG, Y.; WANG, C.: Plasma nitriding of AISI 304 austenitic
stainless steel with pre-shot peening. Surface and Coatings Technology, 204
(2010), pp. 3222-3227.
[35] HATAMLEH, O.A.: Comprehensive investigation on the effects of laser and shot
peening on fatigue crack growth in friction stir welded AA 2195 joints.
International Journal of Fatigue, 31 (2009), pp. 974-988.
[36] SATHYAJITH, S.; KALAINATHAN, S.: Effect of laser shot peening on precipitation
hardened aluminum alloy 6061-T6 using low energy laser. Optics and Lasers
in Engineering, 50 (2011), pp. 345-348.
[37] MONTROSS, C.; WEI, T.; YE, L.; CLARK, G.; MAI, Y.: Laser shock processing and
its effects on microstructure and properties of metal alloys: a review.
International Journal of Fatigue, 24 (2002), pp. 1021-1036.
[38] GAO, Y.K.: Improvement of fatigue property in 7050–T7451 aluminum alloy by
laser peening and shot peening. Materials Science and Engineering: A, 528
(2011), pp. 3823-3828.
[39] MAAWAD, E.; SANO, Y.; WAGNER, L.; BROKMEIER, H.; GENZEL, C.: Investigation of
laser shock peening effects on residual stress state and fatigue performance
of titanium alloys. Materials Science and Engineering: A, 536 (2011), pp. 82-
91.
[40] SATHYAJITH, S.; KALAINATHAN, S.; SWAROOP, S.: Laser peening without coating
on aluminum alloy Al-6061-T6 using low energy Nd: YAG laser. Optics &
Laser Technology, 45 (2012), pp. 389-394.
[41] LIM, H.; KIM, P.; JEONG, H.; JEONG, S.: Enhancement of abrasion and corrosion
resistance of duplex stainless steel by laser shock peening. Journal of
Materials Processing Technology, 212 (2012), pp. 1347-1354.
[42] PEYRE, P.; SCHERPEREEL, X.; BERTHE, L.; CARBONI, C.; FABBRO, R.; BERANGER,
G.; LEMAITRE, C.: Surface modifications induced in 316L steel by laser peening
and shot-peening. Influence on pitting corrosion resistance. Materials Science
and Engineering: A, 280 (2000), pp. 294-302.
[43] CHILLMAN, A.; RAMULU, M.; HASHISH, M.: Waterjet peening and surface
preparation at 600 MPa: A preliminary experimental study. Journal of Fluids
Engineering, 129 (2007), pp. 485-490.

Literature 149
[44] GRINSPAN, A.S.; GNANAMOORTHY, R.A.: Novel surface modification technique
for the introduction of compressive residual stress and preliminary studies on
Al alloy AA6063. Surface and Coatings Technology, 201 (2006), pp. 1768-
1775.
[45] JU, D.Y.; HAN, B.: Investigation of water cavitation peening-induced
microstructures in the near-surface layer of pure titanium. Journal of Materials
Processing Technology, 209 (2009), pp. 4789-4794.
[46] QIN, M.; JU, D.Y.; OBA, R.: Improvement on the process capability of water
cavitation peening by aeration. Surface and Coatings Technology, 200 (2006),
pp. 5364-5369.
[47] QIN, M.; JU, D.; OBA, R.: Investigation of the influence of incidence angle on the
process capability of water cavitation peening. Surface and Coatings
Technology, 201 (2006), pp. 1409-1413.
[48] YANAIDA, K.; OHASHI, A.: Flow characteristics of water jets. Second
International Symposium on Jet Cutting Technology, A2 (1974), Cranfield, pp.
19-32.
[49] YANAIDA, K.; OHASHI, A.: Flow characteristics of water jets in air. Fifth
International Symposium on Jet Cutting Technology, A3 (1980), Hannover, pp.
33-43.
[50] SHIMIZU, S.: Tribology in Water Jet Processes. New Tribological Ways. InTech,
Rijeka, 2011, pp. 153-164.
[51] CHILLMAN, A.; RAMULU, M.; HASHISH, M.: Waterjet and Water-Air Jet Surface
Processing of a Titanium Alloy: A Parametric Evaluation. Journal of
Manufacturing Science and Engineering, 132 (2010), pp. 011012.
[52] LESSER, M.B.; FIELD, J.E.: The impact of compressible liquids. Annual Review
of Fluid Mechanics, 15 (1983), pp. 97-122.
[53] HALLER, K.; POULIKAKOS, D.; VENTIKOS, Y.; MONKEWITZ, P.: Shock wave
formation in droplet impact on a rigid surface: lateral liquid motion and multiple
wave structure in the contact line region. Journal of Fluid Mechanics, 490
(2003), pp. 1-14.
150 Literature
[54] REIN, M.: Phenomena of liquid drop impact on solid and liquid surfaces. Fluid
Dynamics Research, 12 (1993), pp. 61-93.
[55] FIELD, J.E.: ELSI conference: invited lecture: Liquid impact: theory, experiment,
applications. Wear, 233 (1999), pp.1-12.
[56] BOWDEN, F.P.; FIELD, J.E.: The brittle fracture of solids by liquid impact, by
solid impact, and by shock. Proceedings of the Royal Society of London.
Series A, Mathematical and Physical Sciences, 282 (1964), pp. 331-352.
[57] HANCOX, N.L.; BRUNTON, J.H.: The erosion of solids by the repeated impact of
liquid drops. Philosophical Transactions for the Royal Society of London.
Series A, Mathematical and Physical Sciences, 260 (1966), pp. 121-139.
[58] PREECE, C.M.; BRUNTON, J.H.: A comparison of liquid impact erosion and
cavitation erosion. Wear, 60 (1980), pp. 269-284.
[59] OBARA, T.; BOURNE, N.K.; FIELD, J.E.: Liquid-jet impact on liquid and solid
surfaces. Wear, 186 (1995), pp. 388-394.
[60] HEYMANN, F.J.: High-speed impact between a liquid drop and a solid surface.
Journal of Applied Physics, 40 (1969), pp. 5113-5122.
[61] COOK, S.S.: Erosion by water-hammer. Proceedings of the Royal Society A:
Mathematical, Physical and Engineering Sciences, 119 (1928), pp. 481-488.
[62] HUANG, L.; FOLKES, J.; KINNELL, P.; SHIPWAY, P: Mechanisms of damage
initiation in a titanium alloy subjected to water droplet impact during ultra-high
pressure plain waterjet erosion. Journal of Materials Processing Technology,
212 (2012), pp. 1906-1915.
[63] ADLER, W.F.: Liquid drop collisions on deformable media. Journal of Materials
Science, 12 (1977), pp. 1253-1271.
[64] KENNEDY, C.F.; FIELD, J.E.: Damage threshold velocities for liquid impact.
Journal of Materials Science, 35 (2000), pp. 5331-5339.
[65] GEDEON, M.: Strain hardening and strength. Technical Tidbits, 17 (2010), pp.
1-2.
[66] BLACK, J.T.; KOHSER, R.A.: Degarmo's materials and processes in
manufacturing. 11th edition, John Wiley & Sons, Inc., New York, 2012.

Literature 151
[67] ASKELAND, D.R.; FULAY, P.P.; WRIGHT, W.J.: The science and engineering of
materials. 6th edition, Cengage Learning, Inc., Stamford, 2011.
[68] AROLA, D.; MCCAIN, M.; KUNAPORN, S.; RAMULU, M: Waterjet and abrasive
waterjet surface treatment of titanium: a comparison of surface texture and
residual stress. Wear, 249 (2002), pp. 943-950.
[69] AROLA, D.; HALL, C.L.: Parametric effects on particle deposition in abrasive
waterjet surface treatments. Machining Science and Technology, 8 (2004), pp.
171-192.
[70] AROLA, D.; MCCAIN, M.L.: Abrasive waterjet peening: a new method of surface
preparation for metal orthopedic implants. Journal of Biomedical Materials
Research, 53 (2000), pp. 536-546.
[71] KUNAPORN, S.; CHILLMAN, A.; RAMULU, M.; HASHISH, M.: Effect of waterjet
formation on surface preparation and profiling of aluminum alloy. Wear, 265
(2008), pp. 176-185.
[72] KUNAPORN, S.; RAMULU, M.; HASHISH, M.; HOPKINS, J.: Ultra high pressure
waterjet peening Part I: Surface texture. Proceedings of WJTA American
Waterjet Conference, (2001), Minnesota, Paper 25.
[73] RAMULU, M.; KUNAPORN, S.; AROLA, D.; HASHISH, M.; HOPKINS, J.: Waterjet
machining and peening of metals. Journal of Pressure Vessel Technology,
122 (2000), pp. 90-95.
[74] AZHARI, A.; SCHINDLER, C.; KERSCHER, E.; GRAD, P.: Improving surface
hardness of austenitic stainless steel using waterjet peening process. The
International Journal of Advanced Manufacturing Technology, 63 (2012), pp.
1035-1046.
[75] SADASIVAM, B.; HIZAL, A.; AROLA, D.: Abrasive waterjet peening with elastic
prestress: A parametric evaluation. International Journal of Machine Tools &
Manufacture, 49 (2009), pp. 134-141.
[76] OKA, Y.I.; MIHARA, S.; MIYATA, H.: Effective parameters for erosion caused by
water droplet impingement and applications to surface treatment technology.
Wear, 263 (2007), pp. 386-394.
152 Literature
[77] FOLDYNA, J.; SITEK, L.; ŠČUČKA, J.; MARTINEC, P.; VALÍČEK, J.; PÁLENÍKOVÁ, K.:
Effects of pulsating water jet impact on aluminium surface. Journal of Materials
Processing Technology, 209 (2009), pp. 6174-6180.
[78] BARRIUSO, S.; LIEBLICH, M.; MULTIGNER, M.; ETXEBERRIA, I.; ALBERDI, A.;
GONZÁLEZ-CARRASCO, J.: Roughening of metallic biomaterials by abrasiveless
waterjet peening: Characterization and viability. Wear, 270 (2011), pp. 634-
639.
[79] TAYLOR, T.A.: Surface roughening of metallic substrates by high pressure pure
waterjet. Surface and Coatings Technology, 76 (1995), pp. 95-100.
[80] ISLAM, M.A.; FARHAT, Z.; BONNELL, J.: High pressure water-jet technology for
the surface treatment of Al-Si alloys and repercussion on tribological
properties. Journal of Surface Engineered Materials and Advanced
Technology, 1 (2011), pp. 112-120.
[81] KONG, M.C.; AXINTE, D.; VOICE, W.: Aspects of material removal mechanism in
plain waterjet milling on gamma titanium aluminide. Journal of Materials
Processing Technology, 210 (2010), pp. 573-584.
[82] GRINSPAN, A.S.; GNANAMOORTHY, R.: Surface modification by oil jet peening in
Al alloys, AA6063-T6 and AA6061-T4: Residual stress and hardness. Applied
Surface Science, 253 (2006), pp. 989-996.
[83] HIRANO, K.; ENOMOTO, K.; MOCHIZUKI, M.; HAYASHI, M.; HAYASHI, E.; SHIMIZU, S.:
Improvement of residual stress on material surface by water jet peening. 14th
International Conference on Structural Mechanics in Reactor Technology, 2
(1997), Lyon, pp. 361-368.
[84] HAN, B.; JU, D.Y.; JIA, W.P.: Influence of water cavitation peening with aeration
on fatigue behaviour of SAE1045 steel. Applied Surface Science, 253 (2007),
pp. 9342-9346.
[85] DANIEWICZ, S.R.; CUMMINGS, S.D.: Characterization of a water peening
process. Journal of Engineering Materials and Technology, 121 (1999), pp.
336-340.
[86] GRINSPAN, A.S.; GNANAMOORTHY, R.: Effect of oil jet peening duration on
surface modification and fatigue behavior of medium carbon steel AISI 1040.
Materials Science and Engineering: A, 456 (2007), pp. 210-217.
Literature 153
[87] NI, Z.; WANG, X.; WANG, J.; WU, E.: Characterization of the phase
transformation in a nanostructured surface layer of 304 stainless steel induced
by high-energy shot peening. Physica B: Condensed Matter, 334 (2003), pp.
221-228.
[88] WANG, T.; LU, B.; ZHANG, M.; HOU, R.; ZHANG, F.: Nanocrystallization and α
martensite formation in the surface layer of medium-manganese austenitic
wear-resistant steel caused by shot peening. Materials Science and
Engineering: A, 458 (2007), pp. 249-252.
[89] TSUJIKAWA, M.; EGAWA, M.; SONE, T.; UEDA, N.; OKANO, T.; HIGASHI, K.:
Modification of S phase on austenitic stainless steel using fine particle shot
peening. Surface and Coatings Technology, (2012).
[90] CAMPBELL, F.C.; Elements of metallurgy and engineering alloys. ASM
International, Inc., Ohio, 2008.
[91] AROLA, D.; ALADE, A.E.; WEBER, W.: Improving fatigue strength of metals using
abrasive waterjet peening. Machining science and technology, 10 (2006), pp.
197-218.
[92] KUNAPORN, S.; RAMULU, M.; JENKINS, M.; HASHISH, M.; HOPKINS, J.: Ultra high
pressure waterjet peening, Part II: High cycle fatigue performance.
Proceedings of WJTA American Waterjet Conference, (2001), Minnesota,
Paper 26.
[93] TAYLOR, D.; CLANCY, O.M.: The fatigue performance of machined surfaces.
Fatigue & Fracture of Engineering Materials & Structures, 14 (1991), pp. 329-
336.
[94] SOYAMA, H.: Improvement of fatigue strength by using cavitating jets in air and
water. Journal of Materials Science, 42 (2007), pp. 6638-6641.
[95] AZHARI, A.; SCHINDLER, C.; LI, B.: Effect of waterjet peening on aluminium alloy
5005. International Journal of Advanced Manufacturing Technology, 67
(2013), pp. 785-795.
[96] MACODIYO, D.O.; SOYAMA, H.: Optimization of cavitation peening parameters
for fatigue performance of carburized steel using Taguchi methods. Journal of
Materials Processing Technology, 178 (2006), pp. 234-240.

154 Literature
[97] RAJESH, N.; RAMESH, B.N.: Empirical modelling of water-jet peening of 6063-T6
aluminium alloy. Journal of Production Engineering, 86 (2005), pp. 22-26.
[98] SCHEY, J.A.: Introduction to manufacturing processes. 3rd edition. McGraw-
Hill, Inc., New York, 2000.
[99] CRITCHLOW, G.W.; BREWIS, D.M.: Review of surface pretreatments for titanium
alloys. International Journal of Adhesion and Adhesives, 15 (1995), pp. 161-
172.
[100] XIANGHUAI, L.: Recent advance in surface treatment and its applications in
China. Surface and Coatings Technology, 131 (2000), pp. 261-266.
[101] ULUTAN, D.; OZEL, T.: Machining induced surface integrity in titanium and nickel
alloys: A review. International Journal of Machine Tools and Manufacture, 51
(2011), pp. 250-280.
[102] MEGUID, S.A.; SHAGAL, G.; STRANART, J.C.: Finite element modelling of shot -
peening residual stresses. Journal of Materials Processing Technology, 92-93
(1999), pp. 401-404.
[103] DING, K.; YE, L.: Simulation of multiple laser shock peening of a 35CD4 steel
alloy. Journal of Materials Processing Technology, 178 (2006), pp. 162-169.
[104] KARABELCHTCHIKOVA, O.; RIVERO, I.V.: Variability of residual stresses and
superposition effect in multipass grinding of high-carbon high-chromium steel.
Journal of Materials Engineering and Performance, 14 (2005), pp. 50-60.
[105] ZHANG, B.; YANG, F.; WANG, J.; ZHU, Z.; MONAHAN, R.: Stock removal rate and
workpiece strength in multi-pass grinding of ceramics. Journal of Materials
Processing Technology, 104 (2000), pp. 178-184.
[106] WANG, J.; GUO, D.M.: The cutting performance in multipass abrasive waterjet
machining of industrial ceramics. Journal of Materials Processing Technology,
133 (2003), pp. 371-377.
[107] BIGDELI KARIMI, M.; ARABI, H.; KHOSRAVANI, A.; SAMEI, J.: Effect of rolling strain
on transformation induced plasticity of austenite to martensite in a high-alloy
austenitic steel. Journal of Materials Processing Technology, 203 (2008), pp.
349-354.
Literature 155
[108] BRINGAS, J.E.: Handbook of comparative world steel standards. ASM
International, Inc., Massachusetts, 2004.
[109] Seeberger GmbH & Co. KG: Material data sheet 3.3315. URL:
http://www.seeberger.net/_assets/pdf/werkstoffe/aluminium/en/3.3315.pdf.
(Accessed on 23/05/2012).
[110] mejo Metall Josten GmbH & Co. KG: Festigkeitseigenschaften Aluminium
Bleche und Bänder. URL: http://www.mejo.de/metallexikon_europaeische
_normen_festigkeitseigenschaften_aluminium_bleche_und_baender.asp#L4.
(Accessed on 23/05/2012).
[111] Quick-Ohm Küpper & Co. GmbH: Sapphire waterjet nozzles type 18. URL:
http://www.quick-ohm.com/sapphire_waterjet_nozzles/typ18.htm (Accessed
on 20/01/2014).
[112] Standard ISO 4287: 1997: Geometrical Product Specifications (GPS) --
Surface texture: Profile method -- Terms, definitions and surface texture
parameters; International Organization for Standardization.
[113] Buehler Ltd.: The science behind Materials preparation: A guide to materials
preparation and analysis. United States of America, 2004.
[114] AKAY, S; YAZICI, M.; BAYRAM, A.; AVINC, A.: Fatigue life behaviour of the dual-
phase low carbon steel sheets, Journal of Materials Processing Technology,
209 (2009), pp. 3358-3365.
[115] BELINGARDI, G.; CAVATORTA, M.P.; FRASCA, C.: Bending fatigue behavior of
glass–carbon/epoxy hybrid composites. Composites Science and Technology,
66 (2006), pp. 222-232.
[116] AZMIR, M.A.; AHSAN, A.K.: A study of abrasive water jet machining process on
glass/epoxy composite laminate. Journal of Materials Processing Technology,
209 (2009), pp. 6168-6173.
[117] GODOY, C.; MANCOSU, R.; LIMA, M.; BRANDÃO, D.; HOUSDEN, J.; AVELAR-BATISTA,
J.: Influence of plasma nitriding and PAPVD Cr1−xNx coating on the cavitation
erosion resistance of an AISI 1045 steel. Surface Coating Technology, 200
(2006), pp. 5370-5378.
156 Literature
[118] LEU, M.; MENG, P.; GESKIN, E.; TISMENESKIY, L.: Mathematical modeling and
experimental verification of stationary waterjet cleaning process. Journal of
Manufacturing Science and Engineering, 120 (1998), pp. 571-579.
[119] SOHR, J.M.; THORPE, M.L.: Stripping of thermal spray coatings with ultra high
pressure water jet. SAE Technical Paper, 101 (1992), pp. 51-59.
[120] KRELLA, A.; CZYZNIEWSKI, A.: Influence of the substrate hardness on the
cavitation erosion resistance of TiN coating. Wear, 263 (2007), pp. 395-401.
[121] PREECE C.: DRAPER, C.: The effect of laser quenching the surfaces on their
cavitation erosion resistance. Wear, 67 (1981), pp. 321-328.
[122] ZHAO, K.; GU, C.; SHEN, F.; LOU, B.: Study on mechanism of combined action of
abrasion and cavitation erosion on some engineering steels. Wear, 162-164
(1993), pp. 811-819.
[123] LEE, G.M.C.: The erosion resistance of plain carbon steels under water droplet
impact conditions. Wear, 141 (1990), pp. 185-201.
[124] MANN, B.S.; ARYA, V.: An experimental study to correlate water jet
impingement erosion resistance and properties of metallic materials coatings.
Wear, 253 (2002), pp. 650-661.
[125] RICHMAN, R.H.; MCNAUGHTON, W.P.: Correlation of cavitation erosion behavior
with mechanical properties of metals. Wear, 140 (1990), pp. 63-82.
[126] FELLER, H.G.; KHARRAZI, Y.: Cavitation erosion of metals and alloys. Wear, 93
(1984), pp. 249-260.
[127] HEATHCOCK, C.J.; PROTHEROE, B.E.; BALL, A.: Cavitation erosion of stainless
steel. Wear, 81 (1982), pp. 311-327.
[128] PREECE, C.M.; MACMILLAN, N.H.: Erosion. Annual Review of Materials Science,
7 (1977), pp. 95-121.
[129] KRELLA, A.: Influence of cavitation intensity on X6CrNiTi18-10 stainless steel
performance in the incubation period. Wear, 258 (2005), pp. 1723-1731.
[130] LUISET, B.; SANCHETTE, F.; BILLARD, A.; SCHUSTER, D.: Mechanisms of stainless
steels erosion by water droplets. Wear, 303 (2013), pp. 459-464.
[131] ADLER, W.F.; HOOKER S.V.: Rain erosion behaviour of polymethylmethacrylate.
Journal of Material Science, 13 (1978), pp. 1015-1025.
Literature 157
[132] MILLER, L.; SMITH, G.: Tensile fracture in carbon steels. Journal of Iron Steel
Institute, 208 (1970), pp. 998-1005.
[133] VALIENTE, A.; RUIZ, J.; ELICES, M.: A probabilistic model for the pearlite-induced
cleavage of a plain carbon structural steel, Engineering Fracture Mechanics,
72 (2005), pp. 709-728.
[134] KAMKAR, N.; BRIDIER, F.; BOCHER, P.; JEDRZEJOWSKI, P.: Water droplet erosion
mechanisms in rolled Ti-6Al-4V. Wear, 301 (2013), pp. 442-448.
[135] KWOK, C.T.; MAN, H.C.; CHENG, F.T.: Cavitation erosion and damage
mechanisms of alloys with duplex structures. Materials Science and
Engineering A, 242 (1998), pp. 108-120.
[136] GRINSPAN, A.S.; GNANAMOORTHY, R.: Surface modification by oil jet peening in
Al alloys, AA6063-T6 and AA6061-T4, Part 2: Surface morphology, erosion,
and mass loss. Applied Surface Science, 253 (2006), pp. 997-1005.
[137] DURAISELVAM, M.; GALUN, R.; WESLING, V.; MORDIKE, B.L.; REITER, R.;
OLIGMÜLLER, J.; BUVANASKEHARAN, G.: Cavitation erosion resistance of Ti6Al4V
laser alloyed with TiC-reinforced dual phase intermetallic matrix composites.
Materials Science and Engineering A, 454-455 (2007), pp. 63-68.
[138] MAHAGAONKAR, S.B.; BRAHMANKAR, P.K.; SEEMIKERI, C.Y.: Effect of shot
peening parameters on microhardness of AISI 1045 and 316L material: an
analysis using design of experiment. The International Journal of Advanced
Manufacturing Technology, 38 (2008), pp. 563-574.
[139] NIKITIN, I.; BESEL, M.:Correlation between residual stress and plastic strain
amplitude during low cycle fatigue of mechanically surface treated austenitic
stainless steel AISI 304 and ferritic-pearlitic steel SAE 1045. Material Science
and Engineering A, 491 (2008), pp. 297-303.
[140] KANG, S.H.; IM, Y.T.: Three-dimensional thromo-elastic-plastic finite element
modeling of quenching process of plain-carbon steel in couple with phase
transformation. International Journal of Mechanical Sciences, 49 (2007), pp.
423-439.
[141] AL-ABBASI, F.: Micromechanical modeling of ferrite-pearlite steels. Materials
Science and Engineering A, 527 (2010), pp. 6904-6916.
158 Literature
[142] AUTENRIETH, H.; OKOLO, B.; SCHULZE, V.; WANNER, A.: Surface workhardening
and residual stresses induced by micro cutting processes. Proceedings of the
8th International Conference on Residual Stresses, (2008), Denver, pp. 608-
615.
[143] ZHAN, K.; JIANG, C.H.; JI, V.: Effect of prestress state on surface layer
characteristic of S30432 austenitic stainless steel in shot peening process.
Materials and Design, 42 (2012), pp. 89-93.
[144] HACINI, L.; LE, N.V.; BOCHER, P.: Effect of impact energy on residual stresses
induced by hammer peening of 304L plates. Journal of Materials Processing
Technology, 208 (2008), pp. 542-548.
[145] AVILÉS, R.; ALBIZURI, J.; LAMIKIZ, A.; UKAR, E.; AVILÉS, A.: Influence of laser
polishing on the high cycle fatigue strength of medium carbon AISI 1045 steel.
International Journal of Fatigue, 33 (2011), pp. 1477-1489.
[146] LIU, W.; ZHANG, C.; XIA, C.; YANG, Z.; WANG, P.; CHEN, J.: Strain-induced
refinement and thermal stability of a nanocrystalline steel produced by surface
mechanical attrition treatment. Materials Science & Engineering A, 568 (2013),
pp. 176-183.
[147] LIU, G.; WANG, S.; LOU, X.; LU, J.; LU, K.: Low carbon steel with nanostructured
surface layer induced by high-energy shot peening. Scripta Materialia, 44
(2001), pp. 1791-1795.
[148] TAO, N.; WANG, Z.; TONG, W.; SUI, M.; LU, J.; LU, K.: An investigation of surface
nanocrystallization mechanism in Fe induced by surface mechanical attrition
treatment. Acta Materialia, 50 (2002), pp. 4603-4616.
[149] LIU, G.; LU, J.; LU, K.: Surface nanocrystallization of 316L stainless steel
induced by ultrasonic shot peening. Materials Science and Engineering A, 286
(2000), pp. 91-95.
[150] ZHOU, L.; LIU, G.; MA, X.L.; LU, K.: Strain-induced refinement in a steel with
spheroidal cementite subjected to surface mechanical attrition treatment. Acta
Materialia, 56 (2008), pp. 78-87.
[151] ALANG, N.A.; RAZAK, N.A.; MISKUN, A.K.: Effect of surface roughness on fatigue
life of notched carbon steel. International Journal of Engineering &
Technology, 11 (2011), pp. 203-206.

Literature 159
[152] ZHANG, P.; LINDEMANN, J.: Influence of shot peening on high cycle fatigue
properties of the high-strength wrought alloy AZ80. Scripta Materialia, 52
(2005), pp. 485-490.
[153] HUTMANN, P.: The application of mechanical surface treatment in the
passenger car industry. Shot Peening, Wiley-VCH Verlag GmbH & Co.,
Weinheim, 2006, pp. 3-12.
[154] WAGNER, L.: Mechanical surface treatements on the titanium, aluminium and
magnesium alloys. Materials Science and Engineering A, 263 (1999), pp. 210-
216.
[155] KOSMAC, T.; OBLAK, C.; JEVNIKAR, P.; FUNDUK, N.; MARION, L.: The effect of
surface grinding and sandblasting on flexural strength and reliability of Y-TZP
zirconia ceramic. Dental Materials, 15 (1999), pp. 426-433.
[156] SCHERRER, S.S.; DENRY, I.L.; WISKOTT, H.W.: Comparison of three fracture
toughness testing techniques using a dental glass and a dental ceramic.
Dental Materials, 14 (1998), pp. 246-255.
[157] MONTGOMERY, D.C.; PECK, E.A.; VINING, G.G.: Introduction to linear regression
analysis. John Wiley & Sons, Inc., New York, 2001.
[158] ROY, R.K.: Design of experiments using the Taguchi approach. John Wiley &
Sons, Inc., New York, 2001.
[159] CHI, G.; HU, S.; YANG, Y.; CHEN, T.: Response surface methodology with
prediction uncertainty: A multi-objective optimisation approach. Chemical
Engineering Research and Design, 90 (2012), pp. 1235-1244.
[160] ALAO, A.R.; KONNEH, M.: Surface finish prediction models for precision grinding
of silicon. International Journal of Advanced Manufacturing Technology, 58
(2012), pp. 949-967.
[161] FOWLKES, W.Y.; CREVELING, C.M.: Engineering methods for robust product
design: using Taguchi methods in technology and product development.
Prentice Hall, Inc., Massachusetts, 1995.
List of Publications
[1] AZHARI, A.; SCHINDLER, C.; KERSCHER, E.; GRAD, P.: Improving surface
hardness of austenitic stainless steel using waterjet peening process. The
International Journal of Advanced Manufacturing Technology, 63 (2012), pp.
1035-1046.
[2] AZHARI, A.; SCHINDLER, C.; LI, B.: Effect of waterjet peening on aluminium alloy
5005. International Journal of Advanced Manufacturing Technology, 67
(2013), pp. 785-795.
[3] AZHARI, A.; SCHINDLER, C.; NKOUMBOU, J.; KERSCHER, E.: Surface erosion of
carbon steel 1045 during waterjet peening. Journal of Materials Engineering
and Performance 23 (2014), pp. 1870-1880.
List of Students’ Projects
[1] LI, B.: The effect of waterjet peening on aluminium alloy 5005. Studientarbeit
Nr.: 675 (2012), Lehrstuhl für Konstruktion im Maschinen- und Apparatebau
(KIMA), Technishe Universität Kaiserslautern.
[2] JHISLAIN, N.K.: Waterjet treatment of ferritic steel (1045). Studientarbeit Nr.:
711 (2012), Lehrstuhl für Konstruktion im Maschinen- und Apparatebau
(KIMA), Technishe Universität Kaiserslautern.

Curriculum vitae
First name: Mohd Azmir
Last name: Mohd Azhari
Education
1986 – 1991 Seri Cempaka Primary School, Kampong Gajah, Perak
1992 – 1996 Izzuddin Shah Secondary School, Ipoh, Perak
April 1999 Matriculation certificate,
International Islamic University Malaysia
May 2003 Bachelor of Engineering in Manufacturing,
International Islamic University Malaysia
December 2006 Masters of Science in Manufacturing,
International Islamic University Malaysia
December 2013 PhD in Mechanical Engineering
Technische Universität Kaiserslautern
Work experience
Apr 2002 – Jun 2002 Industrial trainee, Lafarge Malayan Cement Ltd.
May 2003 – Dec 2003 Production executive, F&N Dairies Pvt. Ltd.
Dec 2005 – Dec 2006 Lecturer, School of Engineering and Tecnology,
INTI International College Subang
Dec 2006 – Dec 2009 Lecturer, Faculty of Manufacturing Engineering,
Universiti Malaysia Pahang
Dec 2009 – Dec 2013 PhD scholar, Chair of Design in Mechanical Engineering,
Technische Universität Kaiserslautern
Dec 2013 – Senior lecturer, Faculty of Manufacturing Engineering,
Universiti Malaysia Pahang
KIMA-Schriftenreihe
bereits veröffentlicht wurden
11 Cadavid-Giraldo, R.: Cutting with fluidjets of small diameter. 2004, ISBN 3-936890-46-3 30,–
12 Kasper, J.: Untersuchungen zur Schneidzerkleinerung von Aluminium. 2005, ISBN 3-936890-70-6 30,–
13 Theobald, U.: Untersuchung des Gewebeaufschlusses in Reißmaschinen unter Betrachtung des Einzelbeanspruchungsvorganges. 2005, ISBN 3-936890-74-9 30,–
14 Loof, C.: Entwicklung eines Hydrokeratoms für die LASIK-Chirurgie. 2008, ISBN 978-3-939432-79-1 30,–
15 Thjunjoto: Entwicklung einer Apparatur zur Gewinnung von Proben aus Bohrkernen unter in-situ Druck. 2009, ISBN 978-3-941438-07-1 30,–
16 Wind, M.: Numerische und experimentelle Analyse und Optimierung der technischen Eigenschaften eines selbstexpandierenden Stents. 2011, ISBN 978-3-941438-75-0 30,–
17 Kleiner, O.: Numerische und experimentelle Untersuchung der Rad/Schiene-Interaktion unter Berücksichtigung mechanischer und thermomechanischer Effekte. 2011, ISBN 978-3-941438-88-0 30,–
8 Soffel, M.: Untersuchung des Lufteinzuges beim Hochgeschwindigkeitswickeln von Kunststofffolien. 2013, ISBN 978-3-943995-32-9 40,–
9 Stephan, N. K.: Vorgehensmodell zur Unterstützung der interdisziplinären und föderierten Zusammenarbeit in der frühen Phase der Produktentstehung - am Beispiel der Nutzfahrzeugindustrie - 2013, ISBN 978-3-943995-37-4 40,– 10 Li, H.: Analysis of Off-Road Tire-Soil Interaction through Analytical and Finite Element Methods 2013, ISBN 978-3-943995-42-8 40,–
11 Azhari M. A. M.: Effects of Waterjet Treatment on Surface Integrity of Metals and its Optimization
2014, ISBN 978-3-943995-60-2 40,–