effects of web atmospheric cues on usersâ emotional
TRANSCRIPT

Transactions on
Human-Computer Interaction
THCI
Volume 4 ■ Issue 1 ■ March 2012
Abstract
Susan Wiedenbeck was the accepting Senior Editor. This article was submitted on 7/1/2010 and accepted on 1/3/2012. It was with the authors 420 days for 3 revisions. Sheng, H. and T. Joginapelly (2012) “Effects of Web Atmospheric Cues on Users’ Emotional Responses in E-Commerce,” AIS
Transactions on Human-Computer Interaction (4) 1, pp.1-24.
AIS
Tra
ns
ac
tio
ns
on
Hu
ma
n-C
om
pu
ter
Inte
racti
on
Hong Sheng
Missouri University of Science and Technology [email protected]
Tanvi Joginapelly
Missouri University of Science and Technology [email protected]
The internet has become part of everyday life and revolutionized the shopping experience. Consumers’ emotional responses play
an important role in predicting and measuring behavioral intentions and satisfaction; therefore, it is imperative to study e-commerce from an affective perspective. This research adopted the Stimulus-Organism-Response (S-O-R) model to examine the effects of web atmospheric cues, mainly vividness and interactivity, on users’ emotional responses in e-commerce, and the influence of users’ emotional responses on their purchasing intentions. This research involved three stages: a pretest, an experimental study, and an online survey. First, recruited experts in human-computer interaction (HCI) evaluated 25 different e-commerce websites on interactivity and vividness. These ratings informed the selection of three websites to represent various levels of atmospheric cues: high interactivity and vividness, medium interactivity and vividness, and low interactivity and vividness. In the second stage, an experiment was conducted to collect the physiological responses of 20 participants, including galvanic skin response, heart rate variability, and pupil dilation, as they viewed each of the three e-commerce websites; participants’ self-reported emotional responses were also recorded. Finally, an online survey collected data on the emotional responses and purchase intentions of 53 participants after viewing the three e-commerce websites. The results of the experimental study indicate that web atmospheric cues such as vividness and interactivity had significant positive effects on users’ valence and arousal rates. Furthermore, users experiencing higher arousal and more positive valence rates reported higher intentions to purchase from the e-commerce website. Analysis of the physiological data showed that users’ heart rate variability exhibited a trend similar to that of their self-reported valance rate, but no such trend was observed for self-reported arousal rates, galvanic skin response, or pupil dilation values. This paper not only extends the S-O-R paradigm in the e-commerce context and provides empirical evidence for the model, but also applies Russel’s (1980) emotional model to understand the users’ emotional responses to e-commerce websites. The physiological measures employed in this study are examples of new usability evaluation tools for determining complex affective measures in HCI.
Keywords: E-commerce, emotions, physiological measures, atmospheric cues, valence-arousal
Effects of Web Atmospheric Cues on Users’ Emotional Responses in
E-Commerce
Original Research

2
Sheng and Joginapelly Effects of Web Atmospheric Cues on Users’ Emotional Responses
AIS Transactions on Human-Computer Interaction Vol. 4, Issue 1, pp.1-24, March 2012
INTRODUCTION
Today, more and more consumers are using e-commerce and virtual stores to purchase products and virtual services (Jones et al., 2008). Although consumers’ purchase intentions and shopping decisions are highly cognitive, they are also emotional and influenced by factors such as e-commerce web interface and its design features (Jones et al., 2008; Kim et al., 2009). In fact, Donald A. Norman, in his book titled “Emotional Design: Why We Love (or hate) Everyday Things,” argues that the success of a product depends more on the emotional impact of the design than on its practical elements. A well designed interface tends to induce positive feelings, expand the user’s creative process, and make decisions easier. On the other hand, a badly designed and unappealing interface induces negative emotions, which in turn inhibit the user’s thought process (Norman, 2004). Because consumers’ emotional responses play an important role in predicting and measuring behavioral intentions and satisfaction, it is imperative to study e-commerce from the affective perspective and examine the website design features that influence consumers’ emotional responses (Kim et al., 2009). Store atmosphere has long been recognized as an important factor influencing consumers’ perceptions, attitudes, and emotions while shopping (Kotler, 1973). According to Kotler (1973), atmosphere refers to the conscious design of the shopping environment to induce certain emotions among consumers and increase the chance that they will buy. A store atmosphere is determined by various factors such as its image, theatrics, and atmospherics (i.e., physical attributes such as lighting, music and brightness) (Vrechopoulos and Siomkos, 2007). Similar to the effect of atmospherics on consumer shopping behavior in a physical environment, web atmospheric cues (sometimes called a website’s ‘look and feel’) also affect consumers’ emotional and cognitive states, thereby influencing their purchase intentions (Kim et al., 2009). Among these cues, interactivity and vividness have been identified as key features of e-commerce websites, influencing consumers’ cognitive and emotional responses (Coyle and Thorson, 2001; Steuer, 1992). Over the years, researchers have studied extensively the cognitive aspects of consumer behaviors in e-commerce, but little has been done to address the emotional aspects of e-commerce from a consumer perspective (Jones et al., 2008). Most of the literature has focused on providing cognitively convenient web page features, such as sequential menus and layout (Hochheiser and Shneiderman, 2000). As web users grow accustomed to these basic cognitive functions (Picard and Andrew, 1998), it becomes increasingly important for e-commerce stores to provide users with positive emotional experiences (Picard, 1995; Oliver, 1996). Thus, the current study was designed to examine the emotional responses of users on the atmospheric cues of e-commerce websites, such as interactivity and vividness, and the role of emotions in shaping users’ purchase intentions. Although affective experiences involve some degree of cognitive analysis and vice versa, recent literature has shown that online shopping is highly emotional (Donthu and Gracia, 1999). Because emotional response is immediate and has a direct impact on shopping outcomes, this paper focuses on consumers’ emotional responses in e-commerce. Also, because emotions are difficult to measure and evaluate, this research seeks to validate and interpret the results of various emotional measures and also introduces a few innovative techniques to evaluate and measure emotional responses. The remainder of the paper is organized as follows: Section 2 surveys the existing literature related to emotional design, web atmospheric cues, and interactivity and vividness. Section 3 discusses the conceptual foundations of this study: the SOR model, Russel’s circumplex model, and various physiological measures. Section 4 presents the research model and hypotheses. Section 5 discusses the research methodology, and describes the data collection procedures. Section 6 reports the results of the data analysis, and Section 7 explains the results and discusses their implications. Finally, Section 8 concludes the paper.
LITERATURE REVIEW
Emotions Affect and emotions are two closely related concepts. Affect is an essential part of our interaction with various stimuli around us. It often encompasses two concepts: mood and emotion. Emotion is a feeling state towards a specific object. In this study, we focus on users’ emotional responses towards e-commerce websites. Many theories consider affect to be post-cognitive and propose that people form affective impressions after cognitively processing the information. Ortony et al. (1990), for example, suggested that all emotions are based on cognitive analysis and that they arise from cognitive interpretation of the external reality.

3
Sheng and Joginapelly Effects of Web Atmospheric Cues on Users’ Emotional Responses
AIS Transactions on Human-Computer Interaction Vol. 4, Issue 1, pp.1-24, March 2012
However, other researchers believe that initial affective judgments are usually independent and occur prior to cognitive operations (Zajonc, 1980). Recent developments in the field of neuroscience have also proved that affective responses occur prior to cognitive activity (LeDoux, 1992). One of the main characteristics of emotion is quick onset. Emotions are induced by mere exposure within the first few fractions of a second, and people are often unaware of their own immediate emotional responses (Ekman, 1992). In general, affective judgments, once formed, are irrevocable, but the same does not hold true for cognitive judgments (Zajonc, 1980). Emotions have attracted considerable interest from researchers in fields such as human-computer interaction, marketing, and advertising. For example, researchers in marketing have found that emotions play an important role in shopping (Dormann, 2001). Emotional factors often dominate utilitarian functions in this context and influence decision making and consumer behavior (Damasio, 1994). Consumers make purchase decisions based on various emotional factors (Dormann, 2001). Eroglu et al. (2003) also found that atmospheric cues caused emotional experiences which affected users’ attitudes and behavior. Emotions are very complex and complicated to measure and evaluate. Most early research on emotions focused on two dimensions: arousal and valence (Ortony et al., 1990). However, recent advancements in technology have given researchers the means to explore various techniques to assess users’ affect, including eye tracking, physiological data collection, and facial expression recognition (Hudlicka, 2003). One of the motivations of this research is to validate and interpret the results of various measures of emotional experience. In this research, we introduce a few innovative techniques in evaluating and measuring emotional responses.
Store Atmospherics Store atmospherics refers to “the conscious design of space to create certain effects in buyers; more specifically, atmospherics is the effort to design buying environments to produce specific emotional effects in the buyer that enhance his purchase probability” (Kotler, 1973, p.50). Store atmospherics are qualities of the surroundings that can be described according to sensory channels, such as sight, sound, scent, and touch (Kotler, 1973). Kotler’s work opened a new realm of conceptual and empirical studies. Researchers have since examined the effects of various atmospheric cues such as lighting (Golden and Zimmerman, 1986), color (Bellizzi et al., 1983) and smell (Spangenberg et al., 1996). For example, Bellizzi et al. (1983) evaluated the effect of colors in retail sectors and found that color has specific perceptual qualities and can affect the store image. Spagenberg et al. (1996) evaluated user behavior in scented and unscented environments and found that user behavior is more positively affected in a scented environment. Consumers seek social substitutes online; hence, they tend to evaluate web aesthetics as they do in their physical shopping experience (Tractinsky and Rao, 2001). Recent literature on e-commerce suggests that web aesthetics influence users’ satisfaction and pleasure (Tractinsky et al., 2000) because the web interface is analogous to the façade of a physical store (Hooper, 1986). Studies on consumers online purchase behavior have also identified web design quality as a major factor affecting consumer responses (Zhou et al., 2009). Vilnai-Yavetz and Rafaeli (2006) have further demonstrated a positive relationship between aesthetics in virtual service space and consumer satisfaction and attitude. They provided users with two different virtual service spaces that varied in levels of aesthetics, and the results suggested that aesthetics influenced both consumer satisfaction with the service and their feeling of pleasantness. The results also demonstrated that emotions play a strong role in the consumer decision making process and affect consumer responses.
Interactivity and Vividness Interactivity and vividness are two important atmospheric cues that influence consumer attitudes and emotions (Fortin and Dholakia, 2005; Coyle and Thorson, 2001; Lai et al., 2009). Higher levels of vividness can evoke more positive consumer affect and result in higher immersion levels (Fortin and Dholakia, 2005). Interactivity is considered a key feature of media. In this study, we focus on users’ emotional responses to different websites with various levels of interactivity and vividness. Vividness refers to the richness of a mediated environment and the way the environment presents and communicates information to the senses of users (Steuer, 1992). Steuer (1992) divides vividness into two dimensions, depth and breadth. Breadth refers to the number of sensory dimensions involved, while depth refers to the bandwidth of the environment in which information is presented. In brief, vividness refers to richness in media and information presented to users in a mediated environment. Interactivity is the extent to which a computer-mediated environment allows its users to participate in modifying the content and format of the environment (Steuer, 1992). Newhagen and Rafaeli (1996) defined interactivity as “communication that reflects back on itself, feeds on, and responds to the past.” Interactivity plays a strong role in engaging consumers and eliciting favorable responses from them (Fortin and Dholakia, 2005).

4
Sheng and Joginapelly Effects of Web Atmospheric Cues on Users’ Emotional Responses
AIS Transactions on Human-Computer Interaction Vol. 4, Issue 1, pp.1-24, March 2012
Certain communication such as television and magazines are very vivid but less interactive. On the other hand, list serves and newsgroups can be highly interactive but rate very low on vividness (Fortin & Dholakia, 2005). Studies on hypermedia computer-mediated environments, such as websites, have found that they have higher levels of both interactivity and vividness (Hoffman and Novak, 1996). Prior research has examined vividness and interactivity as factors determining user involvement (Steuer, 1992; Coyle & Thorson, 2001) and studied their impact on user attitudes (Coyle & Thorson, 2001; Lai et al., 2009) and satisfaction (Lai et al., 2009). However, there exists a notable gap in the literature; the relationships between web atmospheric cues and user emotional responses have been overlooked. The impacts of user emotional responses on behavioral variables such as attitude and purchase intention have also been left unaddressed. Further, the majority of research in this area has evaluated emotional responses using subjective measures such as self-reported surveys. Because emotional responses are complex and difficult to measure, the present work introduces a few innovative techniques to measure user physiological responses as indicators of their emotional states. Using these measures, self-reported results could be triangulated, and a more in-depth understanding of user affect and emotions could be developed.
CONCEPTUAL FOUNDATIONS
S-O-R Framework The framework for this research was developed from the Stimuli-Organism-Response (S-O-R) paradigm developed by Mehrabain and Russell (1974). This model proposes that stimuli from the environment affect users’ internal states, which in turn influence their behavior and response (Mehrabain and Russell, 1974) (Figure 1).
Figure 1: S-O-R Model (Adapted from Mehrabain and Russell, 1974)
The S-O-R paradigm was first introduced in the context of environmental psychology. It was later adopted and extended in the retailing context. Several marketing studies have extended the model by establishing a taxonomy of responses (e.g., Donovan and Rossiter, 1982), by developing a classification system of environmental features (e.g., Baker et al., 1992), and by introducing individual traits (such as involvement and atmosphere responsiveness) as moderators (e.g., Eroglu, 2001). For example, Eroglu et al. (2001, 2003) studied the effect of atmospheric cues on shoppers’ attitudes and purchase intentions, and they classified stimuli into two categories: high- task- relevant stimuli and low- task- relevant stimuli. A high-task-relevant stimulus contains verbal cues, images, and navigation aids such as price, delivery date, and site map, which help consumers attain their shopping objectives. A low-task-relevant stimulus could be color, animation, font type and size, or atmospheric cues which do not contribute to shopping goals but provide a pleasant experience to the consumers. Both categories affect a consumer’s organisms, that is, their affective and cognitive states. Cognitive states are related to a consumer’s information processing, retention, and retrieval ability, whereas affective states describe the user’s emotional responses. These states influence consumer behavioral responses, such as purchase intention and avoidance behavior, which are the final outcomes in the S-O-R model.
Arousal – Valence Model Studies have categorized emotions in various ways. Lang (1995) defined emotions in two-dimensional space and used pictures as stimuli to be mapped to emotions. Russell et al. (1989) created the affect grid, which is a single-item scale designed to assess affect along the dimensions of pleasure and arousal (on a scale from 1 to 9). On the other hand, Ekman (1999) treated emotions as discrete. He proposed that although emotions such as fear, anger, and sadness are all negative, they differ in their behavioral, physiological, and other characteristics. His work contradicted other models that treated emotions as fundamentally the same, but varying in pleasantness and intensity level. Among all the models developed to categorize and assess emotions, Russell’s circumplex model (1980) is among the most widely accepted. In this model, emotions are classified into two dimensions, valence and arousal. Valence represents the degree of pleasantness of an emotional experience, while arousal represents the intensity of the emotional experience using a range from calmness to excitement (Attonen and Surakka, 2005). Thus, all emotions can be characterized as coordinate points in the two-dimensional space. For example, an engaging experience can be characterized as high arousal- high valence, whereas a frustrating experience can be represented as high arousal-low valence. Figure 2 depicts Russell’s model.

5
Sheng and Joginapelly Effects of Web Atmospheric Cues on Users’ Emotional Responses
AIS Transactions on Human-Computer Interaction Vol. 4, Issue 1, pp.1-24, March 2012
Prior studies have used Russell’s circumplex model to examine and measure users’ emotions (Martin et al., 2008). For example, Lai et al. (2009) studied how high arousal rates are related to consumer satisfaction. Barsky and Nash (2002) demonstrated that emotions play an important role in influencing consumer loyalty and the decision making process. As the body of literature indicates that emotions have an impact on users’ decision making and attitude, the effect of each dimension (valence and arousal) must be studied in greater detail, and measures, algorithms, and computations must be simplified and improved for easy and accurate categorization of emotions.
Figure 2: Russell’s Circumplex Model (1980)
Physiological Measures Over the last decade, a number of evaluation tools have been applied in the field of usability studies (Lin and Hu, 2005). Subjective techniques, such as interviews and survey questionnaires, although convenient and generalizable, often miss complex patterns and are susceptible to user bias. On the other hand, objective analysis, such as using video to code gestures, body language, and verbalization, provides a rich source of data, but the data analysis process is complex and time consuming (Mandryk et al., 2006; Lin and Hu, 2005). With recent scientific and technological developments, researchers are exploring alternative methods of evaluation. Because physiological responses are involuntary, continuous, and accurate, many studies are exploring their use and integration with existing evaluation tools. Some of the most commonly used physiological measures are galvanic skin response (GSR), heart rate, and pupil dilation. GSR is a measure for skin conductivity. The eccrine glands located in the palms of the hands and the soles of the feet cause skin conductivity and respond to psychological stimulation (Stern et al., 2001). This measure is an indicator of some emotional responses and cognitive activities (Chanel et al., 2008; Mandryk et al., 2006; Ward and Marsden, 2003). Lang (1995) has suggested that conductivity is linearly associated with the rate of arousal. Similar to GSR, pupil dilation also reflects physiological arousal, but also helps discriminate between stimuli that tend to cause negative versus positive arousal (Partala et al., 2000). Previous studies have provided empirical evidence suggesting that pupil responses reflect emotional arousal (Partala and Surakka, 2003) and cognitive load (Hyona et al., 1995; Kahneman and Beatty, 1966). Several studies reported by Partala and Surakka have demonstrated the use of pupil dilation in assessing the emotional responses of users (Partala et al., 2000; Partala and Surakka, 2003). The studies found that pupils tend to dilate longer in response to emotional stimulation, and pupil size is usually greater in response to unpleasant stimuli than to pleasant stimuli (Partala and Surakka, 2003). Heart rate is another common physiological response used to measure autonomic nervous system activity. It is generally used to distinguish between pleasant and unpleasant emotions (Mandryk et al., 2006; Anttonen and Surakka, 2005). In general, heart rate tends to decelerate when a user is subjected to emotional stimuli, and the rate of deceleration is usually higher for negative stimuli than for positive stimuli (Bradley and Lang, 2000; Brosschot and Thayer, 2003). Heart rate variability (HRV) measures the oscillation of intervals between consecutive heart beats (Rowe et al., 1998); it is positively related to a user’s valence (e.g., pleasantness–unpleasantness). Therefore, HRV is often employed for assessing emotions.

6
Sheng and Joginapelly Effects of Web Atmospheric Cues on Users’ Emotional Responses
AIS Transactions on Human-Computer Interaction Vol. 4, Issue 1, pp.1-24, March 2012
In recent years, various usability studies have examined physiological responses in the field of human-computer interaction (HCI). Ward and Marsden (2003) explored physiological responses (GSR, heart rate, and blood volume) when users were subjected to various web page designs (e.g., ill designed and well designed interfaces). Although they detected no significant difference in participants’ behavioral responses to the two types of web pages, participants exhibited higher arousal rates when viewing a poorly designed interface. Mandryk et al. (2006) employed physiological measures to evaluate entertainment technologies. Their study tested the effectiveness of these measures in evaluating the user experience and provided guidelines for collecting physiological data. It also revealed that participants exhibited different levels of physiological responses while playing games against a friend than when playing against a computer.
RESEARCH MODEL AND HYPOTHESES DEVELOPMENT
This study applied the S-O-R paradigm in the context of e-commerce to examine the effects of atmospheric cues such as vividness and interactivity on users’ emotional responses and thus on their purchase intentions. Figure 3 illustrates the research model.
Figure 3: Research Model
Previous studies have identified vividness and interactivity as two atmospheric cues that influence an individual’s cognitive and emotional states (Coyle and Thorson, 2001; Steuer, 1992; Lai et al., 2009). The present study focuses on the influence of these design parameters on the users’ emotional state, that is, their valence and arousal rates. Based on the evidence provided by previous studies on the relationship between users’ emotional states and website design features, the following hypotheses were developed:
H1: Participants subjected to higher levels of vividness and interactivity on an interface tend to exhibit higher arousal than those who are subjected to a less vivid and interactive interface.
H2: Participants subjected to higher levels of vividness and interactivity on an interface tend to exhibit more positive valence than those who are subjected to a less vivid and interactive interface.
This study draws its theoretical framework from the S-O-R paradigm, which proposes that stimuli influence users’ internal states (affective and cognitive), which in turn influence their responses and shopping outcomes. The internal state considered here is the user’s emotional state (valence and arousal), and the shopping outcome refers to the purchase intention. A growing body of literature suggests that consumers’ emotional states impact their decision making ability and purchase intentions (Mehrabain and Russell, 1974; Eroglu et al., 2001). For example, Baker et al. (1992) found a positive relationship between consumers’ arousal and their willingness to buy, as well as a positive relationship between consumers’ pleasure (which is similar to valance) and their willingness to buy. Therefore, the following hypotheses have been developed:
H3: Participants experiencing more positive valence have higher purchase intentions.
H4: Participants experiencing higher arousal have higher purchase intentions.
RESEARCH METHODOLOGY
This research involved three stages: a pretest, an experimental study, and an online survey. The objective of the pretest was to select websites with three levels of atmospheric cues: low vividness and low interactivity, medium vividness and medium interactivity, and high vividness and high interactivity. Based on the selections, an experimental study was conducted to collect participants’ subjective and physiological responses. In addition, an online survey was distributed to a larger sample to collect participants’ subjective responses to the websites.

7
Sheng and Joginapelly Effects of Web Atmospheric Cues on Users’ Emotional Responses
AIS Transactions on Human-Computer Interaction Vol. 4, Issue 1, pp.1-24, March 2012
The websites were selected from a number of online shoe stores to represent various interactivity and vividness levels and to test users’ physiological responses and self-reported emotional measures. Online shoe stores were chosen because they are generally well known sites, and participants are likely familiar with them; therefore, the learning curve was not expected to be steep. Further, most online shoe stores sell products similar to those sold in other online shoe stores; therefore, participants’ purchase decisions were expected to be influenced less by the design features of the products than by the web design and web atmospheric cues. Finally, compared to many other websites, online shoe stores are neutral in terms of gender preference, permitting the inclusion of both female and male participants.
Data Collection
Pretest A pretest was conducted to select appropriate stimuli representing various degrees of vividness and interactivity expected to elicit various emotional responses from users. Initially, researchers selected twenty-five online shoe stores. A group of eight HCI experts was recruited to select an appropriate combination of atmospheric cues and further narrow the selections. All experts had received systematic training in usability testing and evaluation, and all had worked on HCI-related research projects such as eye tracking, web and social networking, affective computing, and virtual reality. They were familiar with the major design and usability principles and therefore competent to evaluate an interface. Each expert viewed all 25 website addresses and rated each website on vividness and interactivity using Likert scales. Based on these ratings, three websites were selected as stimuli for the main study, each representing one of the three levels of vividness and interactivity defined above. Because the concepts of vividness and interactivity are closely related (Fortin and Dholakia, 2005) and websites have both increased interactivity and vividness compared to traditional media (Hoffman and Novak, 1996), extreme conditions such as interactive but non-vivid or vice versa are rare in e-commerce websites. Therefore, we did not manipulate different levels of vividness and interactivity.
Experiment The experiment was conducted in a laboratory setting where each participant was asked to examine the three websites. An eye tracker was used to present the websites (treatment conditions) and measure the participants’ pupil dilations. Each participant was also connected to biofeedback sensors measuring heart rate and galvanic skin response. The treatment conditions were presented to the participants in random order to mitigate any ordering effect. Before the experiment, researchers briefed the participants about the experimental procedures. Then, biofeedback sensors were applied and participants were asked to perform a simple task on each of the three websites. The task required the participants to browse through the website and find a pair of sneakers they liked. Having narrowed their search, the participants were asked to add the product to the shopping cart. During the task, participants’ physiological measures were continuously monitored and recorded. After completing the task for each website, participants filled out a short questionnaire to provide more information about their emotional responses and behavioral intentions.
Online Survey A survey was created and posted online. The link for the survey was distributed among students in a mid-sized Midwestern University in the U.S., who were encouraged to participate. Three websites, one representing each treatment condition, were included based on the pretest data. For each website, participants were asked to navigate the website and perform a task similar to that used in the experimental study. They were then asked to answer the survey questions, which asked about their emotions, purchase intentions, and the perceived vividness and interactivity of the website. To ensure that the participants navigated the site and performed the specified task, a manipulation check question was also included for each website.
Subjects The eight HCI experts who participated in the pretest were recruited from a Midwestern university in the U.S. Twenty students participated in the experimental study, and the online survey questionnaire was distributed to a larger sample on the campus so that a total of 103 participants completed the survey. However, data from 50 respondents were eliminated due to incomplete responses or failure to address the manipulation check question. Therefore, survey data from 53 respondents were included in the analysis. Among the participants who completed the survey and experiment, 79.45% were below the age of 25, while 20.55% were between 26 and 40 old. Forty-six participants (or 63.01%) were male, and twenty-seven (or 36.99%) were female. The majority of participants had extensive experience with the web and had been using the internet for seven or more years. Sixty participants (82.19%)

8
Sheng and Joginapelly Effects of Web Atmospheric Cues on Users’ Emotional Responses
AIS Transactions on Human-Computer Interaction Vol. 4, Issue 1, pp.1-24, March 2012
indicated that they had seven or more years of internet experience; eleven (15.06%) reported having four to six years of internet experience. Table 1 summarizes the demographic information about participants in both the experimental study and the online survey.
Table 1: Participant Demographics
Classification Category No. of Subjects
(Experiment) No. of Subjects (Online Survey)
Age <25 15 43
26-40 5 10
Gender Male 15 31
Female 5 22
Internet Experience
>=7 years 16 44
4-6 years 4 7
<3 years 0 2
Measurement The scales used for subjective analysis were primarily adapted from previously published literature. Purchase intention was measured using the seven-point Likert scale items developed by Baker et al. (1992). Six questions from the 18-item MPI scale developed by McMillan and Hwangs’ (2002) were adapted to measure perceived interactivity. We weren’t able to find an existing instrument for measuring vividness. Therefore, we developed four items for measuring vividness based on its conceptual definition in previous literature. The face validity of these items was assessed during the pretest. We also performed a factor analysis and reliability test using the survey data and experimental data; the results suggest that our measurement was reliable and valid. Users’ emotional responses (valence and arousal) were measured using the self assessment manikin (SAM) technique. This technique is a pictorial assessment technique developed by Lang (1980) to measure affective states such as pleasure, arousal, and dominance. Figures 4 and 5 depict the SAM figures for two affective dimensions, arousal and valence. Those used for valence ranged from a smiling figure to a frowning figure; arousal was represented by figures ranging from excited to sleepy. SAM is a widely adopted technique for measuring affective states because it is independent of verbal rating and can thus be adopted even in non-English speaking cultures. Also, it does not require complicated statistical analysis (Bradley and Lang, 1994) and can be used in multiple contexts to obtain reactions to pictures, advertisements, sounds, and other stimuli. Finally, it is simple and inexpensive to implement and easy to analyze.
Figure 4: SAM to Rate Valence (Lang, 1980)
Figure 5: SAM to Rate Arousal (Lang, 1980)

9
Sheng and Joginapelly Effects of Web Atmospheric Cues on Users’ Emotional Responses
AIS Transactions on Human-Computer Interaction Vol. 4, Issue 1, pp.1-24, March 2012
Physiological data were collected using a biofeedback device with sensors connected to the users’ fingers and a Tobii eye tracker system, which was used to measure pupil dilation. Light Stone biofeedback device was used to measure users’ GSR and HRV (see Figure 6). The biofeedback device consists of three “Magical Rings,” which are sensors connected to the device. Of the three sensors, “Heart Ring” is usually connected to the user’s middle finger and is used to measure their HRV while the remaining two sensors are connected to the user’s ring and index fingers and measure GSR. When a user’s autonomic nervous system is activated, there is an energy flow and perspiration increases that provides GSR data. The Eye tracker showed in Figure 7 is a Tobii eye tracker. It is a non-intrusive device that estimates a user’s gaze direction, fixation points, and pupil dimensions. It calculates the position of a user’s eyes and their pupil diameters using the eye model technology.
Figure 6: Biofeedback Device
Figure 7: Eye Tracker
DATA ANALYSIS
Pretest A group of HCI experts rated the initial twenty-five websites on a 7- point Likert scale of interactivity and vividness. Based on the scores, three websites were chosen, each representing one of three levels of interactivity and vividness. Table 2 and Table 3 present the descriptive statistics of the three websites on expert-rated interactivity and vividness.
Table 2: Descriptive Statistics on Interactivity
Mean Std. Deviation N
Website1– low interactivity 2.66 1.16 8
Website 2 – medium interactivity 4.63 1.46 8
Website 3 – high interactivity 5.47 1.77 8
Table 3: Descriptive Statistics on Vividness
Mean Std. Deviation N
Website1– low vividness 2.53 1.22 8
Website 2 – medium vividness 4.47 1.51 8
Website 3 – high vividness 5.78 1.10 8

10
Sheng and Joginapelly Effects of Web Atmospheric Cues on Users’ Emotional Responses
AIS Transactions on Human-Computer Interaction Vol. 4, Issue 1, pp.1-24, March 2012
Subjective Measures from the Experiment and Online Survey
Factor Analysis A confirmatory factor analysis was conducted on the subjective data collected from the online survey and experiment to assess the reliability and validity of the constructs – interactivity, vividness and purchase intention. Initially, six items were included for interactivity, four for vividness, and three for purchase intention. The factor analysis demonstrated that two of the items on the interactivity scale cross-loaded with other constructs. Hence, these two items were removed and the remaining items were retested. The final scales consisted of four items each for vividness and interactivity and three items for purchase intention. All items loaded on the constructs they were intended to measure, with no significant loadings on the other constructs. The results are presented in Table 4. Cronbach’s alpha coefficients were used to assess the internal consistency or reliability of the constructs. Results showed that the four items for vividness, the four items for interactivity, and the three items for purchase intention were highly reliable (with Cronbach’s α = 0.89, 0.91 and 0.96 respectively), far exceeding Nunnally’s (1978) threshold of 0.70.
Table 4: Factor Analysis on Interactivity, Vividness and Purchase Intention
Component
1 2 3
Interactive4 .89 .14 .23
Interactive3 .87 .16 .26
Interactive6 .85 .12 .35
Interactive5 .79 .20 .15
vivid3 .13 .86 .11
vivid1 .10 .84 .24
Vivid4 .23 .81 .23
vivid2 .16 .80 .29
PurIntention2 .31 .27 .88
PurIntention1 .31 .29 .86
PurIntention3 .34 .32 .83
Repeated measures Repeated measures ANOVAs were conducted on the subjective data collected from the survey and experiment responses to examine the effects of interactivity and vividness on users’ valence and arousal levels. These levels were measured for each of the three websites using the SAM technique. The mean valence value obtained for the high vivid and high interactive website was 3.96. This was higher than that for the medium vivid and medium interactive website (M = 3.64) and the low vivid and low interactive website (M = 3.15). To evaluate the significance of this difference, a Mauchly test of sphericity was first conducted. The result was significant (p = 0.05), indicating that the equal variance assumption had been violated. Thus, a Greenhouse Geisser test was also conducted. This test indicated that the website atmospheric cues had a significant effect on valence, F(1.85, 133.21) = 21.69, p < .001 (See Table 5). A similar pattern was also observed for arousal. The mean of arousal was higher for the high vivid and high interactive website (M = 2.93) than for the medium vivid and medium interactive (M = 2.45) and the low vivid and low interactive (M = 2.12) websites. The result of the Mauchly test of sphericity was significant (p = 0.001); therefore, equal variance was not assumed. The Greenhouse Geisser test showed a significant effect on arousal for the three websites with varying levels of atmospheric cues, F(1.69, 121.82) = 23.50, p < .001 (see Table 6). The results from repeated measures ANOVAs supported hypotheses 1 and 2; that is, as levels of interactivity and vividness increased, users’ arousal and valence rates also increased.

11
Sheng and Joginapelly Effects of Web Atmospheric Cues on Users’ Emotional Responses
AIS Transactions on Human-Computer Interaction Vol. 4, Issue 1, pp.1-24, March 2012
Table 5: Repeated Measures Results on Valence
Source Type III Sum of Squares
Df Mean
Square F Sig.
Partial Eta
Squared
Noncent. Parameter
Observed Powera
Va
lence Sphericity Assumed 24.23 2 12.11 21.69 .000 .23 43.37 1.000
Greenhouse-Geisser 24.23 1.85 13.10 21.69 .000 .23 40.12 1.000
Huynh-Feldt 24.23 1.90 12.77 21.69 .000 .23 41.14 1.000
Lower-bound 24.23 1.00 24.23 21.69 .000 .23 21.69 .996
Note: Computed using alpha = .05
Table 6: Repeated Measures Results on Arousal
Source Type III Sum of Squares
Df Mean
Square F Sig.
Partial Eta
Squared
Noncent. Parameter
Observed Powera
Aro
usal Sphericity Assumed 24.12 2 12.06 23.51 .000 .246 47.01 1.000
Greenhouse-Geisser 24.12 1.692 14.26 23.51 .000 .246 39.77 1.000
Huynh-Feldt 24.12 1.728 13.96 23.51 .000 .246 40.62 1.000
Lower-bound 24.12 1.000 24.12 23.51 .000 .246 23.51 .998
Note: Computed using alpha = .05
In addition, post hoc analyses were conducted and a significant difference in user’s valence was observed across the three websites. Table 7 summarizes the results on valance. In terms of arousal, we found that the website with medium vividness and medium interactivity resulted in significantly lower arousal than the website with high vividness and high interactivity. The difference between users’ arousal on the website with low vividness and interactivity and medium vividness and interactivity was not significant. In the following tables, 1 refers to the website with low vividness and low interactivity, 2 refers to the website with medium vividness and medium interactivity, and 3 refers to the website with high vividness and high interactivity.
Table 7: Post Hoc Analysis for Valence Rates
(I) website (J) website Mean Difference
(I-J) Std. Error Sig.
95% Confidence Interval
Lower Bound Upper Bound
1.00 2.00 -.49* .14 .001 -.77 -.22 3.00 -.81* .14 .000 -1.09 -.53
2.00 1.00 .49* .14 .001 .22 .77 3.00 -.32* .14 .027 -.59 -.04
3.00 1.00 .81* .14 .000 .53 1.09 2.00 .32* .14 .027 .04 .59
Note: The mean difference is significant at the 0.05 level.
Table 8: Post Hoc Analysis for Arousal Rates
(I) website (J) website Mean Difference
(I-J) Std. Error Sig.
95% Confidence Interval
Lower Bound Upper Bound
1.00 2.00 -.33 .17 .053 -.66 .00 3.00 -.81* .17 .000 -1.14 -.48
2.00 1.00 .33 .17 .053 -.00 .66 3.00 -.48* .17 .005 -.81 -.15
3.00 1.00 .81* .17 .000 .48 1.14 2.00 .48* .17 .005 .15 .81
Note: The mean difference is significant at the 0.05 level. Figures 8 and 9 show the trend of valence and arousal levels across the three websites. These graphs demonstrate a positive relationship between web atmospheric cues such as interactivity and vividness and users’ emotional responses (i.e., valence and arousal).

12
Sheng and Joginapelly Effects of Web Atmospheric Cues on Users’ Emotional Responses
AIS Transactions on Human-Computer Interaction Vol. 4, Issue 1, pp.1-24, March 2012
Figure 8: Arousal Values across the Three Treatment Conditions
Figure 9: Valence Values across the Three Treatment Conditions
Regression To study the relationship between valence and arousal and users’ purchase intentions, a regression analysis was conducted. Valence and arousal were the independent variables; the dependent variable was purchase intention. The results (R
2 = .47) indicated that purchase intention was significantly influenced by both valence (t = 12.98, p = .000)
and arousal (t = 2.49, p = 0.014), (as shown in Tables 9 and 10), supporting hypotheses 3 and 4.

13
Sheng and Joginapelly Effects of Web Atmospheric Cues on Users’ Emotional Responses
AIS Transactions on Human-Computer Interaction Vol. 4, Issue 1, pp.1-24, March 2012
Table 9: Regression Analysis Results (ANOVA)
Sum of Squares
Df Mean
Square F Sig.
Regression 296.49 2 148.25 97.15 .000a
Residual 329.61 216 1.53
Total 626.10 218
Notes: Predictors: (Constant), Arousal, Valence. Dependent Variable: purchase intention
Table 10: Regression Analysis Results-(Coefficients)
Unstandardized
Coefficients
Standardized Coefficients T Sig.
B Std. Error Beta
(Constant) -.09 .37 -.24 .814
Valence 1.21 .09 .65 12.98 .000
Arousal .20 .08 .13 2.49 .014
Note: Dependent Variable: purchase intention
Emotional Model Russel’s (1980) circumplex model classifies emotions based on the two dimensions of valence and arousal. In the two-dimensional space, valence is represented on the X axis, and arousal on the Y axis. Thus, emotions can be classified into any of four quadrants. Quadrant 1 indicates high valance and high arousal, meaning that the user feels engaged and interested in the experience. Quadrant 2 indicates high arousal and low valence, meaning that the user feels confused and frustrated with the experience. Quadrant 3 indicates low arousal and low valence, meaning that the user is bored and disappointed with the experience. Finally, quadrant 4 indicates low arousal and high valence, meaning that the user is satisfied and hopeful. Therefore, users’ emotions should fall into quadrant 1 or 4 for a positive experience, and the ideal scenario would be quadrant 1. This model was used to determine users’ emotional states in our study. Figures 10 through 12 plot users’ emotional states for each of the three websites with varying atmospheric cues. Subjective data on valance and arousal from both the online survey and the experiment are included, yielding a total of 73 data points. The values obtained were normalized for plotting purposes. Because the majority of these points overlapped, comparatively fewer points were displayed in the graphs. For the website with low interactivity and low vividness, 26% of the participants experienced engagement and interest while 54.8% of the participants were satisfied. On the other hand, 12.32% of the participants were disappointed and bored while 6.8% were frustrated with the experience (see Figure 10).
Figure 10: Russel’s Model: Low Interactivity and Low Vividness

14
Sheng and Joginapelly Effects of Web Atmospheric Cues on Users’ Emotional Responses
AIS Transactions on Human-Computer Interaction Vol. 4, Issue 1, pp.1-24, March 2012
For the website with medium interactivity and medium vividness, 43.8% of the participants experienced engagement and interest; 50.7% were satisfied. On the other hand, only 5.5% of the participants were disappointed and bored with the experience (see Figure 11).
Figure 11: Russel’s Model: Medium Interactivity and Medium Vividness
For the website with high interactivity and high vividness, 64.38% of the participants experienced engagement and interest, and 28.77% were satisfied. Only 4.1% of the participants were disappointed and bored; 2.7% were frustrated with the experience (see Figure 12).
Figure 12: Russel’s Model: High Interactivity and High Vividness
Table 11 summarizes the results from all three websites. As interactivity and vividness levels increased, participants became more engaged and interested (from 26.0% when both interactivity and vividness were low, to 43.8% when both were medium, to 64.4% when both were high). For the websites that had both vividness and interactivity at high or medium levels, most of the points were concentrated in quadrants 1 and 4, indicating that users were engaged and satisfied. However, for the low vividness and low interactivity website, fewer points were concentrated in quadrants 1 and 4, suggesting that users were less satisfied and engaged with the experience and that some were even bored and disappointed. The medium interactivity and vividness website had the most points in quadrants 1 and 4 combined, perhaps indicating that some users felt overwhelmed by the multimedia and interactivity features offered in the high vividness and high interactivity website. The results from the emotional model offer additional support for hypotheses 1 and 2. That is, they demonstrate that as interactivity and vividness levels increase, users tend to experience more positive emotions as indicated by more positive valence and higher arousal rates.

15
Sheng and Joginapelly Effects of Web Atmospheric Cues on Users’ Emotional Responses
AIS Transactions on Human-Computer Interaction Vol. 4, Issue 1, pp.1-24, March 2012
Table 11: Summary of the Emotional Model Results
Treatment condition Quadrant 1: interested, engaged
Quadrant 4:
satisfied,
hopeful
Quadrant 2:
frustrated,
confused
Quadrant 3:
disappointed, bored
Low Interactivity and Vividness 26.0 % 54.8 % 6.8 % 12.3 % Medium Interactivity and Vividness 43.8 % 50.7 % 0.0 % 5.5 % High Interactivity and Vividness 64.4 % 28.8 % 2.7 % 4.1 %
Physiological Data Physiological data were collected using a biofeedback device with sensors attached to users’ fingers during the experiment and an eye tracker. The biofeedback device provided users’ GSR and HRV. The eye tracker provided pupil diameter values. To mitigate the effects of individual differences, an initial baseline measurement of each user’s GSR and HRV were obtained. For each website, the physiological values measured were then subtracted from the baseline before analysis. Repeated measures ANOVAs were conducted to study how these physiological values varied across the three websites. As vividness and interactivity levels increased, HRV also increased, as shown in figure 13. However, the relationship was not significant (F(2, 38) = .21, p = .811).
Figure 13: HRV Values across the Three Treatment Conditions
The graph for valence displayed in Figure 8 exhibits a similar pattern. As interactivity and vividness increased, more positive (higher) valence rates were observed according to self-reported measures. Their HRV values displayed a similar trend. Higher HRV levels signify that the user is relaxed and is exhibiting slow breathing patterns. They also indicate reduced anxiety and stress and a less dysporic mood (Rowe et al., 1998). Therefore, the HRV data supports that as interactivity and vividness levels increase, a user is more relaxed and comfortable with the website experience. A repeated measures ANOVA was also conducted for GSR and pupil dilation to study their relationships with the web atmospheric cues (interactivity and vividness). No significant difference was observed for GSR values, F(2, 38) = 1.34, p = .273. The graph in Figure 14 shows the levels of GSR obtained across the three websites Figure 14 indicates that GSR values were highest for the low vivid and low interactive website when compared to the medium vivid and medium interactive website and high vivid and high interactive website. The concept of arousal is complicated, and high arousal occurs when a user feels either unpleasant emotions or positive emotions such as interest and engagement. Here, for the low vivid and low interactive website, users were frustrated and disappointed, and thus showed higher arousal rates. Similarly, for high vivid and high interactive website, users were comfortable and interested in the website, resulting in GSR rates higher than those for the medium vivid and medium interactive website.

16
Sheng and Joginapelly Effects of Web Atmospheric Cues on Users’ Emotional Responses
AIS Transactions on Human-Computer Interaction Vol. 4, Issue 1, pp.1-24, March 2012
Figure 14: GSR Values across the Three Treatment Conditions
This pattern, however, contradicts the subjective values obtained for arousal using SAM (Figure 8). One possible explanation for the deviation in trend between subjective and physiological measures in arousal is that physiological devices are sensitive devices that record minute details and changes in users’ responses. These minute changes may not have had a great impact on the overall user experience. Also, physiological arousal varies due to cognitive, physical and emotional components (Ekman et al., 2008). Although the repeated measures ANOVA on pupil dilation showed significant differences across the three treatment conditions (F(2, 38) = 43.58, p < .001), the pattern matched neither arousal values obtained from the subjective method nor GSR values. The graph in Figure 15 shows that pupil dilation was greatest for the website with high interactivity and high vividness followed by that with low interactivity and low vividness. The least pupil dilation was observed for the website with medium interactivity and medium vividness. This observation could reflect the impact of various factors such as environmental illumination and stimuli luminosity.
Figure 15: Pupil Dilation Values across the Three Treatment Conditions

17
Sheng and Joginapelly Effects of Web Atmospheric Cues on Users’ Emotional Responses
AIS Transactions on Human-Computer Interaction Vol. 4, Issue 1, pp.1-24, March 2012
These observations demonstrate that HRV matches self-reported valance and that GSR is a more sensitive physiological measure of arousal than pupil dilation. Physiological measures provide involuntary, rich data but also require careful analysis and interpretation. Hence, their integration and use in conjunction with subjective measures provides more robust data and accurate results.
DISCUSSIONS
Summary of Results The results of this study indicate that web atmospheric cues affect users’ emotions, which in turn influence their decision making and purchase intentions. As levels of interactivity and vividness increased, valence and arousal rates also increased. Regression analysis further examined the effect of emotions on purchase intentions. As arousal and valence rates increased, purchase intentions also increased. Hence, the results show a positive relationship between atmospheric cues (i.e., vividness and interactivity) and users’ emotional responses. Emotional responses were also positively related to purchase intentions. In addition to subjective data, physiological measures were used to analyze the impact of web atmospheric cues on users’ involuntary emotional responses. Emotional responses to atmospheric cues showed similar patterns, whether measured by self-reported valence state or by HRV. HRV increased as interactivity and vividness levels increased. However, GSR and pupil dilation showed no positive relationship with interactivity and vividness levels, nor did these values match the arousal values obtained from subjective measures using SAM.
Interpretation of Physiological Measures HRV, the time interval between heart rate variations, is an important factor in estimating emotions, especially valence (Nolan, 1996). The values obtained indicate that users’ self-reported valence levels exhibited a trend similar to that shown by HRV values. This similarity suggests that HRV is related to valence and is consistent with the subjective measures. GSR, a measure of skin conductivity (Stern et al. 2001), varies with arousal rates. These variations can be a result of either positive or negative emotions. When users are subjected to unpleasant stimuli, they experience frustration or anxiety, resulting in increased arousal rates. Similarly, when subjected to pleasant stimuli, users feel interested and engaged, and their GSR levels increase (Lang 1995). Because both positive and negative experiences result in higher arousal rates, GSR values were higher for both the high interactive/vivid website and the low interactive/vivid website than for the medium interactive/vivid website. The trend revealed by GSR data differs from that shown by the subjective measures because physiological measures, and GSR in particular, are highly sensitive to minute changes in reflexes and reactions (Mandryk, 2005). They gather data at millisecond intervals; therefore, the data are very rich. In some circumstances, however, these minute responses may have little impact on the overall user experience. As users report in the survey, they focus on the larger picture, rather than on minute changes. Therefore, a difference in subjective measures and physiological responses is to be expected. Also, physiological arousal is affected by other processes, such as physical activity and cognitive effort that are not directly related to emotional experience (Ekman et al., 2008). For example, when a user performs a simple muscular physical activity such as holding his breath, performs simple cognitive actions such as reversing words, or induces mild pain through thoughts or actions, physiological measures change. These changes, however, are not the result of the stimuli presented. Pupil dilation measures pupil size, which varies with emotional stimulation (Partala and Surakka 2003). Similar to GSR, changes in pupil dilation reflect arousal that could be either positive or negative. For low interactive/vivid and high interactive/vivid websites, users experienced emotional stimulation in the form of negative and positive experiences respectively. Thus, pupil dilation was higher in response to these websites than in response to the medium interactive/vivid website. However, pupil dilation was higher for the high interactive/vivid website than for the low interactive/vivid website. These results were not anticipated. Previous studies suggest that pupil size tends to vary more in response to unpleasant experience than to pleasant ones (Janisse, 1974). This greater variation with the high vividness and high interactivity website may be attributable to the fact that pupil size is dependent on multiple factors such as environmental illumination and stimuli luminosity, color, and contrast (Beatty and Lucero-Wagoner, 2000). Most prior studies (e.g., Bradley et al., 2008; Franzen et al., 2009), therefore, presented the stimuli in grayscale or converted them to equi-luminant black and white images. However, in this study no such manipulations were made on the stimuli. Thus, physiological measures should always be used in conjunction with subjective methods rather than independently. They provide accurate and involuntary data, but they must be interpreted with extreme caution.

18
Sheng and Joginapelly Effects of Web Atmospheric Cues on Users’ Emotional Responses
AIS Transactions on Human-Computer Interaction Vol. 4, Issue 1, pp.1-24, March 2012
Implications One of the most important goals of retailing is to attract customers by creating a strong retailer image. Brand image is a combination of various features and characteristics. Web atmospheric cues such as vividness and interactivity are the main factors that define a brand image (Coyle and Thorson, 2001). These cues stimulate consumers’ emotional responses and influence consumer behaviors (Coyle and Thorson, 2001). The results of this study have further confirmed the importance of web atmospheric cues for consumers’ emotional responses and purchase outcomes. They showed an increase in valence, arousal, and purchase intention as interactivity and vividness increased. Thus, the results of this study support the conclusion that better design and higher levels of web atmospheric cues (such as interactivity and vividness) have a positive influence on consumers’ emotional states and on the decision making process. This information can help designers, marketers, and consumer researchers to design and market their products more effectively by considering the effect of web atmospheric cues on consumers’ response and affective states. The S-O-R framework proposes that users’ cognitive and affective states influence their decision making, and that certain stimuli (such as web atmospheric cues) influence users’ emotions. This study considered the interactivity and vividness of the e-commerce website and found that these stimuli impacted the users’ affective states, which in turn influenced their responses and shopping outcomes. Hence, it provides empirical evidence supporting the S-O-R framework proposed by Mehrabain and Russell (1974). This study also applied Russell’s circumplex model (1980) to categorize users’ emotional responses to the three websites. As levels of interactivity and vividness increased, users felt more engaged, satisfied, and interested. Websites that offered less vividness and interactivity, on the other hand, provided disappointing experiences; users felt bored and somewhat frustrated with these websites. Therefore, valence and arousal values obtained from the users can be represented using Russell’s circumplex model (1980) to obtain greater insight into users’ emotional states and to better understand their overall affective experience. In addition to subjective self-report data, the physiological measures employed in this study provided additional data for analysis. HRV showed a positive relationship with valence. It also increased as levels of interactivity and vividness increased. However, GSR and pupil dilation did not positively correlate with arousal rates or interactivity and vividness levels. This may be attributable to various factors; physiological measurement is very sensitive and responds to a number of factors besides emotions. However, they provide abundant information that may offer further insights into users’ emotional states. From a methodological perspective, this study used a triangulation approach to analyze the subjective and physiological measures. The objective was to identify new usability evaluation tools based on users’ physiological data and to integrate those tools with traditional evaluation techniques to obtain fast, reliable, and highly contextual data for accurate analysis.
Limitations and Future Research The majority of participants in this study were students from a Midwestern University in the U.S. Because most e-commerce shoppers are relatively young and educated, this sample was representative of the largest group of e-commerce shoppers. However, future research can include participants with more diverse backgrounds. Specifically, the emotional responses of participants in various age groups could be compared. The three treatment conditions selected were representative of different web atmospheric cues with various interactivity and vividness levels. The three websites were selected based on pretest responses gathered from the HCI experts. However, for future research, more rigorous manipulations could be performed by designing the treatment conditions rather than using existing e-commerce websites. This study collected physiological data by measuring users’ GSR, pupil dilation, and HRV, and related these data to users’ self-reported data. Besides these measures, other physiological measures such as EMFi, EMG, heart rate, temperature, and respiration rate could be considered to assess users’ emotional states and responses.
CONCLUSION
This research used three different e-commerce websites with varying levels of interactivity and vividness to study users’ emotional responses. The results supported the hypotheses and suggested that levels of interactivity and vividness positively influence users’ emotional states (i.e., valence and arousal). Further, higher arousal and valence rates were found to produce more positive shopping outcomes. In addition to the subjective evaluation tools, physiological measures were introduced as additional analysis tools to assess emotions. These measures provided
19
Sheng and Joginapelly Effects of Web Atmospheric Cues on Users’ Emotional Responses
AIS Transactions on Human-Computer Interaction Vol. 4, Issue 1, pp.1-24, March 2012
partial support for the subjective data obtained, but they may have been influenced by a number of factors and processes other than emotional response.
REFERENCES
Anttonen, J. and V. Surakka (2005) “Emotions and Heart Rate While Sitting on A Chair,” in Proceedings of the SIGCHI conference on Human factors in computing systems, New York: ACM Press, pp. 491-499. Portland, OR, April 2-7, 2005.
Baker, J. , M. Levy, and D. Grewal (1992) “An Experimental Approach to Making Retail Store Environmental Decisions,” Journal of Retailing (68) 4, pp. 445-460.
Barsky, J. and L. Nash, (2002) “Evoking Emotion Affective Keys to Hotel Loyalty,” Cornell Hotel and Restaurant Administration Quarterly (43) 1, pp.39-46.
Beatty, J. and B. Lucero-Wagoner (2000) “The Pupillary System,” in J. T. Cacioppo, L. G. Tassinary, G.G. Berntson (Eds.) Handbook of Psychophysiology, 2nd edition. Cambridge University Press, New York, pp. 142–162.
Bellizzi, J., A. Crowley, and R. Hasty (1983)“The Effects of Color in Store Design,” Journal of Retailing (59) 1, pp. 21-
45.
Bradley, M. M., L. Miccoli, M. Escrig, and P. J. Lang (2008) “The Pupil as a Measure of Emotional Arousal and Autonomic Activation,” Psychophysiology (45) 4, pp. 602-607.
Bradley, M. M. and P. J. Lang (1994) “Measuring Emotion: The Self-Assessment Manikin and the Semantic Differential,” Journal of Behavior Therapy and Experimental Psychiatry (25) 1, pp. 49-59.
Bradley, M. M. and P. J. Lang (2000) “Affective Reactions to Acoustic Stimuli,” Psychophysiology (37) 2, pp. 204-215.
Brosschot, J. F. and J. F. Thayer (2003) “Heart Rate Response is Longer After Negative Emotions than Positive Emotions,” International Journal of Psychophysiology (50) 3, pp. 181-187.
Chanel, G., C. Rebetez, M. Betrancourt, and T. Pun (2008) “Boredom, Engagement and Anxiety as Indicators for Adaptation to Difficulty in Games,” in Proceedings of the 12th international conference on Entertainment and Media in The Ubiquitous Era, New York: ACM Press, pp. 13-17. Tampere, Finland, October 7-9, 2008.
Coyle, J. and E. Thorson (2001) “The Effects of Progressive Levels of Interactivity and Vividness in Web Marketing Sites,” Journal of Advertising (30) 3, pp. 65-77.
Damasio, A. (1994) Descartes' Error: Emotion, Reason, and The Human Brain. New York: Grosset/Putnam.
Donovan, R. J. and J. R. Rossiter (1982) “Store Atmosphere: An Environmental Psychology Approach,” Journal of Retailing (58) 1, pp. 34-57.
Donthu, N. and A. Garcia (1999) “The Internet Shopper,” Journal of Advertising Research (39) 3, pp. 52-58.
Dormann, C. (2001) “People and Computers XV: Seducing Consumers, Evaluating Emotions," in Joint Proceedings of IHM-HCI (2), pp.10-14. Lille, France, September 10-14, 2001,
Ekman, I., A. Poikola, M. Makarainen, T. Takala, and P. Hamalainen (2008) "Voluntary Pupil Size Change as Control in Eyes Only Interaction," in Proceedings of the 2008 Symposium on Eye Tracking Research & Applications, New York: ACM Press, pp. 115-118. Savannah, Georgia, March 26-28, 2008.
Ekman, P. (1992) “An Argument for Basic Emotions,” Cognition and Emotions (6) 3, pp. 169-200.
Ekman, P. (1999) “Basic Emotions,” in T. Dalgleish and M. Power (Eds.) Handbook of Cognition and Emotion. West Sussex, John Wiley and Sons Ltd, pp. 45-60.
Eroglu, S., K. Machleit, and L. Davis (2001) “Atmospheric Qualities of Online Retailing: A Conceptual Model and Implications,” Journal of Business Research (54) 2, pp.177-184.
Eroglu, S., K. Machleit, and L. Davis (2003) “Empirical Testing of a Model of Online Store Atmospherics and Shopper Responses,” Psychology and Marketing (20) 2, pp. 139-150.
Fortin, D. and R. R. Dholakia (2005) “Interactivity and Vividness Effects on Social Presence and Involvement With A Web-Based Advertisement,” Journal of Business Research (58) 3, pp. 387-396.
Franzen, P., D. Buysse, R. Dahl, W. Thompson, and G. Siegle (2009) “Sleep Deprivation Alters Pupillary Reactivity to Emotional Stimuli in Healthy Young Adults,” Biological Psychology (80) 3, pp. 300-305.
Golden, L. G. and D. A. Zimmerman (1986) Effective Retailing. Boston: Houghton Mifflin.
Hochheiser, H. and B. Shneiderman (2000) “Performance Benefits of Simultaneous Over Sequential Menus as Task Complexity Increases,” International Journal of Human Computer Interaction (12) 2, pp. 173-192.
Hoffman, D. and T. Novak (1996) “Marketing in Hypermedia Computer-Mediated Environments: Conceptual Foundations,” Journal of Marketing (60) 3, pp. 50-68.
Hooper, K. (1986) "Architectural Design: An Analogy," in D.A. Norman and S. W. Draper (Eds.) User Centered System Design: New perspectives on human-computer interaction. Hillsdale, NJ: Lawrence Erlbaum
Associates, pp. 9-23.

20
Sheng and Joginapelly Effects of Web Atmospheric Cues on Users’ Emotional Responses
AIS Transactions on Human-Computer Interaction Vol. 4, Issue 1, pp.1-24, March 2012
Hudlicka, E. (2003) “To Feel or Not to Feel: The Role of Affect in Human Computer Interaction,” International Journal of Human Computer Studies (59) 1-2, pp. 1-32.
Hyona, J., J. Tommola, and A. Alaja (1995) “Pupil Dilation as a Measure of Processing Load in Simultaneous Interpretation and Other Language Tasks,” The Quarterly Journal of Experimental Psychology Section A
(48) 3, pp. 598-612.
Janisse, M.P. (1974) “Pupil Size, Affect And Exposure Frequency,” Social Behavior and Personality (2) 2, pp. 125–
146.
Jones, M., M. Spence, and C. Vallaster (2008) “Creating Emotions via B2C Websites,” Business Horizons (51) 5, pp.
419-428.
Kahneman, D. and J. Beatty(1966) “Pupil Diameter and Load on Memory,” Science (154) 3756, pp. 1583-1585.
Kim, J.-H., M. Kim, and S. J. Lennon (2009) “Effects of Web Site Atmospherics on Consumer Responses: Music and Product Presentation,” Direct Marketing: An international Journal (3) 1, pp. 4-19.
Kotler, P. (1973) “Atmospherics as a Marketing Tool,” Journal of Retailing (49) 4, pp. 48-64.
Lai, M., W.-Y. Wu, and S. M. Lin (2009) “The Effects of Website Design on Female’s Emotional Arousal and e-Satisfaction” The Business Review (12) 1, pp. 243-249.
Lang, P. (1995) “The Emotion Probe: Studies of Motivation and Attention,” The American Psychologist (50) 5, pp.
372-385.
Lang, P. J. (1980) “Behavioral Treatment and Biobehavioral Assessment: Computer Applications,” Technology In Mental Health Care Delivery Systems, pp. 119-137.
LeDoux, J. (1992) “Emotion and the Amygdala,” in: J. P. Aggleton (Ed.) The Amygdala: Neurobiological Aspects of Emotion, Memory, and Mental Dysfunction. New York: Wiley-Liss,Inc, pp. 339-351.
Lin, T. and W. Hu (2005) “Do Physiological Data Relate to Traditional Usability Indexes,” in Proceedings of the 17th Australia conference on Computer-Human Interaction: Citizens Online: Considerations for Today and the Future(122), Australia: Computer-Human Interaction Special Interest Group (CHISIG) of Australia Narrabundah, pp. 1-10. Canberra, Australia, November 23 - 25, 2005.
Mandryk, R. L. (2005) Modeling User Emotion in Interactive Play Environments: A Fuzzy Physiological Approach.
Ph.D.Thesis, Simon Fraser University.
Mandryk, R., K. Inkpen, and T. Calvert (2006) “Using Psychophysiological Techniques to Measure User Experience with Entertainment Technologies,” Behaviour and Information Technology (25) 2, pp. 141-158.
Martin, D., M. O'Neill, S. Hubbard, and A. Palmer (2008) “The Role of Emotion in Explaining Consumer Satisfaction and Future Behavioural Intention,” Journal of Services Marketing (22) 3, pp. 224-236.
McMillan, S. J. and J. Hwang (2002) "Measures of Perceived Interactivity: An Exploration of Communication, User Control, and Time in Shaping Perceptions of Interactivity," Journal of Advertising (31) 3, pp. 41-54.
Mehrabian, A. J. A. Russell (1974) An Approach to Environmental Psychology. Cambridge, MA: MIT Press.
Newhagen, J. E. and S. Rafaeli (1996) “Why Communication Researchers should Study the Internet.” Journal of Communication (46) 1, pp. 4-13.
Nolan, R. (1996) “Heart Rate Variability(HRV),” European Heart Journal (17), pp. 354-381.
Norman, D. (2004) Emotional Design: Why We Love (or Hate) Everyday Things. New York: Basic Books.
Nunnally, J. (1978) Psychometric Theory. New York: McGraw-Hill.
Oliver, R. (1996) Satisfaction: A Behavioral Perspective on the Consumer. New York: McGraw-Hill.
Ortony, A., G. L. Clore,and A. Collins (1990) The Cognitive Structure of Emotions. New York: Press Syndicate of the
University of Cambridge.
Partala, T. and V. Surakka (2003) “Pupil Size Variation as an Indication of Affective Processing,” International Journal of Human-Computer Studies (59) 1-2, pp. 185-198.
Partala, T., M. Jokiniemi, and V. Surakka (2000) “Pupillary responses to emotionally provocative stimuli,” in Proceedings of the 2000 symposium on Eye tracking research and applications, New York: ACM Press, pp. 123-129. Palm Beach Gardens, FL, USA, November 6-8, 2000.
Picard, R. (1995) Affective Computing. MIT Media Laboratory: 321.
Picard, R. and S. Andrew 1998) “Panel on Affect and Emotion in The User Interface,” in Proceedings of the 1998 International Conference on Intelligent User Interfaces, New York: ACM Press, pp. 91–94. San Francisco, CA, January 6-9, 1998.
Rowe, D. R., J. Sibert, and D. Irwin(1998) “Heart Rate Variability: Indicators of User State as an Aid to Human Computer Interaction,” in Proceedings of the SIGCHI conference on Human factors in computing systems, New York: ACM Press/Addison-Wesley Publishing Co., pp. 480-487. Las Angeles, CA, April 18-23, 1998. .
Russell, J. (1980) “A Circumplex Model of Affect,” Journal of Personality and Social Psychology (39) 6, pp. 1161-
1178.
Russell, J., A. Weiss, and G. Mendelsohn (1989) “Affect Grid: A Single-Item Scale of Pleasure and Arousal,” Journal of Personality and Social Psychology (57) 3, pp. 493-502.

21
Sheng and Joginapelly Effects of Web Atmospheric Cues on Users’ Emotional Responses
AIS Transactions on Human-Computer Interaction Vol. 4, Issue 1, pp.1-24, March 2012
Spangenberg, E. R., A. E. Crowley, and P. W. Henderson (1996) “Improving the Store Environment: Do Olfactory Cues Affect Evaluations and Behaviors?,” Journal of Marketing (60) 2, pp. 67-81.
Stern, R. M., W. J. Ray, and K. S. Quigley (2001) Psychophysiological Recording. New York: Oxford University
Press.
Steuer, J. (1992) “Defining Virtual Reality: Dimensions Determining Telepresence,” Journal of Communication (42) 4,
pp. 73-93.
Tractinsky, N. and S. Rao (2001) “Incorporating Social Dimensions in Web-Store Design,” Human Systems Management (20) 2, pp. 105-121.
Tractinsky, N., A. Katz, and D. Ikar (2000) “What is Beautiful is Usable,” Interacting with Computers (13) 2, pp. 127-
145.
Tractinsky, N. and V. S. Rao (2001) "Social Dimensions of Internet Shopping: Theory-Based Arguments for Web-Store Design," Human Systems Management (20), pp. 195-121.
Vilnai-Yavetz, I. and A. Rafaeli (2006) “Aesthetics and Professionalism of Virtual Servicescapes,” Journal of Service Research (8) 3, pp. 245-259.
Vrechopoulos, A., and G. Siomkos (2002) "Virtual Store Atmosphere in Non-Store Retailing,” Journal of Internet
Marketing (3) 1.
Ward, R. and P. Marsden (2003) “Physiological responses to different WEB page designs,” International Journal of Human-Computer Studies (59) 1-2, pp. 199-212.
Zajonc, R. (1980) “Feeling and Thinking: Preferences need no Inferences,” American Psychologist (35) 2, pp. 151-
175.
Zhou, T., Y. Lu, and B. Wang (2009) “The Relative Importance of Website Design Quality and Service Quality in Determining Consumers’ Online Repurchase Behavior,” Information Systems Management (26) 4, pp. 327-337.
22
Sheng and Joginapelly Effects of Web Atmospheric Cues on Users’ Emotional Responses
AIS Transactions on Human-Computer Interaction Vol. 4, Issue 1, pp.1-24, March 2012
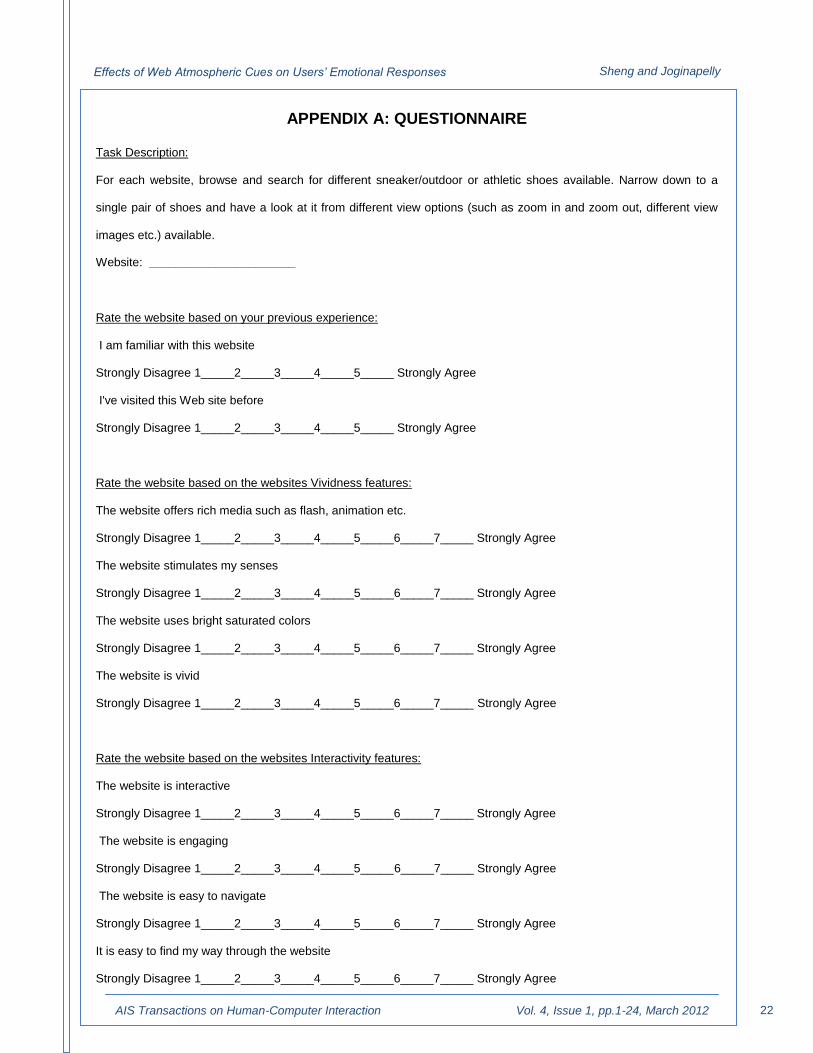
APPENDIX A: QUESTIONNAIRE
Task Description:
For each website, browse and search for different sneaker/outdoor or athletic shoes available. Narrow down to a
single pair of shoes and have a look at it from different view options (such as zoom in and zoom out, different view
images etc.) available.
Website: ______________________
Rate the website based on your previous experience:
I am familiar with this website
Strongly Disagree 1_____2_____3_____4_____5_____ Strongly Agree
I've visited this Web site before
Strongly Disagree 1_____2_____3_____4_____5_____ Strongly Agree
Rate the website based on the websites Vividness features:
The website offers rich media such as flash, animation etc.
Strongly Disagree 1_____2_____3_____4_____5_____6_____7_____ Strongly Agree
The website stimulates my senses
Strongly Disagree 1_____2_____3_____4_____5_____6_____7_____ Strongly Agree
The website uses bright saturated colors
Strongly Disagree 1_____2_____3_____4_____5_____6_____7_____ Strongly Agree
The website is vivid
Strongly Disagree 1_____2_____3_____4_____5_____6_____7_____ Strongly Agree
Rate the website based on the websites Interactivity features:
The website is interactive
Strongly Disagree 1_____2_____3_____4_____5_____6_____7_____ Strongly Agree
The website is engaging
Strongly Disagree 1_____2_____3_____4_____5_____6_____7_____ Strongly Agree
The website is easy to navigate
Strongly Disagree 1_____2_____3_____4_____5_____6_____7_____ Strongly Agree
It is easy to find my way through the website
Strongly Disagree 1_____2_____3_____4_____5_____6_____7_____ Strongly Agree

23
Sheng and Joginapelly Effects of Web Atmospheric Cues on Users’ Emotional Responses
AIS Transactions on Human-Computer Interaction Vol. 4, Issue 1, pp.1-24, March 2012
The website provides immediate feedback
Strongly Disagree 1_____2_____3_____4_____5_____6_____7_____ Strongly Agree
This website provides information I am looking for quickly
Strongly Disagree 1_____2_____3_____4_____5_____6_____7_____ Strongly Agree
Based on the scale of Unhappy to Happy, please select and circle the picture which matches most closely to your
current feeling:
Based on the scale of Calm to Excited, please select and circle the picture which matches most closely to your
current feeling:
Rate the website based on your experience:
The likelihood that I would shop on this website is high
Strongly Disagree 1_____2_____3_____4_____5_____6_____7_____ Strongly Agree
I would be willing to buy a product on this website
Strongly Disagree 1_____2_____3_____4_____5_____6_____7_____ Strongly Agree
I would like to recommend this website to my friend
Strongly Disagree 1_____2_____3_____4_____5_____6_____7_____ Strongly Agree

24
Sheng and Joginapelly Effects of Web Atmospheric Cues on Users’ Emotional Responses
AIS Transactions on Human-Computer Interaction Vol. 4, Issue 1, pp.1-24, March 2012
ABOUT THE AUTHORS
Dr. Hong Sheng is an Assistant Professor in Information Science and Technology at the
Department of Business and Information Technology in Missouri University of Science and Technology (formerly University of Missouri - Rolla). She is also co-directing the Laboratory for Information Technology Evaluation (LITE) at Missouri S&T. Dr. Sheng’s research interests include mobile commerce and ubiquitous commerce, use of IT to support teaching and learning, and Human-Computer Interaction. Dr. Sheng has published her research in journals such as Journal of Association for Information Systems, Information Systems Journal, Journal of Strategic Information Systems, Communications of the ACM, The DATA BASE for Advances in Information Systems, and Journal of Database Management.
Tanvi Joginapelly received a Master Degree in Information Science and Technology with
specialization in Human Computer Interaction from Missouri University of Science and Technology (MS&T), and her bachelor degree from Jawaharlal Nehru Technological University (JNTU), India. In 2008, she was awarded the best outgoing student of electronics and telematics out of all affiliated colleges under JNTU. Her Masters dissertation focused on examining emotions in field of usability using a multi model approach. From 2009 - 2010 she worked as a research assistant at the Laboratory for Information Technology Evaluation at MS&T. Her research interests include affective computing, eye tracking, human computer interaction and usability in information systems.
Copyright © 2012 by the Association for Information Systems. Permission to make digital or hard copies of all or part of this work for personal or classroom use is granted without fee provided that copies are not made or distributed for profit or commercial advantage and that copies bear this notice and full citation on the first page. Copyright for components of this work owned by others than the Association for Information Systems must be honored. Abstracting with credit is permitted. To copy otherwise, to republish, to post on servers, or to redistribute to lists requires prior specific permission and/or fee. Request permission to publish from: AIS Administrative Office, P.O. Box 2712 Atlanta, GA, 30301-2712 Attn: Reprints or via e-mail from [email protected].

Transactions on
Human-Computer Interaction
ISSN: 1944-3900
Editors-in-Chief http://thci.aisnet.org/
Dennis Galletta, U. of Pittsburgh, USA Ping Zhang, Syracuse U., USA
Advisory Board
Izak Benbasat U. of British Columbia, Canada
John M. Carroll Penn State U., USA
Phillip Ein-Dor Tel-Aviv U., Israel
Paul Gray Claremont Graduate U., USA
Jenny Preece U. of Maryland, USA
GavrielSalvendy, Purdue U., USA, & Tsinghua U., China
Ben Shneiderman U. of Maryland, USA
Jane Webster Queen's U., Canada
K.K. Wei City U. of Hong Kong, China
Senior Editor Board
Fred Davis U. of Arkansas, USA
Traci Hess U. of Massachusetts Amherst, USA
Shuk Ying (Susanna) Ho Australian National U., Australia
Mohamed Khalifa U. Wollongong in Dubai., UAE
Jinwoo Kim Yonsei U., Korea
Anne Massey Indiana U., USA
Fiona Fui-Hoon Nah U. of Nebraska-Lincoln, USA
Lorne Olfman Claremont Graduate U., USA
Kar Yan Tam Hong Kong U. of Science & Technology, China
Dov Te'eni Tel-Aviv U., Israel
Noam Tractinsky Ben-Gurion U. of the Negev, Israel
Viswanath Venkatesh U. of Arkansas, USA
Mun Yi Korea Advanced Ins. of Sci. & Tech, Korea
Editorial Board
Miguel Aguirre-Urreta DePaul U., USA
Michel Avital Copenhagen Business School, Denmark
Hock Chuan Chan National U. of Singapore, Singapore
Christy M.K. Cheung Hong Kong Baptist University, China
Michael Davern U. of Melbourne, Australia
Carina de Villiers U. of Pretoria, South Africa
Alexandra Durcikova U. of Arizona, USA
Xiaowen Fang DePaul University
Matt Germonprez U. of Wisconsin Eau Claire, USA
Jennifer Gerow Virginia Military Institute, USA
Suparna Goswami Technische U.München, Germany
Khaled Hassanein McMaster U., Canada
Milena Head McMaster U., Canada
Weiyin Hong U. of Nevada, USA
Netta Iivari Oulu U., Finland
Zhenhui Jack Jiang National U. of Singapore, Singapore
Richard Johnson SUNY at Albany, USA
Weiling Ke Clarkson U., USA
Sherrie Komiak Memorial U. of Newfoundland, Canada
Na Li Baker College, USA
Paul Benjamin Lowry Brigham Young U., USA
Ji-Ye Mao Renmin U., China
Scott McCoy College of William and Mary, USA
Greg D. Moody U. of Nevada, Las Vegas, USA
Robert F. Otondo Mississippi State U., USA
Lingyun Qiu Peking U., China
Sheizaf Rafaeli U. of Haifa, Israel
Rene Riedl Johannes Kepler U. Linz, Austria
Khawaja Saeed Wichita State U., USA
Shu Schiller Wright State U., USA
Hong Sheng Missouri U. of Science and Technology, USA
Stefan Smolnik European Business School, Germany
Jeff Stanton Syracuse U., USA
Heshan Sun U. of Arizona, USA
Jason Thatcher Clemson U., USA
Horst Treiblmaier Vienna U. of Business Admin.& Economics, Austria
Ozgur Turetken Ryerson U., Canada
Fahri Yetim U. of Siegen, Gemany
Cheng Zhang Fudan U., China
Meiyun Zuo Renmin U., China
Managing Editors
Jian Tang, Syracuse U., USA
SIGHCI Chairs http://sigs.aisnet.org/sighci
2001-2004: Ping Zhang 2004-2005: Fiona Fui-Hoon Nah 2005-2006: Scott McCoy 2006-2007: Traci Hess
2007-2008: Weiyin Hong 2008-2009: Eleanor Loiacono 2009-2010: Khawaja Saeed 2010-2011: Dezhi Wu
2011-2012: Dianne Cyr 2012-2013: Soussan Djamasbi