effects of workload variation on the energy distribution in a mobile platform
TRANSCRIPT

Microprocessors and Microsystems 37 (2013) 1192–1199
Contents lists available at ScienceDirect
Microprocessors and Microsystems
journal homepage: www.elsevier .com/locate /micpro
Effects of workload variation on the energy distribution in a mobileplatform
0141-9331/$ - see front matter � 2013 Elsevier B.V. All rights reserved.http://dx.doi.org/10.1016/j.micpro.2013.08.003
⇑ Corresponding author.E-mail addresses: [email protected] (F. Hamady), [email protected] (A. Kayssi),
[email protected] (A. Chehab), [email protected] (N. Gupte).
Faisal Hamady a, Ayman Kayssi a,⇑, Ali Chehab a, Nitin Gupte b
a Electrical and Computer Engineering Department, American University of Beirut, Beirut 1107 2020, Lebanonb PC Client Group, Intel, OR, USA
a r t i c l e i n f o
Article history:Available online 31 August 2013
Keywords:Power breakdownEnergy consumptionMobile platformWorkload analysisSandy Bridge
a b s t r a c t
Continuous advancements in integrated circuit design and the constant development of a diverse set ofcomputing applications, paved the way for versatile mobile devices that we use on daily basis. The depen-dency of these devices on battery as the main power source imposed strict constraints on the energy con-sumption of applications that run on these mobile devices. In this paper, we present a component-wiseenergy consumption breakdown of a modern platform under a variety of workloads and benchmarks.This study provides useful insights into the energy consumption profile of various hardware components,and the manner in which the operating system uses them. It is a crucial step in pointing future researchtowards the power-hungry components and providing a better understanding of the system’s behavior,featuring a baseline to analyze the tradeoffs that system designers can use to optimize the upcomingplatforms given the physical considerations and the practical constraints. Our results demonstrate a sub-stantial variation in the energy contribution of various components as well as the total system energydepending on the nature of the workload.
� 2013 Elsevier B.V. All rights reserved.
1. Introduction
The continuous advancements in integrated circuit design andthe abundant development of computing applications, paved theway for versatile mobile devices that we use on daily basis. Theseare high-tech products that we rely on in our work, social activitiesas well entertainment. The design challenges associated with thepersistent need for devices with smaller size, lighter weight, lowercost, lower power consumption, and quick responsiveness createnew opportunities to develop and market more powerful, yet scal-able and energy efficient solutions [1].
Nevertheless, the remarkable success of mobile computing de-vices (laptops, tablets, smartphones, etc.) that demand high speedcomputations and complex functionalities with low power con-sumption to support longer operating periods, forced the low energyaspect to become an essential design factor [2]. The significantincentives in ensuring green and low power computing led to anaggressive implementation of power saving and management tech-niques that have been favorably engaged throughout the designphases. This further imposes decision and design barriers for theindustry on the selection of components at various levels rangingfrom controllers, processors and memory modules to applications,
compilers and operating systems [3], that meet the new expecta-tions whereby offering ‘‘good enough performance’’ translates intoexceptional user experience.
Consequently, a component-wise power consumption break-down of modern platforms is a crucial step in pointing future re-search towards the power-hungry components and providing abetter understanding of the system’s behavior. The breakdown fea-tures a baseline to analyze diverse tradeoffs that the systemdesigners can use to optimize the upcoming systems given thephysical considerations and the practical constraints.
In this paper, we thoroughly study the energy consumed byindividual modules of a modern laptop under a variety of work-loads. These workloads reflect typical usage cases of today’s users,such as browsing and video streaming, as well as next generationworkloads, such as gesture recognition, rather than being limitedonly to synthetic benchmarks. Accordingly, the results shown inthis study are extremely useful in analyzing component-wisepower management techniques as well as software applicationsand their behavior from the platform’s perspective.
This is also the first work to show a detailed breakdown of thelatest processors featuring this level of integration on an Intel die.Previous studies have been conducted on processors where thegraphics engine and the computing cores are on the same chip,but not integrated onto one die. Note that the architecturalchanges that were introduced in mobile platforms during the pastfew years, especially in the central processing unit (CPU), impacted
F. Hamady et al. / Microprocessors and Microsystems 37 (2013) 1192–1199 1193
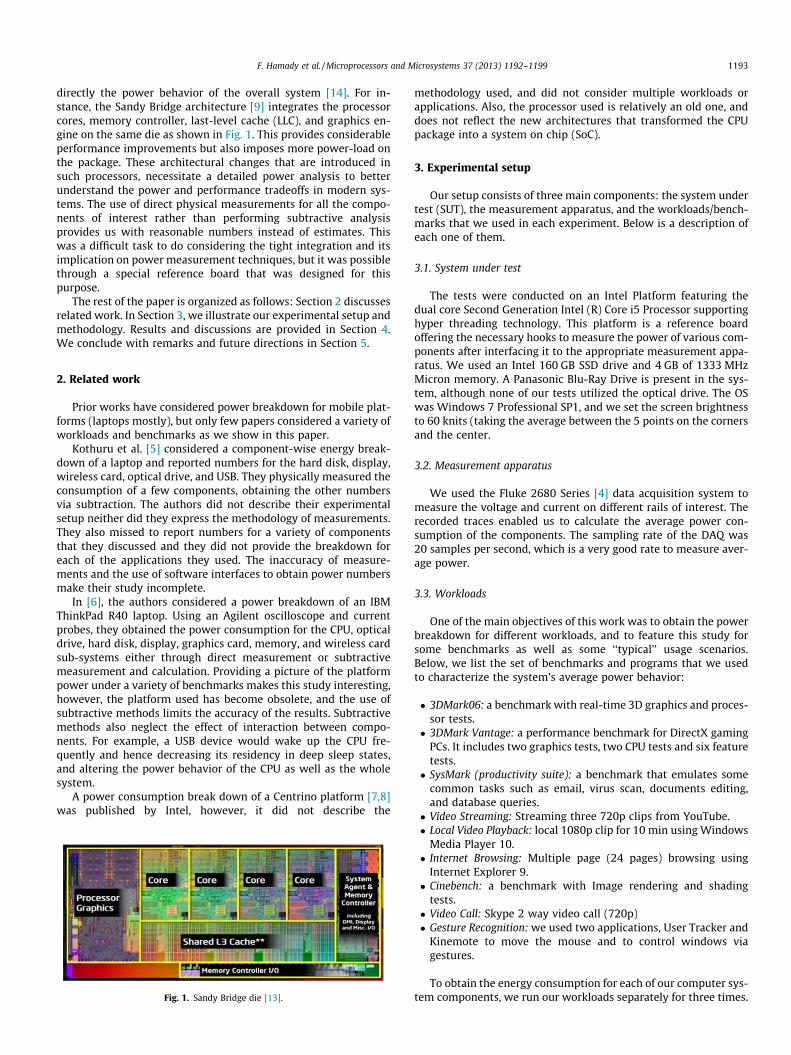
directly the power behavior of the overall system [14]. For in-stance, the Sandy Bridge architecture [9] integrates the processorcores, memory controller, last-level cache (LLC), and graphics en-gine on the same die as shown in Fig. 1. This provides considerableperformance improvements but also imposes more power-load onthe package. These architectural changes that are introduced insuch processors, necessitate a detailed power analysis to betterunderstand the power and performance tradeoffs in modern sys-tems. The use of direct physical measurements for all the compo-nents of interest rather than performing subtractive analysisprovides us with reasonable numbers instead of estimates. Thiswas a difficult task to do considering the tight integration and itsimplication on power measurement techniques, but it was possiblethrough a special reference board that was designed for thispurpose.
The rest of the paper is organized as follows: Section 2 discussesrelated work. In Section 3, we illustrate our experimental setup andmethodology. Results and discussions are provided in Section 4.We conclude with remarks and future directions in Section 5.
2. Related work
Prior works have considered power breakdown for mobile plat-forms (laptops mostly), but only few papers considered a variety ofworkloads and benchmarks as we show in this paper.
Kothuru et al. [5] considered a component-wise energy break-down of a laptop and reported numbers for the hard disk, display,wireless card, optical drive, and USB. They physically measured theconsumption of a few components, obtaining the other numbersvia subtraction. The authors did not describe their experimentalsetup neither did they express the methodology of measurements.They also missed to report numbers for a variety of componentsthat they discussed and they did not provide the breakdown foreach of the applications they used. The inaccuracy of measure-ments and the use of software interfaces to obtain power numbersmake their study incomplete.
In [6], the authors considered a power breakdown of an IBMThinkPad R40 laptop. Using an Agilent oscilloscope and currentprobes, they obtained the power consumption for the CPU, opticaldrive, hard disk, display, graphics card, memory, and wireless cardsub-systems either through direct measurement or subtractivemeasurement and calculation. Providing a picture of the platformpower under a variety of benchmarks makes this study interesting,however, the platform used has become obsolete, and the use ofsubtractive methods limits the accuracy of the results. Subtractivemethods also neglect the effect of interaction between compo-nents. For example, a USB device would wake up the CPU fre-quently and hence decreasing its residency in deep sleep states,and altering the power behavior of the CPU as well as the wholesystem.
A power consumption break down of a Centrino platform [7,8]was published by Intel, however, it did not describe the
Fig. 1. Sandy Bridge die [13].
methodology used, and did not consider multiple workloads orapplications. Also, the processor used is relatively an old one, anddoes not reflect the new architectures that transformed the CPUpackage into a system on chip (SoC).
3. Experimental setup
Our setup consists of three main components: the system undertest (SUT), the measurement apparatus, and the workloads/bench-marks that we used in each experiment. Below is a description ofeach one of them.
3.1. System under test
The tests were conducted on an Intel Platform featuring thedual core Second Generation Intel (R) Core i5 Processor supportinghyper threading technology. This platform is a reference boardoffering the necessary hooks to measure the power of various com-ponents after interfacing it to the appropriate measurement appa-ratus. We used an Intel 160 GB SSD drive and 4 GB of 1333 MHzMicron memory. A Panasonic Blu-Ray Drive is present in the sys-tem, although none of our tests utilized the optical drive. The OSwas Windows 7 Professional SP1, and we set the screen brightnessto 60 knits (taking the average between the 5 points on the cornersand the center.
3.2. Measurement apparatus
We used the Fluke 2680 Series [4] data acquisition system tomeasure the voltage and current on different rails of interest. Therecorded traces enabled us to calculate the average power con-sumption of the components. The sampling rate of the DAQ was20 samples per second, which is a very good rate to measure aver-age power.
3.3. Workloads
One of the main objectives of this work was to obtain the powerbreakdown for different workloads, and to feature this study forsome benchmarks as well as some ‘‘typical’’ usage scenarios.Below, we list the set of benchmarks and programs that we usedto characterize the system’s average power behavior:
� 3DMark06: a benchmark with real-time 3D graphics and proces-sor tests.� 3DMark Vantage: a performance benchmark for DirectX gaming
PCs. It includes two graphics tests, two CPU tests and six featuretests.� SysMark (productivity suite): a benchmark that emulates some
common tasks such as email, virus scan, documents editing,and database queries.� Video Streaming: Streaming three 720p clips from YouTube.� Local Video Playback: local 1080p clip for 10 min using Windows
Media Player 10.� Internet Browsing: Multiple page (24 pages) browsing using
Internet Explorer 9.� Cinebench: a benchmark with Image rendering and shading
tests.� Video Call: Skype 2 way video call (720p)� Gesture Recognition: we used two applications, User Tracker and
Kinemote to move the mouse and to control windows viagestures.
To obtain the energy consumption for each of our computer sys-tem components, we run our workloads separately for three times.

Fig. 3. Increase in total system energy relative to baseline.
1194 F. Hamady et al. / Microprocessors and Microsystems 37 (2013) 1192–1199
We measure the energy consumed for the modules of interest (bymeasuring the average power and multiplying by the run time),and then taking the average of the energy numbers from the threeruns. We directly measure the energy of the processor cores, inte-grated graphics engine (Gfx), and the total CPU energy. We markby ‘‘uncore’’, the difference between the total CPU energy and thesum of the processor cores and the graphics engine. For the SandyBridge architecture, the power supplied to the cores and the powersupplied to the Gfx engine is via different power lanes. Using theinstrumented reference board, we can measure separately theGfx consumption as well as the cores consumption by monitoringthe current flow via these lanes. We can then subtract their sumfrom the total consumption of the processor to get the consump-tion for the rest of the components on the processor (referred toas ‘‘uncore’’).
We directly measure the energy of the central processing unit(CPU), solid state drive (SSD), random access memory (RAM), opti-cal drive, wireless LAN card, LCD, in addition to the total systemenergy from the 12 V input of the charger. We then mark by ‘‘restof the platform’’ (ROP) the difference between the total system en-ergy and the energy of all the instrumented components. The com-ponents that show the highest variation in energy consumption arebasically excluded from the ROP – those include the CPU (withcores and Gfx engine), the memory, the SSD and the WiFi adapter.The absolute ROP energy consumption, including any variations, isconsidered the system baseline, with the separately-measuredcomponents being the focus in this paper.
No external temperature control, such as a chiller, was installedin order to keep the system under test as close as possible to a real-istic scenario. Our setup is shown in Fig. 2.
For the gesture recognition workloads, we used a Microsoft Ki-nect with an external power supply, interfaced to the system via aUSB port. The power consumed by the sensor itself did not count inthe total system power, but the processing of the raw data wasdone on the CPU thus requiring more energy. The video conferenc-ing workload consisted of a Skype video call with another system.We connected via the USB port a web camera capable of 720p andthe connection allowed for such video quality. We were not able tomeasure the actual power drawn by the camera, but the contribu-tion is added to ROP.
4. Results and discussion
To evaluate the battery life differences under the various work-loads, we will first consider the total system average power, whichis the primary metric in such estimations. We consider a baselinewhereby the system is idle, and then we compute the increase insystem power, which maps to battery life, as we show in Fig. 3.The total system power increase varies between 15% all the wayto 140% relative to the idle state, and this means that a
Fig. 2. Experimental setup of the system under test.
considerable variation in the battery life can result from the varia-tion in the workload.
We can note that a segmentation of the energy consumptionper component will help us evaluate the effectiveness of the powermanagement techniques employed by each module. In some cases,components that use a small fraction of the total energy may needto change their self-centric optimal behavior to reflect platform-centric energy efficiency. Later in this section, we will provideexamples in more details.
An energy breakdown of the platform when the system is idleshows a 17% share for the CPU (Fig. 4) which is relatively a smallportion considering the integration of the cores, memory control-ler, graphics and media processing, and LLC on the die. Breakingdown further the CPU energy, we notice that the proper powermanagement of the processing cores and the graphics engine con-sume only 1% of the total system energy. The ‘‘uncore’’ howeverconsumes the rest of the energy maintaining the LLC, memory con-trollers, system agent, etc. This is mainly achieved by appropriatesupport of the deep sleep states where the unused componentsare power gated to prevent leakage power. For instance, uponentering a C2 state [10], the processor can turn off the PLLs andthe core clocks allowing for additional savings in terms of energy.
We also observe in Fig. 5 that nearly half of the energy con-sumed by the system is the CPU’s share in the case of graphicsintensive benchmarks, 3D Mark06 and 3D Mark Vantage, or CPUintensive ones, such as Cinebench. To further relate this to theOS behavior, we plot in Fig. 6 the CPU utilization for each of thefour cores (logical and physical) to find out that the processorwas fully utilized during execution, thus the significant increasein the CPU energy consumption. This is an expected outcome sincethe CPU package hosts two cores with simultaneous multi thread-ing (SMT) and 8 execution units (EU) that support HD graphics.Exercising these sub-systems via these benchmarks would drainthe power in a rapid manner. In systems with discrete graphics en-gines, on-board LLC and external memory controllers, we would
Fig. 4. Idle system breakdown.

Fig. 7. CPU utilization for the Sysmark benchmark.
Fig. 5. Breakdown of CPU intensive benchmarks.
Fig. 6. CPU utilization for the Cinebench workload.
F. Hamady et al. / Microprocessors and Microsystems 37 (2013) 1192–1199 1195
have seen a lighter load on the CPU and a higher one on the exter-nal components [6,7].
Depending on the application/benchmark, different parts of thesystem might be utilized and as such the power profiles wouldchange. For instance, for an application that utilizes the graphicsengine heavily, the power profile would show a greater contribu-tion in the energy consumption from the Gfx engine’s side. Otherapplications that require more memory accesses would have apower profile with an increase in the memory’s power consump-tion. These variations are shown in the pie charts for each bench-mark in this paper. Fig. 7 shows the CPU utilization of Sysmark,where the lower utilization reflects the lower contribution of theCPU consumption to the overall profile, compared to a heavy work-load such as Cinebench.
Depending on the power policies set on the OS of the system,the frequency levels (corresponding to P-states) would be adjustedvia the OSPM (operating system power manager) that uses the coreutilization data as one of the main inputs. This is due to the need ofmaintaining higher performance levels that can cater for theincreasing demands of the applications. The increase in utilization
would trigger higher P-states, in other words higher frequencies,and thus cause higher energy consumption. The relationship be-tween the frequency and power consumption for the system thatwe used is illustrated in Fig. 8.
It is important to emphasize the importance of understandingthe significance of the percentages shown in the results, and tonote the underlying behavior of the system. For instance, considera 10 W idle system with 59% of the power consumed by the ROP.This means that during the idle time, 5.9 W are dissipated by theROP, whereas the more dynamic components (such as CPU, andmemory) have much lower shares given that we have allowed en-ough time for them to go into sleep states. When a computation-ally-intensive workload is run on the system, the CPU share canincrease significantly, from somewhere around 1 W (in deep Cstates) up to 13 W for example. This difference in the CPU con-sumption alone marks the overall system at 23 W, making theROP percentage drop significantly even if the absolute number isstill the same.
Workloads that attribute low average CPU utilization, such asbrowsing and video playback, have the majority of the CPU energy

Fig. 8. Increase in CPU energy consumption versus frequency (Fan-controlledtemperature: slight changes are observed due to chiller-controlled settings).
1196 F. Hamady et al. / Microprocessors and Microsystems 37 (2013) 1192–1199
consumed by the ‘‘uncore’’. Less than 25% of the CPU energy isconsumed by the cores and the graphics engine, so optimizationsat this level should target putting the whole CPU package to sleepin order to diminish power dissipation. One approach is to mini-mize the wake ups via interrupts from peripherals or from theOS timer tick, as these interrupts are one of the major causes keep-ing the CPU from entering into deeper sleep states. This is due toless time spent in idle state, and thus less time spent in the C6 statefor instance. On the other hand, high CPU-utilization workloadssuch as Cinebench demonstrate a high-energy consumption inthe cores rather than the ‘‘uncore’’. Optimizations for such applica-tions should primarily focus on increasing the computational effi-ciency such as utilizing hardware accelerators – as the case showedfor video playback- or instruction set extensions (such as SSEinstructions, and AVX).
Since the number of instructions executed per cycle is mostly afunction of the CPU frequency, then the best approach is to use the
Fig. 9. Energy breakdown
maximum frequency for the durations of high utilization until theworkload finishes execution, and then switch to the lowest sleepstate. This is referred to as ‘‘race to halt’’, and it would be usefulin such scenarios where a lot of work could be done in a small per-iod with relatively high power, but then savings would accumu-late, as less work needs to be done later on translating to verylow power dissipation.
At times when the CPU was the major contributor to the energyconsumption even in idle states, system designers targeted lower-ing the CPU average power consumption to extend the battery life.With the support of deep sleep states [10] and advancement inpower management, the energy contribution of the CPU is nowlower, and today’s designs target putting the system as a wholeinto low power modes. The charts in Figs. 4, 5 and 9 support thisconcept since ROP energy is around 45% of the energy consumed.When trying to optimize the battery life of the platform, we mustconsider the system as a whole and not only the CPU since the con-tribution of other components is fairly significant. Peripherals canaffect the power consumption in direct and indirect ways:
� Directly, through the power consumed by the peripheralscircuitry.� Indirectly, by affecting the performance of other components,
diminishing their power/performance efficiency. For example,a network card may avert the CPU from entering deep sleepstates via frequent interrupts, preventing it from shutting downunused modules.
The graphics core proved to be a scalable and well power-managed engine as we observe in Figs. 3 and 5. Its energyconsumption is null when it is not utilized, as in the case ofCinebench or Kinemote, and goes up to 10% in the case of graphicsintensive applications such as the 3DMark benchmarks. Besidesreducing the watts burned in an external graphics solution, thislevel of integration enables a smoother power management withinthe CPU. The Render C-state (RC6) [14] is an example of power
of typical usage cases.

Fig. 10. Per component energy contribution.
F. Hamady et al. / Microprocessors and Microsystems 37 (2013) 1192–1199 1197
optimization techniques targeting the render engine. When therender engine, blitter engine and the video engine have no work-load and there is no outstanding graphics memory transactionsthe integrated graphics will lower the graphics voltage to enablehigher savings.
We observe from the chart in Fig. 10 that the LCD share rangesbetween 8% and 18% of the total energy. Although this is aconsiderable portion, we may detect higher shares when consider-ing different segments such as mobile phones or PDAs or even
Fig. 12. Gesture recognition
Fig. 11. Per-workload, energy in
upon comparison to different technologies [11]. Examining theincrease relative to the idle system in Fig. 11, we detect a minorchange in the energy consumption due to the same brightnesslevel that we used across all the workloads.
While many of the workloads utilized the wireless card (Skype,Browsing, Streaming, etc.), the WiFi adapter that interfaced to thesystem via a mini PCIe port did not account for more than 4% asshown in Fig. 10. Note that the absolute number in the case ofSkype was higher than Browsing, but the contribution to thesystem’s energy was lower since more components were active,and more computations were required. This is an evident observa-tion from Fig. 11, where the increase is about 1 energy unit in thecase of video call (Skype) while it is a negligible raise in the case ofmulti-page browsing.
The consumption of the SSD (Fig. 10), ranging from 1% in theidle state to 12%, showed a lower contribution as compared to pre-vious storage solutions such as hard disk drives HDD [6,12]. Usingthe Intel rapid storage technology driver, we measured a high res-idency in slumber states when the SSD was not in use. This is oneexample of a power-managed device that would effectively switchto lower power states when it is not used, accounting for the tran-sitional delay and overhead to higher states.
The share of the memory modules was consistent in the rangeof 3–8% of the platform energy, a number that is considerably
workload breakdown.
crease relative to baseline.

1198 F. Hamady et al. / Microprocessors and Microsystems 37 (2013) 1192–1199
low given the fact that we are using 4 GB of 1333 MHz memory.Although the increase in the energy relative to the baseline canbe up to 2 energy units as illustrated in Fig. 11, the effect on batterylife is still acceptable since the overall contribution is low.
None of workloads utilized the optical drive and this is reflectedin Fig. 11, showing a contribution of at most 1% of the total systemenergy.
Based on observations from these peripherals, we must notethat the rate of delivery of the requested data (whether from mem-ory, disk, or network) is an important factor in determining the to-tal energy consumption of the whole system. If the data isdelivered in smaller chunks (due to factors such as network con-gestion in the case of the wireless card), the CPU will be inter-rupted frequently in order to process the data, and hence it willbe prohibited from entering deeper sleep states.
A remarkable observation is the low energy consumed by theCPU in the case of the video playback. This is due to an embeddedH.264 hardware accelerator that offloads computations from theCPU core to deliver the results with minimal resource usage.
Interestingly, we noticed that gesture recognition applicationscould increase the share of the CPU up to 43% of the system’s en-ergy. This is mainly due to the intense computations required torecognize the gestures. The key difference between the two appli-cations is that User Tracker displays a 3D avatar of the user, impos-ing a heavier load on the CPU, while the Kinemote application onlyrecognizes the movements without displaying a tracking mecha-nism on the screen. We can see a noticeable increase in the ROP en-ergy as shown in Fig. 12, since we hooked up a Kinect controller viathe USB port, increasing the platform controller hub (PCH) con-sumption as well as the buses within the system.
5. Conclusion and future work
In this paper, we presented a component-wise energy con-sumption breakdown of a modern mobile platform. We collectedand analyzed the traces for a wide variety of benchmarks andworkloads. The power traces, obtained via physical measurements,showed that today’s CPUs provide a scalable solution that can beone of the major contributors to the average power dissipation inthe system (up to 64% of the total system power). Despite theadvancements in CPU power management and saving techniques,the high demand for computational power is leading to higher fre-quencies, more cores, and more integration on the package. Weshowed the individual energy contributions of the various compo-nents in the system and as a result their effect on battery life.
A considerable change in the system’s energy consumption wasobserved upon variations in the workloads. This shows the impactof software applications on the different components present inthe system and asserts the need for a software/hardware interac-tion scheme that decreases the energy consumption while ensur-ing the highest levels of performance.
Sleep states, especially those featuring power gating such asprocessor core C6 state, showed great saving as they can bringthe energy consumption of the device down to zero. Driver supportfor sleep states illustrated efficient power management solutions,which was the case with the SSD. On the other hand, frequentinterrupts and slow delivery of raw data for further processing,demonstrated a considerable increase in the total system energyresulting in lower power/performance efficiency.
We realized that for some emerging workloads, like gesture rec-ognition, very high computational power is required, thus the needarises for high performance CPUs that feature energy efficiencyalong with high computational power.
For future work, we plan to study the utilization of the busesand links within the system (such as DMI, and PCIe) to better
understand the bottlenecks and points of congestion in the plat-form given a certain workload.
Acknowledgments
This work was supported by Intel-KACST’s Middle East EnergyEfficiency Research (MER) Program. The authors would like tothank Tawfik Arabi from Intel for his support and guidance.
References
[1] D. Geer, Chip makers turn to multicore processors, Computer 38 (5) (2005)11–13.
[2] Jeff Parkhurst, John Darringer, Bill Grundmann, From Single Core to Multi-core:Preparing for a New Exponential, in: Proceedings of the 2006 IEEE/ACMInternational Conference on, Computer-Aided Design, 2006.
[3] Graybill Robert, Melhem Rami, Power Aware Computing (2002).[4] Fluke 2680 Series Data Acquisition Systems. <http://us.flukecal.com/products/
data-acquisition-and-test-instruments/data-acquisition/2680-series-data-acquisition-systems>.
[5] Hemanth JS Kothuru, GirishSolur Virupakshaiah, Shraddha Jadhav,Component-wise Energy Breakdown of Laptop, in: Proceedings of the 6thAnnual GRASP Symposium, Wichita State University, 2010.
[6] Aqeel Mahesri, Vibhore Vardhan, Power Consumption Breakdown on a ModernLaptop, in: Workshop on Power Aware Computing Systems, 2004.
[7] Chinn, Desai, DiStefano, Ravichandran, Thakkar, Mobile PC platformsenabled with Intel Centrino, Intel Technology Journal (2003). May.
[8] Intel Low Power Technologies: Bringing Longer Battery Life and HigherProductivity to Mobile Computing. <http://www.intel.com/ebusiness/pdf/prod/relatedmobile/wp021601.pdf>.
[9] Intel� Micro-architecture Codename Sandy Bridge. <http://www.intel.com/technology/architecture-silicon/2ndgen/index.htm>.
[10] Advanced Configuration and Power Interface Specification 4.0. <www.acpi.info>.
[11] Franco Gatti, Andrea Acquaviva, Luca Benini, Bruno Ricco, Low power controltechniques for TFT LCD displays, CASES (2002).
[12] John Zedlewski, Sumeet Sobti, Nitin Garg, Fengzhou Zheng, ArvindKrishnamurthy, Randolph Wang, Modeling hard-disk power consumption,File and Storage Technologies (2003).
[13] http://www.intel.com/content/www/us/en/architecture-and-technology/microarchitecture/intel-microarchitecture-codename-sandy-bridge.html.
[14] Faisal Hamady, Ayman Kayssi, Ali Chehab, Energy Consumption Breakdown ofa Modern Mobile Platform Under Various Workloads, in: Proceeedings ofInternational Conference of Energy Aware, Computing 2011, Novermber 2011.
Faisal Hamady is a Management Consultant at TheBoston Consulting Group, where he is a core member ofthe firm’s TMT (Technology, Media and Telecom) prac-tice area. Prior to BCG, Faisal worked at Intel on devel-oping power reduction algorithms and energy awareapplications for the latest mobile platforms. He alsoworked at the American University of Beirut on devel-oping power-efficient communication schemes forwireless sensor networks. Faisal holds an M.E. in Infor-mation and Communication Technology from theAmerican University of Beirut, and a B.E. in Computerand Communications Engineering (with distinction)from Notre Dame University.
Ayman Kayssi was born in Lebanon. He studied elec-trical engineering and received the BE degree, withdistinction, in 1987 from the American University ofBeirut (AUB), and the MSE and PhD degrees from theUniversity of Michigan, Ann Arbor, in 1989 and 1993,respectively. He received the Academic ExcellenceAward of the AUB Alumni Association in 1987. In 1993,he joined the Department of Electrical and ComputerEngineering (ECE) at AUB, where he is currently a fullprofessor. In 1999–2000, he took a leave of absence andjoined Transmog Inc. as chief technology officer. From2004 to 2007, he served as chairman of the ECE
Department at AUB. He teaches courses in electronics and in networking, and hasreceived AUB’s Teaching Excellence Award in 2003. His research interests are ininformation security and networks, and in integrated circuit design and test. He has
published more than 165 articles in the areas of VLSI, networking, security, andengineering education. He is a senior member of IEEE, and a member of ACM, ISOC,and the Beirut OEA.
F. Hamady et al. / Microprocessors and Microsystems 37 (2013) 1192–1199 1199
Ali Chehab received his Bachelor degree in EE from AUBin 1987, the Master’s degree in EE from Syracuse Uni-versity in 1989, and the PhD degree in ECE from theUniversity of North Carolina at Charlotte, in 2002. From1989 to 1998, he was a lecturer in the ECE Departmentat AUB. He rejoined the ECE Department at AUB as anAssistant Professor in 2002 and became an AssociateProfessor in 2008. He received the AUB TeachingExcellence Award in 2007. He teaches courses in Pro-gramming, Electronics, Digital Systems Design, Com-puter Organization, Cryptography, and Digital SystemsTesting. His research interests include: Wireless Com-
munications Security, Cloud Computing Security, Multimedia Security, Trust inDistributed Computing, Low Energy VLSI Design, and VLSI Testing. He has about 130publications. He is a senior member of IEEE and a member of ACM.