efficacy of selenium supplementation methods in california
TRANSCRIPT

Larr
y Fo
rero
Efficacy of selenium supplementation methods in California yearling beef cattle and resulting effect on weight gainby Josh Davy, Larry Forero, Thomas Tucker, Christie Mayo, Daniel Drake, John Maas and James Oltjen
Selenium (Se) deficiency occurs commonly in California grazing cattle and has been associated with reduced immune function and, in some studies, reduced weight gain. Multiple methods of supplementing Se are available, but little research has compared the effects of these methods on whole blood Se levels and weight gain. In two trials, we evaluated four methods of Se supplementation — an intrarumenal bolus, two injectable preparations and a loose salt containing 120 ppm Se — over an 85- to 90-day period in Se-deficient yearling cattle in Tehama County. The bolus treatment raised whole blood Se levels to an adequate level (0.08 ppm) for the entire study period. Whole blood Se concentrations in injected cattle initially reached adequate levels but then declined to deficient levels. The loose salt treatment acted slowly, with average whole blood Se concentration reaching adequate levels at the end of the study period. None of the treatments significantly affected weight gain and Se blood concentration was not correlated with weight gain. In growing cattle, it appears that Se supplementation may be viewed not as a direct driver of weight gain, but rather as similar to vaccination, in that it can prevent health problems that might otherwise lead to reduced weight gain.
Selenium (Se) deficiency in California livestock species is widespread and is estimated to exist in excess of 60%
of herds in the state (Dunbar et al. 1988;
Williams 1980). Se is an essential nutri-ent for all animals, including cattle (NRC 1996). The importance of correcting Se de-ficiencies is well documented. Adequate Se levels have been found to boost immu-nity, thereby reducing mortality, diarrhea
and increasing disease resistance in cattle (Arthur et al. 2003; Gerloff 1992; Maas 1983; Salles et al. 2014; Spears et al. 1986).
Soils with low concentrations of Se are the primary cause of plants provid-ing limited Se levels to cattle in forage (NRC 1996). Methods of increasing for-age Se concentrations through the use of soil amendments have been successful in providing adequate Se in forage to cattle (Ajwa et al. 1998). Currently, the use of fertilizers containing Se is not legal in California, leaving direct supplementa-tion of livestock the only method to al-leviate Se deficiency. The difficulty facing California livestock producers is deter-mining the most appropriate supplemen-tation strategy that fits their particular operation.
Se injections are a common method of supplementing deficient cattle. Research has found this can be an effective supple-mentation method, though its effective adequacy period has not been found to last for more than 45 days (Genther and Hansen 2014; Maas et al. 1993). The use of an intraruminal time release bolus has been demonstrated as a safe, long-term Se supplementation strategy (Hemingway et al. 2003; Maas et al. 1994; Sprinkle et al. 2006).
Online: https://doi.org/10.3733/ca.2016a0016
Results from two trials suggest that a selenium rumen bolus can maintain adequate levels of whole blood selenium throughout the study period, whereas the benefits of selenium injections do not last as long.
Research Article
http://calag.ucanr.edu • OCTOBER–DECEMBER 2016 187
The U.S. Food and Drug Administration allows a maximum di-etary supplement of 3 milligrams per head (mg/head) per day in cattle diets. This is the equivalent of 120 parts per million (ppm) of Se added to a salt sup-plement mixture that is formulated for consumption of one ounce per head per day. The use of free-choice salt-mineral mixes as a method of Se supplementation has limited research, but in some cases has been found to bring Se to adequate levels (Patterson et al. 2013). Results can be variable due to individual animal intake, varying pasture conditions and climatic conditions such as temperature, precipitation and season. Research quan-tifying Se status from herds that are pro-vided salt-based supplements is necessary, especially in California conditions, as this is one of the most common methods of supplementation used by California live-stock managers.
Unlike immune responses, weight gain and feed efficiency differences be-tween Se-supplemented and -deficient cattle have been variable, with some studies finding significant improve-ment in supplemented cattle (Del Claro et al. 2013; Johnson et al. 1979; Nelson and Miller 1987; Perry et al. 1976; Spears et al. 1986), while others have not ob-served significant differences (Albaugh et al. 1967; Cozzi et al. 2011; Jenkins and Hidiroglou 1986; Nicholson et al. 1993; Salles et al. 2014; Swecker et al. 2008). In light of these varying results, current information specific to California condi-tions is needed to help quantify weight gain differences between Se-deficient and -adequate cattle.
We evaluated both the efficacy of Se supplementation methods and yearling cattle weight gain associated with whole blood Se levels. To our knowledge, these two trials are one of the only evalua-tions of both different supplement meth-ods and their effect on increasing whole blood Se levels and the subsequent influence on yearling cattle weight gains. Specifically, trial 1 included treatments of a 15-mg/head Se injection (MU-SE), a 25-mg/head Se injection (Multimin) and an intrarumenal bolus against a control group. Trial 2 monitored the effective-ness of a loose salt-based supplement compared to an intrarumenal bolus positive control and true negative con-trol groups.
Study siteThe study site for the two trials was a commercial cattle ranch in Cottonwood (Tehama County), California. Herd whole blood and forage sampling prior to the trial showed the site to be a Se-deficient irrigated pasture. Cottonwood has a typi-cal Mediterranean climate with cool wet winters and warm dry summers. The perennial irrigated pastures are grazed from early spring to late fall and rested in the winter rainy season when cattle are hauled to winter annual rangeland. The soil is an Arbuckle gravelly loam formed in alluvial materials from mainly con-glomerate and metasedimentary rocks (USDA 2014). Vegetation consisted of dallisgrass (Paspalum dilatatum), tall fes-cue (Schedonorus arundinaceus), ryegrass (Lolium spp.), bermudagrass (Cynodon dac-tylon) and white clover (Trifolium repens), with a minor weed component includ-ing smartweed (Polygonum lapathifolium), sedge (Cyperus difformis) and mint (Mentha pulegium). The trials were conducted us-ing the same pastures in both 2011 and 2013. Since the pastures are perennial, the composition did not vary largely between years.
CattleTrials 1 and 2 consisted of preconditioned weaned steers with an average starting weight of 643 pounds (range 488–824 pounds) in 2011, and an average of 551 pounds (range 325–760 pounds) in 2013. Though not a purebred herd, the ranch has used strictly Angus genetics for many years, categorizing the research steers as Black Angus cattle.
Whole blood samplingAlthough liver biopsy is the most pre-ferred sampling method, whole blood sampling for Se has been found to be an accurate and less invasive tool for the assessment of Se status of cattle (Kirk et al. 1995; Pavlata et al. 2001). Unlike other trace minerals, serum has not proven reli-able compared to whole blood testing of Se (Maas et al. 1992).
In both trials, collection of whole blood for Se testing was completed using EDTA tubes. Samples were submitted to the California Animal Health and Food Safety laboratory at UC Davis for testing. Samples of the cattle were tested prior to trial initiation to confirm deficiency,
Josh
Dav
y
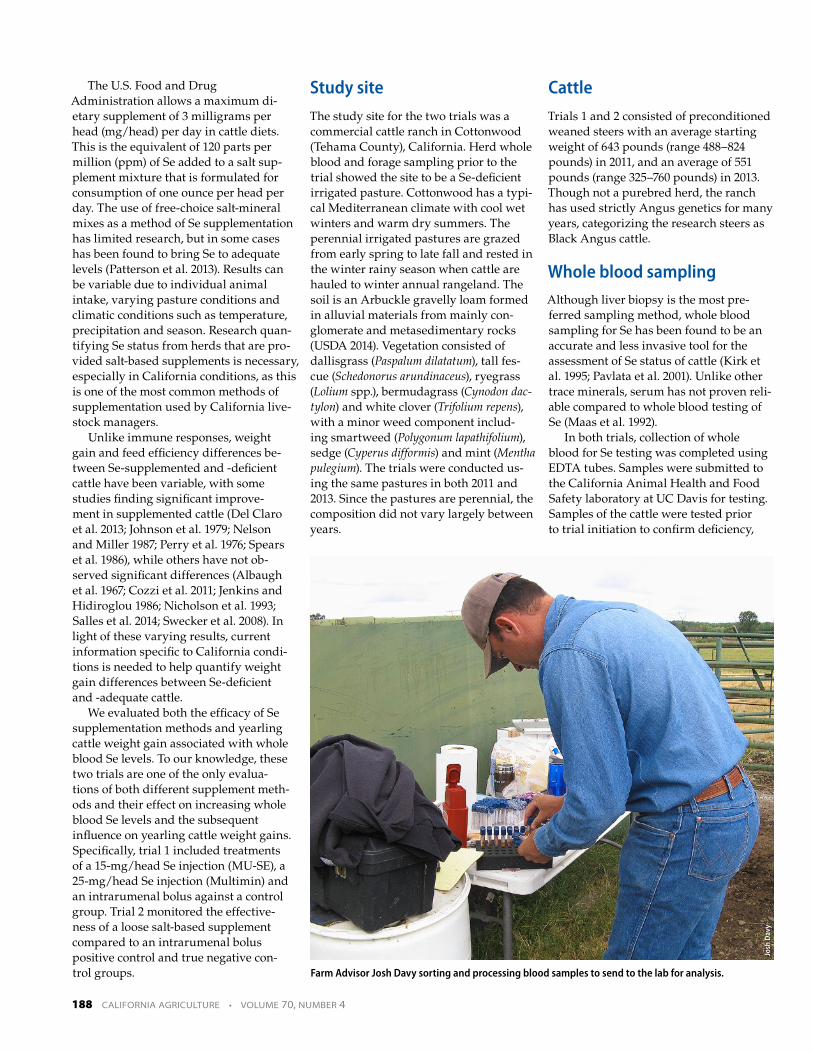
Farm Advisor Josh Davy sorting and processing blood samples to send to the lab for analysis.
188 CALIFORNIA AGRICULTURE • VOLUME 70, NUMBER 4

conduct stratification, and to make certain there was not a large variance in the herd level.
For sample interpretive purposes, whole blood sample results were placed into four groups that described the mineral level status. The groups were classified as severely deficient at levels of 0−0.050 ppm, marginally deficient at 0.051−0.080 ppm, adequate at 0.081−0.160 ppm and highly adequate at 0.161 ppm or more (Dargatz and Ross 1996).
Trial 1 methods (2011)In the 2011 trial, 80 individually identified steers were stratified into four groups of 20 head each. Stratification was completed by creating four weight groups starting with the lightest 20 cattle in group one and continuing in ascending order to group four. Equal numbers of each strati-fication group were randomly assigned to each treatment. Analysis of variance confirmed that no difference in weight existed between treatments prior to treat-ment initiation.
The trial began on July 25, 2011. Treatments included 3 cc of a 5-mg/ml injection of sodium selenite (MU-SE, Merck Animal Health, Madison, New Jersey) (15 mg Se/head), a 5-cc injection of a 5-mg/ml sodium selenite in a mix-ture of zinc oxide, manganese carbon-ate and copper carbonate (Multimin 90, Multimin, Fort Collins, Colorado) (25 mg Se/head), a Se oral bolus (Se365 Se bo-lus, Pacific Trace Minerals, Sacramento, California) designed to release not more than 3 mg/head/day, and an untreated control group. Both injections of Se were performed subcutaneously. The two rates were based off of label recommen-dations of competing Se injection prod-ucts commonly used for supplementing cattle.
Body weight for each animal was recorded at 30-day intervals for 90 days following treatment initiation. Whole blood Se samples were collected on day 30 and again on day 90 after treatment initiation. All treatment groups were combined in the same pasture through-out the trial.
Trial 2 methods (2013)The second trial, which began May 28, 2013, built on the previous trial by
focusing on loose salt as a supplement source. This trial evaluated the ability of a loose salt mixture to raise deficient cattle to a status of adequate. As in trial 1, we sought to determine whether differences in Se status would affect yearling steer weight gains. Forty-eight steers were placed in a salt-supplemented treatment group with free access to a sodium sel-enite–based Se supplement at a concentra-tion of 120 ppm. Six positive control steers were given a Se bolus and six negative control steers were given no treatment. The positive control cattle were given a bolus because the 2011 trial had shown it to be a treatment that had the ability to raise and maintain whole blood Se throughout the trial period.
Both the positive and negative con-trol steers were placed in an adjacent pasture to the loose salt–supplemented steers to prevent access to the supple-ment. Stratification was completed in the same manner as for trial 1 except that two weight groups and three Se groups within weight groups were used. Weight gain and whole blood sampling of all cattle occurred on day zero and four sub-sequent 21-day intervals.
The control and treated pastures were also sampled on the same dates as the
cattle. In cross-pasture transects that reached from one corner of each pasture to the other, six equally spaced individual points were sampled in order to obtain a representation of the grazing area. Each sampling point recorded pasture compo-sition, standing biomass, forage quality, mineral content and plant height. Pasture composition was recorded as basal cover of plant species present in a one-square-foot frame.
Once composition and average plant height was recorded, the samples were clipped to ground level, dried to 100% drymatter, weighed and then split in half for submission of forage quality and mineral content analysis. Forage quality analysis was conducted by Dairy One for-age laboratory in Ithaca, New York, and the forage mineral content was analyzed by the California Animal Health and Food Safety laboratory at UC Davis. The process was repeated in each field at the same sampling date.
Statistical analysisTo analyze weight gain, both trials were run separately using multiple analyses of variance for average daily gain and whole blood Se level. Categorical variables
Josh
Dav
y
Farm Advisor Larry Forero processing cattle in the squeeze chute.
http://calag.ucanr.edu • OCTOBER–DECEMBER 2016 189

included treatment, date, their interac-tions and a covariate of the individual animal identification (when applicable) using Statgraphics Centurion (StatPoint 2009). Covariates including initial weight and Se level were run, but were omitted because they were not significant in the model (P > 0.05). Mean separation was completed using least square means at the 0.05 level. Pearson product moment correlations were run for both forage spe-cies to Se forage content, and Se whole blood level to weight gain. Se level graph-ing used 95% least significant difference bars to present true treatment differences. To depict weight gain, both trials were graphed expressing cumulative average daily gain with 95% confidence intervals in Minitab (Minitab Inc. 2013). Likewise, whole blood Se levels are depicted graphi-cally using Minitab.
Trial 1 results Cattle that received some type of Se treatment generally reached the ad-equate level of 0.08 ppm whole blood Se at 31 days post treatment (fig. 1). Although the lower dose Se injection (MU-SE) crossed the 0.08-ppm level, it also did not differ from the control (P > 0.05). The higher dose Se injection (Multimin) and Se bolus were signifi-cantly higher in whole blood Se than both the lower dose Se injection and the control (P < 0.05, respectively), though
they were not different from each other at 30 days posttreatment (P > 0.05).
At 90 days posttreatment, the only Se supplement that remained at an adequate whole blood level was the Se bolus treatment. The control Se blood levels dropped between 30 and 90 days posttreatment, indicating that the grazed pasture was deficient in Se, though for-age samples were not completed in this trial. The control treatment at day 90 was severely deficient in whole blood Se. Both Se injection treatments were significantly lower than they were on day 90 compared to day 30 (P < 0.05, respectively), and fell between marginally and severely deficient.
Trial 2 results All of the steers in trial 2 began the trial deficient in Se, and most would be con-sidered severely deficient (fig. 2, 6/17/13). As seen in trial 1, the positive control steers that were treated with a Se bolus were adequate in whole blood Se at the first sampling posttreatment (7/8/13) and remained adequate for the duration of the trial. The negative control steers that were not supplemented remained below adequate levels throughout the trial. The loose salt treatment group significantly had higher whole blood Se levels in the first sampling after treatment initiation (P < 0.05). Se levels remained constant between first and second samplings after
treatment initiation (P > 0.05). In the third sampling after treatment (8/20/13), whole blood Se levels decreased, but then actu-ally significantly rebounded, reaching adequate levels in the fourth and final posttreatment sampling of the project (P < 0.05).
The pasture forage Se level was sub-stantially low (fig. 3). A level of 0.1 ppm with a maximum intake of 2 ppm is con-sidered necessary for cattle (NRC 2000). Both pastures in 2013, with the exception of one outlier sampling in July, were gen-erally below this guideline, which again
TABLE 1. Se correlations with pasture forage species in trial 2, 2013
Forage species Se level
Dallisgrass − 0.0474, P = 0.7237
Tall fescue 0.0934, P = 0.4854
Ryegrass − 0.1664, P = 0.2119
Bermudagrass 0.2737, P = 0.0376
White clover − 0.0493, P = 0.7135
Smartweed 0.0372, P = 0.7817
Sedge − 0.0773, P = 0.5643
Mint − 0.1301, P = 0.3304
15-mginjection
25-mginjection
Control Se bolus 15-mginjection
25-mginjection
Control Se bolus
Se w
hole
blo
od, p
pm
Day 30 Day 90
0.00
0.02
0.04
0.06
0.08
0.10
0.12
0.14
Fig. 1. Se whole blood levels (ppm) with 95% confidence intervals based on treatment and sample date for trial 1, 2011.
Negative controlPositive controlLoose salt treatment
6/17/13 7/8/13 8/1/13 8/20/13 9/10/13
Se w
hole
blo
od S
e le
vel,
ppm
Sample date
0.00
0.02
0.04
0.06
0.08
0.10
0.12
Fig. 2. Whole blood Se response with least significant differences by treatment and date in trial 2, 2013.
190 CALIFORNIA AGRICULTURE • VOLUME 70, NUMBER 4

was evident with the consistent decline of Se levels in control cattle. Most likely due to the outlier sampling date, there was a significant date and date–pasture interaction (P < 0.01, P = 0.04, respectively), though pasture itself was not significant (P = 0.07). Only one significant correla-tion between forage species and Se level existed, which was bermudagrass, but the correlation was low (P = 0.04, r = 0.27, table 1).
Weight gainTreatment did not significantly affect average daily gain in either trial (P = 0.20 and 0.12, respectively; fig. 4). Likewise, no correlation existed between Se whole blood level and cumulative average daily gain (r = 0.15) or weight at each sampling (r = 0.16) in the 2013 trial.
Comparison of treatment methods Similar to the findings of Renquist et al. (2007), our data show that sustained herd average of adequate levels of whole blood Se are possible through the use of a Se rumen bolus. In both trial 1 and trial 2, Se levels elevated quickly, with most steers reaching adequate levels soon after treatment. This group con-sistently stayed at an adequate level throughout both trials. The rumen bolus method of supplementation appears to
be a very dependable method of supple-mentation, particularly if Se is the only deficient mineral.
Injection forms of Se are easier to administer in terms of cattle restraint, applicator skill, and, usually, time. The injections do elevate Se levels. In our trials, the higher injection dose at 25 (Multimin) versus 15 (MU-SE) mg/head provided significantly higher whole blood Se levels than the lower dose at 30 days posttreatment. In this time frame, the Se whole blood level in cattle treated with the higher dose was equal to that in the Se bolus–treated cattle, but the benefits didn’t last as long. Our results agree with others that at 90 days, an injection of Se should not be expected to provide any supplemental benefit regardless of dose (Genther and Hansen 2014; Maas et al. 1983). However, this method may be a practical consideration when combined
with the loose salt–based supplemental method.
The greatest benefit of a salt-based supplement is that it allows multiple min-erals to be supplemented at the same time. Our 2013 trial found that it was possible for the herd to reach an adequate level of Se with this supplemental method. The difference between this method and the others is that it takes a longer time period to bring deficient cattle to adequate levels. This treatment did increase whole blood Se levels soon after the supplement was placed into the treatment pasture, but remained at a marginally deficient level until the final sampling.
Since forage Se differences were not significantly impacted by plant species or pasture, we attribute differences in whole blood Se levels to the supplement consumed, and in fact, whole blood Se levels corresponded to consumption of
15-mginjection
25-mginjection
Control Se bolus Control Loose salt Se bolus
Ave
rage
dai
ly g
ain,
lbs
Trial 1 Trial 2
0.0
0.5
1.0
1.5
2.0
2.5
3.0
Fig. 4. Cumulative average daily gain and associated 95% confidence intervals by treatment in each trial.
Positive/negative controlLoose salt treatment
6/17/13 7/8/13 8/1/13 8/20/13 9/10/13
Fora
ge S
e, p
pm
Sample date
–0.15
0
0.15
0.30
0.60
0.45
0.75
Fig. 3. Forage Se levels by pasture and sample date in trial 2, 2013.
TABLE 2. Average consumption of loose salt mineral supplement and associated Se uptake of the whole herd in trial 2, 2013
Sampling dateLoose salt consumed
oz / head / day
Actual Se consumed mg / head / day
Herd average Se blood level
ppm
7 / 8 / 2013 5.63 19 0.06
8 / 1 / 2013 2.76 9 0.07
8 / 20 / 2013 2.26 8 0.05
9 / 10 / 2013 4.43 15 0.08
http://calag.ucanr.edu • OCTOBER–DECEMBER 2016 191

the loose mineral supplement. Intake levels were high when the supple-ment was first placed in the pasture (6/17/13). At a consumption rate of 5.6 oz/head/day, the corresponding Se intake was 19 mg/head/day, which is similar to levels administered through Se injection. On the first posttreatment sampling date (7/8/2013, table 2), Se in-take was 19 mg/head/day. By the next sampling date (8/1/2013), Se intake had declined to 9 mg/head/day, and then to 8 mg/head/day on the third sampling (8/20/13). Yet, on the last sampling date (9/10/13), the herd average intake had
increased to 15 mg/head/day, and cor-responding Se whole blood levels had again increased significantly. This data indicates the importance of continued consumption of the supplement in known deficient areas. Seasonal supplementation, such as only during the breeding season, does not appear to be a method to ad-equately maintain Se levels.
Though they did very well at a herd average, no supplemental method, in-cluding the bolus, brought all animals to adequate levels. Table 3 depicts the percentage of the loose salt treatment cattle that were still deficient or severely
deficient as compared to the herd average Se level at each sampling. Surprisingly, all treat-ments were similar in this effect. Though the salt treatment reduced
the percentage of cattle that were severely deficient by four times, there were still 21% of cattle that were severely deficient when the herd average was adequate. Even the bolus, which was considered a reliable long-term treatment, left 23% and 17% of animals severely deficient in trials 1 and 2, respectively. Combining supplementation methods may decrease the overall number of deficient cattle. This may include practices such as administer-ing Se injections at the beginning of the supplementation period and then provid-ing salt supplement as a means to main-tain Se levels.
Surprisingly, weight gain was not a function of Se whole blood level. Both trials had significant variance in animal Se levels and neither proved significantly attributed nor correlated with gain differ-ences based on Se. Pasture appeared to be a greater influence on weight gain in 2013 than Se treatment. The pasture with the positive and negative control cattle had better gains, though not different from each other, than the separated loose salt treatment group. Correspondingly, the positive/negative control pasture was also higher in energy (total digestible nutrients, TDN) (P < 0.01) and protein (P < 0.01). We suspect this was due to a 10% higher basal cover composition of white clover in the control pasture (P < 0.01). This was surprising, as the pastures were separated only by a single fence line and both were originally planted on the same date.
This does not imply that correction of low Se levels is not important. Salles
The rumen bolus method of supplementation appears to be a very dependable long-term method of supplementation, particularly if Se is the only deficient mineral.
TABLE 3. Average herd whole blood level and corresponding percentage of cattle below adequate and severely deficient in the salt-supplemented group of trial 2, 2013
Sampling date
Average herd Se blood level ppm
Salt-supplemented group below 0.08 ppm
%
Salt-supplemented group below 0.05 ppm
%
6 / 17 / 2013 0.03 100 88
7 / 8 / 2013 0.06 73 33
8 / 1 / 2013 0.07 69 29
8 / 20 / 2013 0.05 88 58
9 / 10 / 2013 0.08 54 21
Cattle grazed free-choice on irrigated pasture during both trials.
Josh
Dav
y
192 CALIFORNIA AGRICULTURE • VOLUME 70, NUMBER 4

et al. (2014) found significant immune response with elevated Se levels in calves. Nicholson et al. (1993) found slight antibody increases in yearling cattle that were supplemented with Se. Similarly, Makimura et al. (1993) found greater vaccine antibody response in Se-supplemented cattle. It appears that Se may not directly influence weight gain as do factors such as TDN in a ration; rather, it may have an indirect affect on an animal’s overall health. Reductions in weight gain may only be noticed in Se-deficient cattle that experience some sort of immune challenge, which secondarily reduces weight gain. The possibilities for this type of challenge could be nu-merous, including parasite and disease infections, which are commonly faced by beef cattle producers. It is likely in our two controlled trials that these challenges were minimal due to many factors, such as contained herds with little exposure to outside cattle or off-ranch forage sources.
However, one could speculate that at some time an immune challenge would occur, resulting in any number of animal health problems in a Se-deficient group of cattle. c
J. Davy is UC Cooperative Extension (UCCE) Livestock and Range Advisor in Colusa, Glenn and Tehama counties; L. Forero is UCCE Livestock and Range Advisor in Shasta and Trinity counties and County Director of UCCE Shasta County; T. Tucker is in the Departments of Medicine and Epidemiology, UC Davis School of Veterinary Medicine; C. Mayo is Postdoctoral Researcher in the UC Davis School of Veterinary Medicine; D. Drake is UCCE Livestock and Range Advisor Emeritus; J. Maas is UCCE Veterinarian in the UC Davis School of Veterinary Medicine; J. Oltjen is UCCE Animal Management Specialist in the Department of Animal Science at UC Davis. We graciously thank our project cooperator Jerry Hemsted at Tom Bengard Ranches. We also thank Schering-Plough for funding the blood sampling in trial 1 and the Rustici Range Endowment for funding costs of the second trial.
References Ajwa HA, Banuelos GS, Mayland HF. 1998. Selenium uptake by plants from soils amended with inorganic and organic materials. J Environ Qual 27(5):1218–27.
Albaugh R, Meyer Smith JS. 1963. Response to vitamin a, vitamin e and selenium of cattle and sheep in Northern California. Calif Agr 17(12):4–5.
Arthur JR, McKenzie RC, Beckett GJ. 2003. Selenium in the immune system. J Nutr 133(5):1457S–59S.
Cozzi G, Prevedello P, Stefani AL, et al. 2011. Effect of dietary supplementation with different sources of sele-nium on growth response, selenium blood levels and meat quality of intensively finished Charolais young bulls. Animal 5(10):1531–8.
Del Claro GR, Zanetti MA, Saran Netto A, et al. 2013. The effects of copper and selenium supplementation in the diet of Brangus steers on performance and rumen fer-mentation. Arq Bras Med Vet Zootec 65(1):255–61.
Dunbar JR, Norman BB, Oliver MN. 1988. Preliminary report on the survey of selenium whole blood values of beef herds in twelve central and coastal California counties. Selenium contents in animal and human food crops grown in California. UC Cooperative Extension, UC Division of Agriculture and Natural Resources, Publication 3330. Oakland, California. p 81–3.
Dargatz DA, Ross PF. 1996. Blood selenium concentra-tions in cows and heifers on 253 cow-calf operations in 18 states. J Anim Sci 74(12):2891–5.
Genther ON, Hansen SL. 2014. A multielement trace mineral injection improves liver copper and selenium concentrations and manganese superoxide dismutase activity in beef steers. J Anim Sci 92(2):695–704.
Gerloff BJ. 1992. Effect of selenium supplementation on dairy cattle J Anim Sci 70(12):3934–40.
Hemingway RG, McInnes AG, Freeman NDA. 2003. Stud-ies on the use of novel selenium - and cobalt-containing rumen boluses for cattle and sheep. Cattle Pract 11(3):167–71.
Kirk JH, Terra RL, Gardner IA, et al. 1995. Comparison of maternal blood and fetal liver selenium concentrations in cattle in California. Am J Vet Res 56(11):1460–4.
Jenkins KJ, Hidiroglou M. 1986. Tolerance of the pre-ruminant calf for selenium in milk replacer. J. Dairy Sci 69(11):1865–70.
Johnson W, Norman B, Dunbar J. 1979. Selenium im-proves weight gain of beef calves. Calif Agr 33(3):14–16.
Maas JM, Galey FD, Peauroi JR, et al. 1992. The correlation between serum selenium and blood selenium in cattle. J Vet Diagn Invest 4(1):48–52.
Maas JM, Peauroi JR, Tonjes T, et al. 1993. Intramuscular selenium administration in selenium-deficient cattle. J Vet Intern Med 7(6):342–8.
Maas JM. 1983. Diagnosis and management of selenium-responsive diseases in cattle. Compend Contin Educ Pract Vet 5:393–9.
Maas JM, Peauroi JR, Weber DW, Adams FW. 1994. Safety, efficacy, and effects on copper metabolism of intrareticu-larly placed selenium boluses in beef heifer calves. Am J Vet Res 55(2):247–50.
Makimura S, Kodama A, Kishita M, et al. 1993. Econdary antibody response to haemophilus-somnus antigen in breeding Japanese black cattle fed selenium-deficient and alpha-tocopherol-fortified diets. J Vet Med Sci 55(5):871–3.
Minitab 17 Statistical Software. 2013. [Computer soft-ware]. State College, PA: Minitab, Inc. www.minitab.com.
[NRC] National Research Council. 1996. Nutrient Require-ments of Beef Cattle. Washington, D.C.: National Acad-emy of Sciences. p 62–4.
NRC. 2000. Nutrient Requirements of Beef Cattle. Wash-ington, D.C.: National Academy of Sciences, National Academy Press.
Nelson A, Miller R. 1987. Responses to selenium in a range beef herd. Calif Agr 41(3):4–5.
Nicholson JWG, Bush RS, Allen JG. 1993. Antibody-responses of growing beef-cattle fed silage diets with and without selenium supplementation. Can J Anim Sci 73(2):355–65.
Patterson JD, Burris WR, Boling JA, Matthews JC. 2013. Individual intake of free-choice mineral mix by grazing beef cows may be less than typical formulation assump-tions and form of selenium in mineral mix affects blood Se concentrations of cows and their suckling calves. Biol Trace Elem Res 155:38–48.
Pavlata L, Illek J, Pechova A. 2001. Blood and tissue sele-nium concentrations in calves treated with inorganic or organic selenium compounds - A comparison. Acta Vet Brno 70(1):19–26.
Perry TW, Beeson WM, Smith WH, Mohler MT. 1976. Effect of supplemental selenium on performance and deposit of selenium in blood and hair of finishing beef cattle. J Anim Sci 42:192–5.
Renquist BJ, Oltjen JW, Sween ML, et al. 2007. Efficacy of a new sustained-release intraruminal selenium bolus. Bovine Pr 41(2):134–7.
Salles MSV, Zanetti MA, Roma LC, et al. 2014. Performance and immune response of suckling calves fed organic selenium. Anim Feed Sci Technol 188(1):28–35.
Spears JW, Harvey RW, Segerson EC. 1986. Effects of marginal selenium deficiency and winter protein supple-mentation on growth, reproduction and selenium status of beef cattle. J Anim Sci 63(2):586–94.
Sprinkle JE, Cuneo SP, Frederick HM, et al. 2006. Effects of a long-acting, trace mineral, reticulorumen bolus on range cow productivity and trace mineral profiles. J Anim Sci 84(6):1439–53.
StatPoint Technologies Inc. 2009. Statgraphics Centurion XVI user manual.
Swecker WS Jr, Hunter KH, Shanklin RK, et al. 2008. Parenteral selenium and vitamin E supplementation of weaned beef calves. J Vet Intern Med 22(2):443–9.
[USDA] United States Department of Agriculture Natural Resources Conservation Service. 2014. Web soil survey. http://websoilsurvey.sc.egov.usda.gov/App/HomePage.htm (accessed Apr. 24, 2014).
Williams JD. 1980. A survey into selenium deficiency in cattle in Northern California. Master of Preventative Medicine Thesis. University of California, Davis. 55 p.
Larr
y Fo
rero
http://calag.ucanr.edu • OCTOBER–DECEMBER 2016 193