efficiency and productivity of commercial banks in nepal
TRANSCRIPT

Asian Journal of Finance & Accounting ISSN 1946-052X
2013, Vol. 5, No. 2
www.macrothink.org/ajfa 220
Efficiency and Productivity of Commercial Banks in
Nepal: A Malmquist Index Approach
Biwesh Neupane
Research and Investment Department, Kriti Captial & Investments Ltd.
Mathuri Sadan, Ravibhawan, Kathmandu, Nepal
Tel: 977-01-427-6786, 977-01-428-1776 E-mail: [email protected]
Received: Sep. 26, 2013 Accepted: November 13, 2013 Published: December 1, 2013
doi:10.5296/ajfa.v5i2.4326 URL: http://dx.doi.org/10.5296/ajfa.v5i2.4326
Abstract
This study investigates the change in efficiency and productivity of banking industry during the period of 2007/08 to 2011/12 and analyzes the effects of various indicators on the efficiency of the twenty two commercial banks in Nepal. Malmquist Index is used as to measure the efficiency and productivity where as Tobit regression is used as to analyze the determinants of efficiency. Overall, the results show that the productivity change of commercial banks in Nepal has improved over the sample period and that the increase in productivity change in Nepalese commercial banks is due to the technical progress rather than efficiency components. It also reports that the decline in efficiency change is due to decline in both pure efficiency change and scale efficiency change. The Tobit regression model found positive relationship between debt to equity ratio and efficiency as well as between capital adequacy and efficiency. Further, profitable banks with lower leverage and higher capital adequacy ratio are found to be more efficient and bank loans seem to be more highly valued than alternative bank outputs i.e., investments and securities.
Keywords: Efficiency, Productivity, Commercial Banks, Nepal, Malmquist Index, Technical Efficiency, Scale Efficiency
Asian Journal of Finance & Accounting ISSN 1946-052X
2013, Vol. 5, No. 2
www.macrothink.org/ajfa 221
1. Introduction
Banking and Finance sector is one of the important pillar for the economic development of any country. Commercial banks, one of the major components of banking system, have to be efficient as it links the various economic activities such as agriculture, trade, industry, energy and service with the economic development. Banks need to be efficient not only for the greater goal of economic growth but also for survival against its competitors. With the growth in banking activities, the efficiency has been the growing concern of commercial banks in order to remain competitive. Due to the importance of the financial sector and its impact to the whole economy, financial sector development study and efficiency analysis is necessary. The efficiency of financial institutions has been widely and extensively studied in the last few decades. For financial institutions, efficiency implies improved profitability, greater amount of funds channeled in, better prices and services quality for consumers and greater safety in terms of improved capital buffer in absorbing risk (Berger et al. 1993).
The mostly used measures for evaluating banks in Nepalese context include various financial ratio measures, which provide the tools for managing information in order to analyze the financial condition and performance of a bank. The most commonly used financial ratios, such as Return on Shareholders’ Equity (ROE), Return on Assets (ROA), Profit Margin (PM), Net Interest Margin (NIM), Cash Reserve Ratio (CRR) and Earnings per Share (EPS), are used to characterize the performance of banks and are also presented in the annual reports of banks. The fundamental limitation of traditional ratio analysis is that the choice of a single ratio does not provide enough information about the various dimensions of the performance of a bank.
The aim of this paper is to evaluate efficiency of commercial banks in Nepal. In general there are two basic approaches that estimate efficiency, the parametric and the non-parametric ones. The parametric methods require explicit assumptions about the function that convert inputs into outputs and about the distribution of the error terms. On the other hand the non parametric methods (including Data Envelopment analysis (DEA) and Malmquist Index (MI)) do not require functional form. It requires only the necessary data, inputs and outputs. Due to the advantages of non parametric methods, in recent years MI has gained researchers’ and managers’ interest. The method is used to estimate the relative efficiency of homogenous decision making units such as hospitals, public institutions, banks, financial institutions, schools, farms etc.
In this paper, we make use of Malmquist Index (MI) to analyze the efficiency of commercial banks in Nepal during the period 2007/08 to 2011/12 and also perform Tobit regression model to analyze the effects of various indicators on the efficiency of the commercial banks in Nepal. The sample includes twenty two established commercial banks in Nepal. Using MI index first the efficiency measures under Constant Return to Scale and Variable Return to Scale assumption is reported. The efficiency suggested that 5 out of 22 banks were consistently efficient under both assumptions. 4 out of 22 banks were least efficient under both assumptions. Then, the Malmquist productivity change and its two components for four years are reported. It showed that the positive productivity change was due to technical

Asian Journal of Finance & Accounting ISSN 1946-052X
2013, Vol. 5, No. 2
www.macrothink.org/ajfa 222
progress rather than efficiency change. The Tobit regression model found positive relationship between profitability, leverage, and capital fund to risk weighted assets and efficiency. In Nepalese banking sector profitable bank with high low leverage and higher risk weighted are found to be more efficient and bank loans seem to be more highly valued than alternative bank outputs i.e., investment and securities.
The remainder of the paper is organized as follows. Section 2 introduces the banking sector in Nepal and Section 3 reviews the related literature. Section 4 presents sample data and methodology used for the paper. In section 5, empirical evidence is presented and conclusion is presented in section 6.
2. Banking Sector in Nepal
Banking sector has undergone tremendous changes and revolution over a period of more than seven decades. The whim of commercial bank started with the establishment of Nepal Bank Limited (NBL) in 1937, first commercial bank of Nepal and Nepal Rastra Bank (NRB), the central bank, nearly after two decades in 1956. The establishment of NBL and NRB is considered to be two major milestones in Nepalese banking sector (Maskay & Subedi, 2009). Third important milestone is the replacement of NRB Act 1955 by current Nepal Rastra Bank Act 2005 (Maskay & Subedi, 2009). A decade after the establishment of NRB, Rastriya Banijya Bank (RBB), a commercial bank under the ownership of the then His Majesty’s Government of Nepal (HMG/N) was established. With the adoption of financial sector liberalization, characterized by liberalization and deregulation of the interest rates, relaxation of entry barriers for domestic and foreign banks, restructuring of public sector commercial banks and withdrawal of central bank control over their portfolio management, new commercial banks from private sector entered into the playground. Consequently, the third commercial bank in Nepal, or the first foreign joint venture bank, was set up as Nepal Arab Bank Ltd (now called as NABIL Bank Ltd) in 1984. Table 1 shows the growth of financial institutions in terms of number of different financial institutions. Table 2 presents the first 10 commercial banks established in Nepal.
Table 1. Growth of Financial Institutions in Nepal
Types of Financial Institutions 1995 2000 2005 2006 2007 2008 2009 2010 2011 2012
Commercial Banks 10 13 17 18 20 25 26 27 31 32
Development Banks 3 7 26 28 38 58 63 79 87 88
Finance Companies 21 45 60 70 74 78 77 79 79 69
Micro-Finance/Development Banks 4 7 11 11 12 12 15 18 21 24
Savings and Credit Co-operatives 6 19 20 19 17 16 16 15 16 16
NGOs (Financial Intermediaries) 7 47 47 47 46 45 45 38 36
Total 44 98 181 193 208 235 242 263 272 265
Source: Nepal Rastra Bank (2012)

Asian Journal of Finance & Accounting ISSN 1946-052X
2013, Vol. 5, No. 2
www.macrothink.org/ajfa 223
Table 2. First 10 Commercial Banks established in Nepal
S.N. Name of Commercial Banks Date of Operation (A.D.)
1. Nepal Bank Limited 1937/11/15
2. Rastriya Banijya Bank 1966/01/23
3. Nabil Bank Limited 1984/07/16
4. Nepal Investment Bank Limited 1986/02/27
5. Standard Chartered Bank Nepal Limited 1987/01/30
6. Himalayan Bank Limited 1993/01/18
7. Nepal SBI Bank Limited 1993/07/07
8. Nepal Bangladesh Bank Limited 1993/06/05
9. Everest Bank Limited 1994/10/18
10. Bank of Kathmandu Limited 1995/03/12
Source: Nepal Rastra Bank (2012)
Many prominent authors agree to the fact that banks and financial institutions such as development banks, co-operatives, finance companies, merchant banks, and insurance companies directly and indirectly affect the economic development and are established all over the world to mobilize savings and invest into economy either directly and indirectly for production and generation of income and employment. With liberalization and increasing competition, the banking sector registered impressive achievement in terms of branch expansion, deposits, credit, and investment as shown in Table 3.
Table 3. Growth of Commercial Bank in terms of branches, deposits, credit and investment
Years
as of July Number of Bank Branches
In Units
Total Deposits
In Million Rs. Total Credit
In Million Rs. Total Investment
In Million Rs. 2001 430 181,767.00 109,121.20 25,446.50
2002 413 185,144.70 113,174.60 34,209.80
2003 447 203,879.30 124,522.40 45,386.30
2004 423 233,811.20 140,031.40 49,668.60
2005 422 232,409.80 163,718.80 60,181.10
2006 437 291,245.50 176,820.30 82,173.70
2007 440 337,497.20 231,829.50 93,530.80
2008 555 426,080.30 302,912.40 108,954.80
2009 752 563,604.40 398,143.00 130,856.90
2010 987 630,880.84 469,279.84 134,041.09
2011 1245 687,587.89 528,023.14 149,557.36
2012 1423 867,978.25 622,575.49 181,272.66
Source: Nepal Rastra Bank (2012)
Nepal’s commercial bank sector has grown at a rate of 15.29% with respect to deposits, 15.50% with respect to credit and 10.72% with respect to investments indicating increase in liquidity over the period of five years from 2007/08 to 2011/12. The commercial bank’s share of total
Asian Journal of Finance & Accounting ISSN 1946-052X
2013, Vol. 5, No. 2
www.macrothink.org/ajfa 224
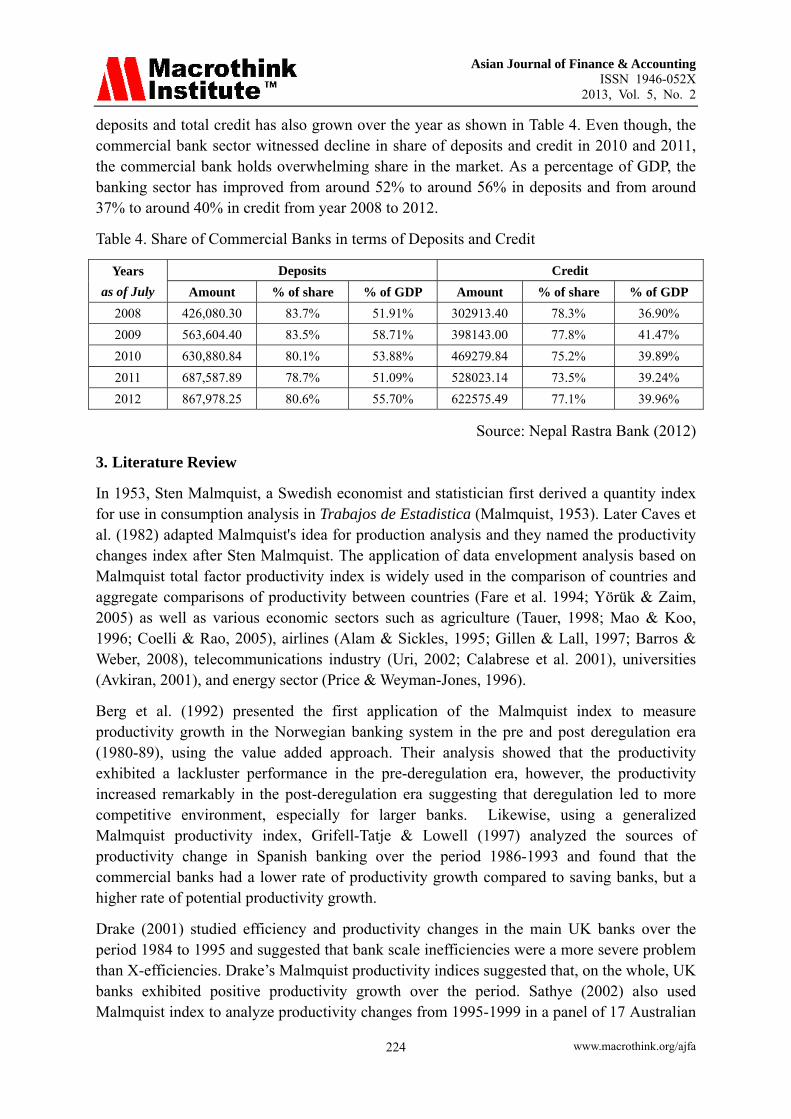
deposits and total credit has also grown over the year as shown in Table 4. Even though, the commercial bank sector witnessed decline in share of deposits and credit in 2010 and 2011, the commercial bank holds overwhelming share in the market. As a percentage of GDP, the banking sector has improved from around 52% to around 56% in deposits and from around 37% to around 40% in credit from year 2008 to 2012.
Table 4. Share of Commercial Banks in terms of Deposits and Credit
Years
as of July Deposits Credit
Amount % of share % of GDP Amount % of share % of GDP
2008 426,080.30 83.7% 51.91% 302913.40 78.3% 36.90%
2009 563,604.40 83.5% 58.71% 398143.00 77.8% 41.47%
2010 630,880.84 80.1% 53.88% 469279.84 75.2% 39.89%
2011 687,587.89 78.7% 51.09% 528023.14 73.5% 39.24%
2012 867,978.25 80.6% 55.70% 622575.49 77.1% 39.96%
Source: Nepal Rastra Bank (2012)
3. Literature Review
In 1953, Sten Malmquist, a Swedish economist and statistician first derived a quantity index for use in consumption analysis in Trabajos de Estadistica (Malmquist, 1953). Later Caves et al. (1982) adapted Malmquist's idea for production analysis and they named the productivity changes index after Sten Malmquist. The application of data envelopment analysis based on Malmquist total factor productivity index is widely used in the comparison of countries and aggregate comparisons of productivity between countries (Fare et al. 1994; Yörük & Zaim, 2005) as well as various economic sectors such as agriculture (Tauer, 1998; Mao & Koo, 1996; Coelli & Rao, 2005), airlines (Alam & Sickles, 1995; Gillen & Lall, 1997; Barros & Weber, 2008), telecommunications industry (Uri, 2002; Calabrese et al. 2001), universities (Avkiran, 2001), and energy sector (Price & Weyman-Jones, 1996).
Berg et al. (1992) presented the first application of the Malmquist index to measure productivity growth in the Norwegian banking system in the pre and post deregulation era (1980-89), using the value added approach. Their analysis showed that the productivity exhibited a lackluster performance in the pre-deregulation era, however, the productivity increased remarkably in the post-deregulation era suggesting that deregulation led to more competitive environment, especially for larger banks. Likewise, using a generalized Malmquist productivity index, Grifell-Tatje & Lowell (1997) analyzed the sources of productivity change in Spanish banking over the period 1986-1993 and found that the commercial banks had a lower rate of productivity growth compared to saving banks, but a higher rate of potential productivity growth.
Drake (2001) studied efficiency and productivity changes in the main UK banks over the period 1984 to 1995 and suggested that bank scale inefficiencies were a more severe problem than X-efficiencies. Drake’s Malmquist productivity indices suggested that, on the whole, UK banks exhibited positive productivity growth over the period. Sathye (2002) also used Malmquist index to analyze productivity changes from 1995-1999 in a panel of 17 Australian

Asian Journal of Finance & Accounting ISSN 1946-052X
2013, Vol. 5, No. 2
www.macrothink.org/ajfa 225
banks to assess the effects of deregulation and the reforms introduced by the Wallis report of 1997. Sathye (2002) found a decline of 3.1 per cent in technical efficiency over the period and of 3.5 per cent in the total factor productivity index, although annual productivity grew by 1.3 per cent. Likewise, Neal (2004) measured X-efficiency and productivity change of Australian banks for the period of 1995-1999. The findings displayed that overall efficiency had a declining trend until 1997 but rose in 1998 as well as 1999, and allocative efficiency of banks was higher than technical efficiency.
Handful of research has also been devoted to investigate the efficiency of banks in Asian countries. Bhattacharyya et al. (1997) examined the productive efficiency of Indian commercial banks during 1986-1991 and found a marginal increase in overall average performance after 1987 and the average efficiency of publicly owned banks is much higher than in the privately owned or foreign owned banks. Galagedera & Edirisuriya (2005) used data envelopment analysis and Malmquist Index in a sample of Indian commercial banks over the period of 1995-2002 and found no significant growth in productivity during the sample period. He found that there has been no growth in productivity in private sector banks where as the public sector banks appeared to demonstrate a modest positive change through 1995-2002. Sinha & Chatterjee (2008) tried to make a comparison of fund based operating performance and total factor productivity growth of selected Indian commercial banks for the five year period 2000-01 to 2004-05 using data envelopment analysis and Mamlquist total factor productivity index. The findings displayed that the mean technical efficiency of the in-sample private and foreign banks is somewhat higher than the in-sample public sector banks. However, in-sample public sector commercial banks exhibited higher Malmquist index than the in-sample private sector banks. Likewise, Rezvanian et al. (2008) also used Malmquist index to examine the effects of the ownership on efficiency, efficiency change, technological progress, and productivity growth of the Indian banking industry over the period of 1998-2003 They found that foreign banks were operating significantly more efficient than privately owned and publicly owned banks.
Chen et al. (2005) employed a non parametric technique to examine the change in the efficiency of 43 Chinese banks between 1993 and 2000 in response to the 1995 banking deregulation. They report that the efficiency of banks has declined from 1997 to 2000, indicating that the 1995 banking deregulation has had a positive impact on banking efficiency only in the beginning year of its implementation. Jeanneney et al. (2006) measured total productivity changes and its component of Chinese banks from 1993 to 2001 and found increment in total factor productivity. They reported productivity growth can be attributed mostly attributed to technical progress, rather than to improvement in efficiency. Ali Rizvi (2001) analyzed 37 scheduled commercial banks - 18 domestic and 19 foreign - operating in Pakistan and concluded that both efficiency and productivity have declined in the post-reforms period of 1993-98. Ahmed et al. (2009) measured the efficiency of 20 domestic commercial banks of Pakistan under intermediation approach and also reported decline in technical efficiency during pre-reform, phase I and phase II period of reforms. They found that banking reforms has shown a decline trend in efficiency (with a decrease of 8.2 percent).
In Nepalese context, Malmquist index has been used in few sectors such as energy (Jha et al.,

Asian Journal of Finance & Accounting ISSN 1946-052X
2013, Vol. 5, No. 2
www.macrothink.org/ajfa 226
2007), and agriculture (Suhariyanto & Thirtle, 2001). With regards to efficiency of banking sector in Nepal, Thagunna & Poudel (2013) used data envelopment analysis to measure and analyze efficiency levels of banks in Nepal during 2007-08 and 2010-11. The study reveals that efficiency level is relatively stable and has increased overall. They found that found that both the ownership type and the asset size of a bank don’t affect its efficiency.
4. Data and Methodology 4.1 Sample Data
Currently, there are 32 commercial banks operating in Nepal (including Agriculture Development Bank). The sample period for the study is between 2007/08 to 2011/12; hence, 7 banks that have started operation since 2009 have been excluded from the sample because of lack of comprehensive data. Out of 25 commercial banks, the sample also excludes Rastriya Banijya Bank (RBB) and Nepal Bank Limited (NBL) because of its huge assets size which may distort the result. Likewise, Agriculture Development Bank (ADBL) has also been excluded from the sample because of its ability to provide more loans than its deposits. For instance, ADBL provided on average 13% more than its deposits from the year 2007/08 to 2011/12. Hence, the sample comprises of a balanced panel of 22 established commercial banks from 2007/08 to 2001/12. Out of 22 sample banks, 6 Commercial Banks namely Nabil Bank Limited, Standard Chartered Bank Nepal Limited, Himalayan Bank Limited, Nepal SBI Bank Limited, Nepal Bangladesh Bank Limited, and Everest Bank Limited are joint venture bank. The list of sample commercial banks along with codes and other details are provided in Table 5.
Table 5. Sample Commercial Banks
S.N. Name of Bank Code Joint Venture with Foreign
Share (%)*
1. Nabil Bank Limited NABIL NB International, Ireland 50%
2. Nepal Investment Bank Limited NIBL
3. Standard Chartered Bank Nepal Limited SCBN Standard Chartered Grind Lays
Bank Ltd., Australia and UK
75%
4. Himalayan Bank Limited HBL Habib Bank Ltd., Pakistan 20%
5. Nepal SBI Bank Limited NSBI State Bank of India, India 55.05%
6. Nepal Bangladesh Bank Limited NBBL Bank Asia Limited, Bangladesh
IFIC Bank, Bangladesh
22.95%
7. Everest Bank Limited EBL Punjab National Bank, India 20%
8. Bank of Kathmandu Limited BOK
9. Nepal Credit and Commerce Bank Limited NCCB
10. NIC Bank Limited** NICB
11. Lumbini Bank Limited LBL
12. Machhapuchchhre Bank Limited MBL
13. Kumari Bank Limited KBL
14. Laxmi Bank Limited LAXL
15. Sidhhartha Bank Limited SBL
Asian Journal of Finance & Accounting ISSN 1946-052X
2013, Vol. 5, No. 2
www.macrothink.org/ajfa 227
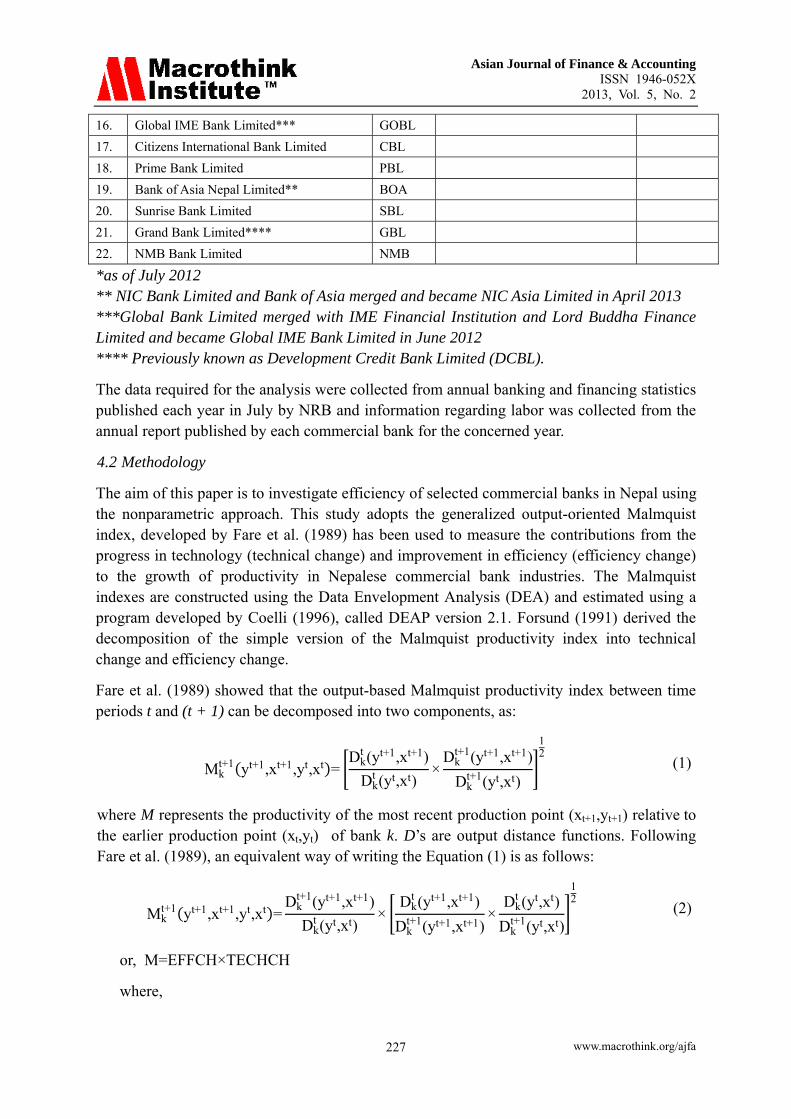
16. Global IME Bank Limited*** GOBL
17. Citizens International Bank Limited CBL
18. Prime Bank Limited PBL
19. Bank of Asia Nepal Limited** BOA
20. Sunrise Bank Limited SBL
21. Grand Bank Limited**** GBL
22. NMB Bank Limited NMB
*as of July 2012 ** NIC Bank Limited and Bank of Asia merged and became NIC Asia Limited in April 2013 ***Global Bank Limited merged with IME Financial Institution and Lord Buddha Finance Limited and became Global IME Bank Limited in June 2012 **** Previously known as Development Credit Bank Limited (DCBL).
The data required for the analysis were collected from annual banking and financing statistics published each year in July by NRB and information regarding labor was collected from the annual report published by each commercial bank for the concerned year.
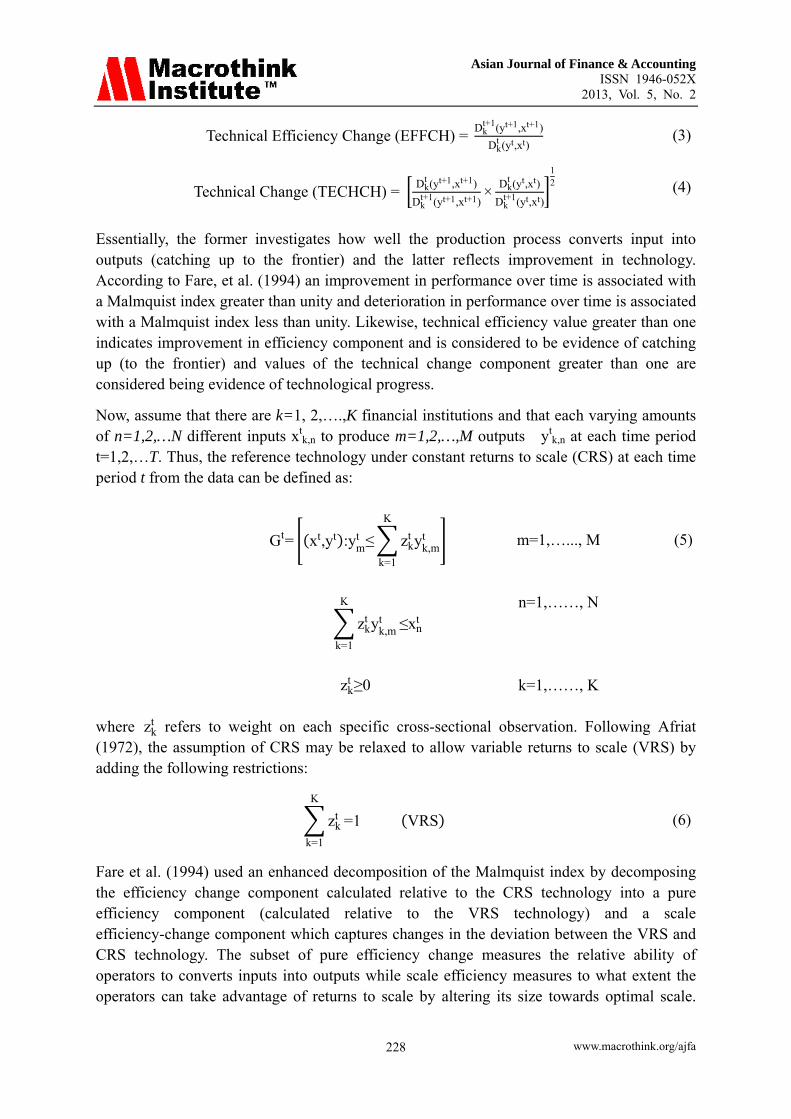
4.2 Methodology
The aim of this paper is to investigate efficiency of selected commercial banks in Nepal using the nonparametric approach. This study adopts the generalized output-oriented Malmquist index, developed by Fare et al. (1989) has been used to measure the contributions from the progress in technology (technical change) and improvement in efficiency (efficiency change) to the growth of productivity in Nepalese commercial bank industries. The Malmquist indexes are constructed using the Data Envelopment Analysis (DEA) and estimated using a program developed by Coelli (1996), called DEAP version 2.1. Forsund (1991) derived the decomposition of the simple version of the Malmquist productivity index into technical change and efficiency change.
Fare et al. (1989) showed that the output-based Malmquist productivity index between time periods t and (t + 1) can be decomposed into two components, as:
Mkt+1 yt+1,xt+1,yt,xt =
Dkt (yt+1,xt+1)
Dkt (yt,xt)
×Dk
t+1(yt+1,xt+1)
Dkt+1(yt,xt)
12
(1)
where M represents the productivity of the most recent production point (xt+1,yt+1) relative to the earlier production point (xt,yt) of bank k. D’s are output distance functions. Following Fare et al. (1989), an equivalent way of writing the Equation (1) is as follows:
Mkt+1 yt+1,xt+1,yt,xt =
Dkt+1(yt+1,xt+1)
Dkt (yt,xt)
×Dk
t (yt+1,xt+1)
Dkt+1(yt+1,xt+1)
×Dk
t (yt,xt)
Dkt+1(yt,xt)
12
(2)
or, M=EFFCH×TECHCH
where,
Asian Journal of Finance & Accounting ISSN 1946-052X
2013, Vol. 5, No. 2
www.macrothink.org/ajfa 228
Technical Efficiency Change (EFFCH) = Dk
t+1(yt+1,xt+1)
Dkt (yt,xt)
(3)
Technical Change (TECHCH) = Dk
t (yt+1,xt+1)
Dkt+1(yt+1,xt+1)
×Dk
t (yt,xt)
Dkt+1(yt,xt)
12 (4)
Essentially, the former investigates how well the production process converts input into outputs (catching up to the frontier) and the latter reflects improvement in technology. According to Fare, et al. (1994) an improvement in performance over time is associated with a Malmquist index greater than unity and deterioration in performance over time is associated with a Malmquist index less than unity. Likewise, technical efficiency value greater than one indicates improvement in efficiency component and is considered to be evidence of catching up (to the frontier) and values of the technical change component greater than one are considered being evidence of technological progress.
Now, assume that there are k=1, 2,….,K financial institutions and that each varying amounts of n=1,2,…N different inputs xt
k,n to produce m=1,2,…,M outputs ytk,n at each time period
t=1,2,…T. Thus, the reference technology under constant returns to scale (CRS) at each time period t from the data can be defined as:
Gt= xt,yt :ymt ≤ zk
t yk,mt
K
k=1
m=1,…..., M (5)
zkt yk,m
t
K
k=1
≤xnt
n=1,……, N
zkt ≥0 k=1,……, K
where zkt refers to weight on each specific cross-sectional observation. Following Afriat
(1972), the assumption of CRS may be relaxed to allow variable returns to scale (VRS) by adding the following restrictions:
zkt
K
k=1
=1 VRS (6)
Fare et al. (1994) used an enhanced decomposition of the Malmquist index by decomposing the efficiency change component calculated relative to the CRS technology into a pure efficiency component (calculated relative to the VRS technology) and a scale efficiency-change component which captures changes in the deviation between the VRS and CRS technology. The subset of pure efficiency change measures the relative ability of operators to converts inputs into outputs while scale efficiency measures to what extent the operators can take advantage of returns to scale by altering its size towards optimal scale.

Asian Journal of Finance & Accounting ISSN 1946-052X
2013, Vol. 5, No. 2
www.macrothink.org/ajfa 229
Thus,
Technical Efficiency Change (EFFCH) = PECH × SECH
where,
Pure Technical Efficiency Change PECH = Dv
t+1 xkt+1,yk
t+1
Dvt xk
t ,ykt
(7)
Scale Efficiency Change SECH = Dc
t+1 xkt+1,yk
t+1 Dvt+1 xk
t+1,ykt+1
Dct xk
t ,ykt Dv
t xkt ,yk
t (8)
The subscript ‘v’ and ‘c’ denotes VRS and CRS technologies, respectively. PECH greater than unity indicates increase in pure technical efficiency, while less than unity indicates a decrease and equal to unity indicates no change in pure technical efficiency. Similarly, SECH greater than unity indicates that the most efficient scale is increasing overtime, so the scale efficiency is improving, while SECH less than unity implies the opposite and equal to unity implies no change.
To construct the Malmquist index for adjacent periods, it is needed to calculate four different distance functions – Dt(yt, xt), Dt(yt+1, xt+1), Dt+1(yt, xt), Dt+1(yt+1, xt+1) . This paper uses Data Envelopment Analysis Program (DEAP v. 2.1) developed by Coelli (1996). With the help of Fare et al.’s (1994) approach and DEAP 2.1, it is thus possible to provide five efficiency indices for each firm and a measure of technical progress over time. These are (i) Productivity Change (TFPCH), (ii) Technological Change (TECHCH), (iii) Efficiency Change (EFFCH), (iv) Pure Technical Efficiency Change (PECH), and (v) Scale Efficiency Change (SECH).
4.3 Choice of proxies for output and input
The choice of input variables and output variables to measure the efficiency of commercial banks has been a debatable issue. Different literature supports different views regarding the input and output specifications. The choice depends on two different approaches used in banking studies namely, production approach and intermediation approach. Production approach considers banks as producers of loan services and deposits accounts using capital and labor as inputs. Under this approach, output is best measured by the number and type of transactions or documents processed over a given time period (Berger & Humphrey, 1997). However, such data are typically not available. The intermediation approach considers banks as financial intermediaries that convert deposits and purchased funds into loans and financial investments. This approach treats loans as outputs, while deposits and other liabilities are treated as inputs. This study also uses intermediation approach, which is mostly commonly used approach.
The study specifies three output and three input variables. First output variable is loans and advances which include loans to private sectors, financial institutions and government organizations. Second output variable is total investments which include investments in
Asian Journal of Finance & Accounting ISSN 1946-052X
2013, Vol. 5, No. 2
www.macrothink.org/ajfa 230
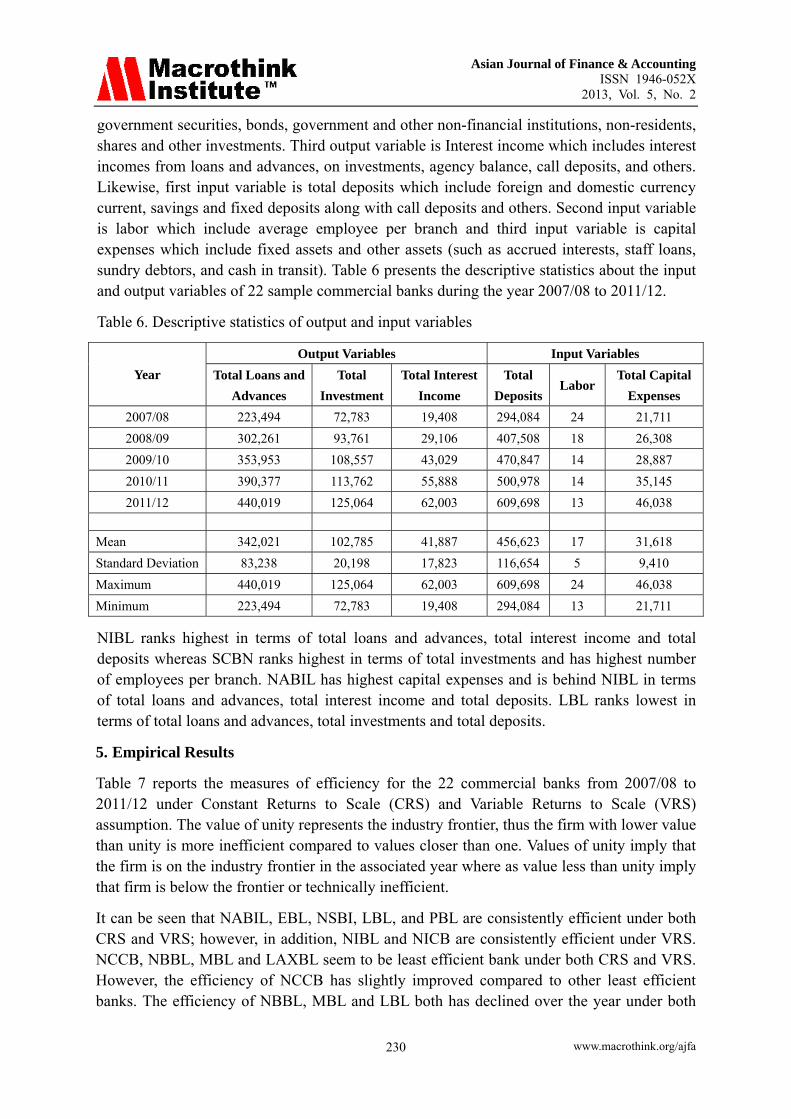
government securities, bonds, government and other non-financial institutions, non-residents, shares and other investments. Third output variable is Interest income which includes interest incomes from loans and advances, on investments, agency balance, call deposits, and others. Likewise, first input variable is total deposits which include foreign and domestic currency current, savings and fixed deposits along with call deposits and others. Second input variable is labor which include average employee per branch and third input variable is capital expenses which include fixed assets and other assets (such as accrued interests, staff loans, sundry debtors, and cash in transit). Table 6 presents the descriptive statistics about the input and output variables of 22 sample commercial banks during the year 2007/08 to 2011/12.
Table 6. Descriptive statistics of output and input variables
Year
Output Variables Input Variables
Total Loans and
Advances
Total
Investment
Total Interest
Income
Total
DepositsLabor
Total Capital
Expenses
2007/08 223,494 72,783 19,408 294,084 24 21,711
2008/09 302,261 93,761 29,106 407,508 18 26,308
2009/10 353,953 108,557 43,029 470,847 14 28,887
2010/11 390,377 113,762 55,888 500,978 14 35,145
2011/12 440,019 125,064 62,003 609,698 13 46,038
Mean 342,021 102,785 41,887 456,623 17 31,618
Standard Deviation 83,238 20,198 17,823 116,654 5 9,410
Maximum 440,019 125,064 62,003 609,698 24 46,038
Minimum 223,494 72,783 19,408 294,084 13 21,711
NIBL ranks highest in terms of total loans and advances, total interest income and total deposits whereas SCBN ranks highest in terms of total investments and has highest number of employees per branch. NABIL has highest capital expenses and is behind NIBL in terms of total loans and advances, total interest income and total deposits. LBL ranks lowest in terms of total loans and advances, total investments and total deposits.
5. Empirical Results
Table 7 reports the measures of efficiency for the 22 commercial banks from 2007/08 to 2011/12 under Constant Returns to Scale (CRS) and Variable Returns to Scale (VRS) assumption. The value of unity represents the industry frontier, thus the firm with lower value than unity is more inefficient compared to values closer than one. Values of unity imply that the firm is on the industry frontier in the associated year where as value less than unity imply that firm is below the frontier or technically inefficient.
It can be seen that NABIL, EBL, NSBI, LBL, and PBL are consistently efficient under both CRS and VRS; however, in addition, NIBL and NICB are consistently efficient under VRS. NCCB, NBBL, MBL and LAXBL seem to be least efficient bank under both CRS and VRS. However, the efficiency of NCCB has slightly improved compared to other least efficient banks. The efficiency of NBBL, MBL and LBL both has declined over the year under both

Asian Journal of Finance & Accounting ISSN 1946-052X
2013, Vol. 5, No. 2
www.macrothink.org/ajfa 231
CRS and VRS.
GOBL, SBL and CBL seem to be improving its performance over the years, GOBL witnessing greater growth in efficiency but SBL is more efficient. NMB lost its efficiency in between but recovered efficiency strongly during the adverse period. Surprisingly, the efficiency of HBL, BOK and KBL has declined slightly over the period but are still efficient compared to other banks. GBL, SCBN, and GBL are in the industry frontier till 2010/11 but witnessed slight decline in efficiency in the year 2011/12.
Table 7. Efficiency of Commercial Banks, 2007-08 to 2011/12 (CRS)
Bank Code CRS VRS
2007/08 2008/09 2009/10 2010/11 2011/12 2007/08 2008/09 2009/10 2010/11 2011/12
NABIL 1.000 1.000 1.000 1.000 1.000 1.000 1.000 1.000 1.000 1.000
NIBL 0.951 1.000 1.000 0.984 0.946 1.000 1.000 1.000 1.000 1.000
SCBN 1.000 1.000 1.000 1.000 0.963 1.000 1.000 1.000 1.000 0.970
HBL 1.000 0.901 0.974 0.931 0.911 1.000 0.983 0.989 0.956 0.995
NSBI 1.000 1.000 1.000 1.000 1.000 1.000 1.000 1.000 1.000 1.000
NBBL 0.828 0.972 0.974 0.930 0.836 0.835 0.988 0.988 0.936 0.872
EBL 1.000 1.000 1.000 1.000 1.000 1.000 1.000 1.000 1.000 1.000
BOK 1.000 0.965 0.973 0.956 0.981 1.000 0.981 0.973 0.968 0.984
NCCB 0.882 0.867 0.849 0.891 0.939 0.951 0.895 0.861 0.891 0.955
NICB 1.000 1.000 1.000 1.000 0.982 1.000 1.000 1.000 1.000 1.000
LBL 1.000 1.000 1.000 1.000 1.000 1.000 1.000 1.000 1.000 1.000
MBL 0.880 0.931 0.942 0.972 0.814 0.899 0.954 0.942 0.982 0.826
KBL 1.000 1.000 0.993 0.991 0.890 1.000 1.000 1.000 1.000 0.910
LAXBL 0.977 0.955 0.907 0.903 0.858 0.980 1.000 0.942 0.945 0.864
SBL 1.000 0.929 1.000 1.000 0.995 1.000 0.938 1.000 1.000 1.000
GOBL 0.767 0.933 0.901 1.000 0.907 0.782 0.948 0.908 1.000 0.927
CBL 0.950 0.840 0.979 1.000 0.916 1.000 0.988 1.000 1.000 1.000
PBL 1.000 1.000 1.000 1.000 1.000 1.000 1.000 1.000 1.000 1.000
BOA 1.000 1.000 1.000 1.000 0.982 1.000 1.000 1.000 1.000 0.983
SBL 0.953 0.813 0.966 1.000 1.000 0.953 0.834 1.000 1.000 1.000
GBL 1.000 1.000 1.000 1.000 0.970 1.000 1.000 1.000 1.000 0.978
NMB 1.000 0.836 0.907 0.982 1.000 1.000 1.000 0.950 1.000 1.000
Mean 0.963 0.952 0.971 0.979 0.950 0.973 0.978 0.980 0.985 0.967
The mean is the geometric mean of the efficiency in the particular year. The mean shows that the efficiency has increased till 2010/11, however, 2011/12 witnessed decline in the efficiency. In fact, the efficiency is lowest in 2011/12 compared to other years. This shows that the performance of commercial banks was not satisfactory compared to previous years in 2012 which can be attributed to various externalities such as adverse political situation, liquidity crunch, tight regulatory measures by NRB among others. It can also be seen that 7 out of 22 commercial banks were in industry frontier (CRS) in 2011/12 compared to 13 out of 22 in 2010/11 (CRS).

Asian Journal of Finance & Accounting ISSN 1946-052X
2013, Vol. 5, No. 2
www.macrothink.org/ajfa 232
Table 8 reports the Malmquist productivity changes (TFPCH) over two years and Table 9 and Table 10 presents the two components of productivity change. The table shows that on average NSBI witnessed 22.6% growth in its productivity over 5 years. The highest growth achievers were EBL, NIBL, NABIL, SBL, LBL and CBL, all with double digit growth. NICB, GBL and NMB witnessed decline in productivity. Overall, the mean growth rate of the industry is around 5.6% for the year 2007/08 to 2011/12; however, the productivity change has declined largely in the year 2011/12. The productivity change can be further decomposed into technical change and efficiency change as shown in Table 9 and Table 10 respectively.
Table 8. Bank’s relative Malmquist Productivity Change (TFPCH) between time period t and t+1, 2007/08 to 20011/12
Bank Code 2007/08 - 2008/09 2008/09-2009/10 2009/10-2010/11 2010/11-2011/12 Mean
NABIL 1.225 1.236 1.193 1.084 1.1845
NIBL 1.253 1.208 1.073 0.939 1.1183
SCBN 1.161 1.111 0.855 0.935 1.0155
HBL 0.995 1.154 1.030 0.953 1.0330
NSBI 1.542 1.109 1.122 1.130 1.2258
NBBL 1.355 1.040 0.987 0.814 1.0490
EBL 1.222 1.394 1.213 0.987 1.2040
BOK 1.140 1.168 1.039 0.964 1.0778
NCCB 1.033 1.002 1.090 0.939 1.0160
NICB 0.960 0.987 1.020 0.881 0.9620
LBL 1.152 1.629 0.684 0.918 1.0958
MBL 1.090 1.095 1.097 0.860 1.0355
KBL 1.223 1.219 1.033 0.869 1.0860
LAXBL 1.056 1.057 1.024 0.870 1.0018
SBL 1.012 1.335 1.129 0.965 1.1103
GOBL 1.220 1.094 1.133 0.836 1.0708
CBL 1.064 1.448 1.070 0.885 1.1168
PBL 1.084 1.211 1.271 0.738 1.0760
BOA 1.226 1.119 0.989 0.893 1.0568
SBL 0.812 1.295 1.103 0.985 1.0488
GBL 0.861 0.995 1.052 0.839 0.9368
NMB 0.637 1.071 1.098 0.882 0.9220
Mean 1.088 1.171 1.052 0.913 1.0560
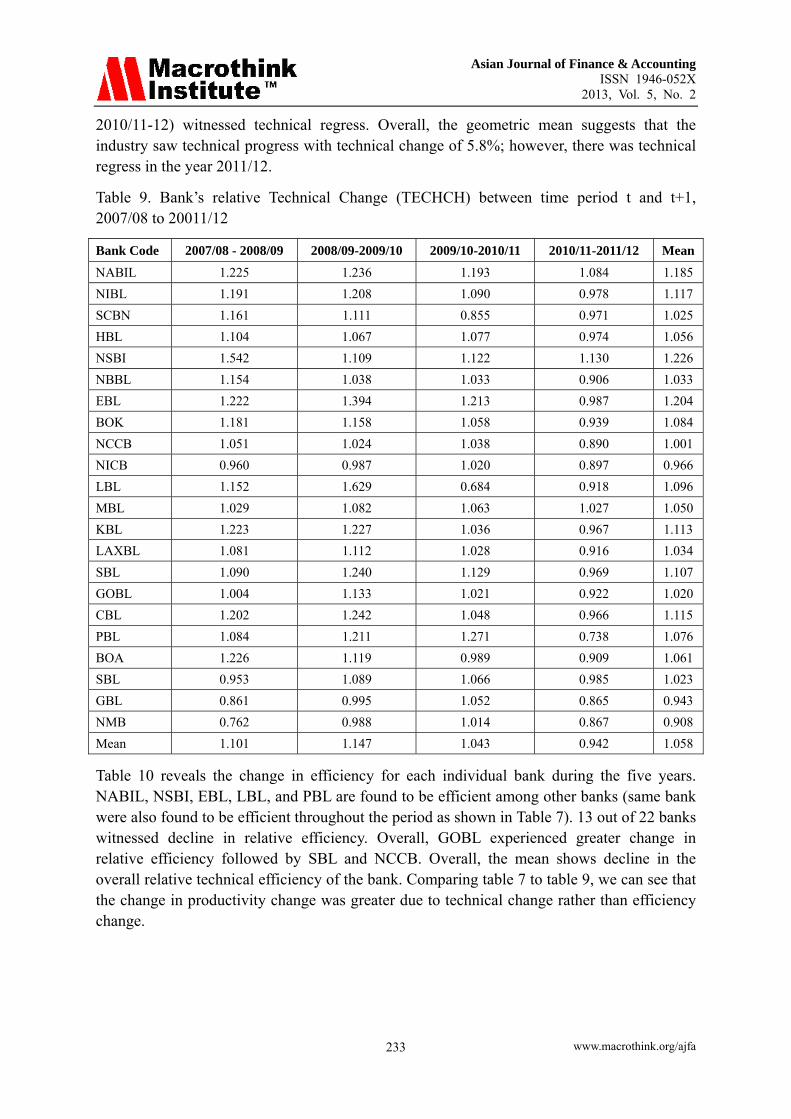
Table 9 presents the index values of technical change (regress/progress) as measured by average shifts in the best practice frontier. The table shows that only NABIL, NSBI and MBL experienced technical progress from 2007/08 to 2010/12 while others experienced both technical progress and regress in some years. NICB, GBL and NMB witnessed technical regress where as NSBI recorded highest technical progress followed by EBL, NABIL, NIBL, CBL, SBL, LAXBL, and LBL (with double digit technical progress). 4 out of 22 (in 2007/08-09), 3 out of 22 (2008/09-10), 2 out of 22 (in 2009/10-11), and 19 out of 22 (in
Asian Journal of Finance & Accounting ISSN 1946-052X
2013, Vol. 5, No. 2
www.macrothink.org/ajfa 233
2010/11-12) witnessed technical regress. Overall, the geometric mean suggests that the industry saw technical progress with technical change of 5.8%; however, there was technical regress in the year 2011/12.
Table 9. Bank’s relative Technical Change (TECHCH) between time period t and t+1, 2007/08 to 20011/12
Bank Code 2007/08 - 2008/09 2008/09-2009/10 2009/10-2010/11 2010/11-2011/12 Mean
NABIL 1.225 1.236 1.193 1.084 1.185
NIBL 1.191 1.208 1.090 0.978 1.117
SCBN 1.161 1.111 0.855 0.971 1.025
HBL 1.104 1.067 1.077 0.974 1.056
NSBI 1.542 1.109 1.122 1.130 1.226
NBBL 1.154 1.038 1.033 0.906 1.033
EBL 1.222 1.394 1.213 0.987 1.204
BOK 1.181 1.158 1.058 0.939 1.084
NCCB 1.051 1.024 1.038 0.890 1.001
NICB 0.960 0.987 1.020 0.897 0.966
LBL 1.152 1.629 0.684 0.918 1.096
MBL 1.029 1.082 1.063 1.027 1.050
KBL 1.223 1.227 1.036 0.967 1.113
LAXBL 1.081 1.112 1.028 0.916 1.034
SBL 1.090 1.240 1.129 0.969 1.107
GOBL 1.004 1.133 1.021 0.922 1.020
CBL 1.202 1.242 1.048 0.966 1.115
PBL 1.084 1.211 1.271 0.738 1.076
BOA 1.226 1.119 0.989 0.909 1.061
SBL 0.953 1.089 1.066 0.985 1.023
GBL 0.861 0.995 1.052 0.865 0.943
NMB 0.762 0.988 1.014 0.867 0.908
Mean 1.101 1.147 1.043 0.942 1.058
Table 10 reveals the change in efficiency for each individual bank during the five years. NABIL, NSBI, EBL, LBL, and PBL are found to be efficient among other banks (same bank were also found to be efficient throughout the period as shown in Table 7). 13 out of 22 banks witnessed decline in relative efficiency. Overall, GOBL experienced greater change in relative efficiency followed by SBL and NCCB. Overall, the mean shows decline in the overall relative technical efficiency of the bank. Comparing table 7 to table 9, we can see that the change in productivity change was greater due to technical change rather than efficiency change.

Asian Journal of Finance & Accounting ISSN 1946-052X
2013, Vol. 5, No. 2
www.macrothink.org/ajfa 234
Table 10. Bank’s relative Efficiency (EFFCH) between time period t and t+1, 2007/08 to 20011/12
Bank Code 2007/08 - 2008/09 2008/09-2009/10 2009/10-2010/11 2010/11-2011/12
NABIL 1.000 1.000 1.000 1.000
NIBL 1.051 1.000 0.984 0.961
SCBN 1.000 1.000 1.000 0.963
HBL 0.901 1.081 0.956 0.978
NSBI 1.000 1.000 1.000 1.000
NBBL 1.174 1.002 0.955 0.898
EBL 1.000 1.000 1.000 1.000
BOK 0.965 1.008 0.982 1.027
NCCB 0.983 0.979 1.049 1.055
NICB 1.000 1.000 1.000 0.982
LBL 1.000 1.000 1.000 1.000
MBL 1.059 1.011 1.032 0.838
KBL 1.000 0.993 0.998 0.898
LAXBL 0.977 0.950 0.997 0.950
SBL 0.929 1.077 1.000 0.995
GOBL 1.216 0.966 1.110 0.907
CBL 0.885 1.166 1.021 0.916
PBL 1.000 1.000 1.000 1.000
BOA 1.000 1.000 1.000 0.982
SBL 0.853 1.189 1.035 1.000
GBL 1.000 1.000 1.000 0.970
NMB 0.836 1.084 1.083 1.018
Mean 0.989 1.021 1.009 0.969
Table 11 shows the decomposition of efficiency into pure technical efficiency change (PECH) and Scale Efficiency Change (SECH). The table indicates mixed results in different year. The efficiency could be attributed more to the pure technical efficiency change in the year 2007/08-09 and 2009/10-11 where as the efficiency change to the scale efficiency change in the year 2008/09-10 to 2010/11-12. NABIL, NSBI, EBL, LBL and PBL show no change in pure technical efficiency as well as scale efficiency throughout the sample period.

Asian Journal of Finance & Accounting ISSN 1946-052X
2013, Vol. 5, No. 2
www.macrothink.org/ajfa 235
Table 11. Changes in Efficiency Components (Pure Technical Efficiency Change and Scale Efficiency Change) by Banks between Time Period t and t + 1, 2007/08 to 20011/12
Bank Code 2007/08 - 2008/09 2008/09-2009/10 2009/10-2010/11 2010/11-2011/12
PECH SECH PECH SECH PECH SECH PECH SECH
NABIL 1.000 1.000 1.000 1.000 1.000 1.000 1.000 1.000
NIBL 1.000 1.051 1.000 1.000 1.000 0.984 1.000 0.961
SCBN 1.000 1.000 1.000 1.000 1.000 1.000 0.970 0.993
HBL 0.983 0.917 1.006 1.074 0.967 0.989 1.041 0.939
NSBI 1.000 1.000 1.000 1.000 1.000 1.000 1.000 1.000
NBBL 1.182 0.993 1.001 1.001 0.947 1.008 0.932 0.964
EBL 1.000 1.000 1.000 1.000 1.000 1.000 1.000 1.000
BOK 0.981 0.985 0.993 1.016 0.995 0.987 1.016 1.010
NCCB 0.941 1.044 0.961 1.018 1.035 1.014 1.072 0.984
NICB 1.000 1.000 1.000 1.000 1.000 1.000 1.000 0.982
LAXBL 1.000 1.000 1.000 1.000 1.000 1.000 1.000 1.000
MBL 1.062 0.997 0.987 1.024 1.042 0.990 0.841 0.996
KBL 1.000 1.000 1.000 0.993 1.000 0.998 0.910 0.987
LBL 1.021 0.958 0.942 1.008 1.003 0.993 0.915 1.038
SBL 0.938 0.990 1.066 1.010 1.000 1.000 1.000 0.995
GOBL 1.213 1.002 0.957 1.009 1.102 1.008 0.927 0.979
CBL 0.988 0.895 1.012 1.152 1.000 1.021 1.000 0.916
PBL 1.000 1.000 1.000 1.000 1.000 1.000 1.000 1.000
BOA 1.000 1.000 1.000 1.000 1.000 1.000 0.983 1.000
SBL 0.875 0.974 1.199 0.992 1.000 1.035 1.000 1.000
GBL 1.000 1.000 1.000 1.000 1.000 1.000 0.978 0.991
NMB 1.000 0.836 0.950 1.142 1.053 1.028 1.000 1.018
Mean 1.006 0.983 1.002 1.019 1.006 1.002 0.980 0.988
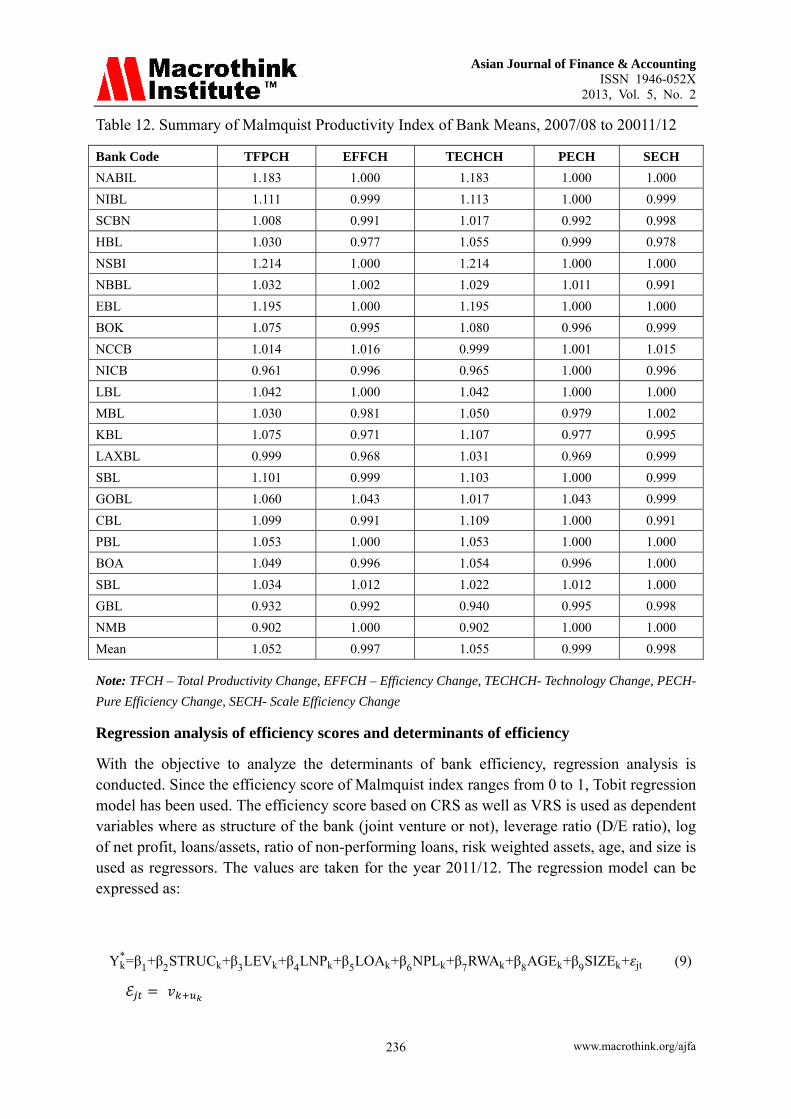
Table 12 summarizes the Malmquist Productivity Index of 22 commercial banks in Nepal between 2007/08-2011/12. On average, NSBI records highest growth in productivity change which is fully due to technical change rather than efficiency change. NMB bank reports the lower growth in productivity change which can be again fully attributed to technical regress (-9.8%). Overall the change in productivity of is mainly due to technical progress (5.5%) but efficiency change contributed negatively (-0.03%) to the total productivity change. Furthermore, the decline in efficiency change is due to decline in both pure efficiency change and scale efficiency change. Unlike Omar et al. (2006), who concluded that an increase in productivity change (TFPCH) in Malaysia's commercial banks industry is due to the innovation in efficiency components rather than the improvement in technical aspect, it can be concluded that the increase in productivity change in Nepalese commercial banks industry is due to the technical progress rather than efficiency components.
Asian Journal of Finance & Accounting ISSN 1946-052X
2013, Vol. 5, No. 2
www.macrothink.org/ajfa 236
Table 12. Summary of Malmquist Productivity Index of Bank Means, 2007/08 to 20011/12
Bank Code TFPCH EFFCH TECHCH PECH SECH
NABIL 1.183 1.000 1.183 1.000 1.000
NIBL 1.111 0.999 1.113 1.000 0.999
SCBN 1.008 0.991 1.017 0.992 0.998
HBL 1.030 0.977 1.055 0.999 0.978
NSBI 1.214 1.000 1.214 1.000 1.000
NBBL 1.032 1.002 1.029 1.011 0.991
EBL 1.195 1.000 1.195 1.000 1.000
BOK 1.075 0.995 1.080 0.996 0.999
NCCB 1.014 1.016 0.999 1.001 1.015
NICB 0.961 0.996 0.965 1.000 0.996
LBL 1.042 1.000 1.042 1.000 1.000
MBL 1.030 0.981 1.050 0.979 1.002
KBL 1.075 0.971 1.107 0.977 0.995
LAXBL 0.999 0.968 1.031 0.969 0.999
SBL 1.101 0.999 1.103 1.000 0.999
GOBL 1.060 1.043 1.017 1.043 0.999
CBL 1.099 0.991 1.109 1.000 0.991
PBL 1.053 1.000 1.053 1.000 1.000
BOA 1.049 0.996 1.054 0.996 1.000
SBL 1.034 1.012 1.022 1.012 1.000
GBL 0.932 0.992 0.940 0.995 0.998
NMB 0.902 1.000 0.902 1.000 1.000
Mean 1.052 0.997 1.055 0.999 0.998
Note: TFCH – Total Productivity Change, EFFCH – Efficiency Change, TECHCH- Technology Change, PECH-
Pure Efficiency Change, SECH- Scale Efficiency Change
Regression analysis of efficiency scores and determinants of efficiency
With the objective to analyze the determinants of bank efficiency, regression analysis is conducted. Since the efficiency score of Malmquist index ranges from 0 to 1, Tobit regression model has been used. The efficiency score based on CRS as well as VRS is used as dependent variables where as structure of the bank (joint venture or not), leverage ratio (D/E ratio), log of net profit, loans/assets, ratio of non-performing loans, risk weighted assets, age, and size is used as regressors. The values are taken for the year 2011/12. The regression model can be expressed as:
Yk*=β1+β2STRUCk+β3LEVk+β4LNPk+β5LOAk+β6NPLk+β7RWAk+β8AGEk+β9SIZEk+ jt (9)ℰ =
Asian Journal of Finance & Accounting ISSN 1946-052X
2013, Vol. 5, No. 2
www.macrothink.org/ajfa 237
In the equation (7), Y* is the latent variable which is efficiency based on CRS and VRS, is the coefficient, STRUCk is the dummy variable which takes the value 0 if the bank is foreign joint venture and 1 if not, LEVk is the leverage ratio, LNPk is the log of the net profit, LOAk is the percentage of loan to total assets, NPLk is the percentage of non-performing loans, RWAk is the percentage of capital fund to risk weighted assets, AGEk is the number of years bank is in operation, and SIZEk (used as control variable) is the log of assets for each bank k. ℰ is the disturbance term, with capturing the unobserved bank specific effects and is the idiosyncratic error and is independently identically distributed (i.i.d), ek~N(0,σ2).
Commercial banks with foreign joint venture are expected to be more efficient than other commercial banks; hence, the coefficient of STRUC is expected to be negative. The LEV ratio (defined as debt by equity ratio) is used as to measure the leverage of commercial banks. The variable is expected to take a positive sign and associated with higher efficiency as banks with appropriate leverage ratio can earn better from the debt portion. Deposits have been taken as proxy for debt and paid up capital (with reserves and retained earnings) has been used as proxy for equity. Log of net profit (LNP) is used as to measure the relationship between the efficiency and profitability. It is expected to have positive relation with the efficiency. LOA is used as a proxy for liquidity risk; hence, one would expect to have positive relationship between liquidity and performance (Bourke, 1989). Non-performing loan as a percentage of total loans (NPL) is used as a proxy of credit risk. The coefficient of non-performing loans is expected to be negative as bad loans have regressive impact on bank’s profitability. Capital fund to risk weighted assets (RWA) is used as a proxy of bank’s exposure to potential losses. The coefficient of RWA is also expected to be positive as bank with higher capital fund to RWA are able to withstand higher potential losses but it may also yield negative coefficient since greater capital fund to RWA gives up financial leverage which may yield to lower interest margins and return on equity. Likewise, AGE is used as a proxy for management expertise as greater year of operation means better understanding of competition, market condition and higher goodwill. It is generally expected that commercial banks become more efficient with higher years of operation. Finally, SIZE as a log of assets is used as control variable in the analysis. The coefficient of SIZE may be positive if banks are able to achieve economies of scale, however, the coefficient of SIZE may also be negative if the banks has higher risks due to higher diversification of assets.
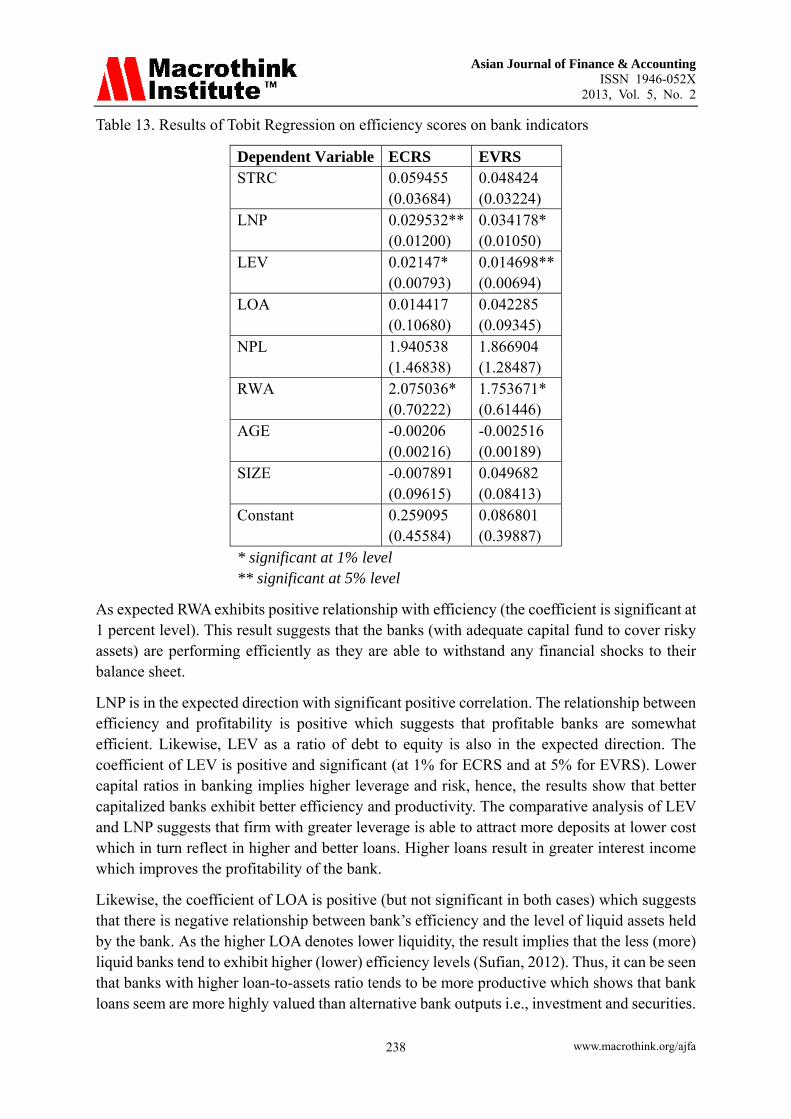
The result of Tobit regression is presented in Table 13. The table reveals that the coefficient of AGE of the commercial banks and STRC as a dummy variable for foreign joint venture is in unexpected direction and the coefficient is also not significant. It is surprising result considering the fact that the foreign joint venture and old banks are considered to be more efficient. Likewise, the coefficient of NPL is positive but also insignificant under both CRS and VRS technology which is similar to the results reported by Sufian (2012). The result is close to what is called skimping hypothesis. Berger and De Young (1997) suggests that under the skimping hypothesis, a bank maximizing the long run profits may rationally choose to have lower costs in the short run by skimping on the resources devoted to loans underwriting and monitoring, but bear the consequences of greater loans performance problem.
Asian Journal of Finance & Accounting ISSN 1946-052X
2013, Vol. 5, No. 2
www.macrothink.org/ajfa 238
Table 13. Results of Tobit Regression on efficiency scores on bank indicators
Dependent Variable ECRS EVRS STRC 0.059455 0.048424
(0.03684) (0.03224) LNP 0.029532** 0.034178*
(0.01200) (0.01050) LEV 0.02147* 0.014698**
(0.00793) (0.00694) LOA 0.014417 0.042285
(0.10680) (0.09345) NPL 1.940538 1.866904
(1.46838) (1.28487) RWA 2.075036* 1.753671*
(0.70222) (0.61446) AGE -0.00206 -0.002516
(0.00216) (0.00189) SIZE -0.007891 0.049682
(0.09615) (0.08413) Constant 0.259095 0.086801
(0.45584) (0.39887) * significant at 1% level ** significant at 5% level
As expected RWA exhibits positive relationship with efficiency (the coefficient is significant at 1 percent level). This result suggests that the banks (with adequate capital fund to cover risky assets) are performing efficiently as they are able to withstand any financial shocks to their balance sheet.
LNP is in the expected direction with significant positive correlation. The relationship between efficiency and profitability is positive which suggests that profitable banks are somewhat efficient. Likewise, LEV as a ratio of debt to equity is also in the expected direction. The coefficient of LEV is positive and significant (at 1% for ECRS and at 5% for EVRS). Lower capital ratios in banking implies higher leverage and risk, hence, the results show that better capitalized banks exhibit better efficiency and productivity. The comparative analysis of LEV and LNP suggests that firm with greater leverage is able to attract more deposits at lower cost which in turn reflect in higher and better loans. Higher loans result in greater interest income which improves the profitability of the bank.
Likewise, the coefficient of LOA is positive (but not significant in both cases) which suggests that there is negative relationship between bank’s efficiency and the level of liquid assets held by the bank. As the higher LOA denotes lower liquidity, the result implies that the less (more) liquid banks tend to exhibit higher (lower) efficiency levels (Sufian, 2012). Thus, it can be seen that banks with higher loan-to-assets ratio tends to be more productive which shows that bank loans seem are more highly valued than alternative bank outputs i.e., investment and securities.
Asian Journal of Finance & Accounting ISSN 1946-052X
2013, Vol. 5, No. 2
www.macrothink.org/ajfa 239
SIZE as a log of assets has been used as control variable. The coefficient of SIZE is negative for ECRS which shows that marginal cost savings can be achieved by increasing the size of the banking firm, especially in developing markets. The result supports the findings of Spathis et. al. (2002), and Kosmindu (2008). Eichengreen and Gibson (2001) suggested that the effect of a growing bank’s size on performance may be positive up to a certain limit. Beyond this point the effect of size could be negative due to bureaucratic and other reasons. However, the coefficient of SIZE is positive for EVRS which suggests that bigger banks are able to achieve efficiency under variable returns to scale assumptions.
Finally, regression diagnostic tests such as redundant variable test, wald-coefficient restrictions test and Jarque-Bera test has been performed to validate the results of the tobit regression. The redundant variable and wald test rejects the hypothesis that significant variables (LNP, LEV and RWA) are redundant with likelihood ratio of 10.17 (significant at 5% level). Likewise, residual diagnostics test was conducted to determine whether the residuals are normally distributed or not. Jarque-Bera stat was not significant at 5% level; hence, it is found that the population residual is normally distributed.
6. Conclusion
The paper attempts to analyze the efficiency of commercial banks in Nepal during the period 2007/08 to 2011/12. The efficiency and productivity estimates are computed using MI. DEAP v 2.1 developed by Coelli (1996) has been used to calculate all the indices. The MI allows isolating efforts to catch up to the frontier (efficiency change) from shifts in the frontier (technological change) and also explains the main sources of efficiency change: either improvements in management practices (pure technical efficiency change) or improvements towards optimal size (scale efficiency change). Furthermore, Tobit regression model has been used to analyze the determinants of efficiency.
The finds from MI suggest that the productivity change of commercial banks in Nepal has improved over the sample period and that the increase in productivity change in Nepalese commercial banks industry is due to the technical progress rather than efficiency components. Furthermore, decomposition of the efficiency change index into its mutually exhaustive pure technical and scale efficiency components suggest that the decline in efficiency change is due to decline in both pure efficiency change and scale efficiency change.
The Tobit regression model produced some interesting results in the analysis. The effect of age, structure as a dummy variable for foreign joint venture, loan to assets ratio, non performing loans and log of assets is found to be insignificant for the efficiency. As expected, capital fund to risk weighted assets is found to be positively related with efficiency as banks are able to withstand any shocks in their balance sheet. The relationship between efficiency and profitability is positive which suggests that profitable banks are somewhat efficient. The coefficient of leverage as a ratio of debt to equity is positive and significant. Lower capital ratios in banking implies higher leverage and risk, hence, the results show that better capitalized banks exhibit better efficiency and productivity. Thus, profitable bank with high low leverage and higher risk weighted are found to be more efficient in Nepalese banking sector and bank loans seem to be more highly valued than alternative bank outputs i.e.,

Asian Journal of Finance & Accounting ISSN 1946-052X
2013, Vol. 5, No. 2
www.macrothink.org/ajfa 240
investment and securities.
The empirical findings from this study suggest that the Nepalese commercial banks are not able to catch up to the frontier because of inefficient management practices and deterioration from the optimal size. Therefore, commercial banks need to focus more on management efficiency. Likewise, decline in scale efficiency suggests that banks could have been too small to reap the benefits of economies of scale. Therefore, from the policy making perspective, mergers, particularly among the small banking groups should be encouraged (Sufian, 2012). This could entail the small banking groups to reap the benefits of economies of scale.
References
Afriat, S. N. (1972). Efficiency estimation of production functions. International Economic Review, 13(3), 568-598. http://dx.doi.org/10.2307/2525845
Ahmed, U., Farooq, S., & Jalil, H. H. (2009). Efficiency dynamics and financial reforms: Case study of Pakistani banks. International Research Journal of Finance and Economics, 25, 172-182.
Alam, I., & Sickles, R. (1995). Long run properties of technical efficiency in the US airline industry. Rice University: Mimeo.
Ali Rizvi, F. S. (2001). Post-liberalisation efficiency and productivity of the banking sector in Pakistan. The Pakistan Development Review, 40(4), 605-632.
Avkiran, N. (2001). Investigating technical and scale efficiencies of Australian universities through Data Envelopment Analysis. Socio-Economic Planning Sciences, 35, 57-80. http://dx.doi.org/10.1016/S0038-0121(00)00010-0
Barros, C., & Weber, W. (2008). Argentina Airports Technical Efficiency in a Context of Economic Crisis. Journal of Air Transport Management, 14(6), 315-319. http://dx.doi.org/10.1016/j.jairtraman.2008.08.005
Berg, S. A., Forsund, F. R., & Jansen, E. S. (1992). Malmquist index of productivity growth during the deregulation of Norwegian banking. The Scandinavian Journal of Economics, 94, 211-228. http://dx.doi.org/10.2307/3440261
Berger, A. N., & De Young, R. (1997). Problem loans and cost efficiency in commercial banks. Journal of Banking and Finance, 21(6), 849-870. http://dx.doi.org/10.1016/S0378-4266(97)00003-4
Berger, A. N., & Humphrey, D. B. (1997). Efficiency of Financial Institutions: International Survey and Directions for Future Research. Eurpoean Journal of Operational Research, 98, 175-212. http://dx.doi.org/10.1016/S0377-2217(96)00342-6
Berger, A., Hunter, W., & Timme, S. (1993). The efficiency of financial institutions: A review and preview of research past, present and future. Journal of Banking and Finance, 17(2&3), 221-250. http://dx.doi.org/10.1016/0378-4266(93)90030-H

Asian Journal of Finance & Accounting ISSN 1946-052X
2013, Vol. 5, No. 2
www.macrothink.org/ajfa 241
Bhattacharyya, A., Lovell, C. K., & Sahay, P. (1997). The impact of liberalization on the productive efficiency of Indian commercial banks. European Journal of Operational Research, 98, 332-345. http://dx.doi.org/10.1016/S0377-2217(96)00351-7
Bourke, P. (1989). Concentration and other determinants of bank profitability in Europe, North America and Australia. Journal of Banking and Finance, 13(1), 65-79. http://dx.doi.org/10.1016/0378-4266(89)90020-4
Calabrese, A., Campisi, D., & Paolo, M. (2001). Productivity change in the telecommunication industries 13 OECD countries. International Journal of Business and Economics, 1(33), 209-223.
Caves, D., Cristensen, L., & Diewert, W. (1982). The economic theory of indexnumbers and measurement of input, output and productivity. Econometrica, 50, 1393-1414. http://dx.doi.org/10.2307/1913388
Chen, X., Skully, M., & Brown, K. (2005). Banking Efficiency in China: Application of DEA to Pre and Post Deregulation Era: 1993-2000. China Economic Review, 16, 229-245. http://dx.doi.org/10.1016/j.chieco.2005.02.001
Coelli, T. (1996). A guide to DEAP version 2.1 Data Envelopment Analysis (Computer) program (CEPA Working Paper 96/98). Armidale: University of New England, CEPA.
Coelli, T. J., & Rao, D. P. (2005). Total factor productivity growth in agriculture: a Malmquist index analysis of 93 countries, 1980-2000. Agriculture Economics, 32(01), 115-134. http://dx.doi.org/10.1111/j.0169-5150.2004.00018.x
Drake, L. (2001). Efficiency and productivity change in UK banking. Applied Financial Economics, 11(5), 557-571. http://dx.doi.org/10.1080/096031001752236825
Eichengreen, B. & Gibson, H.D. (2001). Greek banking at the dawn of the new millennium. Discussion paper, Center of Economic and Policy Research.
Fare, R., Grosskopf, S., Lindgren, B., & Roos, P. (1989). Productivity developments in Swedish hospital: A Malmquist output index approach. In A. Charnes, W. W. Cooper, A. Lewin, & L. Seiford (Eds.). Data Envelopment Analysis: Theory, methodology and applications. Boston: Kluwer Academic Publisher.
Fare, R., Shawna, G., Mary, N., & Zhongyang, Z. (1994). Productivity growth, technical progress and efficiency change in industrialized countries. American Economic Review, 84(1), 66-83.
Forsund, F. (1991). The Malmquist productivity index. Paper presented at the Second European Workshop on Efficiency and Productivity Measurement. Lauvainla-Neuve, Belgium: Centre of Operations Research & Econometrics, University Catholique de Louvain.
Galagedera, D. U., & Edirisuriya, P. (2005). Performance of Indian commercial banks (1995-2002): An application of Data Envelopment analysis and Malmquist productivity index. South Asian Journal of Management, 12(4), 52-74.

Asian Journal of Finance & Accounting ISSN 1946-052X
2013, Vol. 5, No. 2
www.macrothink.org/ajfa 242
Gillen, D., & Lall, A. (1997). Non-parametric measures of efficiency of US airports. International Journal of Transport Economics, 28, 283-306.
Grifell-Tatje, E., & Lovel, C. A. (1997). The sources of productivity change in Spanish banking. European Journal of Operational Research, 98, 364-380. http://dx.doi.org/10.1016/S0377-2217(96)00353-0
Hasan, I., & Marton, K. (2003). Development and efficiency of the banking sector in a transitional economy: a Hungarian experience. Journal of Banking and Finance, 27(12), 2249-2271. http://dx.doi.org/10.1016/S0378-4266(02)00328-X
Isik, I., & Hassan, M. (2002). Technical, scale and allocative efficiencies of Turkish banking industry. Journal of Banking and Finance, 26(4), 719-766. http://dx.doi.org/10.1016/S0378-4266(01)00167-4
Jeanneney, S. G., Hua, P., & Liang, Z. (2006). Financial development, economic efficiency, and productivity growth: Evidence from China. The Developing Economies, 44(1), 27-52. http://dx.doi.org/10.1111/j.1746-1049.2006.00002.x
Jha, D. K., Yorino, N., & Zoka, Y. (2007). Benchmarking results of electricity generating plants in Nepal using Modified DEA models. Osaka, Japan.
Kosmidou, K. (2008). The determinants of banks’ profits in Greece during the period of EU financial integration. Managerial Finance, 34(3), 146–159. http://dx.doi.org/10.1108/03074350810848036
Lv, W., Hong, H., & Fang, K. (2012). Chinese regional energy efficiency change and its determinants analysis: Malmquist index and Tobit model. Annals of Operation Research, 1-14.
Malmquist, S. (1953). Index numbers and indifference curves. Trabajos de Estatica, 4(1), 209-242. http://dx.doi.org/10.1007/BF03006863
Mao, W., & Koo, W. (1996). Productivity growth, technology progress and efficiency change in Chinese agricultural production from 1984 to 1993. North Dakota State University.
Maskay, N. M., & Subedi, S. R. (2009). Development of the Nepalese Financial System: Need for the Formulation of a Master Plan. Economic Review (Occassional Paper), 21.
Neal, P. (2004). X-Efficiency and Productivity Change in Australian Banking. Australian Economic Papers, 43, 174-191. http://dx.doi.org/10.1111/j.1467-8454.2004.00223.x
Nepal Rastra Bank. (2012, Mid-July). Banking and Financial Statistics, No. 58, No. 28. Retrieved June 2013, from Nepal Rastra Bank - Central Bank of Nepal: http://bfr.nrb.org.np/statistics/bank_fina_statistics/Banking_and_Financial_Statistics--No_58%20July%202012.pdf
Omar, M. A., Abdul Rahman, A. R., Yusof, R. M., Majid, M. S., & Mohd. Rasid, M. E. (2006). Efficienciy of Commercial Banks in Malaysia. Asian Academy of Management Journal of Accounting and Finance, 2(2), 19-42.

Asian Journal of Finance & Accounting ISSN 1946-052X
2013, Vol. 5, No. 2
www.macrothink.org/ajfa 243
Price, C. W., & Weyman-Jones, T. (1996). Malmquist indices of productivity change in the UK gas industry before and after privatization. Applied Economics, 28(1), 29-39. http://dx.doi.org/10.1080/00036849600000004
Rezvanian, R., Rao, V. N., & Mehdian, S. M. (2008). Efficiency Change, Technological Progress and Productivity Growth of Private, Public and Foreign Banks inIndia: Evidence from the Post-Liberalization Era. Applied Financial Economics, 18, 701-713. http://dx.doi.org/10.1080/09603100701222317
Sathye, M. (2002). Measuring productivity changes in Australian banking: an application of Malmquist indices. Managerial Finance, 28(9), 48-59. http://dx.doi.org/10.1108/03074350210768068
Sinha, R. P., & Chatterjee, B. (2008). Fund-Based Activity of Commercial Banks: A Malmquist Approach. Indian Economic Review, XXXXIII(1), 83-102.
Spathis, C., Kosmidou, K. & Doumpos, M. (2002). Assessing profitability factors in the Greek banking system: a multicriteria methodology. International Transactions in Operational Research, 9(5), 517–530. http://dx.doi.org/10.1111/1475-3995.00371
Sufian, F. (2012). Determinants of banks’ total factor productivity: the post-Asian financial crisis experience of the Philippines. International Journal of Business Excellence, 5(1/2), 77-100. http://dx.doi.org/10.1504/IJBEX.2012.044574
Suhariyanto, K., & Thirtle, C. (2001). Asian agricultural productivity and convergence. Journal of Agricultural Economics, 52(3), 96-110. http://dx.doi.org/10.1111/j.1477-9552.2001.tb00941.x
Tauer, L. (1998). Productivity of New York dairy farms measured by non-parametric indices. Journal of Agricultural Economics, 49(2), 234-249. http://dx.doi.org/10.1111/j.1477-9552.1998.tb01266.x
Thagunna, K. S., & Poudel, S. (2013). Measuring bank performance of Nepali banks: A Data Envelopment Analysis (DEA) perspective. International Journal of Economics and Financial Issues, 3(1), 54-65.
Uri, N. D. (2002). The Measurement of the Change in Productivity in Telecommunications. Telecommunication Systems, 3, 177-194. http://dx.doi.org/10.1023/A:1016583810796
Yörük, B., & Zaim, O. (2005). Productivity growth in OECD countries: A comparison with Malmquist indices. Journal of Comparative Economics, 33, 401-420. http://dx.doi.org/10.1016/j.jce.2005.03.011