efficient exhaustive search of power-split hybrid...
TRANSCRIPT

Xiaowu Zhang1
Department of Mechanical Engineering,
University of Michigan,
Ann Arbor, MI 48109
e-mail: [email protected]
Shengbo Eben LiState Key Laboratory of Automotive
Safety and Energy,
Tsinghua University,
Beijing 100084, China;
Department of Mechanical Engineering,
University of California, Berkeley,
Berkeley, CA 94720
Huei PengDepartment of Mechanical Engineering,
University of Michigan,
Ann Arbor, MI 48109;
State Key Laboratory of Automotive
Safety and Energy,
Tsinghua University,
Beijing 100084, China
Jing SunDepartment of Naval Architecture
and Marine Engineering,
University of Michigan,
Ann Arbor, MI 48109
Efficient Exhaustive Searchof Power-Split HybridPowertrains With MultiplePlanetary Gears and ClutchesPlanetary gear (PG) power-split hybrid powertrains have been used in producing hybridand plug-in hybrid vehicles from the Toyota, General Motor, and Ford for years. Some ofthe most recent designs use clutches to enable multiple operating modes to improvelaunching performance and/or fuel economy. Adding clutches and multiple operatingmodes, however, also increases production cost and design complexity. To enable an ex-haustive but fast search for optimal designs among a large number of hardware configura-tions, clutch locations, and mode selections, an automated modeling and screeningprocess is developed in this paper. Combining this process with the power-weighted effi-ciency analysis for rapid sizing method (PEARS), an optimal and computationally efficientenergy management strategy, the extremely large design space of configuration, compo-nent sizing, and control becomes feasible to search through. This methodology to identifyoptimal designs has yet to be reported in the literature. A case study to evaluate the pro-posed methodology uses the configuration adopted in the Toyota Hybrid Synergy (THS-II)system used in the Prius model year 2010 and the Hybrid Camry. Two designs are investi-gated to compare with the simulated Prius design: one uses all possible operating modes;and the other uses a suboptimal design that limits the number of clutches to three. [DOI:10.1115/1.4031533]
Keywords: hybrid vehicles, optimal control, planetary gear, optimal design
1 Introduction
The hybrid electric powertrain is one of the most important tech-nologies that have been developed to satisfy the challenging fueleconomy standards set by the EU and U.S. Governments [1].According to a report from the Electric Drive Transportation Asso-ciation (EDTA), hybrid and electric car sales in 2012 increased by73% compared with the previous year. Over 473,000 hybrids andplug-in hybrids were sold, representing 3.3% of the U.S. market, asignificant increase from the 2.2% share in 2011.
The powertrain system can be made more efficient by usingelectric motor/generators (MGs). With MGs, the engine can beright-sized to improve efficiency. In addition, MGs enable the useof regenerative braking, which can significantly help fuel econ-omy, particularly in city driving. In terms of the power flowbetween the engine and the MGs, three types of hybrid vehiclesare traditionally available: series, parallel, and series–parallel(power-split) [2,3].
In series hybrids, all the engine power is first converted to elec-trical power and then back to mechanical form. Excess electricalpower is stored in the battery for later use. The multiple stages ofenergy conversion make series hybrids inherently inefficient,which is the major reason that no production pure series hybridpassenger vehicles are available in the market from major originalequipment manufacturers except the BMW i3, a range-extenderplug-in hybrid vehicle. However, series hybrid mode can be usedas a back-up mode to achieve drivability requirements, as theChevrolet Volt does [4].
Parallel hybrids can be designed as an incremental add-on totraditional powertrains and thus incur a relatively small
investment and effort. Their efficiency in highway driving can bebetter than the series hybrid since both the engine and the MG canprovide torque directly to the wheels without involving extra stepsof energy conversion, thereby reducing energy losses. However,the mechanical coupling between the engine and wheels throughthe transmission makes it hard for the engine to consistently oper-ate in the sweet spot [3].
Among all the strong hybrid vehicle sales in 2012, over 90%were of the power-split type [5], which utilizes one or more PGsas the transmission device. The Toyota Prius, Ford Fusion, andChevrolet Volt are all power-split hybrid vehicles. The PGs arecompact, efficient, and have a high torque capacity. In addition,when the MGs are properly controlled, the PG system performs asan electric continuous variable transmission which can result inefficient engine operation. However, due to the unavoidableenergy conversion from the generator to the motor, the power-split vehicles can have greater energy losses compared to parallelhybrid electric vehicles (HEVs) in highway driving.
Using clutches in a power-split powertrain produces differentoperating modes, thus adding flexibility to vehicle operations. Forexample, the input-split mode can be used for better launchingperformance; the compound-split mode can be used for betterhigh-speed driving, while curtailing the operating speed of theelectric machines [6]. It is also possible to have parallel modes,series modes, pure electric vehicle (EV) modes, and fixed-gearmodes on the same powertrain [7,8]. Having a diverse set of oper-ating modes makes it possible to fully realize the potential of thepowertrain and achieve both better fuel economy and improveddrivability, as compared to conventional vehicles and traditionalhybrid vehicles.
Although many multimode hybrid vehicle configurations anddesigns have been patented and some implemented commercially[9–12], many more remain unexplored. “Configuration” in this pa-per refers to the way the power devices (engine and generator/motors) and output shaft are connected to the nodes of PGs, while
1Corresponding author.Contributed by the Dynamic Systems Division of ASME for publication in the
JOURNAL OF DYNAMIC SYSTEMS, MEASUREMENT, AND CONTROL. Manuscript receivedJanuary 5, 2015; final manuscript received August 21, 2015; published onlineSeptember 23, 2015. Assoc. Editor: Junmin Wang.
Journal of Dynamic Systems, Measurement, and Control DECEMBER 2015, Vol. 137 / 121006-1Copyright VC 2015 by ASME
Downloaded From: http://dynamicsystems.asmedigitalcollection.asme.org/ on 12/03/2015 Terms of Use: http://www.asme.org/about-asme/terms-of-use

“design” in this paper stands for the specific clutch combinationfor a particular configuration. An exhaustive analysis of all possi-ble configurations and designs has already been conducted forpower-split vehicles using a single PG [13]. For power-splitvehicles using more than one PG, a general modeling method hasbeen developed [14]. General clutch allocation and identificationof unique modes for double PGs were discussed by us in Ref.[15], with an automated modeling methodology proposed andunique modes identified. In this paper, the automated modelingand unique mode identification methodologies are generalized topowertrain systems with more than two PGs.
Once a particular configuration is selected and all the feasiblemodes are identified, we can use optimal control methods to findthe best possible fuel economy for that configuration. For example,in this paper we study the THS-II configuration, which connects theengine, two motors, and the vehicle to the two PGs in a particularway. In addition, two “permanent clutches” are used in the THS-IIdesign. Because the two “clutches” never change state, there is asingle operating mode. Our methodology will answer the followingfour questions: How many clutches can be added and how manydistinct modes can be created? Among all possible modes enabledby these clutches, how many of them are useful? If we limit our-selves to no more than three clutches, where should they belocated? And for the “enhanced THS-II” (by having either all possi-ble modes or the modes only through three clutches), how muchbetter is the fuel economy compared with the original THS-II?
If fuel economy is the main design objective, the near-optimalcontrol problem can generally be solved using load leveling[16,17], equivalent consumption minimization strategy (ECMS)[18,19], the Pontryagin’s minimum principle (PMP) [20–22],dynamic programming (DP) [22,23], and convex optimization[24–27]. The load leveling methods are heuristic and cannot guar-antee optimality. ECMS is an instantaneous optimization methodbut the equivalent fuel consumption factor needs tuning. DP isoptimal, but its computation load grows exponentially with thenumber of state and input variables, a well-known phenomenoncommonly referred as “curse of dimensionality.” PMP frequentlysuffers from numerical convergence problems if the underlyingtwo-point-boundary-value problem is nonlinear. While the convexoptimization is fast, it cannot address integer decisions, such asmode selection and engagement of clutches.
To overcome these drawbacks, a new near-optimal energy man-agement strategy named PEARS was developed, which hasproved to produce optimal results similar to traditional DP butover 3–4 orders of magnitude faster [28]. In this paper, thePEARS method is further enhanced. Rather than using instantane-ous optimization, the enhanced PEARS adopts a low-dimensionDP to achieve an optimal mode shift schedule and address modeshift feasibility globally. This method is used to generate optimalcontrol results necessary for identifying the best clutch locationsand optimal operating modes.
The paper is organized as follows: In Sec. 2, we illustrate thedynamics of the PG system and present an automated modelingprocedure as well as a way to screen the modes (to eliminate/iden-tify infeasible and redundant ones) and an identification processfor multiple PG systems. Section 3 describes the concept of thePEARS method and its enhancement. In Sec. 4, the configurationof THS-II is the focus of a case study. Section 5 presentsconclusions.
2 Dynamics of PG and Automatic Modeling
A PG system consists of a ring gear, a sun gear, and a carrierwith several pinion gears. The lever analogy [29] can be appliedto reflect the two degrees-of-freedom (DOF) dynamics of this sin-gle PG, as shown in Fig. 1. The rotational speeds and accelera-tions of the three nodes (sun gear, ring gear, and carrier) mustsatisfy the constraint shown in Eq. (1), where the subscripts s, r,and c indicate the sun gear, ring gear, and the carrier, respectively.S and R are the radii of the sun gear and ring gear
xsSþ xrR ¼ xcðRþ SÞ (1)
The dynamics of the PG system can be represented using thestate-space form as suggested in Ref. [14]. In this paper, a moregeneral form of the modeling is presented, with all possible clutchlocations and modes considered.
2.1 Multiple PG System. Many of today’s popular power-split hybrid vehicles use two MGs to enhance the engine effi-ciency. In this research, we adopt this general powertrain setup.Assuming no component collocation at any of the PG nodes, thenumber of different configurations (nconfiguration_total) and the max-imum number of clutches (nclutch_total) can be calculated byEqs. (2) and (3), where Ck
3n is the k-combination and n is the num-ber of PGs. The first term in Eq. (3) stands for the number ofclutches that can be added between any pair of nodes in the PGssystem, while the second term represents the number of groundingclutches. The third term is the number of redundant clutches thatcan be eliminated from the system: for each PG, locking any twonodes makes all three nodes rotate at the same speed, whichmeans that only one such clutch is needed. In addition, thegrounding clutch for the vehicle output shaft is meaningless dur-ing driving, leading to the last term of Eq. (3)
nConfiguration total ¼ C43n (2)
nclutch total ¼ C23n þ 3n� 2n� 1 ¼ C2
3n þ n� 1 (3)
As an example, the diagram of a double PG system is presentedin Fig. 2, where up to 16 clutches can be added and the removedclutches are marked in red (assuming the vehicle output is on thesecond ring gear).
To avoid redundant designs and to facilitate the systematic,automated modeling procedure, an assumption is made that anyone node can only be connected to no more than two nodes of theother PG at the same time, as the additional connection isredundant.
Fig. 1 PG and its lever analogy
Fig. 2 All 16 possible clutch locations for a double PG system
121006-2 / Vol. 137, DECEMBER 2015 Transactions of the ASME
Downloaded From: http://dynamicsystems.asmedigitalcollection.asme.org/ on 12/03/2015 Terms of Use: http://www.asme.org/about-asme/terms-of-use
2.2 Automated Modeling. In this subsection, the automatedmodeling process for multiple PGs is described.
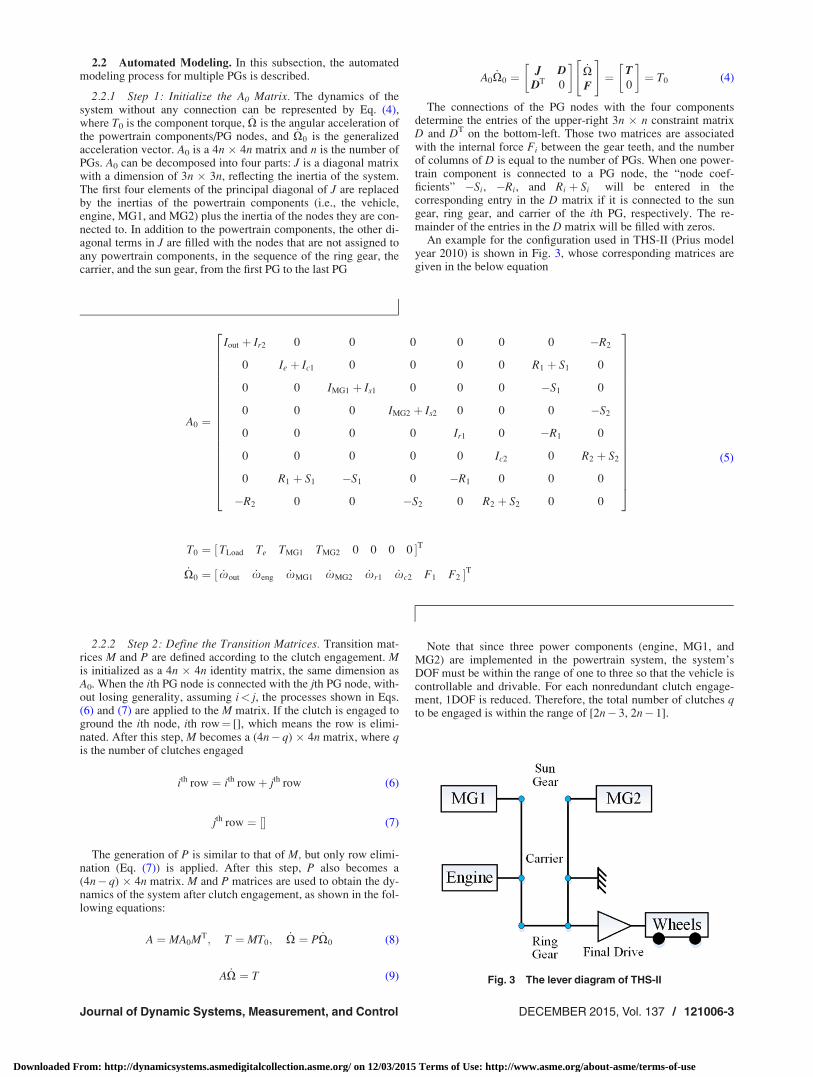
2.2.1 Step 1: Initialize the A0 Matrix. The dynamics of thesystem without any connection can be represented by Eq. (4),where T0 is the component torque, _X is the angular acceleration ofthe powertrain components/PG nodes, and _X0 is the generalizedacceleration vector. A0 is a 4n � 4n matrix and n is the number ofPGs. A0 can be decomposed into four parts: J is a diagonal matrixwith a dimension of 3n � 3n, reflecting the inertia of the system.The first four elements of the principal diagonal of J are replacedby the inertias of the powertrain components (i.e., the vehicle,engine, MG1, and MG2) plus the inertia of the nodes they are con-nected to. In addition to the powertrain components, the other di-agonal terms in J are filled with the nodes that are not assigned toany powertrain components, in the sequence of the ring gear, thecarrier, and the sun gear, from the first PG to the last PG
A0_X0 ¼
J DDT 0
� �_XF
" #¼ T
0
� �¼ T0 (4)
The connections of the PG nodes with the four componentsdetermine the entries of the upper-right 3n � n constraint matrixD and DT on the bottom-left. Those two matrices are associatedwith the internal force Fi between the gear teeth, and the numberof columns of D is equal to the number of PGs. When one power-train component is connected to a PG node, the “node coef-ficients” �Si, �Ri, and Ri þ Si will be entered in thecorresponding entry in the D matrix if it is connected to the sungear, ring gear, and carrier of the ith PG, respectively. The re-mainder of the entries in the D matrix will be filled with zeros.
An example for the configuration used in THS-II (Prius modelyear 2010) is shown in Fig. 3, whose corresponding matrices aregiven in the below equation
A0 ¼
Iout þ Ir2 0 0 0 0 0 0 �R2
0 Ie þ Ic1 0 0 0 0 R1 þ S1 0
0 0 IMG1 þ Is1 0 0 0 �S1 0
0 0 0 IMG2 þ Is2 0 0 0 �S2
0 0 0 0 Ir1 0 �R1 0
0 0 0 0 0 Ic2 0 R2 þ S2
0 R1 þ S1 �S1 0 �R1 0 0 0
�R2 0 0 �S2 0 R2 þ S2 0 0
266666666666666666664
377777777777777777775
T0 ¼ ½TLoad Te TMG1 TMG2 0 0 0 0 �T
_X0 ¼ ½ _xout _xeng _xMG1 _xMG2 _xr1 _xc2 F1 F2 �T
(5)
2.2.2 Step 2: Define the Transition Matrices. Transition mat-rices M and P are defined according to the clutch engagement. Mis initialized as a 4n � 4n identity matrix, the same dimension asA0. When the ith PG node is connected with the jth PG node, with-out losing generality, assuming i< j, the processes shown in Eqs.(6) and (7) are applied to the M matrix. If the clutch is engaged toground the ith node, ith row¼ [], which means the row is elimi-nated. After this step, M becomes a (4n� q) � 4n matrix, where qis the number of clutches engaged
ith row ¼ ith rowþ jth row (6)
jth row ¼ ½� (7)
The generation of P is similar to that of M, but only row elimi-nation (Eq. (7)) is applied. After this step, P also becomes a(4n� q) � 4n matrix. M and P matrices are used to obtain the dy-namics of the system after clutch engagement, as shown in the fol-lowing equations:
A ¼ MA0MT; T ¼ MT0; _X ¼ P _X0 (8)
A _X ¼ T (9)
Note that since three power components (engine, MG1, andMG2) are implemented in the powertrain system, the system’sDOF must be within the range of one to three so that the vehicle iscontrollable and drivable. For each nonredundant clutch engage-ment, 1DOF is reduced. Therefore, the total number of clutches qto be engaged is within the range of [2n� 3, 2n� 1].
Fig. 3 The lever diagram of THS-II
Journal of Dynamic Systems, Measurement, and Control DECEMBER 2015, Vol. 137 / 121006-3
Downloaded From: http://dynamicsystems.asmedigitalcollection.asme.org/ on 12/03/2015 Terms of Use: http://www.asme.org/about-asme/terms-of-use

2.2.3 Step 3: Formulate the Dynamics of the System. Thedynamic matrix A of the powertrain system with clutch engage-ment is generated through Eq. (8). The system dynamics of a cer-
tain mode can be represented in Eq. (9). As an example, Eqs. (10)and (11) show the equations of the THS-II powertrain systemdepicted in Fig. 3
M¼
1 0 0 0 1 0 0 0
0 1 0 0 0 0 0 0
0 0 1 0 0 0 0 0
0 0 0 1 0 0 0 0
0 0 0 0 0 0 1 0
0 0 0 0 0 0 0 1
26666664
37777775; P¼
1 0 0 0 0 0 0 0
0 1 0 0 0 0 0 0
0 0 1 0 0 0 0 0
0 0 0 1 0 0 0 0
0 0 0 0 0 0 1 0
0 0 0 0 0 0 0 1
26666664
37777775
(10)
A ¼
Iout þ Ir2 þ Ir1 0 0 0 �R1 �R2
0 Ie þ Ic1 0 0 R1 þ R2 0
0 0 IMG1 þ Is1 0 �S1 0
0 0 0 IMG2 þ Is2 0 �S2
�R1 R1 þ R2 �S1 0 0 0
�R2 0 0 �S2 0 0
26666664
37777775; T ¼
TLoad
Te
TMG1
TMG2
0
0
26666664
37777775; _X ¼
_xout
_xe
_xMG1
_xMG2
F1
F2
26666664
37777775
(11)
2.3 Mode Screening. With clutches, multiple modes can beachieved. If the vehicle cannot be powered by any powertraincomponent in a mode, it is defined as an infeasible mode. Formodes with identical dynamic equations, one is kept and the restare deemed redundant. Distinguishing redundant mode is impor-tant for simulation speed in the optimization process later on. Inthis section, the process and steps to identify and eliminate infea-sible and redundant modes are described.
2.3.1 Step 1: Constructing the A* Matrix. The A matrix isinverted to obtain the dynamic equations that relate inputs to statederivatives. For a controllable powertrain system (i.e., the speedof each PG node can be controlled), the A matrix is always inverti-ble. At the same time, not every element of the A�1 matrix is use-ful. The useful part of A�1 is extracted to obtain a final 4 � 4matrix A*, as shown in the equation below
_xout
_xeng
_xMG1
_xMG2
2664
3775 ¼ A�
Tload
Teng
TMG1
TMG2
2664
3775 (12)
In order to construct the A* matrix, the last n columns and rowsas well as the columns and rows associated with any free node(node with no powertrain component attached) in A�1 are elimi-nated, as they have no impact on the final state equation. Thereare two cases following the elimination:
A� ¼ A�1½1 : 4; 1 : 4� (13)
(1) If there is no powertrain component collocation (powertraincomponents are not connected to the same PG node) due toclutch engagement, the A* matrix is obtained after the elim-ination process described in the previous paragraph. As the
THS-II example is described in Fig. 3, its A* is shown in
Eq. (13).(2) If there is collocation, the torque coefficients corresponding
to the collocated components are duplicated, making thesequence of the coefficients correspond to “output,”“engine,” “MG1,” and “MG2.” In addition, since the accel-erations of the collocated components are the same, it willlead to identical rows in the A* matrix. An example of a
parallel mode and its A�1 and A* are shown in Fig. 4 and inthe below equation
A�1 ¼
Ainv11 Ainv
12 Ainv13 Ainv
14 Ainv15
Ainv21 Ainv
22 Ainv23 Ainv
24 Ainv25
Ainv31 Ainv
32 Ainv33 Ainv
34 Ainv35
Ainv41 Ainv
42 Ainv43 Ainv
44 Ainv45
Ainv51 Ainv
52 Ainv53 Ainv
54 Ainv55
26666666664
37777777775
A� ¼
Ainv11 Ainv
12 Ainv12 Ainv
13
Ainv21 Ainv
22 Ainv22 Ainv
23
Ainv21 Ainv
22 Ainv22 Ainv
23
Ainv31 Ainv
32 Ainv32 Ainv
33
26666664
37777775
(14)
2.3.2 Step 2: Refining the A* Matrix. For each row of A*, ifthree of the four elements are zero, the corresponding componenthas no connection with the other three components (i.e., the restof the powertrain), then all the elements in the row are set to zero.
If both the first and the second element of the third and fourthrow of A* is zero, then the MGs are neither connected to theengine nor the vehicle, they will not affect the function of themode, and both the third and fourth row will be set to zero.
2.3.3 Step 3: Define Entries in A* Matrix. The four rows ofthe A* matrix are named as Vveh, Veng, VMG1, and VMG2, respec-tively, and the elements of the Vveh row vector are named Cveh,Ceng, CMG1, and CMG2 for later reference.
Fig. 4 An example of a parallel mode in THS-II configuration
121006-4 / Vol. 137, DECEMBER 2015 Transactions of the ASME
Downloaded From: http://dynamicsystems.asmedigitalcollection.asme.org/ on 12/03/2015 Terms of Use: http://www.asme.org/about-asme/terms-of-use
If the first row of A* is zero, the vehicle output is not affectedby any powertrain component, making it infeasible (not drivable).In addition, vehicle modes with identical A* matrices are deemedidentical.
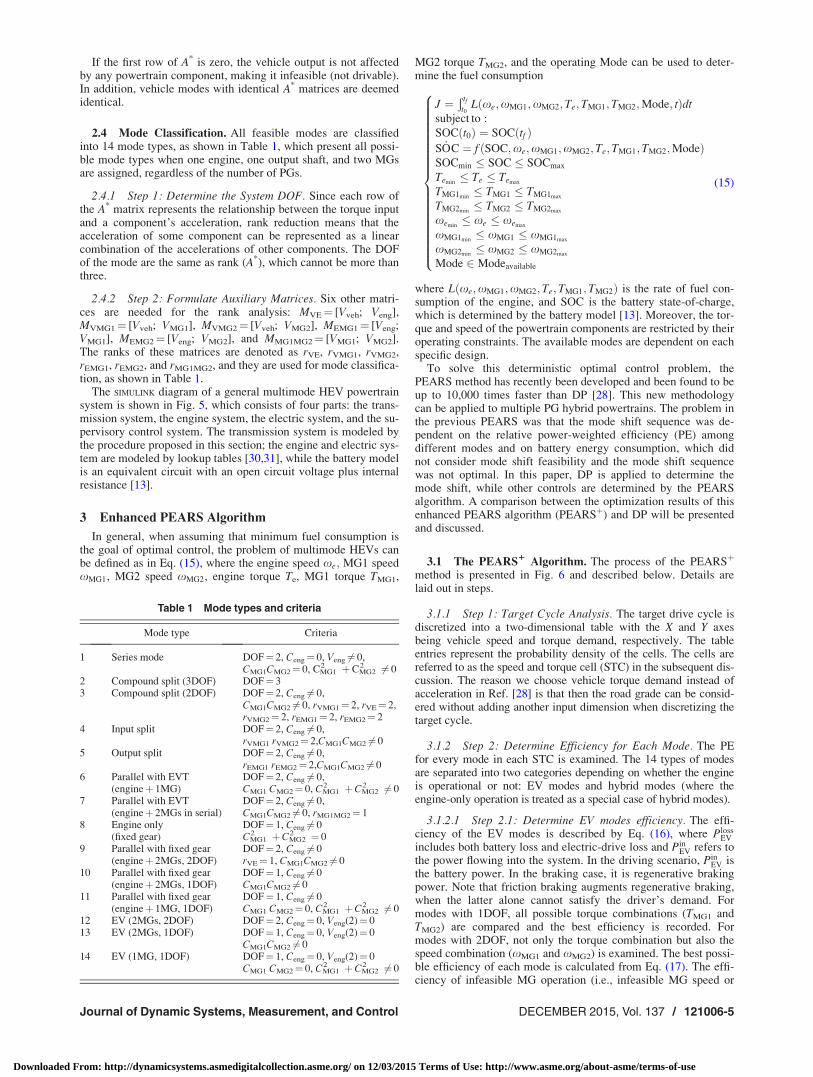
2.4 Mode Classification. All feasible modes are classifiedinto 14 mode types, as shown in Table 1, which present all possi-ble mode types when one engine, one output shaft, and two MGsare assigned, regardless of the number of PGs.
2.4.1 Step 1: Determine the System DOF. Since each row ofthe A* matrix represents the relationship between the torque inputand a component’s acceleration, rank reduction means that theacceleration of some component can be represented as a linearcombination of the accelerations of other components. The DOFof the mode are the same as rank (A*), which cannot be more thanthree.
2.4.2 Step 2: Formulate Auxiliary Matrices. Six other matri-ces are needed for the rank analysis: MVE¼ [Vveh; Veng],MVMG1¼ [Vveh; VMG1], MVMG2¼ [Vveh; VMG2], MEMG1¼ [Veng;VMG1], MEMG2¼ [Veng; VMG2], and MMG1MG2¼ [VMG1; VMG2].The ranks of these matrices are denoted as rVE, rVMG1, rVMG2,rEMG1, rEMG2, and rMG1MG2, and they are used for mode classifica-tion, as shown in Table 1.
The SIMULINK diagram of a general multimode HEV powertrainsystem is shown in Fig. 5, which consists of four parts: the trans-mission system, the engine system, the electric system, and the su-pervisory control system. The transmission system is modeled bythe procedure proposed in this section; the engine and electric sys-tem are modeled by lookup tables [30,31], while the battery modelis an equivalent circuit with an open circuit voltage plus internalresistance [13].
3 Enhanced PEARS Algorithm
In general, when assuming that minimum fuel consumption isthe goal of optimal control, the problem of multimode HEVs canbe defined as in Eq. (15), where the engine speed xe; MG1 speedxMG1, MG2 speed xMG2, engine torque Te, MG1 torque TMG1,
MG2 torque TMG2, and the operating Mode can be used to deter-mine the fuel consumption
J ¼Ð tf
t0Lðxe;xMG1;xMG2; Te;TMG1; TMG2;Mode; tÞdt
subject to :SOCðt0Þ ¼ SOCðtf ÞS _OC ¼ f ðSOC;xe;xMG1;xMG2;Te; TMG1;TMG2;ModeÞSOCmin � SOC � SOCmax
Temin� Te � Temax
TMG1min� TMG1 � TMG1max
TMG2min� TMG2 � TMG2max
xemin� xe � xemax
xMG1min� xMG1 � xMG1max
xMG2min� xMG2 � xMG2max
Mode 2 Modeavailable
8>>>>>>>>>>>>>>>>>>><>>>>>>>>>>>>>>>>>>>:
(15)
where Lðxe;xMG1;xMG2;Te; TMG1;TMG2Þ is the rate of fuel con-sumption of the engine, and SOC is the battery state-of-charge,which is determined by the battery model [13]. Moreover, the tor-que and speed of the powertrain components are restricted by theiroperating constraints. The available modes are dependent on eachspecific design.
To solve this deterministic optimal control problem, thePEARS method has recently been developed and been found to beup to 10,000 times faster than DP [28]. This new methodologycan be applied to multiple PG hybrid powertrains. The problem inthe previous PEARS was that the mode shift sequence was de-pendent on the relative power-weighted efficiency (PE) amongdifferent modes and on battery energy consumption, which didnot consider mode shift feasibility and the mode shift sequencewas not optimal. In this paper, DP is applied to determine themode shift, while other controls are determined by the PEARSalgorithm. A comparison between the optimization results of thisenhanced PEARS algorithm (PEARSþ) and DP will be presentedand discussed.
3.1 The PEARS1
Algorithm. The process of the PEARSþ
method is presented in Fig. 6 and described below. Details arelaid out in steps.
3.1.1 Step 1: Target Cycle Analysis. The target drive cycle isdiscretized into a two-dimensional table with the X and Y axesbeing vehicle speed and torque demand, respectively. The tableentries represent the probability density of the cells. The cells arereferred to as the speed and torque cell (STC) in the subsequent dis-cussion. The reason we choose vehicle torque demand instead ofacceleration in Ref. [28] is that then the road grade can be consid-ered without adding another input dimension when discretizing thetarget cycle.
3.1.2 Step 2: Determine Efficiency for Each Mode. The PEfor every mode in each STC is examined. The 14 types of modesare separated into two categories depending on whether the engineis operational or not: EV modes and hybrid modes (where theengine-only operation is treated as a special case of hybrid modes).
3.1.2.1 Step 2.1: Determine EV modes efficiency. The effi-ciency of the EV modes is described by Eq. (16), where Ploss
EV
includes both battery loss and electric-drive loss and PinEV refers to
the power flowing into the system. In the driving scenario, PinEV is
the battery power. In the braking case, it is regenerative brakingpower. Note that friction braking augments regenerative braking,when the latter alone cannot satisfy the driver’s demand. Formodes with 1DOF, all possible torque combinations (TMG1 andTMG2) are compared and the best efficiency is recorded. Formodes with 2DOF, not only the torque combination but also thespeed combination (xMG1 and xMG2) is examined. The best possi-ble efficiency of each mode is calculated from Eq. (17). The effi-ciency of infeasible MG operation (i.e., infeasible MG speed or
Table 1 Mode types and criteria
Mode type Criteria
1 Series mode DOF¼ 2, Ceng¼ 0, Veng 6¼ 0,CMG1CMG2¼ 0, CMG1
2 þCMG22 6¼ 0
2 Compound split (3DOF) DOF¼ 33 Compound split (2DOF) DOF¼ 2, Ceng 6¼ 0,
CMG1CMG2 6¼ 0, rVMG1¼ 2, rVE¼ 2,rVMG2¼ 2, rEMG1¼ 2, rEMG2¼ 2
4 Input split DOF¼ 2, Ceng 6¼ 0,rVMG1 rVMG2¼ 2,CMG1CMG2 6¼ 0
5 Output split DOF¼ 2, Ceng 6¼ 0,rEMG1 rEMG2¼ 2,CMG1CMG2 6¼ 0
6 Parallel with EVT DOF¼ 2, Ceng 6¼ 0,(engineþ 1MG) CMG1 CMG2¼ 0, CMG1
2 þCMG22 6¼ 0
7 Parallel with EVT DOF¼ 2, Ceng 6¼ 0,(engineþ 2MGs in serial) CMG1CMG2 6¼ 0, rMG1MG2¼ 1
8 Engine only DOF¼ 1, Ceng 6¼ 0(fixed gear) CMG1
2 þCMG22 ¼ 0
9 Parallel with fixed gear DOF¼ 2, Ceng 6¼ 0(engineþ 2MGs, 2DOF) rVE¼ 1, CMG1CMG2 6¼ 0
10 Parallel with fixed gear DOF¼ 1, Ceng 6¼ 0(engineþ 2MGs, 1DOF) CMG1CMG2 6¼ 0
11 Parallel with fixed gear DOF¼ 1, Ceng 6¼ 0(engineþ 1MG, 1DOF) CMG1 CMG2¼ 0, CMG1
2 þCMG22 6¼ 0
12 EV (2MGs, 2DOF) DOF¼ 2, Ceng¼ 0, Veng(2)¼ 013 EV (2MGs, 1DOF) DOF¼ 1, Ceng¼ 0, Veng(2)¼ 0
CMG1CMG2 6¼ 014 EV (1MG, 1DOF) DOF¼ 1, Ceng¼ 0, Veng(2)¼ 0
CMG1 CMG2¼ 0, CMG12 þCMG2
2 6¼ 0
Journal of Dynamic Systems, Measurement, and Control DECEMBER 2015, Vol. 137 / 121006-5
Downloaded From: http://dynamicsystems.asmedigitalcollection.asme.org/ on 12/03/2015 Terms of Use: http://www.asme.org/about-asme/terms-of-use

torque) will be penalized with zero and the control with the high-est efficiency is then selected as the optimal control for each modein each STC. Meanwhile, the corresponding battery energy con-sumption will be recorded
gEV ¼ 1� PlossEV
PinEV
(16)
gEV�jxout; _xout
¼ max½gEVðTMG1;TMG2Þ�jxout ; _xout(17)
3.1.2.2 Step 2.2: Determine hybrid modes efficiency. Twopossible power sources for the hybrid modes are the engine andthe battery. In general, the power can be divided into four parts asshown in Table 2, where Pe_1þPe_2þPe_3 is the total enginepower, and Pbatt is the battery power consumed. Figure 7describes the power flow paths, where l is a flag indicatingwhether or not the battery assist is on.
The PE is calculated in Eq. (18), where Pfuel is the rate of fuelenergy injected, and subscripts G and M denote the generator(when the power is negative) and the motor (when the power ispositive or zero). ge_max, gG_max, and gM_max represent the highestefficiency of the engine, generator, and the motor. Since engineefficiency is much lower than that of the electrical system, nor-malization must be used; otherwise, the engine operation willhardly be selected.
Similar to the EV cases, all torque and speed combinations willbe examined. The control with the highest efficiency is then
Fig. 5 The SIMULINK diagram of a general multimode HEV powertrain system
Fig. 6 The PEARS 1 process
Table 2 Power flows in the hybrid powertrain
Power flows Description
Pe_1 Engine power flows through the generator to the batteryPe_2 Engine power flows through the generator to the motorPe_3 Engine power directly flows to the final drivePbatt Battery power
121006-6 / Vol. 137, DECEMBER 2015 Transactions of the ASME
Downloaded From: http://dynamicsystems.asmedigitalcollection.asme.org/ on 12/03/2015 Terms of Use: http://www.asme.org/about-asme/terms-of-use
selected for each hybrid mode in each STC. Meanwhile, the corre-sponding battery energy and fuel consumption are recorded
gHybrid xe;Teð Þ ¼Pe1
gGgbatt= gemaxg
Gmaxð ÞPfuel þ lPbatt
þPe2
gGgM= gemaxg
GmaxgMmaxð Þ
Pfuel þ lPbatt
þPe3=gemax
þ lPbattgbattgM=gMmax
Pfuel þ lPbatt
(18)
gHybrid�jxout ; _xout
¼ max½gHybridðxe;TeÞ�jxout; _xout(19)
3.1.3 Step 3: Calculate the Optimal Mode Shift With DP.Once the optimal control executions are determined for eachmode at each vehicle STC, the next step is to determine the modeto be used during the drive cycle.
The states and controls of the DP problem are shown in Table 3.The first state is battery energy consumption, which is calculatedfrom step 2; the second state and control are both operatingmodes. Note that the mode is a state because the cost functionincludes the mode shift penalty.
The cost function and constraint of the DP problem aredescribed in Eqs. (20) and (21): the optimization objective is tominimize fuel consumption while keeping the mode shift numberand final delta SOC small
J ¼ minXN
t¼1
ðLt þ c1Dx2e þ c2Dx2
MG1 þ c3Dx2MG2Þ
"
þaðSOCdesired � SOCNÞ2# (20)
Subject to
SOCmin � SOC � SOCmax (21)
where c1, c2, and c3 are the factors to penalize for speed difference,and a is the factor for the equality constraint of the final SOC.
This low-dimension DP problem only takes 15–30 s (dependingon the number of modes for the design being studied) to solve forthe 1372-s long Federal Urban Driving Schedule (FUDS).
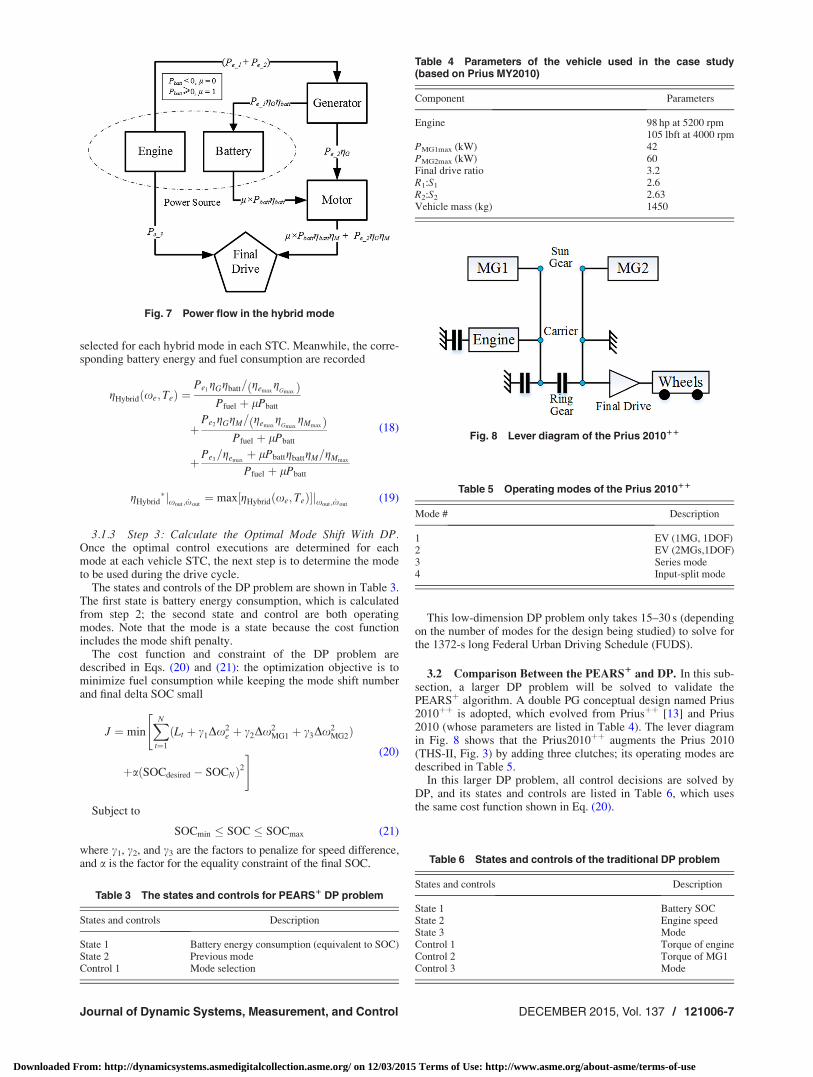
3.2 Comparison Between the PEARS1 and DP. In this sub-section, a larger DP problem will be solved to validate thePEARSþ algorithm. A double PG conceptual design named Prius2010þþ is adopted, which evolved from Priusþþ [13] and Prius2010 (whose parameters are listed in Table 4). The lever diagramin Fig. 8 shows that the Prius2010þþ augments the Prius 2010(THS-II, Fig. 3) by adding three clutches; its operating modes aredescribed in Table 5.
In this larger DP problem, all control decisions are solved byDP, and its states and controls are listed in Table 6, which usesthe same cost function shown in Eq. (20).
Table 3 The states and controls for PEARS1 DP problem
States and controls Description
State 1 Battery energy consumption (equivalent to SOC)State 2 Previous modeControl 1 Mode selection
Table 4 Parameters of the vehicle used in the case study(based on Prius MY2010)
Component Parameters
Engine 98 hp at 5200 rpm105 lbft at 4000 rpm
PMG1max (kW) 42PMG2max (kW) 60Final drive ratio 3.2R1:S1 2.6R2:S2 2.63Vehicle mass (kg) 1450
Fig. 8 Lever diagram of the Prius 201011
Table 5 Operating modes of the Prius 201011
Mode # Description
1 EV (1MG, 1DOF)2 EV (2MGs,1DOF)3 Series mode4 Input-split mode
Fig. 7 Power flow in the hybrid mode
Table 6 States and controls of the traditional DP problem
States and controls Description
State 1 Battery SOCState 2 Engine speedState 3 ModeControl 1 Torque of engineControl 2 Torque of MG1Control 3 Mode
Journal of Dynamic Systems, Measurement, and Control DECEMBER 2015, Vol. 137 / 121006-7
Downloaded From: http://dynamicsystems.asmedigitalcollection.asme.org/ on 12/03/2015 Terms of Use: http://www.asme.org/about-asme/terms-of-use

Both FUDS and the highway fuel economy test (HWFET)cycles are simulated, and the state/control trajectories for bothmethods in FUDS cycle are shown in Table 7 and Figs. 9 and 10.Note that the vehicle is running on the charge-sustaining drive,which means the final SOC must be the same as the initial SOC.
From Table 7, it can be observed that PEARSþ results are near-optimal, all while being much faster to compute. In addition, thePEARSþ results are also qualitatively similar to DP. The differ-ence in fuel economy is less than 3.5%, but the PEARSþmethodis about 10,000 times faster than the traditional DP, making it fea-sible for fast prototype design and sizing, even for on-board modelpredictive control if a short future driving profile can be forecast.In Sec. 4, we use PEARSþ as the optimization approach for gener-ating energy management strategies for the candidate designs.
4 Case Study
The case study presented here combines the modeling proce-dure introduced in Sec. 2 and PEARSþ described in Sec. 3 to findoptimal and suboptimal designs.
In this study, we only consider cases when two powertrain com-ponents are connected to each of the PGs, since having threepowertrain components on the same PG will likely lead to verylimited operation flexibility. Thus, the number of configurations isC2
4P23P2
3 ¼ 216. In addition, topologically, the remaining 216 con-figurations can be classified into two types, depending on whetheror not the engine and output shaft are on the same PG, as depictedin Fig. 11. For type (a), there are C1
2C12P2
3P23 ¼ 144 configurations
and for type (b), there are C12P2
3P23 ¼ 72 configurations. The THS-
II Drive design, which is used in the current generation of Prius,Camry hybrid, and Highlander hybrid, is an example of category(a) configuration, as shown in Fig. 9.
Due to the large design pool, in this paper, we choose THS-IIand use the powertrain components of Prius 2010 in Table 4. Inother words, we are only exploring the clutch placement but notthe design search in the configuration or the sizing dimension.Searching those dimensions may result in even better designs.
While we start by studying the design cases with all 16 clutches,it is clear that the resulting design only serves as a benchmark andwould be difficult to implement in practice. Moreover, inasmuch aswe likely do not need all the modes enabled by 16 clutches. In thisstudy, we will further investigate the cases where three clutchesand one fixed connection are used because the three clutches maylead to as many as seven different modes, resulting in many feasibleand suboptimal designs. In addition, the Chevy Volt uses threeclutches, which means it must be feasible in practice.
For double PGs, 16 clutches may have 216¼ 65,536 clutchstates in theory. After the screening process, for configurationsdescribed in Fig. 11(a), only 101 feasible and nonredundantmodes remain, when the two MGs are treated as different compo-nents. Figure 12 shows the distribution of the feasible and
Fig. 9 Trajectories of DP in the FUDS cycle
Table 7 Optimization results of PEARS1 and traditional DP
Method Fuel consumption (MPG)/difference Computation time (s)a
FUDS HWFET FUDS HWFET
PEARSþ 69.9 3.1% 56.8 3.2% 30 17DP 72.1 58.7 301,840 168,520
aThe results are based on a desktop computer with Intel Xeon E5-1620(3.7GHz) and 32 GB RAM.
121006-8 / Vol. 137, DECEMBER 2015 Transactions of the ASME
Downloaded From: http://dynamicsystems.asmedigitalcollection.asme.org/ on 12/03/2015 Terms of Use: http://www.asme.org/about-asme/terms-of-use

nonredundant modes for the configuration used in THS-II andconfigurations of category (a). The reason all 144 configurationsof category (a) have the same number and type of modes is thatvarying the connection of a node on one PG will only change therelative speed ratio, but not the function of the mode.
4.1 The “Utopian” Design (Adding 16 Clutches). The Uto-pian design (when all clutches shown in Fig. 2 are used) can shiftamong all 101 modes. The results serve as the idealized benchmark.
The fuel consumption, selected operating modes, and their fre-quency in both city and highway cycles are shown in Figs. 13 and14. It can be observed that the EV modes and hybrid modes are usedalmost evenly. The power-split mode and parallel mode with fixed-gear are the preferred hybrid modes in city and highway driving,respectively. Even though only five mode types are shown in Fig.14, about ten different modes are used. To enable all ten modes, tenof the 16 clutches are needed, which is somewhat impractical toimplement due to the added cost and system complexity.
4.2 Power-Based Acceleration Analysis. Before applyingthe PEARSþ algorithm, drivability criteria will be used to screen
out designs with undesirable acceleration performance, whichhelps to focus on the more practical part of the design pool.
To enable such screening, a systematic methodology must bedeveloped to find the optimal mode shift sequence for achievingthe best acceleration performance. In this section, a power-baseddrivability analysis is used.
First, we divide the total vehicle speed interval of [0,60] mph into30 subintervals with 2 mph increment. In each subinterval, the vehi-cle speed is assumed to be at the mean value of the interval, and themaximum possible output power of each mode is calculated: for themode with 1DOF, this is trivial since the maximum power occurswhen each power component is generating its maximum torque; formodes with more than 1DOF, the acceleration of the engine will beassumed to be zero for steady-state analysis, and all possible speedcombinations will be evaluated, selecting the state and control withthe highest power output.
Fig. 10 Trajectories of PEARS1 in the FUDS cycle
Fig. 11 Two types of configurationsFig. 12 All feasible and nonredundant modes for the configu-ration used in Prius 2010, grouped into 14 mode types
Journal of Dynamic Systems, Measurement, and Control DECEMBER 2015, Vol. 137 / 121006-9
Downloaded From: http://dynamicsystems.asmedigitalcollection.asme.org/ on 12/03/2015 Terms of Use: http://www.asme.org/about-asme/terms-of-use

Fig. 13 Optimal modes used in the FUDS and HWFET cycles
Fig. 14 The mode types and usage frequency (percentage of time each mode typeis used) of the Utopian design
Fig. 15 The mode shift and acceleration profile of the Utopiandesign
Table 8 The PEARS1 optimization result for FUDS and HWFETcycle, respectively
Cycle\design Fuel consumption (MPG)
Prius 2010 Prius 2010þþBest with
three clutches Utopian
FUDS 67.6 69.9 73.3 73.8HWFET 56.2 56.8 59.2 59.9
Fig. 16 Optimization results comparing three-clutch designsand the benchmarks
121006-10 / Vol. 137, DECEMBER 2015 Transactions of the ASME
Downloaded From: http://dynamicsystems.asmedigitalcollection.asme.org/ on 12/03/2015 Terms of Use: http://www.asme.org/about-asme/terms-of-use
With this methodology, the mode selection, component state,and control profile for the Utopian design are generated, as shownin Fig. 15. Note that the smoothness and time for mode shifts arenot considered in this paper.
4.3 Configurations With Three Clutches and One FixedConnection. For practical considerations, we consider the subop-timal cases when only three clutches and one fixed connection areallowed, which leads to C1
16 C315 ¼ 7280 different “designs.” Each
combination may have up to seven different modes. In the follow-ing context, “a design” refers to one such particular combinationof clutch allocation for the THS-II configuration. The launchingperformance constraint is set at 8.5 s for 0–60 mph acceleration.After the drivability screening procedure, 308 of the 7280 designswere determined to be feasible and advanced to the fuel economyevaluation step. Because DP is computationally too expensive forsolving the optimization problem with such a large design space,we will use PEARSþ to identify the optimal design.
The optimization results from PEARSþ for FUDS and HWFETcycle are shown in Table 8. It can be found that, even when onlythree clutches and one fixed connection are used, similar fueleconomy can be achieved, compared to the Utopian design.
It could be that the best design for the FUDS cycle may not bethe same as the one for the HWFET cycle. To reflect a balanced
fuel economy performance in both city and highway driving, weuse a weighted fuel economy following the Environmental Protec-tion Agency’s practice of using 55% weight on the city cycle(FUDS) and 45% on the highway cycle (HWFET).
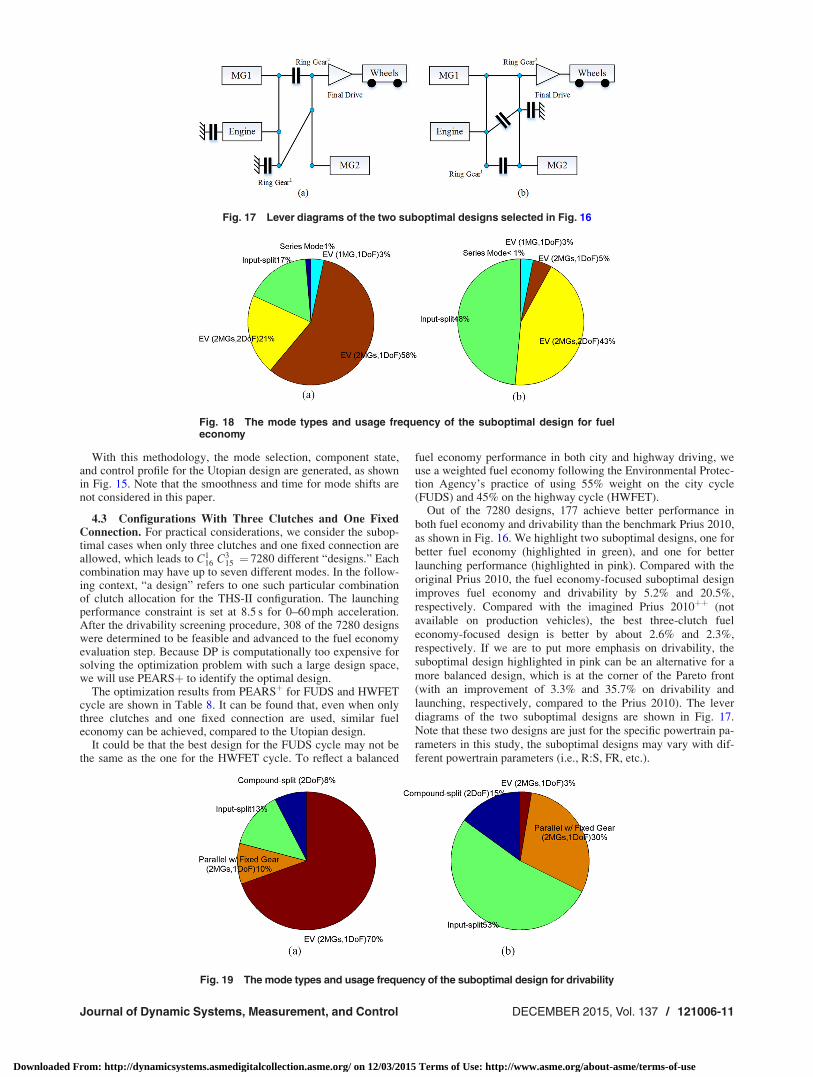
Out of the 7280 designs, 177 achieve better performance inboth fuel economy and drivability than the benchmark Prius 2010,as shown in Fig. 16. We highlight two suboptimal designs, one forbetter fuel economy (highlighted in green), and one for betterlaunching performance (highlighted in pink). Compared with theoriginal Prius 2010, the fuel economy-focused suboptimal designimproves fuel economy and drivability by 5.2% and 20.5%,respectively. Compared with the imagined Prius 2010þþ (notavailable on production vehicles), the best three-clutch fueleconomy-focused design is better by about 2.6% and 2.3%,respectively. If we are to put more emphasis on drivability, thesuboptimal design highlighted in pink can be an alternative for amore balanced design, which is at the corner of the Pareto front(with an improvement of 3.3% and 35.7% on drivability andlaunching, respectively, compared to the Prius 2010). The leverdiagrams of the two suboptimal designs are shown in Fig. 17.Note that these two designs are just for the specific powertrain pa-rameters in this study, the suboptimal designs may vary with dif-ferent powertrain parameters (i.e., R:S, FR, etc.).
Fig. 17 Lever diagrams of the two suboptimal designs selected in Fig. 16
Fig. 18 The mode types and usage frequency of the suboptimal design for fueleconomy
Fig. 19 The mode types and usage frequency of the suboptimal design for drivability
Journal of Dynamic Systems, Measurement, and Control DECEMBER 2015, Vol. 137 / 121006-11
Downloaded From: http://dynamicsystems.asmedigitalcollection.asme.org/ on 12/03/2015 Terms of Use: http://www.asme.org/about-asme/terms-of-use
From the mode selection of the Utopian design and the two sub-optimal three-clutch designs (Figs. 18 and 19), we can see that EVmodes are very frequently used in both city and highway driving.When the engine is turned on (for charge sustaining), the most fre-quently used modes can be input-split, parallel, or compound-splitmode types. We believe the best mode selection depends on con-figuration, component sizes, and the drive cycle. Having clutchesand multiple-modes to add to the flexibility in mode selection isdefinitely a valuable addition.
It should be noted that, in this research, component sizing andpowertrain parameters have not been optimized. One can adoptthis similar process to study the sizing problem. The main purposeof the case study was to demonstrate the potential of this proposeddesign methodology. The preferred modes and winning designwill likely vary with the selected powertrain configuration andcomponent sizes.
It should also be noted that losses such as clutch friction lossand transmission loss are not considered in this design procedure.More sophisticated model will be used in the next design proce-dure, once the final design candidates are identified.
5 Conclusion
In this research, an automated modeling method and a fast sub-optimal control procedure are developed that can be used toexplore a large number of power-split configurations with PGsand clutches. We also developed methods to identify and elimi-nate infeasible and redundant modes and established a power-based acceleration analysis algorithm.
The proposed design procedure was applied to the THS-II con-figuration used in the Prius 2010 model year. The goal was todetermine whether clutches should be added to improve launchingperformance and fuel economy, and if so, where they should belocated. We analyzed both a Utopian design in which all 16 possi-ble clutches are used, and a more practical scenario, where onlythree clutches and a fixed connection are allowed. We found 177designs that achieve better fuel economy and better launching per-formance than the benchmark THS-II configuration (used in theMY 2010 Prius) using the same engine and electric machines. Afuel economy-focused suboptimal design is better by 5.2% and20.5% in fuel economy and drivability, respectively. When driv-ability is emphasized, an alternative design achieves a 35.7%shorter 0–60 acceleration time than the benchmark, yet stillimproves 3.3% in fuel economy. We should point out that theoptimal design may vary with the configurations and componentsizes. Thus, the key contribution of this research may be neitherthe identified suboptimal designs nor a comparison of the per-formance of multimode HEVs with single-mode HEVs, but rathera systematic design methodology for multimode HEVs.
Acknowledgment
This paper is based upon the work supported by the Departmentof Energy under Award No. DE-PI0000012. The second authorwas supported by NSFC under Grant No. 51205228.
References[1] 2012, “Part II: Environment Protection Agency,” Federal Register, Vol. 77, pp.
62623–63200.[2] Mi, C., Masrur, M. A., and Gao, D., 2011, Hybrid Electric Vehicles: Principles
and Applications With Practical Perspectives, Wiley Online Library, London.
[3] Ehsani, M., Gao, Y., and Emadi, A., 2009, Modern Electric Hybrid Electricand Fuel Cell Vehicles: Fundamentals, Theory, and Design, 2nd ed., CRCPress, Boca Raton.
[4] Miler, M., Holmes, A., Conlon, B., and Savagian, P., 2011, “The GM ‘Voltec’4ET50 Multi-Mode Electric Transaxle,” SAE Int., 4(1), pp. 1102–1114.
[5] 2010, “Alternative Fuels and Advanced Vehicles Data Center, Data, Analysis,and Trends: Vehicle—HEV Sales by Model,” Last accessed Sept. 20, 2013,http://www.afdc.energy.gov/afdc/data/vehicles.html
[6] Schmidt, M. R., 1999, “Two-Mode, Compound-Split Electro-Mechanical Vehi-cular,” U.S. Patent No. 5,931,757.
[7] Rahman, K., and Anwar, M., 2011, “The Voltec 4ET50 Electric Drive System,”SAE Int., 4(1), pp. 323–337.
[8] Si, B., 2011, “Reconfiguration Hybrid Powertrain,” U.S. Patent No. 0,319,211.[9] Seo, K., and Yang, H., 2012, “Powertrain for Hybrid Vehicle,” U.S. Patent No.
8,147,367.[10] Muta, K., Yamazaki, M., and Tokieda, J., 2004, “Development of New-
Generation Hybrid System THS II—Drastic Improvement of Power Perform-ance and Fuel Economy,” SAE Technical Paper No. 2004-01-0064.
[11] Bucknor, N. K., Hendrickson, J. D., and Raghavan, M., 2007, “ElectricallyVariable Transmission Having Two Planetary Gear Sets With One Fixed Inter-connection,” U.S. Patent No. 7,198,373.
[12] Si, B., 2011, “Dual Mode Input Split Compound Split Configuration EPPVTransmission,” U.S. Patent No. 8,075,435.
[13] Zhang, X., Li, C.-T., Kum, D., and Peng, H., 2012, “Priusþ and Volt�: Config-uration Analysis of Power-Split Hybrid Vehicles With a Single PlanetaryGear,” IEEE Trans. Veh. Technol., 61(8), pp. 3544–3552.
[14] Liu, J., and Peng, H., 2010, “A Systematic Design Approach for Two PlanetaryGear Split Hybrid Vehicles,” Veh. Syst. Dyn., 48(11), pp. 1395–1412.
[15] Li, C.-T., and Peng, H., 2010, “Optimal Configuration Design for HydraulicSplit Hybrid Vehicles,” American Control Conference, Baltimore, MD,pp. 5812–5817.
[16] Hermance, D., 1999, “Toyota Hybrid System,” SAE TOPTEC Conference,Albany, NY.
[17] Jalil, N., Kheir, N., and Salman, M., 1997, “A Rule-Based Energy ManagementStrategy for a Series Hybrid Vehicle,” American Control Conference,Albuquerque, NM, June 4–6, pp. 689–693.
[18] Pagalelli, G., Delprat, S., Guerra, T., Rimaux, J., and Santin, J., 2002,“Equivalent Consumption Minimization Strategy for Parallel Hybrid Power-trains,” 55th IEEE Vehicular Technology Conference, pp. 2076–2081.
[19] Sciarretta, A., Back, M., and Guzzella, L., 2004, “Optimal Control of ParallelHybrid Electric Vehicles,” IEEE Trans. Veh. Technol., 12(3), pp. 352–363.
[20] Delprat, S., Lauber, J., Guerra, T. M., and Rimaux, J., 2004, “Control of a Paral-lel Hybrid Powertrain: Optimal Control,” IEEE Trans. Veh. Technol., 53(3),pp. 872–881.
[21] Delprat, S., Guerra, T. M., and Rimaux, J., 2002, “Control Strategies for HybridVehicles: Optimal Control,” 56th IEEE Vehicular Technology Conference,Vancouver, BC, Canada, pp. 1681–1685.
[22] Kim, N., Cha, S., and Peng, H., 2010, “Optimal Control of Hybrid ElectricVehicles Based on Pontryagin’s Minimum Principle,” IEEE Trans. ControlSyst. Technol., 19(5), pp. 1279–1287.
[23] Lin, C.-C., Peng, H., Grizzle, J., and Kang, J.-M., 2003, “Power ManagementStrategy for a Parallel Hybrid Electric Truck,” IEEE Trans. Control Syst. Tech-nol., 11(6), pp. 839–849.
[24] Liu, J., and Peng, H., 2006 “Control Optimization for a Power-Split HybridVehicle,” American Control Conference, Minneapolis, MN, pp. 466–471.
[25] Murgovski, N., Johannesson, L., Sjoberg, J., and Egardt, B., 2012, “ComponentSizing of a Plug-In Hybrid Electric Powertrain Via Convex Optimization,”Mechatronics, 22(1), pp. 106–120.
[26] Hu, X., Murgovski, N., Johannesson, L., and Egardt, B., 2013, “Energy Effi-ciency Analysis of a Series Plug-In Hybrid Electric Bus With Different EnergyManagement Strategies and Battery Sizes,” Appl. Energy, 111, pp. 1001–1009.
[27] Hu, X., Murgovski, N., Johannesson, L., and Egardt, B., 2014, “Comparison ofThree Electrochemical Energy Buffers Applied to a Hybrid Bus PowertrainWith Simultaneous Optimal Sizing and Energy Management,” IEEE Trans.Intell. Transp. Syst., 15(3), pp. 1193–1205.
[28] Zhang, X., Peng, H., and Sun, J., 2015, “A Near-Optimal Energy ManagementStrategy for Rapid Component Sizing of Multimode Power Split Hybrid Vehi-cles,” IEEE Trans. Control Syst. Technol., 23(2), pp. 609–618.
[29] Benford, H., and Leising, M., 1981, “The Lever Analogy: A New Tool inTransmission Analysis,” SAE Paper No. 810102.
[30] Olszewski, M., 2011, “Evaluation of the 2010 Toyota Prius Hybrid SynergyDrive System,” Oak Ridge National Laboratory Report.
[31] Kawamoto, N., Naiki, K., Kawai, T., Shikida, T., and Tomatsuri, M., 2009,“Development of New 1.8-Liter Engine for Hybrid Vehicles,” SAE TechnicalPaper No. 2009-01-1061.
121006-12 / Vol. 137, DECEMBER 2015 Transactions of the ASME
Downloaded From: http://dynamicsystems.asmedigitalcollection.asme.org/ on 12/03/2015 Terms of Use: http://www.asme.org/about-asme/terms-of-use