efficient management of geographically distributed … research internship report efficient...
TRANSCRIPT
HAL Id: dumas-00854967https://dumas.ccsd.cnrs.fr/dumas-00854967
Submitted on 28 Aug 2013
HAL is a multi-disciplinary open accessarchive for the deposit and dissemination of sci-entific research documents, whether they are pub-lished or not. The documents may come fromteaching and research institutions in France orabroad, or from public or private research centers.
L’archive ouverte pluridisciplinaire HAL, estdestinée au dépôt et à la diffusion de documentsscientifiques de niveau recherche, publiés ou non,émanant des établissements d’enseignement et derecherche français ou étrangers, des laboratoirespublics ou privés.
Efficient Management of Geographically Distributed BigData on Clouds
Rui Wang
To cite this version:Rui Wang. Efficient Management of Geographically Distributed Big Data on Clouds. Distributed,Parallel, and Cluster Computing [cs.DC]. 2013. <dumas-00854967>

MASTER RESEARCH INTERNSHIP
REPORT
Efficient Management of Geographically Distributed Big Data onClouds
Author:Rui WANG
Supervisors:Alexandru COSTAN
Radu TUDORANGabriel ANTONIU
Luc BOUGEKerData, INRIA

Contents
1 Introduction 3
2 Background 52.1 Cloud Computing . . . . . . . . . . . . . . . . . . . . . . . . . . . . . . . . . . . 52.2 Data Movement . . . . . . . . . . . . . . . . . . . . . . . . . . . . . . . . . . . . 62.3 Bridging Data in the Cloud . . . . . . . . . . . . . . . . . . . . . . . . . . . . . 82.4 State of the Art . . . . . . . . . . . . . . . . . . . . . . . . . . . . . . . . . . . . . 10
3 Our contribution: An Environment-Aware System for Geographically DistributedData Transfers 133.1 Motivation . . . . . . . . . . . . . . . . . . . . . . . . . . . . . . . . . . . . . . . 133.2 Design Principles . . . . . . . . . . . . . . . . . . . . . . . . . . . . . . . . . . . 133.3 Architecture Overview . . . . . . . . . . . . . . . . . . . . . . . . . . . . . . . . 143.4 Cloud Environment Awareness Modeling . . . . . . . . . . . . . . . . . . . . . 14
4 Functional Description and Implementation 184.1 Functional Description . . . . . . . . . . . . . . . . . . . . . . . . . . . . . . . . 184.2 Implementation . . . . . . . . . . . . . . . . . . . . . . . . . . . . . . . . . . . . 19
5 Evaluation 245.1 Experimental Setup . . . . . . . . . . . . . . . . . . . . . . . . . . . . . . . . . . 245.2 Assessing the Cloud Infrastructure Variability . . . . . . . . . . . . . . . . . . 245.3 Synthetic Benchmarks . . . . . . . . . . . . . . . . . . . . . . . . . . . . . . . . 255.4 Experimenting with a Real-life Neuroimaging Application . . . . . . . . . . . 31
6 Conclusion 336.1 Contributions . . . . . . . . . . . . . . . . . . . . . . . . . . . . . . . . . . . . . 336.2 Future Works . . . . . . . . . . . . . . . . . . . . . . . . . . . . . . . . . . . . . 336.3 Lessons Learnt From the Internship . . . . . . . . . . . . . . . . . . . . . . . . 34
1

Abstract
Nowadays cloud infrastructures allow storing and processing increasing amounts ofscientific data. However, most of the existing large scale data management frameworksare based on the assumption that users deploy their data-intensive applications in singledata center, few of them focus on the inter data centers data flows. Managing data acrossgeographically distributed data centers is not trivial as it involves high and variable la-tencies among sites which come at a high monetary cost. In this report, we introducean uniform data management system for disseminating scientific data across geographi-cally distributed sites. Our solution is environment-aware, as it monitors and models theglobal cloud infrastructure, and offers predictable data handling performances for trans-fer cost and time. In terms of efficiency, it leverages for applications the possibility toset the tradeoff to be done between money and time and optimizes the transfer strategyaccordingly. A prototype of our system has been implemented in the Windows AzureCloud, and we obtain some encouraging results from the extensive evaluations.
Keywords: Cloud Computing, Data Transfer, Environment-Aware, Parallel TCPstreams
Acknowledgement
I would like to address my thanks to Radu Tudoran and Alexandru Costan. We have had anefficient collaboration environment for this research project: from brainstorming sessions,system architecture conception to the implementation and the performance evaluation. Iwould like to thank Luc Bougé for his valuable and helpful suggestions that helped meimprove this report. I am also grateful to Gabriel Antoniu for his support that helped me tosolve many issues. I am thankful to Shadi Ibrahim, Houssem Eddine Chihoub, Zhe Li andYue Li for their encouragement and helpful suggestions.
2
1 Introduction
It is generally accepted that we live in a data explosion era. Just as the general manager ofMicrosoft SQL, Mr. Eron Kelly remarks [18], “In the next five years, we’ll generate more dataas humankind than we generated in the previous 5,000 years.” With data sets continuouslygrowing (from terabytes to petabytes) and more complex, scientists are faced with new chal-lenges. They refer to four essential aspects: data collection from distributed sources, datamanagement, data analysis and data publishing. Nevertheless, the traditional approachesare no longer useful to handle and process those enormous quantities of data. The scientistsrequire new data-driven and data-intensive applications which enable them to unify mas-sive pieces of knowledge, to discover the insight of the science phenomenon and to makedecisions. These lead to a new topic in the research domain: Big Data.
Cloud computing is another successful paradigm which is globally sweeping across theindustrial and research domains over last five years. Cloud can be seen as a possible answerto the Big Data challenges due to the following reasons: Availability. To the cloud consumer,the available compute and storage resources often appear to be unlimited and can be appro-priated in any quantity at any time. Accessibility. The broad network facilitates the cloudconsumers to access the cloud resources by heterogeneous thin or thick client platforms.Elasticity. The computational and storage resources can be elastically provisioned and re-leased in the cloud. Low cost. There is no upfront cost, no hardware investments, no mainte-nance cost of the infrastructure for the consumers to run their applications in the cloud, theypay only what they use. Above all, cloud becomes a very important step forward in orderto deal with the Big Data challenges. Scientists start to leverage the cloud resources to store,manage and process these large data sets by deploying their data-intensive applications inthe cloud.
Typically, a Big Data experiment executed in a distributed environment has the follow-ing pattern: the scientists run the analysis programs at some facilities which are not lo-cated on the same site where the data are generated. There are several reasons for that [4]:Firstly, many experimental facilities, and even some supercomputers, provide only limitedstorage space and post-processing facilities. Secondly, raw data can be of interest to manyresearchers other than the individual or team who first generated it. Finally, as science be-comes more complex and interdisciplinary, people are eager to combine data from multiplesources. Thus, those challenges motivate scientists to pursue efficient data movement strate-gies for geographically distributed Big Data.
Let us zoom on the data movement services in the cloud environment. The public cloudproviders mainly adopt data center based infrastructure. All the resources are installed atthe multiple geographically distributed data centers and each data center is connected viaWAN to another. Most scientists mainly focus on the two kinds of data flows in the cloud:the data flow between customers and cloud via internet, the intra data center data flowthat enables efficient scheduling of the compute jobs when running some applications. Fewof them address the inter data centers data flows. Nevertheless, more and more scientistsconsider scaling up their applications to be hosted across multiple data centers because of thegrowing data sets and complex computing algorithms. Thus, an efficient data managementservice dealing with the inter data centers data flows becomes imperative. The purpose ofour work is to fill this gap. There are a set of challenges that need to be taken into account:
3

WAN environment, data center resource capacity, user-perceived latency and the cost, etc.All of them will be detailed in the following section.
During this internship, we introduce a cloud-based data transfer system that supportslarge-scale data dissemination across geographically distributed data centers. The key ideaof our solution is to accurately and robustly predict I/O and transfer performance in adynamic cloud environment in order to judiciously decide how to perform transfer opti-mizations over federated data centers. Estimates must be dynamically updated to reflectchanging workloads, varying network-device conditions and configurations due to multi-tenancy. Based on this monitoring feedbacks, we design performance models for the cloudresources. They are further leveraged to predict the best combination of protocol and transferparameters (e.g., flow count, multicast enhancement, replication degree) in order to maxi-mize throughput or minimize costs, according to application requirements. To validate ourapproach, we have implemented the above system as part of the Azure Cloud [26] so thatapplications could use it following a Software as a Service approach.
The rest of this report is organized as follows: In Section 2, we describe the background,including problem statement and some related work. Section 3 presents the motivations andthe overview of our contributions. We address the functional descriptions of each compo-nents and implementations in Section 4. An extensive evaluation with synthetic benchmarkswill be detailed in Section 5. Finally, in Section 6, we summarize the lesson learnt from thisinternship and the future work.
4

2 Background
In this section, we explain the geographical data management issues and the backgroundof our work. We present the cloud computing paradigm at first, including its origin anddifferent logical models. Then we address the general data management and data movementissues. By bringing geographically distributed data in the cloud, we detail the problemstatement so that the readers could better understand our motivations and challenges. Thelast part refers to the related work. To sum up, this section generally states that there is noappropriate solution which could handle efficiently the geographically distributed data inthe cloud.
2.1 Cloud Computing
Along with the growing demands of computational powers and storages, the new comput-ing systems are required to tackle those capacity barriers. The parallelization of computationon a large amount of machines provides a possible solution. From the Grid Computing to thePeer-to-Peer (P2P) architectures, scientists and researchers proposed number of frameworksto enable machines to cooperate and work in parallel. Over the last decade, the commercialsoftware providers have started to use their available resources in a new way. They pro-vide the facilities available in the data centers as a commercial services, allowing outsidecustomers to rent their available computational and storage resources on-demand as theelectricity or tap water is. This is the origin of the cloud computing paradigm. Even thoughmany people use cloud computing, few of them agree on a specific definition. The definitionfrom National Institute of Standards and Technology [13] is one of the most accurate in ouropinion:
Cloud computing is a model for enabling ubiquitous, convenient, on-demandnetwork access to a shared pool of configurable computing resources (e.g., net-works, servers, storage, applications, and services) that can be rapidly provi-sioned and released with minimal management effort or service provider inter-action.
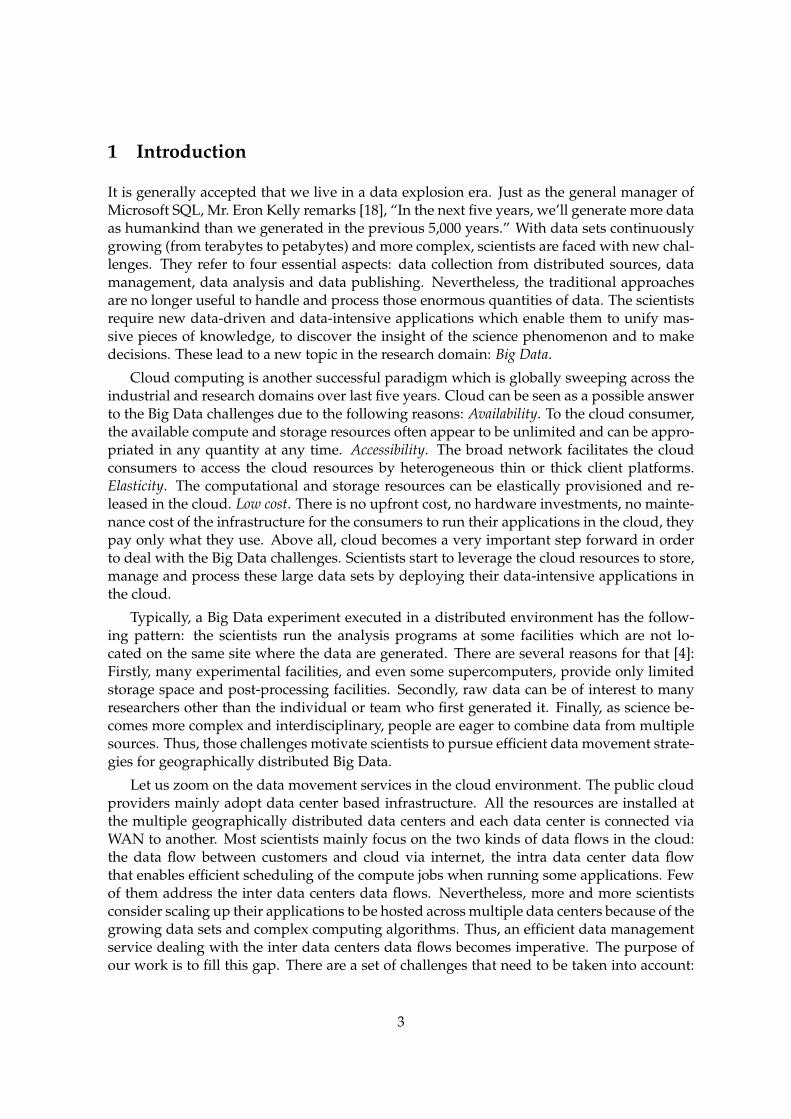
As shown in Figure 1, cloud computing providers offer their services based on severalfundamental models from low level to high level abstractions: Infrastructure as a Service(IaaS), Software as a Service (SaaS), Platform as a Service (PaaS).
Infrastructure as a Service It is the basic cloud model where the cloud providers offer theservices as the virtual machine instances. The customers install their operating system im-ages (The OS images can be also provided by the cloud) on the virtual machines to deploythe applications. The customers rent and handle the resources including virtual machines,servers, storages, networks on infrastructure basis. Amazon EC2 [17], Nimbus [22], Open-Nebula [23] are some of the examples of the IaaS level providers.
Platform as a Service It delivers customers a platform including programming languageexecution environment, database, and web server, etc. For the developers who work at the
5
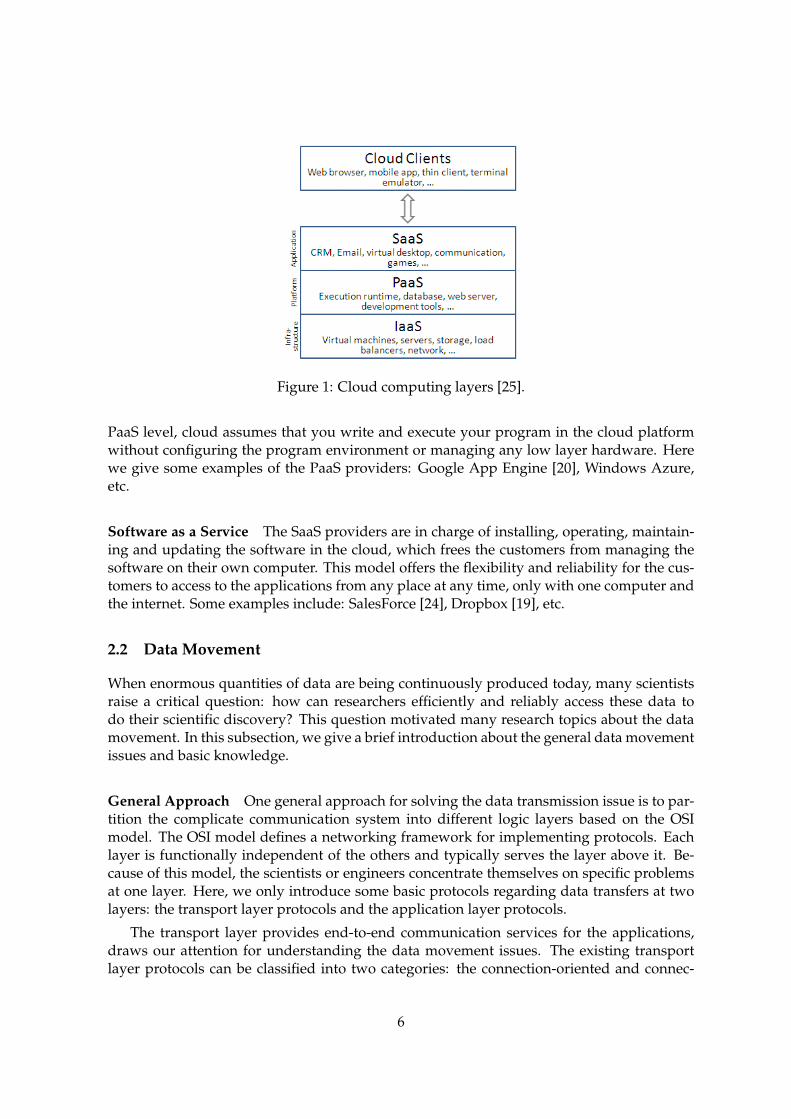
Figure 1: Cloud computing layers [25].
PaaS level, cloud assumes that you write and execute your program in the cloud platformwithout configuring the program environment or managing any low layer hardware. Herewe give some examples of the PaaS providers: Google App Engine [20], Windows Azure,etc.
Software as a Service The SaaS providers are in charge of installing, operating, maintain-ing and updating the software in the cloud, which frees the customers from managing thesoftware on their own computer. This model offers the flexibility and reliability for the cus-tomers to access to the applications from any place at any time, only with one computer andthe internet. Some examples include: SalesForce [24], Dropbox [19], etc.
2.2 Data Movement
When enormous quantities of data are being continuously produced today, many scientistsraise a critical question: how can researchers efficiently and reliably access these data todo their scientific discovery? This question motivated many research topics about the datamovement. In this subsection, we give a brief introduction about the general data movementissues and basic knowledge.
General Approach One general approach for solving the data transmission issue is to par-tition the complicate communication system into different logic layers based on the OSImodel. The OSI model defines a networking framework for implementing protocols. Eachlayer is functionally independent of the others and typically serves the layer above it. Be-cause of this model, the scientists or engineers concentrate themselves on specific problemsat one layer. Here, we only introduce some basic protocols regarding data transfers at twolayers: the transport layer protocols and the application layer protocols.
The transport layer provides end-to-end communication services for the applications,draws our attention for understanding the data movement issues. The existing transportlayer protocols can be classified into two categories: the connection-oriented and connec-
6
Figure 2: Network sockets event flow [25].
tionless. Transmission Control Protocol (TCP) provides a connection-oriented, reliable, or-dered delivery of the byte streams between the processes on different computers. Connec-tions must be properly set up in a three-step handshake process before data transfer. Morecomplex mechanisms are required: congestion control, error checking, etc. In contract, UserDatagram Protocol (UDP) is connectionless. With minimum control mechanism, UDP pro-vides a simple, fast, message-based data communication which is an appropriate option forthe real time stream systems instead of data transmission.
The application layer is reserved for process-to-process communications across an Inter-net Protocol computer network. File Transfer Protocol (FTP) and Hypertext Transfer Proto-col (HTTP) are two of the widely used fundamental application layer protocols for the datatransfer. FTP is the standard application protocol to transfer the files to another host overTCP based network. FTP is designed based on the client-server architecture. HTTP aims toachieve the data transfer specifically for the World Wide Web based on the request-responsemodel.
Network Sockets Network sockets [25] define a general abstraction of the inter processcommunication flow across the computer network. A socket is characterized by a uniquecombination of the IP address, the port number and the transport layer protocol. The mech-anism ensures that sockets deliver the data packets to the destination machine on the appro-priate application process. The Figure 2 describes the typical events flow for a connection-oriented (server and client) socket session.
The endpoint is created via the socket API for the potential communication and datatransmission. Application can bind a unique name to the socket. Servers must bind a namein order to be accessible. Then the server activates the listen API to indicate the willingnessof accepting the connection requests from the client. After initializing the connect API, theserver application issues the accept API. Now the connection is established between stream
7

sockets and server or client can use the data transfer APIs to communicate. Once any oneissues a close command, the connection will be stopped and the system resources will bereleased.
Performance Metrics for the Data Movement It is important to have some performancemetrics to measure the data movement. Round-trip time (RTT) refers to the length of timethat a data packet to be sent into the network plus the length of time that it takes for anacknowledgement of that packet to be received. In another words, RTT is the time delayof transmission times between two nodes in the network. In the IP network, we usuallyuse Internet Control Message Protocol (ICMP) echo request to obtain the RTT between thehosts. In the computer science, the bandwidth is a measurement of the bit-rate for the avail-able resources for the data communications. In other words, it indicates the capacity of thecommunication links. It can be expressed in bits per second. Throughput aims at measuringthe average rate of successful message delivery over a communication channel. Bandwidthcould be considered as the theoretical maximum throughput of the system, and the through-put essentially means the bandwidth consumption.
Performance Improvement for the Data Transfer One of the approaches to improve thedata transfer throughput is by exploiting the network and the end-system parallelism or byusing a hybrid approach between them. Building on the network parallelism, the transferperformance can be enhanced by routing data via intermediate nodes chosen to increaseaggregate bandwidth. Multi-hop path splitting solutions [8] replace a direct TCP connec-tion between the source and destination by a multi-hop chain through some intermediatenodes. Multi-pathing [14] employs multiple independent routes to simultaneously transferdisjoint chunks of a file to its destination. These solutions come at some costs: under heavyload, per-packet latency may increase due to timeouts while more memory is needed forthe receive buffers. On the other hand, endsystem parallelism can be exploited to improveutilization of a single path. This can be achieved by means of parallel streams [6] or con-current transfers [12]. Although using parallelism may improve throughput in certain cases,one should also consider system configuration since specific local constraints (e.g., low diskI/O speeds or over-tasked CPUs) may introduce bottlenecks. Another alternative approacheemerged in the context of the BitTorrent based which can aggregate the available bandwidthfor transfering the data.
2.3 Bridging Data in the Cloud
As we discovered, most of the existing public cloud providers widely accept the one datacenter basis for user deployments: the cloud customers are free to select any data centerto host their applications, whereas, the deployments are limited to locate in only one datacenter. There is no seamless /automatic mechanism for scaling their hosted services acrossmultiple geographically distributed data centers [2]. Furthermore, most of the current dis-tributed computing frameworks have been designed with the restriction that all the computenodes are co-located [5]. In consequence, most of the computer scientists currently focus onthe optimization for the intra data center data flows, but few of them address the inter datacenters data flows.
8

As mentioned in the introduction, this single data center basis deployment assumptionbecomes inadequate in the big data era. Lots of scientists consider scaling up their applica-tions across multiple data centers due to the following facts:
1. In some domains, the commercial or scientific data are typically collected from severalgeographically distributed sources, nevertheless, people or scientists need to processthem with the computational resources hosted in different data centers.
2. For some large scale applications or experiments which require more than availablecompute resources in one data center (Public cloud providers restricts maximum num-ber of computational virtual machines for users in one data center), scientists need tointegrate more resources working in parallel across multiple locations.
It makes sense to manage those amount of data using several data centers. Hence, one needsa system that achieves the efficient data movements in the cloud and considers the followingchallenges:
WAN Environment Local Area Network (LAN) is designed for interconnecting the com-puters in a very limited area, for example, the network within one data center. Ethernet isthe widely used technology for LAN which provides high transfer rate (100 Gigabit Ether-net), and relatively stable network environment. In contrast, Wide Area Network (WAN) isthe data communications network that covers a relatively broad geographic area. The datacenter is connected via the WAN to each other, and transfer throughput between data cen-ters varies with time. On one hand, in the spatial dimension, the long transmission distancemakes the WAN to be more complex and unstable (e.g., different routing path, different tech-nology, different infrastructure condition, etc.). On the other hand, in the time dimension,the transfer bandwidth also depends highly on the peak demand from the geographic areacovered by the site and highly correlated with the local time [10].
User-Perceived Latency Large data sets are intuitively stored and processed in the datacenter which is close to the user’s location, so that the user-perceived latency could be re-duced. Nevertheless, the decision is not as simple when running large scale data-intensiveapplications in the cloud. In the distributed computing frameworks, the scientists need tomake the wise choice between moving the computations close to the data or moving the datasets close to the computations.
Monetary Cost One of the key features of the cloud paradigm is its pay-as-you-use philos-ophy. In clouds, the users need to pay for the data transfers between data centers. Moreover,the CPU consumption is also measured in hours of the virtual machines. More resourcesmight reduce the transferring delays for large data sets (e.g., parallel TCP streams), whereas,in this case the monetary cost might be much more higher. Hence, an optimized model isessentially required to make a tradeoff between those factors (delay or cost) for the datamovement service in the cloud.
9

Figure 3: Globus GridFTP architecture [1].
Programming Model The existing public cloud providers do not offer the seamless/automatic mechanisms for scaling their hosted services across multiple geographically dis-tributed data centers. A new programming model needs to be considered to deal with thedata scheduling and data processing issues across multiple data centers.
2.4 State of the Art
In this subsection, we present two complete solutions for the data movement in the dis-tributed environment: Globus and Stork.
Globus [1] is a GridFTP based framework initially targeting the grid environment, whichaims at providing secure, reliable, high-performance data movement services. In addition,Globus also released the SaaS based version, Globus Online, which adapts to the cloud en-vironment. Figure 3 illustrates the basic Globus architecture design. The implementation ismainly composed of the three logically distinct components, client and server protocol in-terpreters (PIs), which are designed for managing the control channel protocol, and the datatransfer process (DTP), which is responsible for handling the data access and data movementvia the data channel protocol. Globus is one of the high-performance implementation of theGridFTP protocol which supports the following features: third-party control of data trans-fer; authentication, data integrity, data confidentiality; striped data transfer; parallel datatransfer; partial file transfer; automatic negotiation of TCP buffer/window size; support forreliable and restartable data transfer.
Nevertheless, Globus is not the appropriate solution for the problems which we ad-dress. For example, Globus only performs data transfers between GridFTP instances (be-tween GridFTP client and server), remains unaware of the environment and therefore its
10
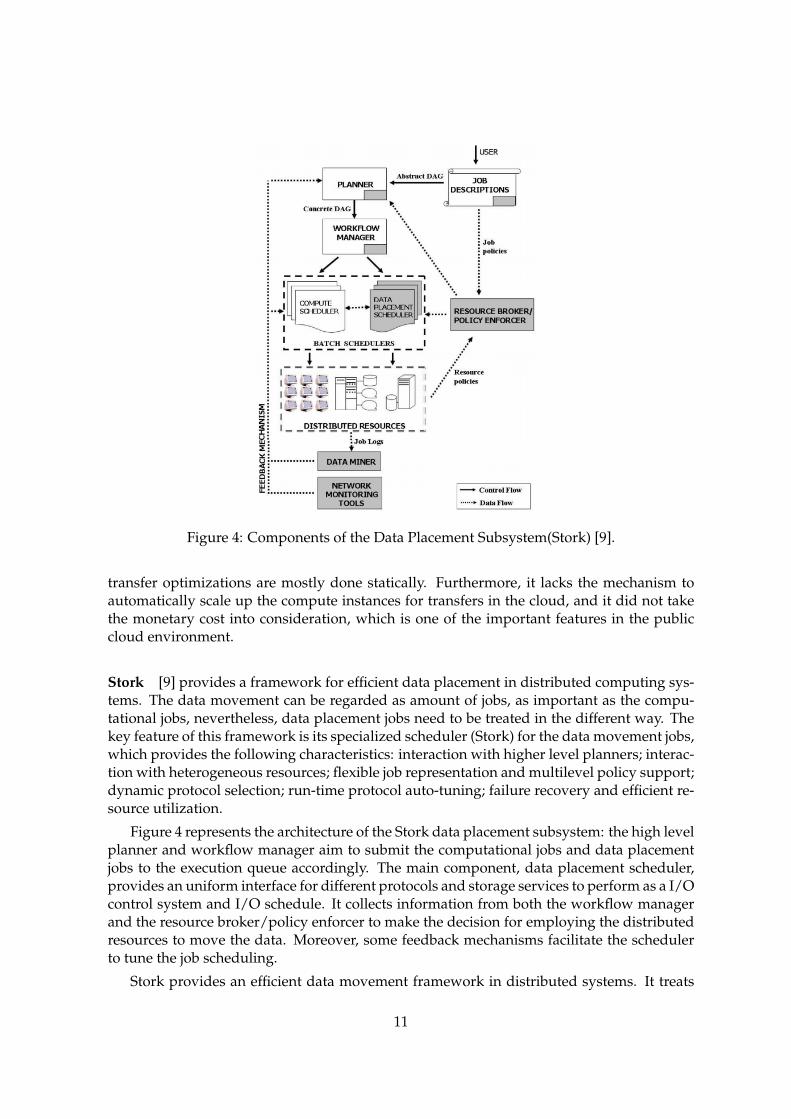
Figure 4: Components of the Data Placement Subsystem(Stork) [9].
transfer optimizations are mostly done statically. Furthermore, it lacks the mechanism toautomatically scale up the compute instances for transfers in the cloud, and it did not takethe monetary cost into consideration, which is one of the important features in the publiccloud environment.
Stork [9] provides a framework for efficient data placement in distributed computing sys-tems. The data movement can be regarded as amount of jobs, as important as the compu-tational jobs, nevertheless, data placement jobs need to be treated in the different way. Thekey feature of this framework is its specialized scheduler (Stork) for the data movement jobs,which provides the following characteristics: interaction with higher level planners; interac-tion with heterogeneous resources; flexible job representation and multilevel policy support;dynamic protocol selection; run-time protocol auto-tuning; failure recovery and efficient re-source utilization.
Figure 4 represents the architecture of the Stork data placement subsystem: the high levelplanner and workflow manager aim to submit the computational jobs and data placementjobs to the execution queue accordingly. The main component, data placement scheduler,provides an uniform interface for different protocols and storage services to perform as a I/Ocontrol system and I/O schedule. It collects information from both the workflow managerand the resource broker/policy enforcer to make the decision for employing the distributedresources to move the data. Moreover, some feedback mechanisms facilitate the schedulerto tune the job scheduling.
Stork provides an efficient data movement framework in distributed systems. It treats
11

the data placement jobs as important as the computational jobs. The scheduler is able tomake the wise decisions according to the job descriptions and existing resources, and it canalso adapt to the environment. Nevertheless, this framework can not adapt to the cloudenvironment based on the data center infrastructure, where the network environment intraand inter data center are different. In addition, it also lacks the models for the adaptivebehaviour.
12

3 Our contribution: An Environment-Aware System for Geo-graphically Distributed Data Transfers
In this section, we introduce our contribution illustrated in the context of a real scientificapplication, called A-Brain. Then we review the design principles of our solution. Theoverview of the architecture will be presented briefly in this section. The last part introducesour models for the cloud environment.
3.1 Motivation
A-Brain [16] is a project developed in the context of the INRIA-Microsoft Joint Center, aim-ing at the analysis of neuroimaging and genetic data on large cohorts of subjects. This is anew approach used to assess and understand the variability that exists between individuals,and that has remained poorly understood so far. As both neuroimaging and genetic-domainobservations represent a huge amount of variables (of the order of 106), performing statisti-cally rigorous analyses on such amounts of data represents a computational challenge thatcannot be addressed with conventional computational techniques. On one hand, sophisti-cated regression techniques need to be used in order to perform sensitive analysis on theselarge datasets; on the other hand, the cost entailed by parameter optimization and statisticalvalidation procedure (e.g., permutation tests). However, the computational framework caneasily by run in parallel.
Taking advantage of the strong experience in the data management for the data-intensiveapplication, KerData team will leverage it on the Microsoft Azure Cloud, and provides avery efficient approach to achieve the experiment computations. The computational modelis based on the MapReduce.
The initial experiments from this project stress that for the Azure Cloud, there is a limi-tation for the maximum number of computational nodes within each data center. The clouduser is strictly limited to use at most 300 cores per data center. Furthermore, there is no exist-ing mechanism to federate the resources across multiple data centers so that we can deploythe applications in several locations and make them work together. On the other hand, somecomplex computations require more than 1000 cores to cooperate and to work together. Thisissue motivates the topic of our internship.
3.2 Design Principles
To enable efficient geographically distributed data transfers, we rely on the following ideas:
Environment awareness Cloud infrastructures are exploited using a multi-tenancy model,which leads to variations in the delivered performance of the nodes and the commu-nication links. Monitoring and detecting in real-time such changes is a critical require-ment for scientific applications which need prediction performance. The monitoringinformation can then be fed into higher-level management tools for advanced provi-sioning and transfer purposes over wide-area networks. This helps removing the per-formance bottlenecks one-by-one and increase the end-to-end data transfer through-put.
13

Modeling the cloud performance The complexity of the data centers architecture, topologyand network infrastructure make simplistic approaches for dealing with transfer per-formance (e.g., exploiting system parallelism) less appealing. In a virtualized envi-ronment such techniques are at odds with the goal of reducing costs through efficientresource utilization. Accurate performance models are then needed, leveraging theon-line observations of the cloud behaviour. Our goal is to monitor the virtualized in-frastructure and the underlying networks and predict performance metrics (e.g., trans-fer time, costs). As such, we argue for a model that provides sufficiently accuracy forautomating the distributed data management tasks.
Cost effectiveness As expected, the cost closely follows performance. Different transferplans of the same data may result in significantly different costs. In this paper weask the question: given the clouds interconnect offerings, how can an application usethem in a way that strikes the right balance between cost and performance.
No modification of the cloud middleware and loose coupling Data processing in publicclouds is done at user level, which restricts the permissions to the virtualized space.Our solution is suitable for both public and private clouds, as no additional privi-leges are required. Moreover, stand alone components of the data management sys-tem increase the fault tolerance and allow an easy deployment across geographicallydistributed data centers.
3.3 Architecture Overview
The proposed system relies on three components, called agents, including Monitor Agent(MA), Transfer Agent (TA) and Decision Manager (DM) that provide the following services:monitoring, data transfers and decision management. The TA is designed to open multi-ple TCP connections between the virtual machine instances and transfer the data throughthose multiple paths. The MA is responsible for tracking the initial cloud environment.The DM implements the cloud models. It plays a role of interaction between MA and TA.On one hand, it conducts the predictable models by collecting the monitor logs from MA.On another hand, it schedules the data movement jobs to the TA in the VM pool based onthe model estimators and also continuously tracks the cloud performance from TA. Thesemodules (depicted in Figure 5) are replicated within the Virtual Machines (VMs) of the datacenters where the applications are running. The system is self-configurable: the discoveryof its other peers is done automatically using the user credentials to query the cloud datacenters. The scientific applications simply interact with the data management service usingits extended API, in order to perform wide-area data transfers. In Section 4, we will give thedetailed functional description of each architectural units.
3.4 Cloud Environment Awareness Modeling
Multiple factors like multi-tenancy, wide-area-networks or the commodity hardware con-tribute to the variation of the performance in a cloud environment [4]. Figure 6 presentsa snapshot of the inter-datacenter throughput in the Azure cloud, as tracked by the Moni-toring Agent. There are two options for modeling such complex infrastructures. Analyticalmodels predict the performance of the underlying resources using low-level details about
14

Figure 5: Architectural overview of the geographical distributed data management system(GEO-DMS).
their internals alongside workload characterizations. Although less expensive and fasterthan empirical models, they rely on simplified assumptions and require complex details forbetter modeling. Sampling methods perform active measurements of the targeted resourcesand do not require understanding the increasingly-complex, and often transparent, cloudinternals. Our technique falls in the empirical, sample-based category. In this section wedescribe it and then show how to use it for predicting the transfers cost/completion-timeefficiency.
3.4.1 Cloud Data Transfer Model
The monitoring information used for performance estimates is collected in two phases: aninitial learning phase, at deployment start-up; and a continuous monitoring phase duringthe lifetime of the deployment, in which new measurements are done at configurable timeintervals. Several user-defined parameters control the update frequencies in order to remainnon-intrusive.
We model the cloud performance based on the accumulated trace of the monitoring pa-rameters about the environment (h - history). The cloud average performance (µ - Equa-tion 1) and variability (σ - Equation 2) are estimated at each moment i. These estimations areupdated based on the weights (w) given to each new measured sample.
µi =(h − 1) ∗ µi−1 + (1 − w) ∗ µi−1 + w ∗ S
h(1)
σi =√
γ − µ2i (2)
15
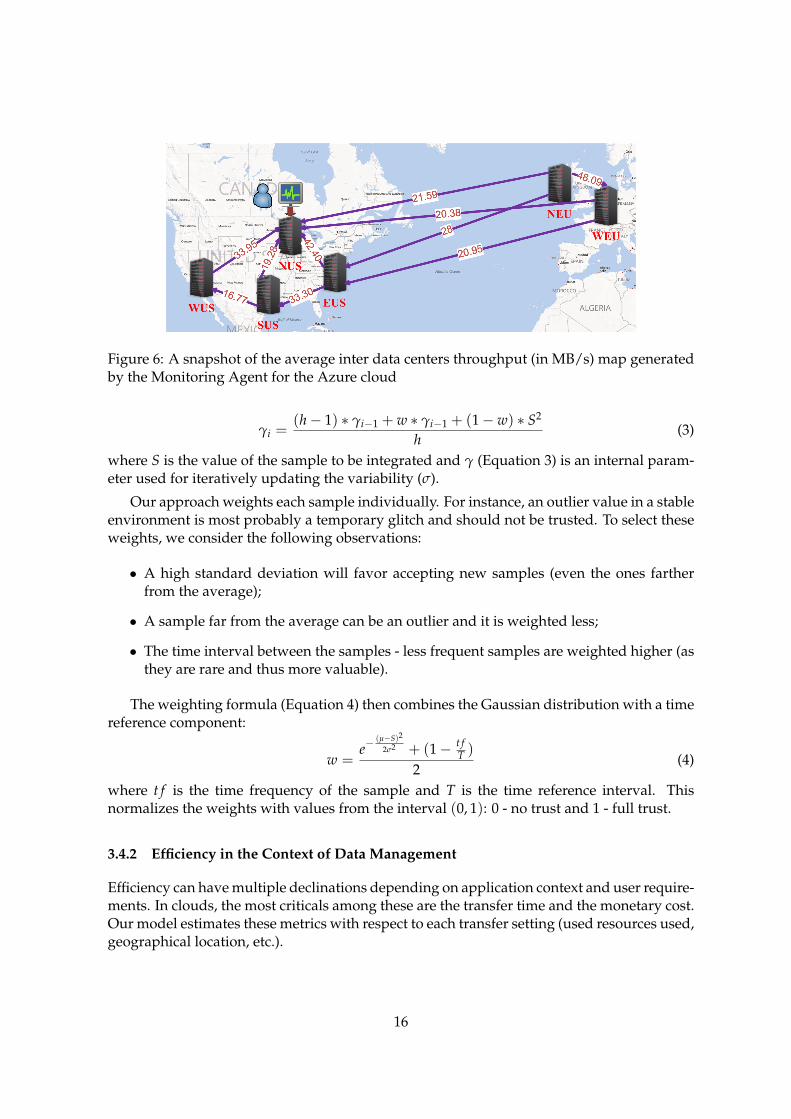
Figure 6: A snapshot of the average inter data centers throughput (in MB/s) map generatedby the Monitoring Agent for the Azure cloud
γi =(h − 1) ∗ γi−1 + w ∗ γi−1 + (1 − w) ∗ S2
h(3)
where S is the value of the sample to be integrated and γ (Equation 3) is an internal param-eter used for iteratively updating the variability (σ).
Our approach weights each sample individually. For instance, an outlier value in a stableenvironment is most probably a temporary glitch and should not be trusted. To select theseweights, we consider the following observations:
• A high standard deviation will favor accepting new samples (even the ones fartherfrom the average);
• A sample far from the average can be an outlier and it is weighted less;
• The time interval between the samples - less frequent samples are weighted higher (asthey are rare and thus more valuable).
The weighting formula (Equation 4) then combines the Gaussian distribution with a timereference component:
w =e−
(µ−S)2
2σ2 + (1 − t fT )
2(4)
where t f is the time frequency of the sample and T is the time reference interval. Thisnormalizes the weights with values from the interval (0, 1): 0 - no trust and 1 - full trust.
3.4.2 Efficiency in the Context of Data Management
Efficiency can have multiple declinations depending on application context and user require-ments. In clouds, the most criticals among these are the transfer time and the monetary cost.Our model estimates these metrics with respect to each transfer setting (used resources used,geographical location, etc.).
16

The Transfer Time (Tt) is estimated considering the number of nodes (n) that are used inparallel to stream data and the predicted transfer throughput (thrmodel), obtained frommonitoring the respective cloud link:
Tt =Size
thrmodel∗ 1
1 + (n − 1) ∗ gain(5)
where gain represents the improvement obtained from the parallel transfers (deter-mined empirically and with values less than 1).
The Cost of a geographical transfer is split into 3 components. The first corresponds to thecost charged by the cloud provider for outbound data (outboundCost), as usually in-bound data is free. The other two components are derived from the cost of the VMs(n - number of VMs) that are leased: the network bandwidth (VMCBand) and the CPU(VMCCPU) costs. The ratio of the resources used for the transfer is given by the intru-siveness parameter (Intr). The final cost equation is:
Cost = n ∗ (Tt ∗ VMCCPU ∗ Intr +
Sizen
Tt ∗ IntrVMCBand
) + outboundCost ∗ Size (6)
where for simplicity we considered that each of the n nodes sends the same amount ofdata ( Size
n ).
This model captures the correlation between performance (time) and cost (money) and isable to adjust the tradeoff between them dynamically during transfers. An example of sucha tradeoff is setting a maximum cost for a data transfer, based on which our system is able toinfer the amount of resources to use. Although the network or end-system performance candrop, the system rapidly detects the new reality and adapts to it in order to satisfy the budgetconstraint. In fact, we evaluate the returned benefit that the resources bring; applications canleverage this knowledge to select their optimal expense.
17

4 Functional Description and Implementation
In the first part of this Section, we zoom on the each component of our system, to give thedetailed functional descriptions. The second part aims to present how we implemented andvalidated our solution in a public cloud platform: Windows Azure Platform.
4.1 Functional Description
The Monitoring Agent (MA) It has the role of monitoring the cloud environment andreporting the measurements to a decision manager. Using the tracked data, a real-time on-line map of the cloud network and resource status is continuously constructed and madeavailable to applications. The metrics considered are: available bandwidth, throughput,CPU load, I/O speed and memory status. New metrics can be easily defined and integratedusing our pluggable monitoring modules approach. This component further records themonitoring history. Such a functionality is important from two perspectives: on one hand,the tracked logs are used by the scientists to better understand and profile their cloud basedapplications, and on the other hand, this provides the base functionality for a self-healingsystem.
The Transfer Agent (TA) It performs the data transfers and exposes a set of functions usedto exploit the network parallelism (e.g. direct_send, forward_sending, read, split etc.). Thesefunctions are used internally by the decision manager to coordinate data movements, but arealso made available to users that might want to integrate the data management in the appli-cation logic. Additional transfer optimizations include: data fragmentation and recomposi-tion using chunks of variable sizes, hashing, acknowledgement for avoiding data loss andduplications. One might consider the latter confirmation mechanism redundant at applica-tion level, as similar functionality is provided by the underlying TCP protocol. We arguethat this can be used to efficiently handle and recover from possible cloud nodes failures,when intermediate nodes are used for transfers. Finally, the component also monitors theongoing transfers and provides real-time information about the achieved throughput andthe progress to completion.
The Decision Manager (DM) It coordinates the transfer from the source(s) to the desti-nation(s), using possibly intermediate nodes, which are used as complementary links withthe destination, through which data is forwarded. The applications initialize the data move-ments by specifying the transfer parameters (e.g., destination, completion time - cost tradeoffor absolute values) to the Decision Manager. Based on these parameters and on the cloudstatus, it chooses the appropriate resources and paths to perform the transfers, so that theysatisfy the efficiency constrains. The choices are made by estimating the delivered perfor-mance and its cost as described in Section 3. This selection is updated at specific intervalsin order to reflect the inherent cloud variability. The Decision Manager sees the network ofTransfer Agents similar to a global peer-to-peer network, which is used to coordinate dataflows towards the destination. Although a Decision Manager exists on all nodes for avail-ability reasons, each transfer is handled by a single entity, typically the one contacted by theapplication to initialize the transfer.
18

Figure 7: The Windows Azure computational resources [26].
4.2 Implementation
A prototype was built to validate the concepts explained aforementioned. The system wasimplemented in C# and currently runs on the Microsoft Azure cloud platform. The back-bone of the system is a layered class hierarchy with approximately 50 classes, structured inthe three main independent modules according to the their different logical functions. Thishierarchy is organized in a mostly single-rooted class library (i.e., the grouped classes inheritfrom a common class) following the abstract factory design pattern. The Monitoring Agentand the Transfer Agent define an application programming interface (API) which specifiesthe interactions with the Decision Agent.
4.2.1 Windows Azure
Azure Platform, is the Microsoft product for the cloud. Windows Azure provides userswith on-demand and scalable computational and storage resources through the geographi-cally distributed data centers in the world. An aspect of the Windows Azure solution is theshift from the PaaS level provider to the IaaS level provider. It allows the users not only toexecute and debug their native code by using a specific technology at the distant runtimeenvironment, but also to create the VMs with different operation systems (Windows-basedor Linux-based) by specifying their own images. Thus, Windows Azure facilitate the devel-opers to handle the available resources in the Cloud with high flexibility and scalability. Inthis report, we mainly focus on the PaaS level services. We will address some key featuresof the Windows Azure in this subsection.
Computational Resources The Windows Azure offers the computational resources gener-ally based on the abstraction of the virtual machines. Windows Azure provides two kindsof virtual machine instances on the PaaS level: Web Roles and Worker Roles. Web Roles, are
19
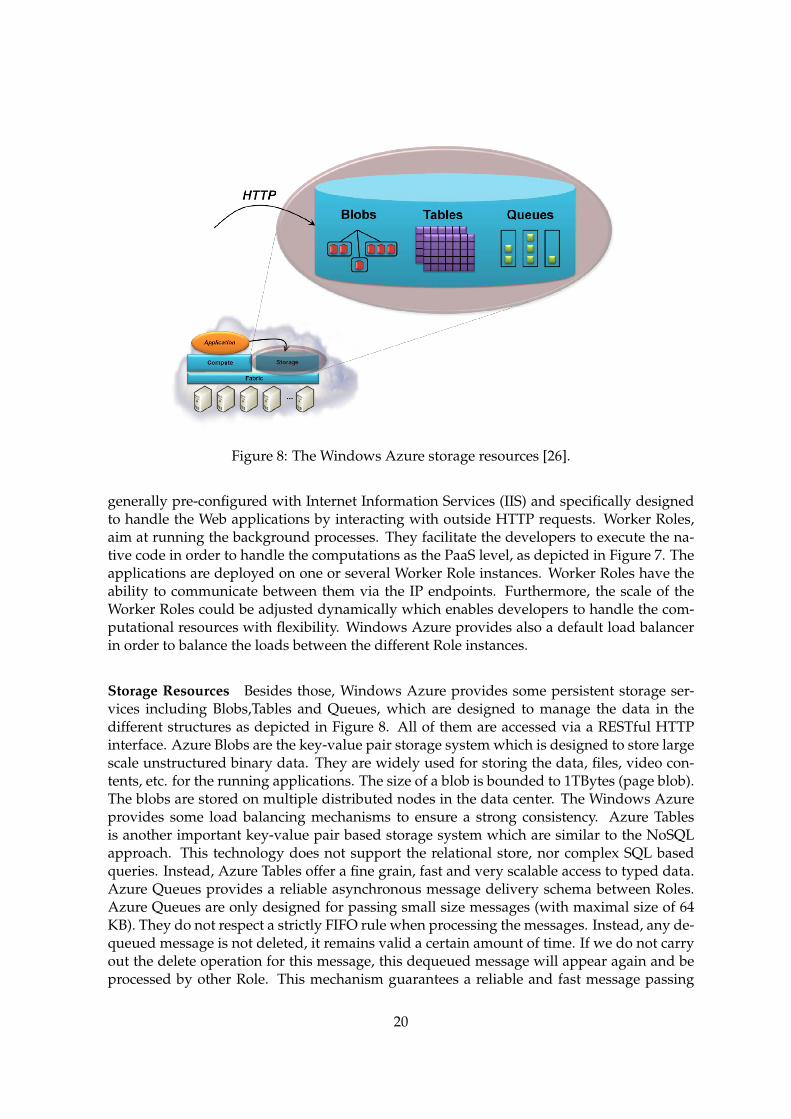
Figure 8: The Windows Azure storage resources [26].
generally pre-configured with Internet Information Services (IIS) and specifically designedto handle the Web applications by interacting with outside HTTP requests. Worker Roles,aim at running the background processes. They facilitate the developers to execute the na-tive code in order to handle the computations as the PaaS level, as depicted in Figure 7. Theapplications are deployed on one or several Worker Role instances. Worker Roles have theability to communicate between them via the IP endpoints. Furthermore, the scale of theWorker Roles could be adjusted dynamically which enables developers to handle the com-putational resources with flexibility. Windows Azure provides also a default load balancerin order to balance the loads between the different Role instances.
Storage Resources Besides those, Windows Azure provides some persistent storage ser-vices including Blobs,Tables and Queues, which are designed to manage the data in thedifferent structures as depicted in Figure 8. All of them are accessed via a RESTful HTTPinterface. Azure Blobs are the key-value pair storage system which is designed to store largescale unstructured binary data. They are widely used for storing the data, files, video con-tents, etc. for the running applications. The size of a blob is bounded to 1TBytes (page blob).The blobs are stored on multiple distributed nodes in the data center. The Windows Azureprovides some load balancing mechanisms to ensure a strong consistency. Azure Tablesis another important key-value pair based storage system which are similar to the NoSQLapproach. This technology does not support the relational store, nor complex SQL basedqueries. Instead, Azure Tables offer a fine grain, fast and very scalable access to typed data.Azure Queues provides a reliable asynchronous message delivery schema between Roles.Azure Queues are only designed for passing small size messages (with maximal size of 64KB). They do not respect a strictly FIFO rule when processing the messages. Instead, any de-queued message is not deleted, it remains valid a certain amount of time. If we do not carryout the delete operation for this message, this dequeued message will appear again and beprocessed by other Role. This mechanism guarantees a reliable and fast message passing
20

Table 1: Compute instance price details [26]Instance CPU Cores Memory Disk I/O Perf. Cost Per Hour
Extra Small shared 768MB 20GB Low $ 0.02Small 1 x 1.6 GHz 1.75GB 225GB Moderate $ 0.12
Medium 2 x 1.6 GHz 3.5GB 490GB High $ 0.24Large 4 x 1.6 GHz 7GB 1000GB High $ 0.48
Extra Large 8 x 1.6 GHz 2040B 20GB High $ 0.96
communication.
Prices Another key feature of the Cloud Computing is its pay-as-you-use philosophy. TheAzure users are charged only when their applications are running in the Cloud or whentheir data are stored in the Azure storage systems. Here we only address two of the pricingpolicies which are related to our work: role instances and outbound data transfer. The userspay for compute role instances on a per-hour usage basis when they deploy their applica-tion code in the cloud. There are five different size of compute instance sizes to choose forrunning a vast array of applications, as we depicted in the Table 1. Data transfers betweenWindows Azure services located within the same data center are not subject to any charge.Instead, outbound data is charged based on the total amount of data moving out of the Win-dows Azure data centers via the Internet. The first 5GB of outbound data transfer is free,extra transfers are charged 0.12$/GB.
4.2.2 Our System
The Monitoring Agent It is designed as an ensemble of self-describing subsystems whichare registered as dynamic services, and are able to collaborate and cooperate in performinga wide range of information gathering tasks. As Figure 9 depicted, The Monitoring Agentconsists of several subcomponents expressed as the classes. The Monitoring Agent tracksseveral metrics which can be defined in an abstract class : Metric. By inheriting from thismetric class we currently implement some concrete metric contents for measuring the per-formances: the available bandwidth between the nodes and between the data centers usingthe iperf software [21]; the throughput, computed by measuring the transfer time of randomtransfers of data based on the TCP sockets, etc. Those pluggable modules used for collect-ing different sets of information, or interfacing with other monitoring tools, are dynamicallyloaded and executed in independent threads. In order to minimize intrusiveness on hostsystems, a dynamic pool of threads is created once, and the threads are then reused whena task assigned to a thread is completed. This allows one to run concurrently and inde-pendently a large number of monitoring tasks, and to dynamically adapt to the load andthe response time of the components in the system. We have also set a customizable intru-siveness threshold, which limits the monitoring samples frequency when the VM is highlyloaded. This option is used for example by the Decision Manager to suspend the throughputmeasurements during data transfers, as this information can be collected directly from theTransfer Agent thanks to the command pattern design.
21

Figure 9: The implementation of the monitoring agent.
The Transfer Agent It is in charge of the data movements using parallel TCP streams, asdepicted in the Figure 10. The transferring data is retrieved from local disk of the WorkerRole or from the Azure Blobs. DataHandler aims to access to and process the transferringdata including virtual splitting. Data is sent as chunks extended with metadata information.Metadata is used for hashing and deduplication, for recomposing the data at destination,as packages can arrive in any order, and for routing the packages and acknowledgements.The parallelization of the transfer is done at cloud node level: data is not directly sent fromthe source to the destination node, but part of it is sent to intermediate nodes. These are thenforwarding the data towards the destination, exploiting the multiple parallel paths existingbetween data centers. The QueueHandler is responsible for processing the receiving chunksfrom multiple threads. The disordered chunks wait in a FIFO queue, and the system recon-struct and write the transferring data in the target disks. As future work, we consider addingsupport for other protocols (HTTP for content-based data or UDP for handling geographi-cal streaming data). The data transfer functions can be accessed via an API or using a setof simple commands similar to the FTP ones. Hence, the Transfer Agents can be controlledboth locally and from remote locations (e.g., from other nodes or data centers).
The Decision Manager It implements the modeling and the prediction components as wedetailed in the section aforementioned by using the monitoring data. Based on them, theefficiency of the transfer is computed at the beginning at the transfer and then updated it-eratively as the transfer progresses. The Decision Manager also coordinates the transfer (i.e.what nodes and resources to provision) based on the time/cost predictions in order to com-ply with the transfer constraints. For instance, it computes whether a benefit (economy) isbrought by a set of resources if the transfer cost is within the limit, or if by using an increasednumber of nodes for parallel streaming of data the completion time can be significantly re-duced. The Manager further communicates with the Transfer Agents to set the chunk size
22

Figure 10: The implementation of the transfer agent.
of the transfers via intermediate nodes in order to maximize the resource usage while pre-serving the non-intrusiveness constraints. Finally, it detects any resource performance dropsand either replaces them or asks the cloud middleware to change them.
23
5 Evaluation
The section presents the evaluation of our solution on the Azure cloud using synthetic bench-marks and a real life application from A-Brain.
5.1 Experimental Setup
The experiments were carried out on the Azure cloud using data centers from United States(North, South, East, West US) and Europe (North, West EU). We used the Small (1 CPU,1.75 GB Memory) and Medium (2 CPU, 3.5 GB Memory) VM instances with tens of suchmachines deployed in each data center, reaching a total of 120 nodes and 220 cores in theglobal system. To execute the A-Brain application, we used the Extra-Large (8 CPU, 14 GB)VM instances.
5.2 Assessing the Cloud Infrastructure Variability
It is commonly known that clouds offer a variable performance, analyzed in several previousworks [15, 11, 7]; the focus there is on the intra-data center performance. As we addressedaforementioned, intra data center environment is usually the local network where the net-work is relatively stable. When it comes to the global cloud infrastructure, the variabilityis expected to increase. In this first experimence, we mainly focus on the variability of thecloud network. We report here the results of an evaluation that considers the data transfersbetween the cloud data centers. We have designed two scenarios: assessing the throughputvariability (Figure 11) and the latencies of the AzureBlobs remote storage service (Figure 12).In both cases the measurements were done from the North EU towards the other 5 EU andUS data centers during one week, with hundreds of measurements each day.
Figure 11 shows the average throughput and the standard deviation achieved whensending 100MB of data using Small instances. The throughput is obtained as follows:Th = DataSize
Latency . As we observed from Figure 11, even in one day, the throughput across datacenters varies a lot. For example, we observe that the coefficient of variation for the averagethroughput between North Europe (NEU) and East US (EUS) at day 1, is higher than 60%.If we compare the same link in different day, we also find the high variability. For instance,considering the same link between North Europe (NEU) and East US (EUS), the averagethroughput is doubled at day 3 comparing to the value at day 1. Moreover, we do not findany specific pattern for those variabilities and the performance drops or bursts can appear atany time. However, as we explained the complexity of WAN environment in Section 2, weare not surprised by this result. Another observation is that the geographical distance hasimpact to the transfer latency. As we illustrate in Figure 11 where the average throughput issignificant higher between North Europe (NEU) and West Europe (WEU). This experimentresult states that it makes sense to have a predictable model of the WAN environment be-tween data centers, so that we can adaptably leverage the available cloud resources to movethe data.
Figure 12 shows the average time and the standard derivation for sending 100MB datato the Azure Blobs. Here we only consider the write operation time from a VM instance toa blob that is located in another site via the RESTful HTTP interface. The result is close to
24

Figure 11: The throughput variation during a week between the North Europe data centerand the other European and US data centers.
the result of the data transfer between instances, the WAN environment has high variabilityfor the data movement. Besides this, we find that the latency will not be significant reducedwhen we write the data into the blob which is located in the neighbouring data center. As weobserve in Figure 12, the write time between North Europe (NEU) and West Europe (WEU)is not always the shortest. The observations here hold both for the neighbouring data centerand for the remote ones.
5.3 Synthetic Benchmarks
The next series of experiments evaluate the accuracy of the sample-based cloud model, theintrusiveness of our approach and its efficiency in terms of costs and performance, using aset of synthetic benchmarks.
5.3.1 Evaluating the performance prediction
Figures 13 and 14 present the accuracy of the estimations done using the monitoring basedmodel, for a 24 hour interval. The figures show the hourly averages (60 values per hour).The critical aspect about the model’s accuracy is how the new samples are integrated withinthe model. We have compared our solution, based on a weighted integration (WSI), with2 other sample integration strategies. The first one (Monitor) considers that the last sampledescribes the current reality and uses it as expected performance; due to its simplicity andlow cost it is widely used. However, in our case it gives the worst results as it is subject to theperformance variations. The second strategy considers a linear integration of the samples(LSI), computing the future performance as an average between the history and the newsample.
25

Figure 12: The variation of the time to write in AzureBlobs during a week between a clientin the North Europe data center and all the other European and US data centers.
Figure 13 shows how the real value of the throughput between North US and North EUis approximated using the 3 strategies for sample integration. Our weighted approach has asmoother approximation and is not that sensitive to temporary variations as the other two.In Figure 14 we report the difference (i.e. accuracy error) between the estimated value andthe real value. With an unstable tracked throughput (e.g., interval 1 to 5 or 18 to 24), weight-ing the samples seems a better option than using fixed integration strategies (LSI). Whenthe performance variations are less important, both the linear and the weighted strategiesgive similar results. This is explained by the fact that in a stable environment the weightsassigned to the samples converge towards 1, just like in the case of the linear average.
5.3.2 Evaluating the intrusiveness
We now analyze the impact of higher resource utilization due to our management systemon the wide-area transfers. We measure the transfer time of 1 GB of data between the NorthEU and US data centers. The number of nodes that are used for the transfer is varied from 1to 5. For each node, we also vary the intrusiveness parameter, which gives the percentage ofthe VM’s resources (CPU, Memory and bandwidth) to be used by our system. The highestvalues from Figure 15 always correspond to the situation when only one node is used for thetransfer.
The lower values are obtained using multiple nodes, leading to different transfer timereductions depending on the intrusiveness level and the cloud performance. Adding moreresources does not reduce the transfer time with the same percentage because:
1. The network bandwidth is bound
2. Due to the overhead induced by the local transfer from the source node to the interme-diate one
26

Figure 13: The approximation of the TCP throughput using multiple strategies (Monitor andUpdate, Linear Sampling Integration and Weighted Sampling Integration).
Figure 14: The average aggregated error in approximating the TCP Throughput dependingon the strategies.
27

Figure 15: The impact of the intrusiveness on the transfer time of 1 GB of data between NUSand NEU, when varying the number of VMs used (1 to 5)
3. Due to the variable performance of the VMs.
All these lead to a limit in the time reduction that the resources (nodes, bandwidth, CPUor Memory) can bring when transferring data. These results motivate our choice for control-ling the amount of resources to be used by the data management system in order to avoidimpacting the application and wasting the resources that otherwise could be used for thescientific computation.
5.3.3 Evaluating the transfer efficiency
Our next experiments evaluate the relationship between the transfer efficiency and the mon-etary cost. We focus on the scenario using additional intermediate nodes to speed up paralleltransfers. These extra nodes come at a cost as they have to be either leased or taken from theones used for the scientific computation. Depending on how urgent the transfer is, this isan acceptable situation. In fact, up to a certain point, the time reduction obtained with morenodes prevents the transfer cost to grow significantly, as observed in Figure 16 when using3 up to 5 VMs. This happens because the cost depends on the time the nodes are leased forthe transfer - smaller transfer times reflect on smaller costs. Looking at the cost/time ratioan optimal point might be with 6 VMs in this case (the maximum time reduction for a mini-mum cost). However, as different applications can value costs differently, we provide themwith the possibility of setting their customized cost/time tradeoff.
5.3.4 Evaluating the environment-aware wide-area transfers
The following experiment illustrates how the transfer efficiency is improved using knowl-edge about the environment. We consider sending increasing data sizes from a source node
28
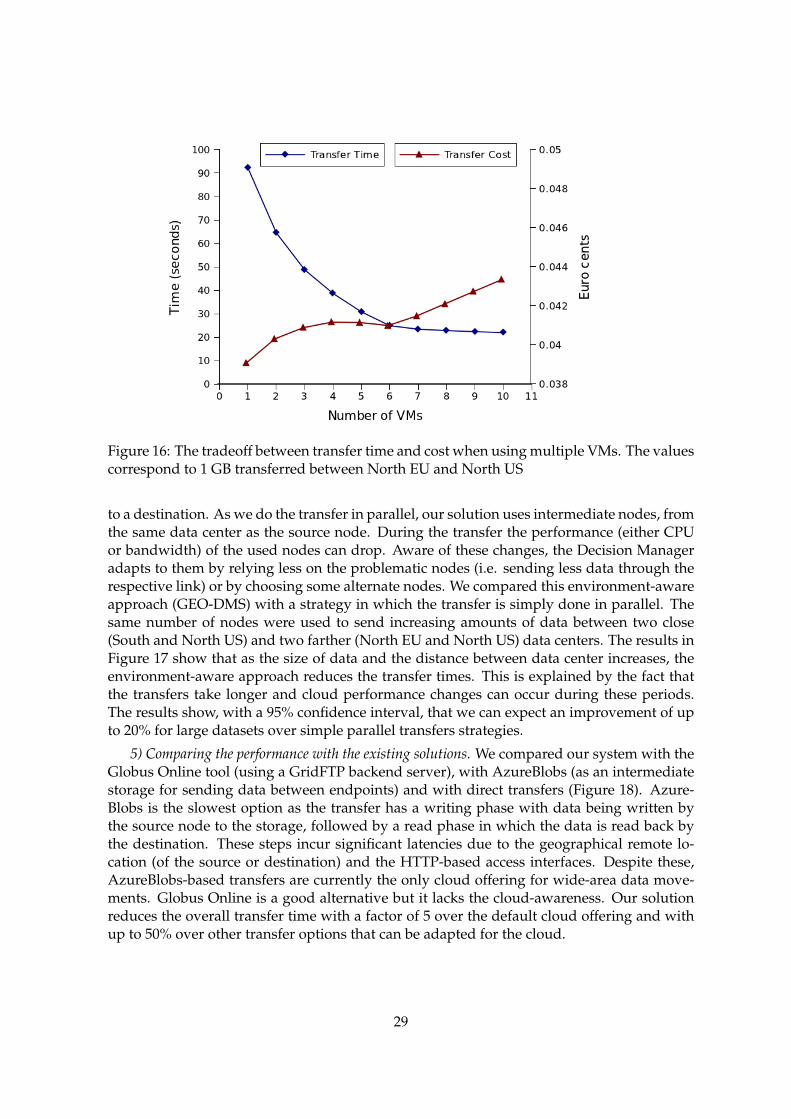
Figure 16: The tradeoff between transfer time and cost when using multiple VMs. The valuescorrespond to 1 GB transferred between North EU and North US
to a destination. As we do the transfer in parallel, our solution uses intermediate nodes, fromthe same data center as the source node. During the transfer the performance (either CPUor bandwidth) of the used nodes can drop. Aware of these changes, the Decision Manageradapts to them by relying less on the problematic nodes (i.e. sending less data through therespective link) or by choosing some alternate nodes. We compared this environment-awareapproach (GEO-DMS) with a strategy in which the transfer is simply done in parallel. Thesame number of nodes were used to send increasing amounts of data between two close(South and North US) and two farther (North EU and North US) data centers. The results inFigure 17 show that as the size of data and the distance between data center increases, theenvironment-aware approach reduces the transfer times. This is explained by the fact thatthe transfers take longer and cloud performance changes can occur during these periods.The results show, with a 95% confidence interval, that we can expect an improvement of upto 20% for large datasets over simple parallel transfers strategies.
5) Comparing the performance with the existing solutions. We compared our system with theGlobus Online tool (using a GridFTP backend server), with AzureBlobs (as an intermediatestorage for sending data between endpoints) and with direct transfers (Figure 18). Azure-Blobs is the slowest option as the transfer has a writing phase with data being written bythe source node to the storage, followed by a read phase in which the data is read back bythe destination. These steps incur significant latencies due to the geographical remote lo-cation (of the source or destination) and the HTTP-based access interfaces. Despite these,AzureBlobs-based transfers are currently the only cloud offering for wide-area data move-ments. Globus Online is a good alternative but it lacks the cloud-awareness. Our solutionreduces the overall transfer time with a factor of 5 over the default cloud offering and withup to 50% over other transfer options that can be adapted for the cloud.
29
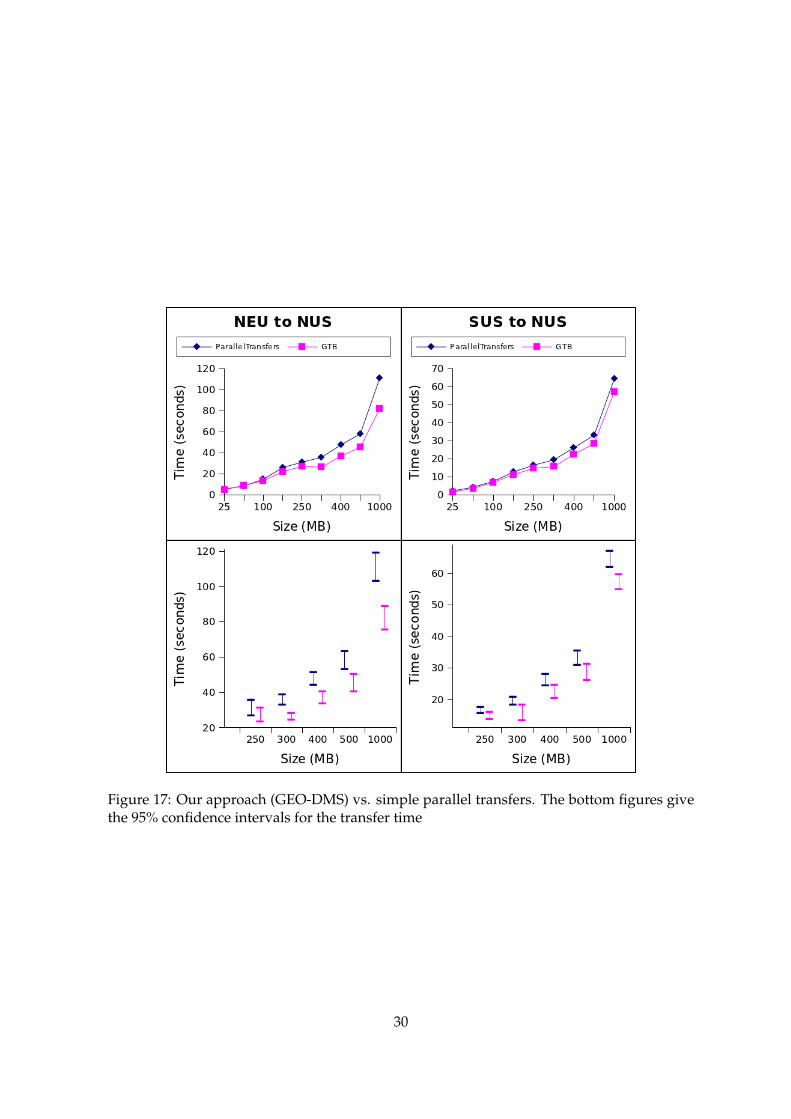
Figure 17: Our approach (GEO-DMS) vs. simple parallel transfers. The bottom figures givethe 95% confidence intervals for the transfer time
30

Figure 18: Transfer time when the data size is varied for our approach (GEO-DMS) and otherexisting options.
5.4 Experimenting with a Real-life Neuroimaging Application
We present an evaluation of the time gains that can be obtained for wide-area transfersin the context of a scientific application from bio-informatics, A-Brain, aiming at joint ge-netic and neuro-imaging data analysis. Due to the large resource requirements that couldnot be obtained from the cloud provider within a single data center, the application runs aMapReduce-based processing across 3 data centers; the final global result is computed usinga Meta-Reducer [3] that aggregates results from all the datacenters. We compare the transfertimes of 1000 files representing partial data, sent from each datacenter towards the Meta-Reducer, using AzureBlobs as a transfer backend and our solution (GEO-DMS). The resultsare shown in Figure 19 for multiple file sizes, resulted from different input data sets andconfigurations. For small datasets (108 MB from the 3× 1000× 36 KB files), the overhead in-troduced by our solution, due to the extra acknowledgements, makes the transfer inefficient.However, as the data size grows (120 GB), the total transfer time is reduced by a factor of 3.
31

Figure 19: Execution times of the A-Brain application across 3 datacenters, using AzureBlobsand GEO-DMS as a transfer backend. The bar indicate the total time of transferring the filestowards the Meta-Reducer located in NUS
32
6 Conclusion
6.1 Contributions
This thesis introduces a cloud-based data management system for big data science applica-tions which run in large, federated and highly dynamic environments. Our solution is ableto effectively use the high-speed networks connecting the cloud data centers through opti-mized protocol tuning and bottleneck avoidance, while remaining non-intrusive and easy todeploy. At its core, it uses a sampling-based model for cost-performance in a cloud setting toenable efficient transfer operations across a group of geographically distributed data centers.As an example, by distributing data locally, it enables high wide-area data throughput whenthe network core is underutilized, at minimal cost. Our experiments show that the systemcan achieve high performance in a variety of settings: it substantially improves throughputand it reduces the execution time for real applications.
Encouraged by these results, we have started to explore other research data-managementissues, from a cloud providers perspective. Apart from the practical applications shown inthis paper, our approach can be used to study the performance of inter-data center or inter-clouds transfers. This is especially useful for cloud users, which do not have visibility intothe supported service levels. We believe that the cloud providers could benefit from usingthis tool as a metric to describe the performance of resources with particular configurations.Further, they could provide Introspection-as-a-Service to reveal information about the cloudinternals to the interested applications.
6.2 Future Works
There are still several directions that worth exploring in the future.
With respect to the modeling part, we are planning to take more performance metrics intoconsideration. The available CPU load might be one of the potential metrics which helps usto build the CPU usage prediction models for the data transfer in the cloud. In addition, wewould like to improve the weight of the prediction algorithm in order to get more accuracypredictions.
We are also planning to enhance the transfer strategies. For example, we consider addingsome error detection and checkpoint mechanisms. With those strategies, the system coulddetect the transfer fails by itself and recovery the transfer jobs to the point where fails oc-cured instead of restart the entire transmissions.
Another possible future work direction is to support more underlayer transfer protocols.Currently the transfer agent only implements TCP sockets for the data transfer which is notenough in the future. For instance, we could apply HTTP for content-based data or UDP forhandling geographical streaming data. Moreover, some high layer transfer protocols (FTP,GridFTP) can be also reused. With this enhanced support, our system adapts to more typesof data and achieve more efficient data transfers.
33
6.3 Lessons Learnt From the Internship
This internship provides me a good opportunity to gain the research experiences in the fieldof distributed systems and cloud computing. Through this five-month internship, I haveenhanced the knowledge regarding the networks and cloud computing. I have the oppor-tunity to manage and handle the cloud resources, to execute my native code in the cloudplateform, to deploy the applications in the cloud. I have adopted a rigorous approach tolearn new knowledge for the research, ranging from bibliophical study, brainstorming ses-sions to the implementation and the evaluation. Furthermore, I have nurtured my interestsand passions in starting the research career. I am also engaged in writing a part of the paperregarding all of our contributions with a PhD student to the IEEE Cluster 2013 conference.
34

References
[1] William Allcock, John Bresnahan, Rajkumar Kettimuthu, Michael Link, Catalin Du-mitrescu, Ioan Raicu, and Ian Foster. The Globus Striped GridFTP Framework andServer. In Proceedings of the 2005 ACM/IEEE conference on Supercomputing, SC ’05, pages54–. IEEE Computer Society, 2005.
[2] Rajkumar Buyya, Rajiv Ranjan, and Rodrigo N. Calheiros. InterCloud: utility-orientedfederation of cloud computing environments for scaling of application services. In Pro-ceedings of the 10th international conference on Algorithms and Architectures for Parallel Pro-cessing - Volume Part I, ICA3PP’10, pages 13–31. Springer-Verlag, 2010.
[3] Alexandru Costan, Radu Tudoran, Gabriel Antoniu, and Goetz Brasche. TomusBlobs:Scalable Data-intensive Processing on Azure Clouds. Journal of Concurrency and compu-tation: practice and experience, 2013.
[4] Ian Foster, Ann Chervenak, Dan Gunter, Kate Keahey, Ravi Madduri, and Raj Ket-timuthu. Enabling PETASCALE Data Movement and Analysis. Scidac Review, Winter2009.
[5] Y. Gu and R.L. Grossman. Sector and sphere: the design and implementation of a high-performance data cloud. In Philosphical Transactions A Special Issue associated with the2008 UK e-Science All Hands Meeting, 2009.
[6] T. J. Hacker, B. D. Noble, and B. D. Athey. Adaptive data block scheduling for par-allel TCP streams. In Proceedings of the High Performance Distributed Computing, 2005.HPDC-14. Proceedings. 14th IEEE International Symposium, HPDC ’05, pages 265–275.IEEE Computer Society, 2005.
[7] Gideon Juve, Ewa Deelman, Karan Vahi, Gaurang Mehta, Bruce Berriman, Benjamin P.Berman, and Phil Maechling. Data Sharing Options for Scientific Workflows on Ama-zon EC2. In Proceedings of the 2010 ACM/IEEE International Conference for High Perfor-mance Computing, Networking, Storage and Analysis, SC ’10, pages 1–9. IEEE ComputerSociety, 2010.
[8] Gaurav Khanna, Umit Catalyurek, Tahsin Kurc, Rajkumar Kettimuthu, P. Sadayappan,Ian Foster, and Joel Saltz. Using overlays for efficient data transfer over shared wide-area networks. In Proceedings of the 2008 ACM/IEEE conference on Supercomputing, SC’08, pages 47:1–47:12. IEEE Press, 2008.
[9] Tevfik Kosar and Miron Livny. A framework for reliable and efficient data placementin distributed computing systems. J. Parallel Distrib. Comput., pages 1146–1157, 2005.
[10] Nikolaos Laoutaris, Michael Sirivianos, Xiaoyuan Yang, and Pablo Rodriguez. Inter-datacenter bulk transfers with netstitcher. SIGCOMM Comput. Commun. Rev., pages74–85, 2011.
[11] Hill J. Li, M. Mao, A. Ruiz-Alvarez, and M. Humphrey. Early Observations on thePerformance of Windows Azure. In High Performance Distributed Computing, pages 367–376, 2010.
35
[12] Wantao Liu, Brian Tieman, Rajkumar Kettimuthu, and Ian Foster. A data transfer frame-work for large-scale science experiments. In Proceedings of the 19th ACM InternationalSymposium on High Performance Distributed Computing, HPDC ’10, pages 717–724. ACM,2010.
[13] P. Mell and T. Grance. The NIST Definition of Cloud Computing. Technical report,National Institute of Standards and Technology, 2011.
[14] Costin Raiciu, Christopher Pluntke, Sebastien Barre, Adam Greenhalgh, Damon Wis-chik, and Mark Handley. Data center networking with multipath TCP. In Proceedings ofthe 9th ACM SIGCOMM Workshop on Hot Topics in Networks, Hotnets-IX, pages 10:1–10:6,New York, NY, USA, 2010. ACM.
[15] Radu Tudoran, Alexandru Costan, Gabriel Antoniu, and Luc Bougé. A PerformanceEvaluation of Azure and Nimbus Clouds for Scientific Applications. In CloudCP 2012– 2nd International Workshop on Cloud Computing Platforms, Held in conjunction with theACM SIGOPS Eurosys 12 conference, Bern, Switzerland, 2012.
[16] A-Brain. http://www.msr-inria.inria.fr/Projects/a-brain.
[17] Amazon EC2. http://aws.amazon.com/.
[18] The Big Bang: How the Big Data Explosion Is Changing the World. http://www.microsoft.com/en-us/news/features/2013/feb13/02-11BigData.aspx/.
[19] DropBox. www.dropbox.com/.
[20] Google App Engine. https://appengine.google.com/.
[21] Iperf. http://iperf.fr/.
[22] Nimbus. http://www.nimbusproject.org/.
[23] OpenNebula. http://opennebula.org/.
[24] SalesForce. http://www.salesforce.com/.
[25] How sockets work. http://pic.dhe.ibm.com/infocenter/iseries/v7r1m0/index.jsp?topic=%2Frzab6%2Fhowdosockets.htm.
[26] Windows Azure. http://www.windowsazure.com/en-us/.
36