efficient power consumption in the modern datacenter
TRANSCRIPT

William Hammond
Efficient Power Efficient Power Consumption in Consumption in the modern the modern DatacenterDatacenter
William A HammondWilliam A HammondSenior Technology PlannerSenior Technology Planner
Digital Enterprise GroupDigital Enterprise Group
March 1, 2005March 1, 2005

2
William Hammond
Server focused AgendaServer focused Agenda
Power Consumption ReviewPower Consumption Review– Showcase where technology focus can have impactShowcase where technology focus can have impact
Datacenter Modular Power IssuesDatacenter Modular Power Issues IntelIntel®® Power Utilities Power Utilities
– Demand Based Switching to save powerDemand Based Switching to save power– Power Calculator to increase rack utilizationPower Calculator to increase rack utilization– Power Monitor to provide DC wide interactionsPower Monitor to provide DC wide interactions
Power reduction in futurePower reduction in future– Continuous capability and impact in future Continuous capability and impact in future
““Intel, SpeedStep and XEON are trademarks or registered trademarks of Intel Corporation Intel, SpeedStep and XEON are trademarks or registered trademarks of Intel Corporation or its subsidiaries in the United States or other countries.”or its subsidiaries in the United States or other countries.”

William Hammond
Power Power Consumption Consumption ReviewReview

4
William Hammond ChillerChiller
Condenser Condenser looploop
CoolingCoolingTowerTower
PDU
PDU
PDU
Where the Power Goes – Facility Where the Power Goes – Facility ViewView
AHU
AHU
AHU
GridGrid3-Phase3-Phase
Diesel Backup
Generator
Power Consumption Review
AHU
• 50% incoming DC power consumed in HVAC and 50% incoming DC power consumed in HVAC and Power Delivery subsystems before reaching systemPower Delivery subsystems before reaching system• AHU to Chiller to Tower efficient closed-loop systemsAHU to Chiller to Tower efficient closed-loop systems• Continued analysis of variable efficiency AHU’sContinued analysis of variable efficiency AHU’s
• General over-blowing of DC ambientGeneral over-blowing of DC ambient• Focus on Efficient UPS’sFocus on Efficient UPS’s
UPS’s Transfer
Switch
Panel
5
William Hammond
Where the Power Goes – Platform Where the Power Goes – Platform ViewView
Power Consumption Review
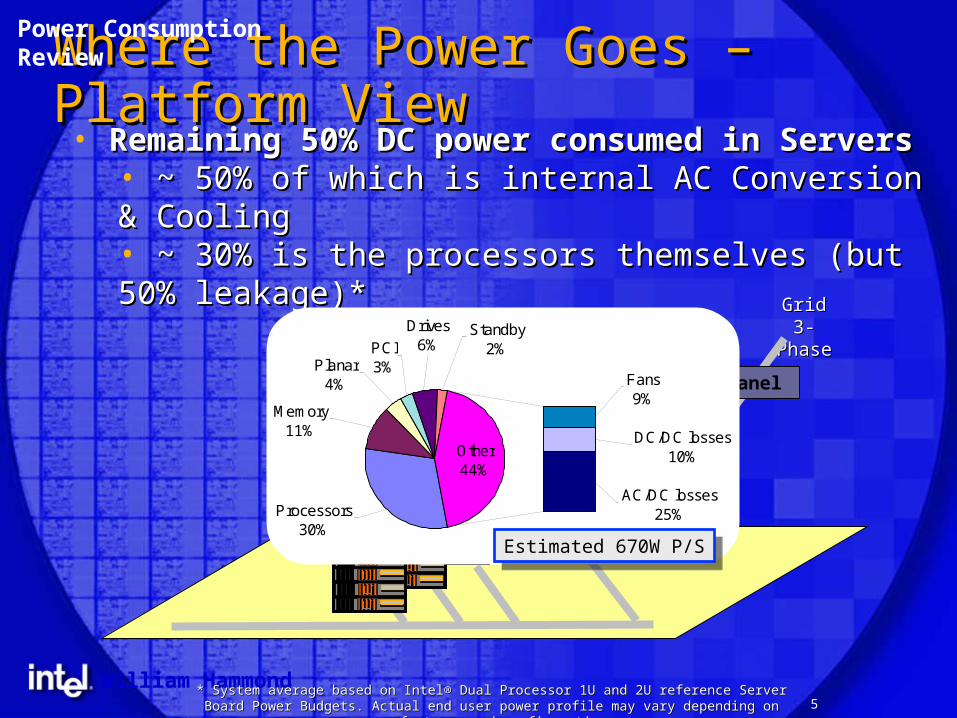
• Remaining 50% DC power consumed in ServersRemaining 50% DC power consumed in Servers• ~ 50% of which is internal AC Conversion & Cooling~ 50% of which is internal AC Conversion & Cooling• ~ 30% is the processors themselves (but 50% leakage)*~ 30% is the processors themselves (but 50% leakage)*
PDU
PDU
PDU
GridGrid3-Phase3-Phase
Panel
DC/DC losses10%
Fans9%
Other44%
Standby2%
Processors30%
AC/DC losses25%
Memory11%
Planar4%
Drives6%PCI
3%
Estimated 670W P/SEstimated 670W P/S
* * System average based on Intel® Dual Processor 1U and 2U reference Server Board Power System average based on Intel® Dual Processor 1U and 2U reference Server Board Power Budgets. Actual end user power profile may vary depending on manufacturer and Budgets. Actual end user power profile may vary depending on manufacturer and
configuration.configuration.
6
William Hammond
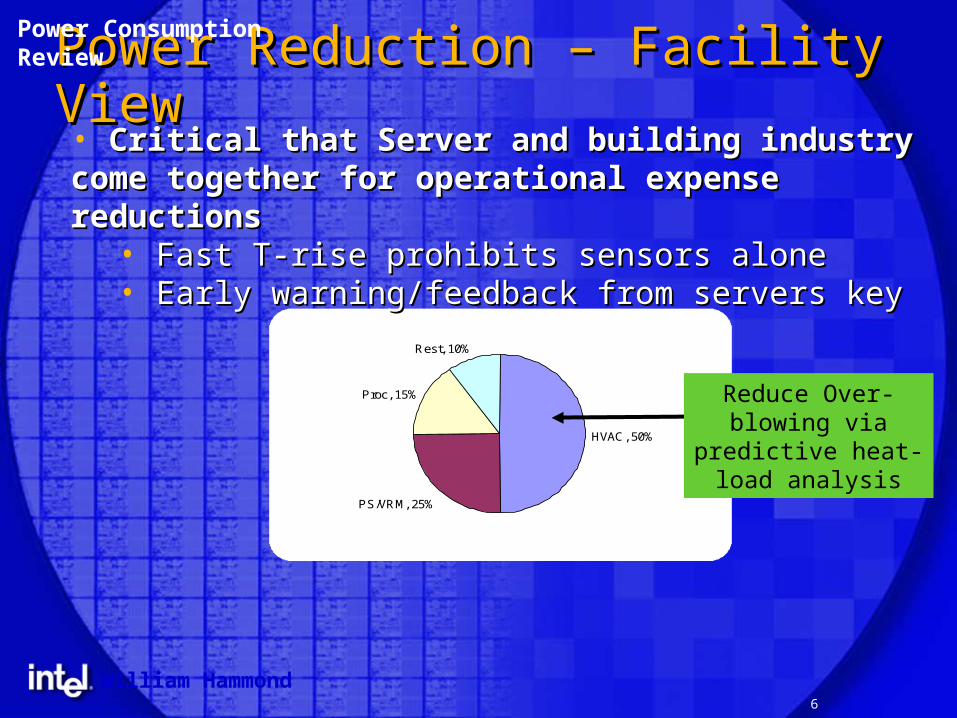
HVAC, 50%
PS/VRM, 25%
Proc, 15%
Rest, 10%
Power Reduction – Facility ViewPower Reduction – Facility ViewPower Consumption Review
• Critical that Server and building industry come together Critical that Server and building industry come together for operational expense reductionsfor operational expense reductions
• Fast T-rise prohibits sensors aloneFast T-rise prohibits sensors alone• Early warning/feedback from servers keyEarly warning/feedback from servers key
Reduce Over-blowing via predictive heat-
load analysis
7
William Hammond
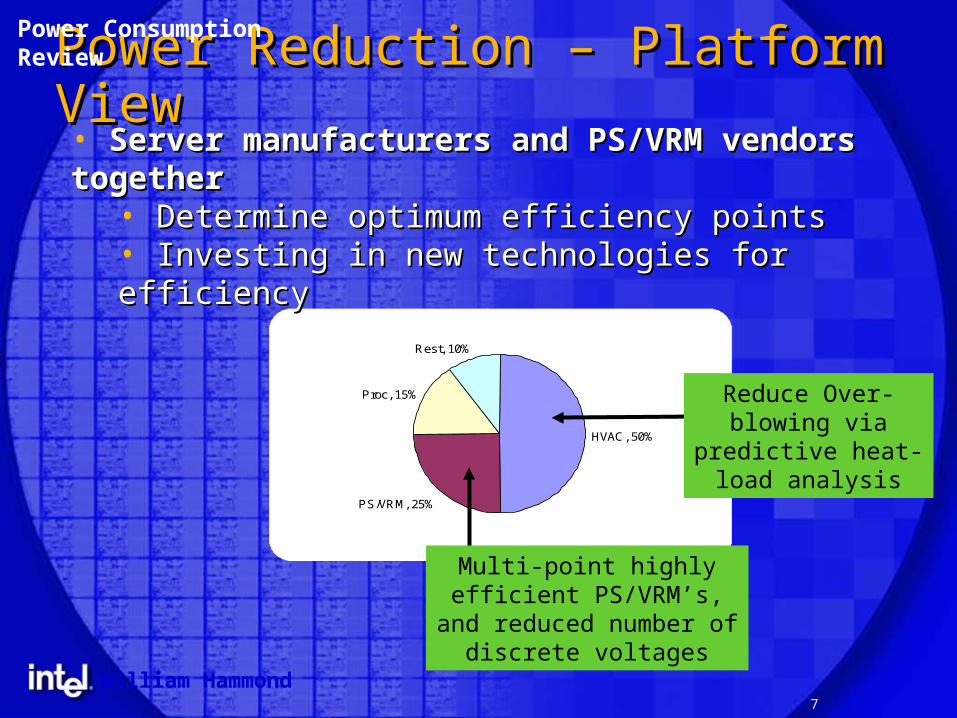
HVAC, 50%
PS/VRM, 25%
Proc, 15%
Rest, 10%
Power Reduction – Platform Power Reduction – Platform ViewView
Power Consumption Review
• Server manufacturers and PS/VRM vendors togetherServer manufacturers and PS/VRM vendors together• Determine optimum efficiency pointsDetermine optimum efficiency points• Investing in new technologies for efficiencyInvesting in new technologies for efficiency
Reduce Over-blowing via predictive heat-
load analysis
Multi-point highly efficient PS/VRM’s, and reduced
number of discrete voltages
8
William Hammond
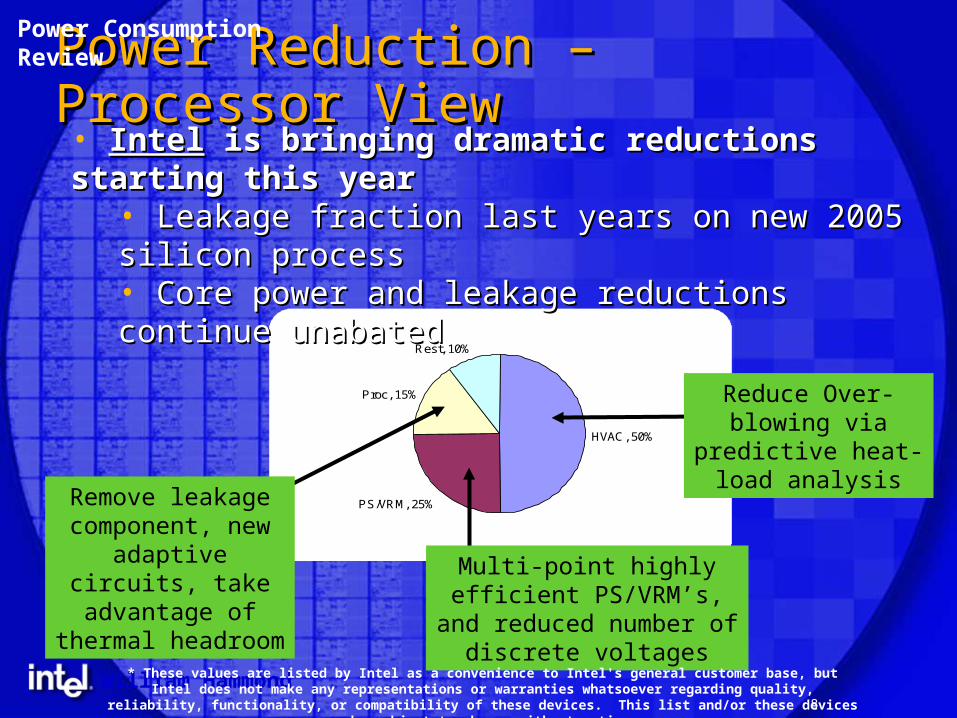
HVAC, 50%
PS/VRM, 25%
Proc, 15%
Rest, 10%
Power Reduction – Processor Power Reduction – Processor ViewView
Power Consumption Review
• IntelIntel is bringing dramatic reductions starting this year is bringing dramatic reductions starting this year• Leakage fraction last years on new 2005 silicon processLeakage fraction last years on new 2005 silicon process• Core power and leakage reductions continue unabatedCore power and leakage reductions continue unabated
Reduce Over-blowing via predictive heat-
load analysis
Multi-point highly efficient PS/VRM’s, and reduced
number of discrete voltages
Remove leakage component, new
adaptive circuits, take advantage of thermal
headroom
* These values are listed by Intel as a convenience to Intel's general customer base, but Intel does not make any representations or warranties whatsoever regarding quality, reliability, functionality, or compatibility of these devices.
This list and/or these devices may be subject to change without notice.
9
William Hammond
HVAC, 50%
PS/VRM, 25%
Proc, 15%
Rest, 10%
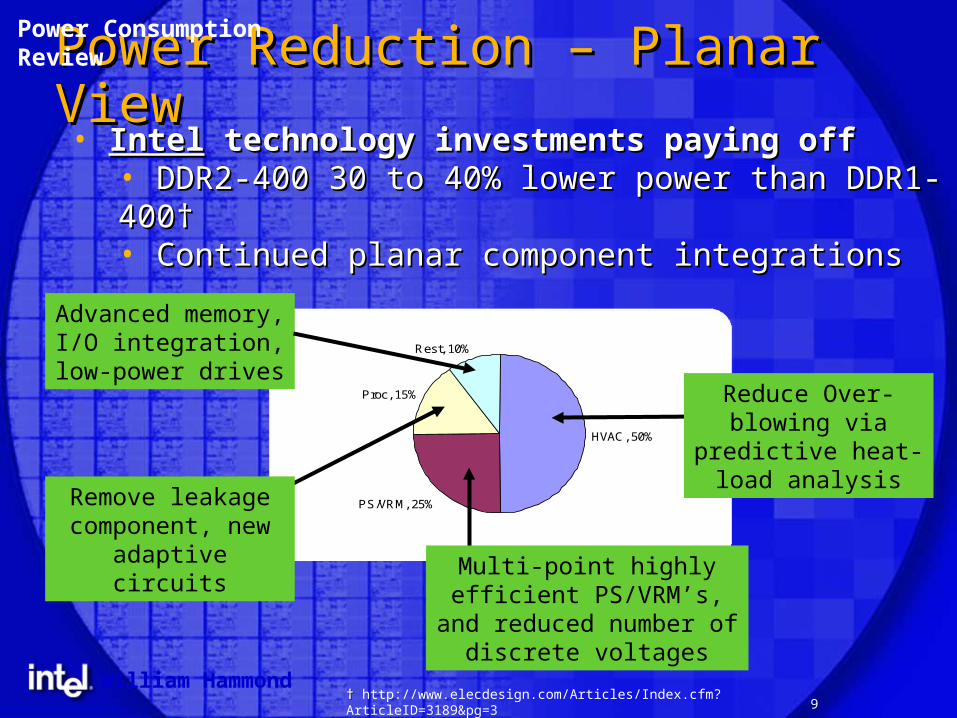
Power Reduction – Planar ViewPower Reduction – Planar ViewPower Consumption Review
• IntelIntel technology investments paying off technology investments paying off • DDR2-400 30 to 40% lower power than DDR1-400†DDR2-400 30 to 40% lower power than DDR1-400†• Continued planar component integrationsContinued planar component integrations
Reduce Over-blowing via predictive heat-
load analysis
Multi-point highly efficient PS/VRM’s, and reduced
number of discrete voltages
Remove leakage component, new adaptive circuits
Advanced memory, I/O integration, low-
power drives
†† http://www.elecdesign.com/Articles/Index.cfm?ArticleID=3189&pg=3

10
William Hammond
Power Reduction - SummaryPower Reduction - SummaryPower Consumption Review
• Intel delivering a Intel delivering a holistic platformholistic platform response to impact response to impact all areas of power consumptionall areas of power consumption
Dramatic reduction in processor power consumption Dramatic reduction in processor power consumption • Intel silicon processes and leakage reductionsIntel silicon processes and leakage reductions• Architecture and design carryover from mobile lineArchitecture and design carryover from mobile line
System Level EnhancementsSystem Level Enhancements• High Efficiency Power Supplies and VRM’sHigh Efficiency Power Supplies and VRM’s• Demand Based SwitchingDemand Based Switching
Datacenter Level IntelDatacenter Level Intel®® Power Utilities Power Utilities• Power Calculator – Maximize existing CapExPower Calculator – Maximize existing CapEx• Power Monitor – Minimize ongoing OpExPower Monitor – Minimize ongoing OpEx
William Hammond
Datacenter Datacenter Modular Modular Power IssuesPower Issues
12
William Hammond
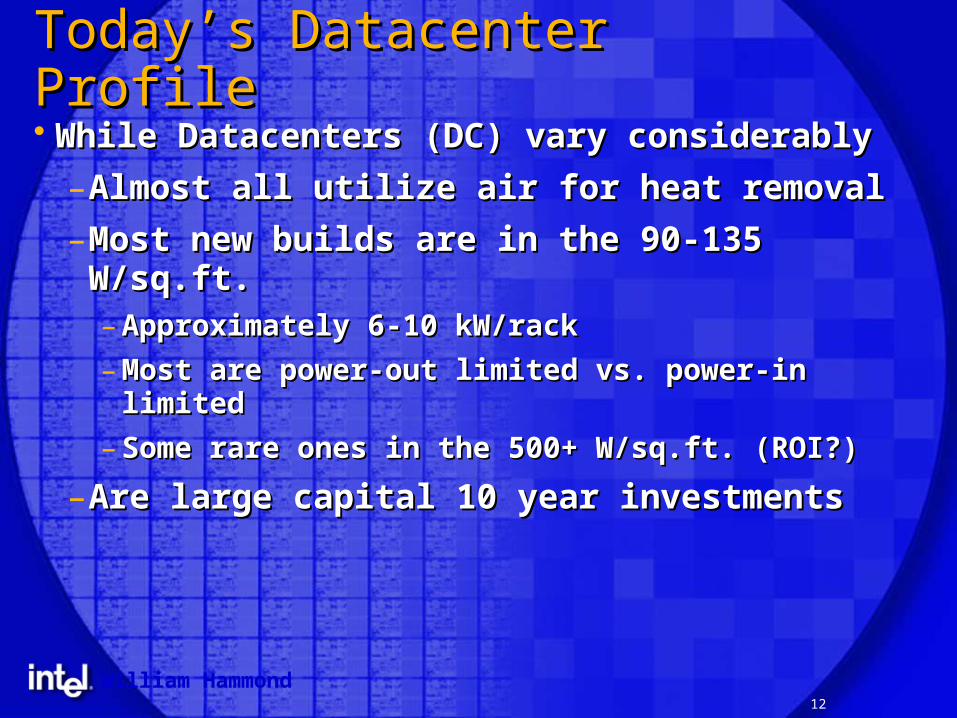
Today’s Datacenter ProfileToday’s Datacenter Profile While Datacenters (DC) vary considerablyWhile Datacenters (DC) vary considerably
–Almost all utilize air for heat removalAlmost all utilize air for heat removal
–Most new builds are in the 90-135 W/sq.ft.Most new builds are in the 90-135 W/sq.ft.– Approximately 6-10 kW/rackApproximately 6-10 kW/rack
– Most are power-out limited vs. power-in limitedMost are power-out limited vs. power-in limited
– Some rare ones in the 500+ W/sq.ft. (ROI?)Some rare ones in the 500+ W/sq.ft. (ROI?)
–Are large capital 10 year investmentsAre large capital 10 year investments

13
William Hammond
Issue: Rack System Power ProfileIssue: Rack System Power ProfilePCI7%
Drives9%
Planar3%
Memory9%
AC/DC losses25%Processors
25%
Standby2%
Other45%
Fans12%
DC/DC losses8%
2U system (average config)2U system (average config)– Unrestricted Rack=21.6KW (20)Unrestricted Rack=21.6KW (20)
– 40 total Processors40 total Processors– 721W/sq ft @ 30sq ft/rack721W/sq ft @ 30sq ft/rack
– 6 sys at 90W/sq ft, 6 sys at 90W/sq ft, 12 Processors12 Processors
1082 W AC total1082 W AC total
1U system (average config)1U system (average config)– Unrestricted Rack =35.7KW (40)Unrestricted Rack =35.7KW (40)
– 80 total Processors80 total Processors– 1192W/sq ft @ 30sq ft/rack1192W/sq ft @ 30sq ft/rack
– 7 sys at 90W/sq ft, 7 sys at 90W/sq ft, 14 Processors14 Processors
DC/DC losses10%
Fans9%
Other44%
Standby2%
Processors30%
AC/DC losses25%
Memory11%
Planar4%
Drives6%PCI
3%
894 W AC total894 W AC total

14
William Hammond
Issue: Power doesn’t track UtilizationIssue: Power doesn’t track Utilization
Weekday Processor Utilization
0
10
20
30
40
50
60
70
0:00
:00
1:30
:00
3:00
:00
4:30
:00
6:00
:00
7:30
:00
9:00
:00
10:3
0:00
12:0
0:00
13:3
0:00
15:0
0:00
16:3
0:00
18:1
0:00
19:4
0:00
21:1
0:00
22:4
0:00
% U
tili
zati
on
A day in Exchange Workload
DP-500W .NET Web Server
Average Power ~ 170 Watt despite big variation in processor utilization
0102030405060708090
100
1
11 21
31
41
51
61
71
81
91
10
1
111
12
1
13
1
14
1
15
1
16
1
17
1
Time
Pro
ce
ss
or
Utl
iza
tio
n
020406080100120140160180200220
CPU 0 CPU1 Power
Processor utilization indicates how busy a server is.
System power continues to be high during low processor
utilization.
15
William Hammond
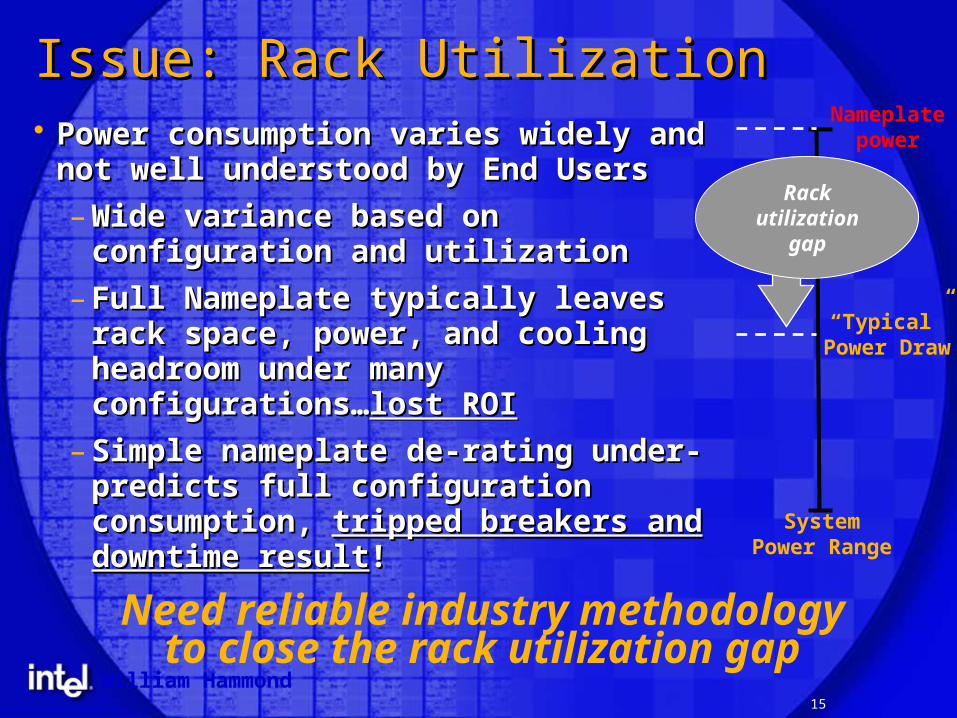
Issue: Rack UtilizationIssue: Rack Utilization Power consumption varies widely and not Power consumption varies widely and not
well understood by End Userswell understood by End Users
– Wide variance based on configuration Wide variance based on configuration and utilization and utilization
– Full Nameplate typically leaves rack Full Nameplate typically leaves rack space, power, and cooling headroom space, power, and cooling headroom under many configurations…under many configurations…lost ROIlost ROI
– Simple nameplate de-rating under-Simple nameplate de-rating under-predicts full configuration consumption, predicts full configuration consumption, tripped breakers and downtime resulttripped breakers and downtime result!!
Nameplatepower
“Typical”Power Draw
Need reliable industry methodology to close the rack utilization gap
Rackutilization
gap
SystemPower Range
William Hammond
IntelIntel®® Power Power UtilitiesUtilities
Demand Based SwitchingDemand Based Switching Power CalculatorPower Calculator Power MonitorPower Monitor
17
William Hammond
Intel®® Power Utilities
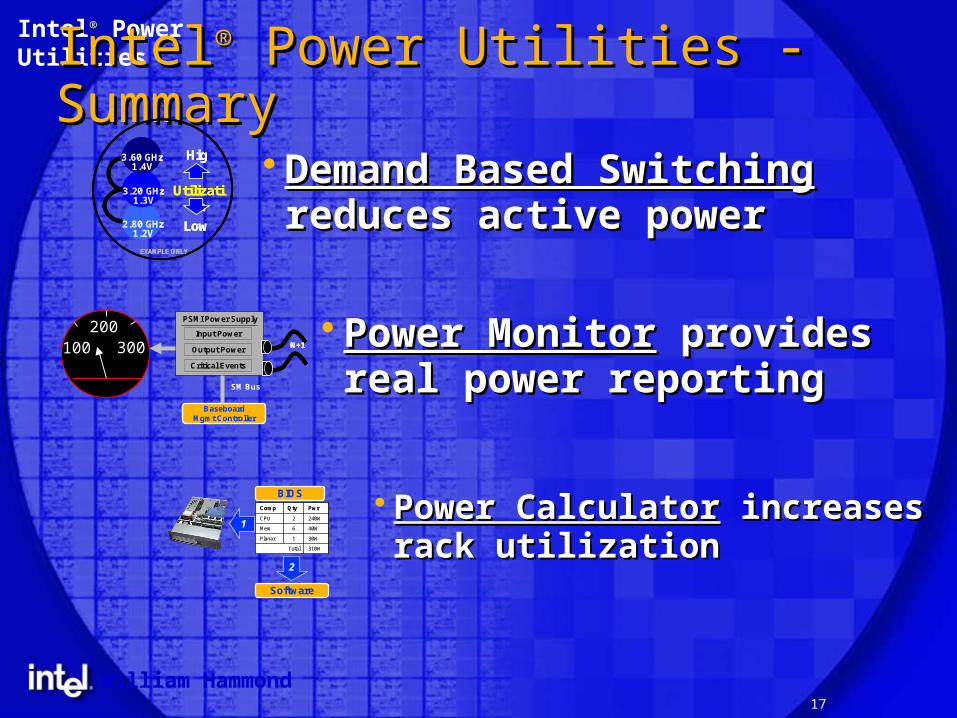
IntelIntel®® Power Utilities - Summary Power Utilities - Summary
Demand Based SwitchingDemand Based Switching reduces active powerreduces active power2.80 GHz
1.2V
EXAMPLE ONLY
High
Low
Utilization
3.20 GHz1.3V
3.60 GHz1.4V
2.80 GHz1.2V
EXAMPLE ONLY
High
Low
Utilization
3.20 GHz1.3V
3.60 GHz1.4V
Software
310W310WTotalTotal
30W30W11PlanarPlanar
40W40W66MemMem
240W240W22CPUCPU
PwrPwrQtyQtyCompComp
310W310WTotalTotal
30W30W11PlanarPlanar
40W40W66MemMem
240W240W22CPUCPU
PwrPwrQtyQtyCompComp
1
2
BIOS Power CalculatorPower Calculator increases rack utilizationincreases rack utilization
Power MonitorPower Monitor provides provides real power reportingreal power reporting
100200
300
BaseboardMgmt Controller
PSMI Power Supply
Input Power
Output Power
Critical Events
SM Bus
N+1N+1

18
William Hammond
0
10
20
30
40
50
60
70
80
90
1001 12 23 34 45 56 67 78 89 100
111
122
133
144
155
166
177
188
0%
20%
40%
60%
80%
100%
120%
CPU 0 CPU 1 P with DBS P w/o DBS
Estimated power profile for the “hypothetical example”
% p
roce
sso
r u
tiliz
atio
n
Server system power without DBS
Server system power with DBS
Assumptions: All components except processor consume fixed amount of power
DBS gives application the power when it is neededDBS gives application the power when it is needed
AC power as % of max AC power
Solution: Solution: DDemand emand BBased ased SSwitchingwitching
Here….
To here….
William Hammond
19
William Hammond
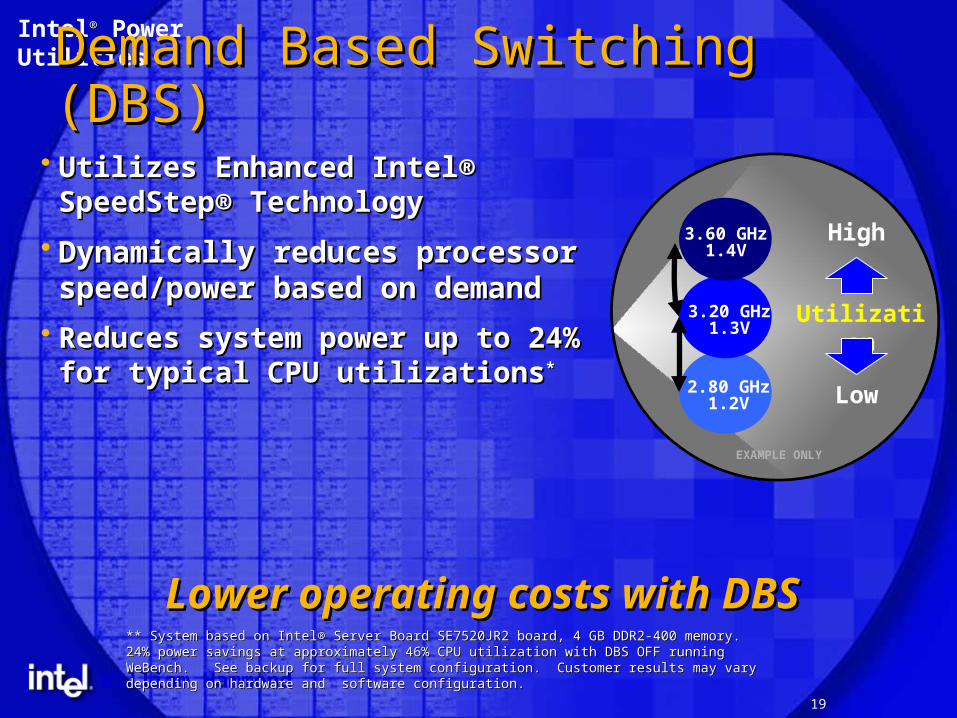
Utilizes Enhanced Intel® Utilizes Enhanced Intel® SpeedStep® Technology SpeedStep® Technology
Dynamically reduces processor Dynamically reduces processor speed/power based on demandspeed/power based on demand
Reduces system power up to Reduces system power up to 24% for typical CPU utilizations24% for typical CPU utilizations**
** ** System based on Intel® Server Board SE7520JR2 board, 4 GB DDR2-400 memory. 24% System based on Intel® Server Board SE7520JR2 board, 4 GB DDR2-400 memory. 24% power savings at approximately 46% CPU utilization with DBS OFF running WeBench. See power savings at approximately 46% CPU utilization with DBS OFF running WeBench. See backup for full system configuration. Customer results may vary depending on hardware and backup for full system configuration. Customer results may vary depending on hardware and software configuration.software configuration.
2.80 GHz1.2V
EXAMPLE ONLY
High
Low
Utilization3.20 GHz1.3V
3.60 GHz1.4V
Lower operating costs with DBSLower operating costs with DBS
Intel®® Power Utilities
Demand Based Switching (DBS)Demand Based Switching (DBS)

20
William Hammond
Intel®® Power Utilities
DBS - System Power BenefitsDBS - System Power Benefits
*Customer results may vary depending on hardware and software configuration.*Customer results may vary depending on hardware and software configuration.
1U Intel® Xeon™ processor platform
45% CPU utilization running WebBench
Power Meter
100 200 300
DBS OFF
100 200 300
DBS ON
316W316W
240W240W
Power Meter
100 200 300
DBS OFF
Power Meter
100 200 300
DBS OFF
100 200 300
DBS OFF
100 200 300
DBS ON
100 200 300
DBS ON
316W316W
240W240W
$100K Savings $100K Savings annually for every annually for every
500 servers500 serversPDU
PDUPDU
PDUPDU
PDUPDU
PDUPDU
PDUPDU
PDU
Measurements based on Intel testing.Cost assumptions made for systems tested:a. “Power in” costs assumed at $0.10 / KWhb. “Cooling costs” assumed to be roughly 2X the power-in costs
$100K Savings $100K Savings annually for every annually for every
500 servers500 serversPDU
PDUPDU
PDUPDUPDUPDUPDUPDU
PDUPDUPDUPDU
PDUPDU
PDUPDUPDUPDUPDUPDU
PDUPDUPDUPDU
PDUPDU
PDUPDUPDUPDUPDUPDU
PDUPDUPDUPDU
PDUPDU
PDUPDUPDUPDUPDUPDU
PDUPDUPDU
Measurements based on Intel testing.Cost assumptions made for systems tested:a. “Power in” costs assumed at $0.10 / KWhb. “Cooling costs” assumed to be roughly 2X the power-in costs
You can You can reduce powerreduce power and and save operating costssave operating costs with DBS with DBS
21
William Hammond
Software
310W310WTotalTotal
30W30W11PlanarPlanar
40W40W66MemMem
240W240W22CPUCPU
PwrPwrQtyQtyCompComp
310W310WTotalTotal
30W30W11PlanarPlanar
40W40W66MemMem
240W240W22CPUCPU
PwrPwrQtyQtyCompComp
1
2
BIOS
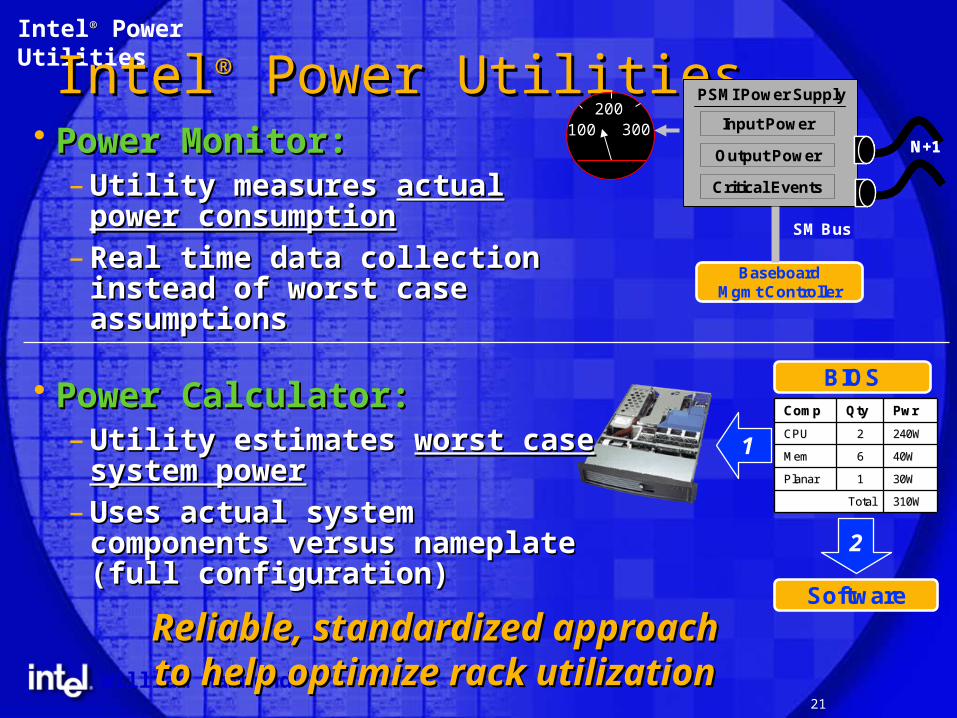
Power Monitor:Power Monitor:– Utility measures Utility measures actual power actual power
consumptionconsumption– Real time data collection instead Real time data collection instead
of worst case assumptionsof worst case assumptions
Power Calculator:Power Calculator:– Utility estimates Utility estimates worst case worst case
system powersystem power – Uses actual system components Uses actual system components
versus nameplate (full versus nameplate (full configuration)configuration)
Reliable, standardized Reliable, standardized approach to help optimize approach to help optimize
rack utilizationrack utilization
Intel®® Power Utilities
IntelIntel®® Power Utilities Power Utilities
BaseboardMgmt Controller
PSMI Power Supply
Input Power
Output Power
Critical Events
SM Bus
N+1N+1100
200300
22
William Hammond
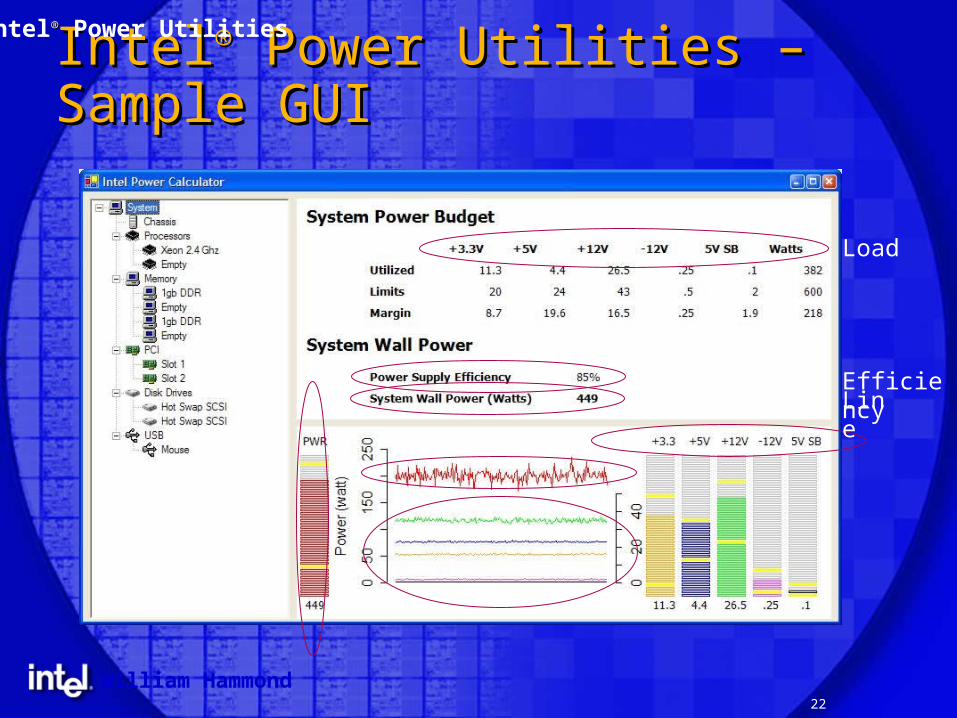
IntelIntel®® Power Utilities – Sample Power Utilities – Sample GUIGUI
Intel®® Power Utilities
Efficiency
Load
Line

23
William Hammond
IntelIntel®® Power Utilities - Power Utilities - StandardsStandards
Intel®® Power Utilities
IPMI/CIM+
BMCFirmware
IPMIengine
PXE/EFI
CIM+engine
IPMIprovider
SNMPprovider
CIMschema
CIMOM
Unified Mgt Module (UMM)PolicyMgr
ScriptingEngine
Chassismgt
PSMI Enabled Power Supply
Line PowerLoad Power (n)
Critical Events
SMB-I
CIM-XML
BMC®® Patrol*
CA®® Unicenter*
Enigmatec®® DR-Orchestator*
HP®® Open View*
IBM®® Tivoli*
Intel®® Server Console*
MS®® Operations Manager*
Potential Future Consoles
LED Control
Predictive Fail
*Other names and brands may be claimed as the property of others. These [vendors, devices] are listed by Intel as a convenience to Intel's general customer base, but Intel does not make any representations or warranties whatsoever
regarding quality, reliability, functionality, or compatibility of these devices. This list and/or these devices may be subject to change without notice.
24
William Hammond
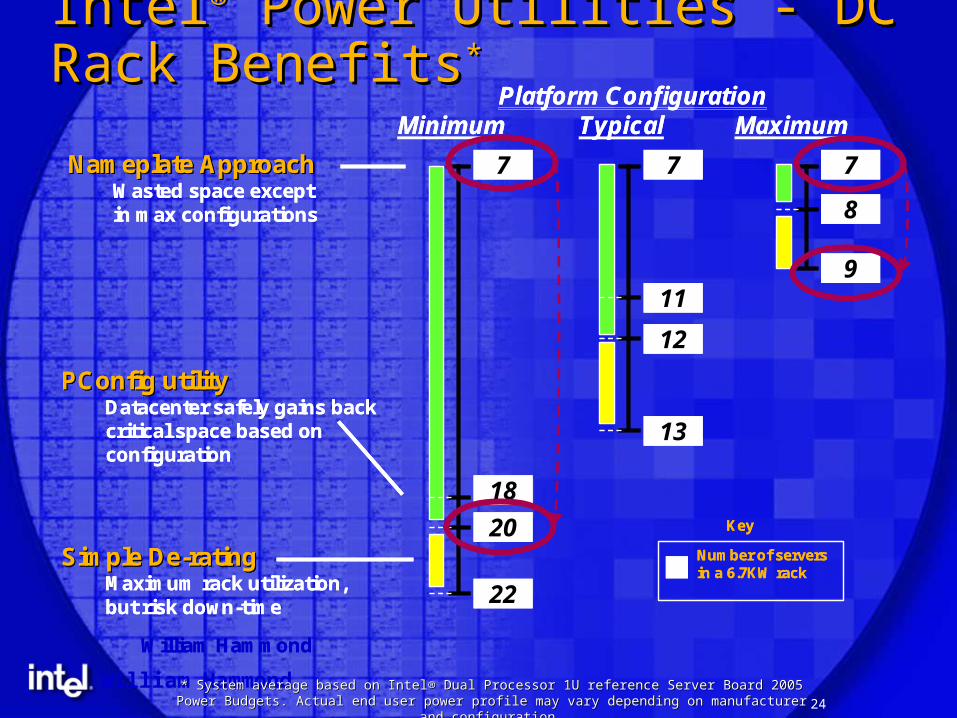
IntelIntel®® Power Utilities - DC Rack Power Utilities - DC Rack BenefitsBenefits**
Typical
Nameplate ApproachNameplate ApproachWasted space except in max configurations
7
PConfig utilityPConfig utilityDatacenter safely gains back critical space based on configuration
Simple DeSimple De--ratingratingMaximum rack utilization,but risk down-time
11
12
13
MaximumMinimum
7
18
20
22
7
8
9
Number of serversin a 6.7KW rack
Key
Platform Configuration
William Hammond
* * System average based on Intel® Dual Processor 1U reference Server Board 2005 Power System average based on Intel® Dual Processor 1U reference Server Board 2005 Power Budgets. Actual end user power profile may vary depending on manufacturer and Budgets. Actual end user power profile may vary depending on manufacturer and
configuration.configuration.
25
William Hammond
IntelIntel®® Power Utilities - Summary Power Utilities - Summary
IntelIntel®® Power Utilities provide reliable, Power Utilities provide reliable, standardized approach to help optimize standardized approach to help optimize rack utilization and minimize OpExrack utilization and minimize OpEx
Intel®® Power Utilities
*Other names and brands may be claimed as the property of others. These [vendors, devices] are listed by Intel as a convenience to Intel's general customer base, but Intel does not make any representations or warranties whatsoever
regarding quality, reliability, functionality, or compatibility of these devices. This list and/or these devices may be subject to change without notice.
William Hammond
DC Power DC Power Futures – Futures – Attacking the Attacking the OpEx problemOpEx problem
27
William Hammond
Operational Expense - ProblemOperational Expense - Problem
Business needs not aligned with power Business needs not aligned with power consumption – neither platform nor DCconsumption – neither platform nor DC– Little capability to minimize OpExLittle capability to minimize OpEx
– Little capability to fully maximize CapEx Little capability to fully maximize CapEx
– Pre-defined Service Level Agreements (SLA) are Pre-defined Service Level Agreements (SLA) are measured historicallymeasured historically
DC OpEx futures
Power Utilities is part of the Power Utilities is part of the solutionsolution

28
William Hammond
Operational Expense - SolutionsOperational Expense - Solutions
Web services type interaction is the future for Web services type interaction is the future for both platform and traditional facilitiesboth platform and traditional facilities– Service Oriented Enterprise controlService Oriented Enterprise control
– Service Oriented Infrastructure communicationService Oriented Infrastructure communication
– Service Oriented Architecture compute/facilityService Oriented Architecture compute/facility
All assets will report capabilities via CIM+XMLAll assets will report capabilities via CIM+XML**
– CoD/grid deployments used to match to SLACoD/grid deployments used to match to SLA
– Highest business needs will get priority systemsHighest business needs will get priority systems
– Lower business needs will be OpEx optimizedLower business needs will be OpEx optimized
DC OpEx futures
Power Utilities will grow with Power Utilities will grow with your DCyour DC
29
William Hammond
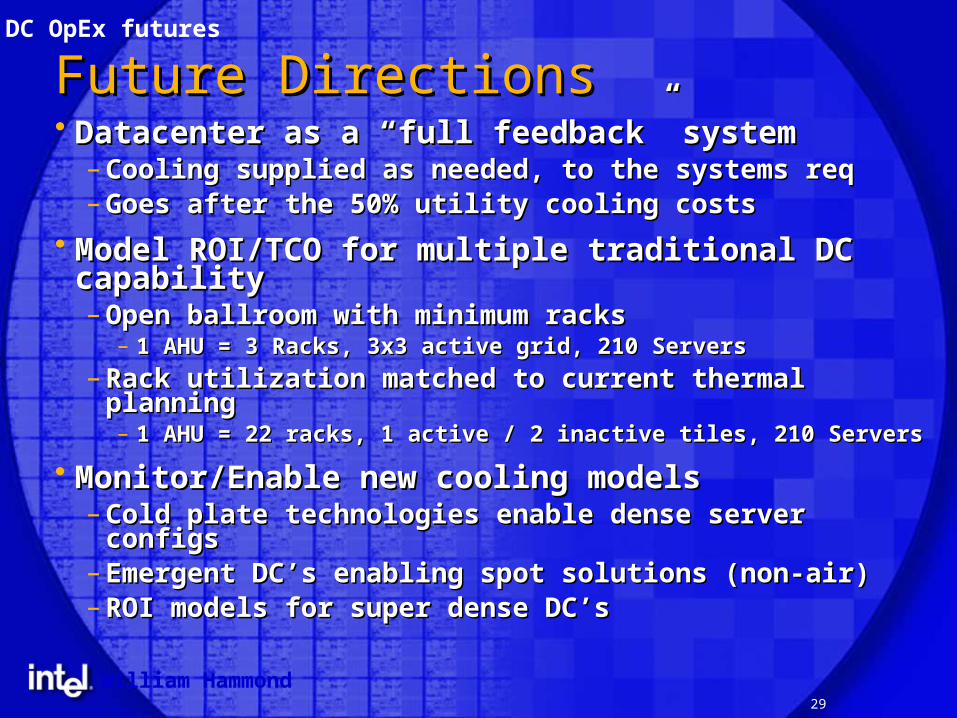
Future DirectionsFuture Directions Datacenter as a “full feedback” systemDatacenter as a “full feedback” system
– Cooling supplied as needed, to the systems reqCooling supplied as needed, to the systems req– Goes after the 50% utility cooling costsGoes after the 50% utility cooling costs
Model ROI/TCO for multiple traditional DC Model ROI/TCO for multiple traditional DC capabilitycapability– Open ballroom with minimum racks Open ballroom with minimum racks
– 1 AHU = 3 Racks, 3x3 active grid, 210 Servers1 AHU = 3 Racks, 3x3 active grid, 210 Servers
– Rack utilization matched to current thermal planning Rack utilization matched to current thermal planning – 1 AHU = 22 racks, 1 active / 2 inactive tiles, 210 Servers1 AHU = 22 racks, 1 active / 2 inactive tiles, 210 Servers
Monitor/Enable new cooling modelsMonitor/Enable new cooling models– Cold plate technologies enable dense server configsCold plate technologies enable dense server configs– Emergent DC’s enabling spot solutions (non-air)Emergent DC’s enabling spot solutions (non-air)– ROI models for super dense DC’sROI models for super dense DC’s
DC OpEx futures
William Hammond
SummarySummary
31
William Hammond
SummarySummary
IntelIntel®® delivering a delivering a holistic platform responseholistic platform response to to impact impact allall areas of power consumption areas of power consumption
IntelIntel®® Power Utilities Power Utilities provide reliable, provide reliable, standardized approach to help optimize rack standardized approach to help optimize rack utilization and minimize OpExutilization and minimize OpEx
IntelIntel®® Power Utilities will grow with your DC Power Utilities will grow with your DC IntelIntel®® Processors – Processors – The processor for your DCThe processor for your DC
Summary

32
William Hammond
Thank You!Thank You!

William Hammond
BackupBackup
34
William Hammond
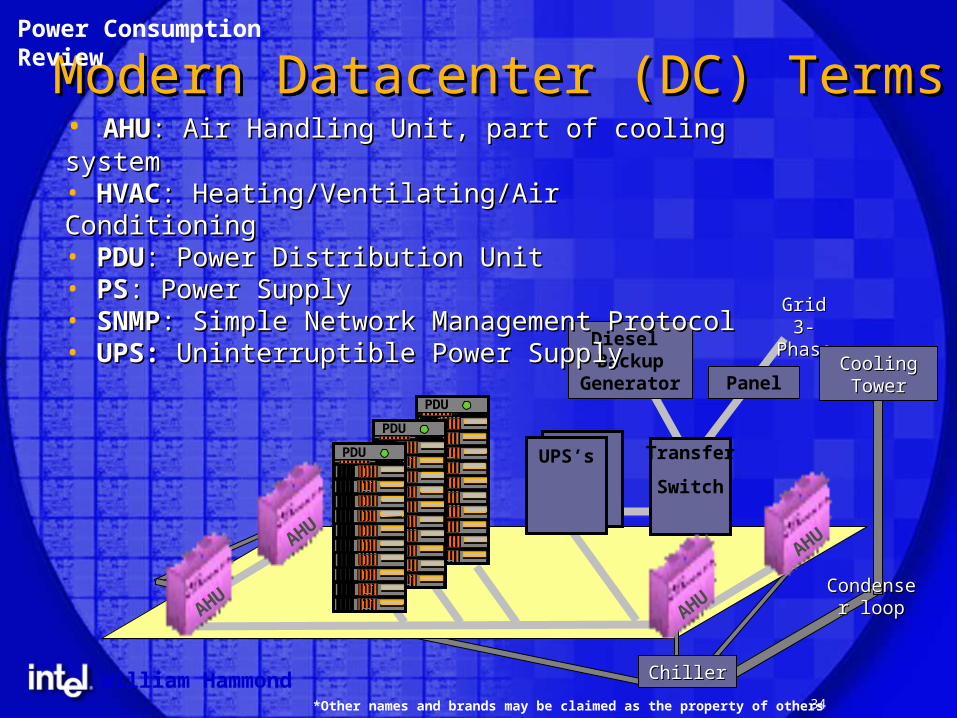
PDU
PDU
PDU UPS’s Transfer
Switch
Modern Datacenter (DC) TermsModern Datacenter (DC) Terms
AHU
AHU
AHU
Panel
GridGrid3-Phase3-Phase
Diesel Backup
Generator
Power Consumption Review
AHU
ChillerChiller
Condenser Condenser looploop
CoolingCoolingTowerTower
• AHUAHU:: Air Handling Unit, part of cooling systemAir Handling Unit, part of cooling system• HVACHVAC: Heating/Ventilating/Air Conditioning : Heating/Ventilating/Air Conditioning • PDUPDU: Power Distribution Unit: Power Distribution Unit• PSPS: Power Supply: Power Supply• SNMPSNMP: Simple Network Management Protocol: Simple Network Management Protocol• UPS: UPS: Uninterruptible Power SupplyUninterruptible Power Supply
*Other names and brands may be claimed as the property of others
35
William Hammond
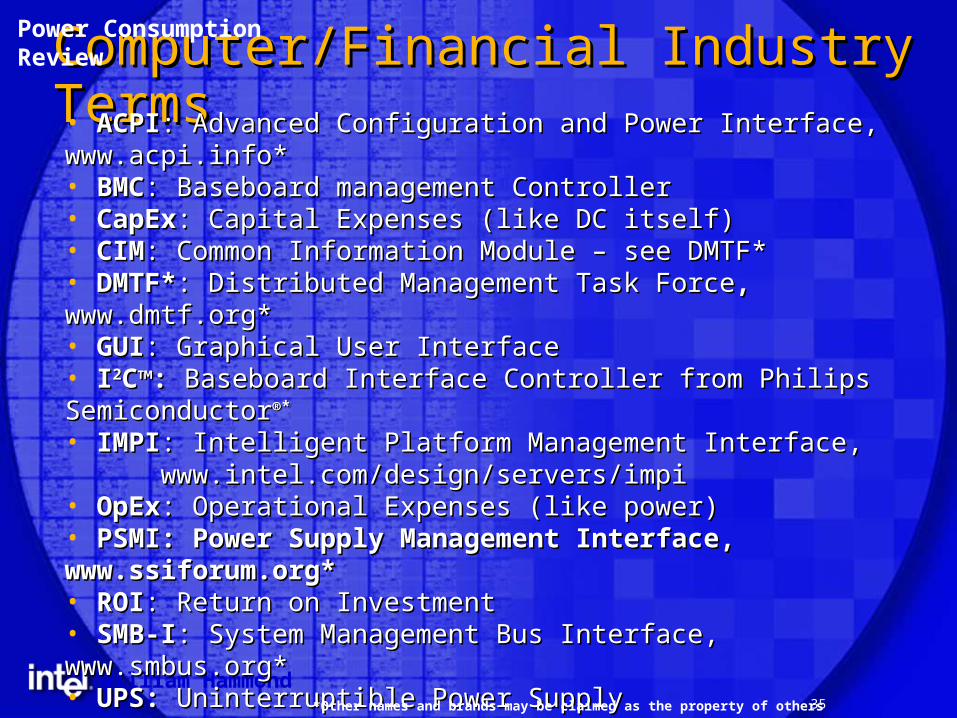
Computer/Financial Industry Computer/Financial Industry TermsTerms
Power Consumption Review
• ACPIACPI: Advanced Configuration and Power Interface, www.acpi.info*: Advanced Configuration and Power Interface, www.acpi.info*• BMCBMC: Baseboard management Controller: Baseboard management Controller • CapExCapEx: Capital Expenses (like DC itself): Capital Expenses (like DC itself) • CIMCIM: Common Information Module – see DMTF*: Common Information Module – see DMTF*• DMTF*DMTF*: Distributed Management Task Force: Distributed Management Task Force, , www.dmtf.org*www.dmtf.org*• GUIGUI: Graphical User Interface: Graphical User Interface • II22CC™™: : Baseboard Interface Controller from Philips SemiconductorBaseboard Interface Controller from Philips Semiconductor®*®*
• IMPIIMPI: Intelligent Platform Management Interface,: Intelligent Platform Management Interface,www.intel.com/design/servers/impiwww.intel.com/design/servers/impi
• OpExOpEx: Operational Expenses (like power): Operational Expenses (like power)• PSMI: Power Supply Management Interface, www.ssiforum.org*PSMI: Power Supply Management Interface, www.ssiforum.org*• ROIROI: Return on Investment: Return on Investment• SMB-ISMB-I: System Management Bus Interface, www.smbus.org*: System Management Bus Interface, www.smbus.org*• UPS: UPS: Uninterruptible Power SupplyUninterruptible Power Supply• WSWS: Web Services: Web Services• XMLXML: E: Exxtensible tensible MMarkup arkup LanguageLanguage
*Other names and brands may be claimed as the property of others