efpia viewpoint: health technology assessment (hta...
TRANSCRIPT
“Putt ing the pat ient at the center of healthcare decis ions”
EFPIA Viewpoint: Health Technology Assessment (HTA) Application in Select Markets and Implications for Japan

1. Introduction
2. What is Health Technology Assessment (HTA)?
3. Healthcare in Japan Today
4. Lessons from HTA Abroad
5. Impact of HTA on Cancer Treatment
6. EFPIA’s Position on HTA in Japan
7. Executive Summary
Contents
4
5
6
9
12
13
16

4 HTA Application in Select Markets and Implications for Japan
1 I ntroduc t ion
IntroductionIn 2012, the Ministry of Health, Labor and Welfare (MHLW)
asked the advisory body, Chuikyo, to conduct a study on Cost-
Effectiveness Analysis (CEA), an aspect of Health Technology
Assessment (HTA), and to make recommendations regarding
its introduction. Initially planned for launch in 2014, the greater
than expected complexity of the task led to postponement of
any introduction until April 2016.
Since 2012, a project team led by MHLW officials and a small
group of health economists has focused its studies primarily on
CEA and HTA methodologies, drawing from experiences in the
UK and other countries. In June 2014, as part of specific measures
for healthcare in the Japan Revitalization Strategy, the Cabinet
requested the testing of CEA in the assessment for insurance
coverage of innovative medical technologies. Subsequently,
a pilot project was initiated involving five pharmaceutical and
three medical device companies with the intention of identifying
specific challenges that would result from the introduction of an
HTA system.
The MHLW-led study has not yet solicited the views of a broad
group of key stakeholders, such as patient advocates, clinicians,
epidemiologists, health policy specialists, and the pharmaceutical
industry. These stakeholders each have a unique perspective,
knowledge and experience of dealing with HTA systems in other
markets, which are critical to informing the discussion in Japan.
The MHLW study has also not yet addressed Chuikyo’s initial
concerns regarding the purpose of introducing CEA and what
benefits could reasonably be anticipated. Indeed, it is unclear
where value will be added with respect to improved cost-
effectiveness within the context of Japan’s healthcare system and
National Health Insurance,1 given that aspects of HTA are already
embedded in the current pricing and reimbursement system.
Looking at the overseas experience, it is clear that the introduction of an inappropriate HTA system in Japan risks creating barriers to access and undoing the progress Japan has made in
reducing its drug lag.
EFPIA Japan believes it is important that decision-makers
collaborate in a transparent process with all stakeholders before
finalizing a proposal regarding the trial introduction of Cost-
Effectiveness Analysis (CEA) in April 2016. Specifically, EFPIA
suggests the following five principles guide the evolution and
discussion of HTA in Japan:
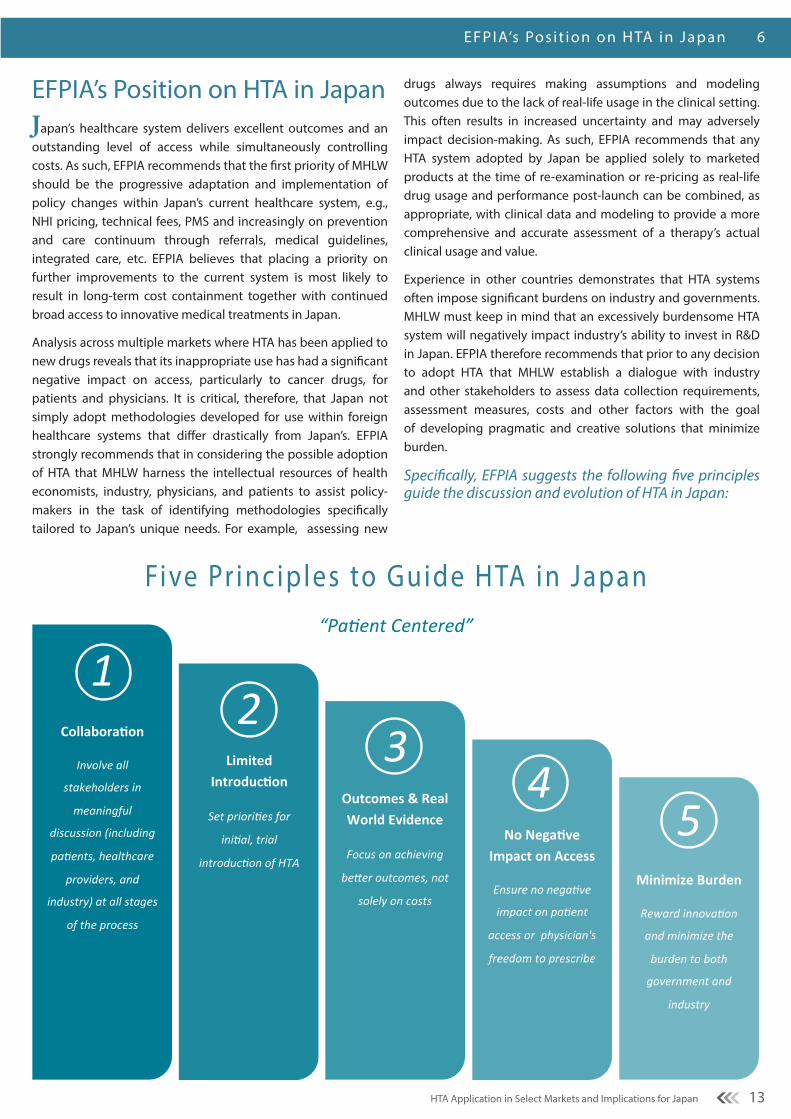
1. Involve all stakeholders in meaningful discussion
(including patients, healthcare providers, and
industry) at all stages of the process
2. Set priorities for the initial, trial introduction of HTA
3. Focus on achieving better health outcomes, not
solely on costs
4. Ensure no negative impact on patient access or
physician’s freedom to prescribe
5. Reward innovation and minimize burden to both
government and industry
1 MHLW. 23 May 2012. Meeting Minutes. 1st meeting of Chuikyo HTA sub-committee. Retrieved from http://www.mhlw.go.jp/stf/shingi/2r9852000002a7t6.html
About EFPIA JapanEFPIA Japan represents 25 R&D-based pharmaceutical companies operating in Japan. Our Mission is to contribute to healthcare and patients in Japan through the early introduction of innovative medicines and vaccines. To do this we encourage access to the most innovative therapies in the shortest possible time; support Japan in becoming a more dynamic and attractive place in
which to invest; and aim to be seen as a trusted healthcare partner.
The combined sales of our member companies account for about one quarter of the pharmaceutical market in Japan, and EFPIA members account for around one-third of all new drugs approved in Japan. EFPIA member companies therefore deliver
significant health benefits to Japanese patients and are an important part of the Japanese pharmaceutical industry.
5HTA Application in Select Markets and Implications for Japan
What is Health Technology Assessment (HTA)? 2
What is Health Technology Assessment (HTA)?The International Society for Pharmacoeconomics and Outcomes Research (ISPOR) defines Health Technology Assessment (HTA) as: “the process that uses evidence to evaluate the clinical efficacy, cost-effectiveness and broader impact of a health technology on patients and the health care system.” 1
Additionally, HTA International (HTAi) stresses that the assessment goes beyond clinical and economic aspects:2
HTA is a multidisciplinary field that addresses the clinical, economic, organizational, social, legal, and ethical impacts of a health technology, considering its specific healthcare context as well as available alternatives. The scope and methods of HTA may be adapted to the needs of a particular health system, but HTA processes and methods should be transparent, systematic, and rigorous.
HTA can take many forms, and be used to address such healthcare topics as:
• Drugs, biologics, devices, procedures
• Support systems, organizational, delivery and management systems (e.g., disease management programs, health care payment systems).
In contrast to this robust range of possible applications, CEA, which is only one of several approaches within HTA, employs a single outcome metric to compare costs and health effects across different interventions. Furthermore, it is important that HTA be used appropriately. For example, according to the European Network of HTA organizations (EUnetHTA), HTA is not a replacement for proper price setting methodologies.
The definition of HTA continues to evolve
The definition of HTA continues to evolve, as does its application and use. Across all markets where HTA is used, it is continually in a state of change: constantly adapting to incorporate new measures of value, reflect changing societal priorities, and address access challenges and patient needs. Although HTA is by nature contextual and takes different forms in different settings, HTA is in general becoming:
• More comprehensive: focusing on diseases and care pathways rather than individual technologies, and informing broader policy decisions beyond pricing and reimbursement.
• More adaptive: continuously collecting / assessing data and informing decisions across the life cycle.
1 International Society for Pharmacoeconomics and Outcomes. (2014). Health care cost, quality, and outcomes: ISPOR book of terms.2 Health Technology Assessment International. 2015. Health Technology Assessment. Retrieved from http://www.htai.org/htai/health-technology-assessment.html
• More collaborative: engaging a wider range of stakeholders.
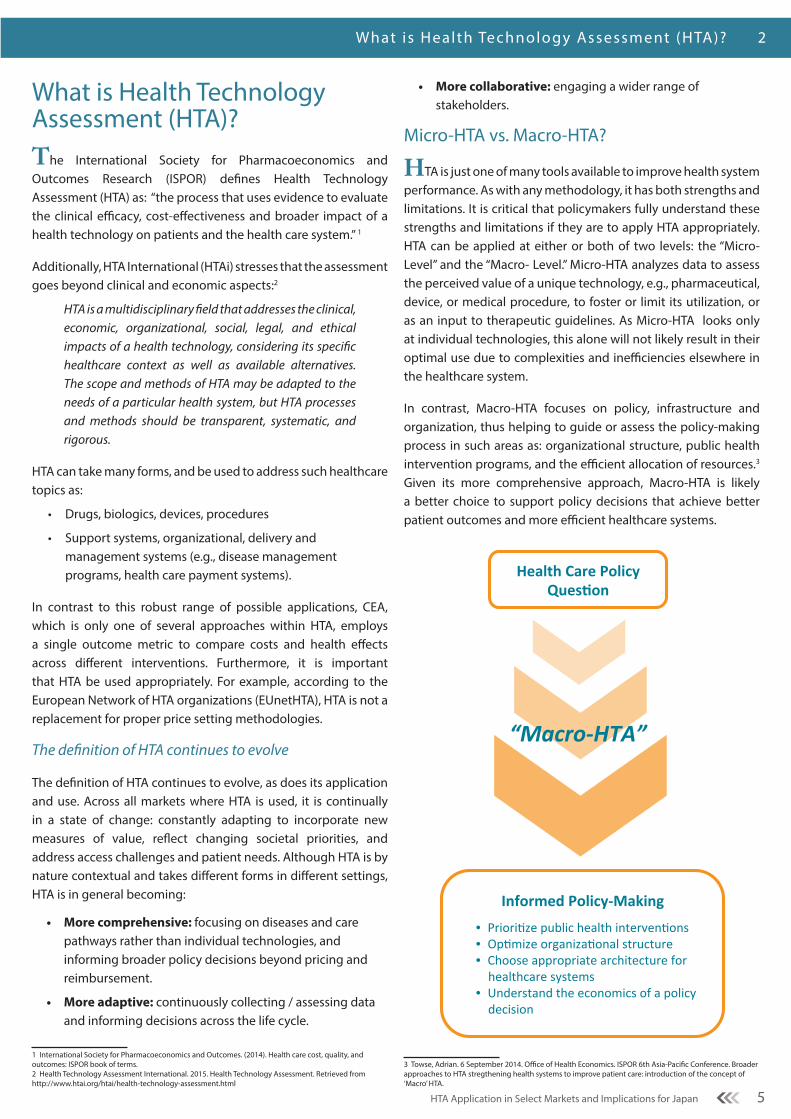
Micro-HTA vs. Macro-HTA?
HTA is just one of many tools available to improve health system performance. As with any methodology, it has both strengths and limitations. It is critical that policymakers fully understand these strengths and limitations if they are to apply HTA appropriately. HTA can be applied at either or both of two levels: the “Micro- Level” and the “Macro- Level.” Micro-HTA analyzes data to assess the perceived value of a unique technology, e.g., pharmaceutical, device, or medical procedure, to foster or limit its utilization, or as an input to therapeutic guidelines. As Micro-HTA looks only at individual technologies, this alone will not likely result in their optimal use due to complexities and inefficiencies elsewhere in the healthcare system.
In contrast, Macro-HTA focuses on policy, infrastructure and organization, thus helping to guide or assess the policy-making process in such areas as: organizational structure, public health intervention programs, and the efficient allocation of resources.3 Given its more comprehensive approach, Macro-HTA is likely a better choice to support policy decisions that achieve better patient outcomes and more efficient healthcare systems.
3 Towse, Adrian. 6 September 2014. Office of Health Economics. ISPOR 6th Asia-Pacific Conference. Broader approaches to HTA stregthening health systems to improve patient care: introduction of the concept of ‘Macro’ HTA.
Health Care Policy Ques2on
Informed Policy-‐Making
• Priori%ze public health interven%ons • Op%mize organiza%onal structure • Choose appropriate architecture for healthcare systems
• Understand the economics of a policy decision
“Macro-‐HTA”
6 HTA Application in Select Markets and Implications for Japan
3 Healthcare in Japan Today
The Context—Healthcare in Japan TodayJapan has one of the most successful national healthcare systems in the world
Foreign governments, nonprofit organizations, and other authorities have recognized the Japanese healthcare system repeatedly for delivering unparalleled access to medicines and high-quality healthcare. Japanese authorities have succeeded in developing a healthcare model that:
• Provides universal access without restriction based on residence, income or financial resources
• Provides high-quality treatments by properly trained medical specialists in private medical practice or employed by public or private medical institutions
• Controls healthcare expenditures through adequate and well-established mechanisms
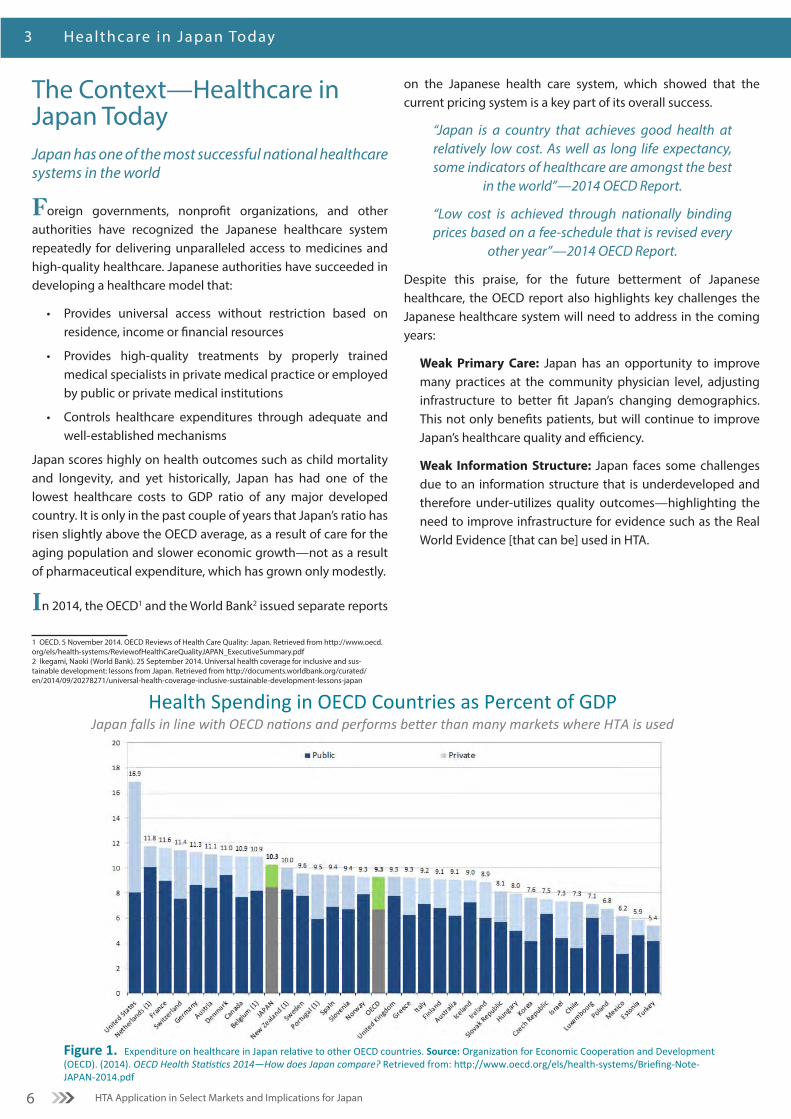
Japan scores highly on health outcomes such as child mortality and longevity, and yet historically, Japan has had one of the lowest healthcare costs to GDP ratio of any major developed country. It is only in the past couple of years that Japan’s ratio has risen slightly above the OECD average, as a result of care for the aging population and slower economic growth—not as a result of pharmaceutical expenditure, which has grown only modestly.
In 2014, the OECD1 and the World Bank2 issued separate reports
1 OECD. 5 November 2014. OECD Reviews of Health Care Quality: Japan. Retrieved from http://www.oecd.org/els/health-systems/ReviewofHealthCareQualityJAPAN_ExecutiveSummary.pdf2 Ikegami, Naoki (World Bank). 25 September 2014. Universal health coverage for inclusive and sus-tainable development: lessons from Japan. Retrieved from http://documents.worldbank.org/curated/en/2014/09/20278271/universal-health-coverage-inclusive-sustainable-development-lessons-japan
on the Japanese health care system, which showed that the current pricing system is a key part of its overall success.
“Japan is a country that achieves good health at relatively low cost. As well as long life expectancy, some indicators of healthcare are amongst the best
in the world”—2014 OECD Report.
“Low cost is achieved through nationally binding prices based on a fee-schedule that is revised every
other year”—2014 OECD Report.
Despite this praise, for the future betterment of Japanese healthcare, the OECD report also highlights key challenges the Japanese healthcare system will need to address in the coming years:
Weak Primary Care: Japan has an opportunity to improve many practices at the community physician level, adjusting infrastructure to better fit Japan’s changing demographics. This not only benefits patients, but will continue to improve Japan’s healthcare quality and efficiency.
Weak Information Structure: Japan faces some challenges due to an information structure that is underdeveloped and therefore under-utilizes quality outcomes—highlighting the need to improve infrastructure for evidence such as the Real World Evidence [that can be] used in HTA.
Figure 1. Expenditure on healthcare in Japan rela2ve to other OECD countries. Source: Organiza2on for Economic Coopera2on and Development (OECD). (2014). OECD Health Sta-s-cs 2014—How does Japan compare? Retrieved from: hEp://www.oecd.org/els/health-‐systems/Briefing-‐Note-‐JAPAN-‐2014.pdf
Health Spending in OECD Countries as Percent of GDP Japan falls in line with OECD na-ons and performs beAer than many markets where HTA is used

7HTA Application in Select Markets and Implications for Japan
Healthcare in Japan Today 3
Japan’s reduction of its drug lag has been one of the great public policy successes of recent years
Over the past five years, the government of Japan has taken major steps towards the elimination of the “drug lag”—the period from first global launch to launch in Japan. This has been achieved partly by doubling the number of staff at the regulatory agency, the Pharmaceutical and Medical Devices Agency (PMDA), and streamlining approval processes. This has significantly reduced the time for the regulatory review of new drugs (Figure 2). Another significant factor has been the introduction in 2010 of the “innovation premium”, which largely protects patented products from price cuts. This has led to a sharp increase in the number of new drug development projects in Japan (Figure 3). Taken together, these policy changes amount to a significant improvement in the environment for innovation, and as a result many more innovative medicines are now available to Japanese patients. Notwithstanding the success in reducing the drug lag, Japan has not stopped there. The revision of the Pharmaceutical Affairs Law, the creation of the Japan Agency for Medical Research and Development (AMED1) and the Sakigake registration package, all indicate a desire to further boost the pro-innovation environment in Japan.
The Japanese government also recognizes the strategic economic importance of the pharmaceutical industry. In February 2013, the Office of Health and Medical Strategy was moved under the
1 AMED: Established in April 2015 to pool the public funding to healthcare research from three ministries: MEXT, METI and MHLW.
direct control of the Chief Cabinet Secretary. Pharmaceuticals and medical devices have been identified as “globally promising industries” that will play a central role in the Abe administration’s economic revitalization and growth strategy.
Access in Japan
Broad, rapid and stable access to medicines is a hallmark of the Japanese healthcare system; patients and physicians have the treatment options they need. Based on EFPIA surveys of waiting times, Japan tops the list, with reimbursement usually following within 60 - 90 days of regulatory approval and immediately for indication extensions. If HTA is applied to these new, innovative products, it has the potential to delay or disrupt access, as it has done in many European markets. Chuikyo estimates that reassessment for CEA would add 3 to 6 months in Japan.2
2 Professor Fukuda at Chuikyo meeting of May 27th, 2015.
*RfUD = Requested for unapproved drugs
Figure 3. Source: Press release on R&D projects of 15 companies in Japan (n = 15). *RfUD = Requested for unapproved drugs.
Increased EFPIA Member Company Drug R&D in Japan
Innova7on premium has contributed to boos7ng drug R&D
179 206 201
256
305 319 331 2
5 9
37
22 25
29
182
211 210
293
327 344
360
2007 2008 2009 2010 2011 2012 2013
Project # of RfUD
Project # exluding RfUD
Change vs. 2009
+40% +56% +64% +71%
28.3
16.8 17.7 19.1 18.3
21.5 22.8
20 19 19.1
14.8
10.1 9.5 10.1
0
5
10
15
20
25
30
35
40
45
2000
20
01 20
02 20
03 20
04 20
05 20
06 20
07 20
08 20
09 20
10 20
11 20
12 20
13
Number of NME
Average Review Time
Improved PMDA Review Times PMDA has nearly eliminated Japan’s ‘drug lag’
Figure 2. Source: 医薬産業政策研究所. 2014. 日本における新薬の臨床開発と認審査の実積 (No. 63, p. 21).
10.1 Months
55
29
63
71
74
90
63
83
71
89
83
90
100
0 20 40 60 80 100
Greece
Portugal
France
Italy
Spain
Norway
Belgium
Sweden
Finland
Austria
Switzerland
Denmark
Japan
Percent Available (2013)
611
602
443
432
384
378
368
364
177
131
107
102
75
0 100 200 300 400 500 600 700
Greece
Portugal
France
Italy
Spain
Norway
Belgium
Sweden
Finland
Austria
Switzerland
Denmark
Japan
Elapsed Mme aNer EMA* approval (days)
*Elapsed Mme between MarkeMng AuthorizaMon and Accessibility **In-‐country availability. In % of medicines with an EU central authorizaMon in 2011-‐12, e.g, 70 at the Mme of survey.
Figure 4. Source: EFPIA annual survey 2010 & 2013. NB: UK and Germany allow access immediately upon markeMng authorizaMon, but HTA hurdles—not within the scope of this W.A.I.T. analysis—apply and delay actual access. *EMA: European Medicines Agency.
Europe – PaMents W.A.I.T. Indicator Pa#ents Wai#ng to Access Innova#ve Therapies
Japan: 60-‐90 days
Japan: 100%
2010 2013
Switzerland
8 HTA Application in Select Markets and Implications for Japan
3 Healthcare in Japan Today
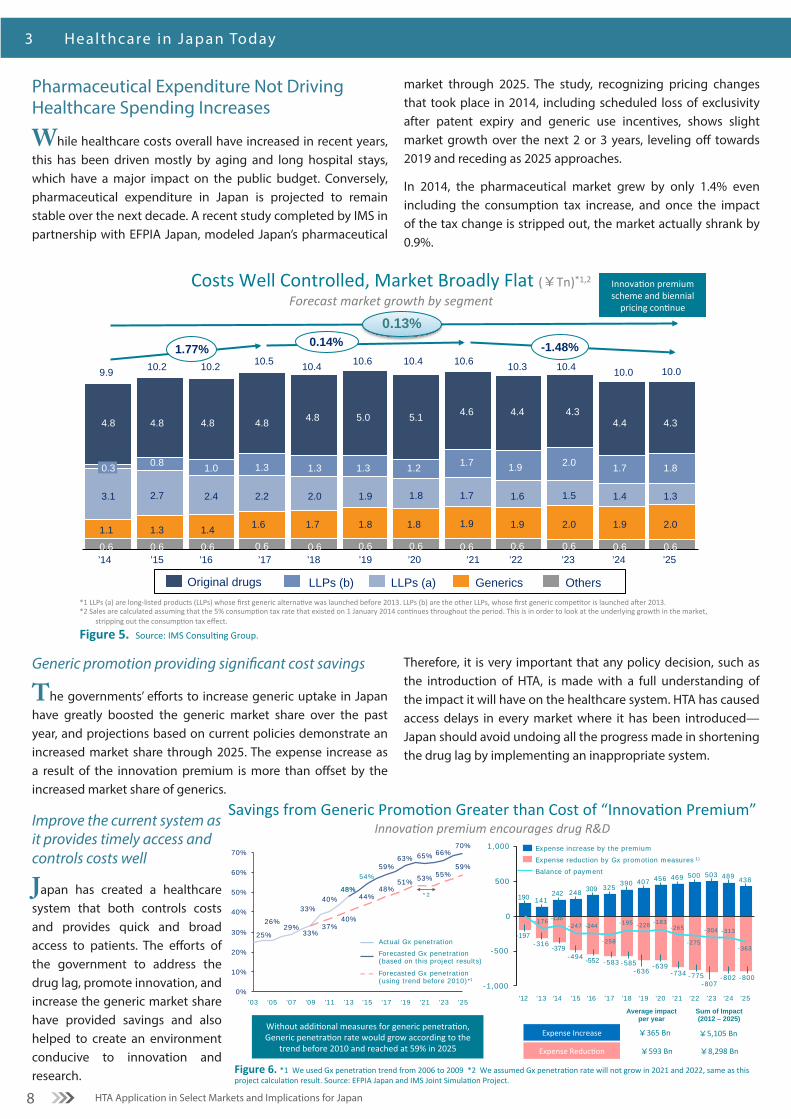
Pharmaceutical Expenditure Not Driving Healthcare Spending Increases
While healthcare costs overall have increased in recent years, this has been driven mostly by aging and long hospital stays, which have a major impact on the public budget. Conversely, pharmaceutical expenditure in Japan is projected to remain stable over the next decade. A recent study completed by IMS in partnership with EFPIA Japan, modeled Japan’s pharmaceutical
market through 2025. The study, recognizing pricing changes that took place in 2014, including scheduled loss of exclusivity after patent expiry and generic use incentives, shows slight market growth over the next 2 or 3 years, leveling off towards 2019 and receding as 2025 approaches.
In 2014, the pharmaceutical market grew by only 1.4% even including the consumption tax increase, and once the impact of the tax change is stripped out, the market actually shrank by 0.9%.
Generic promotion providing significant cost savings
The governments’ efforts to increase generic uptake in Japan have greatly boosted the generic market share over the past year, and projections based on current policies demonstrate an increased market share through 2025. The expense increase as a result of the innovation premium is more than offset by the increased market share of generics.
Improve the current system as it provides timely access and controls costs well
Japan has created a healthcare system that both controls costs and provides quick and broad access to patients. The efforts of the government to address the drug lag, promote innovation, and increase the generic market share have provided savings and also helped to create an environment conducive to innovation and research.
Therefore, it is very important that any policy decision, such as the introduction of HTA, is made with a full understanding of the impact it will have on the healthcare system. HTA has caused access delays in every market where it has been introduced—Japan should avoid undoing all the progress made in shortening the drug lag by implementing an inappropriate system.
4.5 4.8
0.6
1.7
3.9
0.6
1.7
3.9
0.6
1.9
3.9
0.6
1.8
4.0
0.6
1.6
4.2
0.6
1.1
4.6
0.6
1.2
4.6
0.6
1.3
4.4
0.6
1.2
4.5
0.6
1.0
4.5
0.6
0.8
4.8
0.6
4.8
Others Generics LLPs (a) Original drugs *1 LLPs (a) are long-‐listed products (LLPs) whose first generic alterna:ve was launched before 2013. LLPs (b) are the other LLPs, whose first generic compe:tor is launched aDer 2013. *2 Sales are calculated assuming that the 5% consump:on tax rate that existed on 1 January 2014 con:nues throughout the period. This is in order to look at the underlying growth in the market,
stripping out the consump:on tax effect.
Figure 5. Source: IMS Consul:ng Group.
1.5
2.0
4.3
’22 ’24 ’23
1.3
10.0 10.0
4.4
10.4
’25
2.0
4.3
1.4
1.8
10.3
2.0
0.6
1.77%
0.6
1.9
1.7
0.6
0.13%
’20 0.6 0.6
1.9
4.4
0.14% -1.48%
1.7
’21
1.9
1.9
1.6
4.6
10.6
1.7
10.4
0.6
1.8
1.8
1.2
5.1
’19
10.6
0.6
1.8
1.9
1.3
5.0
’18
10.4
0.6
1.7
2.0
1.3
4.8
’17
10.5
0.6
1.6
2.2
1.3
4.8
’16
10.2
0.6
1.4
2.4
1.0
4.8
’15
10.2
0.6
1.3
2.7
0.8
4.8
’14
9.9
0.6
1.1
3.1
0.3
4.8
LLPs (b)
Costs Well Controlled, Market Broadly Flat (¥Tn)*1,2 Forecast market growth by segment
Innova:on premium scheme and biennial
pricing con:nue
Figure 6. *1 We used Gx penetra0on trend from 2006 to 2009 *2 We assumed Gx penetra0on rate will not grow in 2021 and 2022, same as this project calcula0on result. Source: EFPIA Japan and IMS Joint Simula0on Project.
Savings from Generic Promo0on Greater than Cost of “Innova0on Premium” Innova&on premium encourages drug R&D
Without addi0onal measures for generic penetra0on, Generic penetra0on rate would grow according to the
trend before 2010 and reached at 59% in 2025
33%
40%
29%26%
25%
70%66%65%63%
59%
33%
37%
59%55%53%51%
48%44%
40%
0%
10%
20%
30%
40%
50%
60%
70%
’25 ’23 ’21 ’19 ’17 ’15
54%
’13
48% 48%
’11 ’09 ’03 ’07 ’05
Forecasted Gx penetration (using trend before 2010)*1
Forecasted Gx penetration (based on this project results)
Actual Gx penetration
*2
500
0
-500
-1,000
1,000
-183
-802
’20 ’21
-265
-775
500
-636
’24
-228
’19 ’25
-734
407
’18
-195
-585
390
’17
-258
-583
325
’16
-244
-552
309
’15
-247
-494
248
’14
-136
-379 -363
’13
-176
-316
141
’12
-7
-197
190
-800
438
-313
503
-275
’22
469
’23
456 489
-639
-807
-304
242
Balance of payment
Expense reduction by Gx promotion measures 1)
Expense increase by the premium
Expense Increase
Expense Reduc0on
Average impact per year
Sum of Impact (2012 – 2025)
¥365 Bn ¥5,105 Bn
¥593 Bn ¥8,298 Bn
9HTA Application in Select Markets and Implications for Japan
Lessons f rom HTA Abroad 4
No country has found the ideal system
No country has found the ideal system and CEA itself has not
prevented increases to healthcare costs as a result of aging.
Currently, countries are reconsidering their HTA principles and
methodologies with renewed emphasis on improving patient
access, as there are great inequalities across European countries.
One example is the creation of the Cancer Drug Fund in England
in 2010.1 In Scotland, after a review of the HTA process, patients
are now specifically asked for their opinion when end-of-life or
orphan drugs are rejected by the Scottish Medical Council (SMC),
the HTA agency. Additionally, in France, a working group has
1 NHS England. 2015. The Cancer Drugs Fund. Retrieved from: http://www.england.nhs.uk/ourwork/pe/cdf/
been set up in March 2015 to begin review of the current HTA
system.
Generally, because all countries experience delays in access,
the trend is for Coverage with Evidence Development (CED), a
convergence of pharmacovigilance and real-life observation for
economic assessment, and for adjustment of price and coverage
over time.
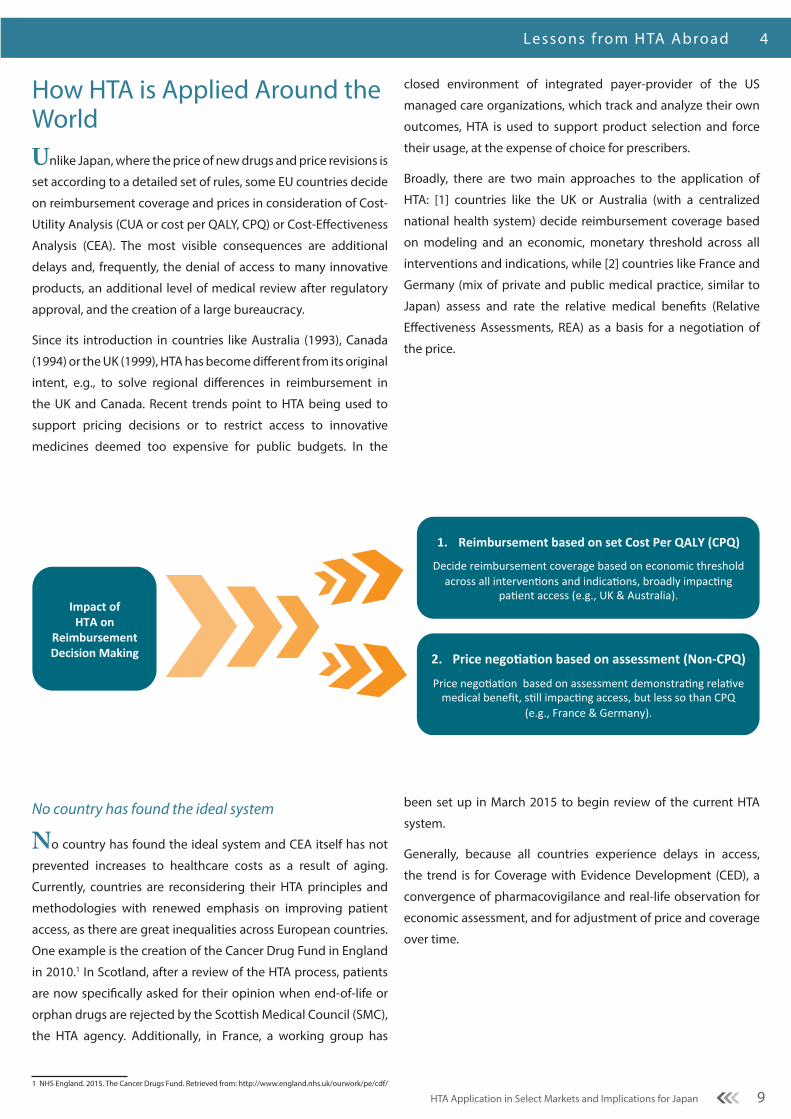
How HTA is Applied Around the WorldUnlike Japan, where the price of new drugs and price revisions is
set according to a detailed set of rules, some EU countries decide
on reimbursement coverage and prices in consideration of Cost-
Utility Analysis (CUA or cost per QALY, CPQ) or Cost-Effectiveness
Analysis (CEA). The most visible consequences are additional
delays and, frequently, the denial of access to many innovative
products, an additional level of medical review after regulatory
approval, and the creation of a large bureaucracy.
Since its introduction in countries like Australia (1993), Canada
(1994) or the UK (1999), HTA has become different from its original
intent, e.g., to solve regional differences in reimbursement in
the UK and Canada. Recent trends point to HTA being used to
support pricing decisions or to restrict access to innovative
medicines deemed too expensive for public budgets. In the
closed environment of integrated payer-provider of the US
managed care organizations, which track and analyze their own
outcomes, HTA is used to support product selection and force
their usage, at the expense of choice for prescribers.
Broadly, there are two main approaches to the application of
HTA: [1] countries like the UK or Australia (with a centralized
national health system) decide reimbursement coverage based
on modeling and an economic, monetary threshold across all
interventions and indications, while [2] countries like France and
Germany (mix of private and public medical practice, similar to
Japan) assess and rate the relative medical benefits (Relative
Effectiveness Assessments, REA) as a basis for a negotiation of
the price.
Impact of HTA on
Reimbursement Decision Making
1. Reimbursement based on set Cost Per QALY (CPQ)
Decide reimbursement coverage based on economic threshold across all interven4ons and indica4ons, broadly impac4ng
pa4ent access (e.g., UK & Australia).
2. Price negoDaDon based on assessment (Non-‐CPQ)
Price nego4a4on based on assessment demonstra4ng rela4ve medical benefit, s4ll impac4ng access, but less so than CPQ
(e.g., France & Germany).

10 HTA Application in Select Markets and Implications for Japan
4 Lessons f rom HTA Abroad
“Patients protest after kidney drugs rejected [by NICE]”—The Guardian (England)1
“NHS set for record £1.75bn surplus as patients protestover [access to] cancer drugs”
—The Telegraph (England)2
“Alzheimer’s drugs [access] court challenge”“The first time a judicial review has been sought on a NICE decision”
—BBC News (England)4
“Pancreatic cancer patients to pay $15,000 or miss out” “A drug company will stop supplying cut-price treatment for pancreatic cancer after the PBAC rejected a deal to list the medication for subsidy”
—Herald Sun (Australia)3
HTA in the News
HTA often makes headlines, but not for the reasons it should. HTA agencies in the UK (NICE), Australia and Canada have been the target of numerous protests by patients and physicians where HTA was applied by governments to limit patients’ access to new and innovative therapies. While HTA can provide
valuable information to policymakers, it is critical that patients and physicians are part of the decision-making process and that maintaining access continues to be a key government priority.
1 Patients protest after kidney cancer drugs rejected. (2008 August 27). The Guardian. Retrieved from http://www.theguardian.com/society/2008/aug/27/health.cancer2 Smith, R. NHS set for record £1.75bn surplus as patients protest over cancer drugs. (2008 August 27). The Telegraph. Retrieved from http://www.telegraph.co.uk/news/health/2633064/NHS-set-for-record-1.75bn-surplus-as-patients-protest-over-cancer-drugs.html3 Mcarthur, G. Pancreatic cancer patients to pay $15,000 or miss out. (2014 March 26). Herald Sun. Retrieved from http://www.heraldsun.com.au/news/pancreatic-cancer-patients-to-pay-15000-or-miss-out/story-fni0fiyv-12268656597074 Alzheimer’s drugs court challenge. (2007 June 25). BBC News. Retrieved from http://news.bbc.co.uk/2/hi/health/6230530.stm
11HTA Application in Select Markets and Implications for Japan
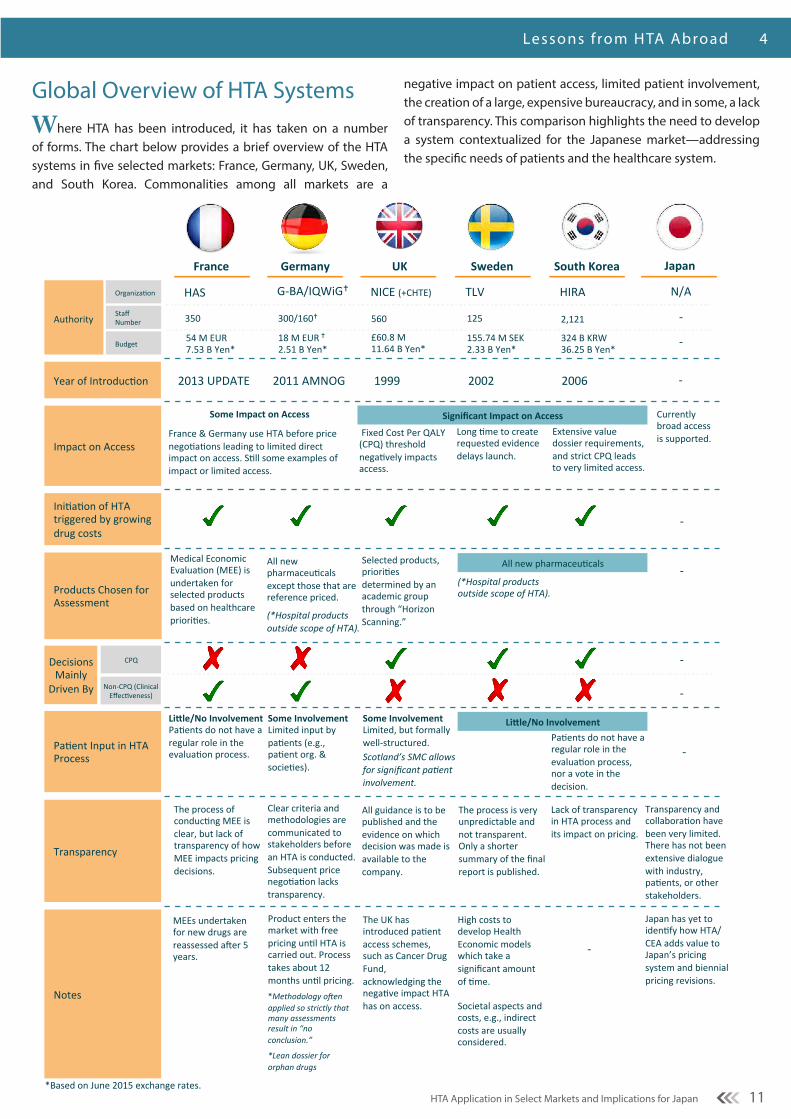
Global Overview of HTA Systems Where HTA has been introduced, it has taken on a number of forms. The chart below provides a brief overview of the HTA systems in five selected markets: France, Germany, UK, Sweden, and South Korea. Commonalities among all markets are a
negative impact on patient access, limited patient involvement, the creation of a large, expensive bureaucracy, and in some, a lack of transparency. This comparison highlights the need to develop a system contextualized for the Japanese market—addressing the specific needs of patients and the healthcare system.
Lessons f rom HTA Abroad 4
Impact on Access
France Germany UK Sweden South Korea
Year of Introduc2on -‐ 2006 2002 1999 2011 AMNOG
Japan
2013 UPDATE
Ini2a2on of HTA triggered by growing drug costs
Authority
Organiza2on
Staff Number
Budget
-‐
HAS G-‐BA/IQWiG� NICE (+CHTE) TLV HIRA N/A
Products Chosen for Assessment
Decisions Mainly Driven By
CPQ
Non-‐CPQ (Clinical Effec2veness)
Pa2ent Input in HTA Process
Currently broad access is supported.
-‐
-‐
-‐
-‐
-‐
Notes
Some Involvement Limited, but formally well-‐structured. Scotland’s SMC allows for significant pa5ent involvement.
Transparency
560
£60.8 M 11.64 B Yen*
Medical Economic Evalua2on (MEE) is undertaken for selected products based on healthcare priori2es.
Some Involvement Limited input by pa2ents (e.g., pa2ent org. & socie2es).
Product enters the market with free pricing un2l HTA is carried out. Process takes about 12 months un2l pricing. *Methodology o<en applied so strictly that many assessments result in “no conclusion.”
*Lean dossier for orphan drugs
Some Impact on Access
France & Germany use HTA before price nego2a2ons leading to limited direct impact on access. S2ll some examples of impact or limited access.
Fixed Cost Per QALY (CPQ) threshold nega2vely impacts access.
Long 2me to create requested evidence delays launch.
Significant Impact on Access
The UK has introduced pa2ent access schemes, such as Cancer Drug Fund, acknowledging the nega2ve impact HTA has on access.
Clear criteria and methodologies are communicated to stakeholders before an HTA is conducted. Subsequent price nego2a2on lacks transparency.
The process is very unpredictable and not transparent. Only a shorter summary of the final report is published.
All guidance is to be published and the evidence on which decision was made is available to the company.
2,121
324 B KRW 36.25 B Yen*
125
155.74 M SEK 2.33 B Yen*
300/160� 350
18 M EUR � 2.51 B Yen*
54 M EUR 7.53 B Yen*
(*Hospital products outside scope of HTA).
Selected products, priori2es determined by an academic group through “Horizon Scanning.”
All new pharmaceu2cals except those that are reference priced.
(*Hospital products outside scope of HTA).
Japan has yet to iden2fy how HTA/CEA adds value to Japan’s pricing system and biennial pricing revisions.
Transparency and collabora2on have been very limited. There has not been extensive dialogue with industry, pa2ents, or other stakeholders.
-‐
Extensive value dossier requirements, and strict CPQ leads to very limited access.
Pa2ents do not have a regular role in the evalua2on process, nor a vote in the decision.
The process of conduc2ng MEE is clear, but lack of transparency of how MEE impacts pricing decisions.
High costs to develop Health Economic models which take a significant amount of 2me. Societal aspects and costs, e.g., indirect costs are usually considered.
Lack of transparency in HTA process and its impact on pricing.
-‐
*Based on June 2015 exchange rates.
Li?le/No Involvement Pa2ents do not have a regular role in the evalua2on process.
MEEs undertaken for new drugs are reassessed amer 5 years.
Li?le/No Involvement
All new pharmaceu2cals

12 HTA Application in Select Markets and Implications for Japan
4 I mpac t of HTA on Cancer Treatment
Impact of HTA on Cancer TreatmentHTA can, and has, negatively impacted access within particular therapeutic areas—particularly oncology. Patients in countries that apply a strict cost-per QALY (CPQ) measure have restricted access to innovative medicines and lower overall cancer survival rates than patients from countries that are non-CPQ. In 2014, IMS published a study that looked at the impact of cost-per-QALY reimbursement criteria on access to cancer drugs.*
The study made the following primary findings:1
• In the five CPQ countries examined (England, Scotland, Sweden, Canada, & Australia), patients have less access to new cancer drugs than patients in the five non-CPQ countries (U.S., France, Germany, Italy, & Spain).
• In these five CPQ countries, fewer new cancer drugs are reimbursed; reimbursement decisions take longer; and new cancer drugs have historically been adopted more slowly and, in the longer term, at lower rates.
• CPQ analyses are subject to many uncertainties and inconsistencies due to the nature of the variables used and their interpretation.
1 IMS Institute for Healthcare Informatics. December 2014. Impact of cost-per-QALY reimbursement criteria on access to cancer drugs.
• Some data show lower rates of both cancer drug spending and cancer survival in countries using CPQ methodologies, particularly the U.K.
• CPQ countries do not necessarily spend less overall on cancer, but they may achieve less for patients.
*Nine Products Reviewed: Afinitor, Halaven (eribulin), Votrient (pazopanib), Jevtana (cabazitaxel), Zytiga (abiraterone acetate), Yervoy (ipilumab), Zelboraf (vemurafinib), Azerra (ofatumumab), and Xgeva (denosumab).
Fewer new cancer drugs are reimbursed
While both CPQ and non-CPQ countries reimburse most non-cancer products, CPQ countries reimburse fewer cancer therapies resulting in limited access for their patients. Specifically, four of the five CPQ countries surveyed deny reimbursement of three of the nine cancer drugs reviewed—markedly worse than in non-CPQ countries.
In particular, recent reports from the NHS of the U.K., have found that overall survival rates of cancer patients in the U.K. are lagging 10 years behind the rest of Europe.2 3 While there are a number of factors that contribute to this disparity, including disease awareness and early diagnosis, uneven and low access has also been identified as a challenge patients face.
2 NHS Choices. 5 December 2013. UK cancer survival rates below European average. Retrieved from http://www.nhs.uk/news/2013/12December/Pages/UK-cancer-survival-rates-below-European-average.aspx3 Foot, Harrison, Tony. June 2011. How to improve cancer survival: explaining England’s relatively poor rates. The King:s Fund.
56% 44%
100%
67% 56%
44% 56%
33% 44%
U.K. Scotland Sweden Canada Australia
100% 100% 100% 100% 89%
11%
U.S. France Germany Italy Spain
95% 95% 100% 79% 79%
5% 5% 21% 21%
U.K. Scotland Sweden Canada Australia
100% 84%
100% 95% 95%
16% 5% 5%
U.S. France Germany Italy Spain
Cancer Products
Non-Cancer Products
CPQ Countries Non-CPQ Countries
CPQ Countries Non-CPQ Countries
NaDonal Reimbursement Status Fewer new cancer drugs are reimbursed in CPQ countries
Figure 7. Source: IMS InsDtute for Healthcare InformaDcs. December 2014. Impact of cost-‐per-‐QALY reimbursement criteria on access to cancer drugs. *In Sweden, reimbursement at the county level was considered, as naDonal-‐level reimbursement decisions are not made for hospital drugs. Fig. 19 lists consideraDons for other markets. Sources: NaDonal InsDtute for Health and Care Excellence (NICE) (England), ScoXsh Medicines ConsorDum (SMC) (Scotland), The Dental and PharmaceuDcal Benefits Agency (TLV) (Sweden), Reimbursement status listed for Ontario, BriDsh-‐Columbia and Alberta (Canada), PharmaceuDcal Benefits Scheme (PBS) (Australia), Base des Médicaments et InformaDons Tarifeires, eVidal (France), Federal Joint Commibee (GBA) (Germany), Italian Drug Agency (AIFA), paginesanitaria (Italy), BotPLUS (Spain)
Reimbursed
Non-launched/Non-marketing approved
Non-Reimbursed
England
England
13HTA Application in Select Markets and Implications for Japan
EFPIA’s Posit ion on HTA in Japan 6
EFPIA’s Position on HTA in JapanJapan’s healthcare system delivers excellent outcomes and an outstanding level of access while simultaneously controlling costs. As such, EFPIA recommends that the first priority of MHLW should be the progressive adaptation and implementation of policy changes within Japan’s current healthcare system, e.g., NHI pricing, technical fees, PMS and increasingly on prevention and care continuum through referrals, medical guidelines, integrated care, etc. EFPIA believes that placing a priority on further improvements to the current system is most likely to result in long-term cost containment together with continued broad access to innovative medical treatments in Japan.
Analysis across multiple markets where HTA has been applied to new drugs reveals that its inappropriate use has had a significant negative impact on access, particularly to cancer drugs, for patients and physicians. It is critical, therefore, that Japan not simply adopt methodologies developed for use within foreign healthcare systems that differ drastically from Japan’s. EFPIA strongly recommends that in considering the possible adoption of HTA that MHLW harness the intellectual resources of health economists, industry, physicians, and patients to assist policy-makers in the task of identifying methodologies specifically tailored to Japan’s unique needs. For example, assessing new
drugs always requires making assumptions and modeling outcomes due to the lack of real-life usage in the clinical setting. This often results in increased uncertainty and may adversely impact decision-making. As such, EFPIA recommends that any HTA system adopted by Japan be applied solely to marketed products at the time of re-examination or re-pricing as real-life drug usage and performance post-launch can be combined, as appropriate, with clinical data and modeling to provide a more comprehensive and accurate assessment of a therapy’s actual clinical usage and value.
Experience in other countries demonstrates that HTA systems often impose significant burdens on industry and governments. MHLW must keep in mind that an excessively burdensome HTA system will negatively impact industry’s ability to invest in R&D in Japan. EFPIA therefore recommends that prior to any decision to adopt HTA that MHLW establish a dialogue with industry and other stakeholders to assess data collection requirements, assessment measures, costs and other factors with the goal of developing pragmatic and creative solutions that minimize burden.
Specifically, EFPIA suggests the following five principles guide the discussion and evolution of HTA in Japan:
1 2
3 4
5
Collabora'on
Involve all
stakeholders in
meaningful
discussion (including
pa<ents, healthcare
providers, and
industry) at all stages
of the process
Limited Introduc'on
Set priori<es for
ini<al, trial
introduc<on of HTA
Outcomes & Real World Evidence
Focus on achieving
beFer outcomes, not
solely on costs
No Nega've Impact on Access
Ensure no nega<ve
impact on pa<ent
access or physician's
freedom to prescribe
Minimize Burden
Reward innova<on
and minimize the
burden to both
government and
industry
“Pa$ent Centered”
Five Pr inciples to Guide HTA in Japan
14 HTA Application in Select Markets and Implications for Japan
4 EFPIA’s Posit ion on HTA in Japan
1 HTAi. (2015). HTA Resources for Involving Patients & Citizens. Retrieved from http://www.htai.org/interest-sub-groups/patient-and-citizen-involvement/pcisg-resources/hta-resources.html
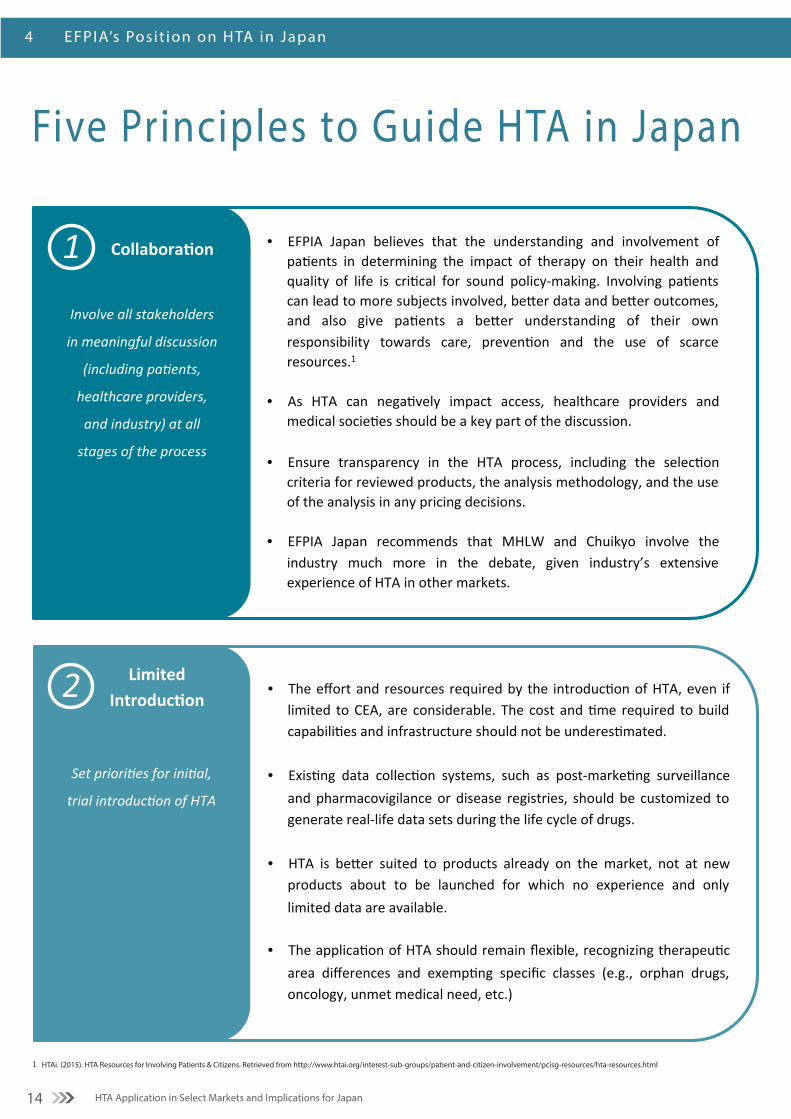
1
Involve all stakeholders
in meaningful discussion
(including pa8ents,
healthcare providers,
and industry) at all
stages of the process
Collabora'on • EFPIA Japan believes that the understanding and involvement of pa:ents in determining the impact of therapy on their health and quality of life is cri:cal for sound policy-‐making. Involving pa:ents can lead to more subjects involved, beCer data and beCer outcomes, and also give pa:ents a beCer understanding of their own responsibility towards care, preven:on and the use of scarce resources.1
• As HTA can nega:vely impact access, healthcare providers and medical socie:es should be a key part of the discussion.
• Ensure transparency in the HTA process, including the selec:on criteria for reviewed products, the analysis methodology, and the use of the analysis in any pricing decisions.
• EFPIA Japan recommends that MHLW and Chuikyo involve the industry much more in the debate, given industry’s extensive experience of HTA in other markets.
2
Set priori*es for ini*al,
trial introduc*on of HTA
Limited Introduc.on
• The effort and resources required by the introduc3on of HTA, even if limited to CEA, are considerable. The cost and 3me required to build capabili3es and infrastructure should not be underes3mated.
• Exis3ng data collec3on systems, such as post-‐marke3ng surveillance and pharmacovigilance or disease registries, should be customized to generate real-‐life data sets during the life cycle of drugs.
• HTA is beDer suited to products already on the market, not at new
products about to be launched for which no experience and only limited data are available.
• The applica3on of HTA should remain flexible, recognizing therapeu3c area differences and exemp3ng specific classes (e.g., orphan drugs, oncology, unmet medical need, etc.)
Five Principles to Guide HTA in Japan

15HTA Application in Select Markets and Implications for Japan
EFPIA’s Posit ion on HTA in Japan 6
Further Considerations: Use HTA to guide treatment and policy-making, not set prices or restrict access
Rather than using HTA to determine pricing and reimbursement decisions for individual technologies, where Japan already has an effective NHI price system, resources could be spent
more meaningfully to address broader issues such as disease prevention, development of disease management programs, and healthcare delivery system planning. It is in these areas that the greatest opportunities for improvements lie, as suggested in the 2014 OECD and World Bank Reports on Healthcare in Japan (see page 6).
3
Focus on achieving
be0er outcomes, not
solely on costs
Outcomes & Real World Evidence
• HTA could be used to assess the most effec2ve treatment paths for a given disease, looking at all the treatments required and not only the medicines. In doing so, such a “Macro-‐HTA” approach could deliver beDer outcomes for pa2ents.
• To improve outcomes, it makes more sense to combine results from randomized control trials (RCT) with other data sources and real world evidence (RWE), capturing how diseases are actually treated in real clinical prac2ce, rather than limi2ng the analysis to the ar2ficial environment of a regulatory clinical trial.
4 Ensure no nega,ve impact
on pa,ent access or
physician's freedom to
prescribe
No Impact on Access
• Any decision to implement HTA on a trial basis in April 2016 must not reverse the great progress Japan has made in reducing the drug lag, shortening the regulatory review period for new drugs and new indica@ons, and ensuring access to innova@on.
• HTA should not restrict physician choice. Physicians should retain the authority to select the best therapy for their pa@ents.
5
Reward innova-on and
minimize the burden to
both government and
industry
Minimize Burden
• Any trial introduc.on of HTA should impose the minimal burden necessary on both government and industry by avoiding unnecessary costs and crea.on of bureaucracy. These resources would be be<er spent on research and improving outcomes for pa.ents.
• To con.nue to a<ract innova.on, Japan needs to offer companies a
predictable and a<rac.ve environment. To do this, flexibility will likely be required, together with a recogni.on of the challenges of data collec.on. Pragma.c and crea.ve solu.ons may be necessary.
• The types of data required and the assessment measures used should
be agreed through industry and government dialogue.

16
Executive SummaryEFPIA Viewpoint: HTA Application in Select Markets and Implications for Japan
EFPIA member companies have significant experience in the application of HTA in European markets, and are familiar with the challenges that arise as a result of such systems.
Specifically, EFPIA suggests the following five principles guide the evolution and discussion of HTA in Japan:
HTA delays and may prevent access to innovative therapies
Japanese citizens have broad access to medicines, as new therapies progress relatively quickly from regulatory approval to reimbursement. Based on EFPIA surveys, Japan tops the list, with reimbursement usually following within 60-90 days of regulatory approval.
The decision to implement CEA on a trial basis in April 2016 must not reverse the progress made in reducing the drug lag.
Costs of pharmaceuticals are already well-controlled by the current pricing scheme and generic use incentives
A recent IMS study (Fig. 5), which recognizes pricing changes that took place in 2014, including scheduled loss of exclusivity after patent expiry and generic use incentives, shows broadly flat pharmaceutical market growth over the next decade.
4.5 4.8
0.6
1.7
3.9
0.6
1.7
3.9
0.6
1.9
3.9
0.6
1.8
4.0
0.6
1.6
4.2
0.6
1.1
4.6
0.6
1.2
4.6
0.6
1.3
4.4
0.6
1.2
4.5
0.6
1.0
4.5
0.6
0.8
4.8
0.6
4.8
Others Generics LLPs (a) Original drugs
*1 LLPs (a) are long-‐listed products (LLPs) whose first generic alterna:ve was launched before 2013. LLPs (b) are the other LLPs, whose first generic compe:tor is launched aDer 2013.
*2 Sales are calculated assuming that the 5% consump:on tax rate that existed on 1 January 2014 con:nues throughout the period. This is in order to look at the underlying growth in the market, stripping out the consump:on tax effect.
Figure 5. Source: IMS Consul:ng Group.
1.5
2.0
4.3
’22 ’24 ’23
1.3
10.0 10.0
4.4
10.4
’25
2.0
4.3
1.4
1.8
10.3
2.0
0.6
1.77%
0.6
1.9
1.7
0.6
0.13%
’20
0.6 0.6
1.9
4.4
0.14% -1.48%
1.7
’21
1.9
1.9
1.6
4.6
10.6
1.7
10.4
0.6
1.8
1.8
1.2
5.1
’19
10.6
0.6
1.8
1.9
1.3
5.0
’18
10.4
0.6
1.7
2.0
1.3
4.8
’17
10.5
0.6
1.6
2.2
1.3
4.8
’16
10.2
0.6
1.4
2.4
1.0
4.8
’15
10.2
0.6
1.3
2.7
0.8
4.8
’14
9.9
0.6
1.1
3.1
0.3
4.8
LLPs (b)
Costs Well Controlled, Market Broadly Flat (¥Tn)*1,2 Forecast market growth by segment
Innova:on premium scheme and biennial
pricing con:nue
1. Involve all stakeholders in meaningful discussion (including pa9ents, healthcare providers, and industry) at all stages of the process
2. Set priori9es for ini9al, trial introduc9on of HTA
3. Focus on achieving beEer outcomes, not solely on costs
4. Ensure no nega9ve impact on pa9ent access or physician's freedom to prescribe
5. Reward innova9on and minimize the burden to both government and industry
55
29
63
71
74
90
63
83
71
89
83
90
100
0 20 40 60 80 100
Greece
Portugal
France
Italy
Spain
Norway
Belgium
Sweden
Finland
Austria
Switzerland
Denmark
Japan
Percent Available (2013)
611
602
443
432
384
378
368
364
177
131
107
102
75
0 100 200 300 400 500 600 700
Greece
Portugal
France
Italy
Spain
Norway
Belgium
Sweden
Finland
Austria
Switzerland
Denmark
Japan
Elapsed Mme aNer EMA* approval (days)
*Elapsed Mme between MarkeMng AuthorizaMon and Accessibility **In-‐country availability. In % of medicines with an EU central authorizaMon in 2011-‐12, e.g, 70 at the Mme of survey.
Figure 4. Source: EFPIA annual survey 2010 & 2013. NB: UK and Germany allow access immediately upon markeMng authorizaMon, but HTA hurdles—not within the scope of this W.A.I.T. analysis—apply and delay actual access. *EMA: European Medicines Agency.
Europe – PaMents W.A.I.T. Indicator Pa#ents Wai#ng to Access Innova#ve Therapies
Japan: 60-‐90 days
Japan: 100%
2010 2013
Switzerland