egg and poultry marketing in south dakota
TRANSCRIPT
South Dakota State UniversityOpen PRAIRIE: Open Public Research Access InstitutionalRepository and Information Exchange
Bulletins South Dakota State University AgriculturalExperiment Station
11-1-1942
Egg and Poultry Marketing in South DakotaW. P. Cotton
W. O. Wilson
Follow this and additional works at: http://openprairie.sdstate.edu/agexperimentsta_bulletins
This Bulletin is brought to you for free and open access by the South Dakota State University Agricultural Experiment Station at Open PRAIRIE: OpenPublic Research Access Institutional Repository and Information Exchange. It has been accepted for inclusion in Bulletins by an authorizedadministrator of Open PRAIRIE: Open Public Research Access Institutional Repository and Information Exchange. For more information, pleasecontact [email protected].
Recommended CitationCotton, W. P. and Wilson, W. O., "Egg and Poultry Marketing in South Dakota" (1942). Bulletins. Paper 364.http://openprairie.sdstate.edu/agexperimentsta_bulletins/364
Contents
General Characteristics of Poultry Industry in South Dakota ________________ 3
Objectives and Methods of Study _______ ------------- -------------------------------- ------------ 4 Poultry Producers'- Marketing Practices -----------------.----------------------- ___________ 5 Turkey Growers' Marketing Practices ------------------------------------------------ ______ JO Characteristics and Marketing Practices of Hatcheries in South
Dakota· ---------------------------------------------------------------------------------------------------------11
Marketing Practices of Merchants Handling Poultry and Eggs ---�-------J 4 Marketing Practices of Produce Plants in South Dakota _______________________ _! 7 Cooperative Marketing of Poultry and Eggs ___________________________________ __ ________ 22
Summary and Conclusions ___________________________________________________________________________ 23
List of Figures
Fig. I. Number of Chickens on Farms in South Dakota, January, 1941 ______ _________ 4 Fig. 2. Percentage of Gross Farm Income, Exclusive of Governn� �nt Payments,
Derived from Various Sources ----- --------- ----------------------------------------��--------------------- - - 5 Fig. 3. Number of Chickens and Turkeys Produced on Farms in South Dakota,·
192 9-4 1 ------------------------------------------------------------------------------------------------------------------------ 7 Fig. 4. Seasonal Production of Chicken Eggs, South Dakota, 1941 -------------·---------- 7 Fig. 5. Average Prices Paid in Cents per Dozen by Merchants for Case Run Eggs
by Areas in South Dakota, April 1, 1942 --------------------------------�------------------------------- 9 Fig. 6. Location of Plants Shipping Car Lot Loads of Eggs or Poultry in South
Dakota, 1942 -------------------------------------------------------------------------------------------------------------12

Poultry and Egg Marketing
in South Dakota w. P. COTTON AND w. 0. WILSON1
General Characteristics of Poultry Industry in State ·
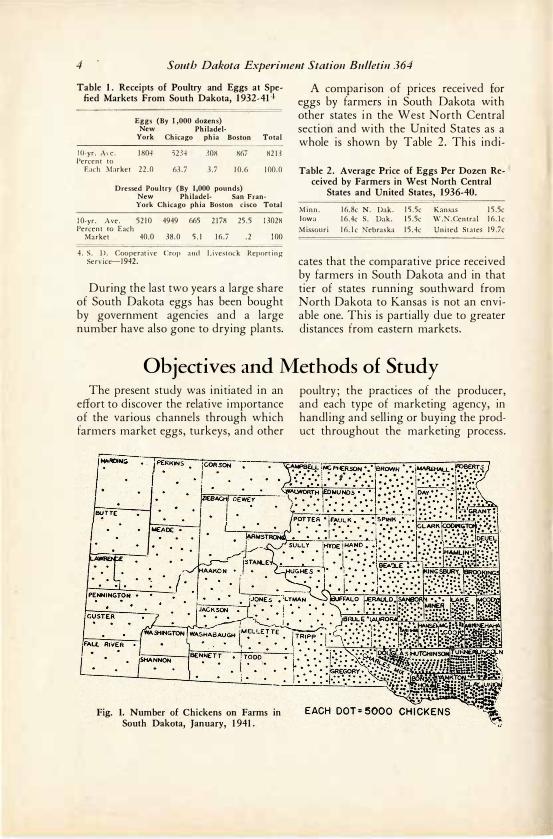
D UE TO THE TYPE OF FARMING and distribution of the farm population in South Dakota, the poultry and egg production of the state
is concentrated largely in the eastern third and particularly in the southeast section (See Fig. 1). Even so, income from poultry, turkey and eggs represents about 12 percent of the total gross farm income in the state and about 10 percent of the total cash farm income, both exclusive of government payments (See Fig. 2).
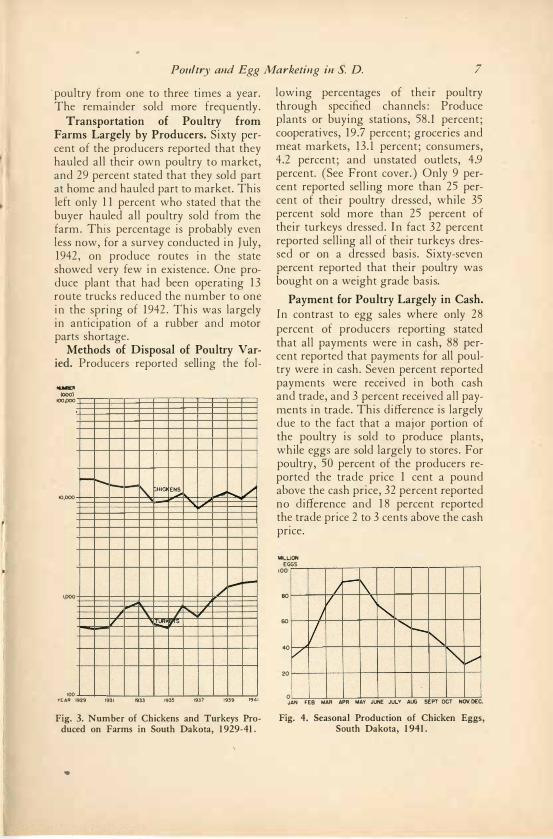
Egg and Poultry Production. Trends in chicken and turkey production i n South Dakota from 1929 t o 1941 are shown by Fig. 3. This indicates that poultry production has moved up and down without any appreciable regularity during this period, while tutkey production has shown a distinct increase from 1937 to 1940. For the five-year period, 1936-40, there was an average of 11,503 ,000 chickens produced in the state.2 This figure represented about one-fourth as many as produced in the adjoining state of Iowa during the same period and about twice as many as were produced in North Dakota.
1. W. P. Cotton, Assistant Economist, and W. O. Wilson, Associate Poultry Husbandman, Agricultural Experiment Station. The authors wish to express their appreciation to Raphael Brandriet and George Anderson of the Extension Service for their assistance in obtaining mail and field questionnaires, to David Williams, Richard Stuelpnagel, and Richard Heeren of the Poultry Department and members of the Agricultural Economics Department for helpful suggestions. Appreciation is expressed to the poultry and turkey producers, merchants, hatcherymen, and produce house operators for making the basic data available.
2. Agricultural Statistics, U.S.D.A., 1941.
During the 10-year period, 1932-4 1, the average production of chicken eggs in South Dakota was 523,000,000 or an average of 82 eggs per hen. Of these, approximately 2.5 percent were used for hatching for the farm, 23.5 percent were consumed on the farm, and 74.0 percent were sold.3 The production of eggs in the state is highly seasonal as is i ndicated by Fig. 4.
Poultry and Egg Shipments to Principal Markets. Table 1 shows the average receipts of eggs and dressed poultry from South Dakota at five principal markets during the 1932-41 period. Of the markets shown New York and Chicago accounted for about 78 percent of the dressed poultry from the state, with each getting about an equal share. But with eggs the situation was different, with Chicago alone securing almost two-thirds of the volume· received at the four markets l isted.
3. S. D. Cooperative Crop and Livestock Reporting Service-1942.
4 South Dakota Experiment Station Bulletin 364
Table 1 . Receipts of Poultry and Eggs at Spefied Markets From South Dakota, 1 932-41-1
Eggs (By 1,000 dozens) New Philadel-
York Chicago phia Boston Total
10-yr. A,e. 1804 5234 308 867 8213 Percent to
Each Market 22.0 63.7 3.7 10.6 100.0
Dressed Poultry (By 1,000 pounds) New Philadel- San Fran-
York Chicago phia Boston cisco Total
10-yr. Ave. S210 4949 66S 2178 2S.S 13028 Percent to Each
Market 40.0 38.0 5.1 16.7 .2 100
4. S. D. Cooperative Crop and Livestock Reporting Service-1942.
During the last two years a large share of South Dakota eggs has been bought by government agencies and a large number have also gone to drying plants.
A comparison of prices received for eggs by farmers i� South Dakota with other states in the West North Central section and with the United States as a whole is shown by Table 2. This indi-
Table 2. Average Price of Eggs Per Dozen Received by Farmers in West North Central
States and United States, 1 936-40.
Minn. 16.8c N. Dak." 15.Sc Kansas IS.Sc lowa 16.4c S. Dak. IS.Sc W.N.Central 16.lc Missouri 16.lc Nebraska 1S.4c United States 19.7c
cates that the comparative price received by farmers in South Dakota and in that tier of states running southward from North Dakota to Kansas is not an enviable one. This is partially due to greater distances from eastern markets.
Objectives and Methods of Study The present study was initiated in an
effort to discover the relative importance of the various channels through which farmers market eggs, turkeys, and other
Fig. 1. Number of Chickens on Farms in South Dakota, January, 1941.
poultry; the practices of the producer, and each type of marketing agency, in handling and selling or buying the product throughout the marketing process.

Poultry and Egg Marketing in S. D. 5
Particular emphasis has been given to discovering factors that contribute to quality, or lack of quality, of products marketed. In this regard, contributory production practices were considered as well as price differentials for various quality grades. An effort was made to ascertain the margin on which various types of marketing agencies operate relative to the services which they perform, and thereby secure a partial measurement of their comparative efficiency as market outlets.
The survey divided itself into two rather distinct phases, that of the producers and that of the market outlets. The marketing agency phase was further divided into the following types of outlets: (1) Merchants operating stores or meat markets handling considerable quantities of eggs or poultry, or both; (2) hatcheries supplying the chicks,
and in many cases buying quantities of eggs and poultry; (3) produce plants and substations handling eggs and poultry, and in many cases dressing poultry; and ( 4) cooperative associations buying and selling poultry or eggs, or both. The producers were likewise divided into two groups. First were farmers selected at random, who in most cases had chickens and in many cases turkeys, also; and the second of which were farmers who were known to produce turkeys on a commercial scale.
Questionnaires were secured on a random sample basis from all of the above groups throughout the state.ii· It was on the basis of the data secured from these schedules that the present analysis was made.
5. Sampling procedure and questionnaires are avai:able on request.
Poultry Producers' Marketing Practices Questionnaires were s u m m a r i z e d
from 171 poultry producers i n the state. These reported an average of 163 head of poultry on hand per farm on January 1 , 1942. The number per farm varied
materially with the section of the state. Farmers east of the Missouri River reported an average of approximately 175 birds per farm, while the avi:rage west of the river was only 75.
PERCENT o;........_�
----=2:..:o- -..----4-r0'-----.---6
"'TO __ ..,.... _ __,s,....
o __ .--_1 0_,o
LIVESTOCK 8 LIVESTOCK
PRODS.EXCEPT POULTRY
CROPS
CHICKENS, EGGS
a TURKEYS
EGGS
CHICKENS
TURKEYS
Fig. 2. Percentage of Gross Farm Income, Exclusive of Government Payments, Derived from Various Sources.
6 South Dakota Experiment Station Bulletin 364
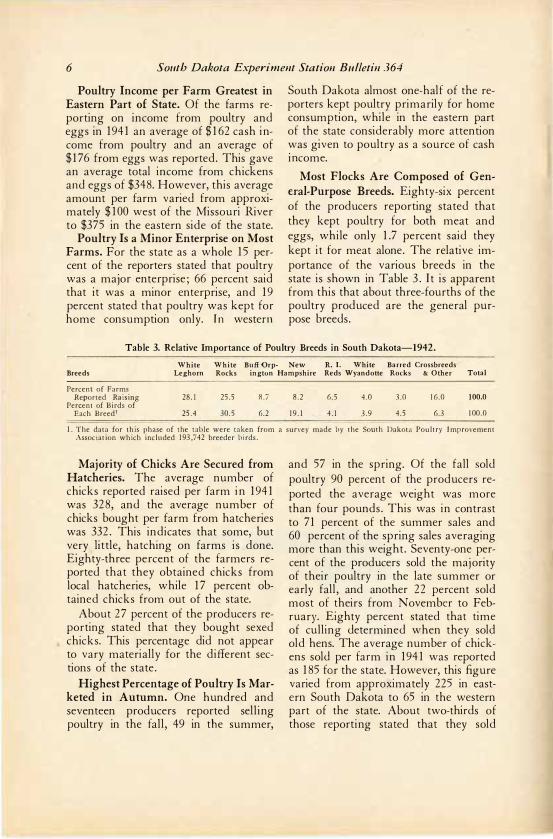
Poultry Income per Farm Greatest in Eastern Part of State. Of the farms reporting on income from poultry and eggs in 1941 an average of $162 cash income from poultry and an average of $176 from eggs was reported. This gave an average total income from chickens and eggs of $348. However, this average amount per farm varied from approximately $100 west of the Missouri River to $375 in the eastern side of the state.
Poultry Is a Minor Enterprise on Most Farms. For the state as a whole 15 percent of the reporters stated that poultry was a major enterprise; 66 percent said that it was a minor enterprise, and 19 percent stated that poultry was kept for home consumption only. Jn western
South Dakota almost one-half of the reporters kept poultry primarily for home consumption, while in the eastern part of the state considerably more attention was given to poultry as a source of cash mcome.
Most Flocks Are Composed of General-Purpose Breeds. Eighty-six percent of the producers reporting stated that they kept poultry for both meat and eggs, while only 1.7 percent said they kept it for meat alone. The relative importance of the various breeds in the state is shown in Table 3. It is apparent from this that about three-fourths of the poultry produced are the general purpose breeds.
Table 3. Relative Importance of Poultry Breeds in South Dakota-1 942.
White White Buff Orp- New R. I. White Barred Crossbreeds Breeds Leghorn Rocks ington Hampshire Reds Wyandotte Rocks & Other Total
Percent of Farms Reported Raising 28.1 25.5 8.7 8.2 6.5 4.0 3.0 16.0 100.0
Percent of Birds of Each Breed1 25.4 30.5 6.2 19.l 4.1 3.9 4.5 6.3 100.0
l. The data for this phase of the table were taken from a survey made by the South Dakota Poultry Improvement Association which included 193,742 breeder birds.
Majority of Chicks Are Secured from Hatcheries. The average number of chicks reported raised per farm i n 1941 was 328, and the average number of chicks bought per farm from hatcheries was 332. This indicates that some, but very little, hatching on farms is done. Eighty-three percent of the farmers reported that they obtained chicks from local hatcheries, while 17 percent obtained chicks from out of the state.
About 27 percent of the producers reporting stated that they bought sexed chicks. This percentage did not appear to vary materially for the different sections of the state.
Highest Percentage of Poultry Is Marketed in Autumn. One hundred and seventeen producers reported sell ing poultry in the fall , 49 in the summer,
and 57 in the spring. Of the fall sold poultry 90 percent of the producers reported the average weight was more than four pounds. This was in contrast to 71 percent of the summer sales and 60 percent of the spring sales averaging more than this weight. Seventy-one percent of the producers sold the majority of their poultry in the late summer or early fall , and another 22 percent sold most of theirs from November to February. Eighty percent stated that time of culling determined when they sold old hens. The average number of chickens sold per farm in 1941 was reported as 185 for the state. However, this figure varied from approximately 225 in eastern South Dakota to 65 in the western part of the state. About two-thirds of those reporting stated that they sold
Poultry and Egg Marketing in S. D. 7
·poultry from one to three times a year. The remainder sold more frequently.
Transportation of Poultry from Farms Largely by Producers. Sixty percent of the producers reported that they hauled all their own poultry to market, and 29 percent stated that they sold part at home and hauled part to market. This left only 11 percent who stated that the buyer hauled all poultry sold from the farm. This percentage is probably even less now, for a survey conducted in July, 1942, on produce routes in the state showed very few in existence. One produce plant that had been operating 13 route trucks reduced the number to one in the spring of 1942. This was largely in anticipation of a rubber and motor parts shortage.
Methods of Disposal of Poultry Varied. Producers reported selling the fol-
HlMIEll (000)
IOOPQO
I0,000
ipoo
-........ -
, / --
100 YEAR 1929 1931
-\.
... ... '
1933
HICI ENS / � _,,,,,......_ ' ' -
.---/ I - I
I """ "'" """
1935 1937 1939
Fig. 3. Number of Chickens and Turkeys Produced on Farms in South Dakota, 1929-41.
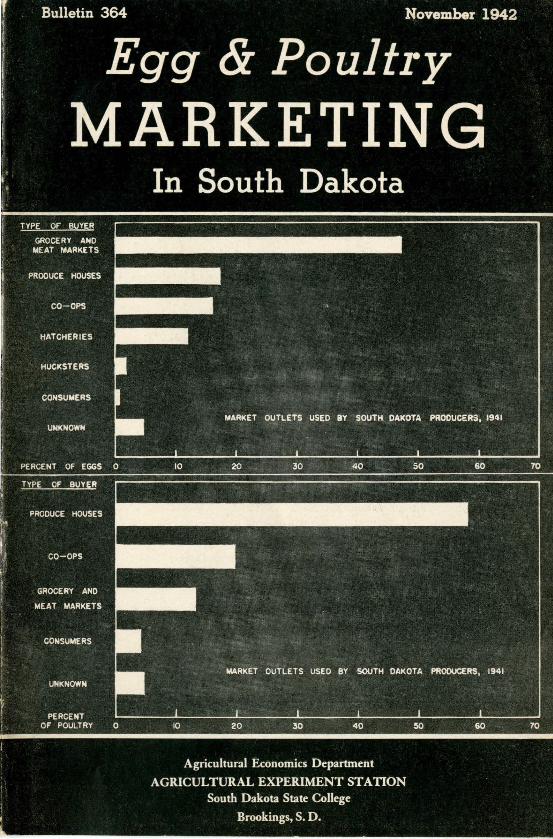
lowing percentages of their poultry through specified channels: Produce plants or buying stations, 58.l percent; cooperatives, 19.7 percent; groceries and meat markets, 13.l percent; consumers, 4.2 percent; and unstated outlets, 4.9 percent. (See Front cover.) Only 9 percent reported selling more than 25 percent of their poultry dressed, while 35 percent sold more than 25 percent of their turkeys dressed. In fact 32 percent reported selling all of their turkeys dressed or on a dressed basis. Sixty-seven percent reported that their poultry was bought on a weight grade basis.
Payment for Poultry Largely in Cash. In contrast to egg sales where only 28 percent of producers reporting stated that all payments were in cash, 88 percent reported that payments for all poultry were in cash. Seven percent reported payments were received in both cash and trade, and 3 percent received all payments in trade. This difference is largely due to the fact that a major portion of the poultry is sold to produce plants, while eggs are sold largely to stores. For poultry, 50 percent of the producers reported the trade price 1 cent a pound above the cash price, 32 percent reported no difference and 18 percent reported the trade price 2 to 3 cents above the cash price.
llllLLION
EGGS
100
80
60
40 [7 20
0
I 7
;-I\ I
\" ......... --"'
" /
JAN FEB MAR APR MAY JUNE JULY AUG SEPT OCT NOV. DEC.
Fig. 4. Seasonal Production of Chicken Eggs, South Dakota, 1941.

8 South Dakota Experiment Station Bulletin 364
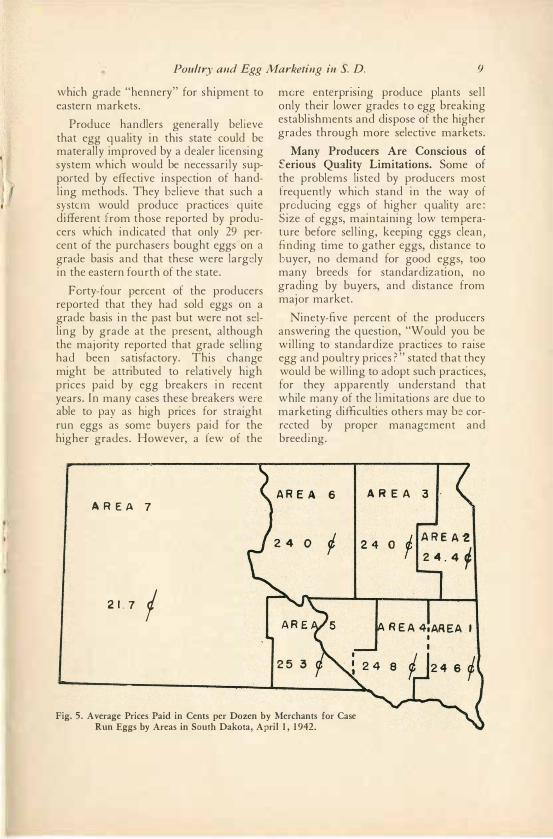
Production Factors Influencing Egg Marketing. The average number of dozen eggs produced per farm was 948 for the state, with a range from 313 dozen per farm west of the Missouri River to 1,567 dozen per farm in Area 4. (See Fig. 5.) The average number sold per farm for the state was 850 dozen. This number ranged from 177 to 1,349 dozen, respectively, in the two sectio.ns just men-tioned.
·
Fifty percent of the growers reported feeding home mixed feed entirely, 9 percent commercial feed, and 41 percent a combination of both. The percentage of producers gathering eggs more than once a day in the various seasons was as follows: Spring, 69; summer, 73 ; fall, 54; and winter, 72 percent.
About 55 percent of the producers kept their eggs in a basement or cellar during the spring, fall and winter, and 73 percent during the summer. Twentynine percent stated that the temperature of their holding room was above 60 degrees during the summer, and 26 percent that it was under 40 degrees in the winter. Sixty-nine percent of the holding rooms were reported relatively dry. This holding of eggs in a dry room is not in accord with recommended practices since dry air increases the size of the air cell and consequently lowers the grade.
Seventy-five percent of the patrons reported holding eggs in cases, whi·le about 14 percent held them in wire baskets, 9 percent in pails and 2 percent in various other containers. (The recommended practice is to store eggs in cases after cooling in wire baskets.)
Seventy-six percent reported that they were producing infertile eggs, while 24 percent were not. These latter producers did not remove male birds from the flock at the end of the hatching season and hence incurred the risk of blood rings and resultant inedible eggs.
Egg Marketing Practices Need Improvement. In spite of losses in the keeping quality of the egg due to washing, almost one-third more of the producers reported that they washed dirty eggs before selling them than reported that they cleaned them by sandpaper or steel wool. Perhaps the answer to this serious problem is greater care in the production of clean eggs.
Further practices of producers preparatory to marketing eggs are indicated by the reports which show that only 13 percent candled eggs at home and 45 percent sorted for size.
Groceries Most Usual Outlet for Farmer Sold Eggs. Producers reported that they marketed the following percentages of their eggs through specified types of markets: Groceries and meat markets, 47.3 percent; produce plants or buying stations, 17.2 percent; cooperatives, 15.9 percent; hatcheries, 12.0 percent; hucksters, 2.0 percent; consumers direct, .9 percent; and unstated outlets, 4.7 percent. (See Front cover.) Since many grocery stores do not have adequate storage facilities for eggs and at present are not properly supervised in· their methods of handling them, the fact that producers sell such a large percentage of their total production through this channel serves as a serious deterrent in egg quality and to the consequent price. Therefore, it is apparent that a
more direct and rapid method of concentrating and moving eggs from the producer to the consumer is desirable. An example of a movement in this direction, along limited lines, that is already underway is in the case of a few produce plants in the state which encourage and educate their patrons to produce and market quality eggs. These eggs are carefully graded at the plant and the producer is paid as much as 9 cents premium per dozen for those
Poultry and Egg Marketing ill S. D. 9
which grade "hennery" for shipment to eastern markets.
Produce handlers generally believe that egg quality in this state could be materally improved by a dealer licensing system which would be necessari ly supported by effective inspection of handl ing methods. They bel ieve that such a systein would produce practices quite different from those reported by producers which indicated that only 29 percent of the purchasers bought eggs on a
grade basis and that these were largely in the eastern fourth of the state.
Forty-four percent of the producers reported that they had sold eggs on a grade basis in the past but were not selling by grade at the present, although the majority reported that grade selling had been satisfactory. This change might be attributed to relatively high prices paid by egg breakers in recent years. In many cases these breakers were able to pay as high prices for straight run eggs as some buyers paid for the higher grades. However, a few of the
ARE A 7
21.7 I
more enterpnsmg produce plants sel l only their lower grades t o egg breaking establishn1ents and dispose of the higher grades through more selective markets.
Many Producers Are Conscious of Serious Quality Limitations. Some of the problems listed by producers most frequently which stand in the way of producing eggs of higher quality are: Size of eggs, maintaining low temperature before sel l ing, keeping eggs clean, finding time to gather eggs, distance to buyer, no demand for good eggs, too many breeds for standardization, no grading by buyers, and distance from major market.
Ninety-five percent of the producers answering the question, "Would you be will ing to standardize practices to raise egg and poultry prices?" stated that they would be willing to adopt such practices, for they apparently understand that while many of the l imitations are due to marketing difficulties others may b:: corrected by proper management and breeding.
25 3
6 AREA 3 ·
24 O J AREA'2 r 24.4¢
REA 41AREA I
Fig. 5. Average Prices Paid in Cents per Dozen by Merchants for Case Run Eggs by Areas in South Dakota, April 1, 1942.

10 South Dakota Experiment Station Bulletin 364
Turkey Growers' Marketing Practices Production Factors Influence Market
ing of Turkeys. The average number ot poults started in 1941 by commercial turkey growers reporting was 581. Seventy-five percent secured poults from their own breeding Bocks, 20 percent bought their poults, and 5 percent bought eggs to hatch. Producers reported that they carried an average of 25 turkey hens and three toms over to the next season for breeding purposes and marketed an average of 483 birds. Sixty percent of those hatching turkeys did the hatching at home. Forty percent had it done at commercial hatcheries. The average charge per egg by hatcheries as reported by producers was 5 cents. Poults were reported bought at distances varying from Iowa to Washington state.
Varieties bought were : Broad Breasted Bronze, 54 percent; S t a n d a r d Bronze, 43 percent; Narragansett, 2 percent; and Bourbon Red, 1 percent.
Forty-seven percent of turkey growers reporting stated that they home-mixed all their feed. Only 18 percent of those buying commercial feed bought from the manufacturer. The remainder bought from a local dealer. Grass, alfalfa, sweet clover, oats and rye, and rape were the crops used most frequently for turkeys on range. Most growers recognize the fact that good ranges lower feed costs.
Production Credit Necessary for Many Turkey Producers. Many of the larger turkey producers use short term credit to finance the purchase of poults and feed. Various sources are employed in securing this credit. The most popular sources appear to be commercial banks, but many growers also secure credit through produce houses, production credit associations, and farmers' elevators. The amount of credit may vary from a few dollars up to several thousand. The
interest rates charged may vary from no formal rate by elevators and produce houses to 4.5 percent by production credit associations to 7 to 8 percent by commercial banks. However, sources which do not make formal interest charges apparently make it up either in the price of feeds or poults, or by a marketing contract.
Some growers reported that produce houses financing poults made a 20 percent carrying charge if the turkeys were not marketed through them, even though feed financing was secured elsewhere. Only 10 percent of the producers insured their turkeys. This insurance was only against storm usually.
More Than One-Half of Turkeys Sold Direct to Packers. In contrast to reports on sales of chickens, schedules returned by commercial turkey growers showed that approximately 80 percent sold most of their turkeys dressed or on a carcass grade basis. About 55 percent of those reporting sold their turkeys direct to packers, 40 percent to local produce handlers, and 5 percent to other outlets. Only 10 percent of those selling to packers sold under contract, while 80 percent of those reporting selling to local produce handlers sold under cqntract. The average age at which turkeys were reported marketed was 25.5 weeks, with a range from 20 to 30 weeks. The average live weight at marketing for toms was 19.2 pounds, with a range from 15 to 23 pounds, and for hens was 12.5 pounds, with a range from 10 to 15 pounds.
Dissatisfaction with Market Outlets. In a number of sections of South Dakota growers did not appear to be satisfied with local turkey markets. A number of buyers purchase only for the holiday trade, and others would buy only on a dressed basis or by their own grade. This
Poultry an,d Egg Marketing in S. D. 11
left the grower at the buyer's mercy if he allowed the buyer to dress his birds and was not satisfied with the grade given, for he was not in a position to transfer the birds elsewhere since refrigerated trucks would be required. The rates for dressing in 1941 in certain areas were 10 cents per bird, and in addition a 10 percent shrinkage charge was made. For these reasons many growers prefer to sell live birds on bids. Such a market appears to exist satisfactori ly in the southeastern corner of the state.
However, it should be recognized that the advantages of selling on a dressed grade basis would be more completely recognized �f U. S. Grades were adopted n10re generally and if both the graders and producers were better educated as to what constitutes these grades.
Producers' interest in market improvement was exhibited by the fact that 83 percent of them expressed a desire for a more active State. Turkey Producers' Association.
Characteristics and Marketing Practices of Hatcheries in South Dakota
Volume and Hatching Customs. The survey of hatcheries showed that the average incubating capacity of those reporting was approximately 42,000 eggs, with a range for individual plants from 4,000 to 75,000.6 The average volume
6. There are several hatcheries in the state with over 100,000 egg capacity, and at least 3 with more than 200,000.
handled during 1941 was a little more than 275,000 eggs. One hatchery alone handled more than two million eggs. The most common number handled was close to the number incubated, or ranged from 16,000 to 270,000 eggs. Seventy-five percent of the hatcheries reporting stated that they custom-hatched
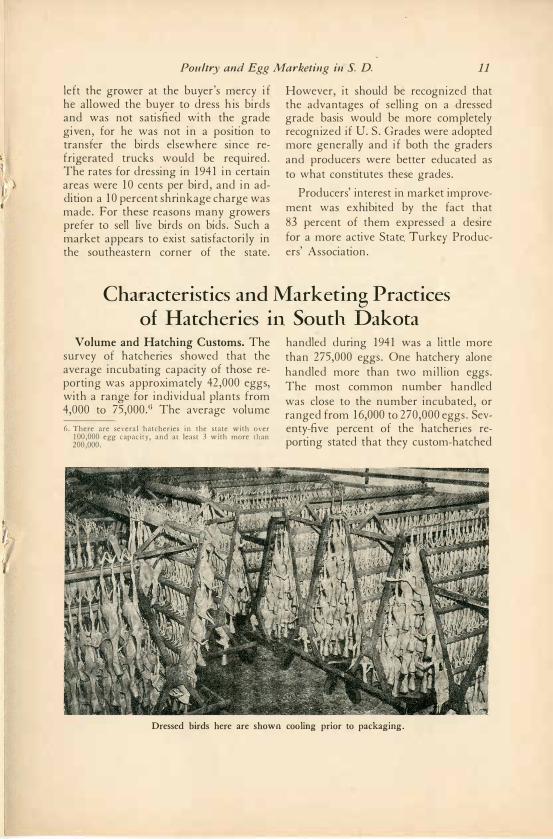
Dressed birds here are shown cooling prior to packaging.
12 South Dakota Experiment Station Bulletin 364
eggs, and custom-hatching constituted more than 25 percent of the total hatch of half the plants.
Plants reporting had been in operation an average of nine years, with a range from 2 to 34 years. Only about one-third of the hatcheries were operated as independent businesses. Others were operated in connection with produce houses, freezer locker plants, and feed and equipment enterprises.
Sanitary and Health Measures Are of Economic Concern. The sanitary and health precautions employed by hatcheries are of economic concern to their patrons. Eighty-eight percent of all plants reporting stated that they fumigated both incubators and chicks in the incubators to control disease. The principal fumigants used were formaldehyde, potassium permanganate and several trade preparations.
NAltDIN6 COllS0/11.
Ml!AH
SHANNON
LEGEND:
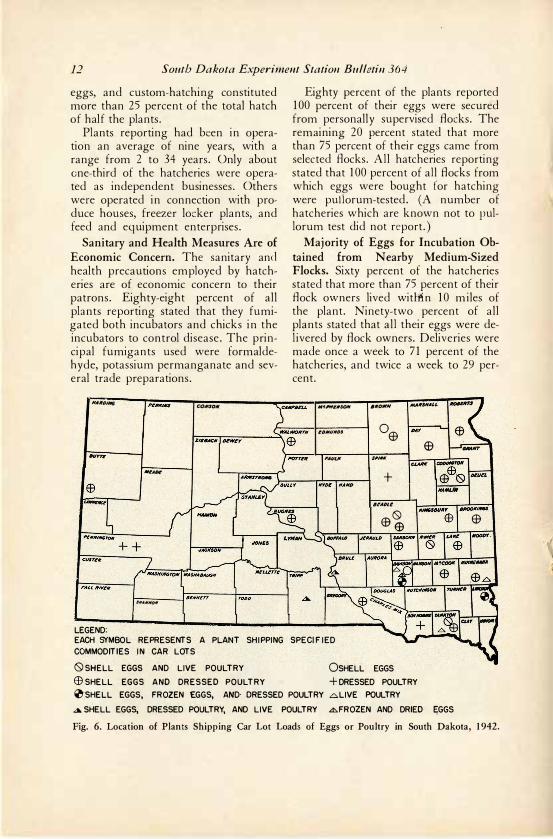
Eighty percent of the plants reported 100 percent of their eggs were secured from personally supervised flocks. The remaining 20 percent stated that more than 75 percent of their eggs came from selected flocks. All ha�cheries reporting stated that 100 percent of all flocks from which eggs were bought for hatching were pullorum-tested. (A number of hatcheries which are known not to pullorum test did not report.)
Majority of Eggs for Incubation Obtained from Nearby Medium-Sized Flocks. Sixty percent of the hatcheries stated that more than 75 percent of their flock owners lived witli-in 10 miles of the plant. Ninety-two percent of all plants stated that al l their eggs were del ivered by flock owners. Deliveries were made once a week to 71 percent of the hatcheries, and twice a week to 29 percent.
MflWelSON 6/tOWN MA1t$NAU
LOMUND' 0$ /MY
EB 'AllU<
u,AM( COl>IM'rDll
+ EB61lSl Rlln
llAllL/lf
61!ADU
®0 .®
$ MOODY.
EACH S\'MBOL REPRESENTS A PLANT SHIPPING SP E CIFIED COMMODITIES IN CAR LOTS
0 SHELL EGGS AND LIVE POULTRY OSHELL EGGS EB SHELL EGGS AND DRESSED POULTRY +DRESSED POULTRY �-SHELL EGGS, FROZEN £.GGS, ArirD DRESSED POULTRY .6LIVE POULTRY
4 SHELL EGGS, DRESSED POULTRY, AND LIVE POULTRY �FROZEN AND DRIED E;GGS
Fig. 6. Location of Plants Shipping Car Lot Loads of Eggs or Poultry in South Dakota, 1942.
Poultry and Egg Marketing in S. D. 13
The most common number of flocks from which eggs for incubation were secured ranged from 10 to 30, with an average of approximately 25. The average size of these flocks was 212 hens, with 53 percent of the plants reporting the average size of Bocks supplying
. them to be between 200 and 300 hens. Premiums Paid for Eggs for Incuba
tion Averaged 8.8 Cents. Most hatcheries paid a straight premium over the market for hatching eggs. Many plants paid a premium based either on percent of hatch or feeding program. The straight premium varied from 7 to 1 1 cents per dozen, with an average of 8.8 cents. The premium based on percent of hatch averaged 6.4 cents and that on feeding program, 7.3 cents.
Types of feeding programs for which premi urns were paid were: Breeder mash, egg concentrate, egg mash supplemented with n1ilk, and egg mash with fam1 grains.
Egg and Chick Grading and Selling Practices Varied. In selecting eggs for incubation all hatcheries reported grading by weight, 87 percent by shape, and 75 percent by color. There was a wide dispersion in methods of disposal of culled eggs. Twenty-two percent of the plants returned them to producers, 14 percent sold them at retail, and the balance sold them to local markets of various types.
Eggs bought in excess of incubation needs were sold on a grade basis by only 20 percent of the hatcheries reporting. Those selling on a grade basis sold eggs candled and separated into groups weighing more and less than 24 ounces per dozen.
The average percentage of hatch reported by all plants was 67.5 with a range from 60 to 73 percent. The average number of chicks sold at retail per plant in 194 1 was 83,576, and at wholesale, 5,246. Fifty-three percent of the
plants hatched all the chicks they sold, 93 percent hatched more than 75 percent of all they sold. About 20 percent of the plants reported shipping some chicks in from out of state.
Eighty-six percent of all plants reported that over three-fourths of the chicks sold were called for by the buyers. Twenty percent reported that more than half of their sales were to customers outside of a 25-mile radius, and 7 percent stated that one-fourth of their sales were shipped out of state. About one-fourth reported selling sexed chicks, but these sold only from 3 to 5 percent of their total volume as sexed.
Uniform Grading of Chicks Needed: Most managers reported grading their chicks into three groups, but there was little uniformity in the designation of these groups. Some called them AAA, AA, and A, while others designated them as A, B, and C. Some hatcheries had a fourth grade called culls, and others had only one grade. The basis for establishing chick grades also showed considerable variation. Key flocks and egg size were the two most popular criteria, while the egg production of parent stock, pullorum tests and physical appearance also had a place.
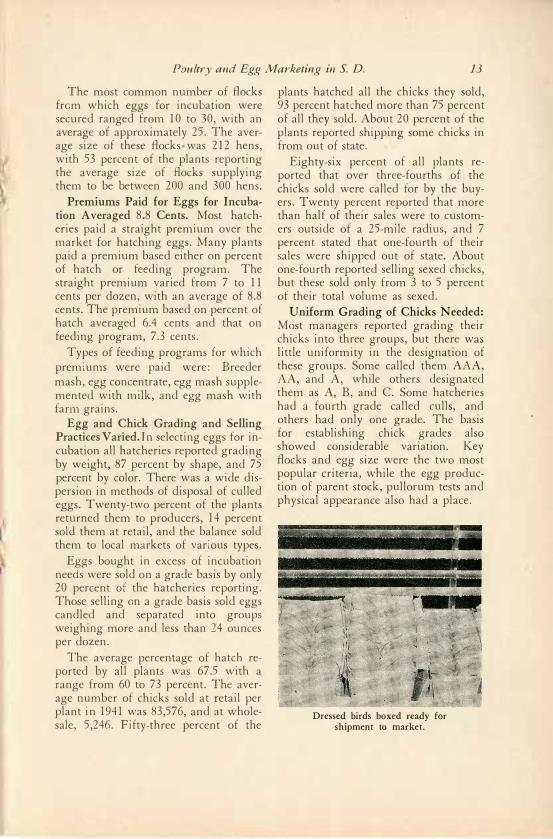
Dressed birds boxed ready for shipment to market.

14 South Dakota Experiment Station Bulletin 364
Chick Prices and Methods of Payment of Interest. The average price for all chicks sold in 194 1 was 8.9 cents, with a range of 7 to 10.5 cents among plants. Only one-third of the hatcheries reported that 100 percent of their chicks were sold for cash, while 93 percent reported that more than three-fourths were sold for cash. The condition on which noncash sales were made showed a wide variation. Some of the plans were: Fall payment, monthly payments, open a.ccounts, and sales contract. Of these the sales c o n t r a c t was most prevalent. Forty-three percent of those reporting
· on the question stated that springtime sales of chicks were paid by the sale of roasters or mature birds in the fall. This was simplified since two-thirds of the hatcheries reporting stated that they bought poultry. These purchased an average of approximately 273,000 pounds each in 194 1.
Majority of Hatcheries Incubate Tur� key Eggs. Sixty-one percent of the hatcheries reported doing turkey egg custom hatching in 194 1, and 22 percent reported buying turkey eggs for hatching. A small percentage of the turkey eggs bought by hatcheries were shipped in from out of state. A few hatcheries had regular supply flocks from which they obtained their turkey eggs for incubation. Those reporting hatched an average of 4,600 poults, and obtained a hatch of 62.7 percent of the eggs incubated. The average price received for poults in 194 1 was 39.3 cents, with a range among plants from 28 to 45 cents.
Hatcheries Contribute to Educational Programs. The following educational work among poultry and turkey growers was reported as being done by a number of hatcheries: Movies shown, instruction in feeding, breeding, rearing, disease treatment, grade buying of eggs and poultry, advertising and shows.
Marketing Practices of Merchants Handling Poultry and Eggs
Since a high percentage of eggs marketed by farmers in South Dakota are sold directly to groceries and meat markets the marketing practices and methods of merchants are of considerable importance. Reports from 82 merchants scattered over the state indicate that the average volume of eggs handled by each in 194 1 was approximately 70,000 dozen, with a range from 1,800 to 720,-000 dozen.
Egg Grading and Methods of Payment Not Uniform. Approximately one-
half of the merchants reporting stated that they bought eggs on a loss ofF basis. ·
The balance bought strictly on case run or case count with no grading. Reports show that only 28 percent of all eggs handled by merchants were paid for in cash, the remaining 72 percent being paid in trade. Payment in trade was particularly high in the western and north central sections of the state. For
7. Loss off means that the producer is paid for only good eggs. The inedibles or lo ss ;_ire deducted from the tot'd case count. Case count is the acwal number
of eggs sold.
Table 4. Margins on Which Merchants Bought Eggs for Cash and Trade, in S. D., 194-2
Cash
Margin per dozen Less than le 1 to 2c More than 2c Total
Percent Reporting 39.3 45.1 15.6 100.0
Trade Pd. None to
Prem. less than le 1 to 2c More than 2c Total
10.7 53.2 29.8 6.3 100.0
Poultry and Egg Marketing in S. D. 15
the entire state only 10 percent of the merchants stated that they paid cash for more than 75 percent of the eggs they bought. Fig. 5 shows the average price paid per dozen by merchants for case run eggs on April 15 in the different areas of the state. From this it is seen that the best prices prevailed in the south central and southeastern sections, with the prices reported in the western part of the state averaging about three cents per dozen less.
Margin Variei With Method of Payment. The margin on which merchants reported handling eggs is shown by Table 4. From this it is apparent that eggs will buy more goods than their market price in some stores, since a number of merchants pay a premium for eggs which are paid for in trade. To what extent merchants may make this premium price up in trade prices is unknown.
Almost one-half of the merchants stated that they based their prices on the Chicago market. Most of the others set their prices relative to local markets, important among which was Mitchell.
Egg Quality Affected by Frequency of Delivery and Holding Practices. Sixty-eight percent of the merchants stated that patrons delivered an average of two or more times a week during the spring and 82 percent stated that the average number of deliveries per patron per week in the summer was two or more.
Only 7.5 percent of the merchants reporting stated that they refrigerated eggs while holding them for market. Most of those who were using refrigeration were employing temperatures from 36 degrees to 50 degrees. The storage rooms used by merchants not using refrigeration were of the following types: Store proper, 30 percent; store basement, 40 percent; special room, 20 percent;
and an adjoining room or building, 10 percent. Ninety-two percent stated that their storage rooms were relatively dry. (See Page 8 for comment on effect of dry storage.)
Merchants Do Little Grading of Eggs before Selling. Ninety percent of the merchants did not grade their eggs before marketing them. Sixty-nine percent sold on a loss off basis, 1.5 percent on a basis of weight, and the rest by case run.
The majority of merchants appear to sell most of their eggs to produce houses located in the larger towns of the state. Seventy percent reporting stated that they sold more than 75 percent of their volume to plants outside of their own towns.
Fifty-Six Percent of Merchants Market Eggs Through Set Outlets. Only 44 percent of the merchants reported choosing between markets when selling. The balance had a regular channel through
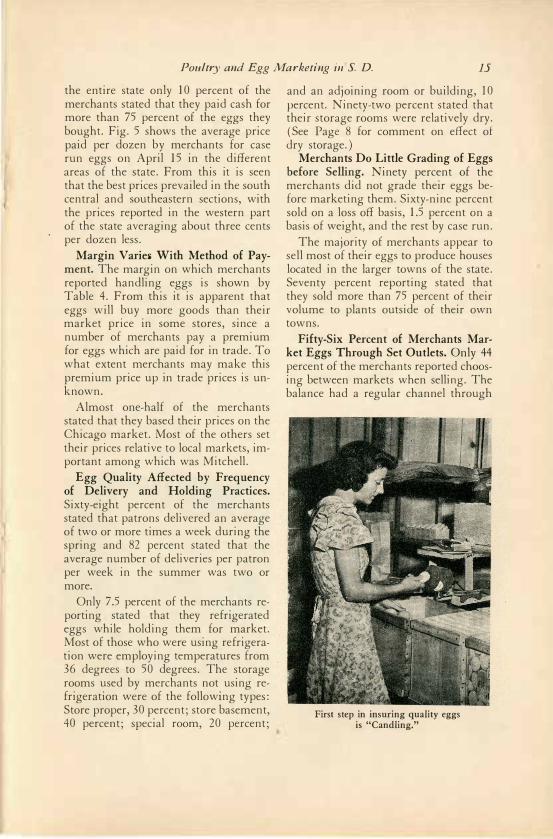
First step in insuring quality eggs is "Candling."

16 South Dakota Experiment Station Bulletin 364
which they sold. Of those choosing between markets 80 percent made their choice on the basis of highest bid or price and the rest chose according to most convenient market for a particular offering.
Majority of Merchants Do Not Handle Poultry. Poultry is not handled by grocery stores and meat markets nearly so extensively as eggs. Only 26 percent of the merchants reported buying live poultry. These reported handling an average of 106,233 pounds each in 1941. However, the range in volume was from 1,500 to 1,240,000 pounds. This means that the volume of live poultry handled by most merchants is quite small.
Pricing Methods Vary. The most common classifications used in grading poultry and the average price per pound reported paid for each on April 15, 1942, are shown in Table 5.
Table 5. Grades Used and Average Prices Paid for Poultry by Merchants in South Dakota,
April 1 5, 1942
Grades
Hens over 5 lbs. Hens under 5 lbs. (not Leghorns) Leghorn hens Light and inferior hens Heavy & Medium Cox or Stags Leghorn or Light Cox or Stags
Prices Per lb. (Cents)
15.6 12.9 12 0 10.0
9.2 6.5
Seventy-one percent of the merchants reporting stated that they bought live poultry on a margin of 1 cent a pound, and 19 percent on a margin of 2 cents or more when buying for cash. When payment was taken in trade, 33 percent stated that they bought at the same price at which they sold. In contrast to the percentage of eggs paid for in trade, (See Page 8) 53 percent of the merchants stated that less than 25 percent of the poultry they bought was paid for by trade.
The majority of merchants based their prices on those quoted by produce
houses at such local markets as Mitchell and Watertown, although som€ used the Chicago price as a direct base.
Merchants Sell Poultry Largely to Produce Plants. The majority of poultry handled by merchants is sold to produce plants located in the larger towns of the state or nearby towns in adjacent states. However, a considerable volume is sold to local produce handlers and to local retail trade. Forty-two percent of the merchants stated that they chose between markets when selling. The remaining 58 percent sold through a reg· ular channel. Thirty percent stated that they sold through a particular channel because there was not another competing outlet buying locally.
Seventy percent of the merchants reporting stated that there had been little or no change in their market outlets during the past few years. The remaining 30 percent had made various changes, as the use of frozen food lockers to store dressed poultry in between seasons, and selling on markets that employed closer grading.
Egg weights vary seasonally in South Dakota.

Poultry and Egg Marketing in S. D. 17
Problems Listed by Merchants Sig
nificant. Some of the principal problems that merchants listed in marketing eggs were : Wide price fluctuations in short period, inadequate and unsuitable storage space, dirty and undersized eggs, loss on bad eggs, finding a desirable outlet, license restnct1ons on produce trucks operating between states, obtaining cases and fillers, handling and candling eggs in hot weather, getting customers to bring in fresh eggs, and getting competing merchants to buy on a non-margin basis.
Problems listed most frequently in handling live poultry were : Shrinkage,
inequitable and inconsistent grading, insufficient volume to ship direct to a terminal market or to a dressing plant, meeting price competition, and dressing and handling dressed poultry properly.
Some Merchants Encourage Quality Production. Approximately 50 percent of the merchants stated that they had done some educational work among producers in an effort to secure higher quality eggs. This work consisted of talks to producers about care of their eggs, including frequent gatherings, keeping them cool, regular deliveries, separating males from laying flock after hatching season; showing candling results; and distributing pamphlets.
Marketing Practices of Produce Plants 8
in South Dakota Produce plants reporting had been
operating an average of 13 years, with a range of from 1 to 41 years. Forty-two of these plants and buying stations in 1 94 1 reported handling an average of 126,288 dozen eggs each, with a range from 750 to 1.5 million dozen. Sixtythree percent of these firms reported procuring over three-fourths of their egg receipts from farmers and 32 percent secured more than 75 percent of their total volume from merchants. Fifty-three percent stated that their total receipts were delivered by producers. Eightynine percent stated that producers delivered eggs at least twice a week on the average during the summer and 77 percent reported that deliveries averaged only once a week in the winter.
Fifty-five percent of all firms operated produce trucks and operated an average of 2 .8 routes which averaged 108
8. Produce plants as used here includes both poultry processors and packers and buying stations.
miles in length. All of these picked up eggs from stores and about two-thirds made pickups from farmer patrons and substations.
Egg Grading and Pricing Varies Materially by Firms and Sections. Only 12 of 47 firms reporting stated that they bought all eggs by grade and only 14 graded all eggs before reselling. Approximately two-thirds used both straight run and loss off bases; one-third used a Grade 1 or hennery classification and a few used dirty and cracked grades.
The price spread for case count eggs as reported by produce plants was not as great for the separate sections of the state as that reported by merchants. The price ranged from an average of 24.7 cents in the eastern areas to a 23.3 cent average west of the Missouri River on April 15, 1942. The average prices paid for different grades on that date for the entire state were: Hennery, 25 cents; case count, 24 cents; dirties, 22 cents;

18 South Dakota Experiment Station Bulletin 364
and cracks, 21 cents. It is to be recognized that price differentials between grades of eggs are lowest in the spring months.
In contrast to the method of payment employed by merchants, ( See page 8) 84 percent paid for all eggs in cash, and only 16 percent by trade.
Egg Marketing Practices of Produce Plants Have Wide Dispersion. Only about half of the plants and buying stations refrigerate eggs ';"hile holding them for market. Those who employed refrigeration held their eggs between 36 degrees and 60 degrees during the summer. Ninety-five percent of those not using refrigeration reported holding the eggs in a basement or other cool room.
The following percentages of produce plants reported selling eggs by specified classifications: Straight run, 75 percent; loss off, 15 percent; hennery, 5 percent; and other, 5 percent.
Distribution of markets by types to which South Dakota produce plants re-
porting market their eggs by seasons in 1941 is
-indicated by Table 6. This sug
gests that there is little choosing between markets by seasons.
Sixty percent of the produce plants indicated that they chose between markets when selling. Price was the determining factor in about 75 percent of the cases, but such factors as size of the market and convenient location also were considerations.
Quality and Trade Barriers Among Principal Problems. Problems in handling eggs most frequently mentioned by produce plants were:
1. Educating farmers on quality and sanitation.
2. Proper cooling of eggs during warm weather.
3. Securing infertile eggs. 4. Stores not being equipped to han
dle. eggs. 5. State laws preventing free move
ment of trucks without special license.
6. A uniform method of buying eggs.
Table 6. Produce Plants Selling Eggs Within Specified Percentage Ranges to Designated Markets by Seasons, South Dakota, 1 94 1
Number o f Plants Selling Specified Percentage o f Volume b y Seasons
Spring Summer Fall Winter
Not Not Not Not City to Which Sold Type of Market 25-50 5 1 - 100 Det'd 25-50 5 1 -100 Det'd 25-50 5 1 - 1 00 Det'd 25-50 5 1 - 100 Det'd
Mitchell Produce Plant Mitchell Drying Plant Sioux Falls Produce Plant Aberdeen Produce Plant Mobridge Produce Plant Arl ington Produce Plant Winner Breaker Salem Produce Plant Britton Produce Plant Lemmon Produce Plant
Out of State Markets Chicago, Ill. Commission Firm 1 New York City Wholesale Coop. New York Commission Firm Eastern Seaboard Terminal Sioux City, lowa Produce Plant Southern States Produce Plant North Dakota Produce Plant Gordon, Nebraska Produce Plant Marshall, Minn. Produce Plant Ortonville, Minn. Drying Plant Worthington, Minn. Produce Plant

Poultry and Egg Marketing in S. D. 19
7. Stores speculating on eggs and causing ruinous competition.
8. Lack of laws requiring l i�ensing of egg buyers.
Educational work done as reported by produce houses in an effort to assist producers in handling eggs was:
1. Instructions as to the National Poultry Improvement plan.
2. Instructing in buying good quality chicks.
3. Distributing l iterature on marketing and farm care.
4. Candling instructions and demonstrations.
5. Instructing producer to market often.
6. Instructing in feeding and care. 7. Cooperating with county agent
programs. Poultry Buying Practices Are of In
terest. Produce plants and buying stations reporting showed an average volume of live poultry handled in 1 94 1 of 222,70 1 pounds, with a range in volume handled by individual firms from 3,000 to 1 ,250,000 pounds. All firms reporting
stated that they bought l ive poultry throughout the year.
Direct Purchases from Farmers Are Principal Source From Which Poultry Is Obtained. Seventy-five percent of the firms reported obtaining over threefourths of their poultry direct from farmers. Forty-seven percent stated that more than 75 percent of all poultry handled was assembled by their own trucks, while 53 percent said that more than three-fourths was brought in by the producers. Forty-one percent of the plants operated truck routes on which live poultry was procured.
Ninety-five percent of the poultry was paid for in cash, while 5 percent was settled in trade. Eighty-four percent of the total volume was bought on a weight-grade basis, while 16 percent was not.
Grades reported as being most commonly used by . produce houses are the same as those shown in Table 5, with the additional grade of roasters or springs.
Majority of Poultry Is Dressed Before Shipment to Terminal Markets. Table
Table 7. Produce Plants Reporting Selling Live Poultry Within Specified Percentage Ranges to Designated Markets by Seasons, South Dakota, 1941
Number of Plants Selling Specified Percentage of Volume by Seasons
Spring Summer Fall Winter
Not Not Not Not City to Which Sold Type of Market 25-50 5 1 - 1 00 Det'd 25-50 5 1 -100 Det'd 25-50 5 1 -100 Det'd 25-50 5 1 - 100 Det'd
South Dakota Markets Mitchell Sioux Falls Aberdeen Mobridge Arlington Winner Webster Lemmon Scotland
Dress in own plant Sisseton Huron
Out-of-State Markets
Produce Plant Produce Plant Produce Plant Produce Plant Produce Plant Produce Plant Produce Plant Produce Plant Produce Plant
Produce Plant Produce Plant
New York Commission Firm Eastern Seaboard Terminal Sioux City, Iowa Produce Plant North Dakota Produce Plant Marshall, Minn. Produce Plant Worthington, Minn. Produce Plant Wheaton, Minn. Produce Plant Omaha, Nebraska Produce Plant Government
20 South Dakota Experiment Station Bulletin 364
7 shows the distribution of outlets through which South Dakota produce houses market their live poultry. It is significant that most of the live poultry is either dressed in the company's own plant, or else sold to some dressing plant in the state or adjacent territory. Relatively little live poultry appears to be shipped to terminal markets.
Fifty percent of the plants sold through a regular channel. The rest chose between markets largely on a price basis, although daily pickups and cash on the spot outlets determined some choices.
About one-third of the plants reporting stated that they handled dressed
Table 8. Distribution of Markets Through Which Produce Plants Sold Dressed Poultry,
South Dakota, 1942
No. Firms No. Firms Reporting Selling Selling Through
Market Through Each Market Market Each Market
l'i ew York City and other Eastern Markets 7
Chicago 2 Minneapolis I Government I
W. Coast Webster Watertown Loe. Mkts.
poultry. These had an average volume of 394,000 pounds in 1941. Abou t threefourths of these plants made a practice of fattening poultry before dressing for a period ranging from 3 to 13 days. Most of those plants doing dressing dressed throughout the year.
Eastern Markets and Chieago Principal Outlets for Dressed Poultry. The distribution of markets through which dressed poultry was sold in 1941 is shown by Table 8.
Fifty-five percent of the dressing plants stated that they chose between markets when selling. Most of these made their choices on the basis of best price for the quality of poultry to be marketed.
Quality and Shrinkage Among Principal Problems. Problems listed most frequently by produce houses as arising in handling poultry were:
1. Securing quality poultry from producers.
2. Regulations and enforcement in regard to buying healthy poultry.
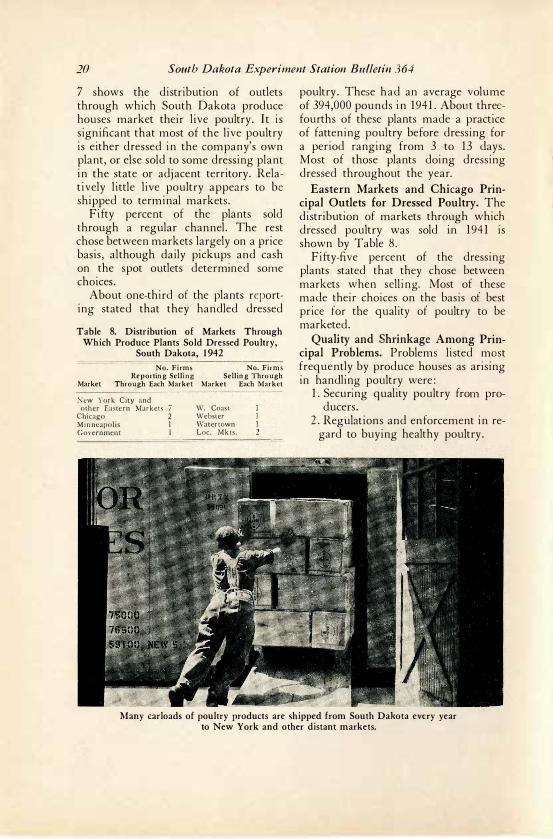
Many carloads of poultry products are shipped from South Dakota every year to New York and other distant markets.

Poultry and Egg Marketing in S. D. 21
3. Careless grading by sn1all buyers. 4. Keeping shrinkage down en route
to markets. 5. Cramped feeding quarters. 6. Too far from consuming centers. 7. �rading of live poultry for dress
ing. 8. Inexperienced help in dressing
plant. 9. Finding a suitable outlet for dres
sed poultry. Fifty Percent of P I a n t s Handle
Turkeys. Approximately one-half of the produce plants reporting stated that they handled turkeys. These bought an average of 1 1 6,000 pounds each in 194 1 with a range in volume from 1,000 to 500,000 pounds for individual plants. Only 23 percent stated that they bought turkeys the year round, while 77 percent buy only in the fall and winter.
The frequency with which various grades for turkeys were used by individual firms was as follows:
1. Number 1 and Number 2-9 firms. 2. Fancy, choice, and No. 2-3 firms. 3. A, B, and C.-2 firms. 4. Choice, No. 1 and No. 2-1 firrn. 5. No specific grades mentioned-7
firms.
Source of Procurement and Outlet for Turkeys of Significance. About twothirds of the plants stated that over 75 percent of the turkeys they bought were brought in by producers, while oneth ird secured more than 75 percent of their volume by means of their own trucks. Seventy-one percent of the firms reported buying their total volume directly from farmers, while another 25 percent secured over half their volume from farmers. A few plants bought through other produce houses, creameries and other sources. Of 27 firms reporting on method of payment, 23 paid cash and 4 settled on a pool basis.
Ten of 23 plants reported that they sold their turkeys to dressing plants in the state or in nearby towns of adjacent states; four shipped to their own selling houses in the eastern markets; seven sold through commission firms or wholesale houses in Chicago, Minneapolis, Milwaukee, New York and other eastern markets; and the others sold to trucks or other buyers. Only 3 1 percent of the firms stated that they chose between markets, 69 percent sold through regular channels. Choices that were made were listed as based on competitive prices, market changes and supply and demand.
Quality Is Prime Problem in Handling Turkeys. Problems that produce houses commonly listed in handling turkeys were:
1. Turkeys are a gamble unless bought dressed and many farmers do not want to sell that way.
2 . Poor grading by competitors. 3. Getting quality birds, since they
are too often sold before they are prime, that is, well feathered and finished.
4. Too many birds are hatched too late to be prime for the holiday markets.
A number of produce houses in each section of the state report doing educational work in the production and marketing of better quality poultry and turkeys. Some of the features of this work have been:
1. Distribution of literature. 2. Stressing quality with emphasis on
price difference. 3. National Poultry Improvemnt .plan
in hatchery and grade buying. 4. Advocating keeping turkeys ·at
home longer. 5. Selling broad breasted toms for
breeding purposes.

22 South Dakota Experiment Station Bulletin 364
Cooperative �arketing of
Poultry and Eggs Fifteen percent of the producers re
porting sold more than 75 percent of their poultry through cooperatives in 1941, while about 7 percent sold more than three-fourths of their eggs through cooperatives. About one-half of the cooperatives handling poultry and eggs on which records are available are creameries, while a number are Farmers' Union Exchanges, other cooperative stores, and farmers' elevators.
Volume Handled by Individual Cooperatives is Considerable. A survey of 24 cooperatives in 19399 showed that
9. A survey made in 1939 of 24 cooperatives in the state handling poultry and eggs was drawn on for this section. This survey was made by L. M . Brown of the Agricultural Economics Department and M. H. Simonson and Vernon 1''oordsy of the Poultry Department, South Dakota State College.
Egg breaking plants use a large number of South Dakota eggs.
these had about the following number of patrons : Selling eggs, 4,000; selling turkeys, 875; and selling other poultry, 3,000.The average volume of live poultry handled by months in 1938 for five of these cooperatives is shown in Table 9. This indicates that about 75 percent of the year's volume is marketed during October, November and December.
Table 9. Average Volume of Live Poultry Handled by Five Cooperatives by Months
in 1 93 8-South Dakota
Month Jan. Feb. Mar. April May June
Ave. Volume ( lbs. ) Per Association 1233 666 619 579 1 120 1216
Month July Aug. Sept. Oct. Nov. Dec. Total
Ave. Volume ( lbs. ) Per Association 945 1 7 15 3799 6437 14598 8973 41900
Records taken from 11 cooperative creameries handling poultry and eggs in 1941 showed an average volume of poultry and eggs bought had a value of approximately $30,000. These plants paid an average of 20 cents a dozen for eggs and 13 cents a pound for poultry for that year. The average margin for handling eggs was 9/10 cents a dozen, and for poultry % cents a pound.
Few Cooperatives Process Their Own Products of Poultry and Eggs. The majority of the cooperatives reporting on 1938 business stated that they sold their poultry and eggs to produce plants in the state, or nearby towns. Only about 10 percent reported selling tlirough cooperative sales outlets. Records show only one cooperative in the state operating its own dressing plant.
Grading and Handling Methods Vary. In the 1939 survey only 2 out of 16 cooperatives reported that they either

Poultry and Egg Marketing in S. D. 23
bought or sold eggs by grade. Six of 16 refrigerated eggs while holding them for market. Nine of 22 determined their price by that paid by local buyers; 7 by purchasing offers; and the remainder by market quotations.
Twenty-three of the plants received live poultry and five received dressed poultry. Of those handling poultry 14 based their price on that of competing buyers, six on purchase offers, and the remainder on market quotations. Nine paid for and sold poultry by grade, but 15 did not. Only 1 out of 22 stated that it fattened poultry before selling.
Fourteen of the 24 associations stated that turkeys and poultry showed a profit, and ten had no profit from these sources. Half of the associations reported making profits on eggs, and half reported no profits.
Patrons Describe Both Advantages and Disadvantages of Cooperative Mar� keting. Some of the benefits that patrons listed as having been received from selling eggs and poultry through cooperatives were :
1. Paid highest prices.
2. Offered friendly service. 3. Picked up at farm by truck. 4. Delivered chicken feed twice a
week. 5. Dividend payments. 6. Dress turkeys. 7. Improved quality by prompt trans
portation to market. 8. Improved local markets. Some criticisms made of cooperative
poultry and egg marketing by other patrons or former patrons were :
1. Unfair grading. 2. No experience in handling product. 3. Did not grade eggs. 4. Will not buy eggs unless they also
get cream. 5. Did not buy eggs and poultry. 6. Paid less than some other outlets. Of 140 producers, 120 stated that they
had never been approached to sell their poultry products to a cooperative. Thirty-five percent of those not selling cooperatively said there was a particular reason. Of these the following numbers gave specified reasons : No cooperative in the community, 28; no better price, 5; prefer selling to grocery, 3.
Summary and Conclusions
Poultry and egg production in South Dakota is characterized by relatively small flocks of general purpose breeds. On most farms the poultry enterprise is a minor one; this is particularly true of the western part of the state. This situation means that the volume of eggs and poultry sold per sale by each producer is usually small, and since the majority of producers sell their eggs to the most convenient store it means that the volume handled by dealers is usually small.
In fact, most stores look upon egg buying as a means of drawing trade, and
since they settle for the majority of eggs in trade they look for their profits from the sale of goods rather than in handling eggs. Therefore, they usually are not too interested in securing eggs of quality nor equipped to protect that quality while they have eggs in their hands.
These factors in the past have been a distinct detriment to getting eggs of high quality from the producer to the consumer by the shortest possible route, and has tended to contribute toward discrediting South Dakota and the MidW est as a source of dependable eggs.

24 South Dakota Experirnent Statioll Bulletin 364
Means by which egg quality may be improved are:
1. Licensing produce handlers. 2. Initiating uniform grading and
handling regulations. 3. Providing an inspection service that
would enforce these regulations or revoke the licenses.
4. Passing the benefits of price differentials for separate grades on to the producer so that he may be encouraged to take greater care of his eggs on the farm and to market them more frequently. Some. produce plants are already doing a good job in this respect. In October, 1942, one plant was paying as much as a 9 cent differential over case run eggs for those grading fancy or hennery. This plant over a period of years has established an exceptionally good market for such grades on the eastern coast.
While the majority of hatcheries pullorum test and use eggs only from selectec;l Bocks these practices are not universal, and to that extent are a handicap to the poultry industry of the state. Furthermore, in many instances growers have little opportunity of knowing just what quality chicks they are getting when they buy and do not have a basis for comparing the prices between separate hatcheries since there is little unif.ormity in present grading systems.
Growers tend to market a much larger percentage of their poultry and turkeys directly to packers or packer buyers than in the case of eggs. This tends to improve the poultry and turkey marketing process . as compared to eggs.
However, a great deal can still be done toward more uniform grading practices and passing the resultant price differentials on to the producers ; and working toward plants with a sufficient volume to operate efficiently, handle products properly, and yet maintain competitive conditions. Perhaps price fixing with grade differentials would be the answer to the latter problem.
The rather widespread practice of buying turkeys on a dressed carcass basis has distinct advantages to both processor and producer provided a uniform grading system is established whereby price differentials are passed on to the producer. In many instances present indications are that this is not now the case.
Cooperatives can serve as a check and a guide to private commercial produce plants provided they have sufficient volume to operate efficiently. In order to justify their existence they must perform the services of assembling, grading, processing and marketing in such a manner that each producer gets the highest possible return for his product in relation to its quality, and at a minimum cost to the consumer.1 0
Those marketing agencies which are now giving and which continue to give attention to the above considerations promise to make the greatest contribution to profitable poultry enterprise on the farm and thereby insure their own perpetuation.
1 0 . Suggest ions on cooperat ive reorgan izat ion , accounting procedure and financial stan dards may be secured from t he follow i n g publication : W . P. Cotton , Gabriel Lundy and L. M . Brow n , "Cooperat i ve Creameries in Sou t h Dakot a , " South Dako t a Agricult ural Exp. Sta. B u l le t i n 363 , A ugust , 1 942.