egg processing, cartoning and transportation costs: a ... · executive summary the u.s. egg...
TRANSCRIPT

Egg Processing, Cartoning and Transportation Costs:
A Special Report
4/8/19
Compiled by
Maro Ibarburu1, Alejandro Plastina2 and Lesa Vold1 1Egg Industry Center
Iowa State University
2 Department of Economics
Iowa State University

2
Executive Summary The U.S. egg production industry runs on very small profit margins. As a result, understanding each input cost is important to the decisions egg farmers make each day. The Processing, Cartoning, and Transportation (PCT) costs are an important part of the costs associated with the final product delivered to the store, and the last public update of these costs was published by Don Bell, University of California, in 2000. A de-identified survey study of PCT costs was conducted for the last half of 2018. Survey responses covered the production of approximately 150 million egg laying hens in the U.S. The survey found the costs of processing gradable nest run and graded loose eggs are between 43 and 49 cents/dozen including delivering to the store door, but not including loss from store returns. Those findings were in line with an inflation-adjusted cost estimate based on industry standards at the change of century (Bell, 2000). It is the intention of the Egg Industry Center to continue updating these estimates on a regular basis to assist the industry in decision making. Keywords: Laying hen, Egg Processing, Cartoning, Packaging, Transportation Introduction The U.S. egg production industry runs on very small profit margins. As a result, understanding each input cost is important to the decisions farmers make each day. The Processing, Cartoning, and Transportation (PCT) costs are an important part of the costs associated with the final product delivered to the store. The last public report was the result of an egg processors survey in 2000, published by Don Bell at University of California. This study is a first attempt at providing updated benchmark costs of processing eggs for the shell-egg market considering current industry practices. This report outlines the process and methodology that were used for this update and their results. The components of the costs with higher variability between answers is probably where there are more opportunities for the processors to reduce their costs. Survey Questionnaire A survey of U.S. egg processors was done to estimate the costs associated with washing, weighing, packaging and transporting eggs. The egg farmer questionnaire was based on a survey developed by Don Bell, and discussion with egg farmers to ensure the questions could be answered with readily available farm information. The survey contained seven questions, some of them with multiple subsections, eliciting information on the cost of packaging materials, processing (washing, weighing, packaging), and other relevant factors influencing cost at this stage.

3
The survey included questions for: • Four different types of eggs: gradable nest run class 1 (GNR1) sourced in-line, gradable nest
run class 1 (GNR1) sourced off-line, graded loose large, and graded loose extra-large. • Four different packaging types: 12-pack carton, 18-pack carton, “twin-18” packs, and 5-dozen
packs. • Two types of cases: the regular corrugated cardboard case and the reusable plastic containers.
For each egg type, the authors surveyed the costs of processing and the yield grade loss associated. Three additional questions were added to the survey, which included:
• The finishing costs for putting boxes of eggs in pallets, wrapping them, etc. • The losses from store returns, and • The differences in costs between USDA-graded eggs and non-USDA-graded eggs.
There are 256 possible combinations of these costs. An example is provided for one of the most typical combinations (four types of eggs: packaged in 12-pack cartons in regular (cardboard) cases, non-USDA certified, and delivered to the store door). Even though the data obtained has some limitations, this is a good first step to benchmark the costs of processing eggs for the shell-egg market. The entire survey questionnaire is reproduced in this report as Appendix 1. De-identified Data Collection In January of 2019, a one-page survey was sent to 107 egg producer/processor companies for which the authors have contact information. One person per company was chosen to receive the survey to avoid the possibility of duplicate responses. Participants were offered a variety of ways to return their surveys where their identity was not traceable, therefore guaranteeing anonymity of the respondents. The survey specifically asked for responses based on the PCT costs for the last half of 2018. Data collection was finished on February 15, 2019. Analytical Approach The analysis was conducted in three stages. First, responses with extremely high and extremely low values (“outliers”) were eliminated from the database. Second, alternative measures of central location (i.e. trimmed mean and median) and dispersion (i.e. the 25th and 75th percentiles) were calculated for the remaining responses. Finally, for items where the distribution of responses was very scattered, cluster analyses were conducted to identify groups of responses with high degrees of similarity within each group but significant differences among groups. This step was conducted in an attempt to understand whether a unique cost estimate can characterize all responses reasonably well.

4
Outliers Tukey’s method (1977) was used to identify outliers, based on its simplicity. This method consists of the following steps:
• Estimating the quartile difference (QD), which is the difference between the values of the 75th and 25th percentiles
• Multiplying that difference by 1.5, or 1.5QD • Identifying any value lower than the 25th percentile minus 1.5QD, as an outlier • Identifying any value that is higher than the 75th percentile plus 1.5QD, as an outlier
Central Location The most commonly used measure of central location for a distribution of numerical values is the arithmetic mean, or simple average (i.e., the sum of the values across all responses divided by the count of responses). However, one major drawback of the simple average approach is its sensitivity to very high or very low values in asymmetric distributions (even after removing outliers). Rice (2006) states, “Without careful attention to the data, the arithmetic mean (of the sample) can produce misleading results” (p. 395). Because the presented data had some more extreme values and some of the distributions were asymmetric, two alternative measures of central location that are more robust to the presence of extreme values in asymmetric distributions were pursued: the median and the trimmed mean. The median is defined as the middle value of the ordered observations (from smallest to largest); and when the sample size is even, the median is the average of the two middle values (Rice, 2006). “Clearly, moving the extreme observations does not affect the sample median at all, so the median is quite robust” (Rice, 2006, p. 395). One disadvantage of the median is that it ignores the values outside the center, and such information might be valuable. The trimmed mean is estimated by ordering the data, discarding the X% lowest and highest values, and taking the arithmetic mean of the remaining data (Rice, 2006). “It is generally recommended that the value chosen for X to be 0.1 or 0.2” (Rice, 2006, p. 397). An advantage of the trimmed mean over the median is that it incorporates information not only from the center of the distribution, but also from the 1-2X% of the rest of the sample. In the present study, X= 20%. Given the authors’ focus on producing robust estimates of the central location of the distribution of costs, our analysis is conducted using only the median and the trimmed mean. According to Rice (2006), “There is no single estimate that is best for all symmetric distributions” (p. 398). But, when the distribution is not symmetric, the median is a more appropriate measure according to Snedecor and Cochran (1989). “For the purpose of simply summarizing the data it is often useful to compute more than one measure of location and compare the results” (Rice, 2006, p. 398). Dispersion Just like the arithmetic mean is the most common measure of central location, the most common measure of dispersion of a distribution of numerical values is the standard deviation. By definition, the standard deviation measures the dispersion of observations around the arithmetic mean. Since the present report is based on the median and the trimmed mean instead of the arithmetic mean, the measure of dispersion chosen by the authors is the range defined by the 25th and the 75th percentile. The 25th (75th) percentile separates the lowest ¼ ( ¾ ) of the ordered sample observations from the

5
highest ¾ ( ¼ ). In summary, the 25th and the 75th percentiles indicate the dispersion of sample values around the median. One drawback of using percentiles as the measure of dispersion is that it ignores the information contained in observations within or outside the range. The clustering analysis was conducted in a computer programming language used for statistical analysis called SAS. Specifically, the options chosen for this operation within the SAS program was Hierarchical clustering, Ward, Standardize data. This analysis was used to identify groups of responses with similar values within each cost category. All clustering methods are based on the agglomerative hierarchical clustering procedure: each observation begins in a cluster by itself; the two closest clusters are merged to form a new cluster that replaces the two old clusters; merging of the two closest clusters is repeated until only one cluster is left. The various clustering methods differ in how the distance between two clusters is computed (SAS Institute Inc. 2010). Survey Results A total of 23 responses were received to the survey. Although it is impossible to know the production of the laying hens represented by the responses, due to the anonymity of the respondents, some rough calculations using raw assumptions suggest approximately 150 million layers. The assumptions used for that estimation were derived from the February 2019 edition of magazine Egg-Industry published by WATT Media. This publication shares data about egg company ranking and helped provide the foundational data for the following assumptions:
• Farmers that process more than three million cases in six months would have on average 15.0 million layers,
• Farmers that process between one and three million cases in six months would have on average 4.2 million layers, and
• Farmers that process less than one million cases would have on average 1.3 million layers. Using these calculations, the survey responses would represent approximately 45% of the U.S. laying hen inventory, and 65% of the laying hens dedicated to shell egg production. Seventy percent of the eggs processed by the respondents were nest-run in-line eggs, 20% were nest-run off-line eggs, and 10% were graded loose eggs. If a producer/processor indicated that he/she didn’t process any eggs of one of the types above, answers related to those eggs were not included in the analysis. Packaging costs: Table 1 presents the results of the survey for the various types of packaging materials and their associated costs. The total number of usable observations is shown as well as the calculated median and trimmed mean costs. The differences between the two cost estimates are also reported.

6
There were 23 answers about the 12-eggs carton cost. Three of them were ruled as outliers, leaving 20 usable answers. The median cost of the 12-eggs carton was 9.80 cents/dozen and the trimmed mean was 9.78 cents/dozen. The dispersion around the median is small. There were 23 answers about the 18-eggs carton cost. One of them was ruled as an outlier, leaving 22 usable answers. The data were organized into three clusters that were statistically different: the 1st cluster consists of 15 observations with a median value of 9.24, the 2nd cluster consisted of 4 observations with a median value of 11.90, and the 3rd cluster consisted of three observations with a much higher median value. The authors suspect a possible problem with the interpretation of this question because the median value for the 2nd and 3rd clusters together was approximately 1.5 times larger than the median of the 1st cluster. It might be that some producers answered in a cents/dozen basis and some answered in a cents per “18-pack” basis (because the “18-pack” package contains 1.5 dozen). Overall, the median cost of the 18-pack was 9.53 cents/dozen and the trimmed mean was 9.87 cents/dozen (a 4% difference between these two estimates). The clustering observed might be a sign of having some issues with the units of measurement used by different respondents. There were 23 answers about the case cost (average of 30dz and 15dz cases). Two of them were ruled as outliers, leaving 21 usable answers. The median case cost was 4.00 cents/dozen and the trimmed mean was 3.89 cents/dozen (a 3% difference between these two estimates). The dispersion around the median is small. There were 13 answers about the reusable plastic containers cost. One of them was ruled as an outlier leaving 12 usable answers. Two answers were significantly higher than the rest, but were not ruled as outliers. The median reusable plastic container cost was 4.28 cents/dozen and the trimmed mean was 4.25 cents/dozen (a 1% difference between these two estimates). The dispersion around the median is small. There were 22 answers about the finishing cost (pallets, shrink wrap, slip sheets, etc). Three of them were ruled as outliers leaving 19 usable answers. The data was organized into two clusters that were statistically different. The median finishing cost was 0.90 cents/dozen and the trimmed mean was 0.89 cents/dozen (a 1% difference between these 2 estimates). The dispersion around the median is large, which along with the clustering observed might indicate that the calculated central measures might be poor indicators of finishing cost for some respondents.
Table&1.&Packaging&material&for&cartoned&eggs&in¢s&per&dozenUsable
observations Median Perc/25 Perc/75 cents/doz. %Carton/cost:/12/;/Pack 20 9.80 9.54 10.02 9.78 0.02 0%Carton/cost:/18/;/pack 22 9.53 9.03 11.18 9.87 ;0.34 ;4%Case/cost:*/ 21 4.00 3.65 4.10 3.89 0.11 3%Reusable/plastic/containers: 12 4.28 3.93 4.64 4.25 0.03 1%Finishing/costs: 19 0.90 0.62 1.08 0.89 0.01 1%*/(avg./of/30/dozen/and/15/dozen/cases)
Percentiles Median&9&Trimmed&meanTrimmed&mean
7
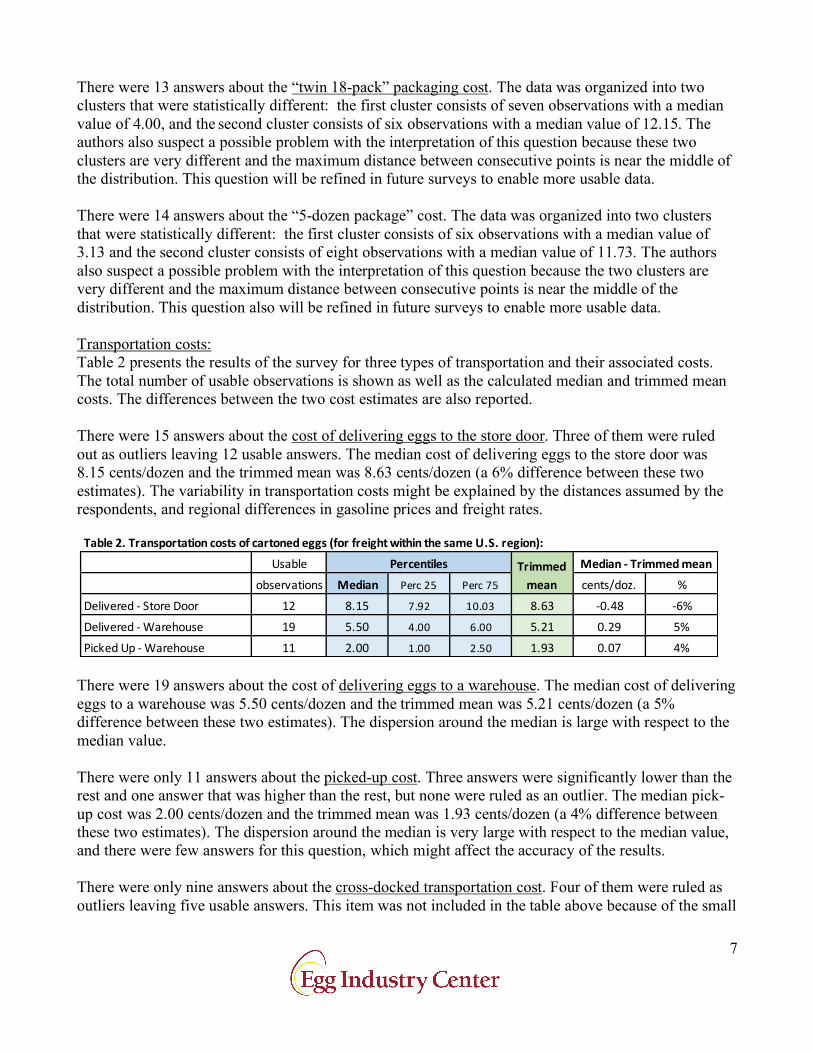
There were 13 answers about the “twin 18-pack” packaging cost. The data was organized into two clusters that were statistically different: the first cluster consists of seven observations with a median value of 4.00, and the second cluster consists of six observations with a median value of 12.15. The authors also suspect a possible problem with the interpretation of this question because these two clusters are very different and the maximum distance between consecutive points is near the middle of the distribution. This question will be refined in future surveys to enable more usable data. There were 14 answers about the “5-dozen package” cost. The data was organized into two clusters that were statistically different: the first cluster consists of six observations with a median value of 3.13 and the second cluster consists of eight observations with a median value of 11.73. The authors also suspect a possible problem with the interpretation of this question because the two clusters are very different and the maximum distance between consecutive points is near the middle of the distribution. This question also will be refined in future surveys to enable more usable data. Transportation costs: Table 2 presents the results of the survey for three types of transportation and their associated costs. The total number of usable observations is shown as well as the calculated median and trimmed mean costs. The differences between the two cost estimates are also reported. There were 15 answers about the cost of delivering eggs to the store door. Three of them were ruled out as outliers leaving 12 usable answers. The median cost of delivering eggs to the store door was 8.15 cents/dozen and the trimmed mean was 8.63 cents/dozen (a 6% difference between these two estimates). The variability in transportation costs might be explained by the distances assumed by the respondents, and regional differences in gasoline prices and freight rates.
There were 19 answers about the cost of delivering eggs to a warehouse. The median cost of delivering eggs to a warehouse was 5.50 cents/dozen and the trimmed mean was 5.21 cents/dozen (a 5% difference between these two estimates). The dispersion around the median is large with respect to the median value. There were only 11 answers about the picked-up cost. Three answers were significantly lower than the rest and one answer that was higher than the rest, but none were ruled as an outlier. The median pick-up cost was 2.00 cents/dozen and the trimmed mean was 1.93 cents/dozen (a 4% difference between these two estimates). The dispersion around the median is very large with respect to the median value, and there were few answers for this question, which might affect the accuracy of the results. There were only nine answers about the cross-docked transportation cost. Four of them were ruled as outliers leaving five usable answers. This item was not included in the table above because of the small
Table&2.&Transportation&costs&of&cartoned&eggs&(for&freight&within&the&same&U.S.®ion):Usable
observations Median Perc/25 Perc/75 cents/doz. %Delivered/9/Store/Door 12 8.15 7.92 10.03 8.63 90.48 96%Delivered/9/Warehouse 19 5.50 4.00 6.00 5.21 0.29 5%Picked/Up/9/Warehouse 11 2.00 1.00 2.50 1.93 0.07 4%
Percentiles Median&>&Trimmed&meanTrimmed&mean

8
number of usable observations. The median cost of cross-docked transportation was 5.30 cents/dozen and the trimmed mean was 5.47 cents/dozen (a 3% difference between these two estimates). Transportation costs reported in this survey show a large dispersion around the median and the trimmed mean, but this is common of self-reported transportation costs in similar surveys. For comparison purposes, an annual survey of grain hauling costs published by Iowa State University Extension and Outreach as Ag Decision Maker File A3-10 highlights the considerable dispersion of responses around the mean and median even after controlling for hauling distance and regional characteristics (the survey only focuses on the state of Iowa). In the future, more useful responses may be obtained if the question is reformulated by referring to specific standardized distances (miles traveled per type of load), regional characteristics, and other things. Processing costs: The processing costs are divided into two components, the cost of processing (washing, weighing, etc), and the grade yield loss (which is the sum of the losses for eggs received that are of lower value such as smaller sizes, or undergrades, and the gain for the eggs received that are of higher value such as larger size eggs). Table 3 presents the results of the survey for the processing cost of three different types of eggs. The total number of usable observations is shown as well as the calculated median and trimmed mean costs. The differences between the two cost estimates are also reported.
There were 20 answers about the cost of processing GNR1 eggs sourced in-line. One of them was ruled as an outlier leaving 19 usable answers. The median cost of processing GNR1 eggs sourced in-line was 13.27 cents/dozen and the trimmed mean was 13.54 cents/dozen (a 2% difference between these two estimates). Even though the differences between the estimates for the center location of the data is small, the dispersion around the median is very large. There were 15 answers about the cost of processing GNR1 eggs sourced off-line. One of them was ruled as an outlier leaving 14 usable answers. Three answers were significantly higher than the rest and one answer that was much lower than the rest, but none were ruled out as outliers. The median cost of processing GNR1 eggs sourced off-line for the entire sample was 15.75 cents/dozen and the trimmed mean was 15.27 cents/dozen (a 3% difference between these two estimates). The dispersion around the median is very large. The cost of processing large or extra-large graded loose eggs should be the same, and it was for all responses except one. The difference between the cost of processing for these two types of eggs should be in the yield grade loss. Therefore, an analysis of the cost of processing graded loose eggs was done.
Table&3.&Processing&costs&(cost&of&processing)COST%of%PROCESSING Usable
observations Median Perc/25 Perc/75 cents/doz. %GNR/1/</Sourced/IN<LINE 19 13.27 10.55 17.21 13.54 <0.27 <2%GNR/1/</Sourced/OFF<LINE 14 15.75 11.35 18.49 15.27 0.48 3%Graded/loose/(plant/grade) 10 14.73 12.62 18.43 15.14 <0.41 <3%GNR1:/Gradable/Nest/Run/Class/1
Percentiles Median&8&Trimmed&meanTrimmed&mean
9
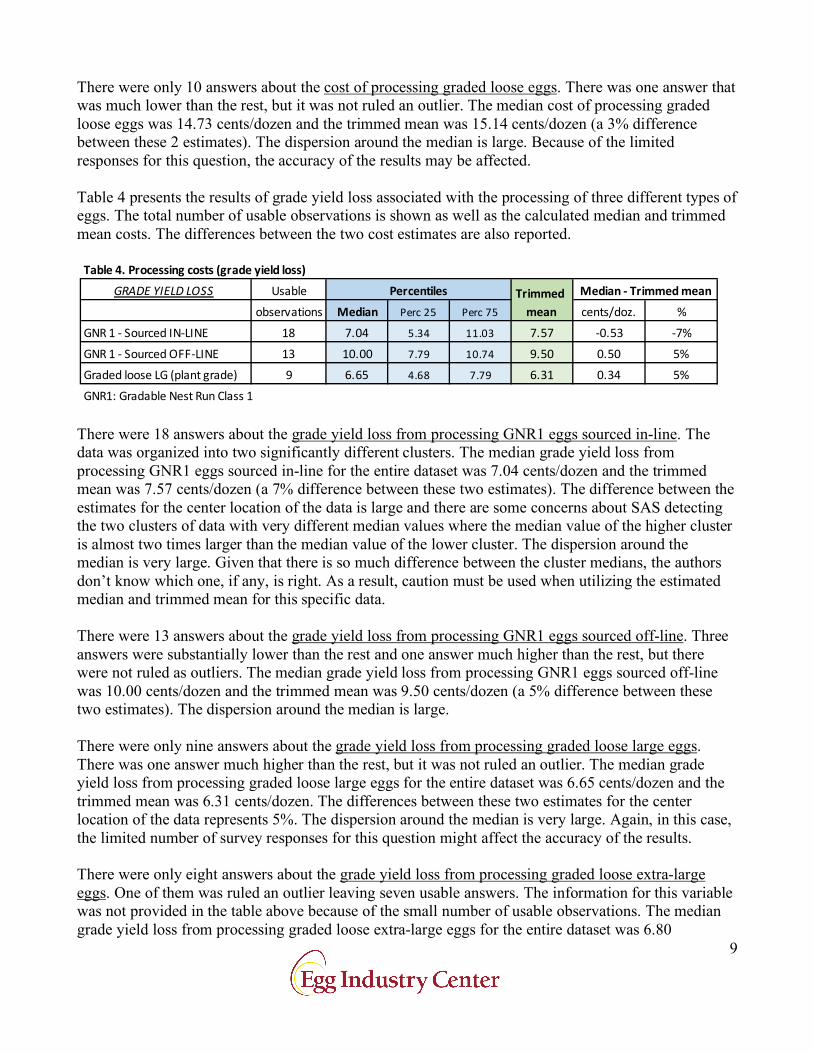
There were only 10 answers about the cost of processing graded loose eggs. There was one answer that was much lower than the rest, but it was not ruled an outlier. The median cost of processing graded loose eggs was 14.73 cents/dozen and the trimmed mean was 15.14 cents/dozen (a 3% difference between these 2 estimates). The dispersion around the median is large. Because of the limited responses for this question, the accuracy of the results may be affected. Table 4 presents the results of grade yield loss associated with the processing of three different types of eggs. The total number of usable observations is shown as well as the calculated median and trimmed mean costs. The differences between the two cost estimates are also reported.
There were 18 answers about the grade yield loss from processing GNR1 eggs sourced in-line. The data was organized into two significantly different clusters. The median grade yield loss from processing GNR1 eggs sourced in-line for the entire dataset was 7.04 cents/dozen and the trimmed mean was 7.57 cents/dozen (a 7% difference between these two estimates). The difference between the estimates for the center location of the data is large and there are some concerns about SAS detecting the two clusters of data with very different median values where the median value of the higher cluster is almost two times larger than the median value of the lower cluster. The dispersion around the median is very large. Given that there is so much difference between the cluster medians, the authors don’t know which one, if any, is right. As a result, caution must be used when utilizing the estimated median and trimmed mean for this specific data. There were 13 answers about the grade yield loss from processing GNR1 eggs sourced off-line. Three answers were substantially lower than the rest and one answer much higher than the rest, but there were not ruled as outliers. The median grade yield loss from processing GNR1 eggs sourced off-line was 10.00 cents/dozen and the trimmed mean was 9.50 cents/dozen (a 5% difference between these two estimates). The dispersion around the median is large. There were only nine answers about the grade yield loss from processing graded loose large eggs. There was one answer much higher than the rest, but it was not ruled an outlier. The median grade yield loss from processing graded loose large eggs for the entire dataset was 6.65 cents/dozen and the trimmed mean was 6.31 cents/dozen. The differences between these two estimates for the center location of the data represents 5%. The dispersion around the median is very large. Again, in this case, the limited number of survey responses for this question might affect the accuracy of the results. There were only eight answers about the grade yield loss from processing graded loose extra-large eggs. One of them was ruled an outlier leaving seven usable answers. The information for this variable was not provided in the table above because of the small number of usable observations. The median grade yield loss from processing graded loose extra-large eggs for the entire dataset was 6.80
Table&4.&Processing&costs&(grade&yield&loss)GRADE&YIELD&LOSS Usable
observations Median Perc/25 Perc/75 cents/doz. %GNR/1/</Sourced/IN<LINE 18 7.04 5.34 11.03 7.57 <0.53 <7%GNR/1/</Sourced/OFF<LINE 13 10.00 7.79 10.74 9.50 0.50 5%Graded/loose/LG/(plant/grade) 9 6.65 4.68 7.79 6.31 0.34 5%GNR1:/Gradable/Nest/Run/Class/1
Percentiles Median&7&Trimmed&meanTrimmed&mean

10
cents/dozen and the trimmed mean was 6.41 cents/dozen. Again, the limited number of survey responses for this question might affect the accuracy of the results. Additional costs statistics: Table 5 presents the results for two additional costs surveyed: the loss from store returns, and the difference in processing costs between standard and USDA certified eggs. The total number of usable observations is shown as well as the calculated median and trimmed mean costs. The differences between the two cost estimates are also reported.
There were only 10 answers about the loss from store returns. Three answers were substantially higher than the rest but were not ruled as outliers. Two clusters were identified where the median value of the higher cluster is almost eight times larger than the median value of the lower cluster, which has more observations. Therefore, there could have been a problem with how this question was written, or interpreted. The difference between the median and the trimmed mean value represents 42% of the average between these two measures. The dispersion around the median is very large where the 75th percentile is 10 times larger than the 25th percentile. There were 17 answers about the processing cost difference between standard and USDA certified. One of them was ruled out as an outlier leaving 16 usable answers. The data was organized into two very clear clusters where the median value of the higher cluster is two times larger than the median value of the lower cluster. The difference between the median and the trimmed mean value represents 24% of the average between these two measures. The dispersion around the median is very large. There might have been a problem with the interpretation of this question because the two clusters are very different and the maximum distance between consecutive points is near the middle of the distribution. This question will be refined in future surveys. Sum of packaging and processing costs (excluding transportation): To estimate aggregate costs of packaging and processing (excluding transportation), the authors added the estimated median and trimmed mean values for the costs of the 12-pack carton, the case cost, the finishing cost, the processing cost, and the grade yield loss, by egg categories. The sum of the 25th and 75th percentiles for those categories of costs provide a measure of dispersion around the estimated median cost of packaging and processing (excluding transportation). This data is summarized in Table 6.
Table&5.&Additional&costsUsable
observations Median Perc/25 Perc/75 cents/doz. %Loss/from/store/returns: 10 0.70 0.26 2.60 1.07 @0.37 @42%Processing/cost/difference/between/standard/and/USDA/ 16 1.02 1.00 1.78 1.30 @0.28 @24%
Trimmed&mean
Percentiles Median&5&Trimmed&mean

11
The median aggregate costs of packaging and processing (excluding transportation) were: 35.01 cents/dozen for GNR1 sourced in-line, 40.45 cents/dozen for GNR1 sourced off-line, and 36.08 cents/dozen for large graded loose. The dispersion of values around the reported median estimates are very wide, ranging from 10.3 to 13.8 cents/dozen, depending on the type of egg processed. For USDA graded eggs, the cost difference between standard and USDA should be added. The trimmed mean aggregate costs of packaging and processing (excluding transportation) were: 35.66 cents/dozen for GNR1 sourced in-line, 39.33 cents/dozen for GNR1 sourced off-line, and 36.02 cents/dozen for large graded loose. The difference between the trimmed mean estimates and the median estimates range between -2% and +3%. Total PCT Costs: A total of 256 combinations of types of eggs processed (four types included in the survey), packaging sizes (four types included in the survey), cases or reusable plastic containers (two options), transportation modes (four types included in the survey), and grading (USDA graded or not) are possible with the answers obtained through this survey. Therefore, there are 256 combinations with different PCT costs. The example below (table 7), is the estimated PCT cost of processing three types of eggs packaged in 12-pack cartons in regular cases, non-USDA certified, and delivered to the store door. The median total PCT costs (calculated as the sum of the median cost of packaging, processing, and transportation to the store door) were: 43.16 cents/dozen for GNR1 sourced in-line, 48.60 cents/dozen for GNR1 sourced off-line, and 44.23 cents/dozen for large graded loose. For USDA graded eggs, the cost difference between standard and USDA (table 5) should be added. The dispersion of values around these median estimates is substantial, ranging between 12.4 and 15.9 cents/dozen depending on the type of egg processed. The loss from store returns wasn’t included in this sum because of the concerns outlined on page 10, but they should be part of the total PCT costs reported below.
Table&6.&Sum&of&packaging&and&processing&costs&(transportation¬&included):
Median Perc*25 Perc*75 cents/doz. %GNR*1*9*Sourced*IN9LINE 35.01 29.69 43.44 35.66 90.65 92%GNR*1*9*Sourced*OFF9LINE 40.45 32.95 44.43 39.33 1.12 3%Graded*loose*LG*(plant*grade) 36.08 31.11 41.42 36.02 0.06 0%GNR1:*Gradable*Nest*Run*Class*1
Percentiles Median&=&Trimmed&meanTrimmed&mean
Median Perc*25 Perc*75 cents/doz. %GNR*1*9*Sourced*IN9LINE 43.16 37.61 53.46 44.30 91.14 93%GNR*1*9*Sourced*OFF9LINE 48.60 40.86 54.46 47.96 0.64 1%Graded*loose*LG*(plant*grade) 44.23 39.02 51.44 44.65 90.42 91%GNR1:*Gradable*Nest*Run*Class*1
Percentiles Median-.-Trimmed-meanTrimmed-mean
Table-7.-PCT-costs-of-eggs-packaged-in-12.pack-cartons-in-regular-cases,-non.USDA-certified,-and-delivered-to-the-store-door-(loss-from-store-returns-not-included)

12
The trimmed mean total PCT costs were: 44.30 cents/dozen for GNR1 sourced in-line, 47.96 cents/dozen for GNR1 sourced off-line, and 44.65 cents/dozen for large graded loose. The difference between the trimmed mean estimates and the median estimates range between -3% and +1%. Discussion of Results The findings presented in the previous section suggest that typical PCT costs range between $43 and $49, depending on the type of egg processed. Furthermore, PCT costs for GNR1 sourced off-line tends to be higher than the other categories, followed by graded loose large eggs, and GNR1 sourced in-line. While some categories of reported costs are fairly concentrated around the median (e.g. 12-pack carton costs and case cost), other categories show high degrees of dispersion (e.g. processing cost and grade yield loss). Consequently, any practical use of the estimates presented in this study must be qualified by the uncertainty surrounding the median and trimmed mean estimates. The variables with a high dispersion around the median could represent an opportunity for producers to increase efficiency, unless they are the consequence of problems with the survey itself, such as differences in methods farmers used to estimate the specific costs, or regional differences. Many questions resulted in very clear clusters of answers. Some possible explanation of the variability of self-reported costs are:
• Two different ways of estimating costs by the companies responding to the survey • Different types of markets affecting grade yield loss differences (e.g. a niche market versus
conventional market because smaller eggs would have a larger discount in the niche market) • Transportation distances and regions that could affect the reporting of transportation costs
One drawback of the process used to protect the confidentiality of the answers was that it prohibited clarification of responses or follow-up questions if needed. A potential concern about any self-reporting survey is that respondents could report incorrect data. Because it is not possible to cross-check the self-reported information, an inflation-adjusted cost estimate approach, outlined in the section below, was used to put the results of our survey in perspective.

13
Results in perspective: Comparison with inflation-adjusted costs based on Bell (2000) The Bell (2000) report was a survey of 12 commercial companies in California to estimate the cost of egg processing, transportation, and marketing costs. In an attempt to benchmark the results from the present study, an inflation-adjusted estimate of the PCT costs from Bell (2000) was calculated, and a comparison run against the current survey data. This benchmarking procedure is fraught with conceptual drawbacks rooted in the impossibility to account for technological and regulatory change since 2000; and, it is important to consider that the Bell (2000) report was based on only California processors, while the current study is based on processors across the U.S., making the results even less comparable. However, it is expected that readers will see value in the comparison of our imperfect inflation-adjusted cost estimate results with an imperfect survey analysis update of the industry standard. To estimate this inflation-adjusted cost, indexes from the USDA National Agricultural Statistics Service Information (USDA-NASS) on prices paid was used for most costs except:
• The transportation costs, which were adjusted using the costs differences of the Agricultural Refrigerated Truck Quarterly datasets published by USDA National Agricultural Marketing Service (USDA-AMS), and
• The plant operations costs, which was adjusted using the industrial rate of electricity published by the U.S. Energy Information Administration.
The PTC cost in 2000 was 25.97 cents/dozen: divided into 9.83 cents/dozen for processing, 4.51 cents/dozen for trucking, 1.38 cents/dozen for marketing, and 10.2 cents/dozen for packaging. In 2000, the estimated 9.83 cents/dozen cost of processing eggs was divided into:
• 4.65 cents/dozen for labor; which adjusted based on the labor wages and rates index to 2018 prices would be 8.03 cents/dozen (a 1.73 adjustment factor)
• 1.45 cents/dozen for plant operations; which adjusted based on the change of the industrial rate of electricity as published by the U.S. Energy Information Administration to 2018 prices would be 2.08 cents/dozen (a 1.43 adjustment factor)
• 1.14 cents/dozen for depreciation; which adjusted based on the building materials index to 2018 prices would be 1.87 cents/dozen (a 1.64 adjustment factor)
• 0.62 cents/dozen for interest; which adjusted based on the building materials (because most interest costs depend directly on the costs of the investment) index to 2018 prices would be 1.02 cents/dozen (a 1.64 adjustment factor)
• 1.14 cents/dozen for overhead; which adjusted based on the ag services index to 2018 prices would be 1.82 cents/dozen (a 1.60 adjustment factor)
• 0.83 cents/dozen for USDA; which adjusted based on the ag services index to 2018 prices would be 1.33 cents/dozen (a 1.60 adjustment factor)
The sum of all the inflation adjusted processing costs would be 16.15 cents/dozen, in 2018. In 2000, the estimated 4.51 cents/dozen cost of trucking eggs was divided into:
• 0.50 cents/dozen for assembly; which adjusted based on the supplies index to 2018 prices would be 0.81 cents/dozen (a 1.62 adjustment factor), this item is similar to the item named “finishing costs” in the current survey.

14
• 4.01 cents/dozen for other costs; which adjusted based on the change of the Agricultural Refrigerated Truck Quarterly as published by USDA-AMS to 2018 prices would be 9.49 cents/dozen (a 2.37 adjustment factor)
The sum of all the adjusted trucking costs would be 10.30 cents/dozen, in 2018. The marketing cost (sales staff and expenses) is probably labor for the most part, so the 2018 value was estimated using the labor wages and rates index from 1.38 cents/dozen in 2000, to 2.38 cents/dozen in 2018. The estimated costs of packaging materials were estimated using the index for supplies, which was 1.62 larger in 2018 than in 2000:
• 12-egg carton cost in 2000 was 7.49 cents/dozen, which adjusted 1.62 times higher using the supplies index resulted in 12.10 cents/dozen in 2018
• 18-egg carton cost in 2000 was 10.46 cents/dozen, which adjusted 1.62 times higher using the supplies index resulted in 16.90 cents/dozen in 2018
• Filler flat cost in 2000 was 4.65 cents/dozen, which adjusted 1.62 times higher using the supplies index resulted in 7.51 cents/dozen in 2018
• 15 dozen case cost in 2000 was 41.39 cents/case, which adjusted 1.62 times higher using the supplies index resulted in 66.88 cents/case (4.46 cents/dozen) in 2018
• 30 dozen case cost in 2000 was 78.62 cents/case, which adjusted 1.62 times higher using the supplies index resulted in 127.05 cents/case (4.23 cents/dozen) in 2018
he authors made the following changes to the original and the inflation-adjusted estimates, to make them comparable to the current survey results: the USDA grading cost was removed from both estimates, and the “marketing” cost was included with the processing cost. It can be seen that some of these estimates (packaging and trucking) are higher than the current EIC survey results, while the inflation-adjusted estimated processing cost is lower than the current EIC survey result. The sum of the inflation-adjusted estimated year 2018 costs is similar to the EIC survey costs estimated for eggs delivered to the store door (43 to 49 cents/dozen).
Table&8.&Original&and&inflation2updated&cost&estimates,&based&on&Bell&(2000).
cents/dozen %+of+total cents/dozen %+of+totalProcessing 10.38 41.3 17.21 39.2Trucking 4.51 17.9 10.30 23.5Packaging 10.25 40.8 16.34 37.3Total 25.14 43.84
Summer+of+2000 PPI+estimated+year+2018

15
Concluding Comments This study is a first attempt at providing updated cost estimates to benchmark industry standards for processing, cartoning, and transportation costs. The study found that the costs of processing gradable nest run and graded loose eggs are between 43 and 49 cents/dozen including delivery to the store door, but not including loss from store returns. Those findings were in line with an inflation-adjusted cost estimate based on a study done (Bell, 2000) considering industry standards in the year 2000. Despite its methodological limitations, this report is the only updated public source of information about PCT costs known to the authors. It is the intention of the Egg Industry Center to continue updating these estimates in a regular basis (annually or twice a year). The authors do recommend introducing modifications (Appendix 2) to future editions of this survey in order to improve the accuracy, consistency, and representativeness of the answers. Acknowledgments The authors want to acknowledge Dr. Alicia Carriquiry, Iowa State University Distinguished Professor of the Department of Statistics, for her guidance about the best way to analyze this data. Also, a special thanks goes to the egg farmers/processors that collaborated with the study by providing their data. References Bell, D. (2001). An Egg Economic Update: California Egg Processing, Transportation and Marketing Costs - 2000. Retrieved from: http://animalsciencey.ucdavis.edu/avian-files/eeu401.pdf Plastina, A., and A. Johanns. 2019. “Iowa Custom Rate Survey.” Iowa State University Extension and Outreach, Ag Decision Maker File A3-10. Retrieved from: https://www.extension.iastate.edu/agdm/crops/pdf/a3-10.pdf Rice, J. A. (2006). Mathematical Statistics and Data Analysis 3rd edition. Belmont, CA: Thompson Brooks/Cole SAS Institute Inc. 2010. SAS/STAT® 9.22 User’s Guide. Cary, NC: SAS Institute Inc. Snedecor, G. W.; Cochran, W. G. (1989). Statistical Methods 8th edition. Ames, IA: Iowa State University Press Tukey, J.W. (1977). Exploratory data analysis. Reading, MA: Addison-Wesley Pub. Co.

16
Appendix 1. Survey Questionnaire

17
Appendix 2. Future Considerations The authors recommend introducing the following changes to future editions of this survey in order to improve the accuracy, consistency, and representativeness of the answers:
• Attempt to collect region-specific data and increase the number of responses by requesting each company to submit one response per site, or at least per region of operation (six regions in total). The feasibility of this approach and any alternative strategies will need to be vetted.
• Attempt to improve the comparability of responses across survey participants by explicitly
stating the units of measurement for each question, and add a comment field where respondents can explain any transformation, or relevant complementary information, to the reported values. Processors should be consulted about the preferred units of measurement for each cost category (e.g. cents/package or cents/case; cost per dozen, carton, package, etc.).
• Pay special attention to the section on transportation costs by: 1) clarifying the distance assumed for the calculation, and the region where transportation takes place or 2) standardizing the transportation cost questions to pre-set distances, which would likely reduce the variability between answers (but at the expense of information about the actual distance eggs are transported). An alternative approach would be: use the USDA-AMS Agricultural Refrigerated Truck Quarterly Datasets to estimate a standard cost for a region for a pre-set average distance, but this approach suffers from the same limitation as the previous one.
• Reduce the variability in the responses about the grade yield loss and the clustering observed in
the grade yield loss of gradable nest run eggs. This variability might be explained, in part, by different markets with different price structures. For example, according to the Urner Barry quotations in the last six months, the average price between large and medium eggs was 37 cents/dozen in the Midwest, but 46 cents/dozen in the South Central. This difference would yield very different grade yield loss estimates. Another explanation for this might be the use of different methods to estimate grade yield loss. A possible solution for it might be developing a spreadsheet with different prices per region and ask the egg processors to input the proportions of eggs of different sizes or classes obtained from GNR1 (in-line or off-line) and graded loose eggs (large or extra-large).
• Redefine the question regarding store returns to reduce the probability of more than one method
being used to estimate this cost.
• Determine why there were two clear clusters of answers about the USDA certification cost. This could be a result of actual differences by region or processing methods and materials, or might be an indication that this question has to be improved to obtain better results.