egma study
TRANSCRIPT

ABE/LINK MALAWI TEACHER PROFESSIONAL DEVELOPMENT SUPPORT (MTPDS)
MALAWI EARLY GRADE MATHEMATICS ASSESSMENT (EGMA):
National Baseline Report 2010
October, 2011 Prepared by: Aarnout Brombacher
Contract No.: ABE-LINK IQC: EDH-I-04-05-00026-00 This report was prepared for USAID/Malawi and the Ministry of Education, Science and Technology by the Malawi Teacher Professional Development Support (MTPDS) activity implemented by Creative Associates International, Inc., RTI International, and Seward Inc.
2
Table of Contents Table of Contents .................................................................................................................... 2 Acronyms ................................................................................................................................ 4 1. Executive Summary .................................................................................................... 5 2. Introduction ................................................................................................................. 6
2.1 Context: Education in Malawi .......................................................................... 6 3. Early Grade Mathematics Assessment (EGMA) ....................................................... 10
3.1 Subtest Description ........................................................................................ 10 3.2 Adaptation and Pretesting ............................................................................. 12 3.3 Piloting ........................................................................................................... 13 3.4 Sampling and Data Collection ....................................................................... 13 3.5 Weighting of the Data .................................................................................... 15
4. Analysis and Results ................................................................................................. 15 4.1 Overall Test Results ...................................................................................... 15 4.2 Analysis at Subtest Level ............................................................................... 28 4.3 General Observations .................................................................................... 42
5. Conclusion and Recommendations .......................................................................... 42 Annex A: Malawi Early Grade Math Assessment: Student Stimuli Booklet,
October 2010 .............................................................................................................. 1 Annex B: Malawi Early Grade Math Assessment: Student Response Form,
Administrator Instructions and Protocol, October 2010 ............................................... 1
Annexes Annex A: Malawi Early Grade Math Assessment: Student Stimuli Booklet,
October 2010 ..................................................................................................... Annex B: Malawi Early Grade Math Assessment: Student Response Form,
Administrator Instructions and Protocol, October 2010 ..................................... Annex C: Instrument Validity and Reliability. Annex D: Standard Error Tables
3
Index of Tables Table 1. EGMA Sample, by Division and Gender ................................................................. 15 Table 2. Overall Test Result, by Standard ............................................................................ 16 Table 3. Overall Test Result for Standard 2, by Region ....................................................... 17 Table 4. Overall Test Result for Standard 4, by Region ....................................................... 18 Table 5. Overall Test Result for Standard 2, by Gender ....................................................... 19 Table 6. Overall test result for Standard 4 by Gender .......................................................... 19 Table 7. Subtest Average, by Standard ................................................................................ 20 Table 8. Subtest Average for Standards 2 and 4, by Gender ............................................... 22 Table 9. Subtest Average for Standard 2, by Region ........................................................... 22 Table 10. Subtest Average for Standard 4, by Region ......................................................... 23 Table 11. Results of the Oral Counting Subtest, Standards 2 and 4 .................................... 28 Table 12. Results of the One-to-One Correspondence Subtest, by Standard ...................... 30 Table 13. Word Problems: Tools Used and Percentage of Learners Attempting
Problem 4 ...................................................................................................... 35 Table 14. Addition and Subtraction Subtests: Tools Used and Percentage of
Learners Attempting Items ............................................................................ 41 Table 15: Recommendations for Consideration of Policy Makers……………………….……43 Index of Figures Figure 1. Overall Test Result, by Standard ........................................................................... 16 Figure 2. Overall Test Result for Standard 2, by Region ...................................................... 17 Figure 3. Overall Test Result for Standard 4, by Region ...................................................... 18 Figure 4. Overall Test Result for Standard 2, by Gender ...................................................... 19 Figure 5. Overall Test Result for Standard 4, by Gender ...................................................... 20 Figure 6. Comparison of Subtest Average With Overall Average, by Standard ................... 21 Figure 7. Comparison of Subtest Average With Overall Average, by Standard and
Gender .......................................................................................................... 24 Figure 8. Comparison of Subtest Average With Overall Average for Standard 2, by
Region ........................................................................................................... 25 Figure 9. Comparison of Subtest Average With Overall Average for Standard 4, by
Region ........................................................................................................... 26 Figure 10. Results of the Oral Counting Subtest, Standards 2 and 4 ................................... 29 Figure 11. Results of the One-to-One Correspondence Subtest, by Standard ..................... 30 Figure 12. Results of the Number Recognition Subtest, by Standard .................................. 31 Figure 13. Results of the Number Recognition Subtest, by Standard .................................. 32 Figure 14. Results of the Missing Number (Pattern Completion) Subtest, by Standard ....... 34 Figure 15. Results of the Word Problem Subtest, by Standard ............................................ 36 Figure 16. Results of the Addition and Subtraction Subtests, Standard 2 ............................ 39 Figure 17. Results of the Addition and Subtraction Subtests, Standard 4 ............................ 39
4
Acronyms DTED Department of Teacher Education and Development EGMA Early Grade Mathematics Assessment EGRA Early Grade Reading Assessment EMIS Education Management Information System H Hundreds MoEST Ministry of Education, Science and Technology MTPDS Malawi Teacher Professional Development Support T Tens U Units USAID U.S. Agency for International Development
5
1. Executive Summary Funded by the U.S. Agency for International Development (USAID), the Malawi Teacher Professional Development Support (MTPDS) is a 3-year initiative that aims to improve teacher skills and, through that, the performance of learners in schools. One of MTPDS’s responsibilities is to design and implement an assessment of the learners in Malawi. The purposes of the assessment were to investigate the level of math skills of children in Malawi in order to obtain a national level perspective of early numeracy development, to provide baseline data for USAID-Funded MTPDS Program activities, and identify areas of weakness for future decision-making and curricular and pedagogical interventions. Between September and November 2010, MTPDS administered an assessment to measure student skills in early grade mathematics. Assessments were carried out in 50 schools across six divisions. A total of 999 standard 2 and standard 4 learners were assessed.
RTI’s Early Grade Mathematics Assessment (EGMA) instrument was adapted to the Malawian context for use under MTPDS. EGMA does not assess a specific curriculum, such as the National Primary Curriculum (NPC) of Malawi, but instead is designed to provide information on the level of competency in foundational numeracy skill areas. All the competencies measured are shown through research to be highly predictive of later mathematical proficiency and are susceptible to improvement through effective teaching (for more information, see the “EGMA Conceptual Framework” at www.eddataglobal.org). The instrument is administered orally, making it possible to assess children on what they know before they can correctly respond to questions on traditional paper-and-pencil tests. The core components of EGMA include oral counting, one-to-one correspondence (rational counting), number identification, number (quantity) discrimination, missing number (pattern completion), word problems, and basic operations (addition and subtraction).
Overall, the results show the students are performing at levels well below the levels that the Malawian curriculum expects of them. Across the subtests, analysis indicates a large proportion of students appear to be able to answer only the most elementary and procedural of items. The tests did not suggest significant differences in performance across districts or gender (although the Northern district does appear to perform consistently lower than the others).
The picture that the results paint is one of standard 4 students performing better than standard 2 students on all of the subtests and on most items within the subtests. The standard 4 students appear to know more of the answers than the standard 2 students do, yet not doing so with much understanding. Regardless, many students continue to struggle, even in standard 4. It appears any teacher development activities that seek to address the gaps identified by this study would need to pay special attention to the development of understanding (conceptual understanding), reasoning (adaptive reasoning), and application (strategic competence).

6
2. Introduction As part of the MTPDS, it is important to understand how Malawian children are developing early standard numeracy skills. In November 2010, MTPDS conducted a nationally representative baseline of early standard numeracy skills using Malawian- EGMA instrument in 50 schools across 6 divisions. The results of the national baseline follow in this report with the purpose of providing a baseline for USAID-Funded MTPDS Program activities and informing USAID, MoEST and other relevant stakeholders of the current status of early grade numeracy development in Malawi. Additionally, this report was undertaken to provide policy relevant and actionable information regarding the relative effectiveness of various instructional approaches and to identify particular areas of need for further attention and investment by MoEST and the donor community. The hope is that this will allow MoEST, donors and Malawian stakeholders to consider options for next steps for improving early grade numeracy, and importantly ensuring ownership and sustainability of reforms for the country.
. Instrument adaptation was done in collaboration with MoEST officials and representatives from the Department of Teacher Education and Development (DTED), Domasi College of Education, Teacher Training Colleges, Centre for Education, Research and Training, and Centre for Language Studies. All of the people involved in the adaptation process are specialists in numeracy / mathematics and evaluation in the country. EGMA was administered by a group of enumerators who were trained on data collection and assessment procedures, supervised by MTPDS project staff. EGMA was conducted in Chichewa, Tumbuka or Chiyao by enumerators with the relevant language ability, depending on the dominant language of the child being assessed.
The assessment itself has several components (subtests), which have been tested in a variety of other low-income countries. The subtests are described in detail in section 3 of this report. The assessment was pretested at Chimutu School in Lilongwe, Malawi in October 2010 and piloted at Magwero, Mkukula, Lumbadzi and Chinkhuti schools in Lilongwe in early November 2010.
The initial portion of the report explains the design of the various subtests of the assessment and points out how they are related to important characteristics of early mathematics. The test adaptation process, pretesting, and pilot testing stages are then described, followed by a description of the sampling and testing procedures. Afterward, the analysis of results is presented in detail followed by general observations. The report concludes with conclusions and recommendations.
Context: Education in Malawi
The efforts to improve learner performance in schools are spearheaded by strategies which the Government of Malawi has devised through the National Education Sector Plan 2008-2017 (NESP)1. The strategies aim at
1. Expanding equitable access to schooling
1 MoEST (2007) National Education Sector Plan 2007 – 2016. MoEST

7
2. Improving quality and relevance of education to reduce dropout and repetition and promote effective learning and
3. Improving governance and management of the system to enable more effective and efficient delivery of services
These efforts are to be implemented in an environment which requires careful adjustments. Enrolments have soared from 3, 016,972 in 2000 to 3, 868, and 643 in 2010 largely because of the provision of Free Primary Education. This has represented Gross Enrolment Ratios fluctuating around 115% and Net Enrolment Ratios slowly closing to 100% in 2010 although the statistics using age tend to be unreliable due to lack of universal registration of births.
The Gender Parity Index for primary education in Malawi in 2005 was 1.0, indicating that Malawi had gender parity in primary education2. However, the enrolment parity is due to high enrolments in the first four years of school. Girls’ enrolment declines slowly as they move to upper classes especially in rural schools compared to urban locations. For example by the end of the primary cycle in 2005 girls constituted only 34% of the Std 8 enrolment and 44% in 20093.
Teacher learner ratios ranged from 1:71 in 2005 to 1:81 in 2010 but these mask gross differences between rural and urban schools, between districts and between zones. There are also massive discrepancies in the distribution of class size by standards with the largest classes found in standard 1. The NESP plans to reduce the teacher learner ratio progressively to 1: 60 and eventually to 1:40 by 2017. This is expected to be achieved through increased teacher supply.
Class room leaner ratios have ranged from 1:85 to 1:117 in the period from 2005 to 2010 and again the figures represent a wide range of classroom learner ratios and typically classrooms are overcrowded with as many as 200 children per class in the lower classes. Shortages of classrooms compel schools especially in urban areas to hold outdoor classes which pose its own challenges in teaching and learning.
The availability of teaching and learning materials especially text books in schools has been an ongoing problem in primary schools. In 2007 for example only 27.1% of std 6 learners had an English text book, 9.5% shared one textbook , 55.5% learners classes where more than two learners shared a text books and 7.9% had no text book (SACMEQ III)4. The NESP has targeted a textbook learner ratio of 1:1 by the end of the plan period. When learners have text books more time is spend on active learning than on copying notes from the blackboard and teachers can use a wide range of strategies to stimulate classroom interaction.
Absenteeism of learners in Malawian schools is a cause for concern. The Government of Malawi and UNICEF (2008) have recorded leaner absenteeism averaging over 25% in the lower standards on any school day5. This renders teaching very ineffective as a quarter of
2 UNICEF (2005) Gender Achievements and Prospects in Education: The Gap Report Part One. New York, NY: UNICEF. http://www.unicef.org/publications/files/GAP_Report_part1_final_14_Nov.pdf 3 MoEST (2005) Education Statistics 2010 Department of Planning, MoEST.; MoEST (2010) Education Statistics 2010 Department of Planning, MoEST 4 Chimombo, J., Kunje, D., Banda, T. and Milner, G. (2010) SACMEQ III 5 GoM/UNICEF(2008) Sentinel sites surveillance. CERT/MoEST,

8
the learners are not able to follow previous day’s work on any school day.
Grade repetition is rampant and is a feature of the primary school system and contributes to the inefficiency of the primary school sector. In 2010 the repetition rates ranged from 12.8% in standard 7 to 24.6% in standard 1. One of the targets of the NESP/PIF is to reduce these repetition rates to 5% by 2012.
The primary school day in Malawi is much shorter than most countries in the region starting at 7:30am and ending at 10:40am giving time on task close to three hours only. This gives limited time for teachers to give intensive instruction.
All these challenges culminate into learners dropping out of school at various points. In 2010 the dropout rates ranged from 8.9% in standard 6 to 12.7% in standard 1 and these figures vary from year to year. Cohort analyses indicate that 30% of boys and 22.9% of girls survived to standard 8 in 2005 and 53.1% of boys and 45% of girls survived to standard 8 in 2010. It is one of NESP’s priorities to reduce the dropout rates in primary schools. Even with the surviving learners, pass rates in Primary School Leavers’ Certificate Examination (PSLCE) have ranged between 68% and 74%.
Other external factors contribute to the wastage. Rural life is labor intensive and the demand for children to contribute to family income is high. This results in little attention to the need for children to attend school regularly and with appropriate parental support. Over 90% of the population of Malawi live in rural areas and belong to the low socio economic group which in turn affects the schooling of children.
Previous studies on student performance: Over the past decade several studies have been conducted with the aim of providing guidance to policy makers in relation to the provision of primary school. Studies of interest are those that have investigated the factors that affect learners’ performance given the dire situation of schools and a diversity of family backgrounds. Most notably, SACMEQ studies conducted between 1997 and 2007 have been seminal in the policy debates in the country. The studies were conducted to find out:
1. the baseline data for selected factors to primary schools
2. how conditions of primary schools compare with the Ministry’s own standards
3. the extent of equitable allocation of educational inputs in the primary schools
4. the reading levels of grade 6 learners
5. the numeracy levels of Grade 6 learners and
6. which educational factors appear to have the most impact on reading and numeracy achievement among learners.
The studies used standard 6 learners and the results were analyzed by educational division, gender, school location and socio-economic status. The overall results of SACMEQ I (1997), SACMEQ II (2000) and SACMEQ III (2007) were that Malawi consistently performed poorly compared to the other 15 consortium countries and that the reading and numeracy levels were increasing slightly but were always below the regional average6. Also consistent were
6 Milner, G., Chimombo, J., Banda, T and Mchikoma, C (1997) The Quality of Education: Some policy suggestions based on a survey of schools. SACMEQ Policy Research No. 7 Malawi. Paris: IIEP; Chimombo, J.,
9
results on gender with boys performing better than girls, schools located in large cities performing better than those in other locations and favoring learners whose parents belong to the high socio-economic level. There was however no particular pattern for the performance based on Educational Division (Milner et al., 2001; Chimombo et al., 2005; SACMEQ III)
After the introduction of PCAR, the Malawi Institute of Education (MIE) under the auspices of DFID and MoEST carried out a baseline study to find out the performance of learners under the new curriculum7. Data was collected from 12 districts selected from all the six Educational Divisions in the country. The focus was on
1. Assessing the achievement of standard 2 and 5 learners in numeracy and mathematics, Chichewa and English
2. Finding the impact of school and home factors on learner achievement and
3. Determining the challenges being experienced in the implementation of PCAR.
While the validity of the claim to using standard 2 and standard 5 learners was questioned, the mean scores in numeracy and mathematics were above 50% while the mean scores in English and Chichewa were well below 50%. Boys consistently performed better than girls in the three test areas and urban schools performed better than rural schools in all the three test areas. An interesting result from the study was that repetition at this early stage did not seem to enhance learner scores and that teacher’s academic qualification had a positive correlation with learner achievement.
A follow up study by the same MIE was reported in 2010 where the same learners were tested using the same instruments after completing one year in standard 3 and 6. In general the learners performed better in the post test than in the pre-test but most learners were not able to demonstrate the skills they were expected to acquire over the academic year8.
In a parallel study, MoEST conducted a Primary Achievement Sample Survey (PASS) to assess learner achievement levels in English and mathematics in standards 3, 5 and 7 and also assess the impact of school and home factors on leaner achievement9. The study involved 10% of the schools in Malawi and used 10, 067 pupils as a sample. Employing various statistical tests the study found that less than 8% of the learners attained the grade level proficiency and competences expected in standard 3 and none of the learners scored above 50% in standard 5. In standard 7 the results were similar; 95% scored below 50% in English and 99% scored below 50% in mathematics. These results cast doubt on the method used in promoting learners from one standard to the next standard in schools. Head teacher’s experience as head, number of teachers in a school and the qualification of a teacher were found to strongly correlate with learner performance. The socio economic status of parents, age and sex of a learner were also found to be connected with learner achievement. Learner repeating a class was shown not to be helpful in increasing performance in mathematics. Kunje, D., Banda, T. and Mchikoma, C. (2000) The SACMEQ Project in Malawi: A study of the conditions of schooling and the quality of education. Harare: SACMEQ 7 MIE (2008) Assessment of learning achievement in Standards 2 and 5 in English, Mathematics and Chichewa in Malawi Primary Schools. Department of Research, Evaluation and policy studies, MIE 8 Manganga, J., Mwale, L., Mapondera, A. and Saka, T. (2010) Learning Achievement of Standards 3 and 7 Learners in Malawi. MIE 9 MoEST (2010) Primary Achievement Sample Survey: Report. MoEST
10
In another study, Kunje, Meke and Ogawa (2009) investigated how school, classroom and pupil factors influence pupil achievement in mathematics, English and Chichewa in 100 primary schools where tests in the three subjects were administered to 6 000 learners in standards 5 and 710. The results were consistent with findings from the other studies and indicated among others that there was generally low achievement in English and mathematics; greater achievement in urban than rural schools especially in English; better pupil performance in schools with teacher pupil ratios below 50 in standard 7; better pupil performance in classes with trained teachers; and better pupil performance in classes with textbooks in any ratio than those without textbooks. At the upper level, pupils at an appropriate age performed better than over age or underage pupils; boys consistently performed better than girls though the differences were small; pupil’s family socioeconomic status had positive influence on achievement; and mothers’ education was also positively related to performance. The study concluded that basic education with rudimentary structures requires appropriate trained teacher to pupil ratios to promote cognitive growth.
These studies consistently show low performance levels of learners in schools. Results of the early grade mathematics assessment are broadly consistent with these other studies.
3. Early Grade Mathematics Assessment (EGMA) This section briefly explains the background behind the adaptation of the EGMA tool for the Malawian context as well as behind the various subtests to make the analysis more meaningful for the reader.
EGMA consists of a number of subtests developed in response to the extensive research literature on early mathematics learning and evaluation. EGMA does not assess a specific curriculum, such as the National Primary Curriculum (NPC) of Malawi, but instead measures the rate at which students are developing critical early math skills. In addition to being aligned with the core competencies identified in a wide range of international curricula (from both developing and developed countries) the subtests represent a progression of skills that lead toward proficiency in mathematics. Furthermore, they systematically sample and test skills required during the early years and, in so doing, provide an indicator of needs for intervention. The EGMA assessment instruments used in the Malawi 2010 national baseline are included in annex A and B.
3.1 Subtest Description
The EGMA: Malawi tool included the following subtests:
1. Oral counting: The assessment of oral counting fluency targets children’s ability to produce numbers fluently. In this subtest, children are asked to count by rote as far as they can. The score is based on the last correct number the child says previous to making an error or at the end of a minute. This is a timed subtest, since its purpose is to elicit a fluency measure.
10 Kunje, D., Meke, E. and Ogawa, K. (2009) An Investigation of Relationship between School and Pupil Characteristics and Achievement at the Basic Education Level in Malawi. CICE Hiroshima University Journal of International Cooperation in Education Vol. 12 No. 2 pp 33 – 49
11
2. One-to-one correspondence (rational counting): One-to-one correspondence refers to counting objects. The assessment of rational counting targets children’s ability to use two processes working together. The first process is recognizing the items they need to count. The second is to recognize, and mentally tag, those items that have already been counted. The EGMA subtest assesses for enumeration and then cardinality. This is a timed subtest, since its purpose is to elicit a fluency measure. For this subtest, the children were presented with a stimulus sheet (see annex A) with 120 circles, presented as 12 columns, with 10 circles in each column.
3. Number identification: The number identification subtest occurs toward the beginning of the EGMA to establish an understanding of children’s knowledge and identification of written symbols. Here, students orally identify printed number symbols presented in a grid.
4. Number (quantity) discrimination: Number discrimination in EGMA measures children’s ability to make judgments about differences by comparing quantities in object groups. In the case of EGMA, this is done by using numbers. For this subtest, children were given a pair of numbers and asked to declare the larger (higher quantity) number.
5. Missing number (pattern completion): In this subtest, children are shown three or four numbers in a number sequence and a placeholder for a next or missing number. The child is asked to name the missing number.
6. Word problems: Word problems help to analyze children’s informal concepts of addition and subtraction by observing the strategies children use to solve problems presented to them. In the context of EGMA, we do not so much observe the strategies used by the children as evaluate whether or not they are able to make a plan to solve a problem stated in words. The word problems cover the three key addition and subtraction problem types: joining/separating, combining, and comparing.
7. Addition problems: In this subtest, children are presented with two sets of addition items. The first set consists of five items that we would expect the child to be able to calculate mentally and answer fluently. All of the numbers used in this subtest are single-digit and do not involve the bridging through the number 10. The second set, also comprising five items, involves double-digit numbers as well as bridging through tens and, in one case, hundreds. The items are presented in written format. Although it is expected that stronger children in each standard should be able to perform the calculations mentally, they are allowed to use manipulatives (counters) and/or pencil and paper to perform the calculations.
8. Subtraction problems: In this subtest, children are presented with two sets of subtraction items. The first set consists of items that we would expect the child to be able to calculate mentally and answer fluently. The numbers used in this subtest are all single-digit and do not involve bridging through the number 10. The second set, also comprising five items, involves double-digit numbers as well as bridging through tens and, in one case, hundreds. The items are presented in written format. Although it is expected that stronger children in each standard should be able to perform the

12
calculations mentally, they are allowed to use manipulatives (counters) and/or pencil and paper to perform the calculations.
3.2 Adaptation and Pretesting
Adaptation of the EGMA instrument took place in September 2010. The individuals charged with that adaptation were project staff and MoEST officials in the numeracy/mathematics and evaluation departments of DTED, Education Methods and Advisory Services, the Department of Basic Education, the Domasi College of Education, Teacher Training Colleges, and World Relief-CBE. They were led through the adaptation process by Aarnout Brombacher, an MTPDS consultant from South Africa. The assessment as a whole, as well as each of the individual subtests, was studied by participants to assure that the content would be familiar to the children being assessed; the content is aligned to the Malawian curriculum for standards 2 and 4; and the contexts used in word problems are accessible to children in Malawi. All of the questions were translated into Chichewa.
The questions were translated because according to the language policy of Malawi, the language of instruction from standards 1 to 4 is Chichewa. Classroom practices are such that where children struggle teachers may code switch between Chichewa and the more familiar local language to facilitate understanding. For this reason the test administration teams were constituted in such a way that the administrators (see section 3.4) were (as far as possible) able to clarify questions in local languages where necessary. Language does not play a role in the actual test items in EGMA since none of the subtests, with the exception of the word problems subtest, use language in anything but the instruction.
Once adaptation was complete the instruments were pretested the same week as the adaptation process and then piloted at the end of October 2010. The pretest was conducted in one school on the periphery of Lilongwe, selected by the local project workers and ministry officials on the basis that it was as representative of rural schools as possible under the circumstances. The sample was randomly chosen and included 19 children in standard 2, 22 children in standard 3, and 18 children in standard 4. The pretest was administered by the team of Malawians who participated in the adaptation process. The pretest results were analyzed in terms of the items on which the children scored well and poorly as well as in light of the test administrator’s experiences of the children’s responses. The results of the pretest were not evaluated more rigorously because the test was to be piloted more vigorously a few weeks later. The instrument was adapted in a series of small ways as a result of the pretest.

13
3.3 Piloting
The adapted EGMA instrument was piloted at the end of October 2010. Piloting of EGMA was carried out in schools in peri-urban and urban areas of Lilongwe. Four schools were chosen of which two were believed by ministry inspectors to be high-performing and two to be low-performing.11 A total of 250 assessments were collected for children in standard 2 (124 responses) and standard 4 (126 responses) in these schools.
The results of the pilot study were evaluated using a Rasch analysis. This produces a person/item plot that provides insight into both the distribution of the participants and the items across the difficulty continuum. The Rasch analysis highlighted any ceiling effects and/or floor effects.12 It also highlighted particular items that were potentially measuring the same thing, and therefore were redundant, or that were not performing well. Based on the interpretation of the analysis the items on the assessment were refined and finalized.
For more information about the instrument’s validity, reliability, and standard error, see Annexes C and D.
3.4 Sampling and Data Collection
The actual study was conducted during the first 2 weeks of November 2010.
In order to have a complete picture of children’s early mathematics levels, the Malawi EGMA sample included children in standards 2 and 4. At this stage of the year, the children would have been at school for about 2 months of the school year. This sample thus gives us an idea of what children are capable of after 1 year and 1 term and 3 years and 1 term of learning, respectively. According to the Ministry of Education policy for standards 1 to 4, the language of instruction is Chichewa; thus, this was the language of the assessment. That said, as with classroom practice the test administrators were equipped to code-switch into the local languages to assist children in understanding the questions as and where necessary. Again, as mentioned, language does not play a significant role in the actual test items for all but one of the EGMA subtests.
To provide a nationally representative sample of standard 2 and standard 4 learners about 1,000 (999) students were assessed from the 50 schools. Schools were selected at random from a list of all schools in the country provided by the MoEST’s 2009 Education Management Information System (EMIS) database. The sample was random but chosen to reflect regional differences and school sizes. To assure those learners’ schools were evenly
11 Choice of schools with high- or low-performing learners helps ensure the full range of student ability is captured for the grades assessed. Having a good range of student ability increases the chances that the pilot analysis will reveal level of appropriateness and validity.
12 A ceiling effect occurs when test items are not challenging enough for a group of individuals. Because the test has a limited number of difficult items, the higher-performing individuals will have an improved chance to score the highest possible score, which is a problem for two reasons: (1) we do not learn what the limit of the higher-performing individuals is, and (2) if we are using the test to measure impact, then the test will be unable to show improvement even if the higher-performing individuals have improved. As the opposite of the ceiling effect, a floor effect occurs when test items are not easy enough for a group of individuals. Because the test has a limited number of easy items, the lower-performing individuals will be unable to score on the test. In this case, we do not learn what the low-performing individuals are capable of learning.
14
spread out across the country the sample list was stratified by division and district. The sampling process used was systematic random sampling, proportional to population. Proportional-to-population sampling assures the sample reflects the way the population of learners is apportioned to schools. Within the school, the assessment was given to a random sample of 20 learners that included approximately 10 girls (5 each from standards 2 and 4) and 10 boys (5 each from standards 2 and 4), the resulting learner distribution between standards and genders was approximately even.
As this was a nationally representative sample, table 1 shows the sample spread across divisions. The sample was drawn based on how students are allocated to schools. Differences can be seen in the number of students assessed in the Central Western (28 learners) division compared with the other divisions (139–160 learners)—this division has more students in schools than the others.
Sample Limitations. The sample was not designed to detect differences between subgroups such as urban and rural, or between regions. The focus of the study was to provide a general picture of the development (and weaknesses) of basic competency in foundational literacy and math skills in the early grades in the general population. To be sure to capture statistical differences in the subgroups of division and gender (especially by grade) the sample would need to be larger (roughly doubled for each subgroup added). However, the statistical differences reported in this study are at the 95% confidence level, meaning that there is only a 5% or less chance that the results obtained occurred by chance rather than representing the true population.

15
Table 1. EGMA Sample, by Division and Gender
Standard 2 Standard 4
Male Female Male Female Total
Central East 34 36 36 33 139
Central West 74 66 70 70 280
Northern 35 35 36 35 141
Shire Highlands 37 33 35 32 137
South East 40 40 40 40 160
South West 36 34 35 34 139
Total 256 244 252 244 996
Teams of enumerators were led by supervisors selected from the Teacher Training Colleges, Centre for Language Studies, and Centre for Education, Research and Training, and monitored by officials from MoEST, the Malawi Nations Examinations Board, the Department for Education Methods and Advisory Services, and the Malawi Institute of Education. Testing was completed during a one-day visit to each school. At each school, learners completed two assessments (reading and math). The content of EGMA and the language of administration were in Chichewa; however, language speakers of other major language groups were sent to regions where they could more easily communicate with children if there were communication barriers. Students were chosen randomly from class registers provided by the teacher or school director and were called to the assessment area by the supervisor.
3.5 Weighting of the Data
In this study, for cost and efficiency reasons, the sample was not a simple random sample of the population of students in each group of interest. In order to enable the making of inferences about the performance of the entire population (and not just those sampled), the results were weighted. The study results, including frequencies and percentages, should therefore be interpreted as representative of the students in Malawi.
4. Analysis and Results In this section, we present the findings of our analysis of the data.
4.1 Overall Test Results
The EGMA instrument used in this study consisted of a number of subtests. The first two subtests, oral counting and one-to-one correspondence (rational counting), do not produce a correct/incorrect response but rather a measure of the extent to which a child can count in each of these ways. Although these subtests are important and the findings discussed later in the report, performance on these subtests cannot be included in the calculation of an overall result.
16
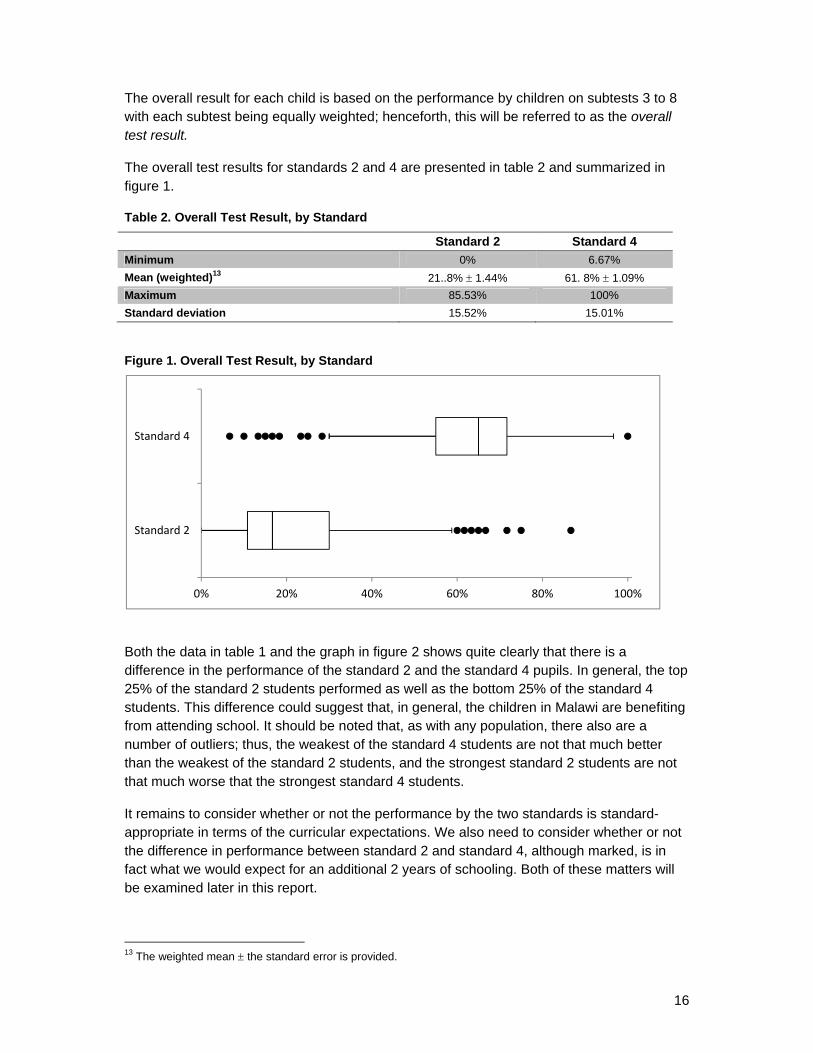
The overall result for each child is based on the performance by children on subtests 3 to 8 with each subtest being equally weighted; henceforth, this will be referred to as the overall test result.
The overall test results for standards 2 and 4 are presented in table 2 and summarized in figure 1.
Table 2. Overall Test Result, by Standard
Standard 2 Standard 4
Minimum 0% 6.67%
Mean (weighted)13 21..8% 1.44% 61. 8% 1.09%
Maximum 85.53% 100%
Standard deviation 15.52% 15.01%
Figure 1. Overall Test Result, by Standard
Both the data in table 1 and the graph in figure 2 shows quite clearly that there is a difference in the performance of the standard 2 and the standard 4 pupils. In general, the top 25% of the standard 2 students performed as well as the bottom 25% of the standard 4 students. This difference could suggest that, in general, the children in Malawi are benefiting from attending school. It should be noted that, as with any population, there also are a number of outliers; thus, the weakest of the standard 4 students are not that much better than the weakest of the standard 2 students, and the strongest standard 2 students are not that much worse that the strongest standard 4 students.
It remains to consider whether or not the performance by the two standards is standard-appropriate in terms of the curricular expectations. We also need to consider whether or not the difference in performance between standard 2 and standard 4, although marked, is in fact what we would expect for an additional 2 years of schooling. Both of these matters will be examined later in this report.
13 The weighted mean the standard error is provided.
0% 20% 40% 60% 80% 100%
Standard 2
Standard 4
17
More than 75% of the standard 2 pupils are performing below 30% on a test of basic/foundational mathematics skills must already be considered a source of some concern.
4.1.1 Overall Test Results by Region and Gender
Before continuing with more detailed analysis it is worth exploring if there are significant differences in performance by region and/or by gender.
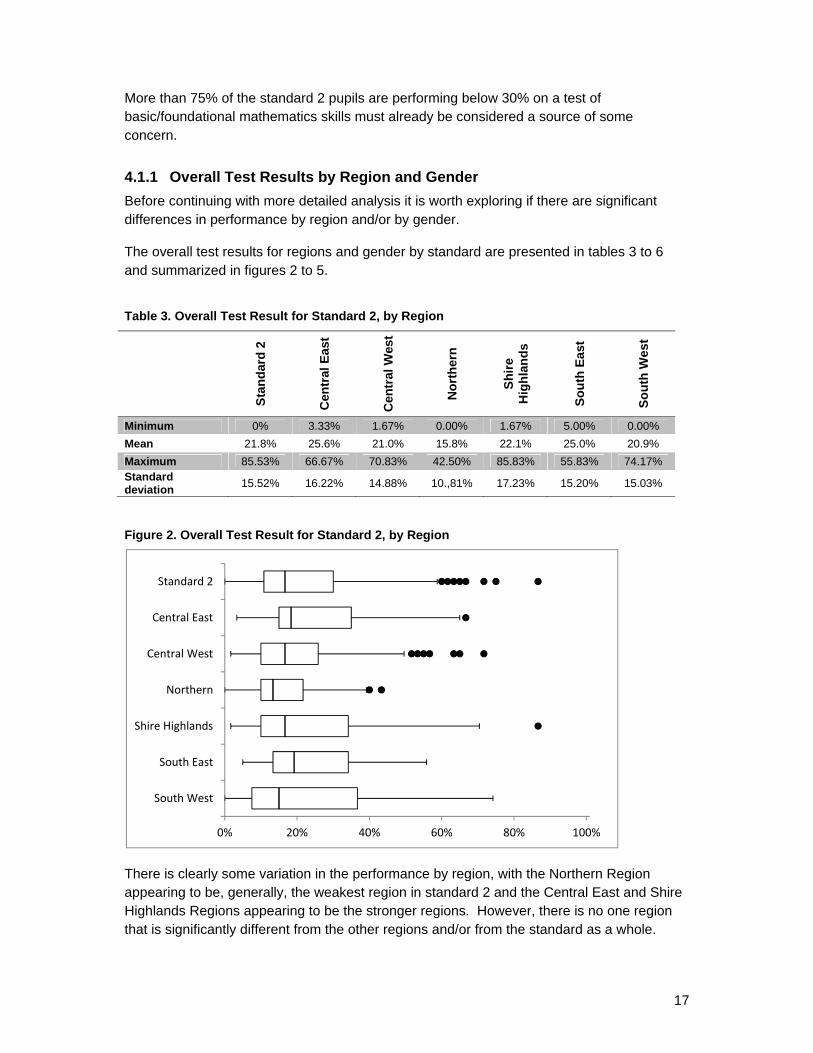
The overall test results for regions and gender by standard are presented in tables 3 to 6 and summarized in figures 2 to 5.
Table 3. Overall Test Result for Standard 2, by Region
Sta
nd
ard
2
Cen
tral
Eas
t
Cen
tral
Wes
t
No
rth
ern
Sh
ire
Hig
hla
nd
s
So
uth
Eas
t
So
uth
Wes
t
Minimum 0% 3.33% 1.67% 0.00% 1.67% 5.00% 0.00%
Mean 21.8% 25.6% 21.0% 15.8% 22.1% 25.0% 20.9%
Maximum 85.53% 66.67% 70.83% 42.50% 85.83% 55.83% 74.17% Standard deviation
15.52% 16.22% 14.88% 10.,81% 17.23% 15.20% 15.03%
Figure 2. Overall Test Result for Standard 2, by Region
There is clearly some variation in the performance by region, with the Northern Region appearing to be, generally, the weakest region in standard 2 and the Central East and Shire Highlands Regions appearing to be the stronger regions. However, there is no one region that is significantly different from the other regions and/or from the standard as a whole.
0% 20% 40% 60% 80% 100%
Standard 2
Central East
Central West
Northern
Shire Highlands
South East
South West
18
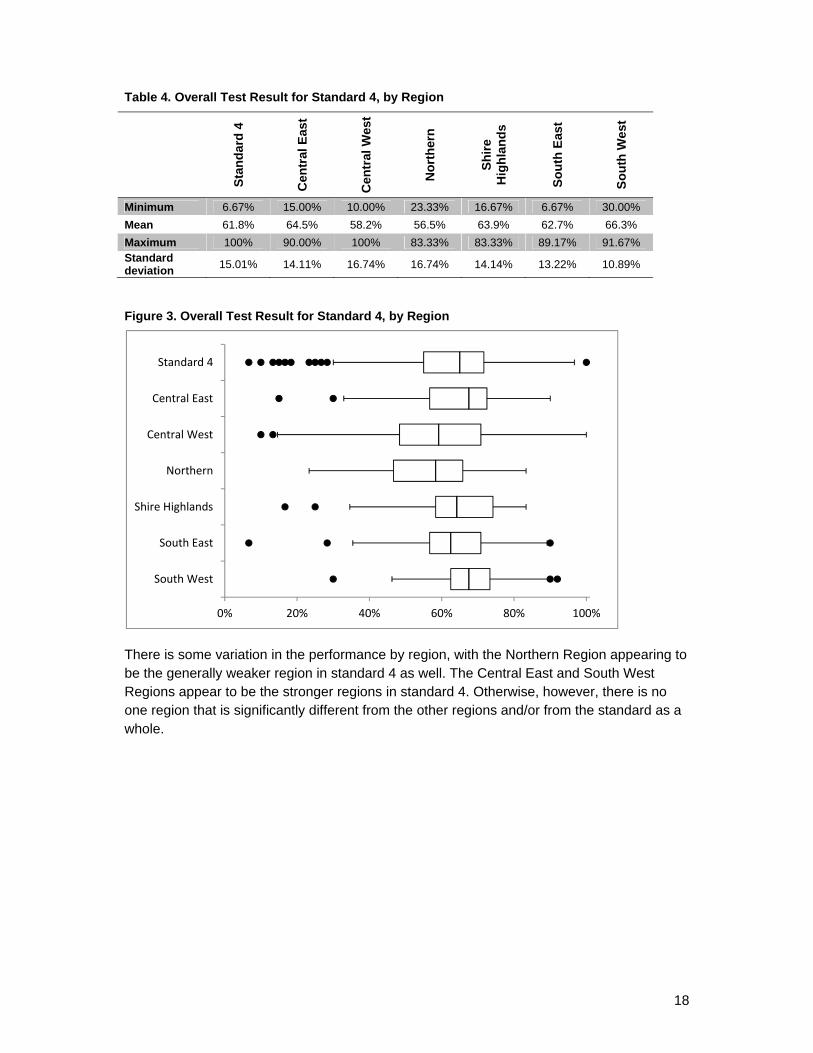
Table 4. Overall Test Result for Standard 4, by Region
Sta
nd
ard
4
Cen
tral
Eas
t
Cen
tral
Wes
t
No
rth
ern
Sh
ire
Hig
hla
nd
s
So
uth
Eas
t
So
uth
Wes
t
Minimum 6.67% 15.00% 10.00% 23.33% 16.67% 6.67% 30.00%
Mean 61.8% 64.5% 58.2% 56.5% 63.9% 62.7% 66.3%
Maximum 100% 90.00% 100% 83.33% 83.33% 89.17% 91.67% Standard deviation
15.01% 14.11% 16.74% 16.74% 14.14% 13.22% 10.89%
Figure 3. Overall Test Result for Standard 4, by Region
There is some variation in the performance by region, with the Northern Region appearing to be the generally weaker region in standard 4 as well. The Central East and South West Regions appear to be the stronger regions in standard 4. Otherwise, however, there is no one region that is significantly different from the other regions and/or from the standard as a whole.
0% 20% 40% 60% 80% 100%
Standard 4
Central East
Central West
Northern
Shire Highlands
South East
South West

19
Table 5. Overall Test Result for Standard 2, by Gender
Sta
nd
ard
2
Mal
e
Fem
ale
Minimum 0% 0.00% 0.00%
Mean 21.8% 21.4% 22.3%
Maximum 85.53% 74.17% 85.83% Standard deviation
15.52% 15.90% 15.10%
Figure 4. Overall Test Result for Standard 2, by Gender
For standard 2 students, while there is a slight variation in the overall test performance by gender, neither gender was significantly different from the other and/or from the standard as a whole.
Table 6. Overall test result for Standard 4 by Gender
Sta
nd
ard
4
Mal
e
Fem
ale
Minimum 6.67% 6.67% 13.33%
Mean 61.8% 63.0% 60.7%
Maximum 100% 100% 90.00% Standard deviation
15.01% 15.46% 14.47%
0% 20% 40% 60% 80% 100%
Standard 2
Male
Female

20
Figure 5. Overall Test Result for Standard 4, by Gender
As with the standard 2 students, there is a slight variation in the overall test performance by gender. Also, as with the standard 2 students, neither gender was significantly different from the other and/or from the standard as a whole.
In terms of overall performance, there does not appear to be a significant difference in performance by region and/or by standard. The only significant difference in overall performance is evident at the individual standard level.
4.1.2 Overall Test Mean Compared With the Subtest Means by Standard, Region and Gender
In this section, we compare the overall test average with the average performance on each of the subtests. We first do so by standard (table 7 and figure 6), then by standard and region (tables 8 and 9 and figures 7 and 8), and finally by standard and gender (table 10 and figure 9).
Table 7. Subtest Average, by Standard
Standard 2 Standard 4
Number recognition 20.5% 74.1%
Quantity discrimination 48.7% 81.8%
Pattern completion 11.1% 39.1%
Word problems 20.6% 60.5%
Addition (Level 1) 25.4% 85.4%
Addition (Level 2) 8.5% 35.6%
Subtraction (Level 1) 19.5% 76.2%
Subtraction (Level 2) 6.6% 36.3%
Total 21.8% 61.8%
0% 20% 40% 60% 80% 100%
Standard 4
Male
Female
21
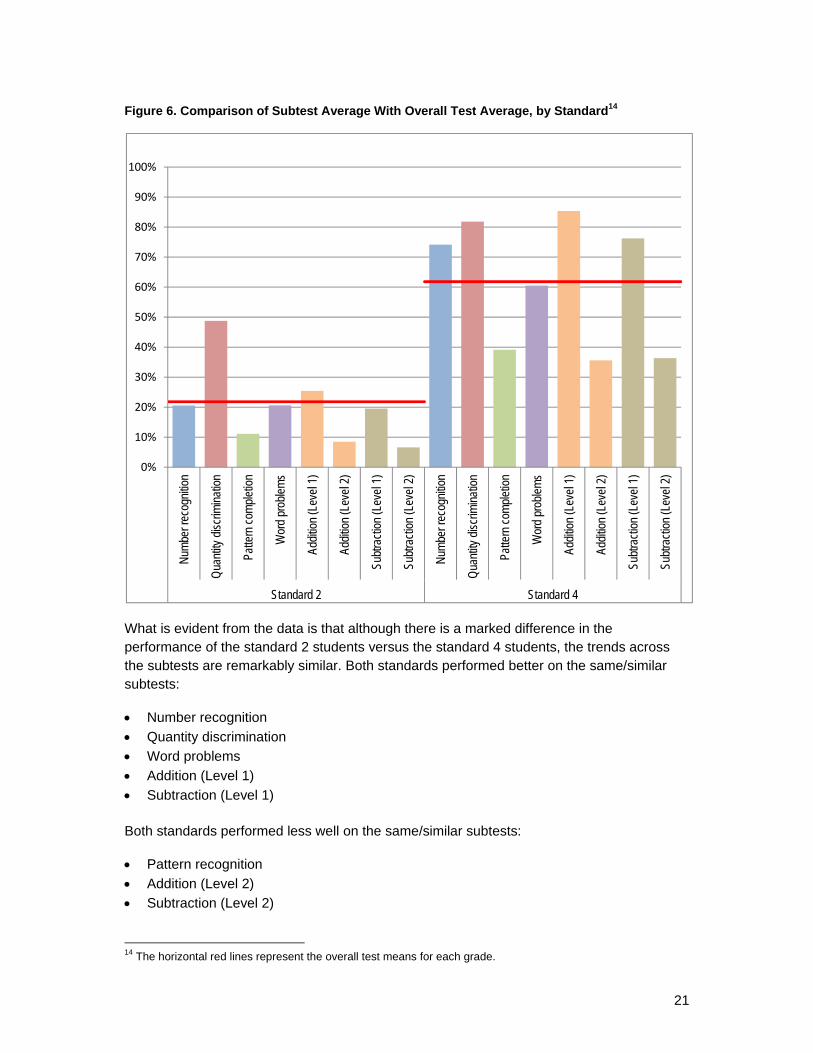
Figure 6. Comparison of Subtest Average With Overall Test Average, by Standard14
What is evident from the data is that although there is a marked difference in the performance of the standard 2 students versus the standard 4 students, the trends across the subtests are remarkably similar. Both standards performed better on the same/similar subtests:
Number recognition
Quantity discrimination
Word problems
Addition (Level 1)
Subtraction (Level 1)
Both standards performed less well on the same/similar subtests:
Pattern recognition
Addition (Level 2)
Subtraction (Level 2)
14 The horizontal red lines represent the overall test means for each grade.
0%
10%
20%
30%
40%
50%
60%
70%
80%
90%
100%
Num
ber r
ecog
nitio
n
Qua
ntity
dis
crim
inat
ion
Patte
rn c
ompl
etio
n
Wor
d pr
oble
ms
Addi
tion
(Lev
el 1
)
Addi
tion
(Lev
el 2
)
Subt
ract
ion
(Lev
el 1
)
Subt
ract
ion
(Lev
el 2
)
Num
ber r
ecog
nitio
n
Qua
ntity
dis
crim
inat
ion
Patte
rn c
ompl
etio
n
Wor
d pr
oble
ms
Addi
tion
(Lev
el 1
)
Addi
tion
(Lev
el 2
)
Subt
ract
ion
(Lev
el 1
)
Subt
ract
ion
(Lev
el 2
)
Standard 2 Standard 4

22
Table 8. Subtest Average for Standards 2 and 4, by Gender
Sta
nd
ard
2
Sta
nd
ard
2
Mal
e
Sta
nd
ard
2
Fem
ale
Sta
nd
ard
4
Sta
nd
ard
4
Mal
e
Sta
nd
ard
4
Fem
ale
Number recognition 20.5% 19.4% 21.7% 74.1% 75.7% 72.5%
Quantity discrimination 48.7% 45.5% 52.3% 81.8% 82.7% 80.9%
Pattern completion 11.1% 11.2% 11.0% 39.1% 39.5% 38.8%
Word problems 20.6% 20.5% 20.8% 60.5% 61.8% 59.0%
Addition (Level 1) 25.4% 27.6% 23.2% 85.4% 86.4% 84.4%
Addition (Level 2) 8.5% 8.1% 8.9% 35.6% 37.0% 34.1%
Subtraction (Level 1) 19.5% 21.2% 17.9% 76.2% 76.2% 76.2%
Subtraction (Level 2) 6.6% 6.6% 6.6% 36.3% 38.6% 34.0%
Total 21.8% 21.4% 22.3% 61.8% 63.0% 60.7%
In the case of gender differences we were asked to investigate if there is an increasing disparity by gender from standard 2 to standard 4 since the table may suggest the possibility given that the absolute differences in the male and female averages appear to increase. Firstly it should be noted that while the difference in male and female averages is in absolute terms greater, it is in relative terms actually smaller. That noted the administration of a t-test indicates quite clearly that there is no evidence of a statistically significant difference in the performance of the males and females at either standard level and hence of disparity (increasing or otherwise). The t-score for standard 2: t = 1.1264 and t-score for standard 4: t
= 1.7866 the t-score in both cases become statistically significant at the 1.960 level.
Table 9. Subtest Average for Standard 2, by Region15
Sta
nd
ard
2
Cen
tral
Eas
t
Cen
tral
Wes
t
No
rth
ern
Sh
ire
Hig
hla
nd
s
So
uth
Eas
t
So
uth
Wes
t
Number recognition 20.5% 25.1% 18.9% 14.6% 21.4% 23.8% 19.8%
Quantity discrimination 48.7% 50.8% 49.9% 45.6% 51.3% 51.7% 42.7%
Pattern completion 11.1% 14.0% 10.7% 3.6% 8.9% 14.7% 12.9%
Word problems 20.6% 26.5% 22.3% 13.9% 16.6% 24.1% 16.9%
Addition (Level 1) 25.4% 34.9% 23.0% 14.3% 26.2% 30.2% 24.0%
Addition (Level 2) 8.5% 10.2% 7.2% 5.7% 7.9% 12.6% 7.8%
Subtraction (Level 1) 19.5% 25.4% 15.9% 11.9% 21.4% 22.2% 21.9%
Subtraction (Level 2) 6.6% 6.1% 6.1% 2.2% 8.0% 8.3% 8.5%
Total 21.8% 25.6% 21.0% 15.8% 22.1% 25.0% 20.9%
15 In as much as language may have played a role, it is advisable to be cautious about over interpreting the consistently poorer performance by the Northern Region.
23
Table 10. Subtest Average for Standard 4, by Region
Sta
nd
ard
4
Cen
tral
Eas
t
Cen
tral
Wes
t
No
rth
ern
Sh
ire
Hig
hla
nd
s
So
uth
Eas
t
So
uth
Wes
t
Number recognition 74.1% 77.2% 67.7% 70.8% 81.7% 77.4% 76.2%
Quantity discrimination 81.8% 82.6% 79.8% 75.4% 85.6% 83.3% 84.1%
Pattern completion 39.1% 46.1% 33.0% 23,7% 47,8% 39,9% 45.0%
Word problems 60.5% 64.1% 57.7% 58.3% 57.0% 59.5% 66.2%
Addition (Level 1) 85.4% 88.0% 80.3% 82.4% 86.8% 88.0% 89.8%
Addition (Level 2) 35.6% 35.9% 33.8% 35.8% 30.7% 37.8% 39.4%
Subtraction (Level 1) 76.2% 78.1% 72.1% 68.9% 83.2% 71.1% 85.1%
Subtraction (Level 2) 36.3% 33.6% 36.7% 33.8% 32.9% 35.5% 42.5%
Total 61.8% 64.5% 58.2% 56.5% 63.9% 62.7% 66.3%
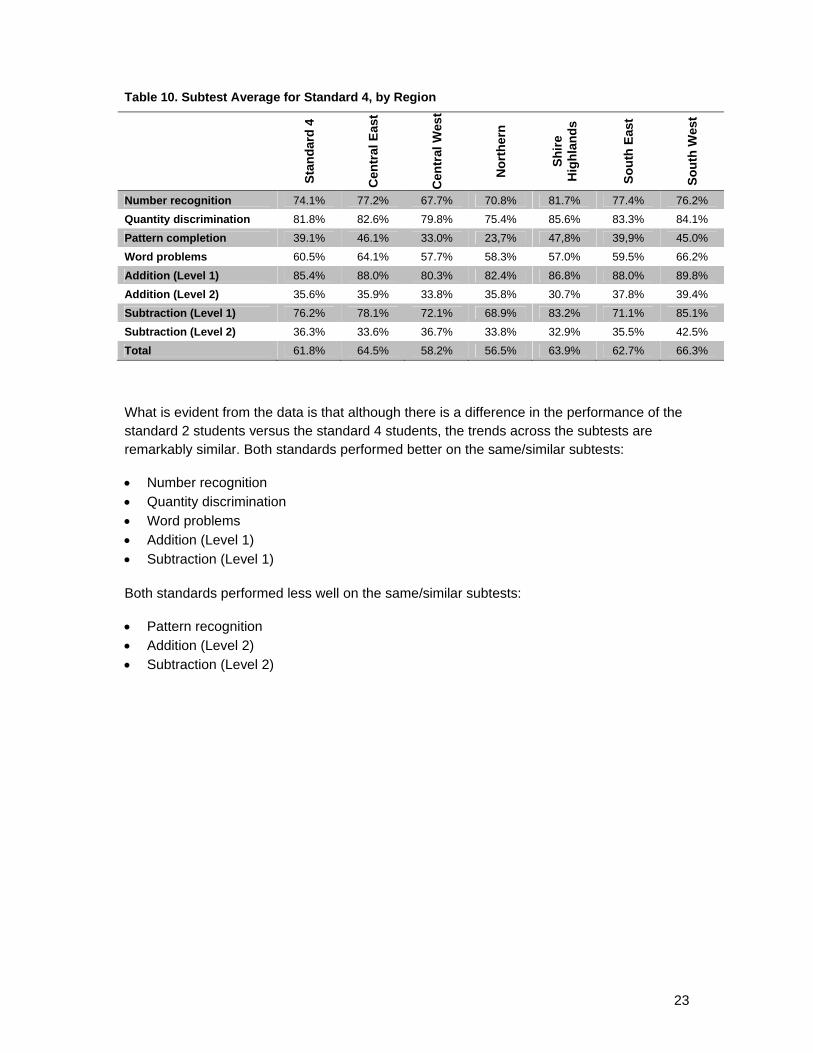
What is evident from the data is that although there is a difference in the performance of the standard 2 students versus the standard 4 students, the trends across the subtests are remarkably similar. Both standards performed better on the same/similar subtests:
Number recognition Quantity discrimination Word problems Addition (Level 1) Subtraction (Level 1) Both standards performed less well on the same/similar subtests:
Pattern recognition Addition (Level 2) Subtraction (Level 2)

24
Figure 7. Comparison of Subtest Average with Overall Average, by Standard and Gender16
16 The horizontal red line represents the overall test means for each gender. The horizontal blue lines represent the overall test averages for each grade.
0%
10%
20%
30%
40%
50%
60%
70%
80%
90%
100%N
umbe
r rec
ogni
tion
Qua
ntity
dis
crim
inat
ion
Patte
rn c
ompl
etio
n
Wor
d pr
oble
ms
Addi
tion
(Lev
el 1
)
Addi
tion
(Lev
el 2
)
Subt
ract
ion
(Lev
el 1
)
Subt
ract
ion
(Lev
el 2
)
Num
ber r
ecog
nitio
n
Qua
ntity
dis
crim
inat
ion
Patte
rn c
ompl
etio
n
Wor
d pr
oble
ms
Addi
tion
(Lev
el 1
)
Addi
tion
(Lev
el 2
)
Subt
ract
ion
(Lev
el 1
)
Subt
ract
ion
(Lev
el 2
)
Num
ber r
ecog
nitio
n
Qua
ntity
dis
crim
inat
ion
Patte
rn c
ompl
etio
n
Wor
d pr
oble
ms
Addi
tion
(Lev
el 1
)
Addi
tion
(Lev
el 2
)
Subt
ract
ion
(Lev
el 1
)
Subt
ract
ion
(Lev
el 2
)
Num
ber r
ecog
nitio
n
Qua
ntity
dis
crim
inat
ion
Patte
rn c
ompl
etio
n
Wor
d pr
oble
ms
Addi
tion
(Lev
el 1
)
Addi
tion
(Lev
el 2
)
Subt
ract
ion
(Lev
el 1
)
Subt
ract
ion
(Lev
el 2
)
Standard 2 Male Standard 2 Female Standard 4 Male Standard 4 Female
25
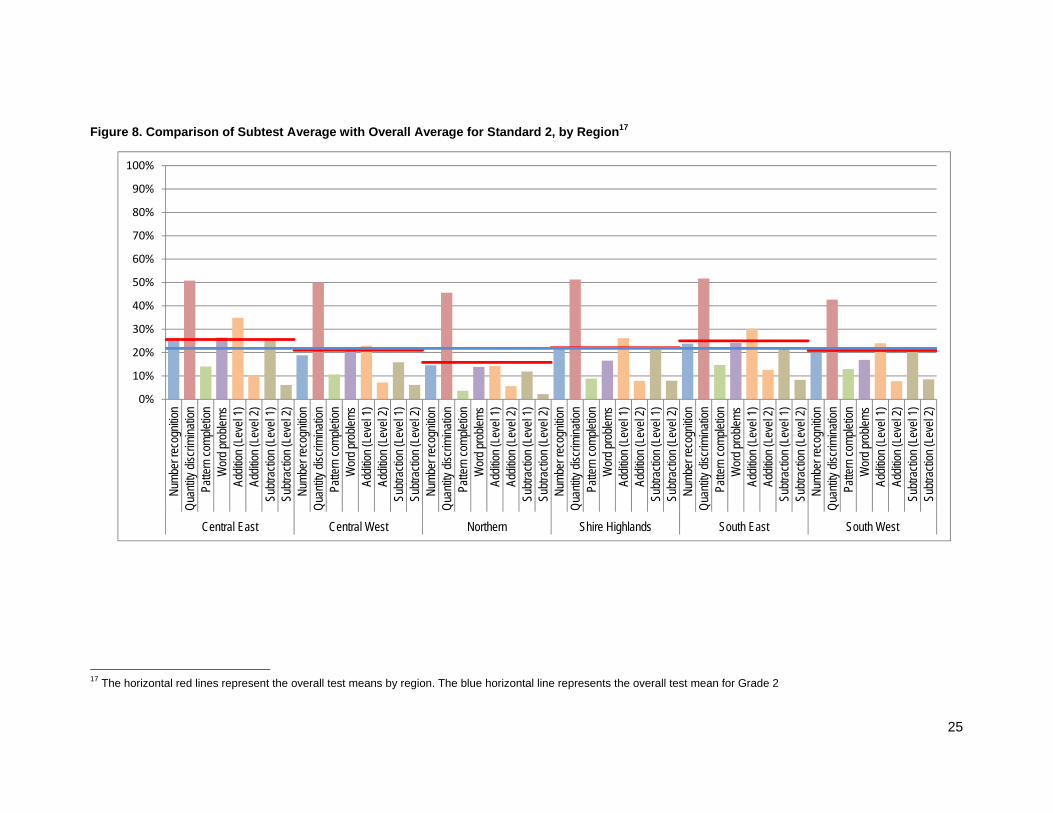
Figure 8. Comparison of Subtest Average with Overall Average for Standard 2, by Region17
17 The horizontal red lines represent the overall test means by region. The blue horizontal line represents the overall test mean for Grade 2
0%
10%
20%
30%
40%
50%
60%
70%
80%
90%
100%N
umbe
r rec
ogni
tion
Qua
ntity
dis
crim
inat
ion
Patte
rn c
ompl
etio
nW
ord
prob
lem
sAd
ditio
n (L
evel
1)
Addi
tion
(Lev
el 2
)Su
btra
ctio
n (L
evel
1)
Subt
ract
ion
(Lev
el 2
)N
umbe
r rec
ogni
tion
Qua
ntity
dis
crim
inat
ion
Patte
rn c
ompl
etio
nW
ord
prob
lem
sAd
ditio
n (L
evel
1)
Addi
tion
(Lev
el 2
)Su
btra
ctio
n (L
evel
1)
Subt
ract
ion
(Lev
el 2
)N
umbe
r rec
ogni
tion
Qua
ntity
dis
crim
inat
ion
Patte
rn c
ompl
etio
nW
ord
prob
lem
sAd
ditio
n (L
evel
1)
Addi
tion
(Lev
el 2
)Su
btra
ctio
n (L
evel
1)
Subt
ract
ion
(Lev
el 2
)N
umbe
r rec
ogni
tion
Qua
ntity
dis
crim
inat
ion
Patte
rn c
ompl
etio
nW
ord
prob
lem
sAd
ditio
n (L
evel
1)
Addi
tion
(Lev
el 2
)Su
btra
ctio
n (L
evel
1)
Subt
ract
ion
(Lev
el 2
)N
umbe
r rec
ogni
tion
Qua
ntity
dis
crim
inat
ion
Patte
rn c
ompl
etio
nW
ord
prob
lem
sAd
ditio
n (L
evel
1)
Addi
tion
(Lev
el 2
)Su
btra
ctio
n (L
evel
1)
Subt
ract
ion
(Lev
el 2
)N
umbe
r rec
ogni
tion
Qua
ntity
dis
crim
inat
ion
Patte
rn c
ompl
etio
nW
ord
prob
lem
sAd
ditio
n (L
evel
1)
Addi
tion
(Lev
el 2
)Su
btra
ctio
n (L
evel
1)
Subt
ract
ion
(Lev
el 2
)
Central East Central West Northern Shire Highlands South East South West

26
Figure 9. Comparison of Subtest Average With Overall Average for Standard 4, by Region18
18 The horizontal red lines represent the overall test means by region. The blue horizontal line represents the overall test mean for Grade 4.
0%
10%
20%
30%
40%
50%
60%
70%
80%
90%
100%N
umbe
r rec
ogni
tion
Qua
ntity
dis
crim
inat
ion
Patte
rn c
ompl
etio
nW
ord
prob
lem
sAd
ditio
n (L
evel
1)
Addi
tion
(Lev
el 2
)Su
btra
ctio
n (L
evel
1)
Subt
ract
ion
(Lev
el 2
)N
umbe
r rec
ogni
tion
Qua
ntity
dis
crim
inat
ion
Patte
rn c
ompl
etio
nW
ord
prob
lem
sAd
ditio
n (L
evel
1)
Addi
tion
(Lev
el 2
)Su
btra
ctio
n (L
evel
1)
Subt
ract
ion
(Lev
el 2
)N
umbe
r rec
ogni
tion
Qua
ntity
dis
crim
inat
ion
Patte
rn c
ompl
etio
nW
ord
prob
lem
sAd
ditio
n (L
evel
1)
Addi
tion
(Lev
el 2
)Su
btra
ctio
n (L
evel
1)
Subt
ract
ion
(Lev
el 2
)N
umbe
r rec
ogni
tion
Qua
ntity
dis
crim
inat
ion
Patte
rn c
ompl
etio
nW
ord
prob
lem
sAd
ditio
n (L
evel
1)
Addi
tion
(Lev
el 2
)Su
btra
ctio
n (L
evel
1)
Subt
ract
ion
(Lev
el 2
)N
umbe
r rec
ogni
tion
Qua
ntity
dis
crim
inat
ion
Patte
rn c
ompl
etio
nW
ord
prob
lem
sAd
ditio
n (L
evel
1)
Addi
tion
(Lev
el 2
)Su
btra
ctio
n (L
evel
1)
Subt
ract
ion
(Lev
el 2
)N
umbe
r rec
ogni
tion
Qua
ntity
dis
crim
inat
ion
Patte
rn c
ompl
etio
nW
ord
prob
lem
sAd
ditio
n (L
evel
1)
Addi
tion
(Lev
el 2
)Su
btra
ctio
n (L
evel
1)
Subt
ract
ion
(Lev
el 2
)
Central East Central West Northern Shire Highlands South East South West

27
The data summarized in the tables and represented by the graphs underscore the observations made based on the overall test data, namely that:
apart from some variation across the regions and the genders, there was no significant difference in the performance of the genders or regions at either standard level; and the northern region, which performed most poorly across the standards on overall test score, also performed most poorly on all of the subtests at the standard 2 level and on most subtests at the standard 4 level. In terms of the trends observed across the subtests at the standard level, we again observe that within acceptable variation the performance on the following subtests was better for both regions and genders:
Number recognition
Quantity discrimination
Word problems
Addition (Level 1)
Subtraction (Level 1)
For the regional and gender analyses performance was poorer on the same/similar subtests:19
Pattern recognition
Addition (Level 2)
Subtraction (Level 2)
Std
2
Std
2
Mal
e
Std
2
Fem
ale
(mal
e -
fem
ale)
/ave
rag
e
Std
4
Std
4
Mal
e
Std
4
Fem
ale
(mal
e -
fem
ale)
/ave
rag
e
Number recognition 20,50% 19,40% 21,70% -11,22% 74,10% 75,70% 72,50% 4,32% Quantity discrimination 48,70% 45,50% 52,30% -13,96% 81,80% 82,70% 80,90% 2,20% Pattern completion 11,10% 11,20% 11,00% 1,80% 39,10% 39,50% 38,80% 1,79% Word problems 20,60% 20,50% 20,80% -1,46% 60,50% 61,80% 59,00% 4,63% Addition (Level 1) 25,40% 27,60% 23,20% 17,32% 85,40% 86,40% 84,40% 2,34% Addition (Level 2) 8,50% 8,10% 8,90% -9,41% 35,60% 37,00% 34,10% 8,15% Subtraction (Level 1) 19,50% 21,20% 17,90% 16,92% 76,20% 76,20% 76,20% 0,00% Subtraction (Level 2) 6,60% 6,60% 6,60% 0,00% 36,30% 38,60% 34,00% 12,67%
Total 21,80% 21,40% 22,30% -4,13% 61,80% 63,00% 60,70% 3,72%
19 When calculating the difference between male and females in terms of raw difference, the disparity appears to be getting greater. However, if the differences are expressed as a percentage of the average for the standard as a whole, then is gets smaller. The difference in Standard 2 fluctuates (sometimes the males are ahead and sometimes the females are ahead), in Standard 4 the boys appear to be ahead in all cases. Determining how statistically significant would require further analysis beyond the scope of this report. MTPDS does not believe that it indicates an increasing, or at least alarming, disparity.
28
In summary, there is no strong evidence to suggest that the regions (with the possible exception of the Northern Region) and/or the genders performed markedly differently from the overall performance and/or trend across the subtests at each standard level.
In the case of the Northern Region, we should be sensitive to the possibility that the consistently poorer performance may, in part, be attributed to language issues. The instructions of the test items were presented in Chichewa and mediated in the local languages as it was found to be necessary by the administrators. And, in as much as the EGMA items are largely language independent (with the possible exception of the word problems subtest), the possibility still remains that language did play a role. The analysis of the data is unable to disaggregate or distinguish between mathematical performance alone and the possible impact of language.
It should also be noted that the performance is, in general, low when compared to both the expectation of the Malawi curriculum for mathematics and the international literature on expectations of performance by children in these standards. The point being that the focus of attention in responding to the data should rather be on the more general results than on the analysis of possible gender and/or regional differences since these are, if they exist, less concerning at this stage than the rather worrying overall picture.
4.2 Analysis at Subtest Level
We turn our attention now to the analysis of the performance at the subtest level. We will consider each subtest one by one, comparing performance at the subtest level with the overall average and comparing the performance on each of the items in the subtest with the subtest average. For each subtest, we will make comments on the implications for an intervention program. These recommendations are informed throughout by both international good practice in mathematics teaching and the awareness of the Malawian context and Malawian realities as communicated by the members of the MTPDS team.
4.2.1 Oral Counting
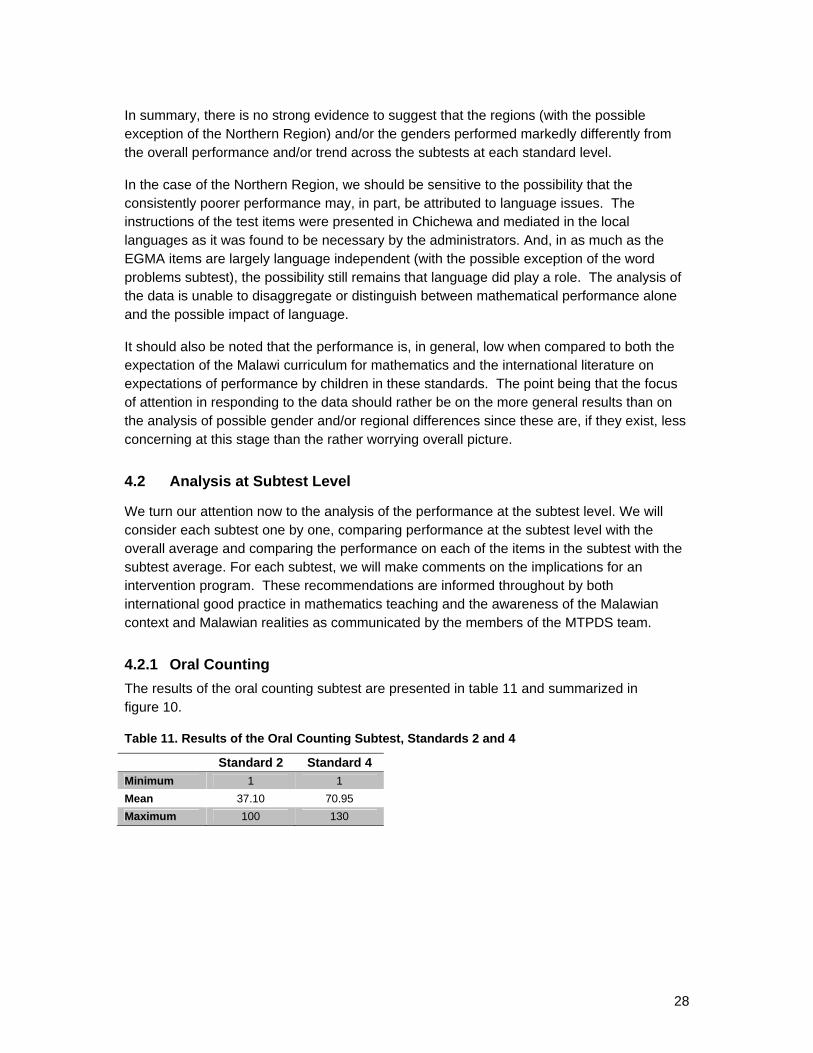
The results of the oral counting subtest are presented in table 11 and summarized in figure 10.
Table 11. Results of the Oral Counting Subtest, Standards 2 and 4
Standard 2 Standard 4
Minimum 1 1
Mean 37.10 70.95
Maximum 100 130
29
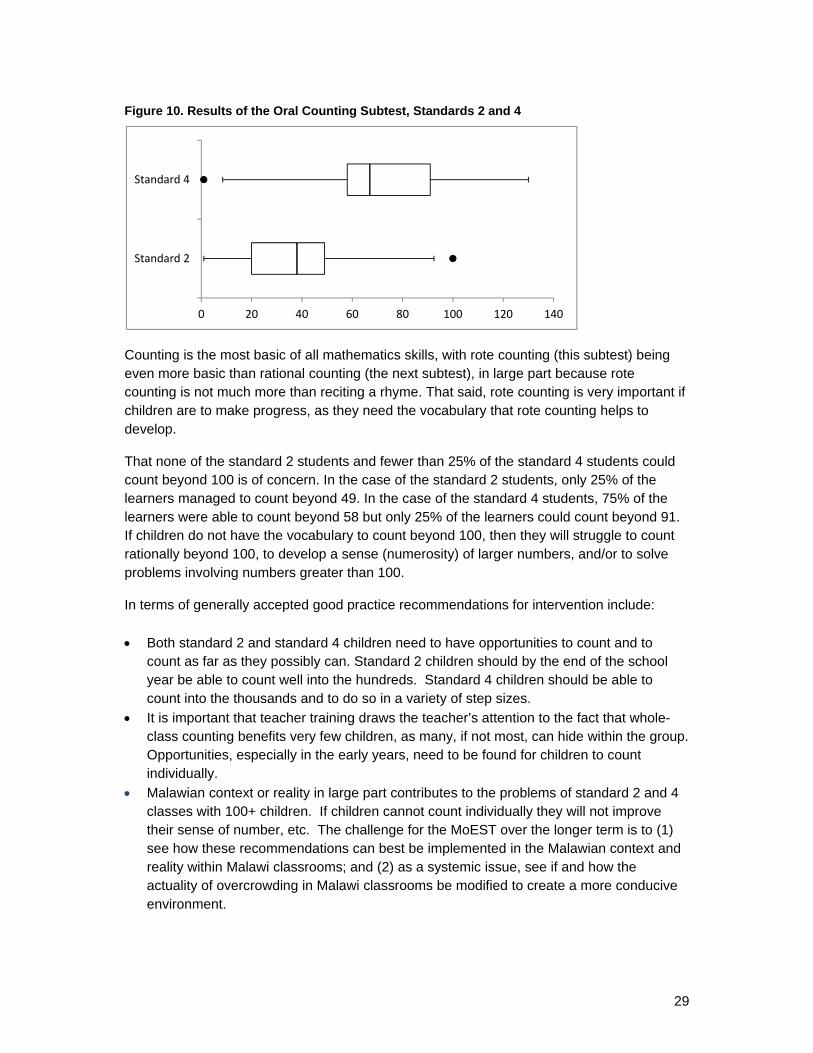
Figure 10. Results of the Oral Counting Subtest, Standards 2 and 4
Counting is the most basic of all mathematics skills, with rote counting (this subtest) being even more basic than rational counting (the next subtest), in large part because rote counting is not much more than reciting a rhyme. That said, rote counting is very important if children are to make progress, as they need the vocabulary that rote counting helps to develop.
That none of the standard 2 students and fewer than 25% of the standard 4 students could count beyond 100 is of concern. In the case of the standard 2 students, only 25% of the learners managed to count beyond 49. In the case of the standard 4 students, 75% of the learners were able to count beyond 58 but only 25% of the learners could count beyond 91. If children do not have the vocabulary to count beyond 100, then they will struggle to count rationally beyond 100, to develop a sense (numerosity) of larger numbers, and/or to solve problems involving numbers greater than 100.
In terms of generally accepted good practice recommendations for intervention include:
Both standard 2 and standard 4 children need to have opportunities to count and to count as far as they possibly can. Standard 2 children should by the end of the school year be able to count well into the hundreds. Standard 4 children should be able to count into the thousands and to do so in a variety of step sizes.
It is important that teacher training draws the teacher’s attention to the fact that whole-class counting benefits very few children, as many, if not most, can hide within the group. Opportunities, especially in the early years, need to be found for children to count individually.
Malawian context or reality in large part contributes to the problems of standard 2 and 4 classes with 100+ children. If children cannot count individually they will not improve their sense of number, etc. The challenge for the MoEST over the longer term is to (1) see how these recommendations can best be implemented in the Malawian context and reality within Malawi classrooms; and (2) as a systemic issue, see if and how the actuality of overcrowding in Malawi classrooms be modified to create a more conducive environment.
0 20 40 60 80 100 120 140
Standard 2
Standard 4
30
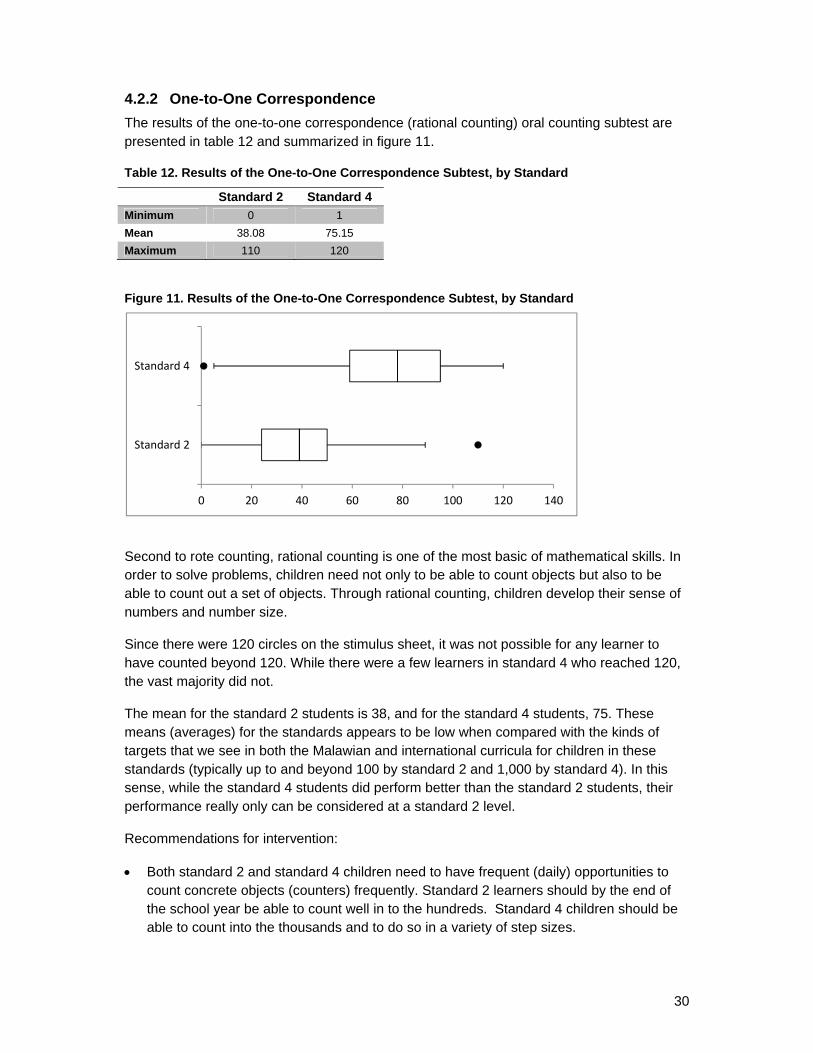
4.2.2 One-to-One Correspondence
The results of the one-to-one correspondence (rational counting) oral counting subtest are presented in table 12 and summarized in figure 11.
Table 12. Results of the One-to-One Correspondence Subtest, by Standard
Standard 2 Standard 4
Minimum 0 1
Mean 38.08 75.15
Maximum 110 120
Figure 11. Results of the One-to-One Correspondence Subtest, by Standard
Second to rote counting, rational counting is one of the most basic of mathematical skills. In order to solve problems, children need not only to be able to count objects but also to be able to count out a set of objects. Through rational counting, children develop their sense of numbers and number size.
Since there were 120 circles on the stimulus sheet, it was not possible for any learner to have counted beyond 120. While there were a few learners in standard 4 who reached 120, the vast majority did not.
The mean for the standard 2 students is 38, and for the standard 4 students, 75. These means (averages) for the standards appears to be low when compared with the kinds of targets that we see in both the Malawian and international curricula for children in these standards (typically up to and beyond 100 by standard 2 and 1,000 by standard 4). In this sense, while the standard 4 students did perform better than the standard 2 students, their performance really only can be considered at a standard 2 level.
Recommendations for intervention:
Both standard 2 and standard 4 children need to have frequent (daily) opportunities to count concrete objects (counters) frequently. Standard 2 learners should by the end of the school year be able to count well in to the hundreds. Standard 4 children should be able to count into the thousands and to do so in a variety of step sizes.
0 20 40 60 80 100 120 140
Standard 2
Standard 4
31
It is important that teacher training draws teacher’s attention to the fact that there is a difference between rote counting (reciting a rhyme) and rational counting – the counting of objects. There is a place for both. Teachers need to be aware that rational counting is an individual activity and children do not benefit from doing so as part of a group.
There are a number of different age-appropriate rational counting activities, and teachers should be trained in using these different methods and in knowing when to use the different ways.
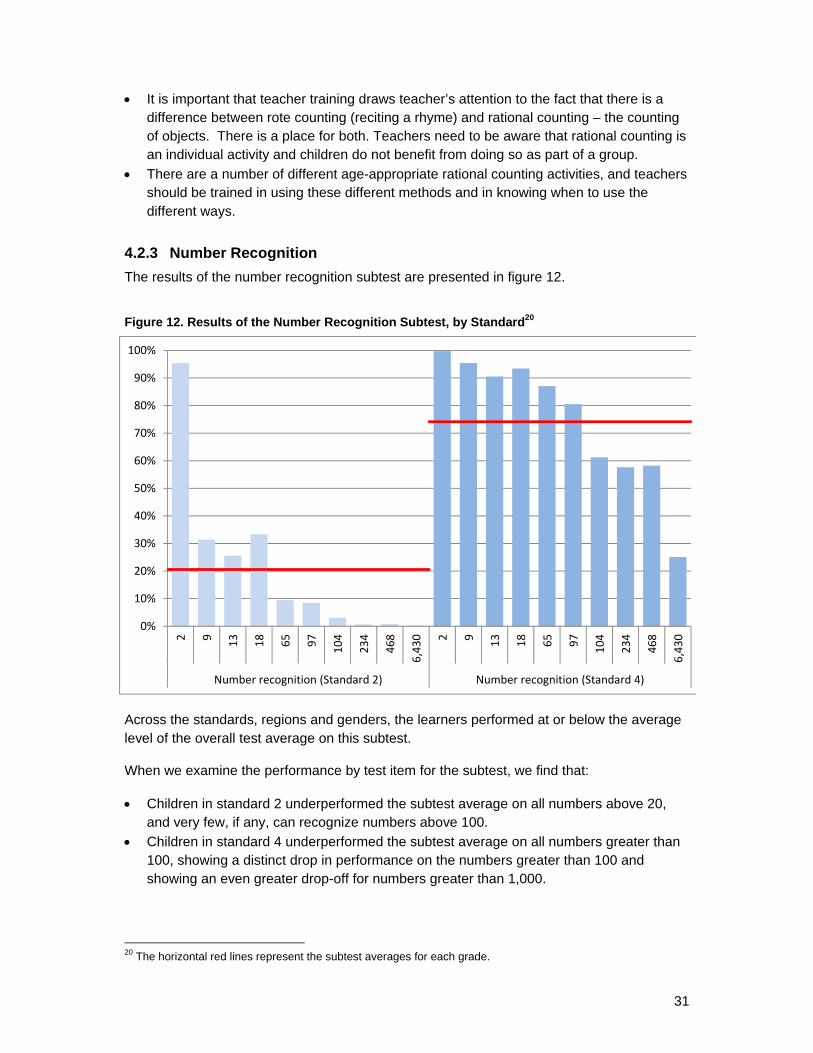
4.2.3 Number Recognition
The results of the number recognition subtest are presented in figure 12.
Figure 12. Results of the Number Recognition Subtest, by Standard20
Across the standards, regions and genders, the learners performed at or below the average level of the overall test average on this subtest.
When we examine the performance by test item for the subtest, we find that:
Children in standard 2 underperformed the subtest average on all numbers above 20, and very few, if any, can recognize numbers above 100.
Children in standard 4 underperformed the subtest average on all numbers greater than 100, showing a distinct drop in performance on the numbers greater than 100 and showing an even greater drop-off for numbers greater than 1,000.
20 The horizontal red lines represent the subtest averages for each grade.
0%
10%
20%
30%
40%
50%
60%
70%
80%
90%
100%
2 9
13
18
65
97
104
234
468
6,430 2 9
13
18
65
97
104
234
468
6,430
Number recognition (Standard 2) Number recognition (Standard 4)
32
Being able to recognize and write numbers is central to being able to communicate (read and write in mathematics), to solving problems in mathematics, and to performing almost all mathematics procedures. That said, children need to learn to recognize and write numbers in much the same way they need to learn to read and write text. In this sense, children need opportunities to practice regular reading and writing of numbers if they are to improve and work at standard-appropriate levels on these skills.
Recommendations for intervention by standard:
Standard 2 children need significant exposure to numbers greater than 20.
Standard 4 children need significant exposure to numbers greater than 100 and well into the thousands.
Teacher training should help teachers realize that learning to recognize (read) and write numbers is much the same as learning to read and write text: it takes time and regular practice.
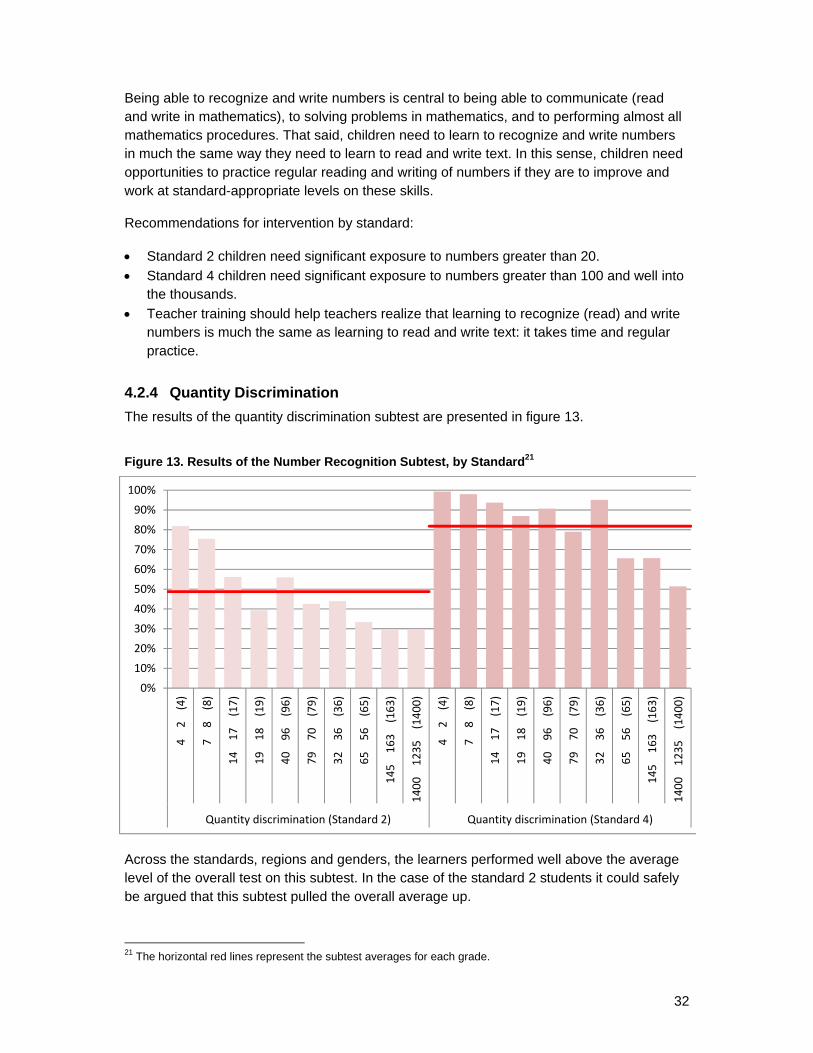
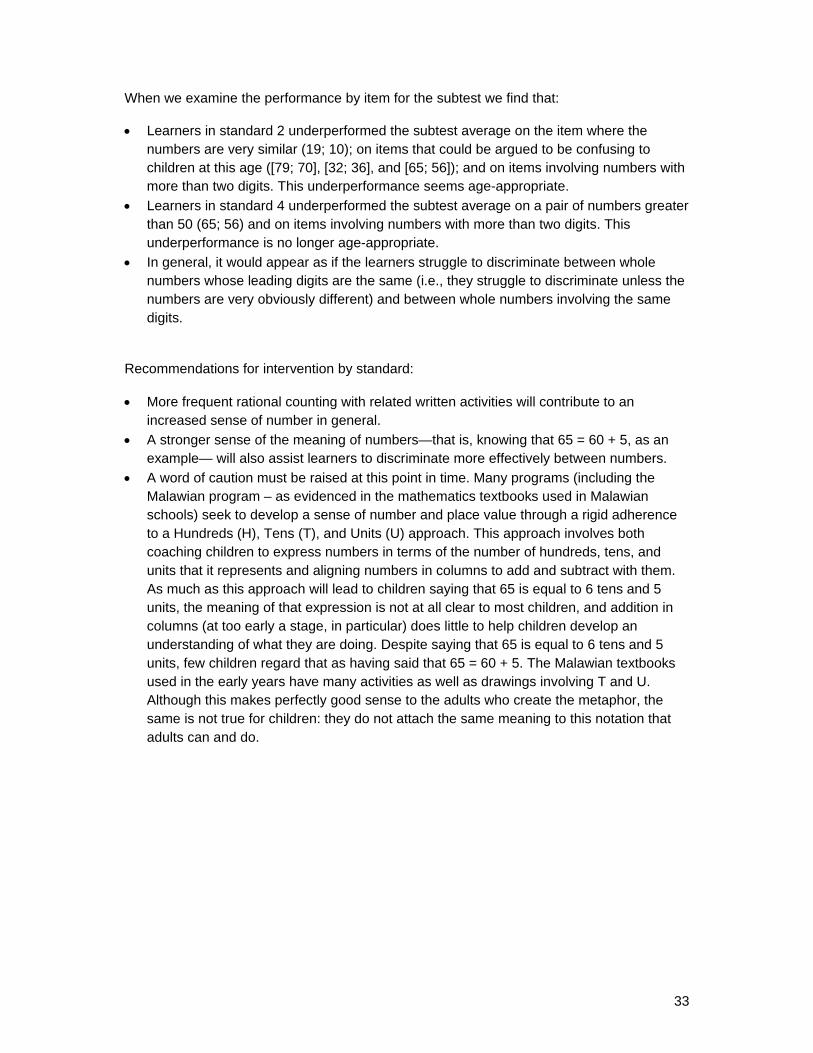
4.2.4 Quantity Discrimination
The results of the quantity discrimination subtest are presented in figure 13.
Figure 13. Results of the Number Recognition Subtest, by Standard21
Across the standards, regions and genders, the learners performed well above the average level of the overall test on this subtest. In the case of the standard 2 students it could safely be argued that this subtest pulled the overall average up.
21 The horizontal red lines represent the subtest averages for each grade.
0%
10%
20%
30%
40%
50%
60%
70%
80%
90%
100%
4 2 (4)
7 8 (8)
14 17 (17)
19 18 (19)
40 96 (96)
79 70 (79)
32 36 (36)
65 56 (65)
145 163 (163)
1400 1235 (1400)
4 2 (4)
7 8 (8)
14 17 (17)
19 18 (19)
40 96 (96)
79 70 (79)
32 36 (36)
65 56 (65)
145 163 (163)
1400 1235 (1400)
Quantity discrimination (Standard 2) Quantity discrimination (Standard 4)
33
When we examine the performance by item for the subtest we find that: Learners in standard 2 underperformed the subtest average on the item where the
numbers are very similar (19; 10); on items that could be argued to be confusing to children at this age ([79; 70], [32; 36], and [65; 56]); and on items involving numbers with more than two digits. This underperformance seems age-appropriate.
Learners in standard 4 underperformed the subtest average on a pair of numbers greater than 50 (65; 56) and on items involving numbers with more than two digits. This underperformance is no longer age-appropriate.
In general, it would appear as if the learners struggle to discriminate between whole numbers whose leading digits are the same (i.e., they struggle to discriminate unless the numbers are very obviously different) and between whole numbers involving the same digits.
Recommendations for intervention by standard:
More frequent rational counting with related written activities will contribute to an increased sense of number in general.
A stronger sense of the meaning of numbers—that is, knowing that 65 = 60 + 5, as an example— will also assist learners to discriminate more effectively between numbers.
A word of caution must be raised at this point in time. Many programs (including the Malawian program – as evidenced in the mathematics textbooks used in Malawian schools) seek to develop a sense of number and place value through a rigid adherence to a Hundreds (H), Tens (T), and Units (U) approach. This approach involves both coaching children to express numbers in terms of the number of hundreds, tens, and units that it represents and aligning numbers in columns to add and subtract with them. As much as this approach will lead to children saying that 65 is equal to 6 tens and 5 units, the meaning of that expression is not at all clear to most children, and addition in columns (at too early a stage, in particular) does little to help children develop an understanding of what they are doing. Despite saying that 65 is equal to 6 tens and 5 units, few children regard that as having said that 65 = 60 + 5. The Malawian textbooks used in the early years have many activities as well as drawings involving T and U. Although this makes perfectly good sense to the adults who create the metaphor, the same is not true for children: they do not attach the same meaning to this notation that adults can and do.
34
4.2.5 Missing Number (Pattern Completion)
The results of the missing number (pattern completion) subtest are presented in figure 14.
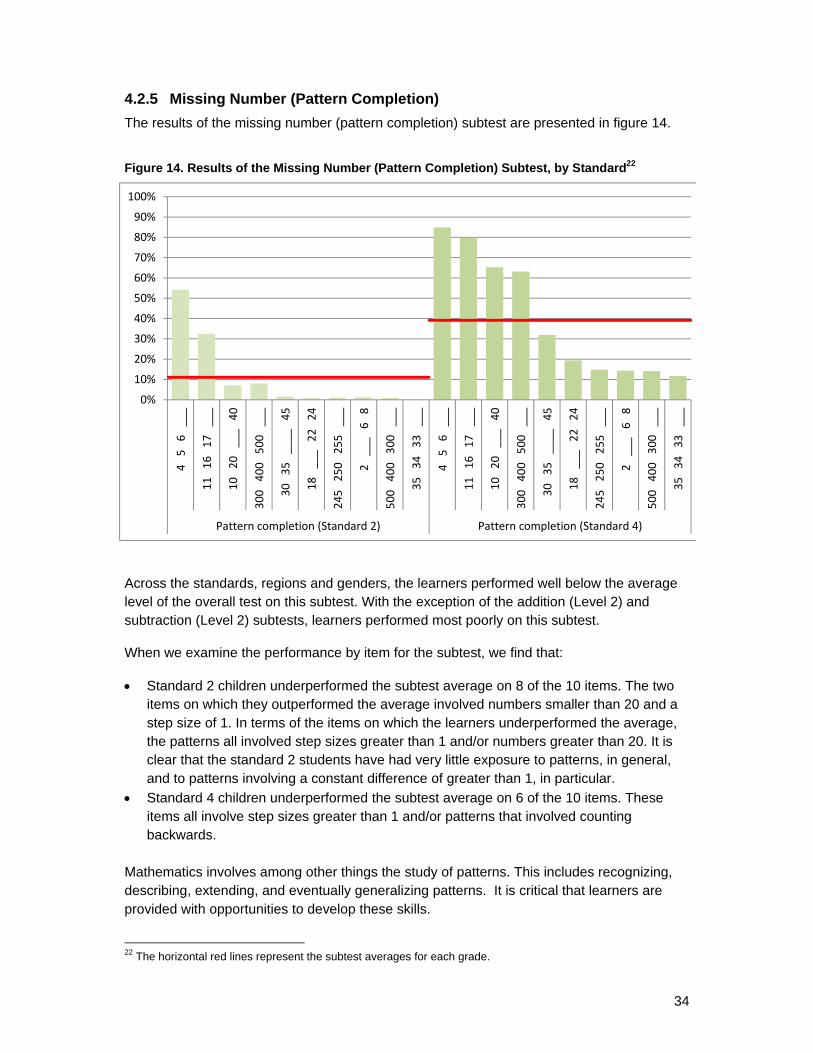
Figure 14. Results of the Missing Number (Pattern Completion) Subtest, by Standard22
Across the standards, regions and genders, the learners performed well below the average level of the overall test on this subtest. With the exception of the addition (Level 2) and subtraction (Level 2) subtests, learners performed most poorly on this subtest.
When we examine the performance by item for the subtest, we find that:
Standard 2 children underperformed the subtest average on 8 of the 10 items. The two items on which they outperformed the average involved numbers smaller than 20 and a step size of 1. In terms of the items on which the learners underperformed the average, the patterns all involved step sizes greater than 1 and/or numbers greater than 20. It is clear that the standard 2 students have had very little exposure to patterns, in general, and to patterns involving a constant difference of greater than 1, in particular.
Standard 4 children underperformed the subtest average on 6 of the 10 items. These items all involve step sizes greater than 1 and/or patterns that involved counting backwards.
Mathematics involves among other things the study of patterns. This includes recognizing, describing, extending, and eventually generalizing patterns. It is critical that learners are provided with opportunities to develop these skills.
22 The horizontal red lines represent the subtest averages for each grade.
0%
10%
20%
30%
40%
50%
60%
70%
80%
90%
100%
4 5 6 ___
11 16 17 ___
10 20 ___ 40
300 400 500 ___
30 35 ____
45
18 ___ 22 24
245 250 255 ___
2 ___ 6 8
500 400 300 ___
35 34 33 ___
4 5 6 ___
11 16 17 ___
10 20 ___ 40
300 400 500 ___
30 35 ____
45
18 ___ 22 24
245 250 255 ___
2 ___ 6 8
500 400 300 ___
35 34 33 ___
Pattern completion (Standard 2) Pattern completion (Standard 4)
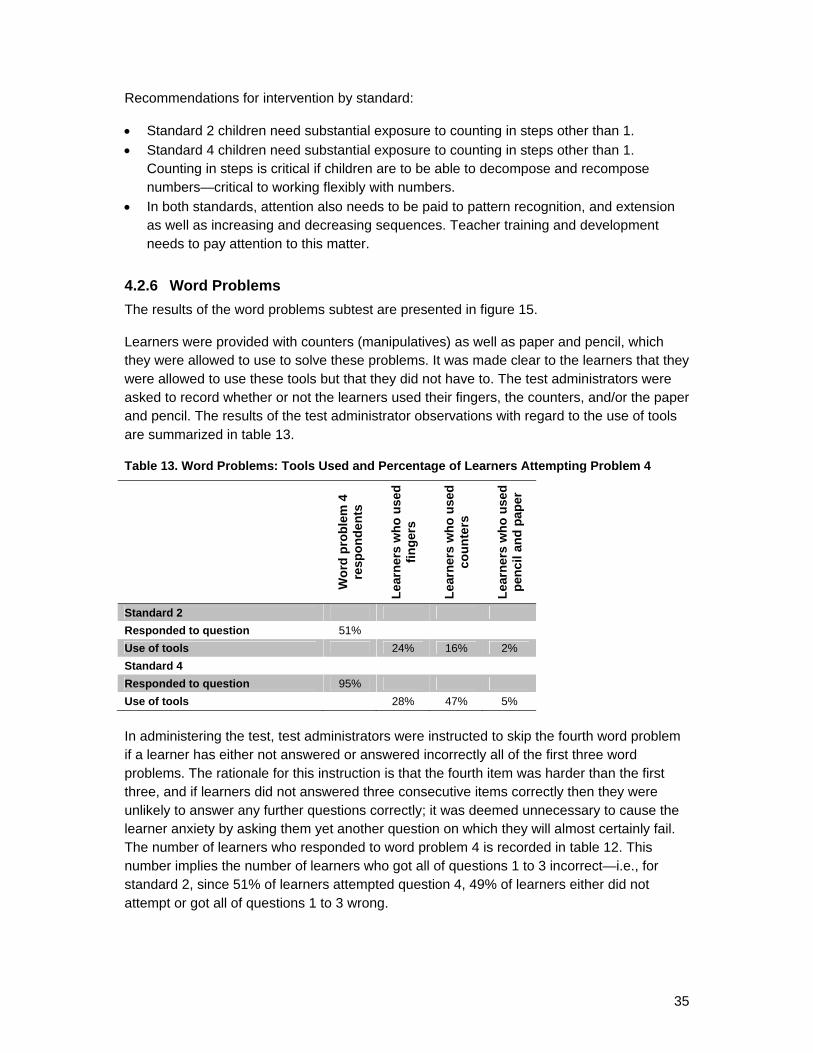
35
Recommendations for intervention by standard: Standard 2 children need substantial exposure to counting in steps other than 1.
Standard 4 children need substantial exposure to counting in steps other than 1. Counting in steps is critical if children are to be able to decompose and recompose numbers—critical to working flexibly with numbers.
In both standards, attention also needs to be paid to pattern recognition, and extension as well as increasing and decreasing sequences. Teacher training and development needs to pay attention to this matter.
4.2.6 Word Problems
The results of the word problems subtest are presented in figure 15.
Learners were provided with counters (manipulatives) as well as paper and pencil, which they were allowed to use to solve these problems. It was made clear to the learners that they were allowed to use these tools but that they did not have to. The test administrators were asked to record whether or not the learners used their fingers, the counters, and/or the paper and pencil. The results of the test administrator observations with regard to the use of tools are summarized in table 13.
Table 13. Word Problems: Tools Used and Percentage of Learners Attempting Problem 4
Wo
rd p
rob
lem
4
resp
on
den
ts
Lea
rner
s w
ho
use
d
fin
ger
s
Lea
rner
s w
ho
use
d
cou
nte
rs
Lea
rner
s w
ho
use
d
pen
cil
and
pap
er
Standard 2
Responded to question 51%
Use of tools 24% 16% 2%
Standard 4
Responded to question 95%
Use of tools 28% 47% 5%
In administering the test, test administrators were instructed to skip the fourth word problem if a learner has either not answered or answered incorrectly all of the first three word problems. The rationale for this instruction is that the fourth item was harder than the first three, and if learners did not answered three consecutive items correctly then they were unlikely to answer any further questions correctly; it was deemed unnecessary to cause the learner anxiety by asking them yet another question on which they will almost certainly fail. The number of learners who responded to word problem 4 is recorded in table 12. This number implies the number of learners who got all of questions 1 to 3 incorrect—i.e., for standard 2, since 51% of learners attempted question 4, 49% of learners either did not attempt or got all of questions 1 to 3 wrong.
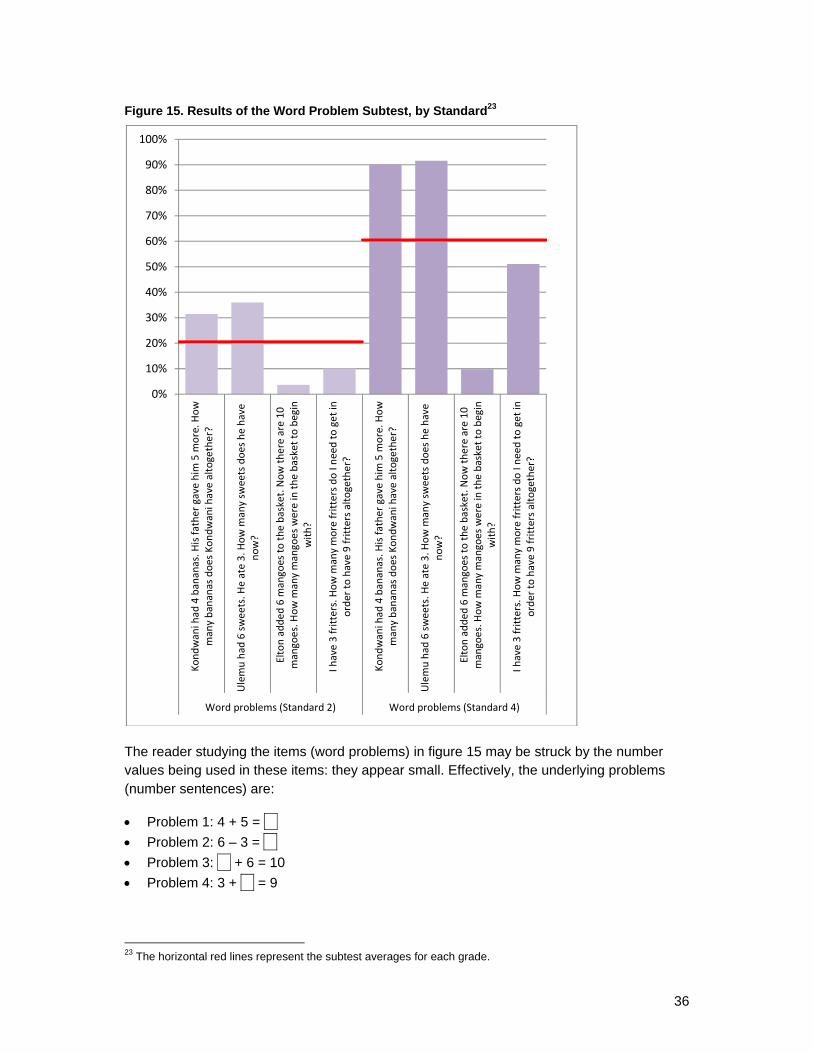
36
Figure 15. Results of the Word Problem Subtest, by Standard23
The reader studying the items (word problems) in figure 15 may be struck by the number values being used in these items: they appear small. Effectively, the underlying problems (number sentences) are:
Problem 1: 4 + 5 = iiii
Problem 2: 6 – 3 = iiii
Problem 3: iiii + 6 = 10
Problem 4: 3 + iiii = 9
23 The horizontal red lines represent the subtest averages for each grade.
0%
10%
20%
30%
40%
50%
60%
70%
80%
90%
100%
Kondwani had
4 bananas. H
is father gave him
5 m
ore. H
ow
many bananas does Kondwani have altogether?
Ulemu had
6 sweets. He ate 3. H
ow m
any sw
eets does he have
now?
Elton added 6 m
angoes to the basket. Now there are 10
mangoes. How m
any mangoes were in
the basket to begin
with?
I have 3 fritters. How m
any more fritters do I need to get in
order to have 9 fritters altogether?
Word problems (Standard 2) Word problems (Standard 4)
37
The number values are deliberately small in this subtest because we are not testing the learner’s ability to solve the arithmetic as much as we are testing their ability to make sense of/interpret a problem statement.
Both the standard 2 students and the standard 4 students marginally underperformed the overall test average on the word problem subtest (20.6% versus 21.6% for standard 2 students and 60.5% versus 61.8% for standard 4 students).
When we examine the performance by item in each subtest, we find that:
Standard 2 children underperformed the average for the subtest on two of the four items. In these items, the word problem is not presented in the more traditional format of + = ? and/or – = ? This is a matter that deserves attention. If children are presented only with items of the more traditional form, then they get into the habit of performing an operation on the two numbers in the problem without any analysis of the problem itself.
Of particular concern with the standard 2 students is that nearly one half (49%) of the learners tested did not get a single one of the first three items correct.
In terms of the tools used by the standard 2 students to solve the word problems, their apparent reluctance to use any of the tools available (including their fingers) may indicate, firstly, that these learners are not used to solving problems and, secondly, that they experience mathematics as the production of answers, often from memory.
The standard 4 students underperformed the average for the subtest on the two of the four items not presented in one of the most traditional forms. Only 5% of these learners did not get any of the items correct.
In terms of the tools used by the standard 4 students to solve the word problems, we notice an increase (over the standard 2 students) in the number using counters; this is encouraging and positive.
The distinctly better performance on the items in this subtest by the standard 4 students suggests the possibility that more are able to make sense of or interpret a problem. Still, their underperformance on the less traditional problem structures hints very strongly at children choosing the numbers in the problems and performing a calculation with them rather than performing a calculation after considered interpretation of the situation. Thus, while there is an overall improvement in performance on the subtest from standard 2 to standard 4, one must be cautious in over-interpreting that as an indication of increased problem-solving skills. The profile across the items tells a different story.
Recommendations for intervention by standard:
Problem solving is the fundamental purpose of mathematics. We study mathematics in order to solve problems. Learners’ underperformance on this subtest tells us a lot about how they experience mathematics. Rather than experiencing mathematics as a meaningful, sense-making, problem-solving activity they experience it as the memorization of facts, rules, formulas and procedures needed to determine the answers to questions. Unfortunately, this experience of mathematics contributes to very limited and hence limiting understanding of the subject and, in turn, underperformance.

38
Any intervention project needs to pay as much attention to what mathematics is taught as it does to how that mathematics is taught (see comments under section 5).
4.2.7 Addition and Subtraction
The results of the addition and subtraction subtests are presented in figure 16 for standard 2 and figure 17 for standard 4.
In order to enable the data to be interpreted more easily, the following description of the addition and subtraction subtests is provided – the analysis of the performance on these subtests follows after the presentation of the tables and figures. The addition and subtraction subtests each consisted of two sets of 5 questions: the so-called “Level 1” and “Level 2” questions. The Level 1 addition and subtraction questions involve numbers in a low number range, and it is expected that children should be able to perform these calculations mentally. Learners were not given access to counters and/or paper and pencils for the questions at this level. The test administrators were asked to record whether or not the learners used their fingers. The Level 2 addition and subtraction questions involve numbers in a higher number range, and it is expected that some/many of these children would have to use tools other than mental arithmetic to solve these. Learners were provided with counters (manipulatives) as well as paper and pencil, which they were allowed to use to solve these problems. It was made clear to the learners that they were allowed to use these tools but that they did not have to. The test administrators were asked to record whether or not the learners used their fingers, the counters, and/or the paper and pencil. The results of the test administrator observations with regard to the use of tools are summarized in table 13.
In administering the test, test administrators were instructed to stop administering the Level 1 questions of each of these subtests once a learner had made three consecutive errors. They were further instructed to stop administering the Level 2 questions if the learner tried to solve the first two questions through counting either with the counters and/or the drawing of stripes. The rationale for both instructions was that the items are arranged in order of increasing difficulty, and if learners have not answered three consecutive questions correctly and/or are using a primitive and/or inappropriate method (given the number size) then they are unlikely to answer any further questions correctly either; it was deemed unnecessary to cause them anxiety by asking them more questions on which they will almost certainly fail. The number of learners who responded to items 4 and 5 (at Level 1) and 3, 4, and 5 (at Level 2) is recorded in table 14. This number implies the number of learners who got all of the three or two preceding questions wrong—i.e., for standard 2, since 41% of learners attempted addition item number 5 (Level 1), the rest of the learners, 59%, either did not attempt or got all of questions 2 to 4 wrong.
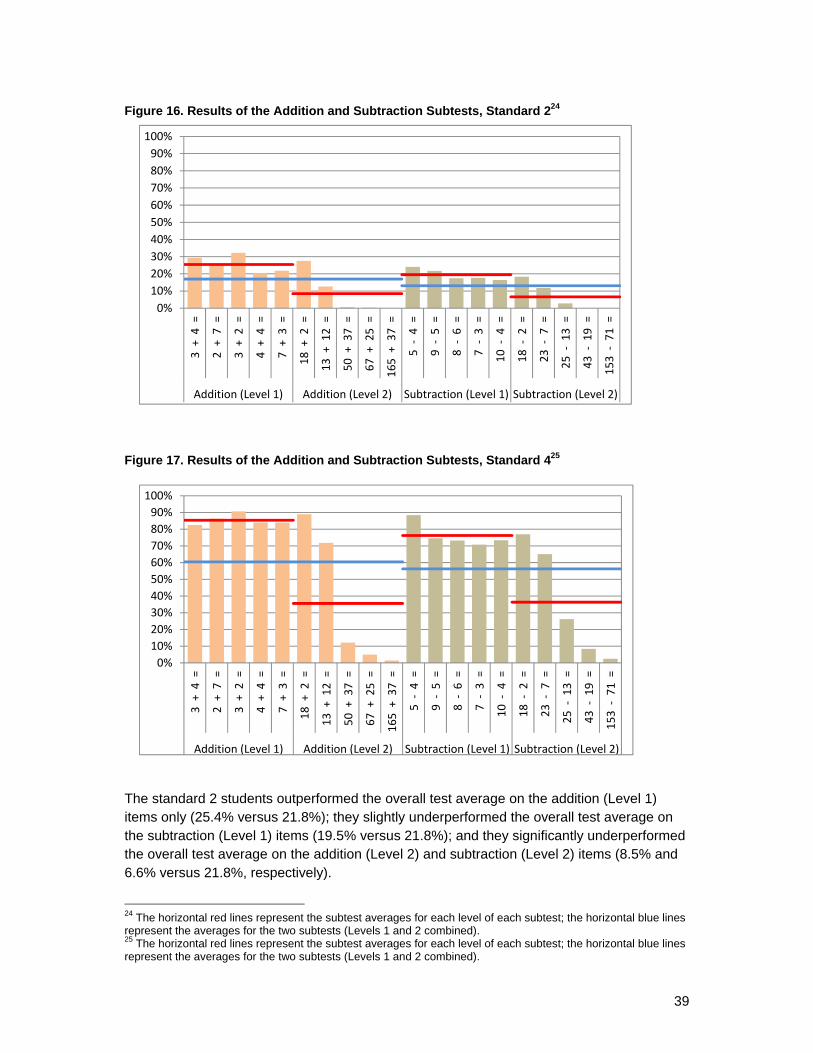
39
Figure 16. Results of the Addition and Subtraction Subtests, Standard 224
Figure 17. Results of the Addition and Subtraction Subtests, Standard 425
The standard 2 students outperformed the overall test average on the addition (Level 1) items only (25.4% versus 21.8%); they slightly underperformed the overall test average on the subtraction (Level 1) items (19.5% versus 21.8%); and they significantly underperformed the overall test average on the addition (Level 2) and subtraction (Level 2) items (8.5% and 6.6% versus 21.8%, respectively).
24 The horizontal red lines represent the subtest averages for each level of each subtest; the horizontal blue lines represent the averages for the two subtests (Levels 1 and 2 combined). 25 The horizontal red lines represent the subtest averages for each level of each subtest; the horizontal blue lines represent the averages for the two subtests (Levels 1 and 2 combined).
0%
10%
20%
30%
40%
50%
60%
70%
80%
90%
100%
3 + 4 =
2 + 7 =
3 + 2 =
4 + 4 =
7 + 3 =
18 + 2 =
13 + 12 =
50 + 37 =
67 + 25 =
165 + 37 =
5 ‐ 4 =
9 ‐ 5 =
8 ‐ 6 =
7 ‐ 3 =
10 ‐ 4 =
18 ‐ 2 =
23 ‐ 7 =
25 ‐ 13 =
43 ‐ 19 =
153 ‐ 71 =
Addition (Level 1) Addition (Level 2) Subtraction (Level 1) Subtraction (Level 2)
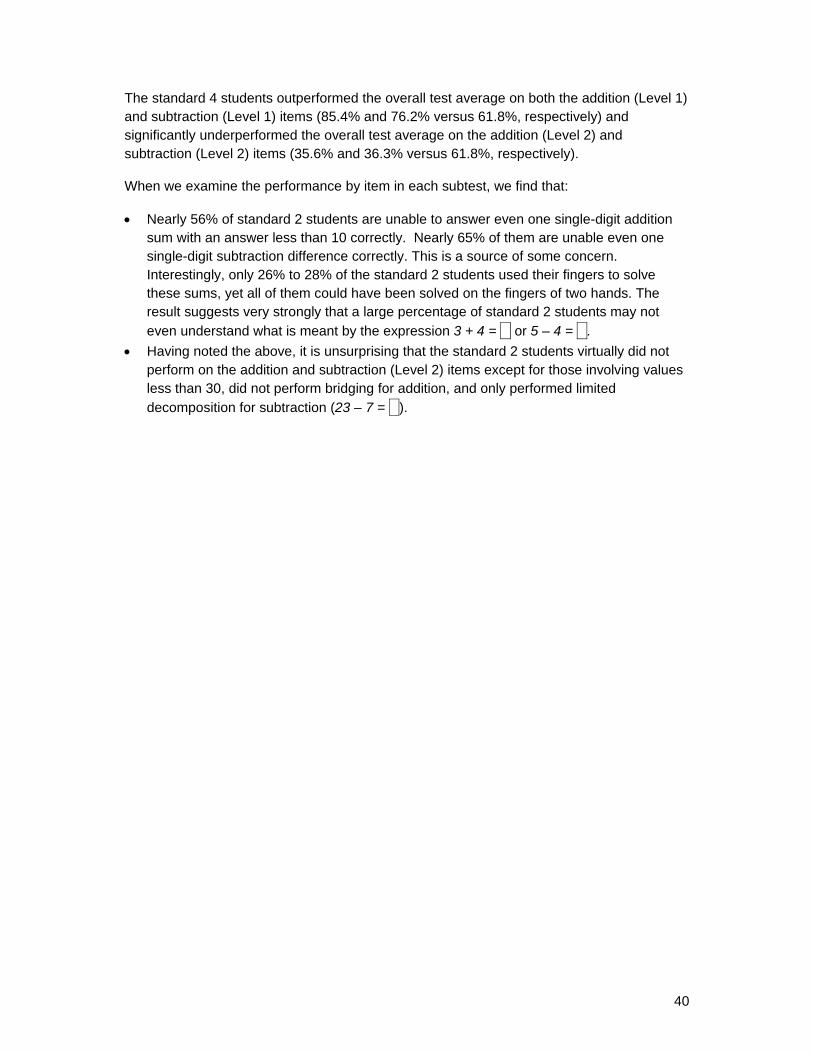
40
The standard 4 students outperformed the overall test average on both the addition (Level 1) and subtraction (Level 1) items (85.4% and 76.2% versus 61.8%, respectively) and significantly underperformed the overall test average on the addition (Level 2) and subtraction (Level 2) items (35.6% and 36.3% versus 61.8%, respectively).
When we examine the performance by item in each subtest, we find that:
Nearly 56% of standard 2 students are unable to answer even one single-digit addition sum with an answer less than 10 correctly. Nearly 65% of them are unable even one single-digit subtraction difference correctly. This is a source of some concern. Interestingly, only 26% to 28% of the standard 2 students used their fingers to solve these sums, yet all of them could have been solved on the fingers of two hands. The result suggests very strongly that a large percentage of standard 2 students may not
even understand what is meant by the expression 3 + 4 = iii or 5 – 4 = iii.
Having noted the above, it is unsurprising that the standard 2 students virtually did not perform on the addition and subtraction (Level 2) items except for those involving values less than 30, did not perform bridging for addition, and only performed limited decomposition for subtraction (23 – 7 = iii).
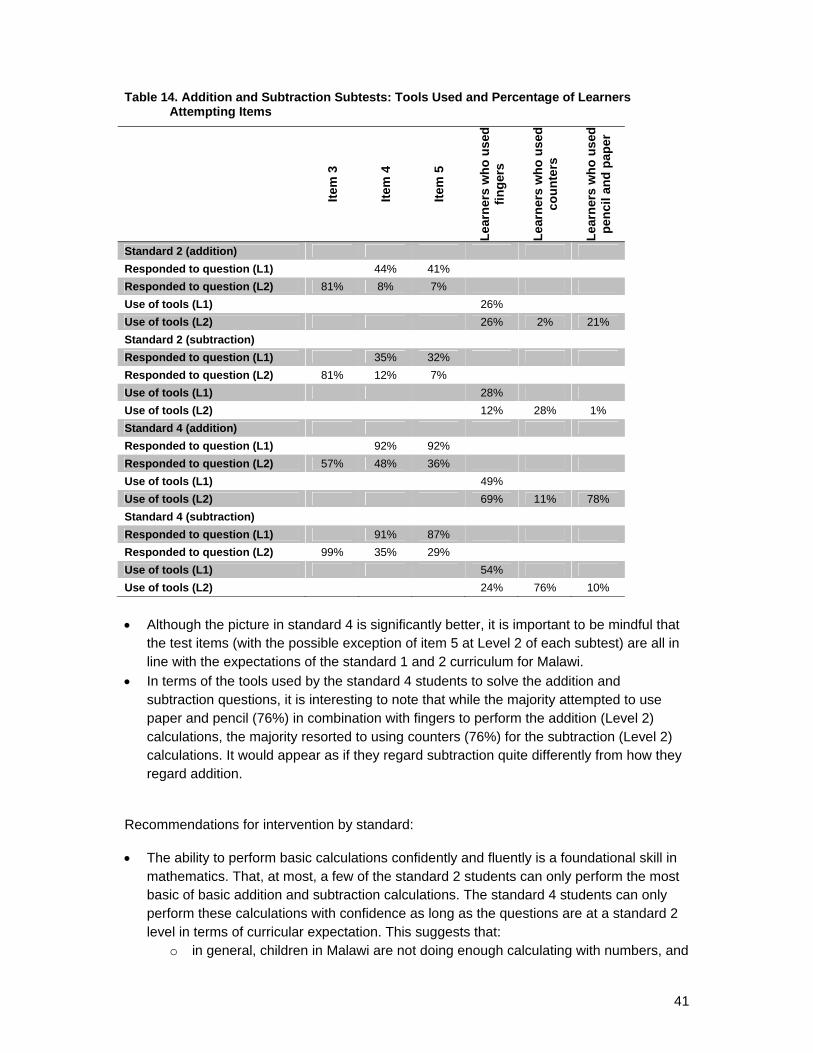
41
Table 14. Addition and Subtraction Subtests: Tools Used and Percentage of Learners Attempting Items
Item
3
Item
4
Item
5
Lea
rner
s w
ho
use
d
fin
ger
s
Lea
rner
s w
ho
use
d
cou
nte
rs
Lea
rner
s w
ho
use
d
pen
cil
and
pap
er
Standard 2 (addition)
Responded to question (L1) 44% 41%
Responded to question (L2) 81% 8% 7%
Use of tools (L1) 26%
Use of tools (L2) 26% 2% 21%
Standard 2 (subtraction)
Responded to question (L1) 35% 32%
Responded to question (L2) 81% 12% 7%
Use of tools (L1) 28%
Use of tools (L2) 12% 28% 1%
Standard 4 (addition)
Responded to question (L1) 92% 92%
Responded to question (L2) 57% 48% 36%
Use of tools (L1) 49%
Use of tools (L2) 69% 11% 78%
Standard 4 (subtraction)
Responded to question (L1) 91% 87%
Responded to question (L2) 99% 35% 29%
Use of tools (L1) 54%
Use of tools (L2) 24% 76% 10%
Although the picture in standard 4 is significantly better, it is important to be mindful that the test items (with the possible exception of item 5 at Level 2 of each subtest) are all in line with the expectations of the standard 1 and 2 curriculum for Malawi.
In terms of the tools used by the standard 4 students to solve the addition and subtraction questions, it is interesting to note that while the majority attempted to use paper and pencil (76%) in combination with fingers to perform the addition (Level 2) calculations, the majority resorted to using counters (76%) for the subtraction (Level 2) calculations. It would appear as if they regard subtraction quite differently from how they regard addition.
Recommendations for intervention by standard:
The ability to perform basic calculations confidently and fluently is a foundational skill in mathematics. That, at most, a few of the standard 2 students can only perform the most basic of basic addition and subtraction calculations. The standard 4 students can only perform these calculations with confidence as long as the questions are at a standard 2 level in terms of curricular expectation. This suggests that:
o in general, children in Malawi are not doing enough calculating with numbers, and
42
o the calculating that they do is more concerned with rote learning and/or memorization than with the development of meaning/understanding.
As with the word problems, the results on the addition and subtraction subtests indicate clearly that any intervention project needs to pay as much attention to what mathematics is taught as it does to how that mathematics is taught (see comments under section 5).
4.3 General Observations
Throughout the analysis of the subtests and the items in those subtests, it has emerged quite clearly that the learners in each standard are only getting the most elementary of items correct. Typically, children perform better on items that are completely procedural in nature, and, in most cases, at a level some standards below the child’s actual level. Notwithstanding the fact that the learners tested in this assessment are at the start of standard 2 and standard 4 years, in general, learners are not able to perform the subtests expected of them as determined by the curriculum for their respective standard levels.
5. Conclusion and Recommendations The data strongly suggest that the children who participated in the pilot study are performing at levels well below the levels that the Malawi curriculum expects of them.
The analysis has shown that from subtest to subtest the children are only able to answer the most elementary and procedural of items with any sense of confidence.
In the case of the standard 2 students: They struggled to identify numbers greater than 20.
They struggled to complete patterns that involve counting in anything but ones. That is, they do not seem to be able to count in 2s, 5s, or 10s and struggled to count backwards in any step size, including 1.
With respect to word problems, only 30% were able to answer the questions with the basic structures � + � = ? and � - � = ? but struggled to make sense of the situations involving the structures � + ? = � and ? + � = �. In part, this suggests the children are not used to having to make sense of situation and also partly suggests they have a poor sense of what they need to do when faced with a contextual problem.
In terms of basic addition and subtraction facts, they found the questions involving numbers and answers greater than 20 more difficult.
In the case of the standard 4 students:
75% of the learners were able to count beyond 58, but only 25% of the learners could count beyond 91.
They underperformed the number identification subtest average on all numbers greater than 100.
They struggled to complete number patterns involving step sizes greater than 1 and/or patterns that involved counting backwards
With respect to word problems, they were able to answer the questions with the basic structures � + � = ? and � - � = ? but struggled to make sense of the situations involving the structures � + ? = � and ? + � = �. In part, this suggests the children are
43
not used to having to make sense of situation. It also suggests they have an impoverished sense of what they need to do when faced with a contextual problem.
Although the standard 4 students performed significantly better on the addition and subtraction items than the standard 2 students did, it is important to be mindful that the test items (with the possible exception of item 5 at Level 2 of each subtest) are all in line with the expectations of the standard 1 and 2 curriculum for Malawi.
The picture that emerges is of children doing only the most basic aspect of the standard-appropriate mathematics well.
The teacher training response/solution lies not so much in “getting the basics right” and/or “getting the basics in place” but rather in how these “basics” are experienced.
That standard 4 children are more confident only on those aspects of the curriculum that we would expect standard 2 students to be confident with suggests the children are “getting the basics” but many years after desired.
The picture that the results paint is one of children eventually knowing what the answers are and yet not doing so with much understanding (in particular, see their responses to the word problems).
In addition to the recommendations already made in the analysis of each of the subtests above, it appears that any program that seeks to address the gaps identified by this study would need to pay special attention to understanding, reasoning and application.
Table 15: Recommendations for Consideration of Policy Makers
1. Review current policies affecting early grade numeracy – policies such as class size, length of school day, teacher preparation, language of instruction could be changed to improve student learning
2. Review current curriculum – based on results of EGMA a review of currently curriculum could be helpful to find gaps in what students need to know and what is in the curriculum, and clarify age-appropriate rational counting
3. Review of current materials – reviewing textbooks and other reading materials used in classrooms for appropriateness, materials should be based on a logical scope and sequence and should start simple and get more complicated, paying as much attention to what is taught as to how it is taught
4. Focused instruction on early numeracy skills – assuring that teachers focus attention to understanding, reasoning and application, offering opportunity for students to practice calculations in developing learning and understanding, and experience mathematics as a meaningful, sense-making, problem-solving activity rather than memorization of facts, rules, formulas and procedures. The instructional practices promoted should be based upon an objective assessment of international research on early numeracy development. There is an emerging consensus that children’s number knowledge develops in along a common path and around the scope and sequence in which these skills should be

44
introduced26.
5.
6. Train Teachers – professional development is needed in specific instructional strategies and methods focused on mathematics (both pre and in-service training on numeracy instruction) focusing attention on how children are getting the basics, and develop conceptual understanding, adaptive reasoning, and strategic competence (e.g., frequent or daily opportunities to count concrete objects with counters). Local efforts to review teacher training strategies employed in both pre and inservice training should take note of international research which matches specific teaching strategies to specific stages in children’s mathematical concept development27.
7. Train PEAS to be instructional coaches – Refocusing PEAs focus to be experts in early numeracy instruction and coaching. This could include modeling and providing constructive feedback to teachers during regular classroom visits
8. Research – design a study to test research based best practices of early numeracy instruction for Malawian context that would include design of numeracy intervention, teacher training, implementation in several hundred schools, and capacity building and policy dialogue for MoEST to be able to scale up
9.
26 RTI International, (2009 EGRA: A Conceptual Framework Based on Mathematics Skills development in Children, USAID. 27 See for example Griffin, S., Case, R., & Capodilupo, A. (1995). Teaching for understanding: The importance of Central conceptual structures in the elementary mathematics curriculum. In A. McKeough, I. Lupert, & A. Marini (Eds.), Teaching for transfer: Fostering generalization in learning (pp. 121–151). Hillsdale, New Jersey: Lawrence Erlbaum Associates.
A-1
Annex A: Malawi Early Grade Math Assessment: Student Stimuli Booklet, October 2010
SHEET 1
Version 5.0, Malawi, October 2010 A-2
EGMA Student stimulus sheets
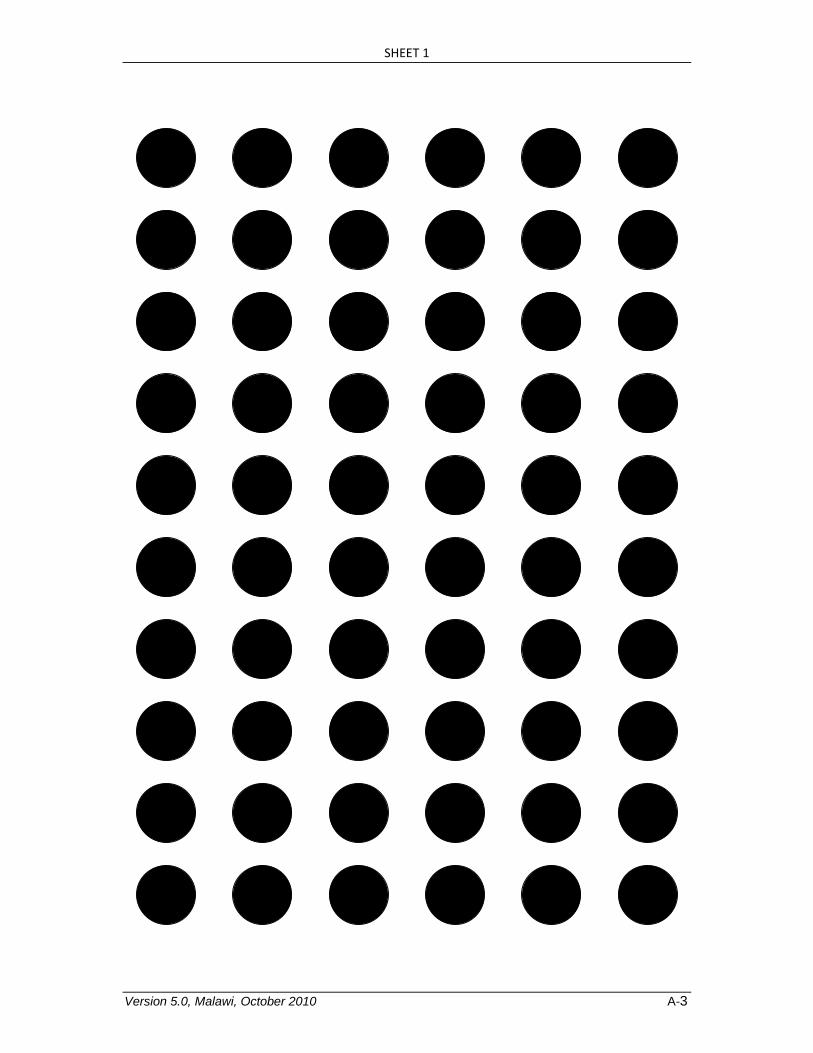
SHEET 1
Version 5.0, Malawi, October 2010 A-3
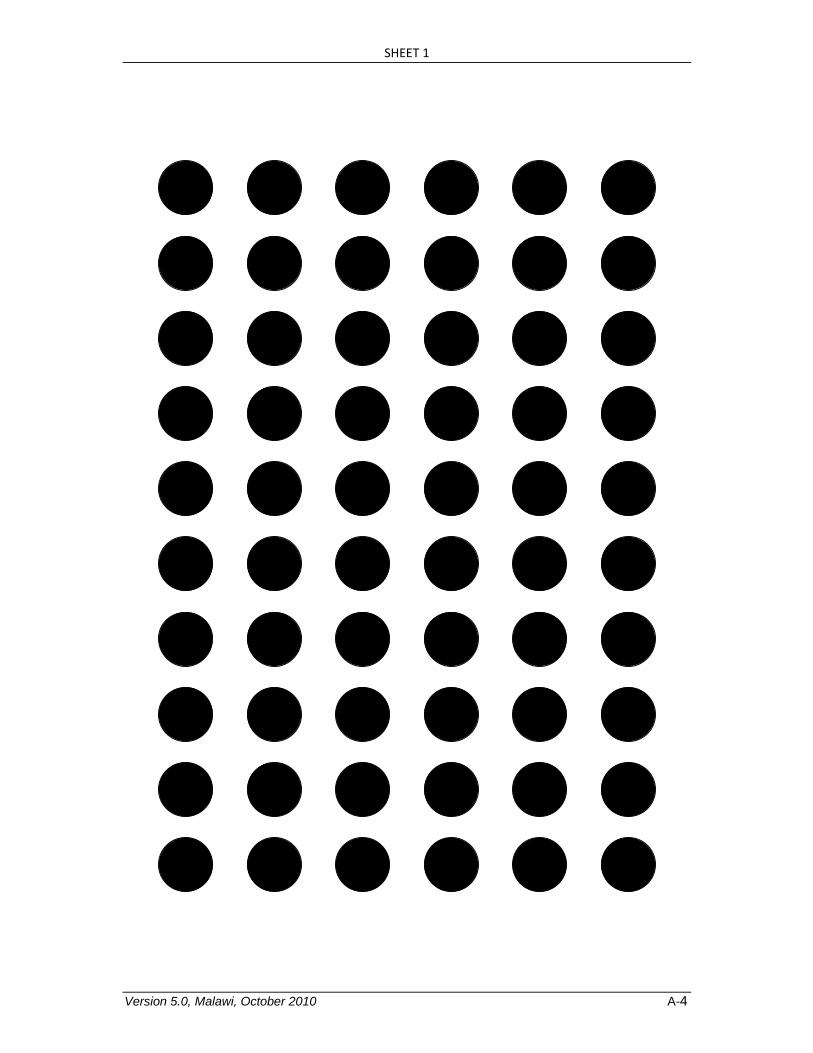
SHEET 1
Version 5.0, Malawi, October 2010 A-4
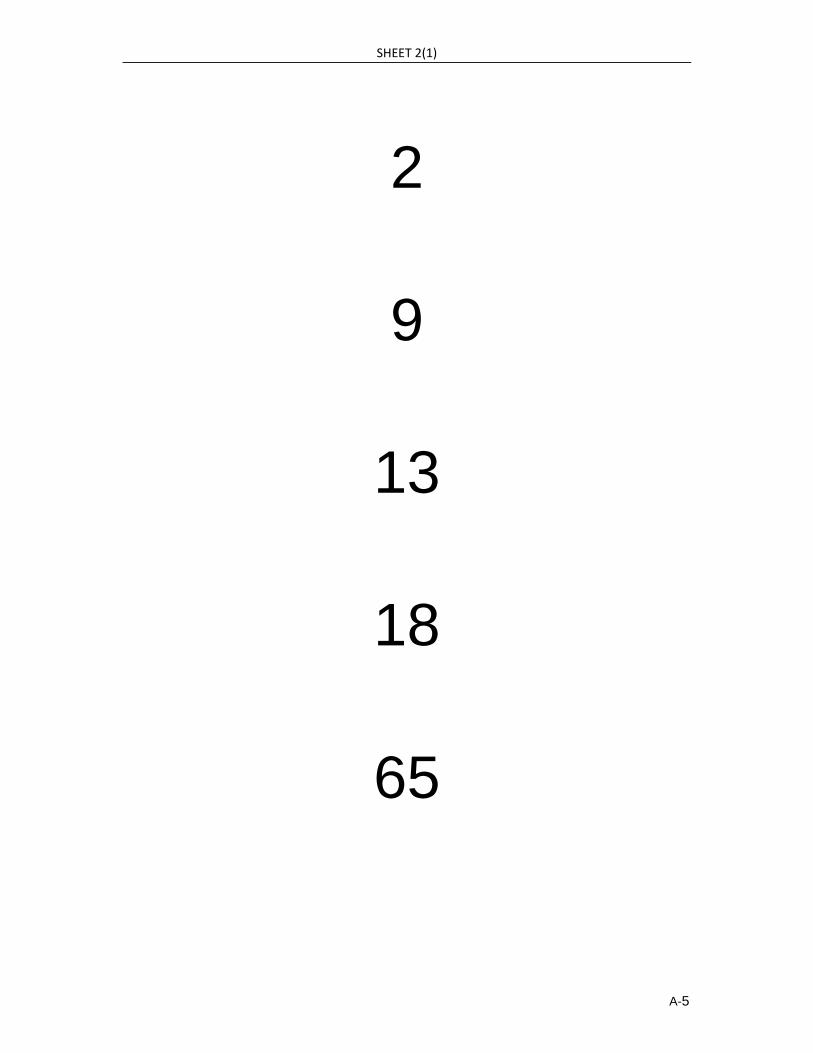
SHEET 2(1)
A-5
2
9
13
18
65
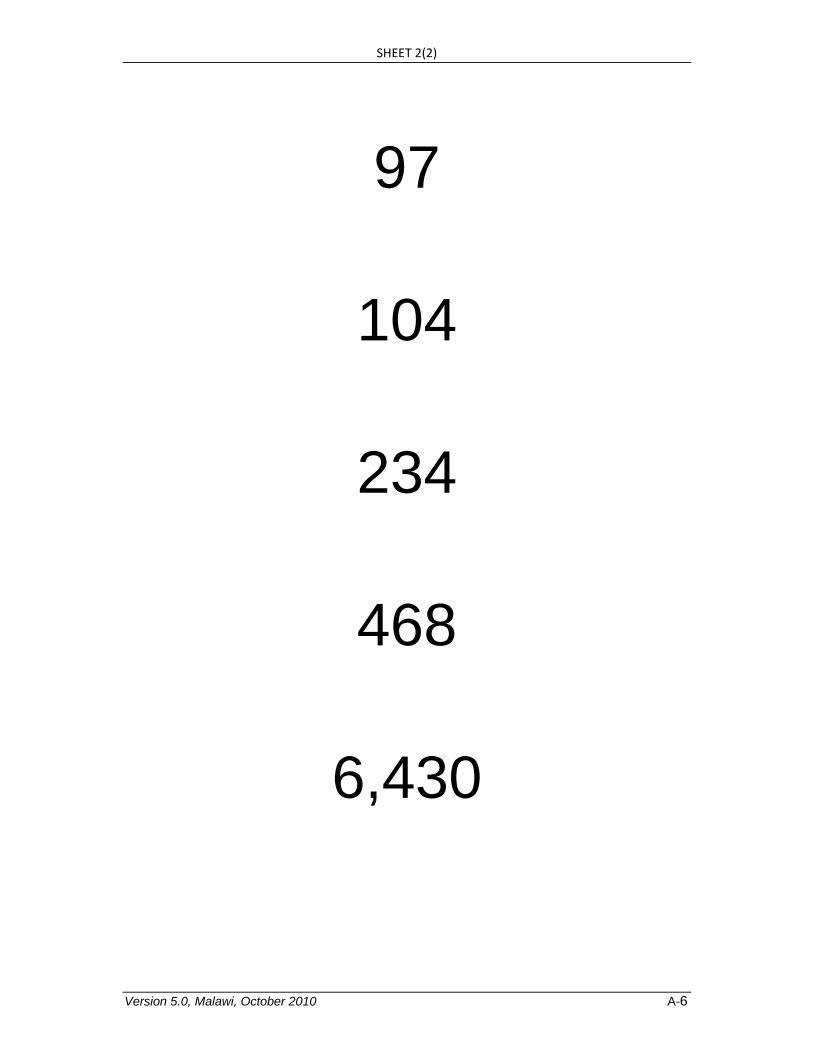
SHEET 2(2)
Version 5.0, Malawi, October 2010 A-6
97
104
234
468
6,430
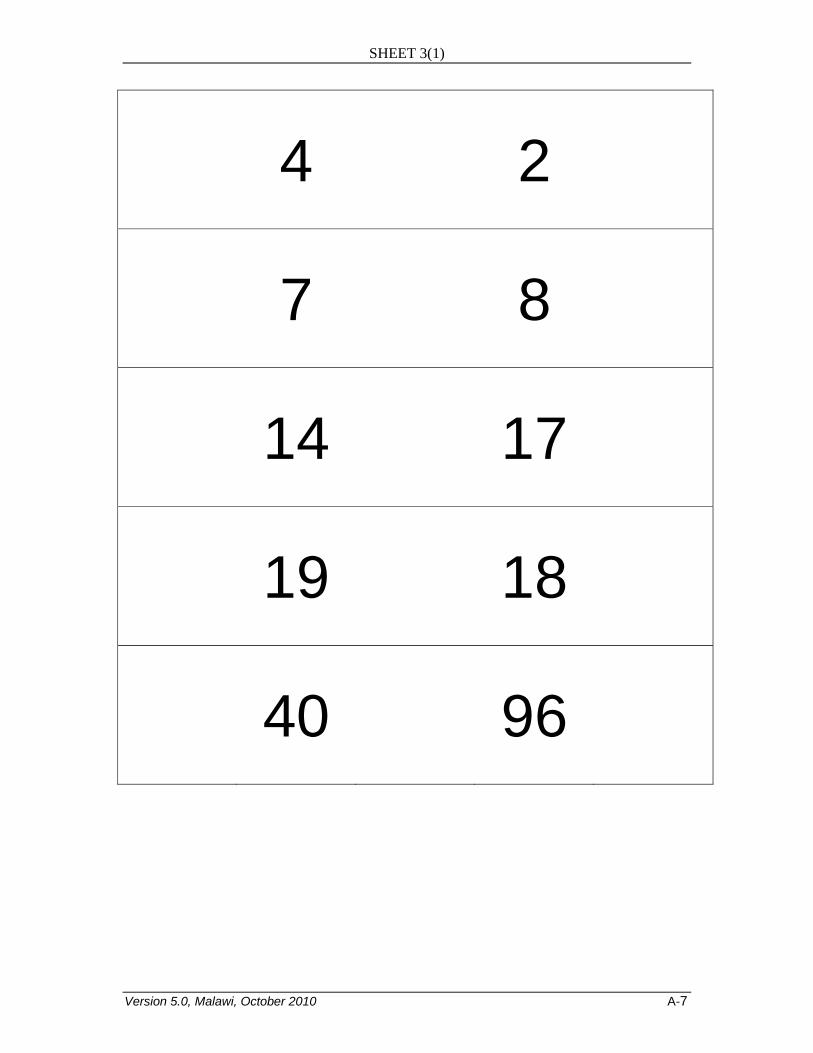
SHEET 3(1)
Version 5.0, Malawi, October 2010 A-7
4 2
7 8
14 17
19 18
40 96
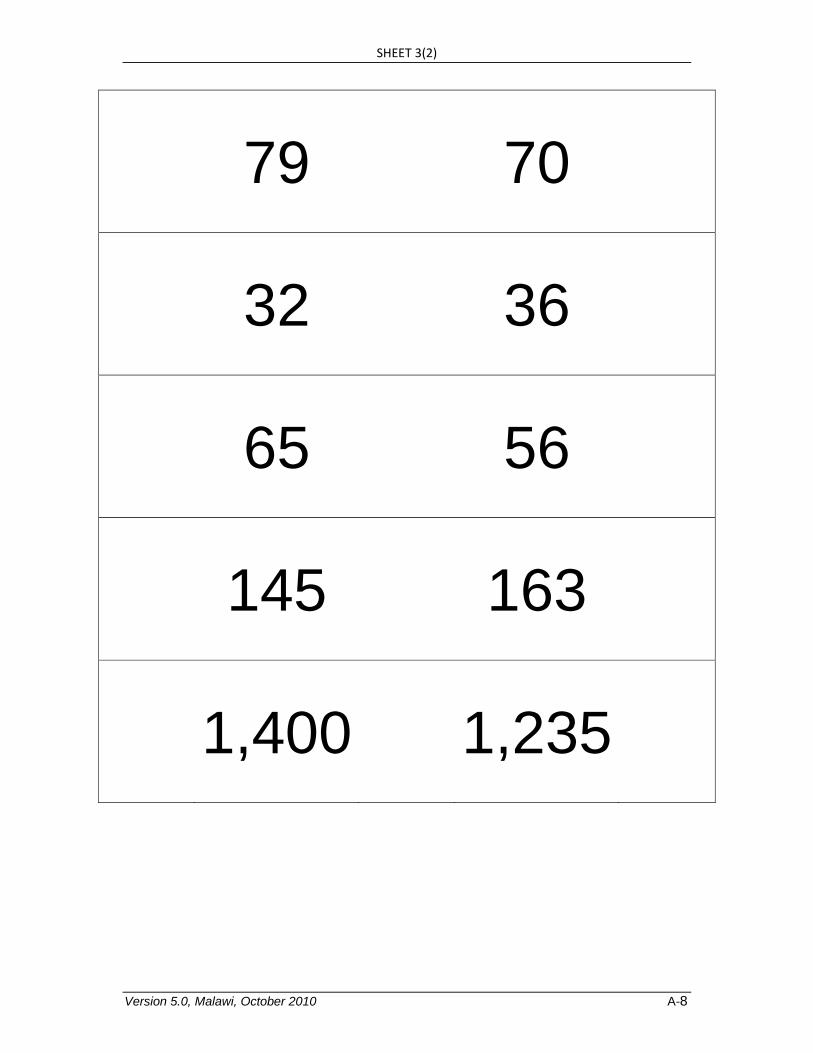
SHEET 3(2)
Version 5.0, Malawi, October 2010 A-8
79 70
32 36
65 56
145 163
1,400 1,235
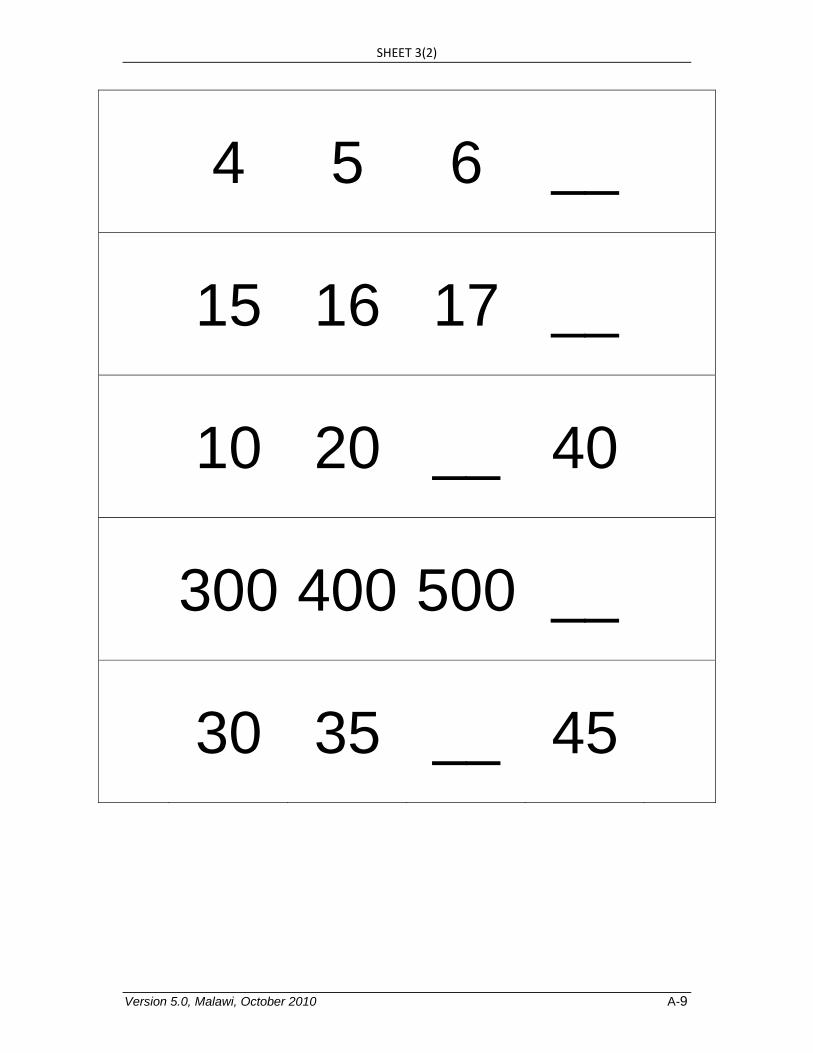
SHEET 3(2)
Version 5.0, Malawi, October 2010 A-9
4 5 6 __
15 16 17 __
10 20 __ 40
300 400 500 __
30 35 __ 45

SHEET 3(2)
Version 5.0, Malawi, October 2010 A-10
18 __ 22 24
245 250 255 __
2 __ 6 8
500 400 300 __
35 34 33 __
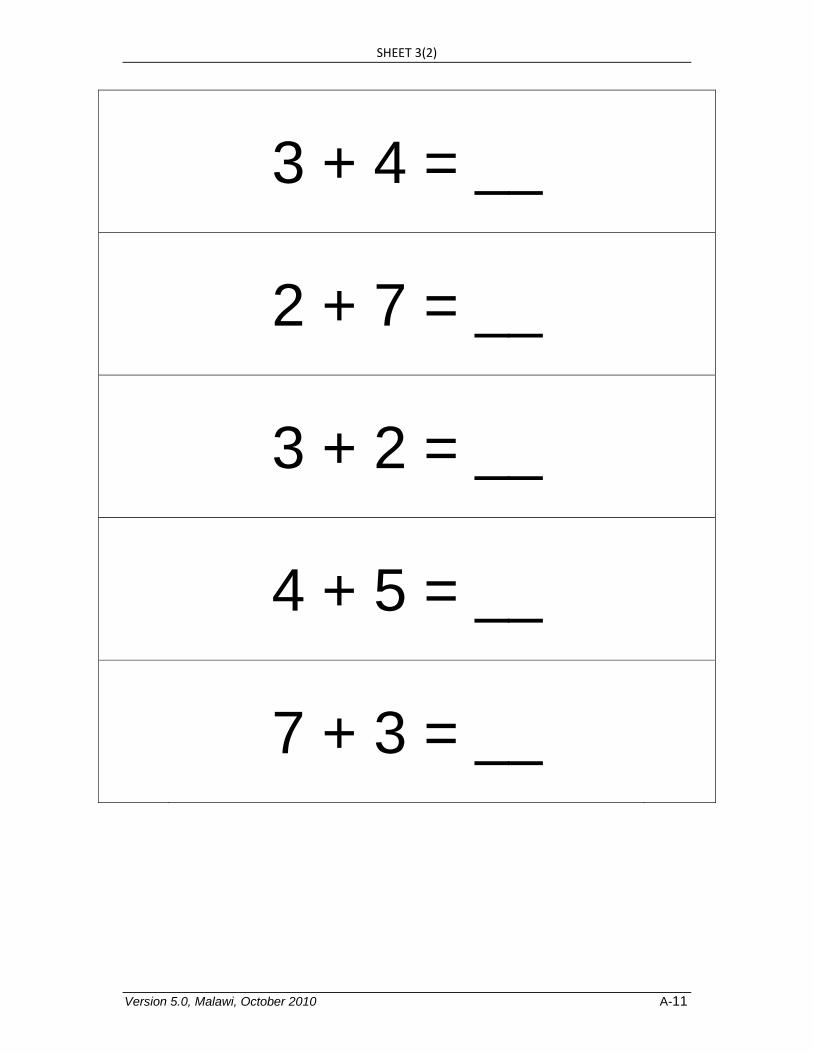
SHEET 3(2)
Version 5.0, Malawi, October 2010 A-11
3 + 4 = __
2 + 7 = __
3 + 2 = __
4 + 5 = __
7 + 3 = __
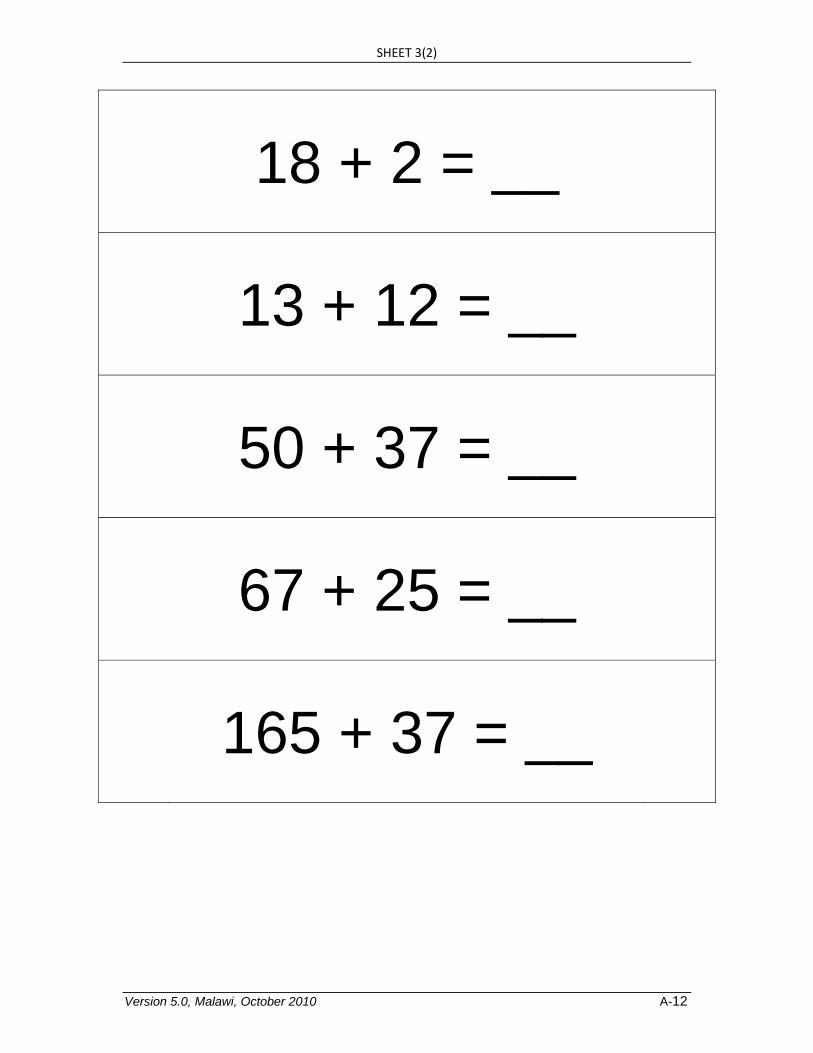
SHEET 3(2)
Version 5.0, Malawi, October 2010 A-12
18 + 2 = __
13 + 12 = __
50 + 37 = __
67 + 25 = __
165 + 37 = __

SHEET 3(2)
Version 5.0, Malawi, October 2010 A-13
5 – 4 = __
9 – 5 = __
8 – 6 = __
7 – 3 = __
10 – 4 = __
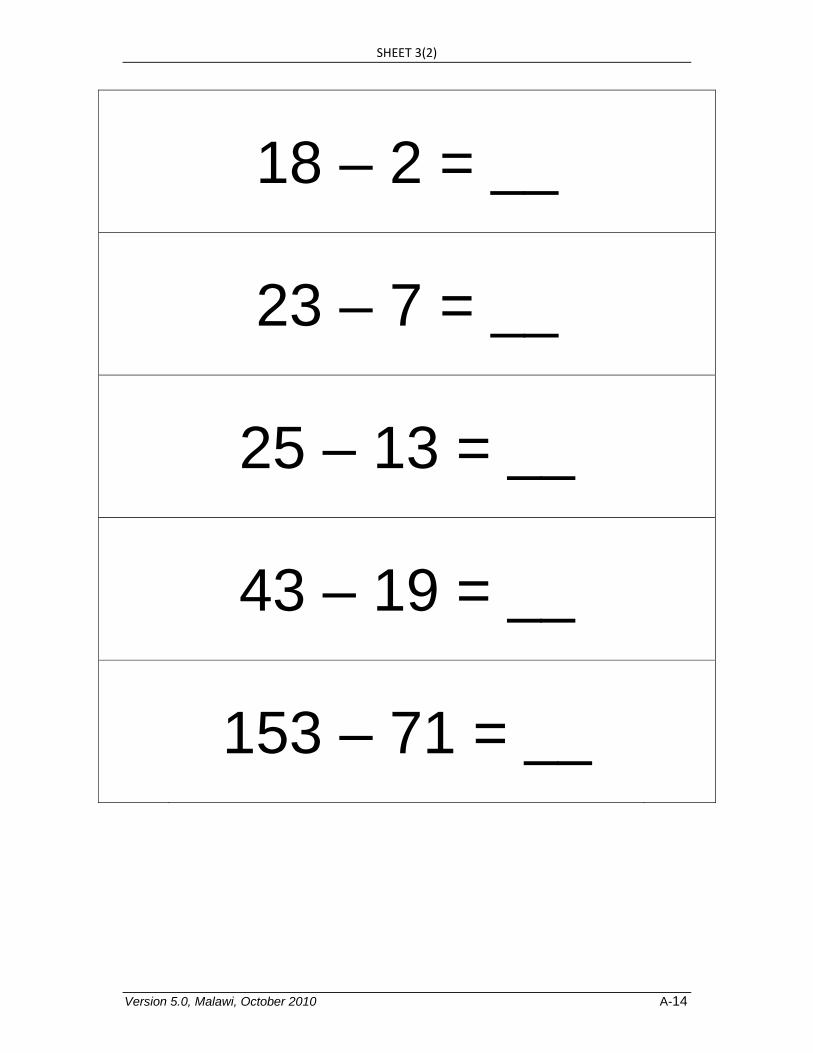
SHEET 3(2)
Version 5.0, Malawi, October 2010 A-14
18 – 2 = __
23 – 7 = __
25 – 13 = __
43 – 19 = __
153 – 71 = __
B-1
Annex B: Malawi Early Grade Math Assessment: Student Response Form, Administrator Instructions and Protocol, October 2010
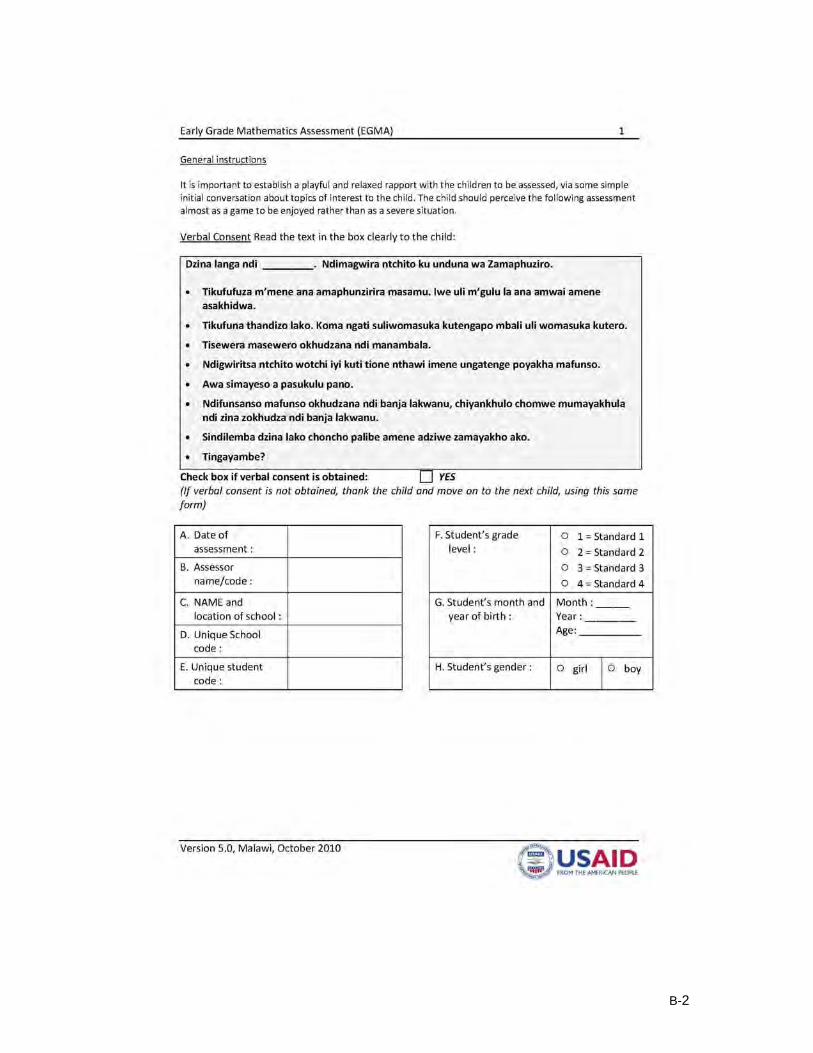
B-2

B-3
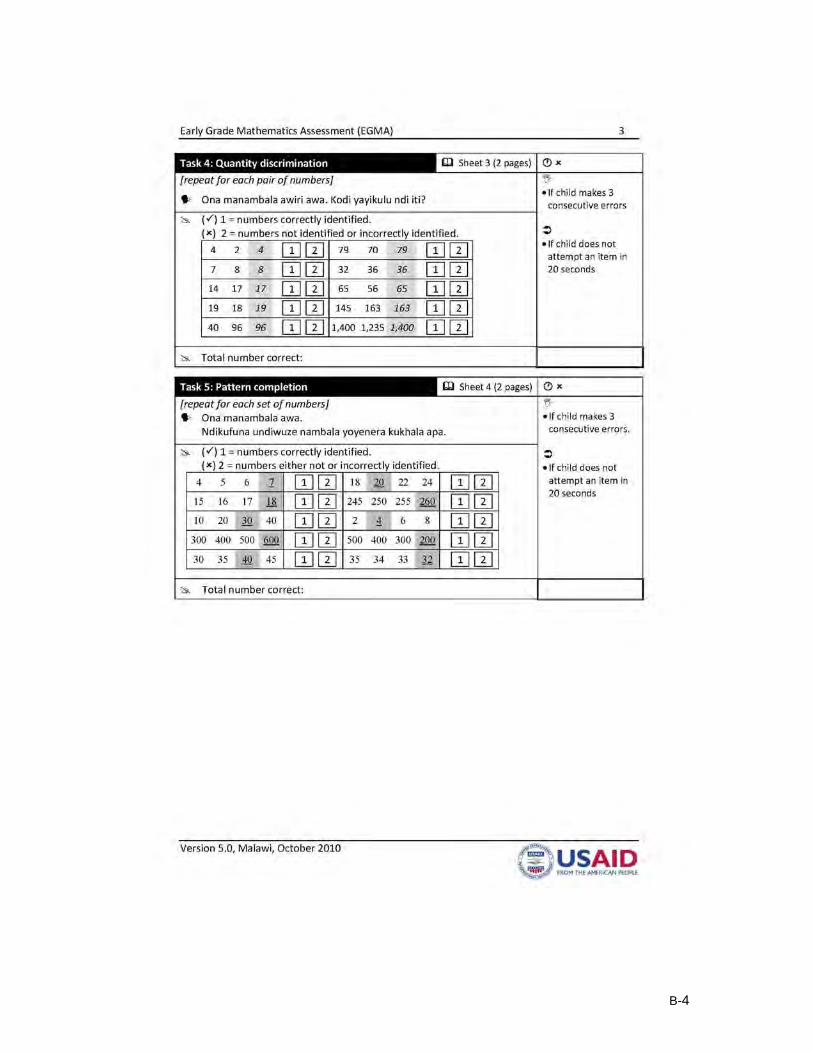
B-4

B-5
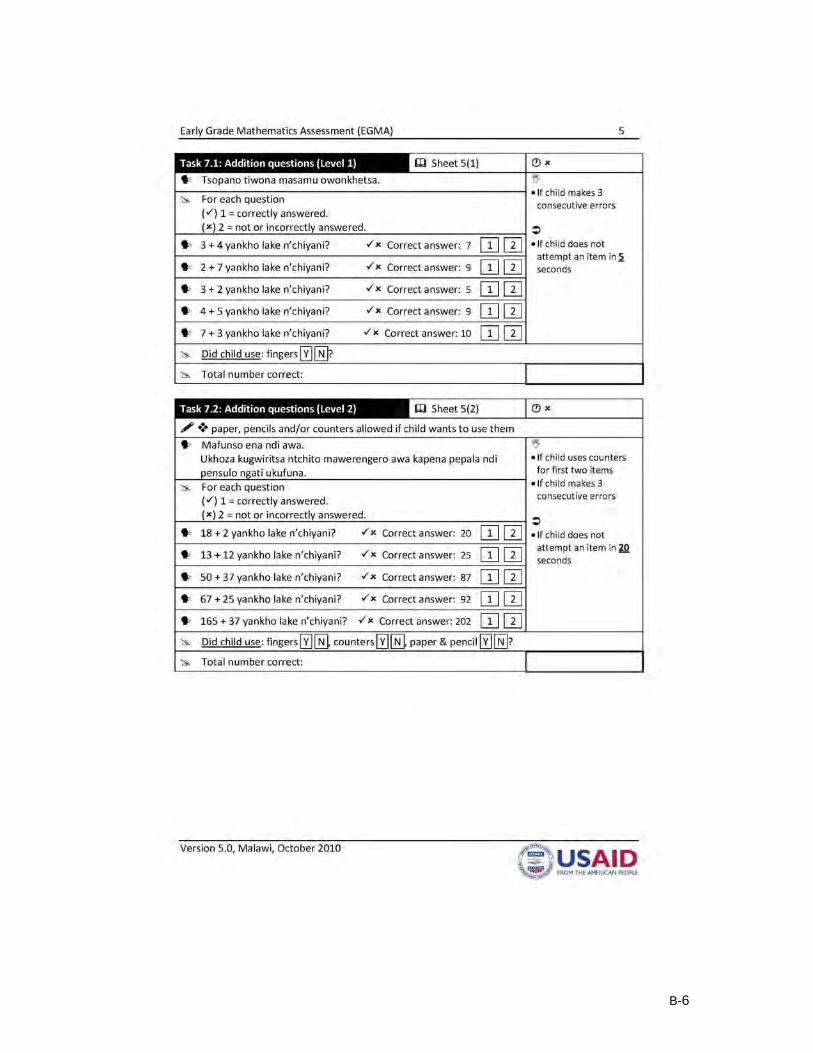
B-6

B-7
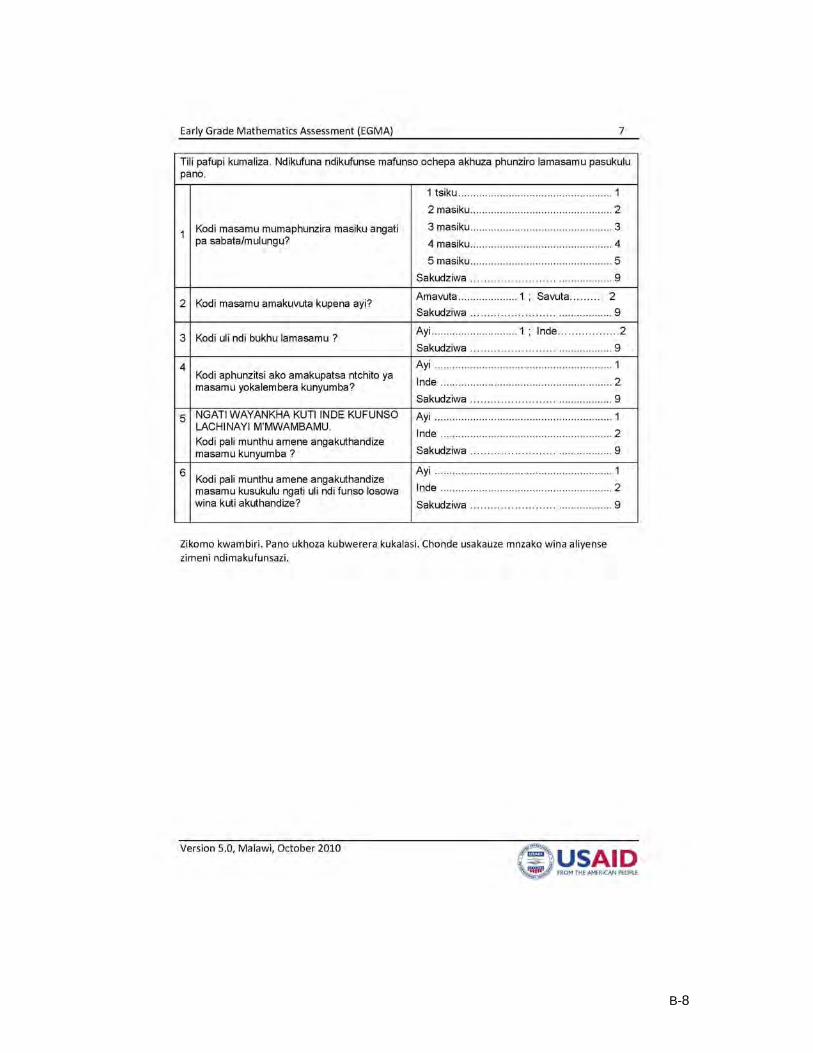
B-8

C-1
Annex C. Instrument Validity and Reliability
Adaptation
EGMA assessments are always adapted to fit the context that is appropriate to the
population being tested. All of the people involved in the adaptation process are specialists
in numeracy / mathematics and evaluation in the country. The assessment as a whole, as
well as each of the individual subtests, were studied by participants to assure that the
content would be familiar to the children being assessed and that the contexts used in word
problems are accessible to children in the Malawi. All of the questions were translated into
Chichewa. They were then translated in the field into Tumbuka and Chiyao by enumerators
based on the learner’s dominant language.
Pre‐testing and Pilot Testing
During pre‐testing, student instructions, examples and test items that appeared to be giving
students trouble were refined and improved.
After piloting the instrument, psychometric analysis (Rasch) was undertaken to test
reliability of the data. The results of psychometric analysis guide the researcher to improve
the reliability of an assessment. In theory, two people who are the same in terms of the
construct being measured should get the same score across items. There should be a good
distribution of difficulty levels represented, and if possible, a normal distribution in
performance. The analysis also looks for ‘misfit’ items that don’t fit the data model. For
example, if some children who are generally good at the construct (like reading) overall, but
who consistently do poorly on a certain item, or the opposite, an item that poorer students
consistently get correct– and so the item is said to be acting strangely and should be
reviewed. There should not be an excessive amount of misfits though a few can be
expected. Sometimes more ‘misfits’ appear when there are large ceiling and floor effects
(i.e. when the majority of students score close to the maximum or minimum), because of
having very little data to base the model on.
As a result of the psychometric analysis, a few items were added where there were “ceiling
effects” meaning that a group of learners at the top of the ability range were easily able to
do the most difficult items. On word problems and pattern completion there were “floor
effects”, meaning that very few standard 2 learners could get even 1 item correct, but there
was no way to simplify the items further so they remained as they were.
Enumerator Training, Fieldwork and Data Entry
Enumerator Training: One important factor in the reliability of EGMA data is the consistency
and accuracy of enumerator performance. The enumerators who administered EGRA and
EGMA in Malawi went through a rigorous training including an introduction to the
instruments, practice with each other and pilot data collection with children in schools.
Furthermore enumerators were required to take an inter‐rater reliability (IRR) test, which
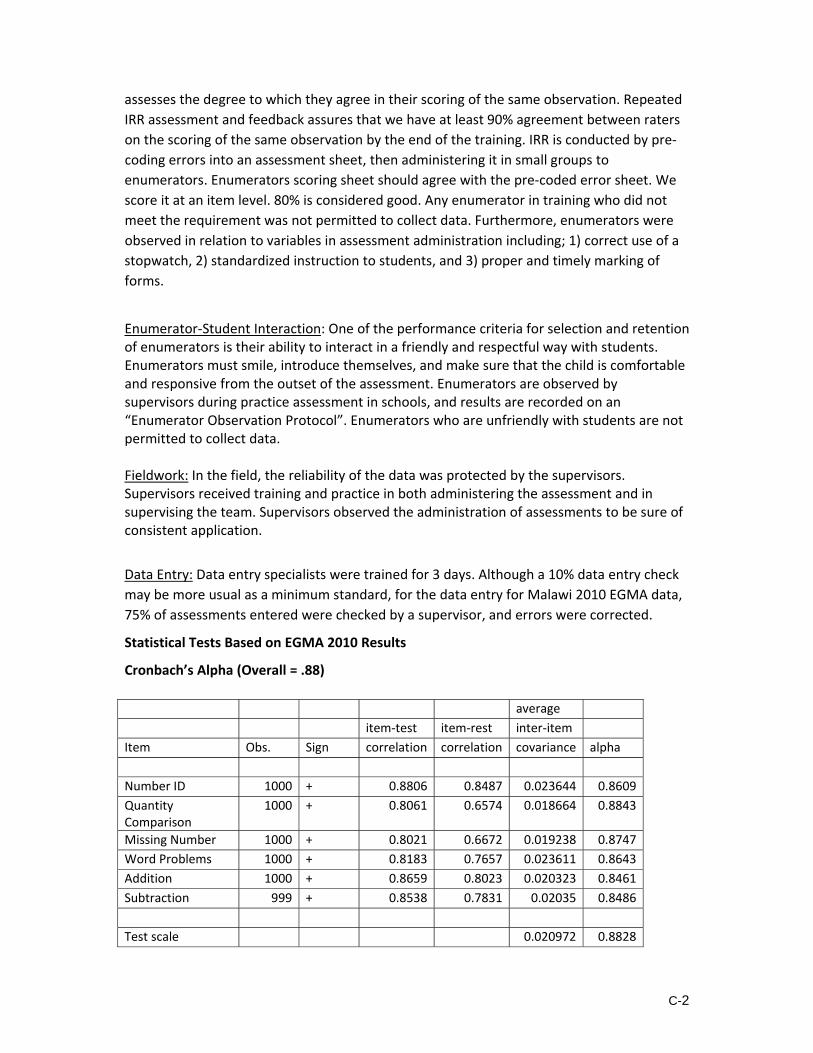
C-2
assesses the degree to which they agree in their scoring of the same observation. Repeated
IRR assessment and feedback assures that we have at least 90% agreement between raters
on the scoring of the same observation by the end of the training. IRR is conducted by pre‐
coding errors into an assessment sheet, then administering it in small groups to
enumerators. Enumerators scoring sheet should agree with the pre‐coded error sheet. We
score it at an item level. 80% is considered good. Any enumerator in training who did not
meet the requirement was not permitted to collect data. Furthermore, enumerators were
observed in relation to variables in assessment administration including; 1) correct use of a
stopwatch, 2) standardized instruction to students, and 3) proper and timely marking of
forms.
Enumerator‐Student Interaction: One of the performance criteria for selection and retention of enumerators is their ability to interact in a friendly and respectful way with students. Enumerators must smile, introduce themselves, and make sure that the child is comfortable and responsive from the outset of the assessment. Enumerators are observed by supervisors during practice assessment in schools, and results are recorded on an “Enumerator Observation Protocol”. Enumerators who are unfriendly with students are not permitted to collect data. Fieldwork: In the field, the reliability of the data was protected by the supervisors. Supervisors received training and practice in both administering the assessment and in supervising the team. Supervisors observed the administration of assessments to be sure of consistent application.
Data Entry: Data entry specialists were trained for 3 days. Although a 10% data entry check
may be more usual as a minimum standard, for the data entry for Malawi 2010 EGMA data,
75% of assessments entered were checked by a supervisor, and errors were corrected.
Statistical Tests Based on EGMA 2010 Results
Cronbach’s Alpha (Overall = .88)
average
item‐test item‐rest inter‐item
Item Obs. Sign correlation correlation covariance alpha
Number ID 1000 + 0.8806 0.8487 0.023644 0.8609
Quantity Comparison
1000 + 0.8061 0.6574 0.018664 0.8843
Missing Number 1000 + 0.8021 0.6672 0.019238 0.8747
Word Problems 1000 + 0.8183 0.7657 0.023611 0.8643
Addition 1000 + 0.8659 0.8023 0.020323 0.8461
Subtraction 999 + 0.8538 0.7831 0.02035 0.8486
Test scale 0.020972 0.8828
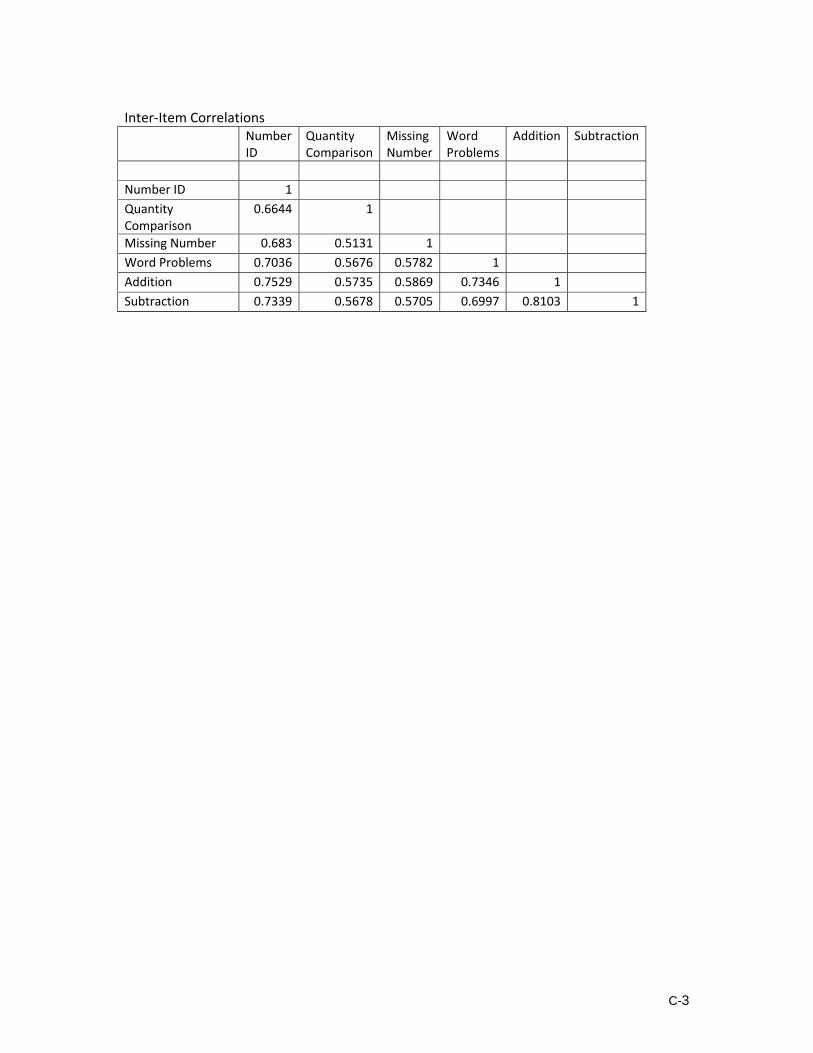
C-3
Inter‐Item Correlations Number
ID Quantity Comparison
Missing Number
Word Problems
Addition Subtraction
Number ID 1
Quantity Comparison
0.6644 1
Missing Number 0.683 0.5131 1
Word Problems 0.7036 0.5676 0.5782 1
Addition 0.7529 0.5735 0.5869 0.7346 1
Subtraction 0.7339 0.5678 0.5705 0.6997 0.8103 1
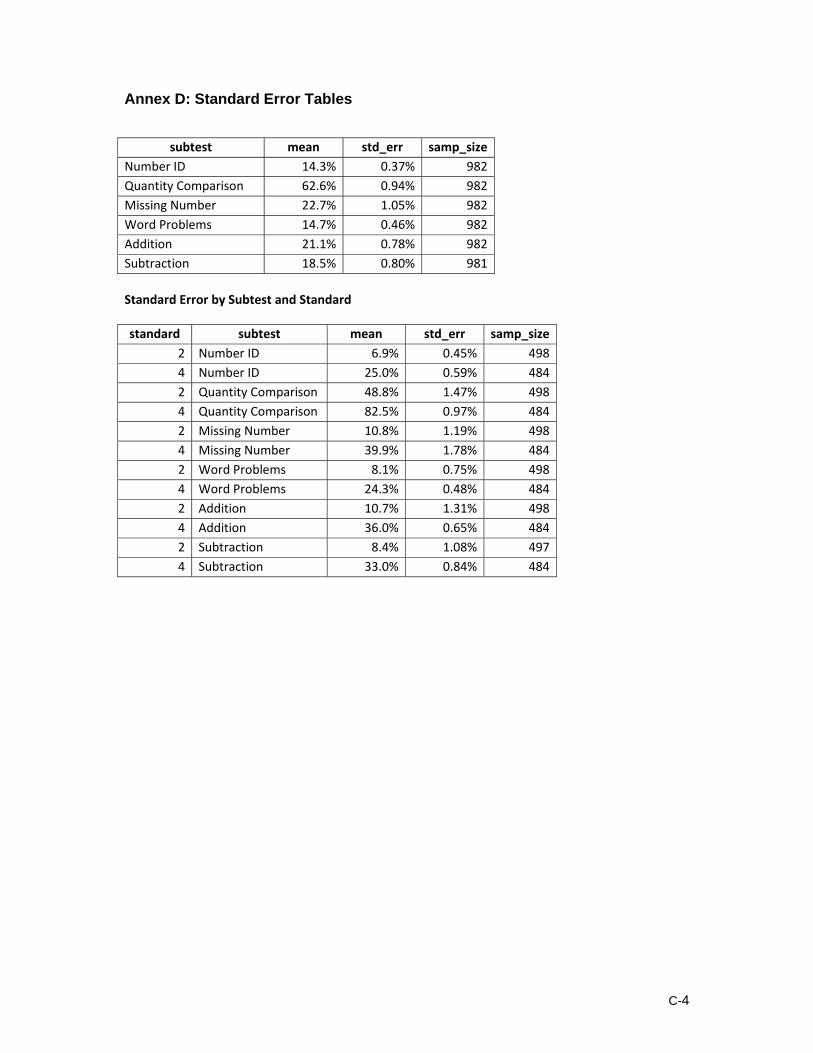
C-4
Annex D: Standard Error Tables
subtest mean std_err samp_size
Number ID 14.3% 0.37% 982
Quantity Comparison 62.6% 0.94% 982
Missing Number 22.7% 1.05% 982
Word Problems 14.7% 0.46% 982
Addition 21.1% 0.78% 982
Subtraction 18.5% 0.80% 981
Standard Error by Subtest and Standard
standard subtest mean std_err samp_size
2 Number ID 6.9% 0.45% 498
4 Number ID 25.0% 0.59% 484
2 Quantity Comparison 48.8% 1.47% 498
4 Quantity Comparison 82.5% 0.97% 484
2 Missing Number 10.8% 1.19% 498
4 Missing Number 39.9% 1.78% 484
2 Word Problems 8.1% 0.75% 498
4 Word Problems 24.3% 0.48% 484
2 Addition 10.7% 1.31% 498
4 Addition 36.0% 0.65% 484
2 Subtraction 8.4% 1.08% 497
4 Subtraction 33.0% 0.84% 484