egypt grain and feed update egypt's rejoins market ... gain publications/grain and feed... ·...
TRANSCRIPT
THIS REPORT CONTAINS ASSESSMENTS OF COMMODITY AND TRADE ISSUES MADE BY
USDA STAFF AND NOT NECESSARILY STATEMENTS OF OFFICIAL U.S. GOVERNMENT
POLICY
Date:
GAIN Report Number:
Approved By:
Prepared By:
Report Highlights:
Post is revising downward its wheat import forecast for MY 2016/17 by about 3.4 percent to a total of
11.8 MMT. Growing feed demand by the poultry, aquaculture and livestock sectors will increase corn
exports to Egypt by approximately 3 percent from 8.35 MMT in MY 2015/16 to 8.6 MMT in MY
2016/17. FAS Cairo expects Egypt’s rice and broken rice exports to resume because of high production
and large stocks. Post estimate rice exports at 500,000 MT in MY 2016/17 from MY 2015/16 forecast
of 200,000 MT
Ahmed Wally
Orestes Vasquez
Egypt's rejoins market mainstream with renewed acceptance
of international tolerance for ergot.
Grain and Feed Update
Egypt
10/5/2016
Required Report - public distribution
Wheat
Production:
FAS Cairo forecasts Egypt’s wheat production and planted area in MY 2016/17 at 8.1 MMT and 1.26
million hectares (ha), respectively. FAS Cairo forecast remains unchanged from USDA‘s MY2015/16
official estimate.
The Ministry of Agriculture and Land Reclamation (MALR) through its Agricultural Research Center
(ARC) is currently focused on developing high yielding early maturing varieties that improve water use
efficiency and achieve a high crop intensification rate.
Fraud in Domestic Wheat Procurement
On June 15, 2016, the Government of Egypt (GOE) announced that it bought almost 5 MMT of
domestically produced wheat, exceeding the target of 4 MMT set by the government. The Egyptian
government supports its wheat farmers by purchasing domestic wheat at prices much higher than
international prices. In MY 2015/16 the procurement price was set at LE 420 per ardeb, or US $315 per
MT ($1 = EGP 8.88), a difference of US $125 - $130 per MT from world spot prices, providing
arbitrage opportunities.
Starting with the crop harvested in 2015, the GOE has permitted privately-owned silos to play a role in
the procurement of domestically produced wheat. The private silos buy wheat from farmers at the
subsidized price and are then compensated by the government for it, as well as for its storage.
In an effort to avoid improprieties, the Ministry of Supply and Internal Trade (MOSIT) inspects the
silos before the onset of the harvest, ensuring that these are empty of any imported wheat. Imports are
suspended during the procurement season and transportation of local and imported wheat across
provinces is prohibited.
Once the procurement season begins, private silos are randomly audited by GOE authorities to
determine if the recorded procurement matches their holdings. In cases of discrepancy, the offending
firm must reimburse the government for any difference in addition to a fine of 25 percent of the
falsified, higher amount the silo operator had reported purchasing
This year, widespread allegations of fraud prompted the GOE to increase inspections of privately-
owned silos. After finding inconsistencies, a parliamentary fact finding commission was formed to
investigate the fraud allegations, uncovering a discrepancy of 200,000 tons that had been over reported,
worth LE 560 million ($63 million), from only 10 sites out of 135 sites where private silos and barns
were implementing the program. According to the report, government officials, domestic suppliers, and
private silo owners appear to have colluded by overstating local procurement numbers and pocketing
government payments.
The chief victim of the fallout was the minister of supply, Dr. Khaled Hanafy, who was forced to resign
during a Cabinet meeting held Wednesday August 24th
. The resignation came four days before the
report’s findings were presented to the Parliament, as pressure mounted from all sides for him to step
down. No charges have been formally filed against him.
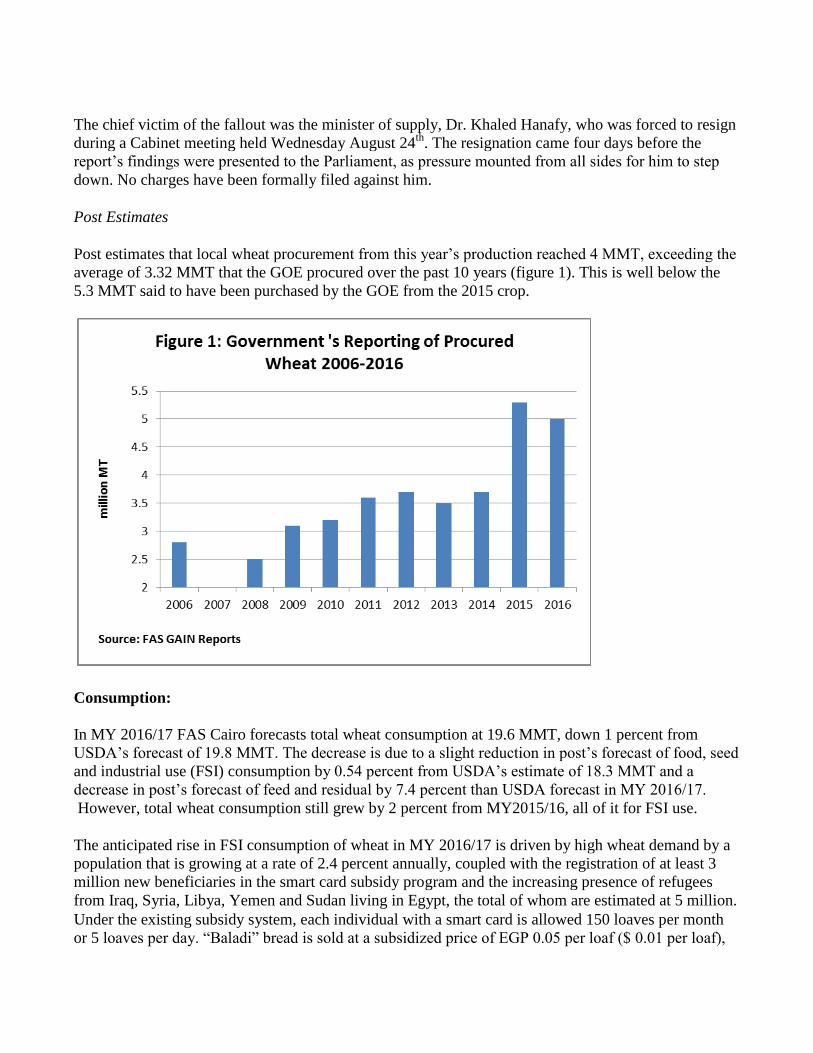
Post Estimates
Post estimates that local wheat procurement from this year’s production reached 4 MMT, exceeding the
average of 3.32 MMT that the GOE procured over the past 10 years (figure 1). This is well below the
5.3 MMT said to have been purchased by the GOE from the 2015 crop.
Consumption:
In MY 2016/17 FAS Cairo forecasts total wheat consumption at 19.6 MMT, down 1 percent from
USDA’s forecast of 19.8 MMT. The decrease is due to a slight reduction in post’s forecast of food, seed
and industrial use (FSI) consumption by 0.54 percent from USDA’s estimate of 18.3 MMT and a
decrease in post’s forecast of feed and residual by 7.4 percent than USDA forecast in MY 2016/17.
However, total wheat consumption still grew by 2 percent from MY2015/16, all of it for FSI use.
The anticipated rise in FSI consumption of wheat in MY 2016/17 is driven by high wheat demand by a
population that is growing at a rate of 2.4 percent annually, coupled with the registration of at least 3
million new beneficiaries in the smart card subsidy program and the increasing presence of refugees
from Iraq, Syria, Libya, Yemen and Sudan living in Egypt, the total of whom are estimated at 5 million.
Under the existing subsidy system, each individual with a smart card is allowed 150 loaves per month
or 5 loaves per day. “Baladi” bread is sold at a subsidized price of EGP 0.05 per loaf ($ 0.01 per loaf),

while the market price is EGP 0.35 per loaf ($ 0.05 per loaf). The government pays the bakers the
difference between the two prices.
The system allows beneficiaries who consume less than the quota amount to convert their bread savings
into points(1 point = $0.01) and spend it on more than 40 food products that can be purchased from
25,000 privately-owned grocery stores partnering with MOSIT or the 5,000 publicly-owned consumer
complexes. The beneficiaries must use the redeemed points during the first twenty days of the following
month or lose them.
According to the Egyptian Ministry of Finance, in FY2015/16 actual spending on food subsidies grew
by three percent to LE 42.2 billion ($4.75 billion at LE8.78 per dollar) from LE 40.8 billion (
$5.3.billion LE 7.78 per dollar) in FY 2014/15. Bread subsidies represented 69.4 percent of the total
expenditures on food subsidies in FY2016/17.
As it is, Egypt still has an expensive and burdensome food subsidy system. MOSIT’s two-year effort to
implement the new subsidy program with the use of smart cards has resulted in progress towards better
access and availability of higher quality bread and a broader array of food products.
MOSIT has made inroads in establishing a cash transfer program targeted to a wide swath of the
Egyptian population but its commodity procurement remains substantial, a function that over time,
arguably, would best be handled by the private sector.
Suffice it to say, significant challenges remain in using smart cards whether associated with the network
connectivity or the availability of enough electronic scanners reading smart cards at bakeries or some
bakeries falsifying bread amounts through entering a larger bread quantity into their electronic scanners
than what they truly gave to the beneficiaries. These opportunities for malfeasance make cash transfers
to intended beneficiaries of the bread subsidy system a compelling option.
Trade:
Post is revising downward its wheat import forecast for MY 2016/17 by 3.38 percent to reach 11.8
MMT. MY 2015/16 wheat imports are being revised downward to 11.6 MMT, 4.1 percent lower than
USDA’s official forecast of 12.075 MMT due to a persistent shortage of foreign currency that has made
opening letters of credit more difficult, significantly hampering imports.
Delays in opening letters of credit for the goods traders supply to state buyers are a recurring problem.
To alleviate this problem, GASC changed the terms of payment for wheat purchased in its tenders. The
letters of credit can now be opened up to 180 days after signing the contract, allowing more time to
secure the necessary amount of dollars needed to complete the transaction.
Switch on, Switch off Ergot Fungus Policy:
Egypt's wheat imports have been disrupted continuously since December of 2015, when a French
shipment was rejected due to Egypt’s attempts to enforce a zero tolerance for ergot. Since the end of
2015, Egypt has implemented and rescinded the policy three times, causing multiple rejections, and
repeated tender annulments. Timeline of A Whirlwind Ergot Policy:
December 2015
Egypt’s Central Administration for Quarantine (CAPQ) rejected a 63,000 MT shipment of French
wheat due to the presence of ergot fungus, despite being below the 0.05 percent threshold. The measure
prompted Bunge, which imported the shipment for GASC, to take legal action against MOSIT. The
first time that Egypt rejects a shipment under the zero-tolerance premise.
January 2016
CAPQ’s former director justifies the rejection of the French shipment on the basis that Egypt’s 2001
quarantine law stipulates the zero tolerance of quarantine pests, indicating that all wheat imports must
be ergot free, in clear contradiction of the Egyptian wheat standard and GASC tender specifications that
stipulate a 0.05 percent tolerance level.
February 2016
GASC cancels tenders number 20, 21 and 23 for the first time in its history, due to the dearth of offers.
Under tender number 22, GASC receives four bids, purchasing wheat of Romanian origin. Egypt's
inconsistency as a customer hits markets at a time of global oversupply, pushing wheat prices down to $
175 per ton.
Despite assurances by the ministers of supply, agriculture, and industry at a press conference that Egypt
is returning to the international level of 0.05 percent ergot level in wheat shipments, traders remain
wary of participating in tender numbers 25 and 26. Those who participate submit bids at a significant
premium.
March 2016
MALR requests the assistance of the Food and Agriculture Organization (FAO) to conduct a pest risk
analysis on the potential of ergot’s transmission to Egyptian agricultural areas.
June 2016
Egypt's prime minister instructs CAPQ to allow wheat shipments under the international standard of
0.05 percent, but CAPQ does not abide by the prime minister’s instructions, and newly applies zero-
tolerance, rejecting a Polish wheat shipment of 30,000 MT and a Canadian wheat shipment of 10,000
MT.
July 2016
CAPQ rejects a U.S. wheat shipment of 33,000 MT, however, the shipment remains at port as a
decision rescinding the zero-tolerance level seems imminent. On July 11, the Minister of Agriculture
issues Ministerial Decree 1117/2016, stipulating that the international tolerance of 0.05 percent ergot
will be applied to all shipments, based on FAO’s recommendation.
While the decision is a positive one, CAPQ once again rejects the aforementioned US wheat shipment
on July 14, claiming that the ergot level was at 0.096, despite testing at 0.006 percent under the
Ministry of Health’s inspection. Efforts to have the shipment retested are rejected. The shipment is
diverted to the EU and milled in Italy.
August 2016
MALR adopts a new ministerial decree reinstating the zero-percent ergot level on all wheat shipments,
stating that their pest risk analysis indicates that the fungus may pose a threat to Egyptian crops. GASC
changes its tender specifications, bringing them in line with quarantine's zero-tolerance policy. Egypt's
health ministry adopts a zero-ergot stance, bringing all three ministries that oversee the policy in line for
the first time.
GASC cancels FY 2016/17 tenders number 5 and tender number 7. No explanation is given why Tender
number 5 was cancelled. Tender number 7 is cancelled because only one offer is submitted.
September 2016
Egyptian inspectors reject a Romanian wheat shipment of 63,000MT at port of origin for traces of
ergot, despite being under the 0.05 percent level. The Romanian trader asks the GOE to return
approximately $500,000 it put down as a guarantee for wheat supplies it can no longer ship.
A 60,000 MT Russian wheat shipment is rejected at origin in Novorossiysk, followed by the rejection
of a second Russian wheat shipment of 33,000 MT at the Egyptian port of Damietta in Egypt which had
arrived in late July. Rejection of shipments prompts traders to boycott GASC wheat tenders number 8
and 9 which are both cancelled.
Russia bans imports of Egyptian fruits and vegetables citing phytosanitary concerns, but the move is
seen as a retaliatory response to the rejection of Russia’s wheat shipments. In 2015, Egypt’s citrus
exports to Russia were 400,000 MT, while Egyptian potato exports were 135,000 MT.
On September 21, due to the absence of bids in three consecutive tenders and looming retaliatory
actions by Egypt’s trading partners, the GOE once again rescinds its zero-tolerance ergot policy and
reinstitutes the international standard of 0.05 percent. In addition, it announced that an international
firm will be contracted to inspect imported wheat at origin, a change from the current system that
involves sending a six-member government team to inspect shipments at origin, which is viewed as an
unnecessary junket costing Egyptian consumers an additional $1.5 to $2 per MT.
In a press conference, the Minister of Health rebuked the Ministry of Agriculture’s claims that since
2011 no wheat shipments containing ergot were allowed into Egypt, with the former clarifying that out
of 313 public-sector wheat shipments entering Egypt from 2011 until August 2016, 131 shipments or 42
percent of all shipments had ergot presence below 0.05 percent.
On September 22, following the cancellation of the zero percent policy, GASC received a range of bids
for tender number 10, and not surprisingly, all the winning bids are Russian origin. The results are the
following: 60,000 MT of Russian wheat from Aston at $179.0 FOB per MT and three other 60,000 ton
awards for Russian wheat from Friends at $178.78 FOB per MT.
Wheat Imports
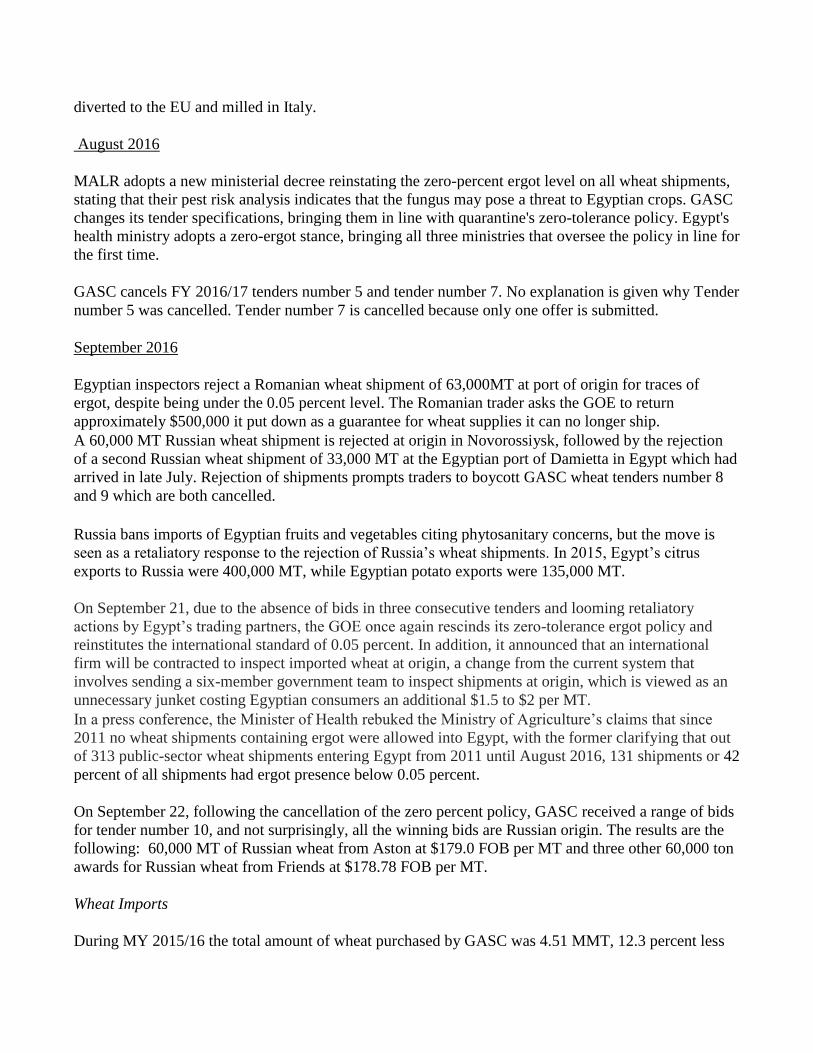
During MY 2015/16 the total amount of wheat purchased by GASC was 4.51 MMT, 12.3 percent less
than MY 2014/15 imports. Top suppliers to GASC were Russia with 1.88 MMT, Romania with 960,000
MT, France with 780,000 MT, Ukraine with 635,000 MT and Argentina with 240,000MT (Table 1).
GASC wheat imports as of July 2016 to Sept 20, 2016 amounted to 840,000 MT (Table 2), against
1.46MMT during the same period in 2015.
Table 1: GASC wheat purchases in MY 2015/16.
Tender No
Tender date Origin Tonnage /MT Total/MT
1 07/01/2015 Romania 60,000 60,000
2 07/09/2015 Russia Ukraine
120,000 60,000
180,000
3 07/15/2015 Romania Russia
120,000 115,000
235,000
4 07/21/2015 Russia 175,000 175,000
5 08/5/ 2015 Russia 120,000 120,000
6 08/13/ 2015 Russia Ukraine
60,000 115,000
175,000
7 08/27/2015 Russia 60,000 60,000
8 08/28/2015 Ukraine 55,000 55,000
9 09/ 03/2015 Russia
170,000
170,000
10 09/18/2014 France Russia
60,000 175,000
235,000
11 10/ 03/2015 Russia Ukraine
180,000 60,000
240,000
12 10/09/2015 Russia Romania
120,000 60,000
180,000
13 10/15/2015 Russia Romania
180,000 60,000
240,000
14 10/29/2015 France Romania Poland
120,000 60,000 60,000
240,000
15 11/10/2015 Ukraine Russia
55,000 60,000
115,000
16 11/11/2015 Russia France
60,000 60,000
120,000
17 11/25/2015 Russia France
Romania
60,000 120,000 60,000
240,000
18 12/23/2015 Argentina 120,000 120,000
19 1/21/2016 Romania Russia France
60,000 115,000 60,000
235,000
20 2/2/2016 Cancelled 0,000 0,000
21 2/4/2016 Cancelled 0,000 0,000
22 2/11/2016 Romania 60,000 60,000
Tender No Tender Date Origin Tonnage/MT Total/MT
23 2/12/2016 Cancelled - -
24 2/19/2016 Russia France
180,000 60,000
240,000
25 2/27/2016 Argentina France
Romania Ukraine
60,000 60,000
120,000 60,000
300,000
26 3/2/2016 Romania Ukraine
120,000 60,000
180,000
27 3/16/2016 France Ukraine Romania
120,000 60,000 60,000
240,000
28 3/24/2016 France 60,000 60,000
29 4/7/2016 France 60,000 60,000
30 4/12/2016 Romania Ukraine
120,000 55,000
175,000
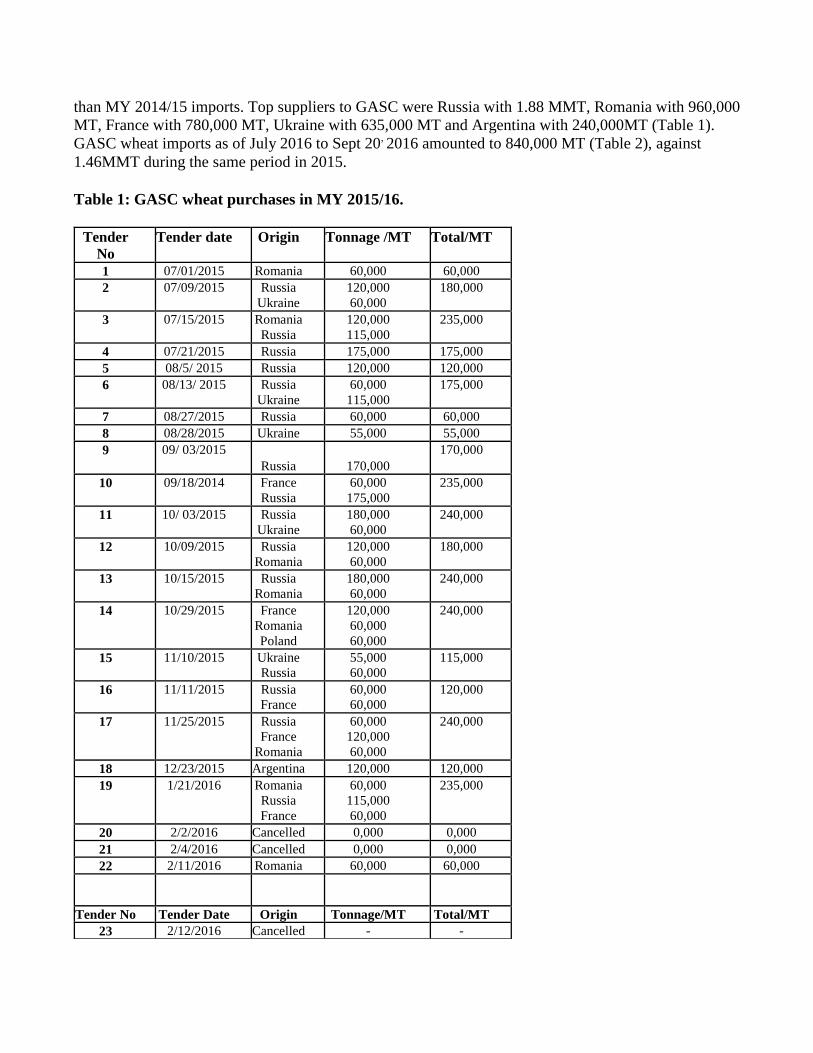
Table 2: GASC wheat purchases as of July 1st 2016
Tender No Tender date Origin Tonnage/MT Total/MT 1 7/12/2016 Russia
Ukraine 120,000 60,000
180,000
2 7/15/2016 Russia Russia
Romania
60,000 60,000
180,000
300,000
3 7/27/2016 Romania Russia
60,000 60,000
120,000
4 8/1/2016 Russia 60,000 60,000 5 8/22/2016 Cancelled - - 6 8/26/2016 Russia 180,000 180,000 7 8/30/2016 Cancelled - - 8 9/16/2016 Cancelled - - 9 9/19/2016 Cancelled - -
10 9/22/2016 Russia Russia Russia
60,000 60,000 60,000
240,000
In MY 2015/16, private sector imports amounted to 7.1 MMT, up 13.8 percent from MY 2014/15. The
increase in the private sector’s share of imports is driven by favorable market prices, liberalized flour
prices under the current bread subsidy system, and 8-9 percent growth in the baking and pasta sectors
requiring different varieties and qualities of wheat.
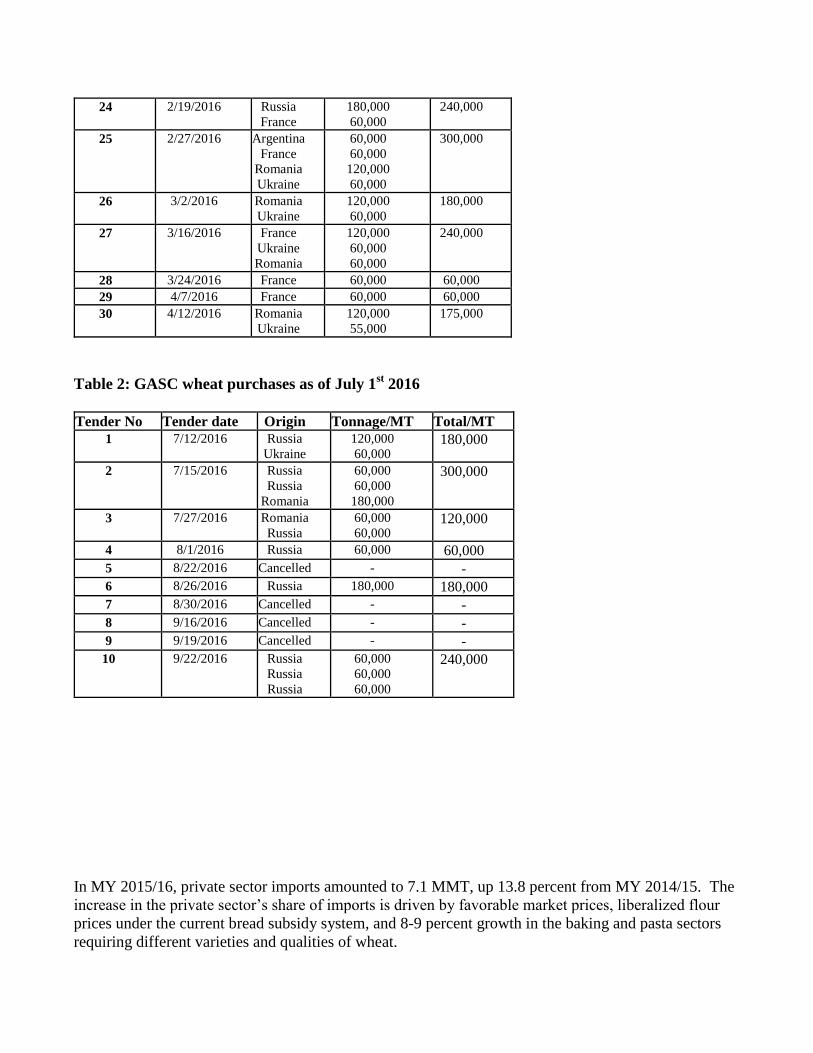
Top suppliers of wheat to Egypt in MY 2015/16 are Russia with 6.0 MMT, Ukraine 2.4 MMT,
Romania 1.2 MMT and France with 933,000 MT.
Stocks:
Post forecasts that MY2016/17 ending stocks will be 4.073 MMT, a decrease of approximately 3.7
percent from Post’s MY2015/16 estimate of 4.223 MMT which was revised downward from USDA’s
official estimate of 4.698 MMT. The decrease in ending stocks of MY 2015/16 is attributed to lower
imports because of the pursuit of zero tolerance for ergot as well as foreign exchange availability
challenges.
GASC usually maintains 5-6 months’ supply of stocks, which include wheat imports in the pipeline. As
such, three months’ supply is in country, while an additional 2-3 months of supply is on its way to
Egypt.
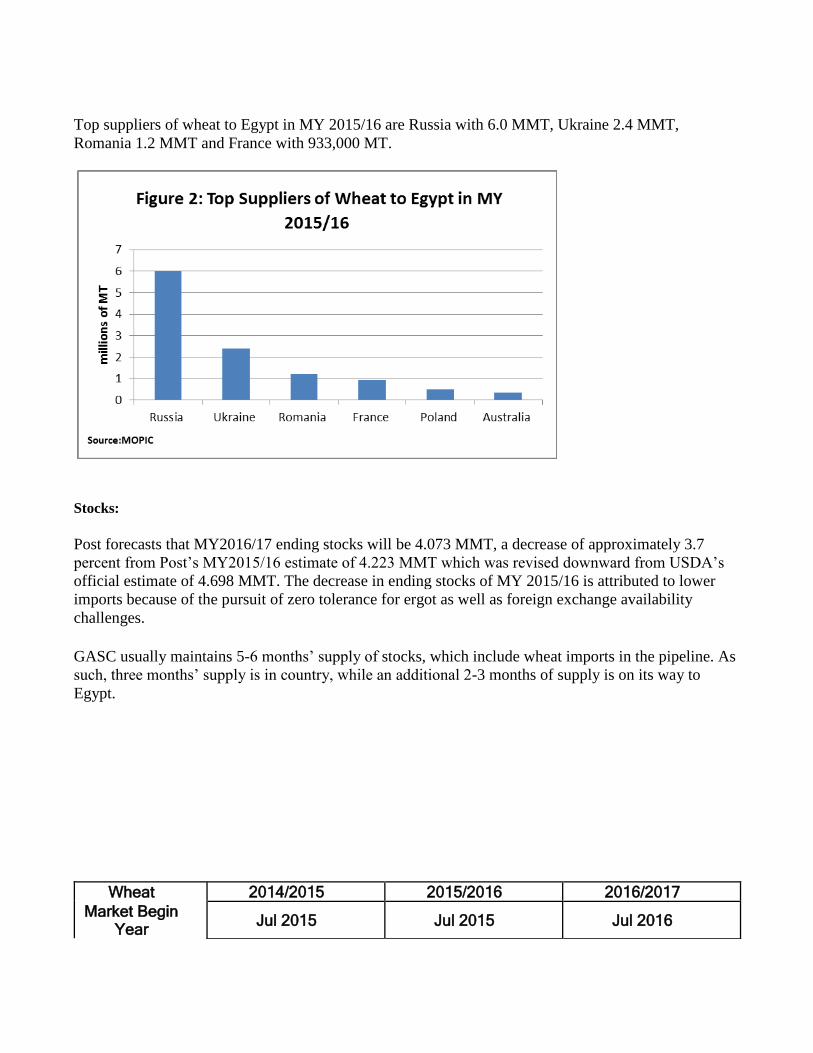
Wheat 2014/2015 2015/2016 2016/2017
Market Begin Year
Jul 2015 Jul 2015 Jul 2016
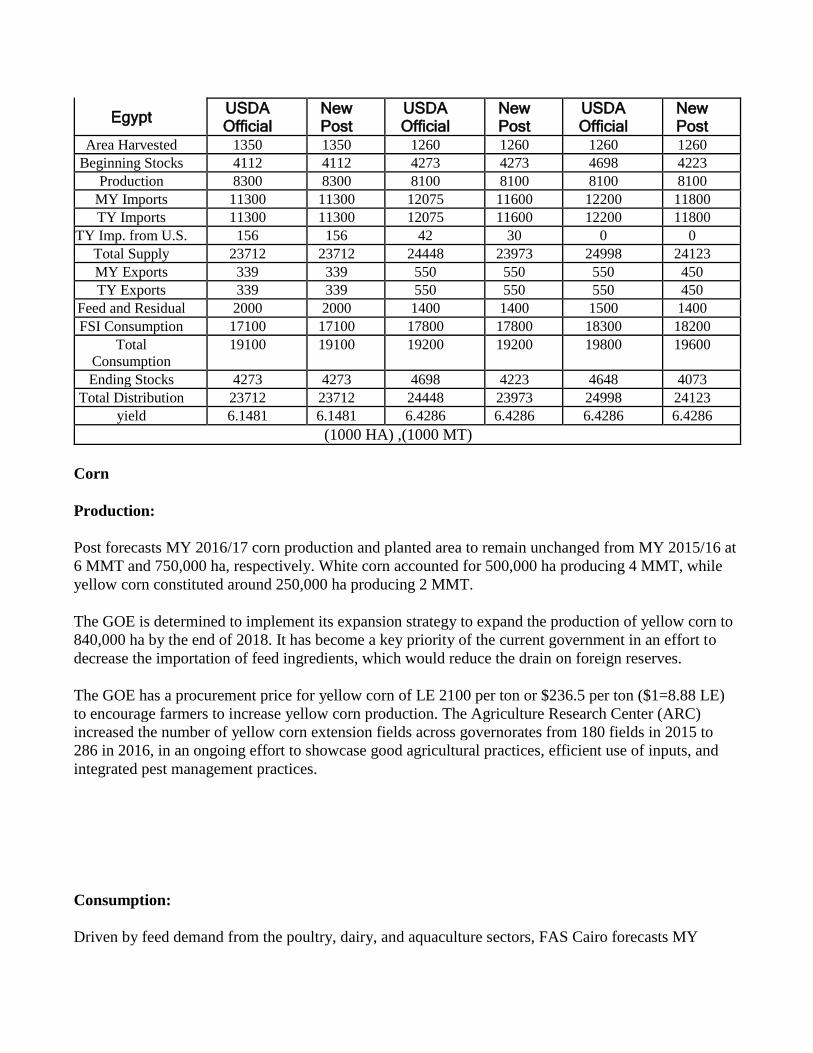
Egypt USDA Official
New Post
USDA Official
New Post
USDA Official
New Post
Area Harvested 1350 1350 1260 1260 1260 1260
Beginning Stocks 4112 4112 4273 4273 4698 4223
Production 8300 8300 8100 8100 8100 8100
MY Imports 11300 11300 12075 11600 12200 11800
TY Imports 11300 11300 12075 11600 12200 11800
TY Imp. from U.S. 156 156 42 30 0 0
Total Supply 23712 23712 24448 23973 24998 24123
MY Exports 339 339 550 550 550 450
TY Exports 339 339 550 550 550 450
Feed and Residual 2000 2000 1400 1400 1500 1400
FSI Consumption 17100 17100 17800 17800 18300 18200
Total
Consumption 19100 19100 19200 19200 19800 19600
Ending Stocks 4273 4273 4698 4223 4648 4073
Total Distribution 23712 23712 24448 23973 24998 24123
yield 6.1481 6.1481 6.4286 6.4286 6.4286 6.4286
(1000 HA) ,(1000 MT)
Corn
Production:
Post forecasts MY 2016/17 corn production and planted area to remain unchanged from MY 2015/16 at
6 MMT and 750,000 ha, respectively. White corn accounted for 500,000 ha producing 4 MMT, while
yellow corn constituted around 250,000 ha producing 2 MMT.
The GOE is determined to implement its expansion strategy to expand the production of yellow corn to
840,000 ha by the end of 2018. It has become a key priority of the current government in an effort to
decrease the importation of feed ingredients, which would reduce the drain on foreign reserves.
The GOE has a procurement price for yellow corn of LE 2100 per ton or $236.5 per ton ($1=8.88 LE)
to encourage farmers to increase yellow corn production. The Agriculture Research Center (ARC)
increased the number of yellow corn extension fields across governorates from 180 fields in 2015 to
286 in 2016, in an ongoing effort to showcase good agricultural practices, efficient use of inputs, and
integrated pest management practices.
Consumption:
Driven by feed demand from the poultry, dairy, and aquaculture sectors, FAS Cairo forecasts MY
2016/17 consumption at 14.8 MMT an increase of 2.1 percent from MY 2015/16 estimate of 14.5MMT,
which is lowered from USDA’s official estimate by 1.7 percent due to high poultry feed prices, as small
farms reduce poultry production cycles to offset expenses.
Consumption growth in the poultry industry is slowing down as the industry is expected to grow 2-3
percent per year down from 4-5 percent, as the number of consolidations and vertical integration efforts
increase in search of economies of scale. Cairo Poultry, Wadi Group, Al Watania poultry, Al Masrya
poultry, and Al Mansoura poultry have established their own feed plants.
Nonetheless, the big driver for demand growth will be the aquaculture industry, ranking number ten
worldwide but number two in tilapia production. Egypt’s total fish production reached 1.560 MMT in
2015 against 1.482 MMT in 2014. The 5.26 percent increase is driven by an 8.1 percent increase in fish
production from aquaculture (1.137 MMT in 2014 against 1.230 MMT in 2015). The current strategy of
the General Authority for Fish Resources Development (GAFRD) of the MALR is to raise fish
production by 35 percent by 2018 from 2015 to 2.1 MMT.
Marine fish farming projects are a high priority for the government. The projects would increase marine
fish production, generate jobs, and increase the affordability of a select group of species: sea bass,
seabream, mullet, and shrimp. The expected production of the three major projects that the GOE is
currently undertaking is 400,000 MT of marine species annually. The projects are located in the Suez
Canal, East Port Said and the governorate of Kafr El Shiekh. The Kafr El Sheikh project will also
include a feed mill with a capacity of 200,000 MT annually.
To meet increasing feed demand, significant investments in aquaculture feed production are taking
place. Two of the largest aqua-feed companies are Skretting’s Nutreco, which recently tripled its annual
tilapia fish feed capacity to 150,000 MT, followed by Aller Aqua who is doubling its aqua feed
production to 150,000 MT. Aquaculture’s major dietary energy sources include the following inputs:
yellow corn 10–35 percent, wheat bran 20–30 percent, rice bran 10–25 percent and vegetable oils 1–5
percent. It should also be noted that soymeal substitute for some of these ingredients and can comprise
up to 40 percent of aquaculture feed, depending on relative prices.
The depreciating Egyptian pound and the shortage of foreign exchange (FOREX) have contributed to
surging prices of imported feed ingredients, which constitute 70 percent of the country’s feed needs, as
importers turn to the parallel market to meet their FOREX needs, which commands a premium of 30-40
percent over the official exchange rate. Local poultry feed prices have increased by more than 30
percent from January 2016 to August 2016 reaching LE 5000 per MT ($ 530 per MT). Extruded fish
feed has seen a similar trend rising 25 percent to LE 5600 per MT ($ 630.6 per MT).
Trade:
Post forecasts MY 2016/17 imports at 8.6 MMT, down 1.74 percent from USDA forecast of 8.75MMT.
Post is also revising downwards MY2015/16 imports to 8.35 MMT from USDA’s estimate of 8.5
MMT, as importers face FOREX challenges, tapping into the parallel market at a premium of 35-40
percent over the official exchange rate. Egypt’s current production of yellow corn covers less than 10
percent of its feed demand; therefore, surging demand by the expanding feed manufacturing industry
must be met by imports.
2016 year-to-date (Jan – July) corn imports reached 4.5 MMT. The four key suppliers of corn were
Ukraine with 1.48MMT, followed by Argentina with 1.45MMT, Brazil with 833,131 MT and USA
with 512,745 MT.
In 2015, Egypt imported 8.2 MMT of corn, with Ukraine as the leading origin at 2.9 MMT, followed by
Brazil at 2.03 MMT, Argentina at 1.65 MMT and the U.S at 966,000 MT. In CY 2014, the United
States was the largest exporter of corn to Egypt with almost 2.9 MMT of corn, followed by Ukraine
with 2.1MMT and Argentina with 1.6 MMT.
2016 year-to-date imports of U.S. distillers dried grains with soluble (DDGS) reached 67,000 MT
against 72,000 MT during the same period in 2015. 2016 DDGS imports are expected to reach the
same levels of 2015 at 125,000 MT. Egyptian purchases of U.S. DDGS dropped by 17.8 percent from
147,630 MT during 2014 to 125,295 MT in 2015. That reduction in imports was mainly driven by
limited access to FOREX.
2016 year-to-date imports of U.S. corn gluten reached 105,000 MT down from 140,106 MT during the
same period in 2015. Both corn gluten meal and DDGS are used in rations for poultry, dairy and beef
cattle and aquaculture.
Stocks:
Post forecast corn stocks at 1.9 MMT in MY 2016/17, higher than USDA’s stock number by 200,000
MT. The MY 2015/16 stock quantity is raised upward from USDA estimate by 4.9 percent driven by
slower consumption growth.
Corn 2014/2015 2015/2016 2016/2017
Market Begin Year
Oct 2014 Oct 2015 Oct 2016
Egypt USDA New USDA New USDA New
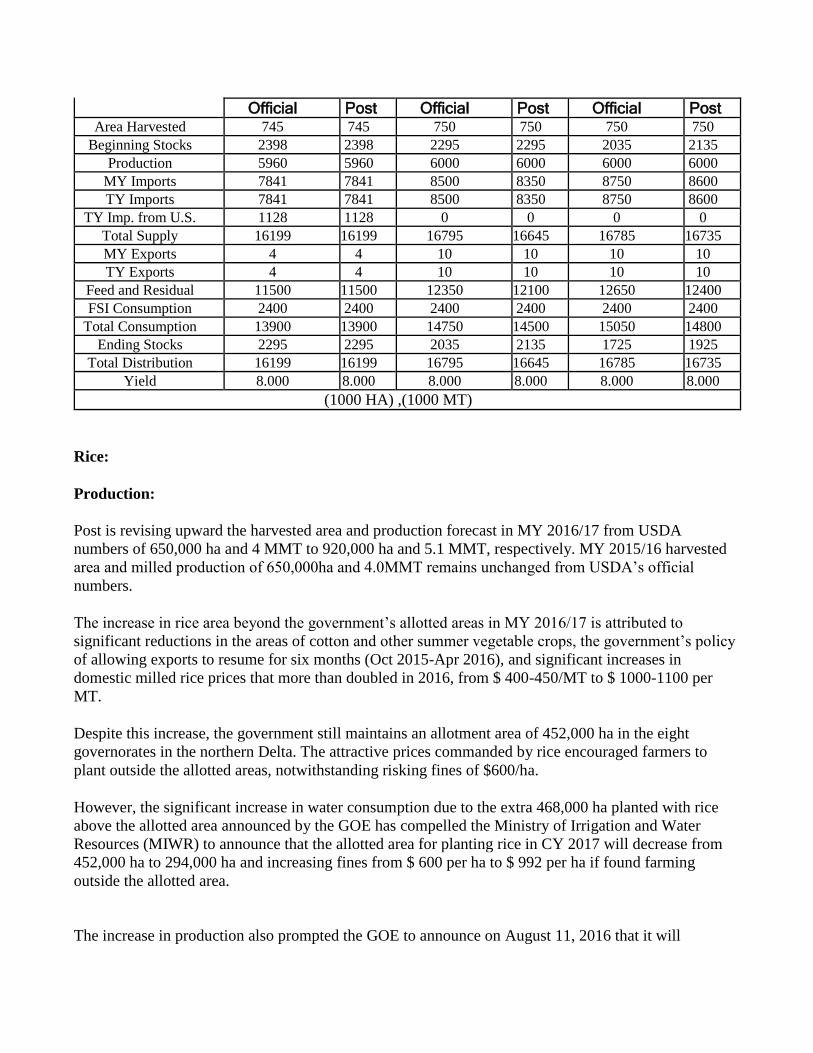
Official Post Official Post Official Post Area Harvested 745 745 750 750 750 750
Beginning Stocks 2398 2398 2295 2295 2035 2135
Production 5960 5960 6000 6000 6000 6000
MY Imports 7841 7841 8500 8350 8750 8600
TY Imports 7841 7841 8500 8350 8750 8600
TY Imp. from U.S. 1128 1128 0 0 0 0
Total Supply 16199 16199 16795 16645 16785 16735
MY Exports 4 4 10 10 10 10
TY Exports 4 4 10 10 10 10
Feed and Residual 11500 11500 12350 12100 12650 12400
FSI Consumption 2400 2400 2400 2400 2400 2400
Total Consumption 13900 13900 14750 14500 15050 14800
Ending Stocks 2295 2295 2035 2135 1725 1925
Total Distribution 16199 16199 16795 16645 16785 16735
Yield 8.000 8.000 8.000 8.000 8.000 8.000
(1000 HA) ,(1000 MT)
Rice:
Production:
Post is revising upward the harvested area and production forecast in MY 2016/17 from USDA
numbers of 650,000 ha and 4 MMT to 920,000 ha and 5.1 MMT, respectively. MY 2015/16 harvested
area and milled production of 650,000ha and 4.0MMT remains unchanged from USDA’s official
numbers.
The increase in rice area beyond the government’s allotted areas in MY 2016/17 is attributed to
significant reductions in the areas of cotton and other summer vegetable crops, the government’s policy
of allowing exports to resume for six months (Oct 2015-Apr 2016), and significant increases in
domestic milled rice prices that more than doubled in 2016, from $ 400-450/MT to $ 1000-1100 per
MT.
Despite this increase, the government still maintains an allotment area of 452,000 ha in the eight
governorates in the northern Delta. The attractive prices commanded by rice encouraged farmers to
plant outside the allotted areas, notwithstanding risking fines of $600/ha.
However, the significant increase in water consumption due to the extra 468,000 ha planted with rice
above the allotted area announced by the GOE has compelled the Ministry of Irrigation and Water
Resources (MIWR) to announce that the allotted area for planting rice in CY 2017 will decrease from
452,000 ha to 294,000 ha and increasing fines from $ 600 per ha to $ 992 per ha if found farming
outside the allotted area.
The increase in production also prompted the GOE to announce on August 11, 2016 that it will
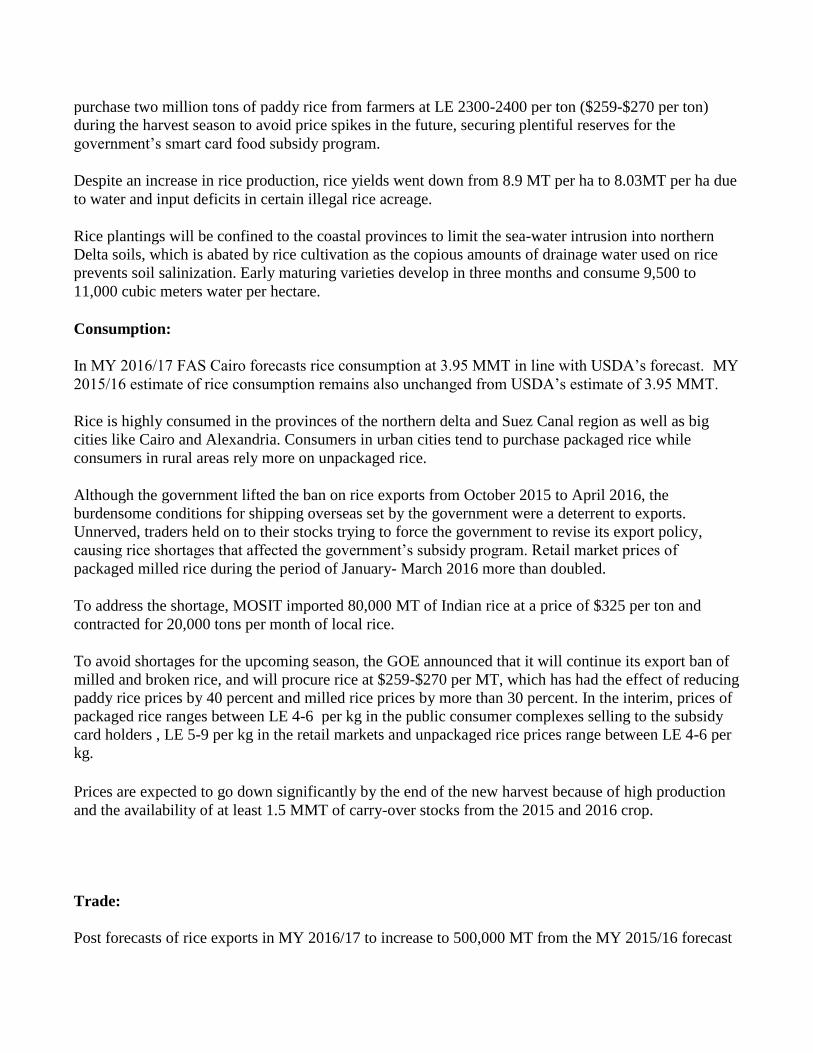
purchase two million tons of paddy rice from farmers at LE 2300-2400 per ton ($259-$270 per ton)
during the harvest season to avoid price spikes in the future, securing plentiful reserves for the
government’s smart card food subsidy program.
Despite an increase in rice production, rice yields went down from 8.9 MT per ha to 8.03MT per ha due
to water and input deficits in certain illegal rice acreage.
Rice plantings will be confined to the coastal provinces to limit the sea-water intrusion into northern
Delta soils, which is abated by rice cultivation as the copious amounts of drainage water used on rice
prevents soil salinization. Early maturing varieties develop in three months and consume 9,500 to
11,000 cubic meters water per hectare.
Consumption:
In MY 2016/17 FAS Cairo forecasts rice consumption at 3.95 MMT in line with USDA’s forecast. MY
2015/16 estimate of rice consumption remains also unchanged from USDA’s estimate of 3.95 MMT.
Rice is highly consumed in the provinces of the northern delta and Suez Canal region as well as big
cities like Cairo and Alexandria. Consumers in urban cities tend to purchase packaged rice while
consumers in rural areas rely more on unpackaged rice.
Although the government lifted the ban on rice exports from October 2015 to April 2016, the
burdensome conditions for shipping overseas set by the government were a deterrent to exports.
Unnerved, traders held on to their stocks trying to force the government to revise its export policy,
causing rice shortages that affected the government’s subsidy program. Retail market prices of
packaged milled rice during the period of January- March 2016 more than doubled.
To address the shortage, MOSIT imported 80,000 MT of Indian rice at a price of $325 per ton and
contracted for 20,000 tons per month of local rice.
To avoid shortages for the upcoming season, the GOE announced that it will continue its export ban of
milled and broken rice, and will procure rice at $259-$270 per MT, which has had the effect of reducing
paddy rice prices by 40 percent and milled rice prices by more than 30 percent. In the interim, prices of
packaged rice ranges between LE 4-6 per kg in the public consumer complexes selling to the subsidy
card holders , LE 5-9 per kg in the retail markets and unpackaged rice prices range between LE 4-6 per
kg.
Prices are expected to go down significantly by the end of the new harvest because of high production
and the availability of at least 1.5 MMT of carry-over stocks from the 2015 and 2016 crop.
Trade:
Post forecasts of rice exports in MY 2016/17 to increase to 500,000 MT from the MY 2015/16 forecast
of 200,000 MT. Egypt’s rice trade policy severely restricts private traders’ ability to conduct business,
but as large amounts of stocks are accumulating, so is the pressure to ease its restrictions. Private traders
and millers of the Agriculture Export Council (AEC) and the Chamber of Cereal Industries (CCI) are
urging the Ministry of Trade and Industry to reconsider its decision to ban rice and broken rice exports.
FAS Cairo expects the government to ease its export conditions, and allow trade to resume for a brief
period after it secures the rice needed for its smart card food subsidy program. A clearer picture will
emerge in December of 2016. If Egypt allowed the market to work its course, it would be able to sell
close to 1 MMT of rice in the international marketplace.
MY 2015/16 exports will remain in line with USDA estimates. During the six-month period from
October 2015 to the end of March 2016, Egypt officially exported 45, 000 MT of milled rice and
90,000MT of broken rice. According to some sources, it is estimated that around 60,000-65,000 MT of
milled rice were smuggled into Libya and Sudan.
Stocks:
Post forecast that ending rice stocks in MY 2016/17 will be 1.53 MMT upward from USDA’s official
forecast of 739,000 MT as stocks accumulate due to larger production and the government’s ban on
exports. In late September 2016, the GOE announced that there is no intention to lift the ban on milled
rice or broken rice exports, but it is likely that a new export period maybe announced after the harvest is
finalized and the government builds a stock for its subsidy program. MY 2015/16 stock estimate
remains unchanged from USDA’s official estimate of 854,000 MT.
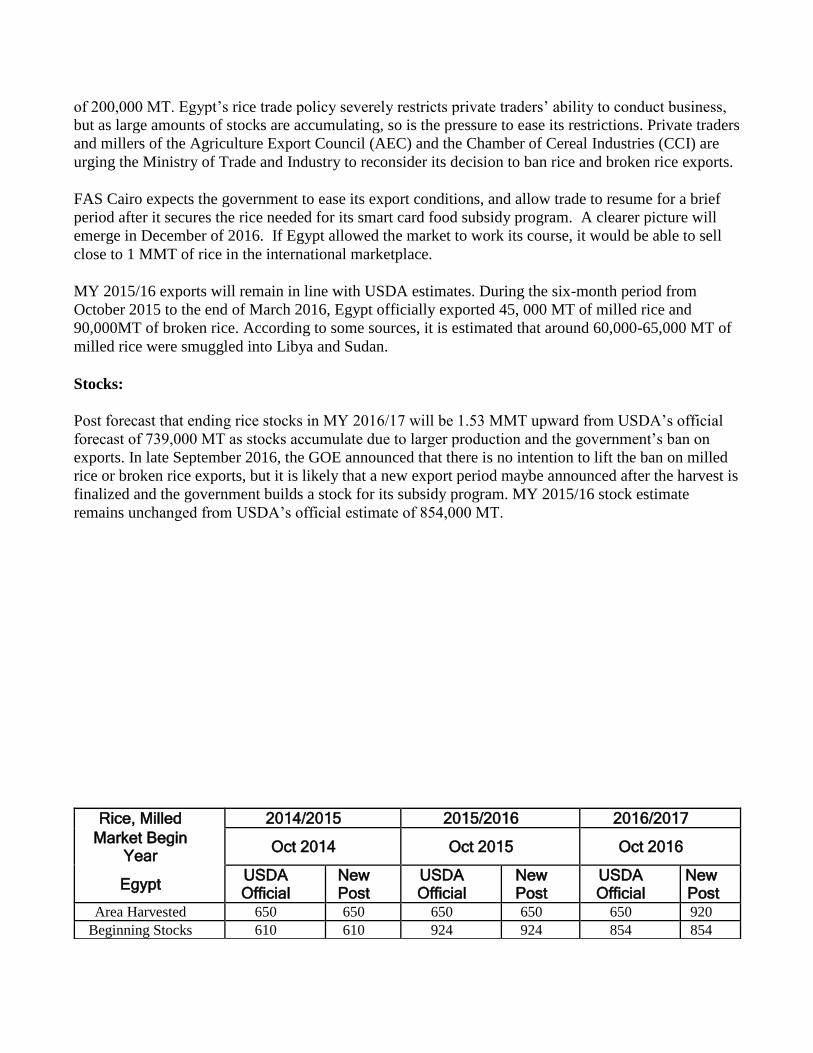
Rice, Milled 2014/2015 2015/2016 2016/2017
Market Begin Year
Oct 2014 Oct 2015 Oct 2016
Egypt USDA Official
New Post
USDA Official
New Post
USDA Official
New Post
Area Harvested 650 650 650 650 650 920
Beginning Stocks 610 610 924 924 854 854
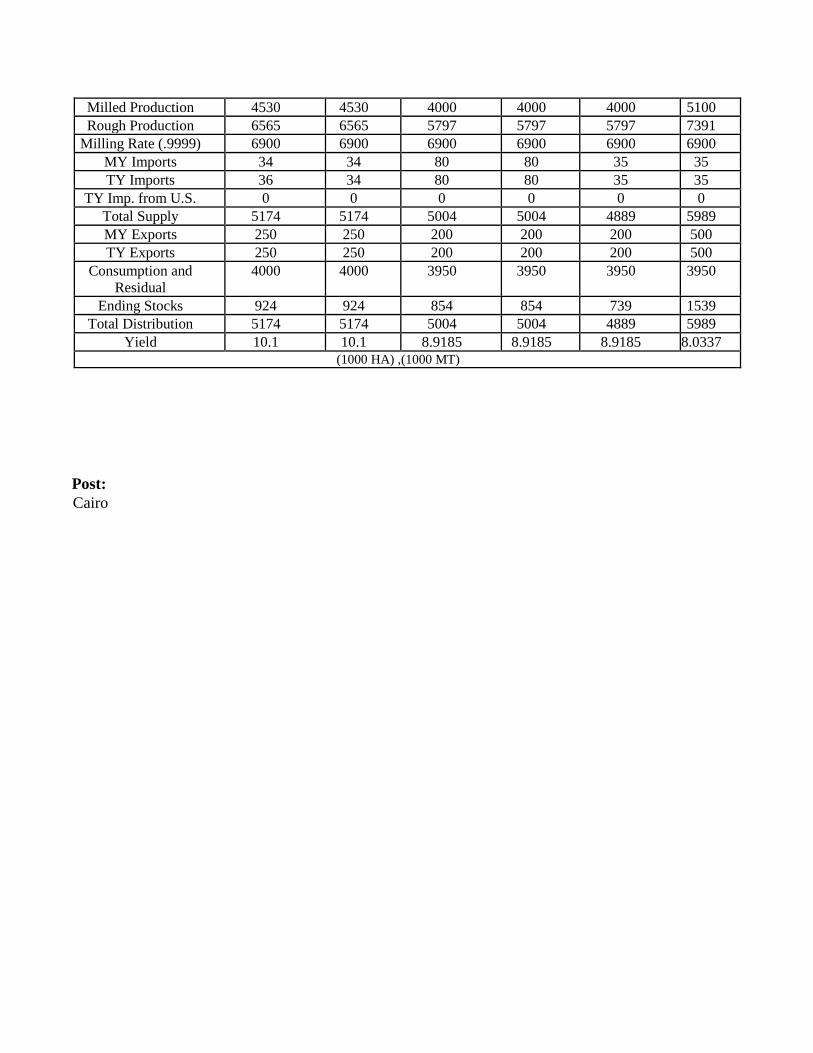
Milled Production 4530 4530 4000 4000 4000 5100
Rough Production 6565 6565 5797 5797 5797 7391
Milling Rate (.9999) 6900 6900 6900 6900 6900 6900
MY Imports 34 34 80 80 35 35
TY Imports 36 34 80 80 35 35
TY Imp. from U.S. 0 0 0 0 0 0
Total Supply 5174 5174 5004 5004 4889 5989
MY Exports 250 250 200 200 200 500
TY Exports 250 250 200 200 200 500
Consumption and
Residual 4000 4000 3950 3950 3950 3950
Ending Stocks 924 924 854 854 739 1539
Total Distribution 5174 5174 5004 5004 4889 5989
Yield 10.1 10.1 8.9185 8.9185 8.9185 8.0337 (1000 HA) ,(1000 MT)
Post:
Cairo