ehp environmental health perspectiveseb9ec12a-9f10-428a-a38d-189f567fa6a5}… · environmental...
TRANSCRIPT

ENVIRONMENTALHEALTH PERSPECTIVES
ENVIRONMENTALHEALTH PERSPECTIVES
National Institutes of HealthU.S. Department of Health and Human Services
Global Magnitude of Reported and Unreported Mesothelioma
Eun-Kee Park, Ken Takahashi, Tsutomu Hoshuyama,Tsun-Jen Cheng, Vanya Delgermaa,
Giang Vinh Le, Tom Sorahan
doi: 10.1289/ehp.1002845 (available at http://dx.doi.org/)Online 6 January 2011
ehponline.org
ehp

1
Global Magnitude of Reported and Unreported Mesothelioma
Eun-Kee Park,1 Ken Takahashi,
1 Tsutomu Hoshuyama,
1 Tsun-Jen Cheng,
2 Vanya Delgermaa,
1
Giang Vinh Le,1 Tom Sorahan
3
1Department of Environmental Epidemiology, Institute of Industrial Ecological Sciences,
University of Occupational and Environmental Health, Iseigaoka 1-1, Yahatanishiku,
Kitakyushu City, Fukuoka Prefecture 807-8555, Japan
2Institute of Occupational Medicine and Industrial Hygiene, College of Public Health,
National Taiwan University, 17 Shiujou Rd, Taipei 100, Taiwan
3Institute of Occupational and Environmental Medicine, University of Birmingham,
Edgbaston, Birmingham, B15 2TT, UK
Correspondence to: Ken Takahashi MD, PhD, MPH
Department of Environmental Epidemiology, Institute of Industrial Ecological Sciences,
University of Occupational and Environmental Health, Iseigaoka 1-1, Yahatanishiku,
Kitakyushu City, Fukuoka Prefecture 807-8555, Japan.
Tel: +81-93-691-7401
Fax: +81-93-601-7324
e-mail: [email protected]
Page 1 of 31

2
Running title: Reported and Unreported Mesothelioma
Key words: asbestos, frequency, mesothelioma, mortality, prediction
Acknowledgements: This work was supported in part by the JSPS (Japan Society for the
Promotion of Sciences) AA (Asia Africa) Science Platform Program. The authors thank Dr.
Kelly Cho, School of Medicine, Yale University, USA and Dr. Megu Ohtaki, Department of
Environmetrics and Biometrics, Research Institute for Radiation Biology and Medicine,
Hiroshima University, Japan for their valuable advice.
Competing financial interest declaration: Takahashi K receives research grant “AA Science
Platform” from the JSPS, for the submitted work. Other authors have no relationships with
the JSPS, AA Science Platform Program that might have an interest in the submitted work in
the previous 3 years.
Abbreviations:
AA: Asia Africa
ACP: Asbestos-Containing Products
ARDs: Asbestos-Related Diseases
CDC: Centers for Disease Control and Prevention
CI: Confidence Interval
CLM: Confidence Limits for the Mean
ICD: International Classification of Diseases
Page 2 of 31
3
JSPS: Japan Society for the Promotion of Sciences
UN: United Nations
USGS: United States Geological Survey
WHO: World Health Organization
Page 3 of 31
4
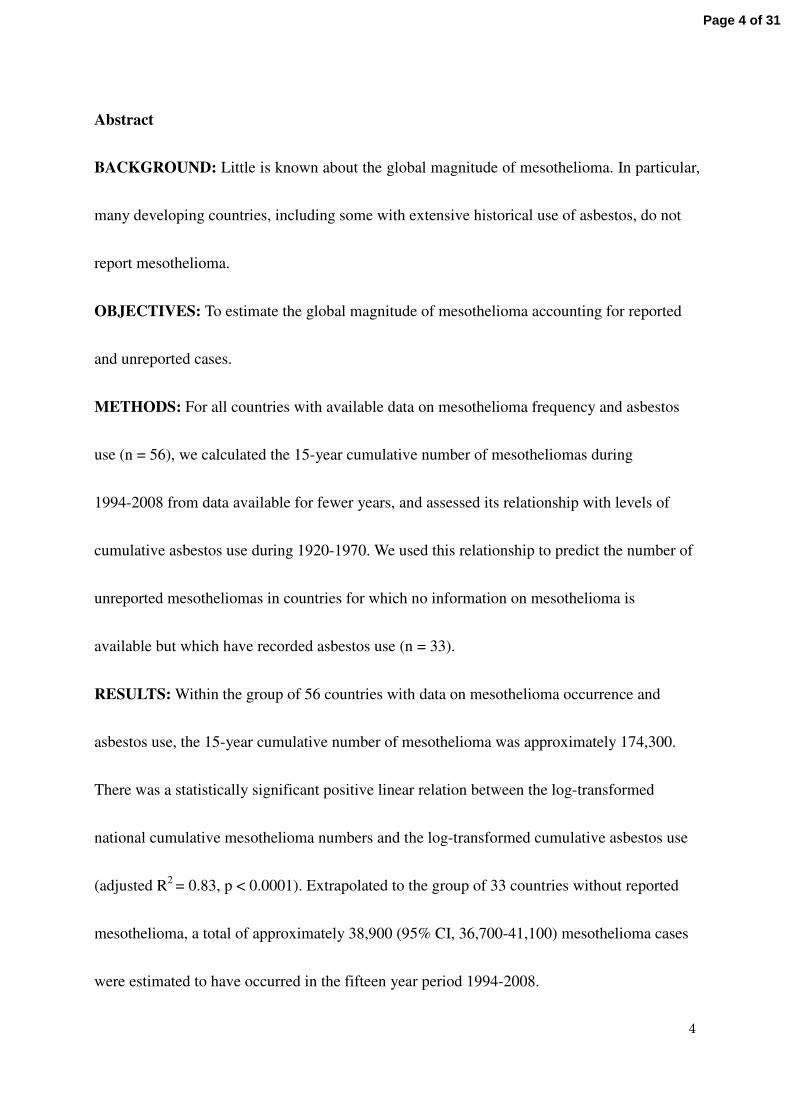
Abstract
BACKGROUND: Little is known about the global magnitude of mesothelioma. In particular,
many developing countries, including some with extensive historical use of asbestos, do not
report mesothelioma.
OBJECTIVES: To estimate the global magnitude of mesothelioma accounting for reported
and unreported cases.
METHODS: For all countries with available data on mesothelioma frequency and asbestos
use (n = 56), we calculated the 15-year cumulative number of mesotheliomas during
1994-2008 from data available for fewer years, and assessed its relationship with levels of
cumulative asbestos use during 1920-1970. We used this relationship to predict the number of
unreported mesotheliomas in countries for which no information on mesothelioma is
available but which have recorded asbestos use (n = 33).
RESULTS: Within the group of 56 countries with data on mesothelioma occurrence and
asbestos use, the 15-year cumulative number of mesothelioma was approximately 174,300.
There was a statistically significant positive linear relation between the log-transformed
national cumulative mesothelioma numbers and the log-transformed cumulative asbestos use
(adjusted R2
= 0.83, p < 0.0001). Extrapolated to the group of 33 countries without reported
mesothelioma, a total of approximately 38,900 (95% CI, 36,700-41,100) mesothelioma cases
were estimated to have occurred in the fifteen year period 1994-2008.
Page 4 of 31

5
CONCLUSIONS: We estimate conservatively that, globally, one mesothelioma case has
been overlooked for every four to five reported cases. As our estimation is based on asbestos
use until 1970, the many countries which increased asbestos use since then should anticipate a
higher disease burden in the immediate decades ahead.
Page 5 of 31

6
Introduction
Malignant mesothelioma is a major public health concern, as this rare form of cancer, caused
specifically by exposure to asbestos, is difficult to diagnose, has extremely poor prognosis
and is on the increase. Epidemics of mesothelioma have been reported nationally (CDC 2009;
Hodgson et al. 2005; Kjellstrom and Smartt 2000; Murayama et al. 2006) and regionally
(Pelucchi et al. 2004; Peto et al. 1999) but available information is biased toward developed
countries/regions (countries hereafter) with the resources to diagnose asbestos-related
diseases (ARDs) and with known historic use of asbestos. At present, mesothelioma is grossly
underreported in many developing countries (LaDou 2004; Takahashi and Karjalainen 2003),
including some with known extensive use of asbestos.
Few attempts have been made to quantify the global incidence of mesothelioma. In a 2005
study of the total burden of occupational carcinogens (Driscoll et al. 2005), Driscoll et al.
reported 43,000 mesothelioma deaths per year, based on an estimated proportion of exposed
workers and levels of exposure, combined with absolute risk measures. This number,
endorsed in a World Health Organization (WHO) document on the elimination of ARDs
(WHO 2006), is widely quoted to guide preventive activities. However, there has been no
validation or reassessment of this 2005 estimate possibly because the indices that were used
are difficult to access and reproduce. Commonly available statistics should be utilized to
address the shortage of information, which may also improve estimates of the disease burden.
Page 6 of 31
7
In a previous study (Lin et al. 2007), we calculated the volume of asbestos consumed per
head (per capita asbestos use) from a report by the U.S. Geological Survey (USGS) (Virta
2006), and used this value as a surrogate for population exposure level. Our results indicated
that rates of past asbestos use can predict recent death rates from four types of ARDs at
national levels, and explained the bulk of the variance (Lin et al. 2007). This relationship,
albeit ecological, is likely to reflect a causal relationship. Other researchers have used this
surrogate indicator to estimate or predict ARDs in different populations (Antao et al. 2009;
Tse et al. 2010).
Information related to mesothelioma frequency is accumulating in relation to the growing
number of national and regional registries (Leigh and Driscoll 2003; Marinaccio et al. 2007).
In the present study, we estimate the magnitude of mesothelioma in the world accounting for
both reported and unreported numbers by utilizing a global database and extending our
previous ecological model. We incorporate updated data from the widest possible sources of
information, assuming that mortality reflects incidence for this fatal form of cancer. We
employ cumulative indicators of asbestos use and number of mesothelioma cases,
hypothesizing that recent national burden of mesothelioma is a consequence of historical
cumulative use of asbestos. This relationship is then applied to countries that lack relevant
health data.
Page 7 of 31
8
Materials and Methods
We extracted all data on asbestos use from a report by the USGS (Virta 2006, 2009). We
adopted the USGS definition of use (production plus import minus export), the data for which
are available by country, in 10-year intervals from 1920 to 1970, in 5-year intervals from
1970 to 1995, and annually from 1995 to 2007. We treated a reported negative value of
asbestos use (caused by storage, for example) as zero in this analysis. Using linear
interpolation, cumulative asbestos use was calculated independently for two periods
(1920-1970 and 1971-2007) to allow a sufficient lag time from the earlier period to that of
mesothelioma observation (1994-2008). When necessary, we interpolated values for asbestos
use for the calendar year lacking data.
The cumulative numbers of all types of mesothelioma (C45, International Classification of
Diseases, 10th Revision, or ICD-10) were obtained from the WHO Mortality Database (WHO
2010 (a)) and tallied by country. Note that the WHO data comprise deaths registered in
national civil registration systems, with underlying cause of death as coded by the relevant
national authority (WHO 2010 (b)). Data were extracted for countries with at least 3 years of
data coded as C45 (ICD-10) or any of its subcategories. To maximize utilization of available
data, we separately counted numbers recorded for “malignant neoplasm of the pleura (163,
ICD-9).” Then to investigate countries that did not report data to the WHO, we used Pubmed
(www.ncbi.nlm.nih.gov/pubmed) and other sources to search for national frequency data
Page 8 of 31

9
published in English (Lee et al. 2010; Rüegger 2008). Data were prioritized for analysis in
that order and overlapping information was evaluated once only. For a number of countries,
national counts of mesothelioma deaths were reported for intermittent years or did not span
the entire period. For each country the 15-year cumulative number was estimated by first
calculating the annual mean of reported mesothelioma deaths from data available for fewer
years which was then multiplied by 15.
National population data were obtained from the WHO (WHO 2010 (a)) and the United
States Census Bureau (U.S. Census Bureau 2010), prioritized for use in this order.
Twelve of the 89 analyzed countries warranted special treatment of asbestos use data
because of political transition (e.g., disintegration, unification), or combined treatment with
other countries/entities by the USGS. Historical information was utilized in an unbiased
manner to the extent possible to give continuity with data of countries existing today.
� Data on asbestos use for the Soviet Union during 1920-1990 in the USGS database
represented those of Russia and Kazakhstan combined (Virta 2006). We thus apportioned
data recorded by the Soviet Union during 1920-1990 between “Russia” and “Kazakhstan”
during 1920-1990 according to the ratio of use recorded by Russia and Kazakhstan during
1995-2007.
� Data on asbestos use for West and East Germany, respectively, during 1950-1985 were
combined into one entity (i.e., “Germany”).
Page 9 of 31
10
� To account for the disintegration of Czechoslovakia in 1993 (UN 2010), data on asbestos
use for Czechoslovakia during 1920-1990 were apportioned to the level of use during
1995-2007 between Czech Republic and Slovakia.
� To account for the disintegration of Yugoslavia in 1991 (Duffield 2003), data on asbestos
use for Yugoslavia during 1930-1990 were apportioned to the level of use during
1995-2007 among Bosnia and Herzegovina, Croatia, Serbia and Montenegro, the former
Yugoslav Republic of Macedonia and Slovenia (Serbia and Montenegro were treated as
one entity in this paper).
� Data on asbestos use for Belgium and Luxembourg were combined during 1930-2001 in
the USGS database (Virta 2006). We apportioned this data to Belgium and Luxembourg,
respectively, according to the size of the respective populations during this period.
We compiled all data and performed descriptive statistics using Microsoft Excel
(Microsoft Corporation, Redmond, WA, USA). We then conducted the regression analyses
using SAS version 9.1 (SAS Institute Inc., Cary, NC, USA). Due to the extremely wide
dispersion of data for both asbestos and mesothelioma, both data were log-transformed, to
construct the regression model: log10 (mortality) = B0 + B1 * log10 (asbestos). We applied
PROC REG to obtain the parameters and their confidence limits, the adjusted R2 and p-values
of the regression model. The size of the national populations was used as weights. To further
obtain the confidence limits for the mean predicted value for each observation, we added the
Page 10 of 31

11
CLM option. This accounted for the variation due to estimating the parameters only. All the
aforementioned processes were accomplished in one run of PROC REG.
After predicted values were obtained, based on the principle that if Yi ~ N(mi, si2) is the
measurement for the i-th cluster, then Y = sum(Yi) ~ N(sum(mi), sum(si2)), the confidence
limits for the sum of predicted values were calculated from the square root of the sum of the
variance.
The graph was drawn using Sigmaplot (version 9.01, Systat Software Inc., San Jose, CA,
USA); the size of the bubbles was drawn proportionate to the size of national populations of
the year 2000. P-values < 0.05 were deemed statistically significant in all analyses.
Page 11 of 31
12
Results
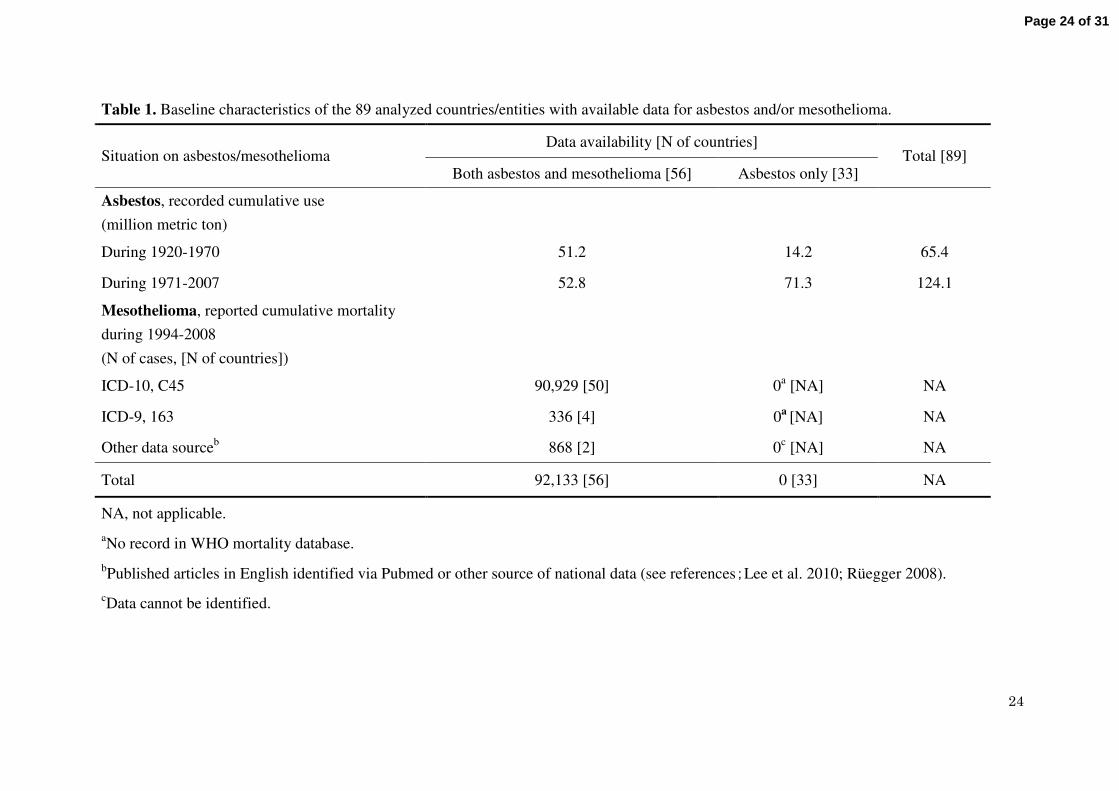
Globally 89 countries had available information on frequency of mesothelioma and/or use of
asbestos at the national level. These countries represented 82.6% of the global population in
year 2000. Of these countries 56 had data for both mesothelioma frequency and asbestos use
and 33 had no mesothelioma frequency data but had data for asbestos use (Table 1).
The cumulative asbestos use during 1920-1970 was 51.2 million metric tons in the 56
countries and 14.2 million metric tons in the 33 countries, with a total of 65.4 million metric
tons in the 89 analyzed countries. This volume represented 100% of the global asbestos use
during 1920-1970. By individual country, cumulative asbestos use was highly skewed, led by
the USA, Russia, the UK, Germany and Japan, with volumes at 21.8, 8.4, 4.8, 4.1 and 3.2
million metric tons, respectively (Tables 2 and 3). The 56 countries with mesothelioma data
reported a total of 92,133 deaths during 1994-2008 (336 of which were coded as 163 under
ICD-9 by four countries) (Table 1).
Table 2 shows the 15-year cumulative mortality of mesothelioma extrapolated from
numbers reported for fewer years in the 56 countries with mesothelioma data, ranked in order
of the cumulative asbestos use. The 15-year cumulative numbers are highly skewed but
generally paralleled the level of cumulative asbestos use. Leading countries for the 15-year
mesothelioma number are the USA, the UK, Italy, Germany and France, with 36,561, 28,369,
18,530, 15,948 and 12,390 cases, respectively (Table 2). The total 15-year cumulative
Page 12 of 31
13
mortality was approximately 174,300 deaths.
Figure 1 shows scatter plots of national data for the group of 56 countries. A clear positive
linear relation is observed between the log-transformed values of the 15-year cumulative
mortality of mesothelioma during 1994-2008 and the cumulative use of asbestos during
1920-1970. Cumulative asbestos use was a significant predictor of cumulative mesothelioma
mortality, with an adjusted R2 value of 0.83 (p < 0.0001). Similar findings were obtained
when data for the four countries reporting deaths coded to ICD-9 were omitted, with an
adjusted R2 value of 0.82 (p < 0.0001).
Table 3 shows the predicted 15-year cumulative mortality of mesothelioma in the group of
33 countries which lacked data on mesothelioma frequency; predictions were obtained from
the value of cumulative asbestos use applied to the relationship obtained earlier. The range of
cumulative asbestos use of the 33 countries, except for Madagascar, fell within the range
reported by the 56 countries. Leading countries for the “predicted” 15-year mesothelioma
number are Russia, Kazakhstan, China, India and Thailand with 21,300, 6,500, 5,100, 2,200
and 500 cases, respectively. In total, an estimated 38,900 (95% CI, 36,700-41,100)
mesothelioma cases possibly occurred but were unreported during 1994-2008.
Page 13 of 31

14
Discussion
It is unlikely that mesothelioma is absent in countries that have used asbestos but do not
report mesothelioma frequency. There is increasing evidence that the extent of asbestos use
can be used to predict subsequent incidence and mortality of asbestos-related diseases at
national levels (Antao et al. 2009; Lin et al. 2007; Nishikawa et al. 2008; Tse et al. 2010).
This is not unexpected as mesothelioma is almost exclusively attributable to past asbestos
exposure. We thus postulated that national experiences would follow reasonably similar
patterns where countries lacking mesothelioma data were probably “missing” the disease
burden to an extent proportionate to the level of historical cumulative asbestos use. Based on
available data of 56 countries, we recorded that recent cumulative mortality of mesothelioma
is closely related to historical cumulative use of asbestos. Further extrapolation of this
relation to the 33 countries with no available data for mesothelioma suggested that one
mesothelioma case is unreported for every 4 to 5 cases reported worldwide (38,900
unreported versus 174,300 reported).
Accounting for the reported and unreported numbers, we estimate the global burden of
mesothelioma to be 213,200 as the 15-year cumulative mortality during 1994-2008. This is
equivalent to an annual average of approximately 14,200 cases assuming a flat change rate or
approximately 25,000 (38,000) cases in the year 2008 assuming a 10% (20%) annual increase
rate. These estimates are larger than the estimated 10,000 mesothelioma deaths proposed by
Page 14 of 31

15
consensus for only the developed regions in the world (Anonymous 1997) but smaller than
the 43,000 mesothelioma deaths estimated for the world in the earlier study (Driscoll et al.
2005). Nevertheless, our values are reasonably close to those of earlier reports despite the
different methods used.
From the observed linear relation between log-transformed values of cumulative
mesothelioma and asbestos, it is derived that y = 10(0.913 * log x - 1.998)
, where y (cases) is the
15-year cumulative mesothelioma mortality for the period 1994-2008, and x (metric tons) is
the cumulative asbestos use during 1920-1970. When back-transformed to their original units,
this is a linear relation between variables x and y, each dispersed for a very wide range, i.e., to
the power of 10. Further, the amount of asbestos use corresponding to one mesothelioma case
(“Asbestos -to-Mesothelioma ratio”), or x/y, will vary depending on the level of x. For
example, the “A-to-M” ratio is 182-222 metric tons per case for cumulative use of
1,000-10,000 metric tons and 271-331 metric tons per case for cumulative use of
100,000-1,000,000 metric tons (See Supplemental Material, Table 1). The values recorded
here for the “A-to-M ratio” should be distinguished from a ratio reported earlier and
referenced widely (fixed value of 170 metric tons per case) (Tossavainen 2004), which was
derived from the experience of 11 developed countries with looser definitions and timeframe.
The present study is the first to provide a global estimate of “missed” mesothelioma cases
accounting for the collective experience of countries with data. We directly compared national
Page 15 of 31

16
asbestos use and mesothelioma frequency using cumulative indicators (the denominator
population would be common to all calculations if rates were calculated), which had the
advantage of directly estimating the disease burden as well as maximizing use of sparse data.
Asbestos has an extremely long industrial life-span and populations are repeatedly exposed
during production, maintenance and abatement. Smoking is unrelated to mesothelioma and
confounding need not be accounted for. These facts supported the assumption that cumulative
asbestos use subsequently takes a toll reflected in the cumulative mesothelioma count in
populations.
There are, however, obvious limitations in the methods as well as potential sources of
errors in the information applied to this study. First and foremost, our findings are based on
an ecological relation and thus we do not know the extent to which the consumed amounts of
asbestos reflected actual exposure levels of populations. Second, extrapolating from the
collective experience of one group of countries to another may introduce bias, especially
since the former group consisted of developed and developing countries while the latter group
consisted of predominantly developing countries. Third, we did not have information for
consumed fiber types (e.g., amphiboles, chrysotile).
Whether and the extent to which the aforementioned limitations and possible errors
collectively caused overestimation or underestimation merits further consideration. One
potential source of overestimation (pertaining to the above second limitation) is that
developed countries may incur more mesothelioma cases due to an older age composition.
However, this factor is probably offset by several potential sources of disease
Page 16 of 31

17
underestimation: 1) lack of data on the trade of asbestos-containing products (ACP) which
would impose additional risk; 2) our estimates cannot account for the national experiences of
the majority of countries in the world with “no information” on asbestos use (it is possible
that USGS information on asbestos use is less complete for the less-developed countries,
especially for the earlier years); and lastly but most importantly, 3) underdiagnosis and
underreporting of mesothelioma is also a major problem in developed countries. Therefore
our values should be viewed as conservative estimates.
It is plausible that the “hidden” burden is substantial in countries with high cumulative use
of asbestos, including the asbestos-producing countries such as Russia, Kazakhstan, China
and India. Underdiagnosis and/or underreporting may have occurred in these countries due to
lack of awareness, knowledge and resources. It is additionally possible that, although
mesothelioma is diagnosed domestically, frequency numbers are not actively disclosed to the
international community owing to the increasing number of countries adopting bans on
asbestos use (Kazan-Allen 2005) on grounds of public health. Some countries with vested
interest in maintaining the production and trade of asbestos may be poorly motivated to
acknowledge ARDs. For example, Russia is known for not recognizing asbestosis in its
territory (Walgate 2010).
It should be noted that the world nearly doubled cumulative use of asbestos from 65
million metric tons until 1970 to 124 million metric tons since then. In particular, the group of
Page 17 of 31

18
33 countries not reporting mesothelioma frequency quintupled asbestos use (Table 1).
Individually, the number of countries exceeding cumulative use of 3.0 million metric ton
increased from five (names were aforementioned) to eight since 1971. These were Russia
(36.1), China (11.2), Kazakhstan (9.6), Japan (8.1), the USA (6.9), Brazil (5.3), Germany
(5.2), India (4.5) and Thailand (3.6) (data not shown). Thus even with the expected hygienic
improvements to reduce exposure over time, and particularly since 1970 onwards, these
countries should anticipate the need to deal with a very high burden of mesothelioma in the
immediate decades ahead.
Developed countries should share experience and technology to enable developing
countries to promote accurate diagnosis, reporting and management of ARDs (Takahashi
2008), including mesothelioma. Moreover, political will is essential to ensure that asbestos
use ceases globally.
Page 18 of 31
19
Conclusions
The 15-year cumulative frequency of mesothelioma during 1994-2008 in the 56 countries
reporting mesothelioma is estimated at 174,300. At national levels, cumulative mesothelioma
frequency is predictable from cumulative asbestos use. Using this relationship, the 15-year
cumulative frequency of mesothelioma during 1994-2008 in the 33 countries that do not
report mesothelioma is predicted at 38,900 (95% CI, 36,700-41,100). Thus, globally one
mesothelioma has been overlooked for every four to five reported cases. These estimates will
support countermeasures at national, regional and international levels.
Page 19 of 31
20
REFERENCES
Anonymous. 1997. Asbestos, asbestosis, and cancer: the Helsinki criteria for diagnosis and
attribution. Scand J Work Environ Health 23:311-316.
Antao VC, Pinheiro GA, Wassell JT. 2009. Asbestosis mortality in the USA: facts and
predictions. Occup Environ Med 66:335-338.
CDC. 2009. Malignant mesothelioma mortality-United States, 1999-2005. MMWR Morb
Mortal Wkly Rep 58:393-396.
Driscoll T, Nelson DI, Steenland K, Leigh J, Concha-Barrientos M, Fingerhut M, et al. 2005.
The global burden of disease due to occupational carcinogens. Am J Ind Med
48:419-431.
Duffield JS. 2003. Regional conflict management in Europe. In: Regional Conflict
Management (Diehl PF, Lepgold J, eds). Maryland: Rowman and Littlefield Publishers,
239-268.
Hodgson JT, McElvenny DM, Darnton AJ, Price MJ, Peto J. 2005. The expected burden of
mesothelioma mortality in Great Britain from 2002 to 2050. Br J Cancer 92:587-593.
Kazan-Allen L. 2005. Asbestos and mesothelioma: worldwide trends. Lung Cancer 49 Suppl
1:S3-S8.
Kjellstrom T, Smartt P. 2000. Increased mesothelioma incidence in New Zealand: the
asbestos-cancer epidemic has started. N Z Med J 113:485-490.
Page 20 of 31

21
LaDou J. 2004. The asbestos cancer epidemic. Environ Health Perspect 112:285-290.
Lee LJ, Chang YY, Wang JD. 2010. Impact of malignant mesothelioma in Taiwan: a 27-year
review of population-based cancer registry data. Lung Cancer 68:16-19.
Leigh J, Driscoll T. 2003. Malignant mesothelioma in Australia, 1945-2002. Int J Occup
Environ Health 9:206-217.
Lin RT, Takahashi K, Karjalainen A, Hoshuyama H, Wilson D, Kameda T, et al. 2007.
Ecological association between asbestos-related diseases and historical asbestos
consumption: an international analysis. Lancet 369:844-849.
Marinaccio A, Binazzi A, Cauzillo G, Cavone D, Zotti RD, Ferrante P, et al. 2007. Analysis of
latency time and its determinants in asbestos related malignant mesothelioma cases of the
Italian register. Eur J Cancer 43:2722-2728.
Murayama T, Takahashi K, Natori Y, Kurumatani N. 2006. Estimation of future mortality
from pleural malignant mesothelioma in Japan based on an age-cohort model. Am J Ind
Med 49:1-7.
Nishikawa K, Takahashi K, Karjalainen A, Wen CP, Furuya S, Hoshuyama T, et al. 2008.
Recent mortality from pleural mesothelioma, historical patterns of asbestos use, and
adoption of bans: a global assessment. Environ Health Perspect 116:1675-1680.
Pelucchi C, Malvezzi M, La Vecchia C, Levi F, Decarli A, Negri E. 2004. The mesothelioma
epidemic in Western Europe: an update. Br J Cancer 90:1022-1024.
Page 21 of 31
22
Peto J, Decarli A, La Vecchia C, Levi F, Negri E. 1999. The European mesothelioma epidemic.
Br J Cancer 79:666-672.
Rüegger M. 2008. Malignant Mesothelioma Recognized as Occupational Diseases in
Switzerland (in German). Available: http://www.suva.ch/fr/roundtable2008_rueegger.pdf
[accessed 15 July 2010].
Takahashi K. 2008. Asbestos-related diseases: time for technology sharing. Occup Med
(London) 58:384-385.
Takahashi K, Karjalainen A. 2003. A cross-country comparative overview of the asbestos
situation in ten Asian countries. Int J Occup Environ Health 9:244-248.
Tossavainen A. 2004. Global use of asbestos and the incidence of mesothelioma. Int J Occup
Environ Health 10:22-25.
Tse LA, Yu IT, Goggins W, Clements M, Wang XR, Au JS, et al. 2010. Are current or future
mesothelioma epidemics in Hong Kong the tragic legacy of uncontrolled use of asbestos
in the past? Environ Health Perspect 118:382-386.
UN (United Nations). 2010. Member States of the United Nations. Available:
http://www.un.org/en/members/index.shtml [accessed 19 July 2010].
U.S. Census Bureau. 2010. International Data Base: International Programs Center,
Population Division. Available: http://www.census.gov/ipc/www/idb/ [accessed 20 July
2010].
Page 22 of 31

23
Virta RL. 2006. Worldwide Asbestos Supply and Consumption Trends from 1900 through
2003. Available: http://pubs.usgs.gov/circ/2006/1298/c1298.pdf [accessed 11 July 2010].
Virta RL. 2009. World Asbestos Consumption from 2003 through 2007. Available:
http://minerals.usgs.gov/minerals/pubs/commodity/asbestos/mis-2007-asbes.pdf
[accessed 11 July 2010].
Walgate R. 2010. European nations agree to improve environmental health. Lancet 375:969.
WHO (World Health Organization). 2006. Elimination of Asbestos-Related Diseases. Geneva:
World Health Organization. Available:
http://whqlibdoc.who.int/hq/2006/WHO_SDE_OEH_06.03_eng.pdf [accessed 20 July
2010].
WHO. 2010(a). WHO Mortality Database: World Health Organization Statistical Information
System (WHOSIS). Available: http://www.who.int/whosis/mort/download/en/index.html
[accessed 17 July 2010].
WHO. 2010(b). About the WHO Mortality Data. Available:
http://www.who.int/healthinfo/statistics.mortdata/en/index.html [accessed 03 October
2010].
Page 23 of 31
24
Table 1. Baseline characteristics of the 89 analyzed countries/entities with available data for asbestos and/or mesothelioma.
Data availability [N of countries] Situation on asbestos/mesothelioma
Both asbestos and mesothelioma [56] Asbestos only [33] Total [89]
Asbestos, recorded cumulative use
(million metric ton)
During 1920-1970 51.2 14.2 65.4
During 1971-2007 52.8 71.3 124.1
Mesothelioma, reported cumulative mortality
during 1994-2008
(N of cases, [N of countries])
ICD-10, C45 90,929 [50] 0a [NA] NA
ICD-9, 163 336 [4] 0a [NA] NA
Other data sourceb 868 [2] 0
c [NA] NA
Total 92,133 [56] 0 [33] NA
NA, not applicable.
aNo record in WHO mortality database.
bPublished articles in English identified via Pubmed or other source of national data (see references;Lee et al. 2010; Rüegger 2008).
cData cannot be identified.
Page 24 of 31

25
Table 2. Reported and extrapolated 15-year cumulative mortality of mesothelioma during 1994-2008 in 56 countries/entities with data for
mesothelioma mortality and use of asbestos.
Country [code]
Cumulative use
of asbestos
(in tons,
1920-1970)
Number of
years with
available data
Reported
cumulative
mortality (cases)
Annual average of
reported mortality
(cases)
Extrapolated
15-year
cumulative
mortality (cases)
1 USA [USA] 21,840,583 7 17,062 2,437 36,561
2 UK [GBR] 4,829,517 7 13,239 1,891 28,369
3 Germany [DEU] 4,144,825 9 9,569 1,063 15,948
4 Japan [JPN] 3,210,349 14 11,212 801 12,013
5 France [FRA] 2,352,646 8 6,608 826 12,390
6 Canada [CAN] 1,955,347 5 1,603 321 4,809
7 Italy [ITA] 1,934,558 3 3,706 1,235 18,530
8 Australia [AUS] 1,152,776 8 3,747 468 7,026
9 Belgium [BEL] 1,110,214 3 467 156 2,335
10 Spain [ESP] 701,565 7 1,840 263 3,943
11 Poland [POL] 581,013 10 957 96 1,436
12 Brazil [BRA] 577,333 10 955 96 1,433
13 Romania [ROU] 550,799 10 581 58 872
14 Slovakia [SVK] 548,874 12 154 13 193
15 Denmark [DNK] 447,590 13 918 71 1,059
16 Mexico [MEX] 422,645 10 1,513 151 2,270
17 Sweden [SWE] 414,601 11 1,348 123 1,838
Page 25 of 31

26
18 Netherlands [NLD] 411,989 13 5,141 395 5,932
19 Austria [AUT] 410,249 7 563 80 1,206
20 Argentina [ARG] 338,870 11 1,065 97 1,452
21 Finland [FIN] 299,695 13 970 75 1,119
22 Switzerland [CHE] 267,302 4 568 142 2,130
23 Republic of Korea [KOR] 244,802 12 339 28 424
24 Hungary [HUN] 235,442 13 451 35 520
25 South Africa [ZAF] 203,566 12 2,322 194 2,903
26 Colombia [COL] 196,345 9 323 36 538
27 Croatia [HRV] 165,011 14 547 39 586
28 Norway [NOR] 158,017 12 648 54 810
29 New Zealand [NZL] 147,197 7 513 73 1,099
30 Cyprus [CYP] 145,745 4 21 5 79
31 Czech Republic [CZE] 140,920 15 611 41 611
32 Egypt [EGY] 124,908 4 7 2 26
33 Chile [CHL] 103,780 9 331 37 552
34 Greece [GRC] a 101,021 15 128 9 128
35 Malaysia [MYS] 94,540 6 20 3 50
36 Slovenia [SVN] 94,114 12 270 23 338
37 Venezuela [VEN] 93,210 11 124 11 169
38 Portugal [PRT] a 90,605 8 152 19 285
39 Israel [ISR] 78,122 10 262 26 393
40 Taiwan [TWN] 67,670 12 300 25 375
41 Philippines [PHL] 41,132 5 51 10 153
Page 26 of 31

27
42 Luxembourg [LUX] 38,749 9 39 4 65
43 Serbia & Montenegro [SRB &MNE] 34,222 12 313 26 391
44 Uruguay [URY] 33,914 6 38 6 95
45 Bulgaria [BGR] 33,576 4 35 9 131
46 Latvia [LVA] 22,189 13 112 9 129
47 Costa Rica [CRI] 11,718 9 24 3 40
48 Iceland [ISL] 6,417 12 28 2 35
49 Lithuania [LTU] 5,396 11 135 12 184
50 Guatemala [GTM]a 3,757 5 9 2 27
51 Panama [PAN] 3,506 7 14 2 30
52 Singapore [SGP] a 3,150 13 47 4 54
53 Estonia [EST] 2,300 12 45 4 56
54 Hong Kong [HKG] 616 7 79 11 169
55 Netherlands Antilles [ANT] 335 4 5 1 19
56 Nicaragua [NIC] 316 4 4 1 15
Total 51,229,638 NA 92,133 NA 174,300
NA, not applicable.
aNumber of cases represents "malignant neoplasm of the pleura (163, ICD-9)".
Page 27 of 31

28
Table 3. Predicted 15-year cumulative mortality of mesothelioma in 33 countries/entities with data only for use of asbestos.
Country [code]
Cumulative use
of asbestos
(in tons, 1920-1970)
Predicted 15-year cumulative mortality
(95% CI) [cases]
1 Russia [RUS] 8,443,923 21,308 15,026 - 30,218
2 Kazakhstan [KAZ] 2,301,286 6,500 5,006 - 8,440
3 China [CHN] 1,767,086 5,107 3,976 - 6,558
4 India [IND] 688,015 2,158 1,700 - 2,739
5 Thailand [THA] 152,378 545 400 - 741
6 Zimbabwe [ZWE] 122,595 447 323 - 617
7 Algeria [DZA] 90,005 337 238 - 477
8 Swaziland [SWZ] 87,868 329 232 - 468
9 Iran [IRN] 68,437 262 181 - 380
10 Turkey [TUR] 60,345 234 159 - 343
11 Morocco [MAR] 55,697 217 147 - 321
12 The Former Yugoslav Republic of Macedonia [MKD] 48,829 193 129 - 288
13 Lebanon [LBN] 47,718 189 126 - 283
14 Nigeria [NGA] 34,443 140 91 - 216
15 Peru [PER] a 32,645 133 86 - 207
16 Indonesia [IDN] 29,920 123 79 - 193
17 Democratic Republic of the Congo [COD] 22,579 95 59 - 153
18 Uganda [UGA] 18,139 78 47 - 128
19 Iraq [IRQ] 16,202 70 42 - 117
Page 28 of 31

29
20 Zambia [ZMB] 15,607 68 41 - 113
21 Mozambique [MOZ] 14,566 64 38 - 107
22 Angola [AGO] 14,378 63 37 - 106
23 Jamaica [JAM] 10,698 48 28 - 83
24 Myanmar [MMR] 10,632 48 28 - 83
25 Tunisia [TUN] 9,724 44 25 - 77
26 Bolivia [BOL] 8,959 41 23 - 72
27 El Salvador [SLV] a 6,545 31 17 - 56
28 Kenya [KEN] 3,153 16 8 - 31
29 Botswana [BWA] 1,163 6 3 - 14
30 Senegal [SEN] 799 5 2 - 10
31 Libya [LBY] 540 3 1 - 7
32 Bosnia & Herzegovina [BIH] 387 2 1 - 6
33 Madagascar [MDG] b 16 NA NA
Total 14,185,272 38,900 36,700 - 41,100
NA, not applicable. aTreated as lacking data on mesothelioma frequency because only 2 years of data were available in the WHO mortality database and no
other information could be identified (see Materials and Methods).
bOut of range of the regression model.
Page 29 of 31

30
Figure Legend
Figure 1. Relationship between 15-year cumulative mortality of mesothelioma (1994-2008)
and cumulative use of asbestos (1920-1970) weighted by the size of national populations in
56 countries/entities with both data. Asbestos use for 33 countries or entities without
mesothelioma frequency data is indicated along the x-axis. The figure is based on the
following regression model: log10(15-year cumulative mortality of mesothelioma) = β0 + β1 *
log10(cumulative use of asbestos), where β0 = -1.998 [95% Confidence Interval (CI) -2.676 to
-1.319] and β1 = 0.913 (95% CI 0.800 to 1.026), adjusted R2 = 0.827, p-value <0.0001.
Page 30 of 31

Page 31 of 31