ehp environmental health perspectives · 1 outbreak of fatal childhood lead poisoning related to...
TRANSCRIPT

ENVIRONMENTALHEALTH PERSPECTIVES
ENVIRONMENTALHEALTH PERSPECTIVES
National Institutes of HealthU.S. Department of Health and Human Services
Outbreak of Fatal Childhood Lead Poisoning Related to Artisanal Gold Mining in Northwestern Nigeria, 2010
Carrie A. Dooyema, Antonio Neri, Yi-Chun Lo, James Durant, Paul I. Dargan, Todd Swarthout, Oladayo Biya,
Saheed O. Gidado, Suleiman Haladu, Nasir Sani-Gwarzo, Patrick M. Nguku, Henry Akpan, Sa’ad Idris,
Abdullahi M. Bashir, Mary Jean Brown
http://dx.doi.org/10.1289/ehp.1103965
Online 20 December 2011
ehponline.org
ehp
1
Outbreak of Fatal Childhood Lead Poisoning Related to Artisanal Gold Mining in Northwestern
Nigeria, 2010
Carrie A. Dooyema1,2
, Antonio Neri1, Yi-Chun Lo
2, James Durant
3, Paul I. Dargan
4, Todd
Swarthout5, Oladayo Biya
6, Saheed O. Gidado
6, Suleiman Haladu
6, Nasir Sani-Gwarzo
7, Patrick
M. Nguku6, Henry Akpan
8, Sa’ad Idris
9, Abdullahi M. Bashir
9, Mary Jean Brown
1
1Centers for Disease Control and Prevention (CDC), National Center for Environmental, Healthy
Homes and Lead Poisoning Prevention Branch, Atlanta, Georgia, USA; 2CDC, Epidemic
Intelligence Service Atlanta, Georgia, USA; 3Agency for Toxic Substances and Disease Registry
Atlanta, Georgia, USA; 4Guy’s and St. Thomas’ NHS Foundation Trust and King’s Health
Partners, London, UK; 5
Médecins Sans Frontières, Amsterdam, Netherlands; 6Nigerian Field
Epidemiology and Laboratory Training Program, Abuja, Nigeria;7CDC, Abuja, Nigeria;
8Nigerian Federal Ministry of Health, Abuja, Nigeria;
9Zamfara State Ministry of Health, Gusau,
Nigeria
Correspondence to: Carrie A. Dooyema, 4770 Buford Highway, MS K-26, Chamblee, Georgia
30341, USA. Telephone: 770-488-5039, Fax: 770-488-5369, E-mail: [email protected]
Running title: Acute Childhood Lead Poisoning in Nigeria
Keywords
Artisanal gold mining, childhood, environmental health, lead poisoning, nervous system
Page 1 of 31
2
Acknowledgements
We acknowledge the Nigerian Federal Ministry of Health, Zamfara Ministry of Health, Gabriele
Poggensee, CDC Nigeria, and Ian Von Lindern, Casey Bartrem, Margrit von Braun, and Simba
Tirima with TerraGraphics Environmental Engineering Inc. At CDC Atlanta, we acknowledge
the Center for Global Health, Global Disease Detection Program, Lora Davis, and Division of
Laboratory Sciences at the National Center for Environmental Health.
Financial support was provided by CDC’s Global Disease Detection Program, CDC Nigeria, and
the Nigerian Field Epidemiology and Laboratory Training Program.
The authors declare they have no competing financial interests.
The findings and conclusions in this report are those of the authors and do not necessarily
represent the views of the CDC or the Agency for Toxic Substances and Disease Registry.
Abbreviations
ASM: Artisanal and small-scale mining
BLL: Blood lead level
CDC: Centers for Disease Control and Prevention
EPA: U.S. Environmental Protection Agency
MSF: Médecins Sans Frontières
NFELTP: Nigeria Field Epidemiology and Laboratory Training Program
PPB: Parts per billion
PPM: Parts per million
U5MR: Under age 5 mortality rate
USGS: U.S. Geological Survey
XRF: X-Ray fluorescence spectrometer
WHO: World Health Organization
Page 2 of 31

3
Abstract
Background: In May 2010, a team of national and international organizations was assembled to
investigate children’s deaths due to lead poisoning in villages in northwestern Nigeria. Objectives: To
determine the cause of the childhood lead poisoning outbreak, investigate risk factors for child
mortality, and identify children aged <5 years in need of emergency chelation therapy for lead
poisoning.
Methods: We administered a cross-sectional, door-to-door questionnaire in two affected villages,
collected blood from children aged 2–59 months, and soil samples from family compounds.
Descriptive and bivariate analyses were performed with survey, blood-lead, and environmental data.
Multivariate logistic regression techniques were used to determine risk factors for childhood mortality.
Results: We surveyed 119 family compounds. One hundred eighteen of 463 (25%) children aged <5
years had died in the last year. We tested 59% (204/345) of children, aged <5 years, and all were lead
poisoned (≥10 µg/dL); 97% (198/204) of children had blood-lead levels ≥45 µg/dL, the threshold for
initiating chelation therapy. Gold ore was processed inside two-thirds of the family compounds
surveyed. In multivariate modeling significant risk factors for death in the previous year from
suspected lead poisoning included: the child’s age, the mother performing ore-processing activities,
community well as primary water source, and the soil-lead concentration in the compound.
Conclusion: The high levels of environmental contamination, percentage of children aged <5 years
with elevated blood-lead levels (97%, >45 µg/dL), and incidence of convulsions among children prior
to death (82%) suggest that most of the recent childhood deaths in the two surveyed villages were
caused by acute lead poisoning from gold ore-processing activities. Control measures included
environmental remediation, chelation therapy, public health education, and control of mining activities.
Page 3 of 31

4
Introduction
Childhood lead exposure results in lower intelligence and behavior problems, and negatively
affects multiple body systems (Bellinger 2004; Canfield et al. 2003; Lamphear et al. 2005;
Mendelsohn et al. 1998; Tellez-Rojo et al. 2006). Young children are particularly susceptible to
lead exposure due to behavioral factors such as frequent hand-to-mouth activities, and biological
factors including greater gastrointestinal absorption and developing neurological systems
(Bellinger 2004; Henretig 2006; Lidsky and Schneider 2003). Encephalopathy typically occurs
with blood-lead levels (BLLs) ≥100 µg/dL, but can occur with BLLs as low as 70 µg/dL
(Henretig 2006; U.S. Centers for Disease Control and Prevention [CDC] 2002). Symptoms of
acute lead encephalopathy include vomiting, changes in behavior, ataxia, convulsions, and coma
(CDC 2002; Henretig 2006). Currently, childhood lead poisoning resulting in encephalopathy
and death in developed countries is rarely reported, and the last documented child-fatality from
lead poisoning in the United States (U.S.) was in 2006 (Berg et al. 2006). However, hundreds of
U.S. pediatric acute lead encephalopathy deaths were recorded in the first half of the 20th
century. For example, 202 deaths from childhood lead poisoning were recorded in U.S. cities
from 1931 and 1940, with 25% occurring in Baltimore, Maryland (McDonald and Kaplan,
1942). Most lead poisoning in this period occurred in urban settings from deteriorating lead
housepaint and lead painted cribs. Lead poisoned children in this era frequently had high BLLs.
One study evaluating lead poisoning in 293 children from 1931—1970 found the mean BLL for
children with mild, severe, and fatal acute lead encephalopathy to be 328 µg/dL, 336 µg/dL, and
327 µg/dL respectively (National Research Council 1972).
Sources of global lead poisoning include lead mining and smelting, battery recycling, leaded
gasoline, paint, traditional medicines, toys, and discarded electronic devices (Meyer et al. 2008).
Page 4 of 31

5
Lead poisoning is of specific concern for children in developing countries (Falk 2003).
The
World Health Organization (WHO) estimates that lead poisoning causes 0.6% of the global
burden of disease and contributes to approximately 600,000 cases of intellectual disability in
children annually (World Health Organization [WHO] 2010). During the past 20 years,
moderate-to-high elevations of BLLs have been documented globally in clusters of children
living in mining and smelting communities or areas where lead batteries are reclaimed (Brown et
al. 2009; Garcia Vargas et al. 2001; Kaul et al. 1999; Lalor et al. 2006). However, only one
report found in recent literature documents fatalities from childhood lead poisoning; in 2008 in
Senegal, informal battery recycling was determined to be the likely cause of death of 18 children
(Haefliger et al. 2009).
Description of the outbreak
During meningitis surveillance activities conducted February–April 2010, Médecins Sans
Frontières (MSF) and local Nigerian public health officials observed higher-than-expected
numbers of childhood illnesses and deaths in four villages in rural northwestern Nigeria. Most of
the illnesses and deaths occurred in children aged <5 years. Symptoms included vomiting,
abdominal pain, headache, and convulsions; ill children failed to respond to malaria treatment
and empiric antibiotics. MSF and State Ministry of Health staff noted that all four villages
participated in artisanal gold ore-processing activities, and heavy-metal poisoning was
considered as a potential source of the illnesses. Venous blood samples, analyzed in Europe,
from eight symptomatic children from an affected village indicated BLLs between 168–370
µg/dL. These concentrations exceed the United States Centers for Disease Control and
Prevention (CDC) level of concern of 10 µg/dL and are well-known to be fatal (CDC 2002).
Page 5 of 31

6
MSF notified Nigerian authorities of the results and a team of international experts was
mobilized to assist in the investigation and response to this outbreak.
This report describes the response and investigation of an outbreak of childhood lead poisoning
with child mortality unprecedented in modern times. On May 8, 2010, the Nigerian Federal
Ministry of Health assembled representatives from federal, state, and international organizations,
including the Nigeria Field Epidemiology and Laboratory Training Program (NFELTP), CDC,
and WHO, to join in ongoing MSF efforts to investigate and respond to the outbreak. The
purpose of this emergency response was to determine the cause and contributing factors to the
outbreak, and identify and prioritize children aged <5 years with lead poisoning for emergency
chelation therapy. The urgent nature of the response and limited resources necessitated quick
investigation and intervention to stop the increasing rate of child fatalities in these villages.
Although there were reports of adults in these villages with symptoms of lead poisoning, initial
efforts focused almost entirely on children aged <5 years. Young children are most susceptible
to lead poisoning and most of the fatalities in MSF clinics were among children aged <5 years.
Investigators hypothesized the outbreak of lead poisoning was associated with artisanal gold ore-
processing activities. Investigators used a three-pronged approach to investigate the outbreak that
included a door-to-door survey, blood lead sampling, and environmental testing.
Methods
Cross-sectional survey
Stakeholders, including Nigerian state health officials and MSF, recommended the two most
affected villages (A and B) for participation. The investigation protocol was reviewed and
Page 6 of 31
7
approved by both the Nigerian government and the CDC. The investigation was conducted in
accordance with the Declaration of Helsinki developed by the World Medical Association
(World Medical Association 2008).
After obtaining consent of village leaders, investigators conducted a cross-sectional, door-to-
door survey to interview parents, sample blood from children aged <5 years, and collect soil
from households from May 23–June 4, 2010. Informed consent to administer the survey, draw
blood, and collect environmental samples was obtained from the head of the household prior to
survey initiation. Local health professionals and translators were trained in a four-hour session
on survey administration, venous blood drawing, and environmental sampling.
Each village consisted of numerous family dwellings separated by low walls. Investigators
defined a “compound” as several multigenerational and multifamily dwellings enclosed by a
common wall. All compounds in Village A were eligible to participate in the survey. Because of
time and logistical constraints, only compounds in the central area of Village B were eligible to
participate. The central area of Village B included most of the compounds and common
gathering places such as mosques, markets, and the head of the village’s residence.
The survey collected information about children aged <5 years in each compound, including the
number living in the compound, the number with a history of convulsions, the number who had
died in the last 12 months, and their approximate date of death.
Page 7 of 31

8
Prior to the investigation the team heard that artisanal gold ore-processing activities were
occurring in both villages. These ore-processing activities included: 1) breaking rocks into small
gravel-sized pieces (breaking); 2) grinding rocks into a fine powder with a flour mill or mortar
and pestle (grinding); 3) washing ground ore powder with water to separate gold particles
(washing); 4) drying ground ore after washing (drying); 5) using liquid mercury to amalgamate
gold flakes (separating); and 6) using heat to vaporize mercury from the gold mixture after
amalgamation (melting). Both men and women in the villages participated in ore-processing.
Men typically processed ore in central locations around the village and women processed ore
inside family compounds. The survey included questions about gold ore-processing activities
inside and outside the compound, household member and maternal processing activities, history
of animal deaths within the compound, and the family’s primary water source. Prior to data
collection investigators mapped each village and marked the location of each family compound.
Global positioning system (GPS) coordinates were taken at the entrance of each compound to
facilitate compound identification and follow-up on blood and environmental testing results. At
the end of the investigation, MSF staff visited the compounds and provided parents with their
child’s blood lead test result and information on chelation therapy and the medical management
of lead poisoning.
Blood sampling
Venous blood was collected from children aged 2 months to 5 years. Phlebotomists attempted to
draw blood from every available child in Village A and from children in every other surveyed
compound in Village B due to time constraints. Samples of manufacturer lots of materials used
for blood collection were pre-screened by CDC laboratories and determined to be free of lead.
Page 8 of 31

9
To prevent sample contamination all blood collection supplies were kept in plastic gallon-size
storage bags prior to sample collection. In addition, the venipuncture site was thoroughly cleaned
with alcohol wipes prior to obtaining the specimen. One 1–3 mL blood sample was collected in a
laboratory tube and analyzed for lead using a portable blood-lead analyzer, LeadCare II ®
(Magellan Biosciences, Chelmsford, MA, USA) in an uncontaminated area away from the
villages. This portable instrument can reliably determine BLLs from 3.3–65 µg/dL with an
accuracy level of +/-3 µg/dL (Freeney and Zink 2007).
A second blood sample was collected from every third child and analyzed for lead, total
mercury, and manganese, at the CDC National Center for Environmental Health’s Inorganic and
Radiation Analytical Toxicology laboratory in Atlanta, Georgia. Inductively coupled plasma
mass spectroscopy was used to analyze lead and total mercury. Detailed explanations of CDC
blood lead and total blood mercury laboratory methods have been published elsewhere (Jones
RL et al. 2007; Caldwell et al. 2009). Inductively coupled dynamic reaction cell plasma mass
spectrometry was used for whole blood manganese analysis as previously described (Jones DR et
al. 2010). The limit of detection for blood lead is 0.25 µg/dL, total blood mercury 0.33 µg/L and
manganese 0.8 µg/L. Precision was evaluated by monitoring the replicate results of internal
quality control (QC) materials. QC tests, included at the beginning and end of each analytical
run, help ensure the accuracy and precision of the analysis process. The low level QC should be
in the low-normal range for blood levels in the U.S. population and the high level QC should be
less than those found in the high normal population range of the U.S. population. The population
ranges are taken from the Fourth National Report on Human Exposure in Environmental
Chemicals (CDC 2010). The low level QC for mercury had an interday coefficient of variation
Page 9 of 31
10
(CV) of 15.1 at 0.516 µg/L and a CV of 2.3 at 5.857 µg/L. For lead the low level QC had an
interday CV of 1.7 at 2.876 µg/dL and a CV of 1.2 at 12.754 µg/dL. For manganese the low level
QC, with a mean of 7.983, has a CV of 4.8% while the high level QC with a mean of 14.929 has
a CV of 6.7%. Accuracy for blood lead and mercury was verified by analyzing standard
reference material from the National Institute of Standards and Technology (NIST). Blood
manganese accuracy was verified by participating in proficiency testing with the Wadsworth
Center of New York Trace Elements in Whole Blood Program. The level of concern for blood
lead is 10 µg/dL (CDC 2002). Although there is no blood level of concern for metallic mercury
exposure, long-term effects, largely neurological, have been noted at total blood mercury levels
<1.0 µg/L (ATSDR 1999). Investigators used the reference range of 7.7-12.1 µg/L from Tietz’s
Textbook of Clinical Chemistry (1999) for blood manganese (Milne 1999). Although some heavy
metals, such as mercury, are better evaluated using urine biomarkers, logistical constraints
precluded collection of urine specimens.
Environmental sampling
Places where children ate or slept, which were identified by the eldest mother in each compound,
were targeted for environmental sampling in each surveyed compound. Samples of soil were
swept, placed in a plastic bag, and analyzed for lead content using a portable, hand-held x-ray
fluorescence spectrometer (XRF) (Innov-XSystems, Woburn, MA, USA and Thermo-Scientific
Niton, Billerica, MA) in an uncontaminated area away from the villages. A certified industrial
hygienist or environmental engineer also assessed each village and took XRF readings
throughout the villages using U.S. Environmental Protection Agency (EPA) method 6200 to
determine areas of high contamination (EPA 2007). Inside the villages priority for XRF
Page 10 of 31

11
assessment and analysis was given to areas potentially affected by ore processing. The limit of
detection for lead by XRF was approximately 40 ppm while the upper reporting limit was
100,000 ppm. Samples of processed ore were also collected and analyzed for lead using XRF.
After XRF analysis, a subset of soil and ore samples were sent to the U.S. Geological Survey
(USGS) for further analysis using inductively coupled plasma mass spectroscopy to verify XRF
field results and to perform mineralogy analysis to determine the chemical composition of the
samples.
The U.S. Environmental Protection Agency's (EPA) Toxic Substance Control Act defines a soil-
lead hazard as bare soil containing total lead ≥400 parts per million (ppm) in a child’s play area
or 1,200 ppm in bare soil in other parts of a yard where a child lives (U.S. Environmental
Protection Agency [EPA] 2008). EPA standards were used to categorize XRF soil-lead results
from surveyed compounds into three groups: ≤400 ppm, 401–1200 ppm, and >1200 ppm. A
limited number of water samples were collected by a certified industrial hygienist. Water was
drawn up in a bucket and the sampling bottle was immediately submerged to obtain the sample.
Water samples were stabilized with 1 milliliter of nitric acid. Unfortunately, no field blanks were
taken. Water samples were sent to a commercial environmental testing laboratory in the U.S. and
analyzed using the EPA method 200.8 for lead, arsenic, and manganese. The EPA action level of
15 parts per billion for drinking water was the reference standard for water results (EPA 1991).
Statistical analysis
Data from the household survey, blood-lead results, and environmental sample results were
entered into Epi-Info version 3.5.1 (CDC, Atlanta, GA, USA). Statistical analyses were
Page 11 of 31

12
performed using SAS software (SAS Institute Inc, Cary, NC, USA). Univariate analyses,
including calculation of daily and overall under age 5 mortality rates (U5MR) were performed.
The daily U5MR was calculated by taking the number of deaths per 10,000 children per day for
the six month period of December 2009—May 2010. ,. This rate was compared to the United
Nations High Commission on Refugees (UNHCR) threshold of > 2.0/10,000/day, which
indicates deteriorating conditions in a refugee relief situation (UNHCR 2007). To calculate the
overall U5MR, the number of deaths was divided by the number of children alive in the
compounds in the 12 month period of May 2009—May 2010 and multiplied by 1,000. This was
compared to the U5MR per 1,000 live births for this region of Northwestern Nigeria (217/1,000
live births) as a way to crudely estimate excess mortality in the villages (NPC 2009).
Bivariate and multivariate logistic regression was used to identify risk factors for child mortality
from suspected lead poisoning. Using this outcome compounds without any children aged <5
years were excluded from bivariate and multivariate analyses. Risk factors were grouped into
demographic, ore processing, and other environmental risk factors. Demographic risk factors
included age, gender, and village of residence. Ore-processing risk factors included whether
members of the compound or a child’s mother participated in any of the six ore-processing
activities. Investigators focused on maternal risk factors because children age <5 years in this
population typically spend the majority of time with their mothers in the compound.
Environmental risk factors included proximity to ore-grinding activities, presence of ground
material inside the compound, soil-lead concentrations within the compound, primary water
source, and history of animal death (as a proxy for environmental contamination) within the
compound. The outcome of interest was a child’s death. Multicollinearity, inter-variable
Page 12 of 31

13
correlation, the Hosmer-Lemeshow goodness-of-fit assessment, and the effect of each risk factor
on the outcome were considered. Variables from bivariate analysis with a p-value <0.1 were
tested in the model using backward selection. Variables with a p-value of <0.05 remained in the
final model.
Results
Survey results
All 54 compounds identified in Village A and 65 of 72 (90%) compounds in the central area of
Village B participated in the survey (n = 119). Responses from one compound in Village A were
excluded because data were incomplete. A total of 463 children aged <5 years living in the
sampled areas of the villages from May 2009–May 2010 were included in this analysis. Data
from all 118 surveyed compounds was used to calculate descriptive statistics regarding village
demographics and ore-processing activities. To calculate bivariate and multivariate statistics only
data from the 110 surveyed compounds with children aged <5 years was used.
The two villages were similar demographically (Table 1). An average of 4.2 children aged <5
years lived in each compound. From May 2009–May 2010, 118 of 463 (25%) children aged <5
years in the surveyed compounds were reported to have died and 82% (97/118) were reported to
have had convulsions prior to death. A history of convulsions was reported in 17% (58 of 345) of
the surviving children. Sixty-two (53%) of 110 surveyed compounds with children aged <5 years
reported that from one to eight children aged <5 years had died from May 2009–May 2010.
Eighty-two percent of deaths occurred from December 2009–May 2010 making the daily U5MR
Page 13 of 31

14
12.1/10,000 children age <5 years/day for the period in the villages. The approximate overall
U5MR for the one year period (May 2009–May 2010) was 255/1,000 live births.
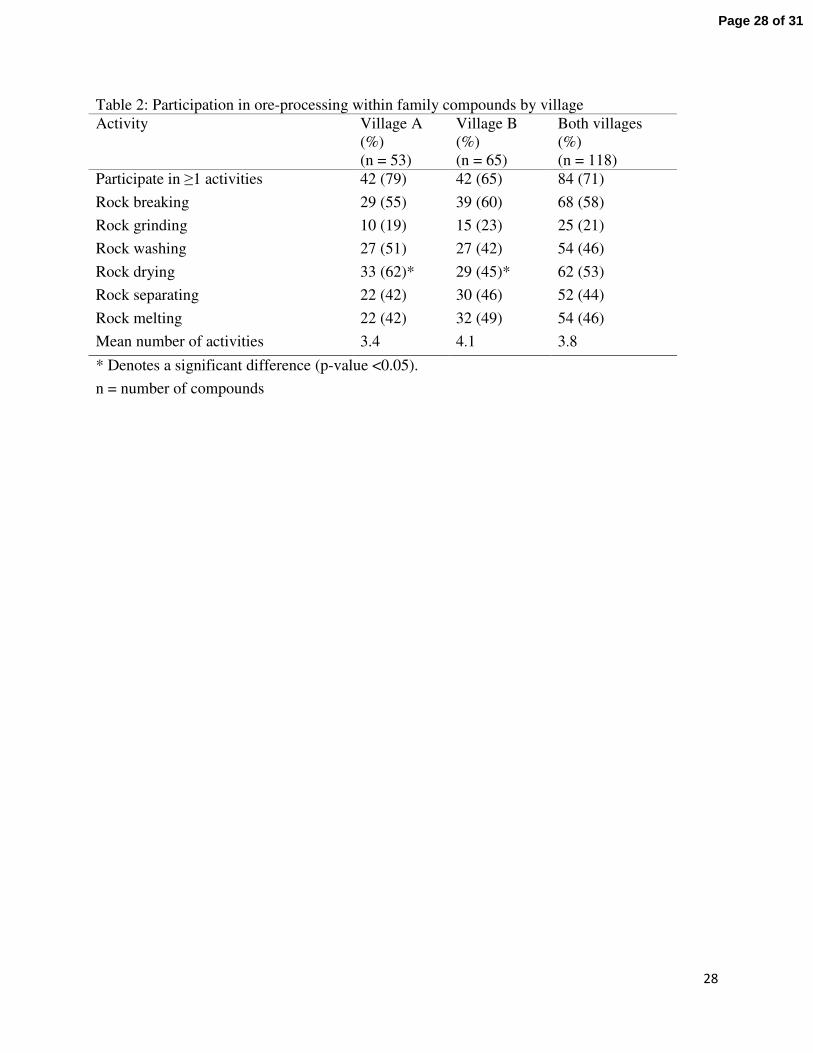
Overall, 84 of 118 (71%) compounds reported processing gold ore within their compound (Table
2). Compounds participating in ore processing averaged four different processing activities. Ore
drying was performed more frequently in compounds in Village A than in Village B (69% vs.
49% p = 0.002). Only 25 compounds reported grinding activities within their compound (Table
2), but 54 of 118 (46%) reported grinding activities nearby, and 32 of 118 (27%) compounds
reported having ground ore present in their compound. Fifty-six of the 84 (67%) compounds
processing ore started doing so in the 12 months preceding the investigation (May 2009–May
2010), however some compounds (33%) reported processing for as long as 18 years. Compounds
in Village B were more likely to use a well inside their compound than those in Village A, who
were more likely to use a community well as their main water source (94% vs. 60%, p <0.001).
Blood sampling
Venous blood-lead samples were obtained from 204 of 345 (59%) children aged <5 years. All
blood samples indicated lead poisoning (BLL ≥10 µg/dL). For 198 of 204 (97%) children, BLLs
were ≥45 µg/dL, the CDC-recommended threshold for initiating chelation therapy (CDC 2002).
Eighty-five percent (173/204) of blood samples exceeded the maximum detection limit of the
LeadCare II instrument (65 µg/dL).
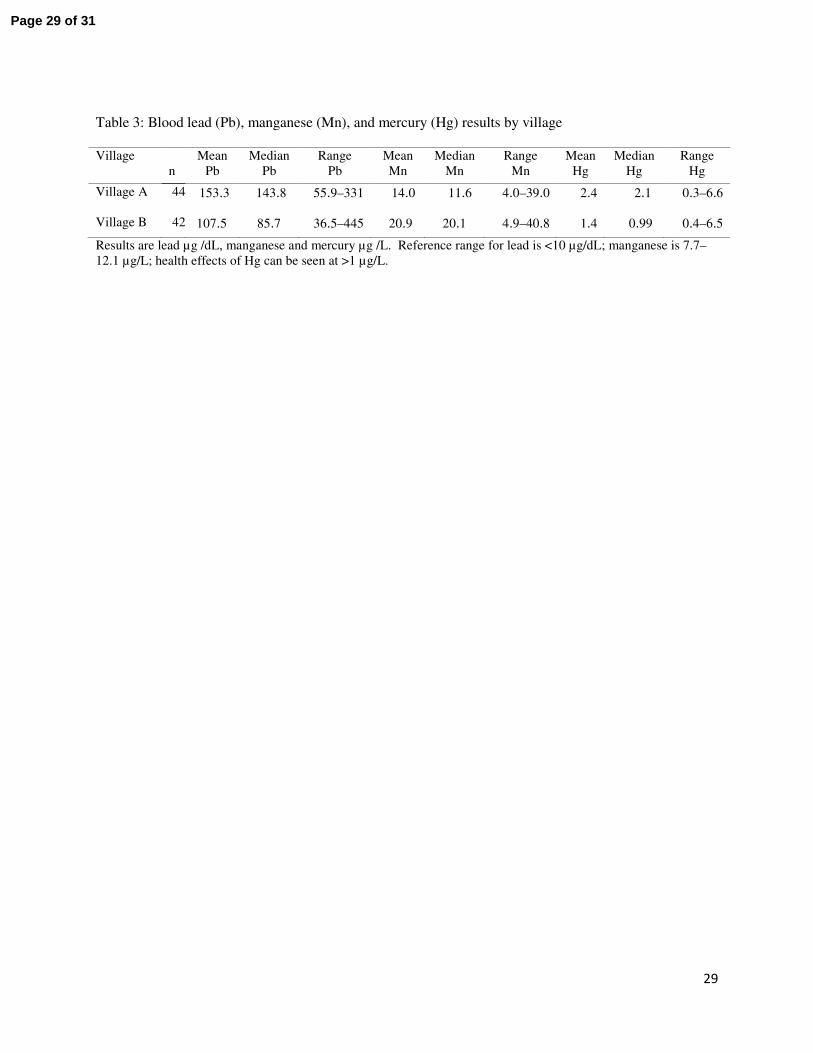
Eighty-six blood samples were sent to CDC laboratories for blood lead, mercury, and manganese
testing (Table 3). The mean blood-lead concentration for children in Village A was 153.3 µg/dL
Page 14 of 31

15
(range 55.9–331.0 µg/dL) and 107.5 µg/dL (range 36.5–445.0 µg/dL) for children in Village B.
The mean total blood mercury level for children in Village A was 2.4 µg/L (range 0.3–6.6 µg/L)
and 1.4 µg/L (range 0.4–6.5 µg/L) in Village B. For comparison, the geometric mean value for
total blood mercury reported for children ages 1–5 in the U.S. Fourth National Report on Human
Exposure to Environmental Chemicals was 0.33 µg/L (95% CI 0.29–0.37) with the 95th
percentile measuring 1.8 µg/L (95% CI 1.3–2.5) (CDC 2010). Mean blood manganese levels
were 14.0 (range 4.0–39.0 µg/L) and 20.9 (range 4.9–40.8 µg/L) in Villages A and B
respectively, and 66% (57/86) of samples were above the reference range of 7.7-12.1 µg/L for
manganese.
Environmental sampling
Soil obtained from 116 of 118 compounds was analyzed in the field. Soil-lead concentrations
ranged from 45 ppm to >100,000 ppm; 85% of samples exceeded the EPA threshold of 400 ppm.
The average soil-lead concentration from household samples analyzed by XRF was 7,959 ppm
(range 421–>100,000 ppm) in Village A and 3,298 ppm (range 45–>100,000 ppm) in Village B.
Four water samples were collected and sent to a commercial environmental testing laboratory in
the U.S. for analysis. Community wells in Villages A and B had 520 ppb and 1,300 ppb of lead
respectively exceeding the EPA action level of 15 ppb of lead in drinking water. Two
convenience water samples, one from pond and one from a private well in Village B were also
tested and had lead concentrations of 250 and 37 ppb lead respectively. The private well was
selected because no ore-processing impact was suspected, and the pond was selected because it
had been used for sluicinggold ore and village livestock were observed using this water source.
The lead concentrations of 5 ore samples from various stages of ore processing were measured at
Page 15 of 31

16
USGS laboratories were 331, 9,150, 13,700 112,000, and 175,000 ppm. This confirmed that
some gold ore processed by the villagers was rich in lead content.
Bivariate and multivariate analyses
Table 4 summarizes the results of bivariate analyses. Children who died were more likely than
children who survived to have had a mother who participated in ore-processing activities (OR =
1.9, 95% CI 1.2, 2.9). Having a mother who participated in grinding, washing, drying,
separating, or melting activities was significantly associated with a child’s death (p < 0.05).
Children who died were more likely than children who survived to have ground ore present in
the compound (OR = 2.0, 95% CI 1.3, 3.2). Proximity to village grinding activities was not
significantly associated with mortality in bivariate analysis.
Environmental and demographic variables tested in the logistic regression model are illustrated
in Table 4. Although we collected data regarding whether any household member performed
ore-processing activities as well as if the child’s mother performed ore-processing activities the
two responses were not mutually exclusive and were highly correlated in bivariate analysis., As
previous studies have found that a child’s BLL is most related to the mother’s activities and BLL
(CDC 2002) we only evaluated risk factors related to the mother’s activities in the logistic
regression model. Child mortality was significantly related to five risk factors in the final model:
the child’s age, whether the mother performed ore breaking or washing activities, whether a
community well was used as a primary water source, and the soil-lead level of the child’s
compound (Table 5). No potential interaction terms were included in the final model as they did
not improve the model’s explanatory power.
Page 16 of 31

17
After controlling for the maternal ore-processing activities of breaking and washing, and
environmental factors including water source and soil-lead level within the compound, children
≤24 months were 2.7 times as likely to have died as children 25–49 months of age (95% CI 1.6,
4.4). In addition, children living in a compound with a soil-lead level of >1200 ppm were 3.6
times as likely to have died as children in a compound with a soil level of <400 ppm (95% CI
1.5, 8.5) and children whose primary water source was a community well outside their
compound were 3.7 times as likely to have died as children whose primary source was a well
inside the compound (95% CI 2.0, 6.8).
Discussion
The United Nations High Commission on Refugees (UNHCR) considers a daily U5MR of
>2.0/10,000/day a key indicator that conditions in a refugee situation are deteriorating (UNHCR
2007). The daily U5MR of this outbreak was more than six times the UNHCR’s benchmark and
well above the overall U5MR in the region (217/1000) and the nation (157/1000). Children aged
≤24 months had 2.6 times the odds of death compared to older children, consistent with previous
research that indicates that younger children are at greater risk for lead poisoning.
This investigation was subject to at least four limitations. First, post-mortem evaluations and
blood-lead samples were not available for deceased children. Thus, not all of these deaths can be
reliably attributed to lead poisoning and BLLs in children who died cannot be compared to those
who lived. Second, we were unable to determine whether other unmeasured cultural or
nutritional factors exist that may explain some of the high mortality rates. Third, the survey and
Page 17 of 31

18
environmental sampling were conducted by local staff with limited training and no field blanks
were obtained to validate sampling methods. Variation could have occurred in the way survey
questions were asked or how environmental samples were collected. Finally, we were only able
to determine an approximate U5MR for the villages prior to the outbreak based on regional data.
Despite these limitations, it is reasonable and prudent to conclude that most of the recent
childhood deaths in these villages were caused by acute lead poisoning and take steps to stop the
exposure. This conclusion is based on high environmental lead concentrations, the percentage of
children with elevated BLLs (97% >45 µg/dL), the high incidence of convulsions before death
(82%), and the significant reduction in mortality once treatment for lead poisoning was initiated
and children were removed from the source of contamination. Although mortality was reduced it
will take some time to fully characterize the extent of neurological damage that has occurred in
these children. In this investigation 85% of surveyed compounds had soil-lead levels that
exceeded 400 ppm and some had levels 250 times the EPA threshold. Most compounds in this
rural, impoverished setting were constructed of dirt walls and floors. Children came in direct
contact large amounts of soil through daily activities and this provides a constant and direct route
of exposure for children. We also demonstrated a relationship of increasing exposure related to
increasing odds of dying — as children whose compounds contained ≤1200 ppm lead were less
likely to die than children whose compounds contained >1200 ppm lead. Moreover,
environmental contamination may not be limited to soil, and contamination of water sources is
also possible. In our multivariate model, the odds of death was 3.7 times greater for children who
had a community well as their main source of water compared to children whose main water
source was a private well in their compound. Four water samples, including two from
Page 18 of 31

19
community wells, had lead concentrations that greatly exceeded the US EPA’s action level for
drinking water of 15 ppb.
Most of the compounds engaged in ore-processing activities (67%) began them in the 12 months
preceding this investigation, when child mortality also increased. Although not captured in our
survey, anecdotal evidence indicates that the increase in child mortality was related to the
increased use of flour-grinding machines located within the villages to grind ore. Prior to
November 2009 at least one grinder was reported by villagers to be in each of the surveyed
villages, but after November 2009 villagers reported that there were up to 10 grinding machines
in each village. The increase in the number of grinding machines would likely amplify the
amount of ground ore around the village and in individual compounds, contributing to
widespread contamination. The increase in lead contamination and continued use of mercury
also warrant investigation into the health effects from multiple metals in children and adults.
Further research on multiple metal exposures in this population is needed.
During and after this investigation, accounts of similar ore-processing activities and increased
rates of child mortality were reported in other nearby villages. Characterizing the full extent of
the outbreak remains an urgent and ongoing matter. As more affected villages are identified,
medical treatment and environmental remediation will require trained personnel and increased
funding. Initiating medical treatment in the absence of environmental remediation is not only
ineffective in reducing children’s lead exposure and body burden, but may cause more harm than
good (Chisholm 1992). CDC recommendations for follow-up and rehabilitation of lead-poisoned
children in the U.S. prioritize control or elimination of sources of exposure as the most essential
Page 19 of 31
20
intervention, and great progress has been made to reduce lead exposure (CDC 2002). In these
villages in Nigeria, contamination of water systems, crops, and animals, as well as the risk of
recurrent contamination from villages who temporarily cease and then resume ore processing,
remain enormous issues to be addressed. Community-based education campaigns are ongoing.
Messages include the need for blood-lead testing and environmental remediation and the dangers
of ore-processing, particularly within the confines of the village.
Beginning in June 2010, chelation therapy was provided free of charge in hospitals supported by
MSF and Nigerian staff for all children aged <5 in the surveyed villages. Hundreds of children
have undergone chelation therapy and unpublished data from MSF clinics in these villages
indicate that child mortality has been reduced from ~43% immediately prior to the investigation
to <1% post investigation. Each compound in the villages has been remediated to decrease the
risk for lead poisoning. Environmental remediation efforts spearheaded by TerraGraphics and the
Blacksmith Institute with the support of Nigerian state and local officials began in early June
2010. TerraGraphics/Blacksmith Institute provided technical assistance and training for the
remediation and the manual labor was largely performed by Nigerian state, local, and village
members. Remediation included removing contaminated surface soil and replacing it with clean
uncontaminated soil and disposing of contaminated soil in secure landfills. Remediation
drastically brought down soil-lead levels inside compounds and reduced child’s exposure to lead.
Remediation efforts also included education messages emphasizing the importance of prohibiting
ore-processing activities and ore-processing materials inside the compound. However, post-
remediation follow-up is necessary to determine the long-term efficacy of the remediation.
Page 20 of 31

21
Unfortunately, the type of artisanal and small-scale mining (ASM) demonstrated in this article is
occurring on a global scale. According to the Global Mercury Project (GMP), an initiative of the
United Nations, ASM occurs in over 55 countries and 10-15 million miners work globally,
primarily in Africa, Asia, and South America. An estimated 100 million people globally rely
directly or indirectly on ASM for their livelihood (Spiegal and Veiga, 2007). Participation in
mining for many individuals is driven by poverty and a lack of economic opportunities,
especially in rural communities, as seen in this outbreak. ASM is the source of 20-30% of the
world’s gold (Spiegal and Veiga, 2007). The price of gold continues to rise on the global market
and during the last decade gold has increased 360% (Swenson et al. 2011).
ASM has long been recognized as having negative health and environmental impacts. Mercury
exposure in mining communities has been well-established in the literature in places such as
Brazil, Indonesia, Zimbabwe, and Ghana, (GMP 2006; Kwaansa-Ansah, Basu, Nriagu, 2010) but
much less is known about other toxic chemicals, such as lead. Findings from this investigation
should be included into existing global initiatives to address other heavy metals in addition to
mercury.
Conclusion
In this article we describe an outbreak of childhood lead poisoning related to artisanal mining
that resulted in child mortality rates which were unprecedented in modern times. To our
knowledge this is the first documentation of an outbreak of childhood lead poisoning associated
with artisanal gold mining. Twenty five percent of children aged <5 years in the two villages
died from May 2009–May 2010 and 97% of surviving children had blood lead levels that
Page 21 of 31

22
required chelation therapy. Extensive environmental contamination was found in both of the
villages and inside individual family compounds. The response to this outbreak required
extensive coordination with federal and state ministries, international non-governmental
organizations, international organizations, and U.S. government agencies.
The need for technological assistance and transfer in countries with developing economies and
healthcare infrastructure is critical. In resource-limited areas such as northern Nigeria, utilization
of natural resources is an economic necessity. However, mining has exposed the communities to
high lead concentrations with devastating effects on the population. Affected children in these
villages may suffer long-term consequences, such as intellectual deficits and blindness. Safer
mining practices, including moving the processing away from village, techniques to reduce dust
generation, and basic hygiene could prevent lead exposure and subsequent lead poisoning in
persons participating in ore-processing activities and their families.
Page 22 of 31
23
References
Agency for Toxic Substances and Disease Registry. 1999. Toxicologic Profile for Mercury,
CAS# 7439-97-6. Atlanta, Georgia, USA.
Bellinger DC. 2004. Lead. Pediatrics 113(4 Suppl):1016-1022.
Berg KK, Hull HF, Zabel EW, Staley PK, Brown MJ, Homa DM. 2006. Death of a child after
ingestion of a metallic charm—Minnesota. MMWR Morb Mortal Wkly Rep 55(12): 340-
341.
Brown MJ, McWeeney G, Kim R, et al. 2009. Lead poisoning among internally displaced Roma,
Ashkali and Egyptian children in the United Nations-Administered Province of Kosovo.
Eur J Public Health 20(3):288-292.
Caldwell KL, Mortensen ME, Jones RL, Caudill SP, Osterloh JD. 2009. Total blood mercury
concentrations in the U.S. population: 1999-2006. Int J Hyg Environ Health 212 (6): 588-
598.
Canfield RL, Henderson CR, Cory-Slecta DA, Cox C, Jusko TA, Lanphear, BP. 2003.
Intellectual impairment in children with blood lead concentrations below 10 microg per
deciliter. N Engl J Med 348 (16): 1517-1526.
Centers for Disease Control and Prevention. 2002. Managing elevated blood lead levels among
young children: recommendations from the Advisory Committee on Childhood Lead
Poisoning Prevention. Atlanta, GA: US Department of Health and Human Services, CDC;
Available: http://www.cdc.gov/nceh/lead/casemanagement/casemanage_main.htm. [accessed
8 Oct 2010].
Centers for Disaese Control and Prevention. 2010. Fourth National Report on Human Exposures
to Environmental Chemicals. Atlanta GA: US Department of Health and Human Services,
CDC; Available: http://www.cdc.gov/exposurereport/pdf/FourthReport.pdf [accessed 15 July
2011]
Chisholm JJ. 1992. BAL, EDTA, DMSA and DMPS in the treatment of lead poisoned children.
Clinical Toxicology 30(4):493-504.
Falk H. 2003. International environmental health for the pediatrician: case study of lead
poisoning. Pediatrics 112(1):259-264.
Page 23 of 31

24
Freeney R, Zink E. 2007. ESA Biosciences Inc. Review of the Performance Characteristics of
the LeadCare II Blood Lead Testing System. Available:
http://www.rnamedical.com/pdf/inserts/leadcare/70-6869.pdf. [accessed 6 Jan 2011]
Garcia Vargas GG, Rubio Andrade M, Del Razo LM, Borja Abutro V, Vera Aguilar E, Cebrian
ME. 2001. Lead exposure in children living in a smelter community in region Lagunera,
Mexico. J Toxicol Environ Health A 62(6):417-429.
Global Mercury Project, Environmental and Health Assessment Final Report 2006. Available at
http://www.globalmercuryproject.org/documents/non_country%20specific/GMP-EHA-
Final_Report-July24-06.pdf [accessed 15 July 2011].
Haefliger P, Mathieu-Nolf M, Lociciro S, et al. 2009. Mass lead intoxication from informal used
lead-acid battery recycling in Dakar, Senegal. Environ Health Perspect 117(10):1535-1540.
Henretig FM. 2006. Lead. In: Goldfrank’s Toxicologic Emergencies. 8th
ed: (Flomenbaun NE,
Goldfrank LR, Hoffman RS, Howland MA, Lewin NA, Nelson LS, eds. ) New York:
McGraw-Hill 1308-24.
Jones RL, Homa DM, Meyer PA, Brody DJ, Caldwell KL, Pirkle JL, Brown MJ. 2007. Trends in
blood lead levels and blood lead testing among US children aged 1 to 5 years, 1988-2004.
Pediatrics 123 (3): 376-385.
Jones DR, Jarrett JJ, Caldwell KL, Jones RL.2010 Comparisons between ICP-DRC-MS and ICP-
CCT-MS for the analysis of Manganese in whole human blood. In: ICP Information
Newsletter Winter Conference on Plasma Spectrochemistry, 38 (8) Florida.
Kaul B, Sandhu RS, Depratt C, Reyes F. 1999. Follow-up screening of lead-poisoned children
near an auto battery recycling plant, Haina, Dominican Republic. Environ Health
Perspect 107(11):917-920.
Kwaansa-Ansah EE, Basu N, Nriagu JO. 2010. Enviromental and occupational exposures to
mercury among indigenous people in Dunkwa-On-Offin, a small scale gold mining area
in the south-west of Ghana. Bull Environ Contam Toxicol 85(5) 476-480.
Lalor GC, Vutchkov MK, Bryan ST, et al. 2006. Acute lead poisoning associated with backyard
lead smelting in Jamaica. West Indian Med J 55(6):394-398.
Lanphear BP, Hornung R, Khoury J, et al. 2005. Low-level environmental lead exposure and
children’s intellectual function: an international pooled analysis. Environ Health Perspect
113(7):894-899.
Page 24 of 31
25
Lidsky TI, Schneider JS. 2003. Lead neurotoxicity in children: basic mechanisms and clinical
correlates. Brain 126(1):5-19.
McDonald JM and Kaplan E. 1942. Incidence of lead poisoning in the city of Baltimore, JAMA
119 (11): 870-872.
Mendelsohn AL, Dreyer BP, Fierman AH, et al. 1998. Low-lead exposure and behavior in early
childhood. Pediatrics 101(3): E10.
Meyer PA, Brown MJ, Falk, H. 2008. Global approach to reducing lead exposure and poisoning.
Mutat Res 659(1-2):166-175.
Milne DB. 1999. Trace elements. In: Tietz textbook of clinical chemistry. (Burtis CA and
Ashwood ER, eds). Philadelphia: WB Saunders Co. 1029-1055.
National Population Commission (NPC) [Nigeria] and ICF Macro. 2009. Nigeria Demographic
and Health Survey 2008. Abuja, Nigeria. p 121.
National Research Council, 1972. Biologic effects of lead in man. In: Lead: Airborne lead in
perspective. Washington DC: National Academy of Sciences p 91-93.
Spiegal SJ and Veiga MM. 2007 Global impacts of mercury supply and demand in small-scale
gold mining: Report to the UNEP Governing Council Meeting Nairobi 2007. Available:
http://www.chem.unep.ch/mercury/partnerships/2006%20GMP%20Report%20to%20UNEP
%20GC24.pdf [accessed 10 July 2011].
Swenson JJ, Carter CE, Domec J, Delgado CI. 2011. Gold mining in the peruvian Amazon:
global prices, deforestation, and mercury imports. PLoS One 6(4):e18875.
Tellez-Rojo MM, Bellinger DC, Arroyo-Quiroz C, et al. 2006. Longitudinal associations
between blood lead concentrations lower than 10 microg/dL and neurobehavioral
development in environmentally exposed children in Mexico City. Pediatrics 118(2):E 323-
330.
United Nations High Commissioner for Refugees. 2007. Handbook for Emergencies. 3rd
edition.
Available: http://www.unhcr.org/472af2972.pdf [accessed 6 Jan 2011].
United States Environmental Protection Agency. 2007 SW-846 On-line: Test methods for
evaluating solid wastes physical/chemical methods. Available:
http://www.epa.gov/osw/hazard/testmethods/sw846/online/index.htm [accessed 29 2011].
United States Environmental Protection Agency. 2008 73 CFR 745. Lead; renovation, repair, and
painting program; Lead hazard information pamphlet, notice of availability; final rule.
Page 25 of 31

26
Federal Register. Available: http://www.epa.gov/fedrgstr/epa-tox/2008/april/day-
22/t8141.pdf [accessed 8 July 2010].
United States Environmental Protection Agency 1991. 40 CFR Part 141 Subpart I—Control of
Lead and Copper. Electronic Code of Federal Regulations. Available:
htc=ecfr&rgn=div5&view=text&node=40:22.0.1.1.3&idno=40#40:22.0.1.1.3.9.16.1tp://ecfr.
gpoaccess.gov/cgi/t/text/text-idx? [accessed 6 Jan 2011].
World Health Organization. 2010. Preventing disease through healthy environments. Available:
http://www.who.int/ipcs/features/10chemicals_en.pdf [accessed 6 Jan 2011].
World Medical Association (2008) Declaration of Helsinki Ethical Principles for Medical
Research Involving Human Subjects. Available:
http://www.wma.net/en/30publications/10policies/b3/index.html [accessed 7 July 2011].
Page 26 of 31

27
Table 1: Demographics of participating family compounds by village
Demographic Village A (%)
(n = 53)
Village B (%)
(n = 65)
Both villages (%)
(n = 118)
Mean number of married men per
compound
3.1 2.1 2.6
Mean number of mothers per
compound
3.7
3.0
3.4
Mean number of children aged <5
years per compound
4.8
3.1
4.2
Total number of children aged <5
years in participating compounds,
as of May 2009
259
204
463
Number of children aged <5 years
living at time of survey (%)
181 (70)
164 (80)
345 (75)
Number of children aged <5 years
who had died within last 12
months before survey (%)
78 (30)
40 (20)
118 (25)
Number compounds with ≥1
pregnant women (%)
26 (49)
24 (37)
50 (42)
n = number of compounds
Page 27 of 31
28
Table 2: Participation in ore-processing within family compounds by village
Activity Village A
(%)
(n = 53)
Village B
(%)
(n = 65)
Both villages
(%)
(n = 118)
Participate in ≥1 activities 42 (79) 42 (65) 84 (71)
Rock breaking 29 (55) 39 (60) 68 (58)
Rock grinding 10 (19) 15 (23) 25 (21)
Rock washing 27 (51) 27 (42) 54 (46)
Rock drying 33 (62)* 29 (45)* 62 (53)
Rock separating 22 (42) 30 (46) 52 (44)
Rock melting 22 (42) 32 (49) 54 (46)
Mean number of activities 3.4 4.1 3.8
* Denotes a significant difference (p-value <0.05).
n = number of compounds
Page 28 of 31
29
Table 3: Blood lead (Pb), manganese (Mn), and mercury (Hg) results by village
Village
n
Mean
Pb
Median
Pb
Range
Pb
Mean
Mn
Median
Mn
Range
Mn
Mean
Hg
Median
Hg
Range
Hg
Village A
44 153.3 143.8 55.9–331 14.0 11.6 4.0–39.0 2.4 2.1 0.3–6.6
Village B 42 107.5 85.7 36.5–445 20.9 20.1 4.9–40.8 1.4 0.99 0.4–6.5
Results are lead µg /dL, manganese and mercury µg /L. Reference range for lead is <10 µg/dL; manganese is 7.7–
12.1 µg/L; health effects of Hg can be seen at >1 µg/L.
Page 29 of 31

30
Table 4: Potential risk factors for child mortality Potential risk factor Outcome
Deceased Alive
Crude Odds Ratio
(95% CI)
p-value
Maternal Activities
Breaks ore 1.5 (0.96, 2.2) 0.08
Yes 56 132
No 62 213
Grinds ore 2.6 (1.4, 5.0) 0.002
Yes 20 25
No 98 320
Washes ore 2.6 (1.4, 4.7) 0.002
Yes 22 28
No 96 317
Dries ore 2.9 (1.8, 4.8) <0.0001
Yes 38 48
No 80 297
Separates ore 1.7 (1.0, 3.1) 0.05
Yes 23 42
No 95 303
Other environmental risk factors
Mother performs ≥1
ore-processing activity
74 163 1.9 (1.2, 2.9) 0.0037
Mother performs 0
ore-processing activities
44 182
Soil-lead level in compound
<400 ppm 8 53 Ref Ref
400-1200 ppm 20 111 1.2 (0.5, 2.9) 0.7
>1200 ppm 90 178 3.4 (1.5, 7.4) 0.0026
Dried ore in compound 2.0 (1.3, 3.2) 0.0041
Yes 46 82
No 72 263
Main water source
Community well
35 38
3.4 (2.0, 5.7) <0.0001
Private well 83 307
History of animal death in compound 2.4 (1.5, 3.8) 0.0003
Yes animal death 89 195
No animal death 29 150
Demographic risk factors
Age Birth-24 mos ) 88 181 2.6 (1.6, 4.2) <0.0001
25-49 mos
Village of residence
Village A
Village B
30 161
78 181
40 164
1.8 (1.1, 2.7)
0.01
Page 30 of 31

31
Table 5: Significant risk factors retained in final model
Risk factors Crude Odds
Ratio
(95% CI)
p-value
Adjusted Odds
Ratios
(95% CI)
Maternal Activities
Breaks ore 1.5 (0.96, 2.2) 0.08 1.8 (1.1, 3.0)
Washes ore 2.6 (1.4, 4.7) 0.002 3.4 (1.7, 6.7)
Other environmental risk factors
Lead level in compound
<400 ppm Ref Ref Ref
400-1200 ppm 1.2 (0.5, 2.9) 0.7 1.5 (0.6, 3.8)
>1200 ppm 3.4 (1.5, 7.4) 0.0026 3.6 (1.5, 8.5)
Main water source 3.4 (2.0, 5.7) <0.0001 3.7 (2.0, 6.8)
Demographic risk factors
Age (birth-24 mos vs. 25-49 mos) 2.6 (1.6, 4.2) <0.0001 2.6 (1.6, 4.4)
Page 31 of 31