efficient stabilization of phosphodiester (po...
TRANSCRIPT
Efficient Stabilization of Phosphodiester (PO), Phosphorothioate (PS),and 2′-O-Methoxy (2′-OMe) DNA·RNA Hybrid Duplexes by AminoSugarsI. Charles, Erik Davis, and Dev P. Arya*
Laboratory of Medicinal Chemistry, Department of Chemistry, Clemson University, Clemson, South Carolina 29634, United States
*S Supporting Information
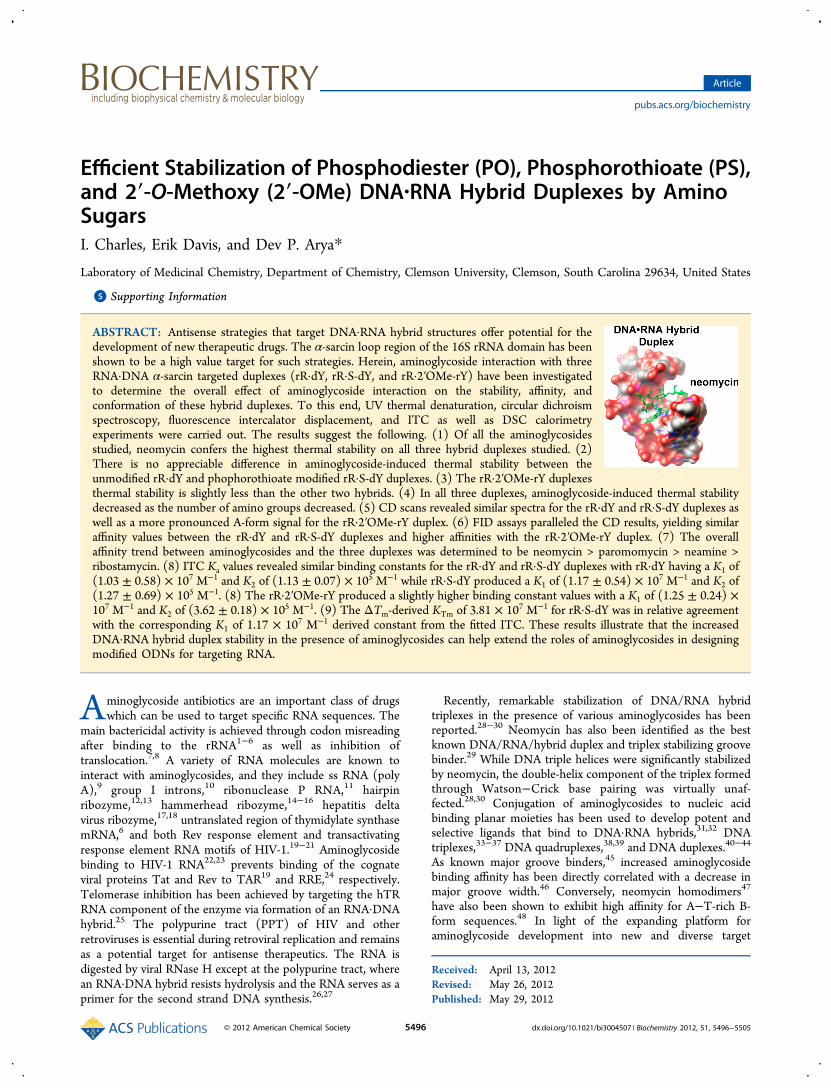
ABSTRACT: Antisense strategies that target DNA·RNA hybrid structures offer potential for thedevelopment of new therapeutic drugs. The α-sarcin loop region of the 16S rRNA domain has beenshown to be a high value target for such strategies. Herein, aminoglycoside interaction with threeRNA·DNA α-sarcin targeted duplexes (rR·dY, rR·S-dY, and rR·2′OMe-rY) have been investigatedto determine the overall effect of aminoglycoside interaction on the stability, affinity, andconformation of these hybrid duplexes. To this end, UV thermal denaturation, circular dichroismspectroscopy, fluorescence intercalator displacement, and ITC as well as DSC calorimetryexperiments were carried out. The results suggest the following. (1) Of all the aminoglycosidesstudied, neomycin confers the highest thermal stability on all three hybrid duplexes studied. (2)There is no appreciable difference in aminoglycoside-induced thermal stability between theunmodified rR·dY and phophorothioate modified rR·S-dY duplexes. (3) The rR·2′OMe-rY duplexesthermal stability is slightly less than the other two hybrids. (4) In all three duplexes, aminoglycoside-induced thermal stabilitydecreased as the number of amino groups decreased. (5) CD scans revealed similar spectra for the rR·dY and rR·S-dY duplexes aswell as a more pronounced A-form signal for the rR·2′OMe-rY duplex. (6) FID assays paralleled the CD results, yielding similaraffinity values between the rR·dY and rR·S-dY duplexes and higher affinities with the rR·2′OMe-rY duplex. (7) The overallaffinity trend between aminoglycosides and the three duplexes was determined to be neomycin > paromomycin > neamine >ribostamycin. (8) ITC Ka values revealed similar binding constants for the rR·dY and rR·S-dY duplexes with rR·dY having a K1 of(1.03 ± 0.58) × 107 M−1 and K2 of (1.13 ± 0.07) × 105 M−1 while rR·S-dY produced a K1 of (1.17 ± 0.54) × 107 M−1 and K2 of(1.27 ± 0.69) × 105 M−1. (8) The rR·2′OMe-rY produced a slightly higher binding constant values with a K1 of (1.25 ± 0.24) ×107 M−1 and K2 of (3.62 ± 0.18) × 105 M−1. (9) The ΔTm-derived KTm of 3.81 × 10⁷ M−1 for rR·S-dY was in relative agreementwith the corresponding K1 of 1.17 × 10⁷ M−1 derived constant from the fitted ITC. These results illustrate that the increasedDNA·RNA hybrid duplex stability in the presence of aminoglycosides can help extend the roles of aminoglycosides in designingmodified ODNs for targeting RNA.
Aminoglycoside antibiotics are an important class of drugswhich can be used to target specific RNA sequences. The
main bactericidal activity is achieved through codon misreadingafter binding to the rRNA1−6 as well as inhibition oftranslocation.7,8 A variety of RNA molecules are known tointeract with aminoglycosides, and they include ss RNA (polyA),9 group I introns,10 ribonuclease P RNA,11 hairpinribozyme,12,13 hammerhead ribozyme,14−16 hepatitis deltavirus ribozyme,17,18 untranslated region of thymidylate synthasemRNA,6 and both Rev response element and transactivatingresponse element RNA motifs of HIV-1.19−21 Aminoglycosidebinding to HIV-1 RNA22,23 prevents binding of the cognateviral proteins Tat and Rev to TAR19 and RRE,24 respectively.Telomerase inhibition has been achieved by targeting the hTRRNA component of the enzyme via formation of an RNA·DNAhybrid.25 The polypurine tract (PPT) of HIV and otherretroviruses is essential during retroviral replication and remainsas a potential target for antisense therapeutics. The RNA isdigested by viral RNase H except at the polypurine tract, wherean RNA·DNA hybrid resists hydrolysis and the RNA serves as aprimer for the second strand DNA synthesis.26,27
Recently, remarkable stabilization of DNA/RNA hybridtriplexes in the presence of various aminoglycosides has beenreported.28−30 Neomycin has also been identified as the bestknown DNA/RNA/hybrid duplex and triplex stabilizing groovebinder.29 While DNA triple helices were significantly stabilizedby neomycin, the double-helix component of the triplex formedthrough Watson−Crick base pairing was virtually unaf-fected.28,30 Conjugation of aminoglycosides to nucleic acidbinding planar moieties has been used to develop potent andselective ligands that bind to DNA·RNA hybrids,31,32 DNAtriplexes,33−37 DNA quadruplexes,38,39 and DNA duplexes.40−44
As known major groove binders,45 increased aminoglycosidebinding affinity has been directly correlated with a decrease inmajor groove width.46 Conversely, neomycin homodimers47
have also been shown to exhibit high affinity for A−T-rich B-form sequences.48 In light of the expanding platform foraminoglycoside development into new and diverse target
Received: April 13, 2012Revised: May 26, 2012Published: May 29, 2012
Article
pubs.acs.org/biochemistry
© 2012 American Chemical Society 5496 dx.doi.org/10.1021/bi3004507 | Biochemistry 2012, 51, 5496−5505
genres,49the path is clear for the application of effectivestrategies to control gene expression through the inhibition ofcrucial steps in translation, slicing, or activation of RNase H.50
Within the functionally active 16S rRNA domain, the A-site51−55 and α-sarcin loop region are critical targets for haltingprotein synthesis.56−58 The binding of aminoglycosides to theribosomal A-site has been shown to cause an improperselection of aminoacyl-tRNA during elongation as well astranslocation inhibition. A similar breakdown in ribosomalfunction has been linked to the α-sarcin-catalyzed hydrolysis ofthe phosphodiester bond that links the eighth and ninthresidues within the α-sarcin loop.59 This cleavage prevents theproper formation of elongation factor aminoacyl-tRNAcomplexes and results in the termination of protein synthesis.51
The importance of this single phosphodiester linkageemphasizes the significance of the α-sarcin loop as an attractivetarget for antisense oligonucleotides. As such, the potential fordevelopment of novel therapeutic antisense strategies thattarget the α-sarcin loop is great.The successful application of antisense oligonucleotide
strategies depends upon such factors as the drug’s stabilitytoward cellular nucleases, ability to activate RNase H whenhybridized to mRNA, and intracellular uptake. In order toachieve the above criteria, a variety of backbone and sugarmodifications have been explored. Among them, the phosphor-othioate modified S-DNA (S-dY) exhibits the most efficientintracellular uptake when compared to other modifiedoligonucleotides including peptide nucleic acids, 2′-O-methyl,and methylphosphonate oligonucleotides.60−65 Additionally, S-DNA has been shown to activate transcription factors66 andtargets a variety of proteins such as growth factors andreceptors.67−69 Thus, phosphorothioate oligonucleotides wereamong the most important first generation antisensetherapeutics to proceed to clinical trial stage.70 However, theduplex stability of S-DNA with DNA and RNA has beenreported to be less than its DNA counterpart.71−76
Our results describing aminoglycoside stabilization of hybridduplexes77−80 as well as neomycin assisted delivery of plasmidDNA and oligonucleotides,81 in conjunction with the reportedpotential applications of S-DNA oligonucleotides in antisensetherapeutics, prompted us to further explore the efficiency ofaminoglycoside stabilization of phosphorothioate and 2′-O-methyl duplexes. Herein, we report the efficient stabilization ofunmodified and modified α-sarcin mimic (rR) duplexes (rR·dY,rR·S-dY, and rR·2′OMe-rY, Scheme 1) in the presence ofaminoglycosides.
■ MATERIALS AND METHODS
Nucleic Acids and Aminoglycosides. 7mer DNA (dY)and phosphorothioate modified DNA (S-dY) were purchasedfrom Integrated DNA Technologies, Inc., (Coralville, IA) andwere used without further purification. RNA [(rR)(2′OMe-rY)]was purchased from Dharmacon, Inc., (Lafayette, CO) and wasused without further purification. Oligonucleotides used includedY, lot number 4388590; rR, lot numbers COFRA-0001 andCHAIB-0001; and S-dY, lot numbers 6928998, 6596188, and6776459. The concentrations of all the nucleic acid solutionswere determined spectrophotometrically using the followingextinction coefficients (on a per strand basis, M−1 cm−1) ε260 =81 900 for rR, ε260 = 54 000 for S-dY, and ε260 = 54 000 for dY.The following aminoglycosides were purchased from ICNPharmaceuticals, Inc. (Aurora, OH), and were used withoutfurther purification: ribostamycin (lot 98564), amikacin (lot2775C), gentamicin (lot 93706), neomycin (lot 88235),neamine (lot 5332C), and streptomycin (lot R4235). Thefollowing were purchased from Sigma (St. Louis, MO) andwere used without further purification: neomycin (lot129H0918), paromomycin (lot 39H1276), and lividomycin(lot 77F0769). Kanamycin (lot 994856) was purchased fromFisher Scientific (Fair Lawn, NJ) and was used without furtherpurification.
UV Spectroscopy. UV spectra were recorded at λ = 200−300 nm on a Cary 1E UV/vis spectrophotometer equippedwith temperature programming. Spectrophotometer stabilityand λ alignment were checked prior to initiation of eachmelting point experiment. For accurate Tm determinations,first-derivative functions were used. Data were recorded every1.0 deg. In all UV experiments, the samples were heated from20 to 95 °C at a rate of 5 °C/min, annealed (95−5 °C, at a rateof 0.2 °C/min rate), and again melted (5−90 °C, at a rate of0.2 °C/min rate), and the samples were brought back to 25 °Cat a rate of 5 °C/min. During melting and annealing, theabsorbance of each solution was monitored at the followingwavelengths: 260, 280, and 284 nm. The second melting stagewas used for calculating melting temperature.
CD Spectroscopy. All CD experiments were conducted at15 °C on a JASCO J-810 spectrophotometer equipped with athermoelectrically controlled cell holder. A quartz cell with a 1cm path length was used in all CD studies. CD spectra wererecorded as an average of three scans from 300 to 200 nm. Inisothermal CD titration experiments, small aliquots ofconcentrated ligand solutions were added to 1.8 mL of 10μM nucleic acid solutions in buffer and allowed to equilibratefor at least 20 min prior to scanning. Scanning experimentswere carried out in 1.8 mL of 10 μM nucleic acid solutions inbuffer without the presence of an aminoglycoside. Theexperiments were carried out in 60 mM total Na+ ions, 10mM sodium cacodylate, 0.1 mM EDTA, at pH 6.0.
FID Assays. FID experiments were conducted on a PhotonTechnology International (Lawrenceville, NJ) fluorimeter. TheFID experiments were performed at 10 °C. The total volumeused was 1.8 mL. The nucleic acid concentration used was 2μM per duplex with a 7 μM thiazole orange (TO)concentration. The buffer used in the experiment was 10 mMsodium cacodylate, 0.1 mM EDTA, 60 mM total Na+, and pH6.0. TO was excited at 504 nm, and the emission was recordedfrom 515 to 600 nm. The ligand concentration required todisplace 50% of the bound fluorescent probe was determinedfrom a dose response curve using the Origin 5.0 software
Scheme 1. α-Sarcin Mimic Base Sequence (rR) as Well as theModified and Unmodified Sequences Used To ConstructrR·dY, rR·S-dY, and rR·2′OMe-rY Duplexes
a(*) indicates a phosphorothioate linkage between bases. b(m)indicates the presence of 2′OMe groups.
Biochemistry Article
dx.doi.org/10.1021/bi3004507 | Biochemistry 2012, 51, 5496−55055497
(MicroCal, Inc., Northampton, MA) and is expressed as itsAC50.ITC Studies. Isothermal titration calorimetric measurements
were performed at 10 and 15 °C on a MicroCal VP-ITC(MicroCal, Inc., Northampton, MA). In a typical experiment, 5μL aliquots of 500 μM drug were injected from a rotatingsyringe (300 rpm) into an isothermal sample chambercontaining 1.42 mL of a duplex solution that was 20 μM perduplex. Each experiment was accompanied by control experi-ments in which 5 μL aliquots of the drug were titrated intobuffer. The duration of each injection was 5.0 s, and the delaybetween each injection was 300 s. The initial delay prior to thefirst injection of 2 μL was 60 s. Each injection generated a heatburst curve (microcalories per second vs seconds). The areaunder each curve was determined by integration using Origin5.0 software (MicroCal, Inc., Northampton, MA) to obtain ameasure of the heat associated with that injection. The bufferused in the experiment was 10 mM sodium cacodylate, 0.1 mMEDTA, 60 mM total Na+, and pH 6.0.DSC Experiments. DSC measurements were performed
using a VP-DSC Microcalorimeter from Microcal Inc. (North-ampton, MA). The DSC consists of 0.511 mL of sample and
reference cells. Both cells were first loaded with buffer solution,equilibrated at 5 °C for 15 min, and scanned from 5 to 90 °C ata scan rate of 60 °C/h. Extreme care was taken to minimize thepresence of air bubbles in loading of the sample cell. The datawere recorded every 2 s. The solution was brought back to 5 °Cat the rate of 60 °C/h and incubated for 15 min. The aboveprocedure was repeated four times in order to check forreversibility. Then, the sample cell was emptied, rinsed, andloaded with the duplex solution (40 μM per duplex) andscanned under the same conditions. The net DSC scan wasanalyzed for thermodynamic parameters using Origin 5.0software (MicroCal, Inc., Northampton, MA). The pre- andpost-transitional baselines were determined from least-squaresfits of straight lines to the data points, respectively, below theonset of the transition peak and following the return of thetransition peak to the baseline. A sigmoidal baseline wasdetermined under the transition peak by extrapolating the pre-and post-transitional baselines and employing the profile of thetransition peak. The difference in the extrapolated baselines atthe transition temperature divided by the number of moles ofduplex is the heat capacity change.
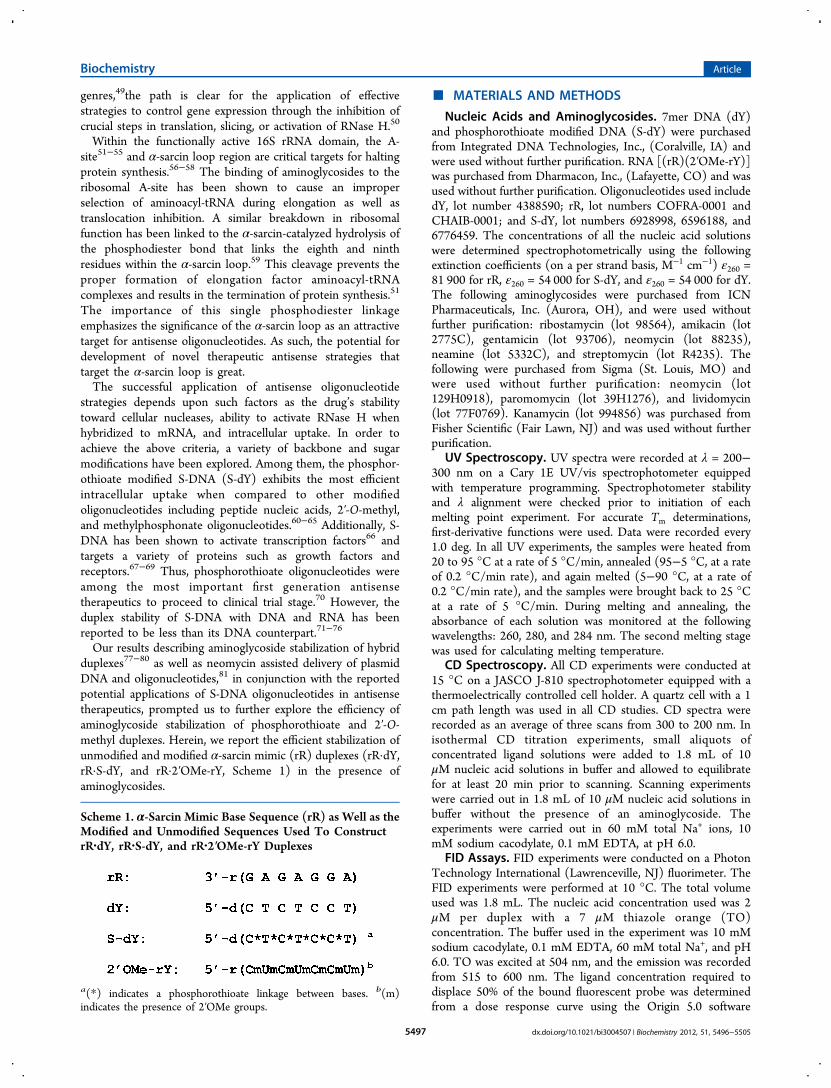
Figure 1. Chemical stuctures for the aminoglycosides studied herein.
Biochemistry Article
dx.doi.org/10.1021/bi3004507 | Biochemistry 2012, 51, 5496−55055498

ΔTm Method. The following equation was used to calculateassociation constants at the corresponding melting temper-atures where the nucleic acid was complexed to the ligand.82
°− =
Δ+
T TR
n HK L
1 1( )
ln(1 )Tm m HS
m (1)
Tm° is the melting temperature of ligand free nucleic acid, Tmcorresponds to the melting temperature of ligand boundnucleic acid, ΔHHS represents the enthalpy change correspond-ing to nucleic acid base pair melting in the absence of ligand (asdetermined by DSC measurement), L is free ligandconcentration at Tm (estimated by one-half the total ligandconcentration), and n is the binding site size determined by CDand fluorescence experiments. After obtaining the associationconstants at Tm, the integrated Van’t Hoff equation (2) wasused to calculate the association constants at 10 °C.83
= −Δ − −Δ −
Δ
K K
T T
/[e e
( / ) ]
TH R T T C T T T
C R
obs/ (1/ 1/ ) (1/ 1/ )
m/
p
p
mobs m m
(2)
where ΔHobs is the observed binding enthalpy of ligand tonucleic acid as derived from ITC excess site bindingexperiments at 10 °C, R is the gas constant, and ΔCp is theheat capacity change determined from eq 3 by using bindingenthalpies at various temperatures.
Δ = ∂∂
CHTp (3)
■ RESULTS AND DISCUSSIONUV Thermal Denaturation Studies. UV thermal denatu-
ration of rR·dY, rR·S-dY, and rR·2′OMe-rY duplexes in the
presence of various aminoglycosides was carried out in a 60mM total sodium ion concentration (Table 1, Figure 2,Supporting Information Figures S1−S3). ΔTm2→1 values weredetermined as the difference between the experimental andcontrol Tm values, (Table 1, Figure 2). The results indicated
that neomycin stabilized all three structures more than theother aminoglycosides studied with ΔTm2→1 values of 13.7,13.8, and 12.6 °C for the rR·dY, rR·S-dY, and rR·2′OMe-rYduplexes, respectively (Table 1, Figure 2). Paromomycin, whilestructurally similar, displayed lower thermal stabilization withΔTm2→1 values of 6.8, 7.8, and 4.9 °C (Table 1, Figure 2). Acomparison of ΔTm2→1 values for the rR·dY duplex andribostamycin revealed 2.8 times lower thermal stability whencompared to neomycin (Table 1, Figure 2). Similarly,neamine’s thermal stabilization of the rR·dY duplex was 3.6times less than neomycin (Table 1, Figure 2). Both resultsemphasize the importance of ring III and IV involvement inaminoglycoside−target interaction. The same pattern wasobserved with rR·2′OMe-rY duplex which displayed slightlylower ΔTm values when compared to rR·dY and rR·S-dYduplexes (Table 1, Figure 2). The overall trend revealed by theΔTm values in Table 1 and Figure 2 reinforces the importanceof amine−target electrostatic interaction with higher thermalstability being conferred by structures having more chargedamines and lower thermal stabilization for ligands with fewercharged amines. This trend was found to be consistent with allthree duplexes studied (Table 1, Figure 2).The thermal denaturation value for the rR·dY duplex in the
absence of aminoglycosides was found to be higher than therR·S-dY duplex. In the presence of neomycin (rdup = 1.0), themelting temperature (Tm) of rR·dY and rR·S-dY duplexes were38 and 30 °C, respectively (Figures S1 and S2) This is in goodagreement with literature where S-DNA/RNA hybrid duplexeshave been shown to be thermally less stable than theirunmodified counterpart.73,74 In the presence of polyamines,phosphorothioated hybrid duplexes were reported to bethermally less stable (showing a difference in the Tm of 5
Figure 2. Change in ΔTm2→1 (rdup = 1.0), where rdup is the ratio of thedrug per duplex, derived from thermal denaturation curves for rR·dY(green), rR·S-dY (red), and rR·2′OMe-rY (blue) duplexes with variousaminoglycosides. The number of possible charged amines in eachligand is listed in parentheses next to the aminoglycoside. Conditions:10 mM sodium cacodylate, 0.1 mM EDTA, 60 mM total Na+ ions, andpH 6.0.
Table 1. UV ΔTm Values at 260 nm in the Presence of 60mM Na+ Ion Concentration with rdup = 1.75a
ΔTm
aminoglycoside rR·dY rR·S-dY rR·2′OMe-rY
neomycin (6) 13.7 13.8 12.6sisomicin (5) 13.0 13.0 12.0tobramycin (5) 10.7 11.8 11.6gentamicin (5) 8.9 8.9 7.9kanamycin (5) 7.9 9.9 5.9lividomycin (5) 7.8 8.9 6.9paromomycin (5) 6.8 7.8 4.9ribostamycin (4) 4.9 3.9 4.9neamine (4) 3.8 3.9 4.9amikacin (4) 3.8 3.8 −0.1streptomycin (3) 2.0 0.9 −1.1
ardup = ratio of the drug per duplex. The number of possible chargedamines for each ligand is listed in parentheses next to theaminoglycoside. Conditions: 10 mM sodium cacodylate, 0.1 mMEDTA, pH 6.0.
Table 2. AC50 Values Obtained From FID Assaysa
AC50 (μM)
nucleic acid neomycin paromomycin ribostamycin neamine
rR·dY 1.0 4.2 33.6 16.5rR·S-dY 1.1 4.3 84.3 15.9rR·2′OMe-rY 0.44 0.83 5.3 1.3
aThe experimental conditions are listed in the Materials and Methodssection.
Biochemistry Article
dx.doi.org/10.1021/bi3004507 | Biochemistry 2012, 51, 5496−55055499

°C) than their unmodified hybrid duplexes as well.74 TherR·2′OMe-rY duplex, on the other hand, displayed a thermalstabilization value in the absence of an aminoglycoside that wassignificantly higher than either the rR·dY and rR·S-dY duplex,ΔTm = 39 °C (Figure S3). Despite these differences, theΔTm2→1 values for all three duplexes in the presence ofaminoglycosides were comparable to each other with ΔTm2→1
values ±2 °C for rR·S-dY and rR·dY duplexes and slightly lowervalues for the rR·2′OMe-rY duplex (Table 1, Figure 2).
CD Spectroscopy. The interaction of neomycin with therR·S-dY duplex hybrid duplex was monitored by CD spectros-copy. The CD spectrum obtained by incremental titration ofneomycin into a solution of rR·S-dY duplex showed peakalterations due to the interaction between the host and ligand(Figure 3A). A plot of normalized molar ellipticity (λ = 278nm) versus rdup (Figure 3B) revealed one clear distinctinflection at 1.1 corresponding to a first binding site.The shape of the CD spectrum changed significantly as rdup
was increased from 0 to 1.0 as opposed to the minimal changeobserved between rdup 1.0 and 1.5 (Figure 3A). Further increasein rdup did not alter the CD spectrum considerably (Figure 3A).This observation was found to be consistent with a bindingstoichiometry of ∼1.5 neomycin molecules per duplex, whichwas later confirmed through ITC studies (Table 3).CD scans were conducted to determine any structural
difference between the rR·dY, rR·S-dY, and rR·2′OMe-rYduplexes (Figure 4). The CD spectra for the rR·dY and rR·S-dYduplexes were practically alike, displaying broad positive bandsat 275 nm and shallow negative bands at 210 nm (Figure 4).The similarity of the spectra indicated that the phosphor-othioate linkage in the rR·S-dY duplex’s backbone had noappreciable effect on structure when compared to the rR·dYduplex’s normal phosphodiester linkage (Figure 4). However,the rR·2′OMe-rY duplex’s CD spectra showed substantialdifference with an intense positive band shift at 270 nm and astrong negative band at 210 nm (Figure 4).
Figure 3. CD titration of 10 μM of rR·S-dY duplex with neomycin at molar ratios of 0, 0.5, 1, 1.5, 2, 3, and 4 [neomycin]/[duplex] (A). A plot ofnormalized molar ellipticity versus rdup for CD titration of rR·S-dY duplex with neomycin (B). The continuous lines reflect the linear least-squares fitsof each apparent linear domain of the experimental data (filled circles) before and after the apparent inflection points. Conditions: 10 mM sodiumcacodylate, 0.1 mM EDTA, 60 mM total Na+, pH 6.0, and 15 °C.
Table 3. Thermodynamic Binding Parameters Derived from Two-Site Model Fits of ITC-Derived Isotherms for NeomycinTitrations into the rR·dY, rR·S-dY, and rR·2′OMe-rY Duplexesa
nucleic acid binding sites N Ka (M−1) ΔHobs (kcal/mol) TΔS (kcal/mol) ΔG (kcal/mol)
rR·dY 2 0.4 (1.03 ± 0.58) × 107 −9.46 ± 0.26 −0.21 −9.25 ± 0.260.3 (1.13 ± 0.07) × 105 −34.79 ± 0.67 −28.12 −6.67 ± 0.67
rR·S-dY 2 0.9 (1.17 ± 0.54) × 107 −14.88 ± 0.18 −5.55 −9.33 ± 0.180.6 (1.27 ± 0.69) × 105 −34.09 ± 0.51 −27.35 −6.74 ± 0.51
rR·2′OMe-rY 2 0.9 (1.25 ± 0.24) × 107 −7.74 ± 0.08 1.61 −9.35 ± 0.080.8 (3.62 ± 0.18) × 105 −15.01 ± 0.46 −7.68 −7.33 ± 0.46
aConditions: 60 mM total Na+ ions, 10 mM sodium cacodylate, 0.1 mM EDTA, at pH 6.0 at 15 °C.
Figure 4. CD for spectra for rR·dY (black), rR·S-dY (red), andrR·2′OMe-rY (blue) duplexes 10 uM. Conditions: 60 mM total Na +
ions, 10 mM sodium cacodylate, 0.1 mM EDTA, pH 6.0 at 15 °C.
Biochemistry Article
dx.doi.org/10.1021/bi3004507 | Biochemistry 2012, 51, 5496−55055500

FID Assays. FID assays were carried out to assess the overalltrend for aminoglycoside binding affinity with the duplexes(Figures S4−S16). Neomycin, paromomycin, ribostamycin, andneamine were used as ligands to gauge the relative constitutiveeffect of charged amine and ring interaction with the targets(Figure 1). The results of these assays were compiled intoTable 2 where they are represented as AC50 values, theconcentration of ligand required to displace 50% of theintercalating fluorophore. The highest AC50 values wererecorded with neomycin for all three duplexes (Table 2). TheAC50 values for aminoglycoside interaction with rR·dY andrR·S-dY paralleled one another with figures that wereextraordinarily close in value with an exception for rR·dY/rR·S-dY/ribostamycin interaction (Table 2). AC50 values for
rR·2′OMe-rY were consistently lower than the values for theother two duplexes (Table 2). Both of these trends can besuccinctly explained by the CD spectral differences representedin Figure 4. The rR·dY and rR·S-dY duplexes have almostidentical structures and therefore parallel affinities. TherR·2′OMe-rY duplex’s spectra indicates more pronounced A-form structure and hence a higher affinity. Even so, the overalltrend for aminoglycosides affinity for the rR·dY, rR·S-dY, andrR·2′OMe-rY duplexes was determined to be neomycin >paromomycin > neamine > ribostamycin (Table 2).
ITC Studies. The nature of the binding of neomycin torR·dY, rR·S-dY, and rR·2′OMe-rY duplexes was studied usingITC experiments. Figure 5 shows ITC isotherms for neomycintitrated against rR·dY, rR·S-dY, and rR·2′OMe-rY duplexes.
Figure 5. ITC isotherm profiles for neomycin 500 μM titrated against rR·dY (A), rR·S-dY (B), and rR·2′OMe-rY (C) duplexes, 20 μM at 15 °C.Conditions: 60 mM total Na+ ions, 10 mM sodium cacodylate, 0.1 mM EDTA at pH 6.0.
Biochemistry Article
dx.doi.org/10.1021/bi3004507 | Biochemistry 2012, 51, 5496−55055501
Each isotherm reveals a biphasic interaction (Figure 5). Assuch, all injection heat data were fitted with a model for twoindependent binding sites. The fits were obtained by keepingdrug−duplex association constant (Ka) and observed bindingenthalpy ΔHobs as free-floating parameters and varying drug−duplex binding stoichiometry (N) to get less χ2. The results arepresented in the Table 3 and will be discussed in theThermodynamic Interactions section.DSC and ΔTm. The ITC titration of neomycin versus rR·S-
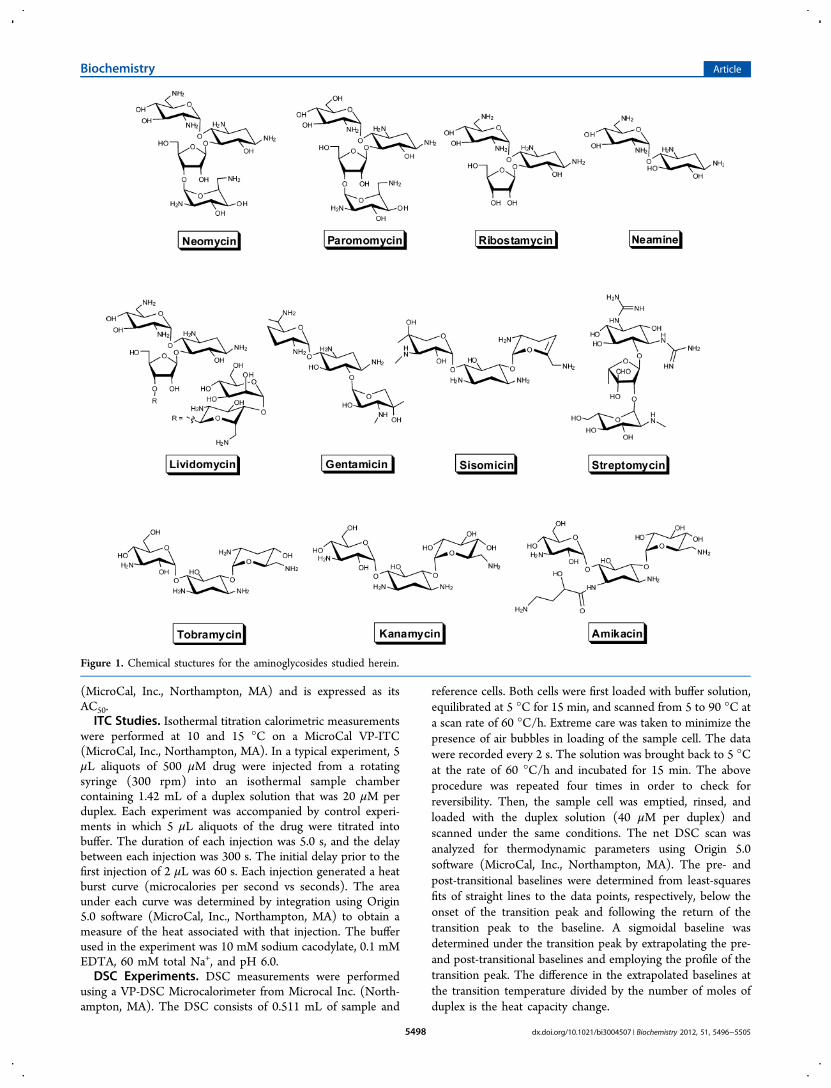
dY duplex was repeated at 10 °C in order to determineassociation constant (KT) at a reference temperature (Figure6).84−86 The heat capacity change (ΔCp) was calculated fromΔHT1
(−13.81 kcal/mol) and ΔHT2(−12.46 kcal/mol) of the
first binding event of two ITC experiments carried out at twodifferent temperatures, T1 (288 K) and T2 (283 K),respectively, using eq 1 (Figure 6). The resulting calculatedΔCp (−270 cal mol−1 K−1) was used to estimate the apparentdrug−duplex association constant at Tm from eq 2. A KTm
of
5.73 × 10⁶ M−1 was calculated from eq 3 using the followingterms: the melting temperature of the drug-free (Tm° = 293.2K) and drug-bound duplex (Tm = 311.04 K) (Figures S1 andS2), the enthalpy change for the melting of the duplex in theabsence of bound drug (a value determined by differentialscanning calorimetry, ΔHdup = 23.33 kcal/mol, Figure 7),binding stoichiometry obtained from ITC experiment (n = 1.1,Figure 3), and the free drug concentration (L = 2 × 10⁻⁶ M) atTm. The resulting K25
Tm of 3.81 × 10⁷ M−1 was in relativeagreement with the corresponding K1 of 1.17 × 10⁷ M−1
derived constant from the fitted ITC profile corroborating theresult.
Thermodynamic Interactions. The results reveal twoligand binding sites for each duplex (Table 3). The bindingstoichiometry for each duplex varied with a 0.7, 1.5, and 1.7overall ligand to duplex ratio for rR·dY, rR·S-dY, andrR·2′OMe-rY respectively (Table 3). Binding constants forprimary binding sites were consistently 2 orders of magnitude
Figure 6. Excess binding site experiment: neomycin 10 μM vs rR·S-dY 50 μM at 10 °C (A). Excess binding site experiment; neomycin 10 μM vsrR·S-dY 50 μM at 15 °C (B).
Figure 7. DSC profile of rR·S-dY duplex 40 μM per duplex.Conditions: 60 mM total Na+ ions, 10 mM sodium cacodylate, 0.1mM EDTA, at pH 6.0.
Figure 8. Thermodynamic profiles for neomycin-nucleic binding.Green bars represent ΔH values, blue bars TΔS values, and red barsΔG values. The number in parentheses indicates the first or secondbinding site for its associated duplex. Conditions: 60 mM total Na+
ions, 10 mM sodium cacodylate, 0.1 mM EDTA, at pH 6.0 at 15 °C.
Biochemistry Article
dx.doi.org/10.1021/bi3004507 | Biochemistry 2012, 51, 5496−55055502
higher than secondary sites (Table 3). A comparison of Kavalues for rR·dY and rR·S-dY duplexes which were shown tohave similar CD spectra and FID affinity (Figure 4, Table 2)revealed comparable binding constants with rR·dY having a K1of (1.03 ± 0.58) × 107 M−1 and K2 of (1.13 ± 0.07) × 105 M−1
while rR·S-dY produced a K1 of (1.17 ± 0.54) × 107 M−1 andK2 of (1.27 ± 0.69) × 105 M−1 (Table 3). The rR·2′OMe-rYduplex whose CD spectra and FID affinity were markedlydifferent from the other two duplexes (Figure 4, Table 2)produced slightly higher binding constant values with a K1 of(1.25 ± 0.24) × 107 M−1 and K2 of (3.62 ± 0.18) × 105 M−1,which is consistent with the higher FID affinity (Tables 2 and3).A bar plot of the individual thermodynamic components for
each hybrid duplex’s interaction with neomycin according toGibb’s free energy equation is represented in Figure 8. Profilesfor the rR·dY versus the rR·S-dY duplex first binding siterevealed a higher negative ΔH and TΔS for rR·S-dY whencompared to rR·dY (Figure 8). However, the thermodynamiccomponents for the second binding event in both the rR·dYand rR·S-dY duplexes were essentially the same (Figure 8). TherR·2′OMe-rY duplex first binding site produced a negative ΔHand a slightly positive TΔS (Figure 8). The second site forrR·2′OMe-rY duplex produced a thermodynamic profile similarin character to the second site in the previous duplexes but withmuch lower overall negative values (Figure 8). Thesedifferences underscore the structural/conformational dissim-ilarities between the rR·2′OMe-rY and the rR·dY/rR·S-dYduplexes (Figures 4 and 8).
■ SUMMARYWhile backbone-modified ODNs have shown promise asantisense therapeutic agents, the overall thermal stability ofthese structures can limit their potential. Herein, it has beendemonstrated that aminoglycosides significantly stabilize α-sarcin loop mimic rR·dY, rR·S-dY, and rR·2′OMe-rY duplexes.Among all aminoglycosides studied, neomycin was found to bethe most potent double-helix stabilizer for all three duplexes.Additionally, stabilization was demonstrated to be correlatedwith aminoglycoside participating amino groups and ringinteractions. The structural similarities between the rR·dYand rR·S-dY duplexes produced similar binding affinities,thermodynamic profiles, and binding constants with Ka valuesfor the PS containing rR·S-dY duplex almost equal in value tothe native rR·dY species. Even though the stability of antisensephosphorothioate backbone containing oligonucleotides towardcellular nucleases, their ability to activate RNase H, and theirsuccessful intracellular uptake are better than unmodified DNAand other reported modified oligonucleotides, their thermalstability has been shown to be less than their DNAcounterparts.71−76 In this connection, our current resultsshowing increased stability in the presence of aminoglycosideswill further extend the successful application of phosphor-othioate DNA and 2′OMe-DNA in antisense applications.
■ ASSOCIATED CONTENT*S Supporting InformationThermal denaturation plots for aminoglycoside interaction withthe hybrid duplexes; FID spectra including titration plot offluorescence intensity versus emission wavelength, maximumemission fluorescence vs addition concentration, sigmoidalcurve fits, and curve fit parameter values. This material isavailable free of charge via the Internet at http://pubs.acs.org.
■ AUTHOR INFORMATION
Corresponding Author*Tel 864-656-1106; Fax 864-656-6613; e-mail [email protected].
FundingP.I. thanks the National Science Foundation (CHE/MCB-0134972) and National Institutes of Health (R41GM097917)for financial support.
NotesThe authors declare no competing financial interest.
■ ABBREVIATIONS
UV, ultraviolet spectroscopy; CD, circular dichroism spectros-copy; FID, fluorescence intercalator displacement; ITC,isothermal calorimetry; DSC, differential scanning calorimetry.
■ REFERENCES(1) Miller, P. S., Kipp, S. A., and McGill, C. (1999) A psoralen-conjugated triplex-forming oligodeoxyribonucleotide containing alter-nating methylphosphonate-phosphodiester linkages: Synthesis andinteractions with DNA. Bioconjugate Chem. 10, 572−577.(2) Moazed, D., and Noller, H. F. (1987) Interaction of antibioticswith functional sites in 16S ribosomal RNA. Nature 327, 389−394.(3) Purohit, P., and Stern, S. (1994) Interactions of a small RNA withantibiotic and RNA ligands of the 30S subunit. Nature 370, 659−662.(4) Recht, M. I., Fourmy, D., Blanchard, S. C., Dahlquist, K. D., andPuglisi, J. D. (1996) RNA sequence determinants for aminoglycosidebinding to an A-site rRNA model oligonucleotide. J. Mol. Biol. 262,421−436.(5) Miyaguchi, H., Narita, H., Sakamoto, K., and Yokoyama, S.(1996) An antibiotic-binding motif of an RNA fragment derived fromthe A-site-related region of escherichia coli 16S rRNA. Nucleic AcidsRes. 24, 3700−3706.(6) Tok, J. B. H., Cho, J., and Rando, R. R. (1999) Aminoglycosideantibiotics are able to specifically bind the 5′-untranslated region ofthymidylate synthase messenger RNA. Biochemistry 38, 199−206.(7) Davies, J., and Davis, B. D. (1968) Misreading of ribonucleic acidcode words induced by aminoglycoside antibiotics. the effect of drugconcentration. J. Biol. Chem. 243, 3312−3316.(8) Davies, J., Gorini, L., and Davis, B. D. (1965) Misreading of RNAcodewords induced by aminoglycoside antibiotics. Mol. Pharmacol. 1,93−106.(9) Xi, H., Gray, D., Kumar, S., and Arya, D. P. (2009) Molecularrecognition of single-stranded RNA: Neomycin binding to poly(A).FEBS Lett. 583, 2269−2275.(10) Cho, J., and Rando, R. R. (1999) Specificity in the binding ofaminoglycosides to HIV-RRE RNA. Biochemistry 38, 8548−8554.(11) Mikkelsen, N. E., Brannvall, M., Virtanen, A., and Kirsebom, L.A. (1999) Inhibition of RNase P RNA cleavage by aminoglycosides.Proc. Natl. Acad. Sci. U. S. A. 96, 6155−6160.(12) Earnshaw, D. J., and Gait, M. J. (1998) Hairpin ribozymecleavage catalyzed by aminoglycoside antibiotics and the polyaminespermine in the absence of metal ions. Nucleic Acids Res. 26, 5551−5561.(13) Walter, F., Murchie, A. I., Thomson, J. B., and Lilley, D. M.(1998) Structure and activity of the hairpin ribozyme in its naturaljunction conformation: Effect of metal ions. Biochemistry 37, 14195−14203.(14) Tor, Y., Hermann, T., and Westhof, E. (1998) DecipheringRNA recognition: Aminoglycoside binding to the hammerheadribozyme. Chem. Biol. 5, R277−R283.(15) Stage, T. K., Hertel, K. J., and Uhlenbeck, O. C. (1995)Inhibition of the hammerhead ribozyme by neomycin. RNA 1, 95−101.
Biochemistry Article
dx.doi.org/10.1021/bi3004507 | Biochemistry 2012, 51, 5496−55055503
(16) Clouet-d’Orval, B., Stage, T. K., and Uhlenbeck, O. C. (1995)Neomycin inhibition of the hammerhead ribozyme involves ionicinteractions. Biochemistry 34, 11186−11190.(17) Chia, J. S., Wu, H. L., Wang, H. W., Chen, D. S., and Chen, P. J.(1997) Inhibition of hepatitis delta virus genomic ribozyme self-cleavage by aminoglycosides. J. Biomed. Sci. 4, 208−216.(18) Robles, J., and McLaughlin, L. W. (1997) DNA triplexstabilization using a tethered minor groove binding hoechst 33258analogue. J. Am. Chem. Soc. 119, 6014−6021.(19) Zapp, M. L., Stern, S., and Green, M. R. (1993) Small moleculesthat selectively block RNA binding of HIV-1 rev protein inhibit revfunction and viral production. Cell 74, 969−78.(20) Mei, H., Galan, A. A., Halim, N. S., Mack, D. P., Moreland, D.W., Sanders, K. B., Truong, H. N., and Czarnik, A. W. (1995)Inhibition of an HIV-1 tat-derived peptide binding to TAR RNA byaminoglycoside antibiotics. Bioorg. Med. Chem. Lett. 5, 2755−2760.(21) Hermann, T., and Westhof, E. (1998) Saccharide-RNArecognition. Biopolymers 48, 155−165.(22) Kumar, S., Kellish, P., Robinson, W. E., Wang, D., Appella, D.H., and Arya, D. P. (2012) Click dimers to target HIV TAR RNAconformation. Biochemisry 51, 2331−2347.(23) Kumar, S., and Arya, D. P. (2011) Recognition of HIV TARRNA by triazole linked neomycin dimers. Bioorg. Med. Chem. Lett. 21,4788−4792.(24) Mei, H. Y., Mack, D. P., Galan, A. A., Halim, N. S., Heldsinger,A., Loo, J. A., Moreland, D. W., Sannes-Lowery, K., Sharmeen, L.,Truong, H. N., and Czarnik, A. W. (1997) Discovery of selective,small-molecule inhibitors of RNA complexes--I. the tat protein/TARRNA complexes required for HIV-1 transcription. Bioorg. Med. Chem.5, 1173−1184.(25) Glukhov, A. I., Zimnik, O. V., Gordeev, S. A., and Severin, S. E.(1998) Inhibition of telomerase activity of melanoma cells in vitro byantisense oligonucleotides. Biochem. Biophys. Res. Commun. 248, 368−371.(26) Hansen, J., Schulze, T., Mellert, W., and Moelling, K. (1988)Identification and characterization of HIV-specific RNase H bymonoclonal antibody. EMBO J. 7, 239−243.(27) Wohrl, B., and Moelling, K. (1990) Interaction of HIV-1 RNaseH with polypurine tract containing RNA-DNA hybrids. Biochemistry29, 10141−10147.(28) Arya, D. P., and Coffee, R. L., J. (2000) DNA triple helixstabilization by aminoglycoside antibiotics. Bioorg. Med. Chem. Lett. 10,1897−1899.(29) Arya, D. P., Coffee, R. L., and Charles, I. (2001) Neomycin-induced hybrid triplex formation. J. Am. Chem. Soc. 123, 11093−11094.(30) Arya, D. P., Coffee, R. L., Willis, B., and Abramovitch, A. I.(2001) Aminoglycoside-nucleic acid interactions: Remarkable stabili-zation of DNA and RNA triple helices by neomycin. J. Am. Chem. Soc.123, 5385−5395.(31) Shaw, N. N., and Arya, D. P. (2008) Recognition of the uniquestructure of DNA:RNA hybrids. Biochimie 90, 1026−1039.(32) Shaw, N. N., Xi, H., and Arya, D. P. (2008) Molecularrecognition of a DNA:RNA hybrid: Sub-nanomolar binding by aneomycin-methidium conjugate. Bioorg. Med. Chem. Lett. 18, 4142−4145.(33) Arya, D. P., Xue, L., and Tennant, P. (2003) Combining the bestin triplex recognition: Synthesis and nucleic acid binding of a BQQ-neomycin conjugate. J. Am. Chem. Soc. 125, 8070−8071.(34) Arya, D. P., Xue, L., and Willis, B. (2003) Aminoglycoside(neomycin) preference is for A-form nucleic acids, not just RNA:Results from a competition dialysis study. J. Am. Chem. Soc. 125,10148−10149.(35) Xue, L., Charles, I., and Arya, D. P. (2002) Pyrene-neomycinconjugate: Dual recognition of a DNA triple helix. Chem. Commun. 1,70−71.(36) Arya, D. P., Micovic, L., Charles, I., Coffee, R. L., Jr., Willis, B.,and Xue, L. (2003) Neomycin binding to watson-hoogsteen (W-H)DNA triplex groove: A model. J. Am. Chem. Soc. 125, 3733−3744.
(37) Xue, L., Xi, H., Kumar, S., Gray, D., Davis, E., Hamilton, P.,Skriba, M., and Arya, D. P. (2010) Probing the recognition surface of aDNA triplex: Binding studies with intercalator-neomycin conjugates.Biochemistry 49, 5540−5552.(38) Ranjan, N., Andreasen, K. F., Kumar, S., Hyde-Volpe, D., andArya, D. P. (2010) Aminoglycoside binding to oxytricha novatelomeric DNA. Biochemistry 49, 9891−9903.(39) Xue, L., Ranjan, N., and Arya, D. P. (2011) Synthesis andspectroscopic studies of the aminoglycoside (neomycin)-peryleneconjugate binding to human telomeric DNA. Biochemistry 50, 2838−2849.(40) Willis, B., and Arya, D. P. (2010) Triple recognition of B-DNAby a neomycin-hoechst 33258-pyrene conjugate. Biochemistry 49, 452−469.(41) Willis, B., and Arya, D. P. (2009) Triple recognition of B-DNA.Bioorg. Med. Chem. Lett. 19, 4974−4979.(42) Willis, B., and Arya, D. P. (2006) Major groove recognition ofDNA by carbohydrates. Curr. Org. Chem. 10, 663−673.(43) Willis, B., and Arya, D. P. (2006) Recognition of B-DNA byneomycin-hoechst 33258 conjugates. Biochemistry 45, 10217−10232.(44) Arya, D. P., and Willis, B. (2003) Reaching into the majorgroove of B-DNA: Synthesis and nucleic acid binding of a neomycin-hoechst 33258 conjugate. J. Am. Chem. Soc. 125, 12398−12399.(45) Hamilton, P. L., and Arya, D. P. (2012) Natural product DNAmajor groove binders. Nat. Prod. Rep. 29, 134−143.(46) Xi, H., Davis, E., Ranjan, N., Xue, L., Hyde-Volpe, D., and Arya,D. P. (2011) Thermodynamics of nucleic acid “shape readout” by anaminosugar. Biochemistry 50, 9088−9113.(47) Arya, D. P., Coffee, R. L., Jr., and Xue, L. (2004) From triplex toB-form duplex stabilization: Reversal of target selectivity by amino-glycoside dimers. Bioorg. Med. Chem. Lett. 14, 4643−4646.(48) Kumar, S., Xue, L., and Arya, D. P. (2011) Neomycin-neomycindimer: An all-carbohydrate scaffold with high affinity for AT-rich DNAduplexes. J. Am. Chem. Soc. 133, 7361−7375.(49) Willis, B., and Arya, D. P. (2006) An expanding view ofaminoglycoside-nucleic acid recognition. Adv. Carbohydr. Chem.Biochem. 60, 251−302.(50) Agrawal, S., Mayrand, S. H., Zamecnik, P. C., and Pederson, T.(1990) Site-specific excision from RNA by RNase H and mixed-phosphate-backbone oligodeoxynucleotides. Proc. Natl. Acad. Sci. U. S.A. 87, 1401−1405.(51) Hausner, T. P., Atmadja, J., and Nierhaus, K. H. (1987)Evidence that the G2661 region of 23S rRNA is located at theribosomal binding sites of both elongation factors. Biochimie 69, 911−923.(52) Fourmy, D., Recht, M. I., Blanchard, S. C., and Puglisi, J. D.(1996) Structure of the A site of escherichia coli 16S ribosomal RNAcomplexed with an aminoglycoside antibiotic. Science 274, 1367−1371.(53) Fourmy, D., Recht, M. I., and Puglisi, J. D. (1998) Binding ofneomycin-class aminoglycoside antibiotics to the A-site of 16 S rRNA.J. Mol. Biol. 277, 347−362.(54) Fourmy, D., Yoshizawa, S., and Puglisi, J. D. (1998)Paromomycin binding induces a local conformational change in theA-site of 16 S rRNA. J. Mol. Biol. 277, 333−345.(55) Carter, A. P., Clemons, W. M., Brodersen, D. E., Morgan-Warren, R., Wimberly, B. T., and Ramakrishnan, V. (2000) Functionalinsights from the structure of the 30S ribosomal subunit and itsinteractions with antibiotics. Nature 407, 340−348.(56) Egebjerg, J., Larsen, N., and Garrett, R. A. (1990) The Ribosome,American Society For Microbiology, Washington, DC.(57) Steitz, J. A., and Jakes, K. (1975) How ribosomes select initiatorregions in mRNA: Base pair formation between the 3′ terminus of 16SrRNA and the mRNA during initiation of protein synthesis inescherichia coli. Proc. Natl. Acad. Sci. U. S. A. 72, 4734−4738.(58) Hill, W. E., Camp, D. G., Tapprich, W. E., and Tassanakajohn,A. (1988) Probing ribosome structure and function using shortoligodeoxyribonucleotides. Methods Enzymol. 164, 401−419.(59) Endo, Y., and Wool, I. G. (1982) The site of action of alpha-sarcin on eukaryotic ribosomes. the sequence at the alpha-sarcin
Biochemistry Article
dx.doi.org/10.1021/bi3004507 | Biochemistry 2012, 51, 5496−55055504
cleavage site in 28 S ribosomal ribonucleic acid. J. Biol. Chem. 257,9054−9060.(60) Gray, G. D., Basu, S., and Wickstrom, E. (1997) Transformedand immortalized cellular uptake of oligodeoxynucleoside phosphor-othioates, 3′-alkylamino oligodeoxynucleotides, 2′-O-methyl oligoribo-nucleotides, oligodeoxynucleoside methylphosphonates, and peptidenucleic acids. Biochem. Pharmacol. 53, 1465−1476.(61) Iversen, P. L., Zhu, S., Meyer, A., and Zon, G. (1992) Cellularuptake and subcellular distribution of phosphorothioate oligonucleo-tides into cultured cells. Antisense Res. Dev. 2, 211−222.(62) Crooke, R. M., Graham, M. J., Cooke, M. E., and Crooke, S. T.(1995) In vitro pharmacokinetics of phosphorothioate antisenseoligonucleotides. J. Pharmacol. Exp. Ther. 275, 462−473.(63) Politz, J. C., Taneja, K. L., and Singer, R. H. (1995)Characterization of hybridization between synthetic oligodeoxynucleo-tides and RNA in living cells. Nucleic Acids Res. 23, 4946−4953.(64) Thierry, A. R., and Dritschilo, A. (1992) Intracellular availabilityof unmodified, phosphorothioated and liposomally encapsulatedoligodeoxynucleotides for antisense activity. Nucleic Acids Res. 20,5691−5698.(65) Temsamani, J., Kubert, M., Tang, J., Padmapriya, A., andAgrawal, S. (1994) Cellular uptake of oligodeoxynucleotide phosphor-othioates and their analogs. Antisense Res. Dev. 4, 35−42.(66) Perez, J. R., Li, Y., Stein, C. A., Majumder, S., van Oorschot, A.,and Narayanan, R. (1994) Sequence-independent induction of Sp1transcription factor activity by phosphorothioate oligodeoxynucleo-tides. Proc. Natl. Acad. Sci. U. S. A. 91, 5957−5961.(67) Brown, D. A., Kang, S. H., Gryaznov, S. M., DeDionisio, L.,Heidenreich, O., Sullivan, S., Xu, X., and Nerenberg, M. I. (1994)Effect of phosphorothioate modification of oligodeoxynucleotides onspecific protein binding. J. Biol. Chem. 269, 26801−26805.(68) Khaled, Z., Benimetskaya, L., Zeltser, R., Khan, T., Sharma, H.W., Narayanan, R., and Stein, C. A. (1996) Multiple mechanisms maycontribute to the cellular anti-adhesive effects of phosphorothioateoligodeoxynucleotides. Nucleic Acids Res. 24, 737−745.(69) Stein, C. A. (1995) Does antisense exist? Nat. Med. 1, 1119−1121.(70) Matteucci, M. D., and Wagner, R. W. (1996) In pursuit ofantisense. Nature 384, 20−22.(71) Clark, C. L., Cecil, P. K., Singh, D., and Gray, D. M. (1997) CD,absorption and thermodynamic analysis of repeating dinucleotideDNA, RNA and hybrid duplexes [d/r(AC)]12.[d/r(GT/U)]12 andthe influence of phosphorothioate substitution. Nucleic Acids Res. 25,4098−4105.(72) Kibler-Herzog, L., Zon, G., Uznanski, B., Whittier, G., andWilson, W. D. (1991) Duplex stabilities of phosphorothioate,methylphosphonate, and RNA analogs of two DNA 14-mers. NucleicAcids Res. 19, 2979−2986.(73) Vickers, T., Baker, B. F., Cook, P. D., Zounes, M., Buckheit, R.W., J., Germany, J., and Ecker, D. J. (1991) Inhibition of HIV-LTRgene expression by oligonucleotides targeted to the TAR element.Nucleic Acid Res. 19, 3359−3368.(74) Antony, T., Thomas, T., Shirahata, A., and Thomas, T. J. (1999)Selectivity of polyamines on the stability of RNA-DNA hybridscontaining phosphodiester and phosphorothioate oligodeoxyribonu-cleotides. Biochemistry 38, 10775−10784.(75) Cummins, L., Graff, D., Beaton, G., Marshall, W. S., andCaruthers, M. H. (1996) Biochemical and physicochemical propertiesof phosphorodithioate DNA. Biochemistry 35, 8734−8741.(76) Kandimalla, E. R., Manning, A., Zhao, Q., Shaw, D. R., Byrn, R.A., Sasisekharan, V., and Agrawal, S. (1997) Mixed backbone antisenseoligonucleotides: Design, biochemical and biological properties ofoligonucleotides containing 2′-5′-ribo- and 3′-5′-deoxyribonucleotidesegments. Nucleic Acid Res. 25, 370−378.(77) Charles, I., Xi, H., and Arya, D. P. (2007) Sequence-specifictargeting of RNA with an oligonucleotide-neomycin conjugate.Bioconjug. Chem. 18, 160−169.(78) Arya, D. P. (2005) Aminoglycoside-nucleic acid interactions:The case for neomycin. Top. Curr. Chem. 253, 149−178.
(79) Charles, I., and Arya, D. P. (2005) Synthesis of neomycin-DNA/peptide nucleic acid conjugates. J. Carbohydr. Chem. 24, 145−160.(80) Charles, I., Xue, L., and Arya, D. P. (2002) Synthesis ofaminoglycoside-DNA conjugates. Bioorg. Med. Chem. Lett. 12, 1259−1262.(81) Napoli, S., Carbone, G. M., Catapano, C. V., Shaw, N., and Arya,D. P. (2005) Neomycin improves cationic lipid-mediated transfectionof DNA in human cells. Bioorg. Med. Chem. Lett. 15, 3467−3469.(82) McGhee, J. D. (1976) Theoretical calculations of the helix-coiltransition of DNA in the presence of large, cooperatively bindingligands. Biopolymers 15, 1345−1375.(83) Doyle, M. L., Brigham-Burke, M., Blackburn, M. N., Brooks, I.S., Smith, T. M., Newman, R., Reff, M., Stafford, W. F., III, Sweet, R.W., Truneh, A., Hensley, P., and O’Shannessy, D. J. (2000)Measurement of protein interaction bioenergetics: Application tostructural variants of anti-sCD4 antibody. Methods Enzymol. 323, 207−230.(84) Kaul, M., and Pilch, D. S. (2002) Thermodynamics ofaminoglycoside-rRNA recognition: The binding of neomycin-classaminoglycosides to the A site of 16S rRNA. Biochemistry 41, 7695−7706.(85) Haq, I., Chowdhry, B. Z., and Jenkins, T. C. (2001)Calorimetric techniques in the study of high-order DNA-druginteractions. Methods Enzymol. 340, 109−149.(86) Naghibi, H., Tamura, A., and Sturtevant, J. M. (1995) Significantdiscrepancies between van’t hoff and calorimetric enthalpies. Proc.Natl. Acad. Sci. U. S. A. 92, 5597−5599.
Biochemistry Article
dx.doi.org/10.1021/bi3004507 | Biochemistry 2012, 51, 5496−55055505

1
Supporting Information
Efficient Stabilization of Phosphodiester (PO), Phosphorothioate
(PS) and 2’-O-Methoxy (2’-OMe) DNA•RNA Hybrid Duplexes by
Aminosugars
I. Charles, Erik Davis, and Dev P. Arya*
Laboratory of Medicinal Chemistry, Department of Chemistry, Clemson University,
Clemson, South Carolina 29634
Contents.
1. Figure S1. UV melting profiles for rR•dY hybrid duplex with various
aminoglycosides at 260 nm in 60 mM Na+ ion concentration with rdup = 1.75,
where rdup = ratio of the drug/duplex. Conditions; 10 mM sodium cacodylate, 0.1
mM EDTA, pH 6.0. (pages 7,8)
2. Figure S2. UV thermal denaturation profiles for rR•S-dY hybrid duplex with
various aminoglycosides at 260 nm in 60 mM Na+ ion concentration with rdup =
1.75, where rdup = ratio of the drug/duplex. Conditions; 10 mM sodium
cacodylate, 0.1 mM EDTA, pH 6.0. (pages 9,10)
3. Figure S3. UV thermal denaturation profile for rR•2’OMe-rY hybrid duplex at
260 nm in the presence of 60 mM Na+ ion concentration. Conditions; 10 mM
sodium cacodylate, 0.1 mM EDTA, pH 6.0. (page 11)
4. Figure S4. FID titration of neomycin into rR•dY hybrid duplex [2 uM/duplex]
2
and TO [7 uM/duplex] at 10 °C. (A) Titration plot of fluorescence intensity versus
emission wavelength. (B) Titration plot of maximum emission fluorescence
versus addition concentration µM. (C) Sigmoidal curve fit for B using log([µM])
and normalized fluorescence values (Origin 5.0 software MicroCal, Inc.;
Northampton, MA). (D) Sigmoidal parameter values from C. Conditions; 60 mM
Na+ ion concentration, 10 mM sodium cacodylate, 0.1 mM EDTA, pH 6.0. (page
12)
5. Figure S5. FID titration of paromomycin into rR•dY hybrid duplex [2
uM/duplex] and TO [7 uM/duplex] at 10 °C. (A) Titration plot of fluorescence
intensity versus emission wavelength. (B) Titration plot of maximum emission
fluorescence versus addition concentration µM. (C) Sigmoidal curve fit for B
using log([µM]) and normalized fluorescence values (Origin 5.0 software
MicroCal, Inc.; Northampton, MA). (D) Sigmoidal parameter values from C.
Conditions; 60 mM Na+ ion concentration, 10 mM sodium cacodylate, 0.1 mM
EDTA, pH 6.0. (page 13)
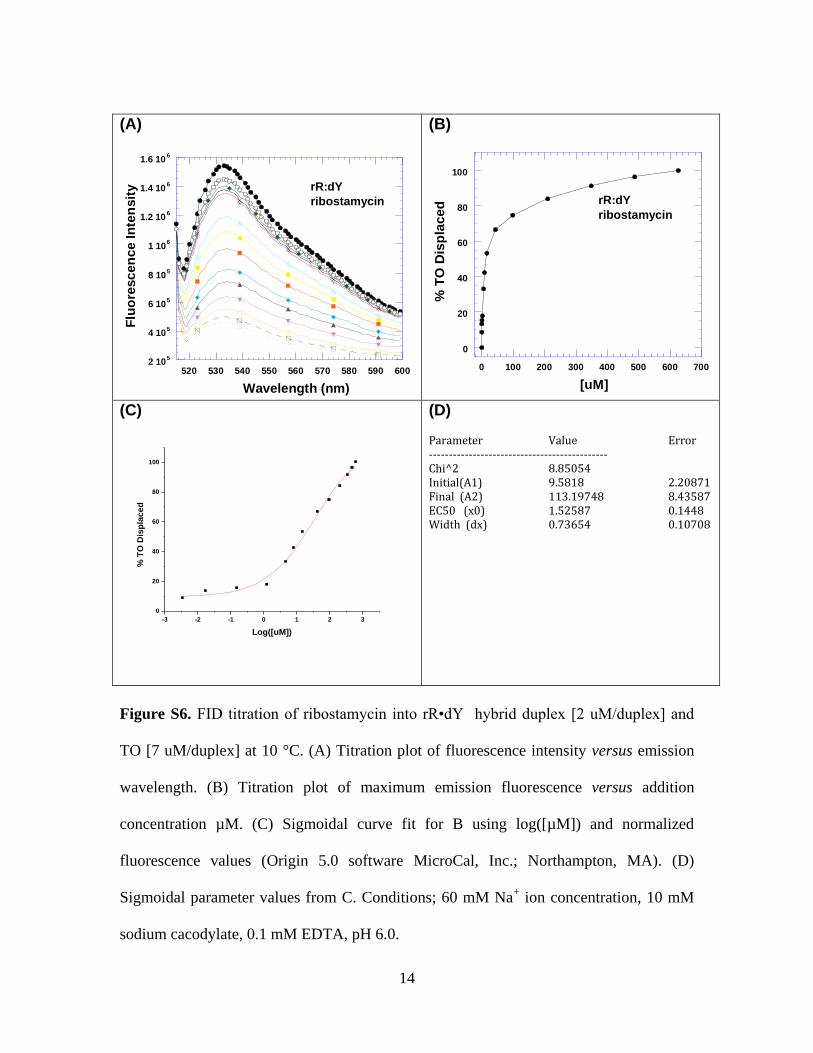
6. Figure S6. FID titration of ribostamycin into rR•dY hybrid duplex [2 uM/duplex]
and TO [7 uM/duplex] at 10 °C. (A) Titration plot of fluorescence intensity versus
emission wavelength. (B) Titration plot of maximum emission fluorescence
versus addition concentration µM. (C) Sigmoidal curve fit for B using log([µM])
and normalized fluorescence values (Origin 5.0 software MicroCal, Inc.;
Northampton, MA). (D) Sigmoidal parameter values from C. Conditions; 60 mM
Na+ ion concentration, 10 mM sodium cacodylate, 0.1 mM EDTA, pH 6.0. (page

3
14)
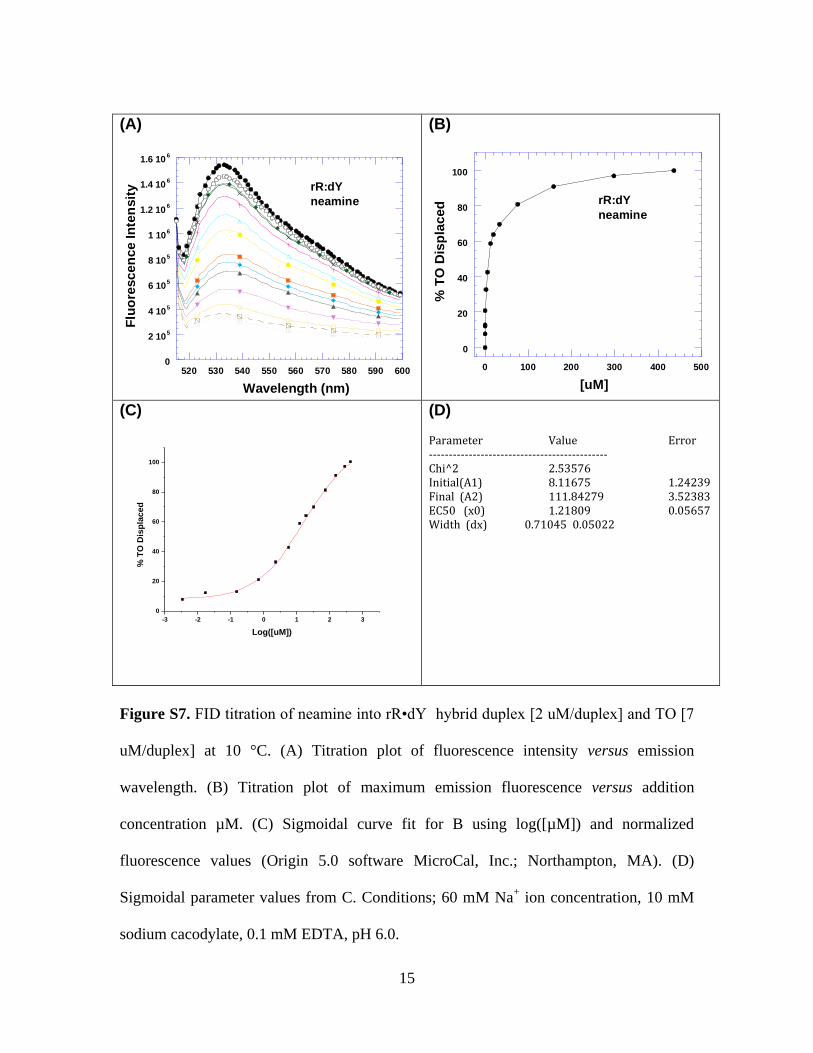
7. Figure S7. FID titration of neamine into rR•dY hybrid duplex [2 uM/duplex] and
TO [7 uM/duplex] at 10 °C. (A) Titration plot of fluorescence intensity versus
emission wavelength. (B) Titration plot of maximum emission fluorescence
versus addition concentration µM. (C) Sigmoidal curve fit for B using log([µM])
and normalized fluorescence values (Origin 5.0 software MicroCal, Inc.;
Northampton, MA). (D) Sigmoidal parameter values from C. Conditions; 60 mM
Na+ ion concentration, 10 mM sodium cacodylate, 0.1 mM EDTA, pH 6.0. (page
15)
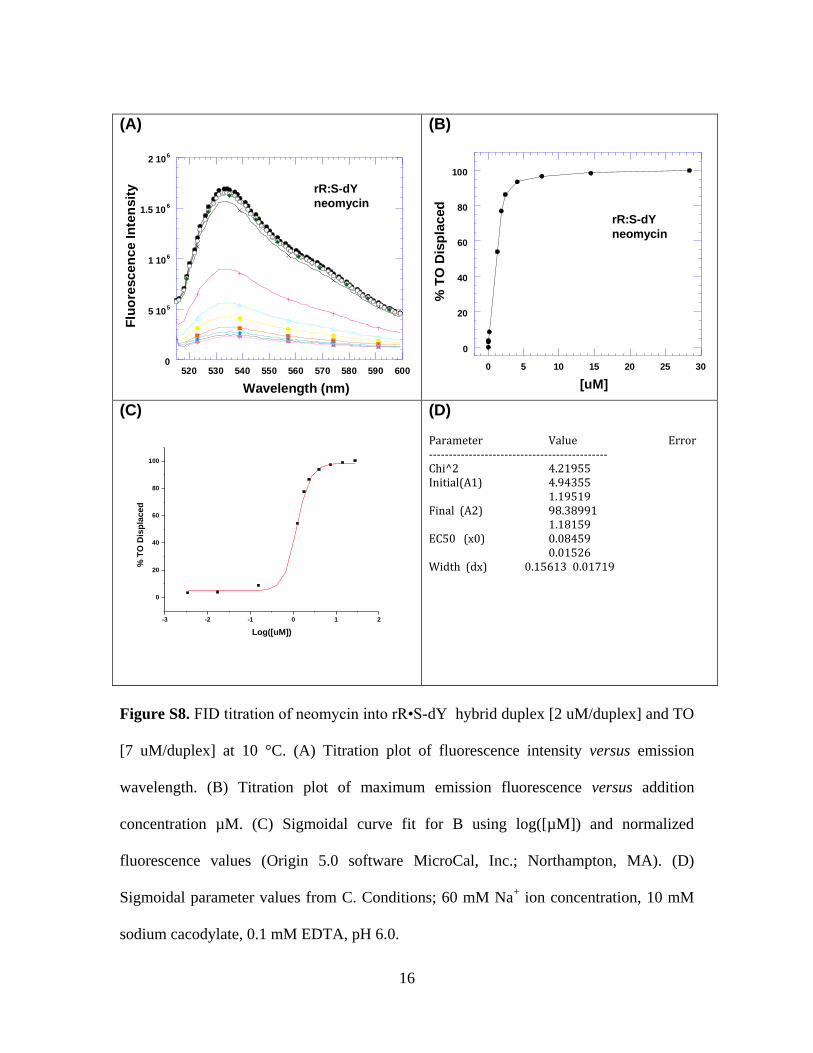
8. Figure S8. FID titration of neomycin into rR•S-dY hybrid duplex [2 uM/duplex]
and TO [7 uM/duplex] at 10 °C. (A) Titration plot of fluorescence intensity versus
emission wavelength. (B) Titration plot of maximum emission fluorescence
versus addition concentration µM. (C) Sigmoidal curve fit for B using log([µM])
and normalized fluorescence values (Origin 5.0 software MicroCal, Inc.;
Northampton, MA). (D) Sigmoidal parameter values from C. Conditions; 60 mM
Na+ ion concentration, 10 mM sodium cacodylate, 0.1 mM EDTA, pH 6.0. (page
16)
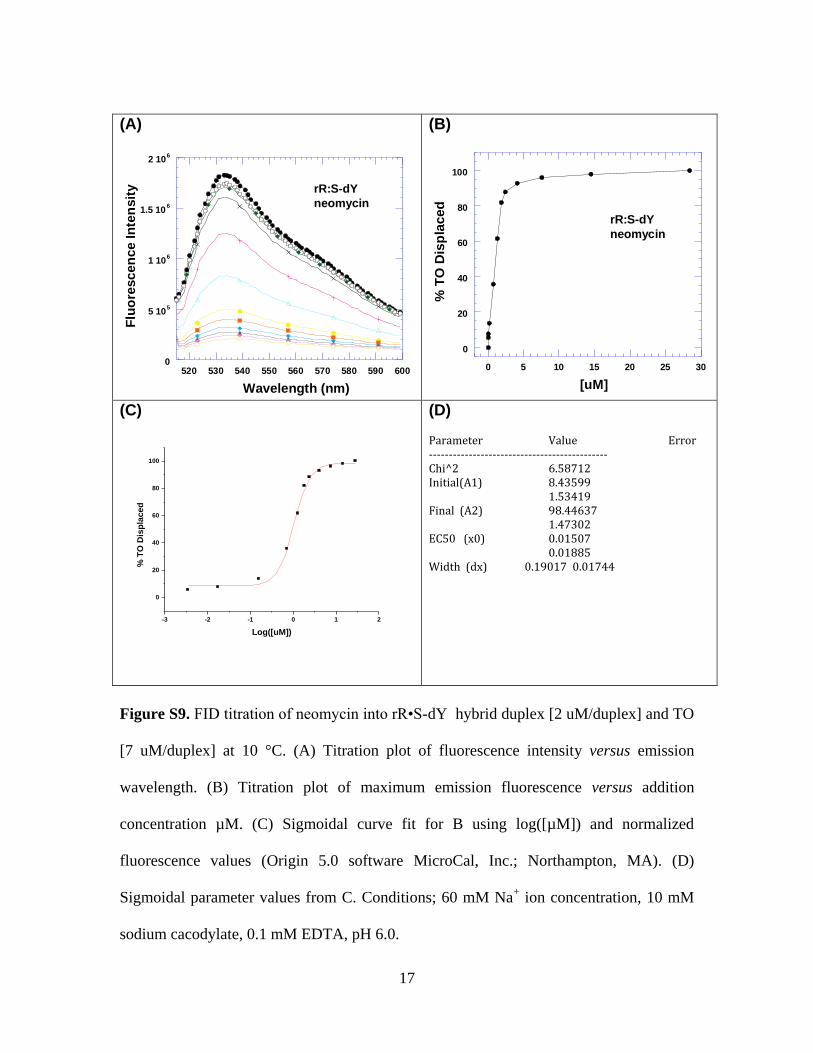
9. Figure S9. FID titration of neomycin into rR•S-dY hybrid duplex [2 uM/duplex]
and TO [7 uM/duplex] at 10 °C. (A) Titration plot of fluorescence intensity versus
emission wavelength. (B) Titration plot of maximum emission fluorescence
versus addition concentration µM. (C) Sigmoidal curve fit for B using log([µM])

4
and normalized fluorescence values (Origin 5.0 software MicroCal, Inc.;
Northampton, MA). (D) Sigmoidal parameter values from C. Conditions; 60 mM
Na+ ion concentration, 10 mM sodium cacodylate, 0.1 mM EDTA, pH 6.0. (page
17)
10. Figure S10. FID titration of paromomycin into rR•S-dY hybrid duplex [2
uM/duplex] and TO [7 uM/duplex] at 10 °C. (A) Titration plot of fluorescence
intensity versus emission wavelength. (B) Titration plot of maximum emission
fluorescence versus addition concentration µM. (C) Sigmoidal curve fit for B
using log([µM]) and normalized fluorescence values (Origin 5.0 software
MicroCal, Inc.; Northampton, MA). (D) Sigmoidal parameter values from C.
Conditions; 60 mM Na+ ion concentration, 10 mM sodium cacodylate, 0.1 mM
EDTA, pH 6.0. (page 18)
11. Figure S11. FID titration of ribostamycin into rR•S-dY hybrid duplex [2
uM/duplex] and TO [7 uM/duplex] at 10 °C. (A) Titration plot of fluorescence
intensity versus emission wavelength. (B) Titration plot of maximum emission
fluorescence versus addition concentration µM. (C) Sigmoidal curve fit for B
using log([µM]) and normalized fluorescence values (Origin 5.0 software
MicroCal, Inc.; Northampton, MA). (D) Sigmoidal parameter values from C.
Conditions; 60 mM Na+ ion concentration, 10 mM sodium cacodylate, 0.1 mM
EDTA, pH 6.0. (page 19)
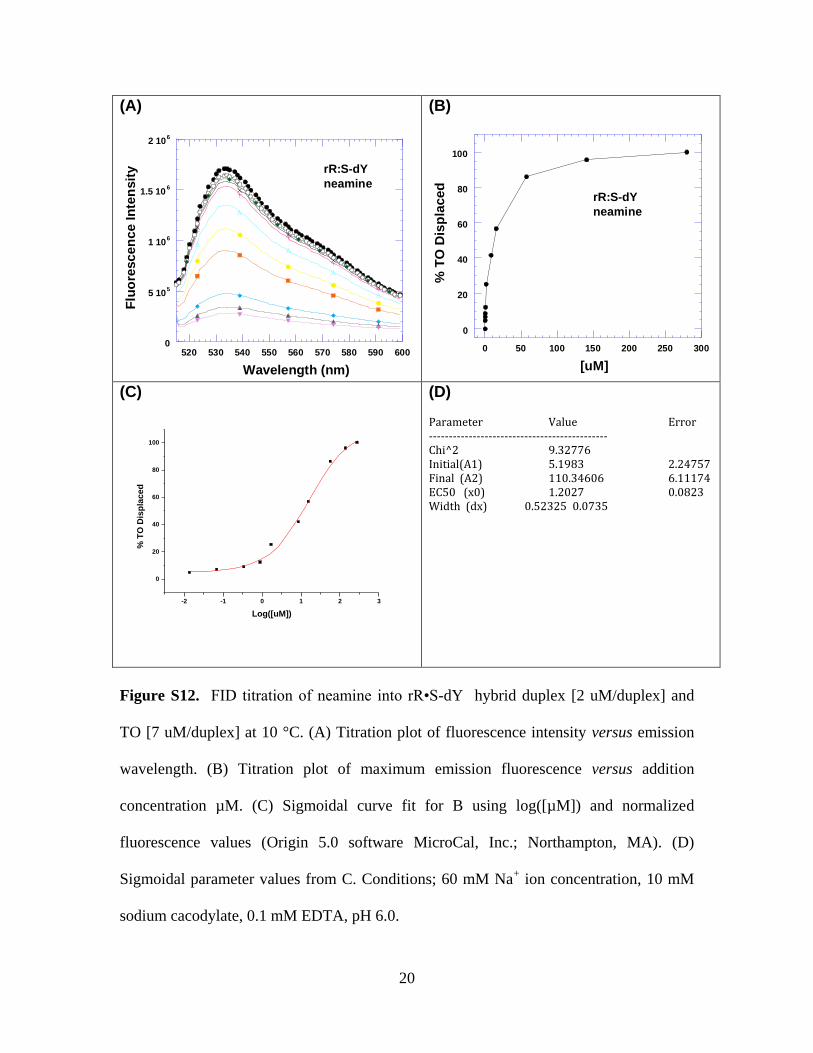
12. Figure S12. FID titration of neamine into rR•S-dY hybrid duplex [2 uM/duplex]
5
and TO [7 uM/duplex] at 10 °C. (A) Titration plot of fluorescence intensity versus
emission wavelength. (B) Titration plot of maximum emission fluorescence
versus addition concentration µM. (C) Sigmoidal curve fit for B using log([µM])
and normalized fluorescence values (Origin 5.0 software MicroCal, Inc.;
Northampton, MA). (D) Sigmoidal parameter values from C. Conditions; 60 mM
Na+ ion concentration, 10 mM sodium cacodylate, 0.1 mM EDTA, pH 6.0. (page
20)
13. Figure S13. FID titration of neomycin into rR•2’OMe-rY hybrid duplex [2
uM/duplex] and TO [7 uM/duplex] at 10 °C. (A) Titration plot of fluorescence
intensity versus emission wavelength. (B) Titration plot of maximum emission
fluorescence versus addition concentration µM. (C) Sigmoidal curve fit for B
using log([µM]) and normalized fluorescence values (Origin 5.0 software
MicroCal, Inc.; Northampton, MA). (D) Sigmoidal parameter values from C.
Conditions; 60 mM Na+ ion concentration, 10 mM sodium cacodylate, 0.1 mM
EDTA, pH 6.0. (page 21)
14. Figure S14. FID titration of paromomycin into rR•2’OMe-rY hybrid duplex [2
uM/duplex] and TO [7 uM/duplex] at 10 °C. (A) Titration plot of fluorescence
intensity versus emission wavelength. (B) Titration plot of maximum emission
fluorescence versus addition concentration µM. (C) Sigmoidal curve fit for B
using log([µM]) and normalized fluorescence values (Origin 5.0 software
MicroCal, Inc.; Northampton, MA). (D) Sigmoidal parameter values from C.
Conditions; 60 mM Na+ ion concentration, 10 mM sodium cacodylate, 0.1 mM

6
EDTA, pH 6.0. (page 22)
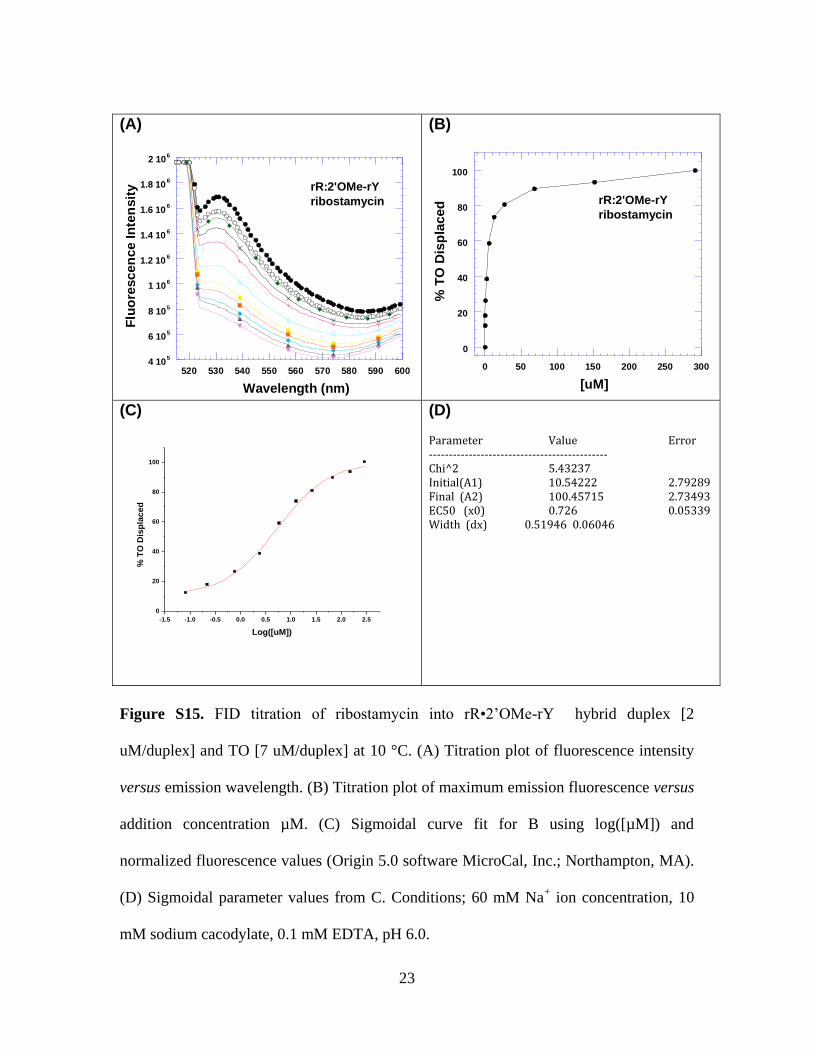
15. Figure S15. FID titration of ribostamycin into rR•2’OMe-rY hybrid duplex [2
uM/duplex] and TO [7 uM/duplex] at 10 °C. (A) Titration plot of fluorescence
intensity versus emission wavelength. (B) Titration plot of maximum emission
fluorescence versus addition concentration µM. (C) Sigmoidal curve fit for B
using log([µM]) and normalized fluorescence values (Origin 5.0 software
MicroCal, Inc.; Northampton, MA). (D) Sigmoidal parameter values from C.
Conditions; 60 mM Na+ ion concentration, 10 mM sodium cacodylate, 0.1 mM
EDTA, pH 6.0. (page 23)
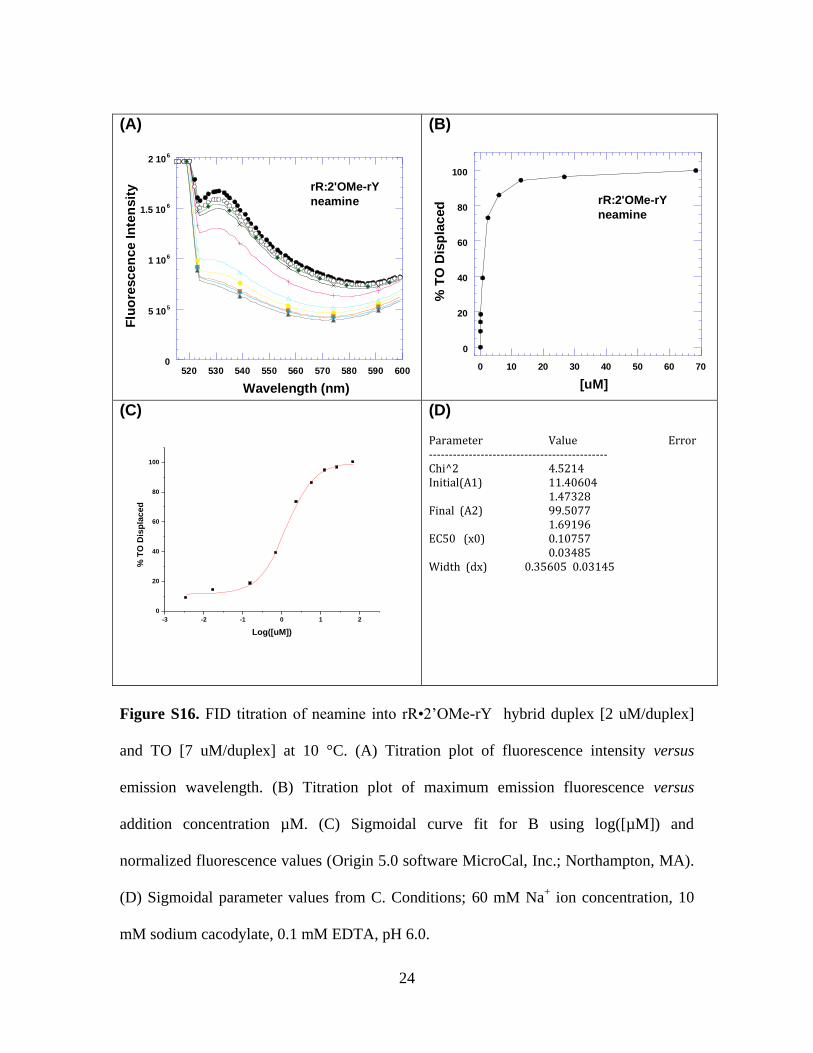
16. Figure S16. FID titration of neamine into rR•2’OMe-rY hybrid duplex [2
uM/duplex] and TO [7 uM/duplex] at 10 °C. (A) Titration plot of fluorescence
intensity versus emission wavelength. (B) Titration plot of maximum emission
fluorescence versus addition concentration µM. (C) Sigmoidal curve fit for B
using log([µM]) and normalized fluorescence values (Origin 5.0 software
MicroCal, Inc.; Northampton, MA). (D) Sigmoidal parameter values from C.
Conditions; 60 mM Na+ ion concentration, 10 mM sodium cacodylate, 0.1 mM
EDTA, pH 6.0. (page 24)
7
0.42
0.44
0.46
0.48
0.5
0.52
10 20 30 40 50 60 70 80 90
A26
0
T(C)
No Drug
(A)
0.44
0.46
0.48
0.5
0.52
0.54
10 20 30 40 50 60 70 80 90
A26
0
T(C)
Neomycin
(B)
0.44
0.46
0.48
0.5
0.52
0.54
10 20 30 40 50 60 70 80 90
A26
0
T(C)
Paromomycin
(C)
0.46
0.48
0.5
0.52
0.54
0.56
10 20 30 40 50 60 70 80 90
A26
0
T(C)
Lividomycin
(D)
0.46
0.47
0.48
0.49
0.5
0.51
0.52
0.53
0.54
10 20 30 40 50 60 70 80 90
A2
60
T(C)
Kanamycin
(E)
0.47
0.48
0.49
0.5
0.51
0.52
0.53
0.54
0.55
10 20 30 40 50 60 70 80 90
A26
0
T(C)
Gentamycin
(F)

8
0.44
0.46
0.48
0.5
0.52
0.54
10 20 30 40 50 60 70 80 90
A26
0
T(C)
Amikacin
(G)
0.44
0.46
0.48
0.5
0.52
0.54
10 20 30 40 50 60 70 80
A2
60
T(C)
Neamine
(H)
0.44
0.46
0.48
0.5
0.52
0.54
10 20 30 40 50 60 70 80
A2
60
T(C)
Ribostamycin
(I)
0.46
0.48
0.5
0.52
0.54
0.56
10 20 30 40 50 60 70 80 90
A2
60
T(C)
Streptomycin
(J)
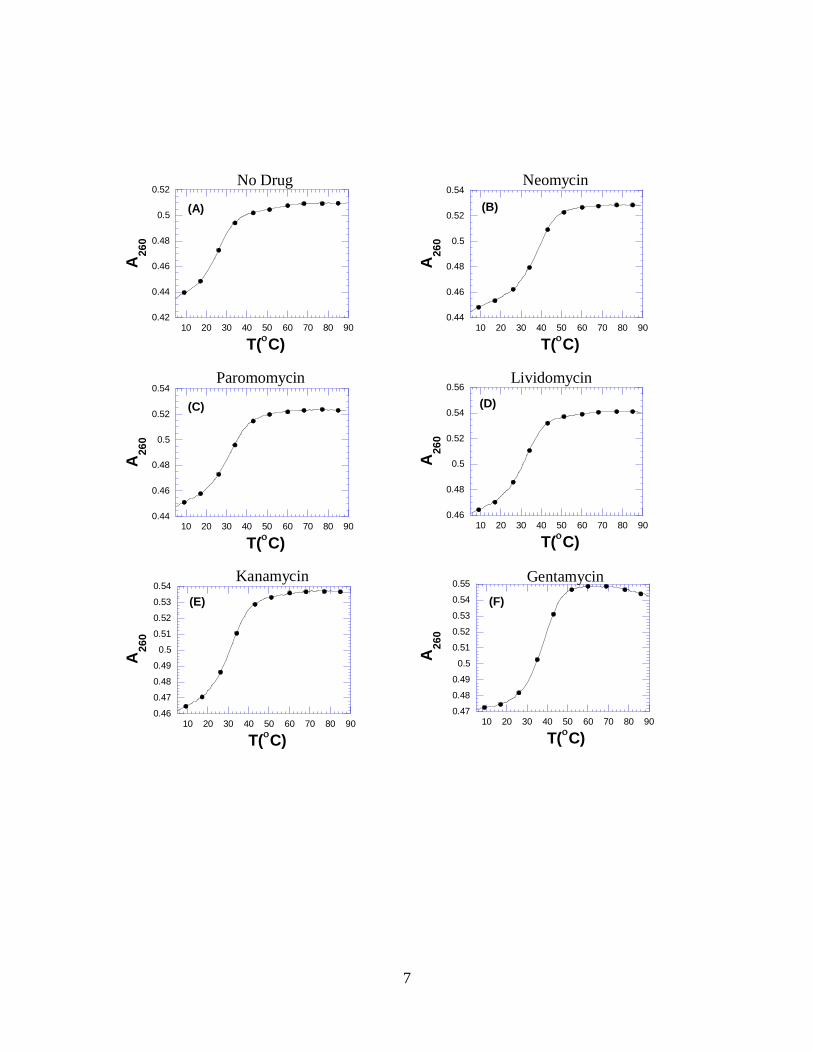
Figure S1. UV thermal denaturation profile of rR•dY hybrid duplex with no drug (A),
neomycin (B), paromomycin (C), lividomycin (D), kanamycin (E), gentamycin (F),
amikacin (G), neamine (H), ribostamycin (I) and streptomycin (J) at 260 nm in a 60mM
Na+ ion concentration with rdup = 1.75, where rdup = ratio of the drug/duplex. Buffer
conditions: 10 mM sodium cacodylate, 0.1 mM EDTA, pH 6.0. The melting rate was
0.2 C/min.

9
0.44
0.46
0.48
0.5
0.52
0.54
10 20 30 40 50 60 70 80 90
A26
0
T(C)
No Drug
(A)
0.4
0.42
0.44
0.46
0.48
0.5
10 20 30 40 50 60 70 80 90
A26
0
T(C)
Neomycin
(B)
0.44
0.46
0.48
0.5
0.52
0.54
10 20 30 40 50 60 70 80 90
A26
0
T(C)
Paromomycin
(C)
0.46
0.48
0.5
0.52
0.54
0.56
10 20 30 40 50 60 70 80 90
A26
0
T(C)
Lividomycin
(D)
0.46
0.48
0.5
0.52
0.54
0.56
10 20 30 40 50 60 70 80 90
A26
0
T(C)
Kanamycin
(E)
0.46
0.48
0.5
0.52
0.54
0.56
10 20 30 40 50 60 70 80 90
A26
0
T(C)
Gentamycin
(F)
0.46
0.48
0.5
0.52
0.54
0.56
10 20 30 40 50 60 70 80 90
A26
0
T(C)
Amikacin
(G)
0.44
0.46
0.48
0.5
0.52
0.54
10 20 30 40 50 60 70 80 90
A26
0
T(C)
Neamine
(H)
10
0.46
0.48
0.5
0.52
0.54
0.56
10 20 30 40 50 60 70 80 90
A26
0
T(C)
Ribostamycin
(I)
0.48
0.5
0.52
0.54
0.56
0.58
10 20 30 40 50 60 70 80 90
A26
0
T(C)
Streptomycin
(J)
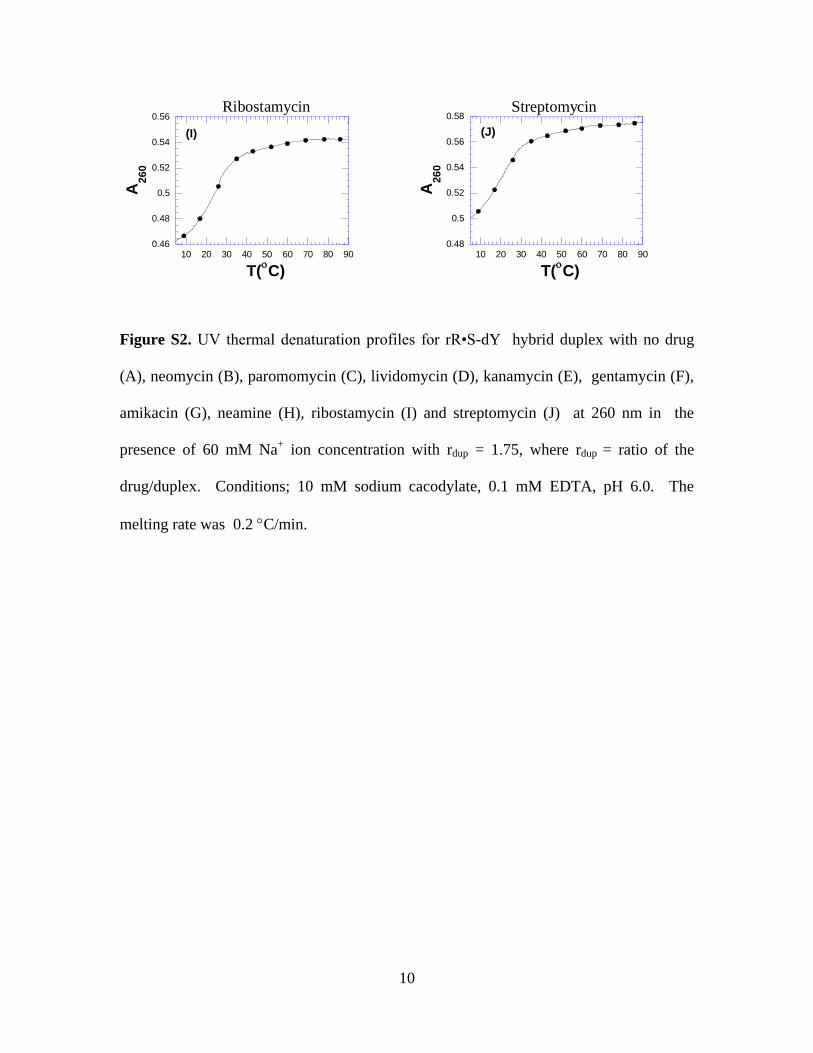
Figure S2. UV thermal denaturation profiles for rR•S-dY hybrid duplex with no drug
(A), neomycin (B), paromomycin (C), lividomycin (D), kanamycin (E), gentamycin (F),
amikacin (G), neamine (H), ribostamycin (I) and streptomycin (J) at 260 nm in the
presence of 60 mM Na+ ion concentration with rdup = 1.75, where rdup = ratio of the
drug/duplex. Conditions; 10 mM sodium cacodylate, 0.1 mM EDTA, pH 6.0. The
melting rate was 0.2 C/min.

11
0
0.2
0.4
0.6
0.8
1
10 20 30 40 50 60 70 80 90
A2
60
T (oC)
r R:2'OMe-rY
Tm 39
Figure S3. UV thermal denaturation profile for rR•2’OMe-rY hybrid duplex at 260 nm
in the presence of 60 mM Na+ ion concentration. Conditions; 10 mM sodium cacodylate,
0.1 mM EDTA, pH 6.0.
12
(A)
0
5 105
1 106
1.5 106
2 106
520 530 540 550 560 570 580 590 600
Flu
ore
scen
ce In
ten
sit
y
Wavelength (nm)
rR:dY
neomycin
(B)
0
20
40
60
80
100
0 5 10 15 20 25 30
% T
O D
isp
lace
d
[uM]
rR:dY
neomycin
(C)
-3 -2 -1 0 1 2
0
20
40
60
80
100
% T
O D
isp
lace
d
Log([uM])
(D) Parameter Value Error --------------------------------------------- Chi^2 1.61243 Initial(A1) 6.95789 0.83154 Final (A2) 101.18521 1.09896 EC50 (x0) -8.35644E-4 0.01532 Width (dx) 0.34162 0.01543
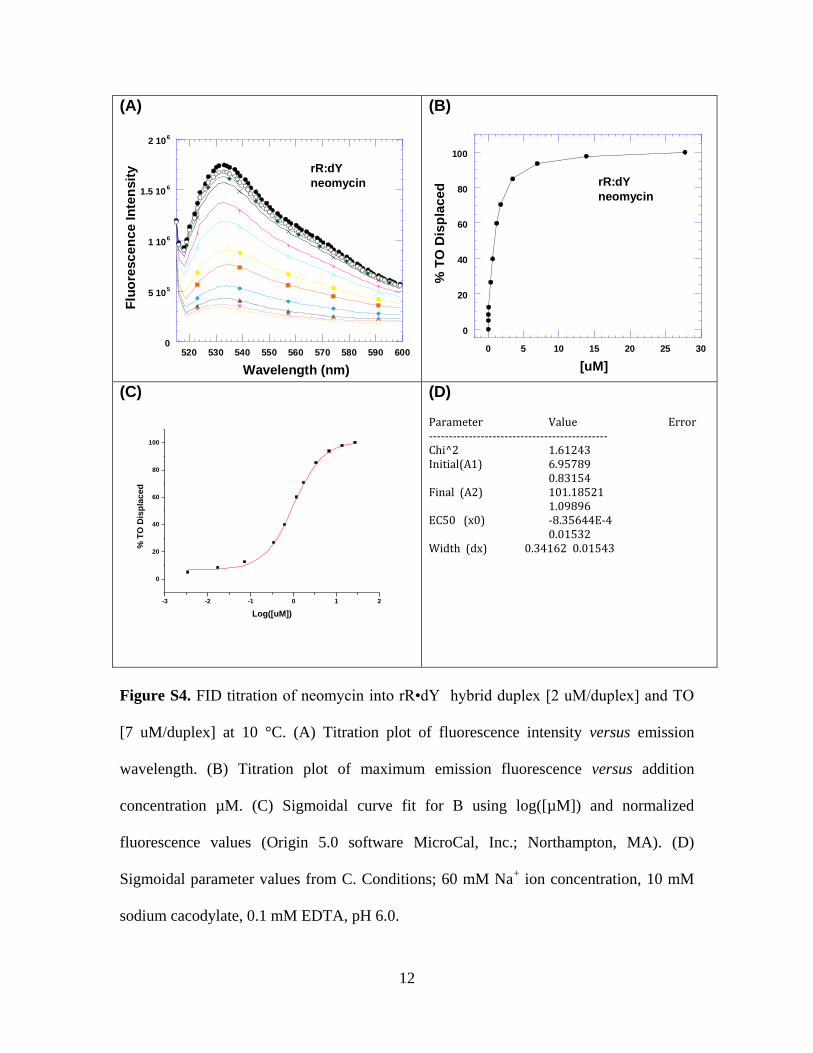
Figure S4. FID titration of neomycin into rR•dY hybrid duplex [2 uM/duplex] and TO
[7 uM/duplex] at 10 °C. (A) Titration plot of fluorescence intensity versus emission
wavelength. (B) Titration plot of maximum emission fluorescence versus addition
concentration µM. (C) Sigmoidal curve fit for B using log([µM]) and normalized
fluorescence values (Origin 5.0 software MicroCal, Inc.; Northampton, MA). (D)
Sigmoidal parameter values from C. Conditions; 60 mM Na+ ion concentration, 10 mM
sodium cacodylate, 0.1 mM EDTA, pH 6.0.

13
(A)
2 105
4 105
6 105
8 105
1 106
1.2 106
1.4 106
1.6 106
520 530 540 550 560 570 580 590 600
Flu
ore
scen
ce In
ten
sit
y
Wavelength (nm)
rR:dY
paromomycin
(B)
0
20
40
60
80
100
0 20 40 60 80 100 120 140 160
% T
O D
isp
lac
ed
[uM]
rR:dY
paromomycin
(C)
-3 -2 -1 0 1 2 3
0
20
40
60
80
100
% T
O D
isp
lace
d
Log([uM])
(D) Parameter Value Error --------------------------------------------- Chi^2 0.70022 Initial(A1) 7.56036 0.66185 Final (A2) 106.30927 1.31402 EC50 (x0) 0.62109 0.02065 Width (dx) 0.5951 0.01994
Figure S5. FID titration of paromomycin into rR•dY hybrid duplex [2 uM/duplex] and
TO [7 uM/duplex] at 10 °C. (A) Titration plot of fluorescence intensity versus emission
wavelength. (B) Titration plot of maximum emission fluorescence versus addition
concentration µM. (C) Sigmoidal curve fit for B using log([µM]) and normalized
fluorescence values (Origin 5.0 software MicroCal, Inc.; Northampton, MA). (D)
Sigmoidal parameter values from C. Conditions; 60 mM Na+ ion concentration, 10 mM
sodium cacodylate, 0.1 mM EDTA, pH 6.0.
14
(A)
2 105
4 105
6 105
8 105
1 106
1.2 106
1.4 106
1.6 106
520 530 540 550 560 570 580 590 600
Flu
ore
scen
ce In
ten
sit
y
Wavelength (nm)
rR:dY
ribostamycin
(B)
0
20
40
60
80
100
0 100 200 300 400 500 600 700
% T
O D
isp
lac
ed
[uM]
rR:dY
ribostamycin
(C)
-3 -2 -1 0 1 2 3
0
20
40
60
80
100
% T
O D
isp
lac
ed
Log([uM])
(D) Parameter Value Error --------------------------------------------- Chi^2 8.85054 Initial(A1) 9.5818 2.20871 Final (A2) 113.19748 8.43587 EC50 (x0) 1.52587 0.1448 Width (dx) 0.73654 0.10708
Figure S6. FID titration of ribostamycin into rR•dY hybrid duplex [2 uM/duplex] and
TO [7 uM/duplex] at 10 °C. (A) Titration plot of fluorescence intensity versus emission
wavelength. (B) Titration plot of maximum emission fluorescence versus addition
concentration µM. (C) Sigmoidal curve fit for B using log([µM]) and normalized
fluorescence values (Origin 5.0 software MicroCal, Inc.; Northampton, MA). (D)
Sigmoidal parameter values from C. Conditions; 60 mM Na+ ion concentration, 10 mM
sodium cacodylate, 0.1 mM EDTA, pH 6.0.
15
(A)
0
2 105
4 105
6 105
8 105
1 106
1.2 106
1.4 106
1.6 106
520 530 540 550 560 570 580 590 600
Flu
ore
scen
ce In
ten
sit
y
Wavelength (nm)
rR:dY
neamine
(B)
0
20
40
60
80
100
0 100 200 300 400 500
% T
O D
isp
lac
ed
[uM]
rR:dY
neamine
(C)
-3 -2 -1 0 1 2 3
0
20
40
60
80
100
% T
O D
isp
lac
ed
Log([uM])
(D) Parameter Value Error --------------------------------------------- Chi^2 2.53576 Initial(A1) 8.11675 1.24239 Final (A2) 111.84279 3.52383 EC50 (x0) 1.21809 0.05657 Width (dx) 0.71045 0.05022
Figure S7. FID titration of neamine into rR•dY hybrid duplex [2 uM/duplex] and TO [7
uM/duplex] at 10 °C. (A) Titration plot of fluorescence intensity versus emission
wavelength. (B) Titration plot of maximum emission fluorescence versus addition
concentration µM. (C) Sigmoidal curve fit for B using log([µM]) and normalized
fluorescence values (Origin 5.0 software MicroCal, Inc.; Northampton, MA). (D)
Sigmoidal parameter values from C. Conditions; 60 mM Na+ ion concentration, 10 mM
sodium cacodylate, 0.1 mM EDTA, pH 6.0.
16
(A)
0
5 105
1 106
1.5 106
2 106
520 530 540 550 560 570 580 590 600
Flu
ore
scen
ce In
ten
sit
y
Wavelength (nm)
rR:S-dY
neomycin
(B)
0
20
40
60
80
100
0 5 10 15 20 25 30
% T
O D
isp
laced
[uM]
rR:S-dY
neomycin
(C)
-3 -2 -1 0 1 2
0
20
40
60
80
100
% T
O D
isp
lace
d
Log([uM])
(D) Parameter Value Error --------------------------------------------- Chi^2 4.21955 Initial(A1) 4.94355 1.19519 Final (A2) 98.38991 1.18159 EC50 (x0) 0.08459 0.01526 Width (dx) 0.15613 0.01719
Figure S8. FID titration of neomycin into rR•S-dY hybrid duplex [2 uM/duplex] and TO
[7 uM/duplex] at 10 °C. (A) Titration plot of fluorescence intensity versus emission
wavelength. (B) Titration plot of maximum emission fluorescence versus addition
concentration µM. (C) Sigmoidal curve fit for B using log([µM]) and normalized
fluorescence values (Origin 5.0 software MicroCal, Inc.; Northampton, MA). (D)
Sigmoidal parameter values from C. Conditions; 60 mM Na+ ion concentration, 10 mM
sodium cacodylate, 0.1 mM EDTA, pH 6.0.
17
(A)
0
5 105
1 106
1.5 106
2 106
520 530 540 550 560 570 580 590 600
Flu
ore
scen
ce In
ten
sit
y
Wavelength (nm)
rR:S-dY
neomycin
(B)
0
20
40
60
80
100
0 5 10 15 20 25 30
% T
O D
isp
laced
[uM]
rR:S-dY
neomycin
(C)
-3 -2 -1 0 1 2
0
20
40
60
80
100
% T
O D
isp
lace
d
Log([uM])
(D) Parameter Value Error --------------------------------------------- Chi^2 6.58712 Initial(A1) 8.43599 1.53419 Final (A2) 98.44637 1.47302 EC50 (x0) 0.01507 0.01885 Width (dx) 0.19017 0.01744
Figure S9. FID titration of neomycin into rR•S-dY hybrid duplex [2 uM/duplex] and TO
[7 uM/duplex] at 10 °C. (A) Titration plot of fluorescence intensity versus emission
wavelength. (B) Titration plot of maximum emission fluorescence versus addition
concentration µM. (C) Sigmoidal curve fit for B using log([µM]) and normalized
fluorescence values (Origin 5.0 software MicroCal, Inc.; Northampton, MA). (D)
Sigmoidal parameter values from C. Conditions; 60 mM Na+ ion concentration, 10 mM
sodium cacodylate, 0.1 mM EDTA, pH 6.0.

18
(A)
0
5 105
1 106
1.5 106
2 106
520 530 540 550 560 570 580 590 600
Flu
ore
scen
ce In
ten
sit
y
Wavelength (nm)
rR:S-dY
paromomycin
(B)
0
20
40
60
80
100
0 10 20 30 40 50 60
% T
O D
isp
laced
[uM]
rR:S-dY
paromomycin
(C)
-2.0 -1.5 -1.0 -0.5 0.0 0.5 1.0 1.5 2.0
0
20
40
60
80
100
% T
O D
isp
lac
ed
Log([uM])
(D) Parameter Value Error --------------------------------------------- Chi^2 7.65699 Initial(A1) 8.00736 1.85447 Final (A2) 105.26967 3.50223 EC50 (x0) 0.63668 0.03911 Width (dx) 0.34488 0.03857
Figure S10. FID titration of paromomycin into rR•S-dY hybrid duplex [2 uM/duplex]
and TO [7 uM/duplex] at 10 °C. (A) Titration plot of fluorescence intensity versus
emission wavelength. (B) Titration plot of maximum emission fluorescence versus
addition concentration µM. (C) Sigmoidal curve fit for B using log([µM]) and
normalized fluorescence values (Origin 5.0 software MicroCal, Inc.; Northampton, MA).
(D) Sigmoidal parameter values from C. Conditions; 60 mM Na+ ion concentration, 10
mM sodium cacodylate, 0.1 mM EDTA, pH 6.0.

19
(A)
0
5 105
1 106
1.5 106
2 106
520 530 540 550 560 570 580 590 600
Flu
ore
scen
ce In
ten
sit
y
Wavelength (nm)
rR:S-dY
ribostamycin
(B)
0
20
40
60
80
100
0 200 400 600 800 1000
% T
O D
isp
laced
[uM]
rR:S-dY
ribostamycin
(C)
-2 -1 0 1 2 3
0
20
40
60
80
100
% T
O D
isp
lac
ed
Log([uM])
(D) Parameter Value Error --------------------------------------------- Chi^2 8.79028 Initial(A1) 3.4415 2.44452 Final (A2) 126.53017 12.27785 EC50 (x0) 1.92564 0.16741 Width (dx) 0.75983 0.11092
Figure S11. FID titration of ribostamycin into rR•S-dY hybrid duplex [2 uM/duplex]
and TO [7 uM/duplex] at 10 °C. (A) Titration plot of fluorescence intensity versus
emission wavelength. (B) Titration plot of maximum emission fluorescence versus
addition concentration µM. (C) Sigmoidal curve fit for B using log([µM]) and
normalized fluorescence values (Origin 5.0 software MicroCal, Inc.; Northampton, MA).
(D) Sigmoidal parameter values from C. Conditions; 60 mM Na+ ion concentration, 10
mM sodium cacodylate, 0.1 mM EDTA, pH 6.0.
20
(A)
0
5 105
1 106
1.5 106
2 106
520 530 540 550 560 570 580 590 600
Flu
ore
scen
ce In
ten
sit
y
Wavelength (nm)
rR:S-dY
neamine
(B)
0
20
40
60
80
100
0 50 100 150 200 250 300
% T
O D
isp
laced
[uM]
rR:S-dY
neamine
(C)
-2 -1 0 1 2 3
0
20
40
60
80
100
% T
O D
isp
lace
d
Log([uM])
(D) Parameter Value Error --------------------------------------------- Chi^2 9.32776 Initial(A1) 5.1983 2.24757 Final (A2) 110.34606 6.11174 EC50 (x0) 1.2027 0.0823 Width (dx) 0.52325 0.0735
Figure S12. FID titration of neamine into rR•S-dY hybrid duplex [2 uM/duplex] and
TO [7 uM/duplex] at 10 °C. (A) Titration plot of fluorescence intensity versus emission
wavelength. (B) Titration plot of maximum emission fluorescence versus addition
concentration µM. (C) Sigmoidal curve fit for B using log([µM]) and normalized
fluorescence values (Origin 5.0 software MicroCal, Inc.; Northampton, MA). (D)
Sigmoidal parameter values from C. Conditions; 60 mM Na+ ion concentration, 10 mM
sodium cacodylate, 0.1 mM EDTA, pH 6.0.

21
(A)
0
5 105
1 106
1.5 106
2 106
520 530 540 550 560 570 580 590 600
Flu
ore
scen
ce In
ten
sit
y
Wavelength (nm)
rR:2'OMe-rY
neomycin
(B)
0
20
40
60
80
100
0 5 10 15 20 25
% T
O D
isp
laced
[uM]
rR:2'OMe-rY
neomycin
(C)
-3.0 -2.5 -2.0 -1.5 -1.0 -0.5 0.0 0.5 1.0 1.5
0
20
40
60
80
100
% T
O D
isp
lac
ed
Log([uM])
(D) Parameter Value Error --------------------------------------------- Chi^2 7.30244 Initial(A1) 13.90374 1.97995 Final (A2) 100.51152 1.83206 EC50 (x0) -0.35959 0.03524 Width (dx) 0.2939 0.02945
Figure S13. FID titration of neomycin into rR•2’OMe-rY hybrid duplex [2 uM/duplex]
and TO [7 uM/duplex] at 10 °C. (A) Titration plot of fluorescence intensity versus
emission wavelength. (B) Titration plot of maximum emission fluorescence versus
addition concentration µM. (C) Sigmoidal curve fit for B using log([µM]) and
normalized fluorescence values (Origin 5.0 software MicroCal, Inc.; Northampton, MA).
(D) Sigmoidal parameter values from C. Conditions; 60 mM Na+ ion concentration, 10
mM sodium cacodylate, 0.1 mM EDTA, pH 6.0.

22
(A)
0
5 105
1 106
1.5 106
2 106
520 530 540 550 560 570 580 590 600
Flu
ore
scen
ce In
ten
sit
y
Wavelength (nm)
rR:2'OMe-rY
paromomycin
(B)
0
20
40
60
80
100
0 10 20 30 40 50 60 70
% T
O D
isp
laced
[uM]
rR:2'OMe-rY
paromomycin
(C)
-2.0 -1.5 -1.0 -0.5 0.0 0.5 1.0 1.5 2.0
0
20
40
60
80
100
% T
O D
isp
lac
ed
Log([uM])
(D)
Parameter Value Error --------------------------------------------- Chi^2 4.48765 Initial(A1) 11.90523 2.43091 Final (A2) 101.9094 2.14548 EC50 (x0) -0.0795 0.04583 Width (dx) 0.49775 0.04888
Figure S14. FID titration of paromomycin into rR•2’OMe-rY hybrid duplex [2
uM/duplex] and TO [7 uM/duplex] at 10 °C. (A) Titration plot of fluorescence intensity
versus emission wavelength. (B) Titration plot of maximum emission fluorescence versus
addition concentration µM. (C) Sigmoidal curve fit for B using log([µM]) and
normalized fluorescence values (Origin 5.0 software MicroCal, Inc.; Northampton, MA).
(D) Sigmoidal parameter values from C. Conditions; 60 mM Na+ ion concentration, 10
mM sodium cacodylate, 0.1 mM EDTA, pH 6.0.
23
(A)
4 105
6 105
8 105
1 106
1.2 106
1.4 106
1.6 106
1.8 106
2 106
520 530 540 550 560 570 580 590 600
Flu
ore
scen
ce In
ten
sit
y
Wavelength (nm)
rR:2'OMe-rY
ribostamycin
(B)
0
20
40
60
80
100
0 50 100 150 200 250 300
% T
O D
isp
laced
[uM]
rR:2'OMe-rY
ribostamycin
(C)
-1.5 -1.0 -0.5 0.0 0.5 1.0 1.5 2.0 2.5
0
20
40
60
80
100
% T
O D
isp
lac
ed
Log([uM])
(D) Parameter Value Error --------------------------------------------- Chi^2 5.43237 Initial(A1) 10.54222 2.79289 Final (A2) 100.45715 2.73493 EC50 (x0) 0.726 0.05339 Width (dx) 0.51946 0.06046
Figure S15. FID titration of ribostamycin into rR•2’OMe-rY hybrid duplex [2
uM/duplex] and TO [7 uM/duplex] at 10 °C. (A) Titration plot of fluorescence intensity
versus emission wavelength. (B) Titration plot of maximum emission fluorescence versus
addition concentration µM. (C) Sigmoidal curve fit for B using log([µM]) and
normalized fluorescence values (Origin 5.0 software MicroCal, Inc.; Northampton, MA).
(D) Sigmoidal parameter values from C. Conditions; 60 mM Na+ ion concentration, 10
mM sodium cacodylate, 0.1 mM EDTA, pH 6.0.
24
(A)
0
5 105
1 106
1.5 106
2 106
520 530 540 550 560 570 580 590 600
Flu
ore
scen
ce In
ten
sit
y
Wavelength (nm)
rR:2'OMe-rY
neamine
(B)
0
20
40
60
80
100
0 10 20 30 40 50 60 70
% T
O D
isp
laced
[uM]
rR:2'OMe-rY
neamine
(C)
-3 -2 -1 0 1 2
0
20
40
60
80
100
% T
O D
isp
lac
ed
Log([uM])
(D) Parameter Value Error --------------------------------------------- Chi^2 4.5214 Initial(A1) 11.40604 1.47328 Final (A2) 99.5077 1.69196 EC50 (x0) 0.10757 0.03485 Width (dx) 0.35605 0.03145
Figure S16. FID titration of neamine into rR•2’OMe-rY hybrid duplex [2 uM/duplex]
and TO [7 uM/duplex] at 10 °C. (A) Titration plot of fluorescence intensity versus
emission wavelength. (B) Titration plot of maximum emission fluorescence versus
addition concentration µM. (C) Sigmoidal curve fit for B using log([µM]) and
normalized fluorescence values (Origin 5.0 software MicroCal, Inc.; Northampton, MA).
(D) Sigmoidal parameter values from C. Conditions; 60 mM Na+ ion concentration, 10
mM sodium cacodylate, 0.1 mM EDTA, pH 6.0.

25