eight county freight plan meeting - eciatrans
TRANSCRIPT

Eight County Freight PlanEast Central Intergovernmental Association & Blackhawk Hills Regional Council
CPCS Team
March 27, 2017
Dubuque, IA
2
Project Objective
To develop a better understanding of the multimodal freight system in the bi-state
region and to use this information to better inform policy and programming decisions.

3
Work Plan Overview
1 2 3 4 5 6 7 8 9 10 11 12 13 14
Project Inception
Task 0.1 - Kick-Off Meeting
Task 0.2 - Literature Review and Initial Data Collection
Task 0.3 - Project Management & revise Work Plan, as needed
Task 1 - Data Collection and Inventory
Task 1.1 - Physical Profile
Task 1.2 - Operational Profile
Task 1.3 - Stakeholder Consultations & 6 Council Meetings
Task 2 - Needs Assessment and Analysis
Task 2.1 - Freight System Performance Measures
Task 2.2 - Existing and Future Commodity Flow Assessment
Task 2.3 - Freight Modal Profiles and Needs Assessment Report
Task 3 - Study Recommendations
Task 3.1 - Freight System Infrastructure Projects
Task 3.2 - Project Evaluation and Prioritization
Task 3.3 - Supporting Freight System Strategies
Task 4 - Reporting
Task 4.1 - Draft Final Report
Task 4.2 - Final Report
Legend
Major Task Duration Work Activity Meeting
Months
We are here

4
Presentation Map
Freight System Inventory
Eight County Local Economy
Visioning
Stakeholder Perspectives
Questions & Discussion

• What is the socio-economic make-up of the Eight County Region?
• What are freight-related industries?
• What portion of businesses in the Eight County Region are freight-related?
• What are the key industries in the Eight County Region?
What drives the Eight County Economy?
5

• Population– 26,400 (8%) drop from 1970 to 2015
• Education– Over half the population with some college/associates
or higher
Regional Population and Education
290,000
300,000
310,000
320,000
330,000
340,000
350,000
360,000
1970 1980 1990 2000 2010 2015 est
Eight County Population
Eight County Population
No HS Degree,
10%
HS Degree, 36%
Some College, or Associates, 34%
Bachelors or higher,
20%
2015 Level of Education (18+)
Source: CPCS Analysis of 2015 American Community Survey Data, US Census Bureau
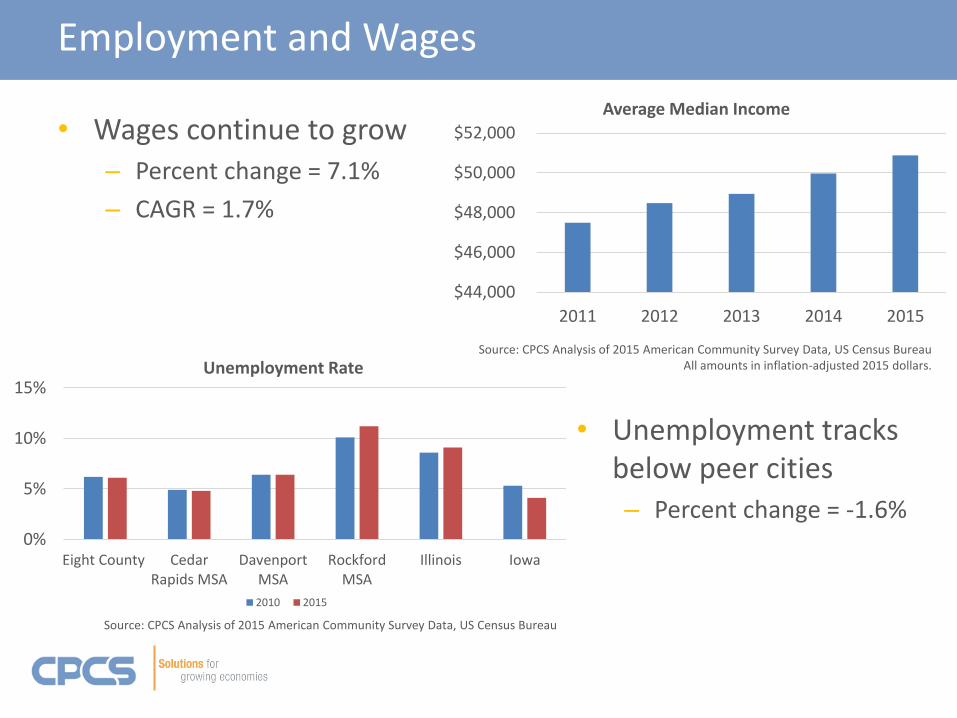
• Wages continue to grow– Percent change = 7.1%
– CAGR = 1.7%
Employment and Wages
$44,000
$46,000
$48,000
$50,000
$52,000
2011 2012 2013 2014 2015
Average Median Income
Source: CPCS Analysis of 2015 American Community Survey Data, US Census BureauAll amounts in inflation-adjusted 2015 dollars.
0%
5%
10%
15%
Eight County CedarRapids MSA
DavenportMSA
RockfordMSA
Illinois Iowa
Unemployment Rate
2010 2015
• Unemployment tracks below peer cities– Percent change = -1.6%
Source: CPCS Analysis of 2015 American Community Survey Data, US Census Bureau
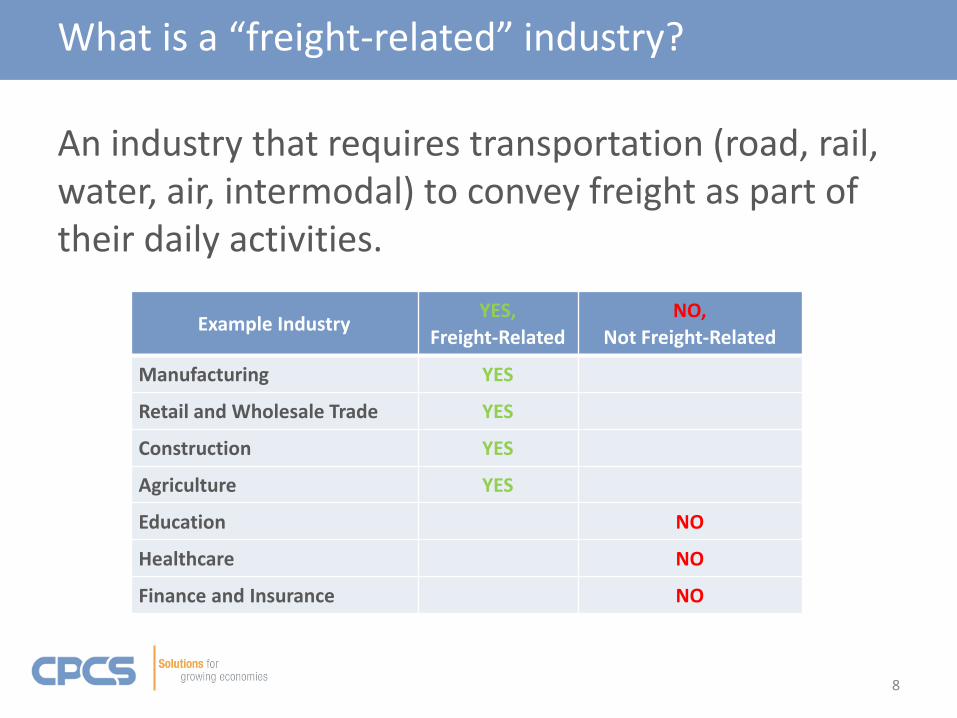
An industry that requires transportation (road, rail, water, air, intermodal) to convey freight as part of their daily activities.
8
What is a “freight-related” industry?
Example IndustryYES,
Freight-Related
NO,
Not Freight-Related
Manufacturing YES
Retail and Wholesale Trade YES
Construction YES
Agriculture YES
Education NO
Healthcare NO
Finance and Insurance NO
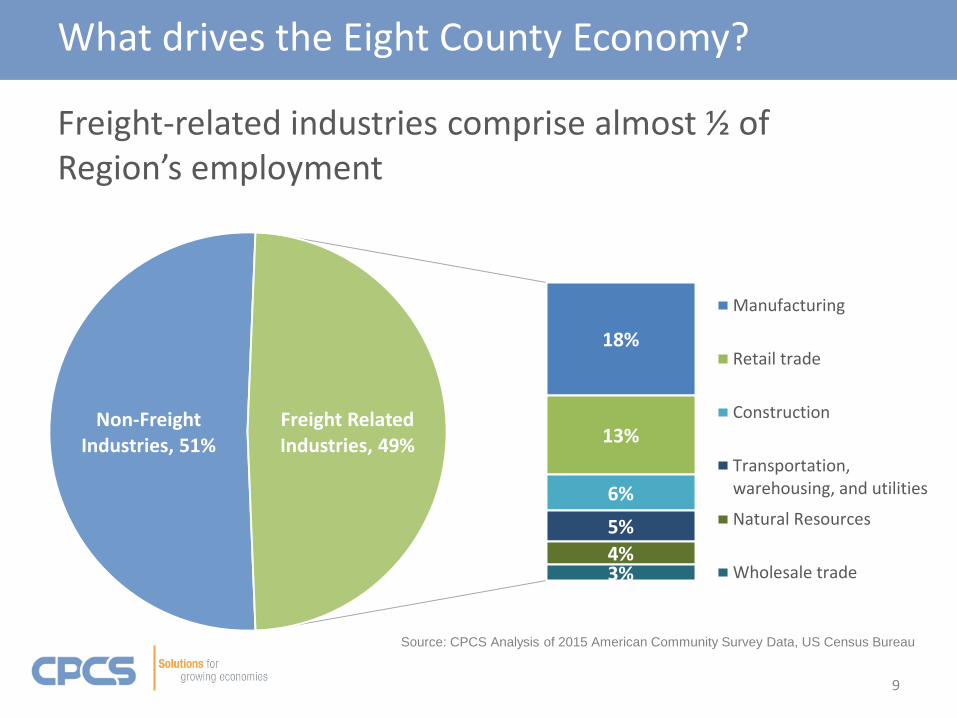
Freight-related industries comprise almost ½ of Region’s employment
What drives the Eight County Economy?
18%
13%
6%
5%
4%3%
Non-Freight Industries, 51%
Freight Related Industries, 49%
Manufacturing
Retail trade
Construction
Transportation,warehousing, and utilities
Natural Resources
Wholesale trade
Source: CPCS Analysis of 2015 American Community Survey Data, US Census Bureau
9

Freight-Related Employment Concentration
10Source: CPCS Analysis of ReferenceUSA, 2016

NAICSFirms with
20-49 Employees
Firms with
50-99
Employees
Firms with 100+
Employees
(11) Agriculture, Forestry, Fishing, and Hunting 3 2 1
(21) Mining, Quarrying, Oil and Gas Extraction 5 2 2
(22) Utilities 5 0 5
(23) Construction 87 12 24
(31-33) Manufacturing 144 49 92
(42) Wholesale Trade 69 24 117
(44-45) Retail Trade 191 44 52
(48-49) Transportation and Warehousing 81 16 10
Freight-Related Employment
Source: CPCS Analysis of ReferenceUSA, 2016
11

What the Region does Better (Location Quotient)
Industry
Car
roll
Clin
ton
De
law
are
Du
bu
qu
e
Jack
son
Jo D
avie
ss
Ste
ph
en
son
Wh
ite
sid
e
(11) Agriculture ND ND 1.58 ND 1.97 ND 2.66 ND
(21) Mining, Quarrying, Oil and Gas Extraction
ND ND NC ND NC ND NC ND
(22) Utilities ND 1.11 ND 0.66 ND ND ND 0.33
(23) Construction 0.9 0.9 1.25 0.86 0.97 1.3 1.36 0.6
(31-33) Manufacturing 2.13 2.28 3.18 1.68 1.65 1.6 2.3 2.02
(42) Wholesale trade 2.15 0.5 1.9 1.16 1.33 ND 0.67 0.96
(44-45) Retail trade 1.24 0.98 0.95 0.98 1.35 1.14 0.89 1.16
(48-49) Transportation, Warehousing
ND ND ND 2.07 1.17 ND 1.06 ND
Source: CPCS Analysis of Bureau of Labor Statistics, 2015ND indicates that a quotient is not disclosable, and NC indicates quotients that could not be calculated.
12

Open Discussion
– Do you agree with our assessment of what drives the Eight County Region’s economy?
– What might be missing from this picture?
13

14
Presentation Map
Freight System Inventory
Eight County Local Economy
Visioning
Stakeholder Perspectives
Questions & Discussion

Freight Industry Use of the Transportation System
<---- Higher Lower--->
Air Cargo TruckRail
IntermodalRail Unit Rail Carload Water
<---- Faster Slower--->
<---- More Reliable Less Reliable--->
<---- More Visible Less Visible--->
<---- More Expensive Less Expensive--->
<---- Low Weight High Weight--->
<---- Higher Value Lower Value--->
<---- More Time-Sensitive Less Time-Sensitive--->
Source: CPCS adapted from Freight Transportation Service Spectrum, Hofstra University
The mode a business uses depends on a number of factors… but usually the most important is price and mode availability
Service Characteristics
Cargo Characteristics
15

Examples
Freight Industry Use of the Transportation System
AgricultureFavors lowest transportation cost, less time sensitive
ConstructionFavors lowest transportation cost, truck often last mile
ManufacturingFavors transit time, level of service

Freight Tonnage and Value in the Eight Counties
Truck-49.3million (73%)
Rail- 15.5million (23%)
Water-0.7million (1%)
Multiple Modes-1.8million (3%)
Truck-$41.2billion (82%)
Rail-$3.4billion (7%)
Water-$0.7billion (1%)
Multiple Modes-$5.1billion (10%)
Tons by Mode (2014)Total = 67.3 Million tons
Value by Mode (2014)Total = $50.4 Billion
Source: WSP | PB Analysis of FHWA Freight Analysis Framework version 4 (FAF4) data. Preliminary.

Freight Tonnage and Value in the Eight Counties
Tons by Commodity (2014)Total = 67,332,050
Value by Commodity (2014)Total = $50,412,039,476
Source: WSP | PB Analysis of FHWA Freight Analysis Framework version 4 (FAF4) data. Preliminary.
Cereal grains 18%
Fertilizers 17%
Gravel15%
Other ag prods.7%
Coal5%
Nonmetal min. prods. 5%
Other foodstuffs4%
Animal feed 4%
Waste/scrap 2%
Gasoline 2%
All Other 21%
Machinery 8%
Unknown/Mixed 8%
Motorized vehicles 7%
Other ag prods. 6%
Other foodstuffs 6%
Cereal grains 5%
Plastics/rubber 5%
Fertilizers 5%Electronics 4%
Pharmaceuticals4%
All Other42%

Roadways
19
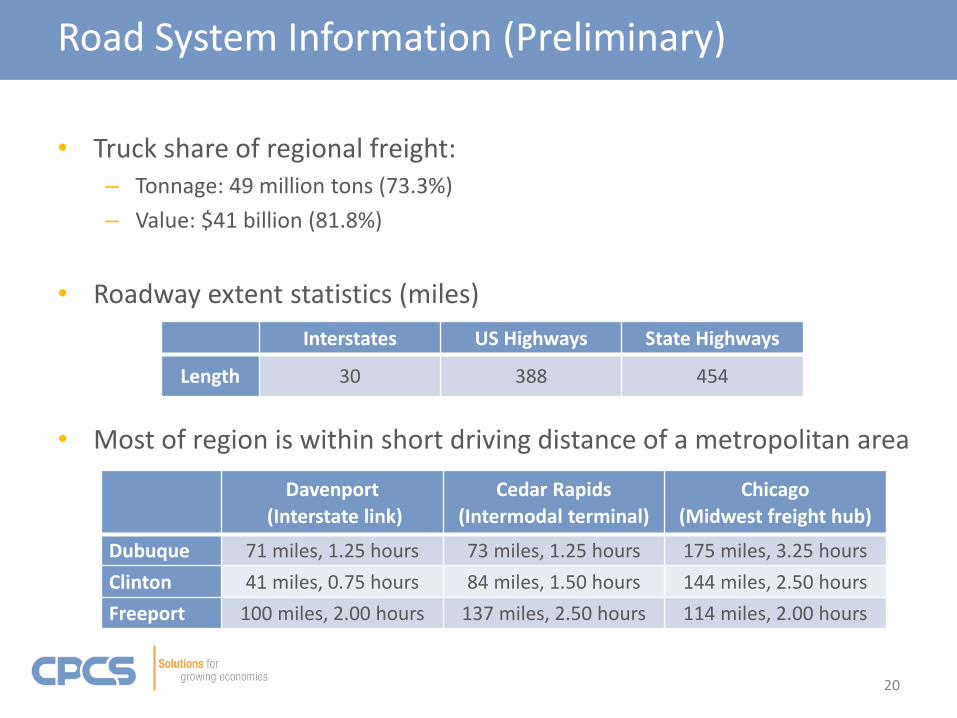
• Truck share of regional freight:– Tonnage: 49 million tons (73.3%)
– Value: $41 billion (81.8%)
• Roadway extent statistics (miles)
• Most of region is within short driving distance of a metropolitan area
20
Road System Information (Preliminary)
Davenport
(Interstate link)
Cedar Rapids
(Intermodal terminal)
Chicago
(Midwest freight hub)
Dubuque 71 miles, 1.25 hours 73 miles, 1.25 hours 175 miles, 3.25 hours
Clinton 41 miles, 0.75 hours 84 miles, 1.50 hours 144 miles, 2.50 hours
Freeport 100 miles, 2.00 hours 137 miles, 2.50 hours 114 miles, 2.00 hours
Interstates US Highways State Highways
Length 30 388 454

Railroads
21

• Class I Railroads:– Union Pacific: 98.34 miles
– Canadian National: 207.9 miles
– Canadian Pacific: 160.1 miles
– BNSF: 130.7 miles
• 486 railroad crossings in region
• Rail share of regional freight:– Tonnage: 15 million tons (23%)
– Value: $3.4 billion (6.7%)
Rail System Information (Preliminary)
Facility RailroadEstimated Maximum
Rail Miles from RegionEstimated Travel Time
Global III (Rochelle, IL) UP 80 (From DeWitt) 2.9 hours at 27.3 MPH
Cedar Rapids Intermodal CRANDIC 110 (From Sterling, via UP) 4.0 hours at 27.3 MPH
Cicero Intermodal (Chicago) BNSF 180 (From E. Dubuque) 6.4 hours at 28.3 MPH
Bensenville, IL CP 180 (From Dubuque) 6.8 hours at 26.6 MPH
Joliet, IL CN 210 (From Dubuque) 7.9 hours at 26.6 MPH
Source: AAR Performance Measures
22

Marine System
23

• Marine share of regional freight:– Tonnage: 713,000 tons (1%)
– Value : $734 million (1.5%)
• 94 miles of the Mississippi River in the Region
• Three locks and dams, all with 110 x 600’ locks, built between 1934 and 1939
• Connection– 1,460 – 1,550 miles to the Gulf
– 15 days average travel time to the Gulf
– Trip passes through 16 locks from top of region
Marine System Information (Preliminary)

Intermodal Facilities (Preliminary)
25
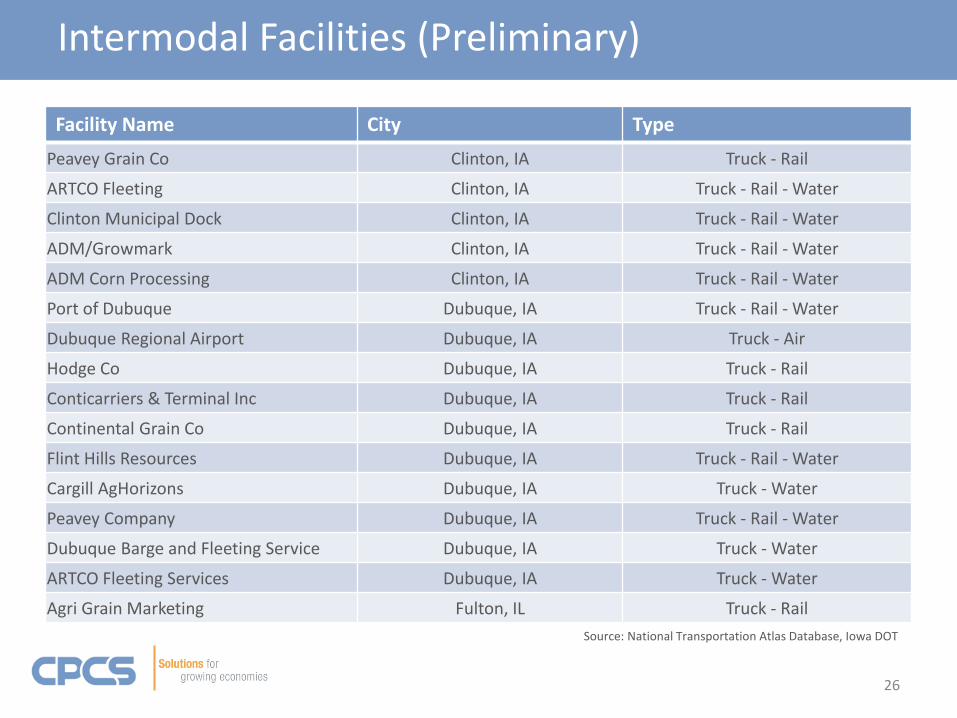
Intermodal Facilities (Preliminary)
Facility Name City Type
Peavey Grain Co Clinton, IA Truck - Rail
ARTCO Fleeting Clinton, IA Truck - Rail - Water
Clinton Municipal Dock Clinton, IA Truck - Rail - Water
ADM/Growmark Clinton, IA Truck - Rail - Water
ADM Corn Processing Clinton, IA Truck - Rail - Water
Port of Dubuque Dubuque, IA Truck - Rail - Water
Dubuque Regional Airport Dubuque, IA Truck - Air
Hodge Co Dubuque, IA Truck - Rail
Conticarriers & Terminal Inc Dubuque, IA Truck - Rail
Continental Grain Co Dubuque, IA Truck - Rail
Flint Hills Resources Dubuque, IA Truck - Rail - Water
Cargill AgHorizons Dubuque, IA Truck - Water
Peavey Company Dubuque, IA Truck - Rail - Water
Dubuque Barge and Fleeting Service Dubuque, IA Truck - Water
ARTCO Fleeting Services Dubuque, IA Truck - Water
Agri Grain Marketing Fulton, IL Truck - Rail
26
Source: National Transportation Atlas Database, Iowa DOT

Eight County Proximity
27

Open Discussion
– Do you agree with our identification of the Eight County Region’s infrastructure assets?
– What might be missing from this picture?
28

29
Presentation Map
Freight System Inventory
Eight County Local Economy
Visioning
Stakeholder Perspectives
Questions & Discussion
30
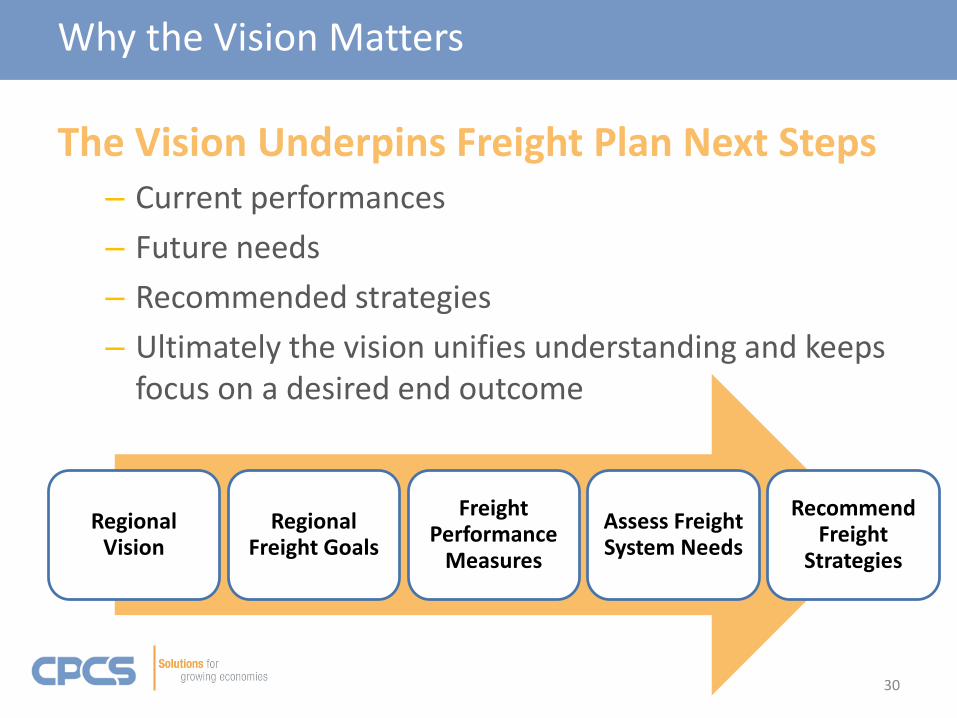
Why the Vision Matters
Regional Vision
Regional Freight Goals
Freight Performance
Measures
Assess Freight System Needs
Recommend Freight
Strategies
The Vision Underpins Freight Plan Next Steps– Current performances
– Future needs
– Recommended strategies
– Ultimately the vision unifies understanding and keeps focus on a desired end outcome
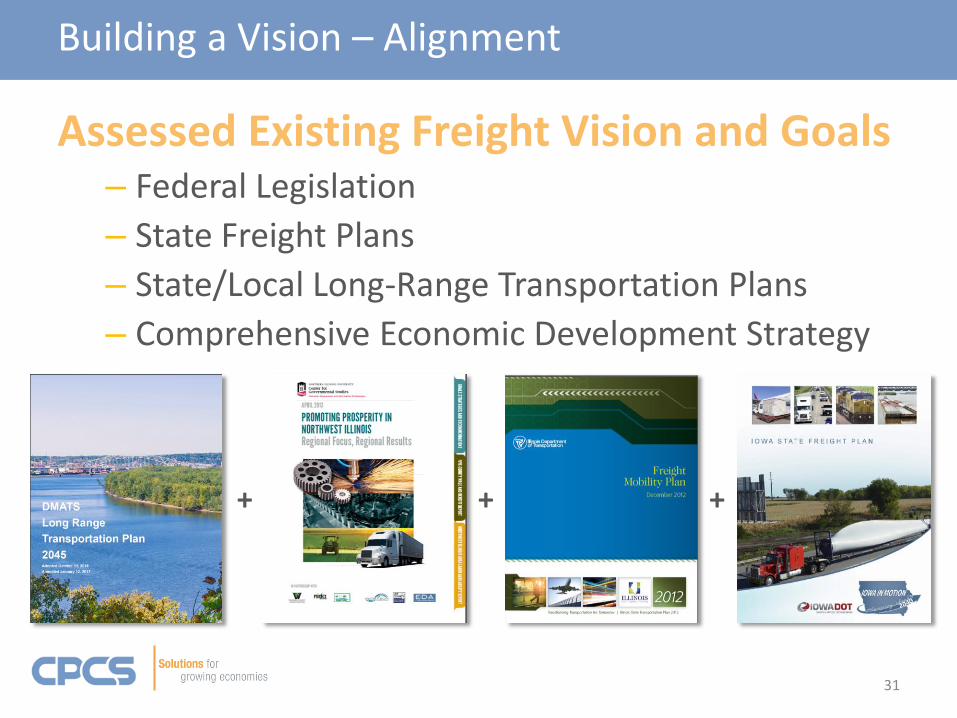
Building a Vision – Alignment
+++
31
Assessed Existing Freight Vision and Goals – Federal Legislation
– State Freight Plans
– State/Local Long-Range Transportation Plans
– Comprehensive Economic Development Strategy
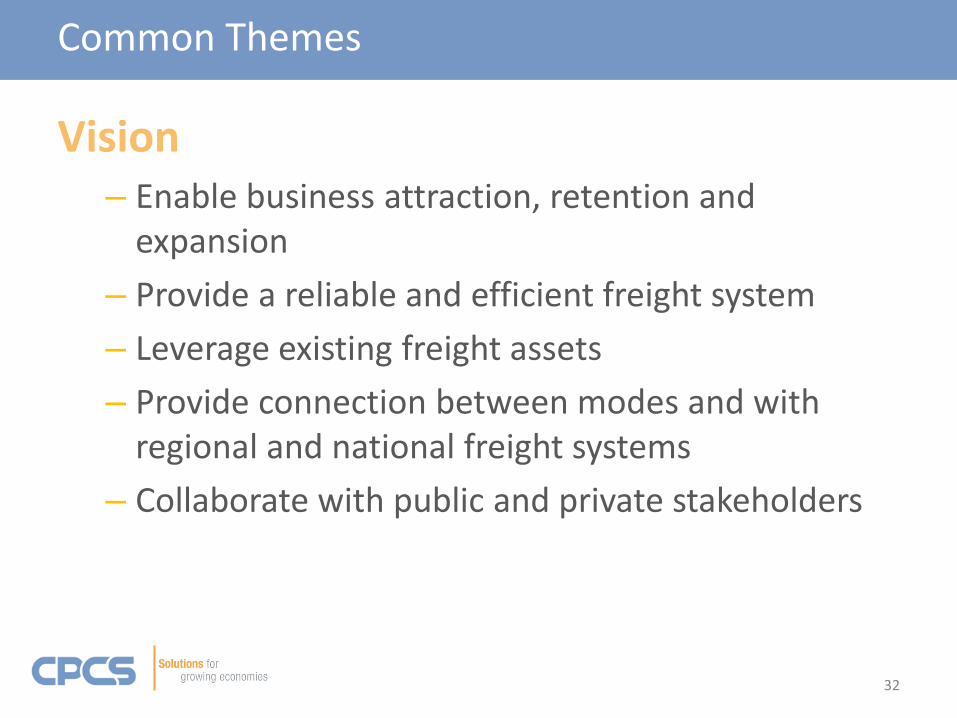
Common Themes
32
Vision– Enable business attraction, retention and
expansion
– Provide a reliable and efficient freight system
– Leverage existing freight assets
– Provide connection between modes and with regional and national freight systems
– Collaborate with public and private stakeholders

• Example #1 – Full Meal Deal– The Eight County freight system provides safe, efficient,
and competitive services that connect the region’s businesses and industries with domestic and international markets, and support statewide economic development activities.
• Example #2 – Transportation & Economics Focus– The Eight County freight system provides for the reliable
movement of goods, while improving overall transportation system efficiency and promoting economic growth.
• Example #3 – Short and Sweet– The Eight County freight system successfully moves
products and enhances state and local economic growth.
33
Approaches to Freight Vision Statements

Eight County Freight Vision for Discussion
The Eight County multimodal freight system enables economic growth by meeting the transportation needs of
local businesses and providing efficient and reliable access to the region,
nation, and globe
34
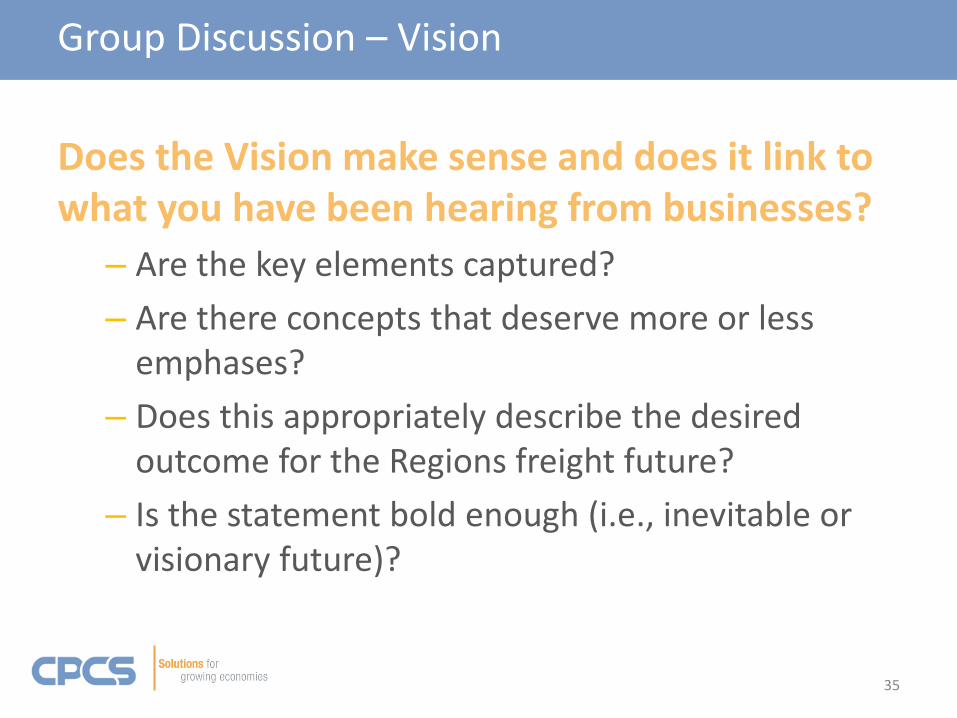
Group Discussion – Vision
Does the Vision make sense and does it link to what you have been hearing from businesses?
– Are the key elements captured?
– Are there concepts that deserve more or less emphases?
– Does this appropriately describe the desired outcome for the Regions freight future?
– Is the statement bold enough (i.e., inevitable or visionary future)?
35

Next Steps
36
Incorporate Comments and Implement Vision
– Develop supporting goals
– Use vision and goals to define performance measures
Regional Vision
Regional Freight Goals
Freight Performance
Measures
Assess Freight System Needs
Recommend Freight
Strategies

37
Presentation Map
Freight System Inventory
Eight County Local Economy
Visioning
Stakeholder Perspectives
Questions & Discussion

38
Stakeholder Outreach
Public Agencies Internalize institutional knowledge Understand needs Develop buy-in for implementation
Private Sector Identify/validate needs and
opportunities Confirm recommendations Develop buy-in for implementation
Individuals Public awareness

• Online survey
• 22 qualitative and quantitative questions
• Twenty companies responded
Industry Survey – Response Overview
0 2 4 6 8 10 12 14
Manufacturing (ex. food, heavy, general)
Other (Services, Construction)
Natural Resources (ex. energy, forestry, mining, quarrying)
Consumer Goods
Transportation and Logistics (ex. warehouse, terminals, carriers)
Industries Represented
39
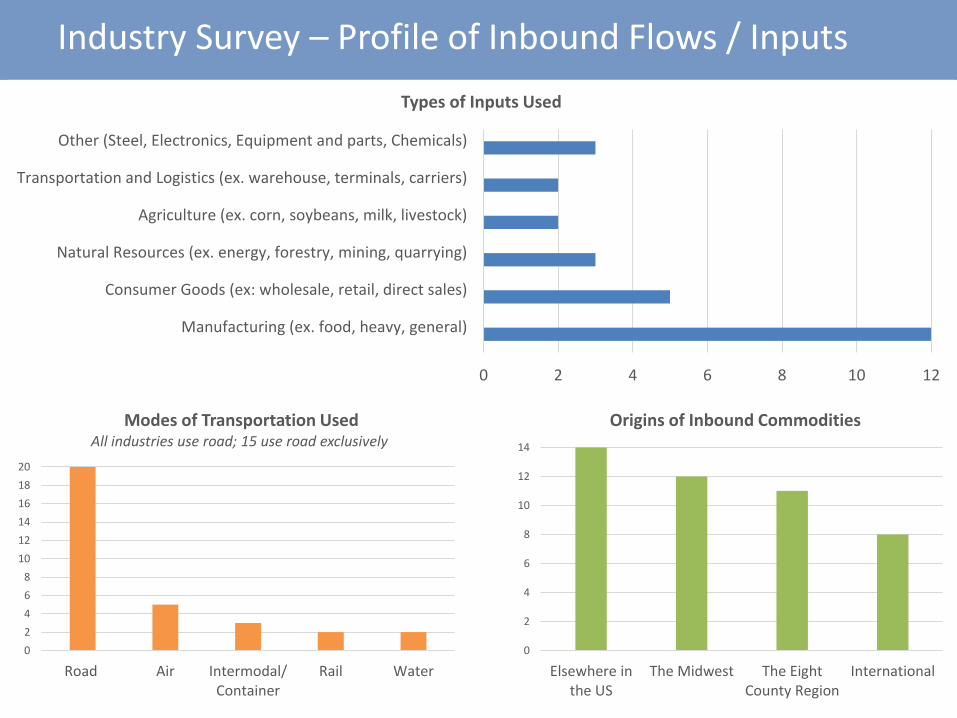
Industry Survey – Profile of Inbound Flows / Inputs
0
2
4
6
8
10
12
14
16
18
20
Road Air Intermodal/Container
Rail Water
Modes of Transportation UsedAll industries use road; 15 use road exclusively
0 2 4 6 8 10 12
Manufacturing (ex. food, heavy, general)
Consumer Goods (ex: wholesale, retail, direct sales)
Natural Resources (ex. energy, forestry, mining, quarrying)
Agriculture (ex. corn, soybeans, milk, livestock)
Transportation and Logistics (ex. warehouse, terminals, carriers)
Other (Steel, Electronics, Equipment and parts, Chemicals)
Types of Inputs Used
0
2
4
6
8
10
12
14
Elsewhere inthe US
The Midwest The EightCounty Region
International
Origins of Inbound Commodities

Industry Survey – Profile of Outbound Flows
• Types of comm [Q10]
0 2 4 6 8 10 12
Manufacturing (ex. food, heavy, general)
Consumer Goods (ex: wholesale, retail, direct sales)
Other (Asphalt, Biodiesel)
Natural Resources (ex. energy, forestry, mining, quarrying)
Types of Goods Produced(One company produces Manufactured and Consumer Goods;
For seventeen goods producing companies only)
0
2
4
6
8
10
12
14
16
18
Road Air Intermodal/Container
Rail Water
Outbound Modes of Transportation Used(For 17 Goods-Producing Industries; all use road)
0
2
4
6
8
10
12
Elsewhere inthe US
The Midwest International The EightCounty Region
Destination of Outbound Commodities (For 17 goods-producing companies only)

Industry Survey – Transportation System Performance
0 2 4 6 8 10 12 14 16
Cost
Other infrastructure issues (bridge weight limits, truck route restrictions)
Access to modes/competitive services
Safety
Congestion
Regulatory Issues (delivery restrictions, truck prohibited routes, hours of…
Geometric issues (turn lanes, lane drops, clearance restrictions, etc.)
Other: USACE Locks and Dams Upgrading
“Top 3” Transportation Issues in Eight County Region
0 2 4 6 8 10 12 14 16 18
New/expanded roadways
Pavement improvements
Dedicated truck routes
Bridge Improvements (weight and height related)
New/improved intermodal and/or port facilities
Transload/consolidation facilities
Other (Lock/Dams Upgrades; Develop HWY 30; Public Transportation)
At-grade rail separation/crossing improvements
Truck parking
"Top 3" Transportation Improvements to Help Competitiveness
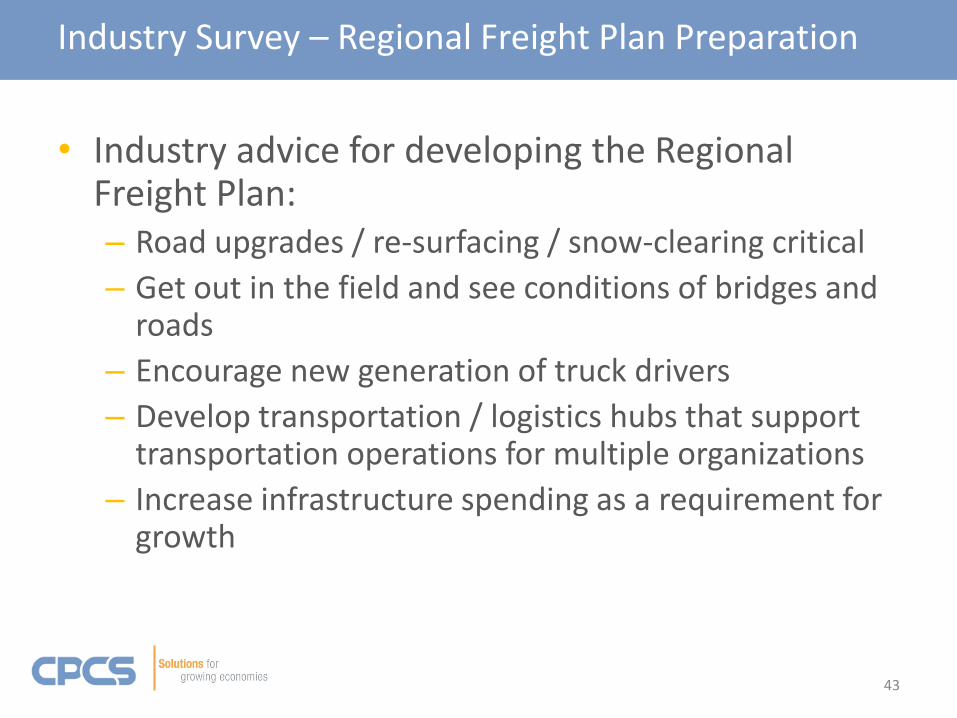
• Industry advice for developing the Regional Freight Plan:– Road upgrades / re-surfacing / snow-clearing critical
– Get out in the field and see conditions of bridges and roads
– Encourage new generation of truck drivers
– Develop transportation / logistics hubs that support transportation operations for multiple organizations
– Increase infrastructure spending as a requirement for growth
43
Industry Survey – Regional Freight Plan Preparation
• What are top industry issues/concerns?
• What transportation system improvements are most needed?
• What advice did they provide for us in developing the Eight County Freight Plan?
What have you heard during your consultations?
Please provide us your compiled results by April 14th

45
Presentation Map
Freight System Inventory
Eight County Local Economy
Visioning
Questions & Discussion
Stakeholder Perspectives

• Continue consultations• Refine vision and develop performance measures• Existing and future commodity flow assessment
46
Our Next Steps…
1 2 3 4 5 6 7 8 9 10 11 12 13 14
Project Inception
Task 0.1 - Kick-Off Meeting
Task 0.2 - Literature Review and Initial Data Collection
Task 0.3 - Project Management & revise Work Plan, as needed
Task 1 - Data Collection and Inventory
Task 1.1 - Physical Profile
Task 1.2 - Operational Profile
Task 1.3 - Stakeholder Consultations & 6 Council Meetings
Task 2 - Needs Assessment and Analysis
Task 2.1 - Freight System Performance Measures
Task 2.2 - Existing and Future Commodity Flow Assessment
Task 2.3 - Freight Modal Profiles and Needs Assessment Report
Task 3 - Study Recommendations
Task 3.1 - Freight System Infrastructure Projects
Task 3.2 - Project Evaluation and Prioritization
Task 3.3 - Supporting Freight System Strategies
Task 4 - Reporting
Task 4.1 - Draft Final Report
Task 4.2 - Final Report
Legend
Major Task Duration Work Activity Meeting
Months
