eight questions about corruption - world · pdf file · 2005-10-13eight questions...
TRANSCRIPT
Eight Questions about Corruption
Jakob Svensson
S ome years ago I interviewed the chief executive officer of a successful Thaimanufacturing firm as part of a pilot survey project While trying to figureout a good way to quantify the firmrsquos experience with government regula-
tions and corruption in the foreign trade sector the CEO exclaimed ldquoI hope to bereborn as a custom officialrdquo When a well-paid CEO wishes for a job with low officialpay in the government sector corruption is almost surely a problem
The most devastating forms of corruption include the diversion and outrighttheft of funds for public programs and the damage caused by firms and individualsthat pay bribes to avoid health and safety regulations intended to benefit the publicExamples abound A conservative estimate is that the former President of ZaireMobutu Sese Seko looted the treasury of some $5 billionmdashan amount equal to thecountryrsquos entire external debt at the time he was ousted in 1997 The fundsallegedly embezzled by the former presidents of Indonesia and Philippines Mo-hamed Suharto and Ferdinand Marcos are estimated to be two and seven timeshigher (Transparency International 2004) In the Goldenberg scam in Kenya inthe early 1990s the Goldenberg firm received as much as $1 billion from thegovernment as part of an export compensation scheme for fictitious exports ofcommodities of which Kenya either produced little (gold) or nothing at all (dia-monds) (ldquoPublic Inquiry into Kenya Gold Scamrdquo 2003) An internal IMF reportfound that nearly $1 billion of oil revenues or $77 per capita vanished fromAngolan state coffers in 2001 alone (Pearce 2002) This amount was about threetimes the value of the humanitarian aid received by Angola in 2001mdashin a countrywhere three-quarters of the population survives on less than $1 a day and where one
y Jakob Svensson is Assistant Professor Institute for International Economic Studies Stock-holm University Stockholm Sweden He is also Senior Economist Development ResearchGroup World Bank Washington DC and Research Fellow Center for Economic PolicyResearch London United Kingdom His e-mail address is jakobsvenssoniiessuse
Journal of Economic PerspectivesmdashVolume 19 Number 3mdashSummer 2005mdashPages 19ndash42
in three children dies before the age of five In Turkey the effect of the earthquakethat took thousands of lives in 2004 would have been much less severe accordingto the government of Turkey if contractors had not been able to pay bribes to buildhomes with substandard materials (Kinzer 1999) Extrapolating from firm andhousehold survey data the World Bank Institute estimates that total bribes in a yearare about $1 trillion (Rose-Ackerman 2004) While the margin of error in thisestimate is large anything even in that general magnitude ($1 trillion is about3 percent of world GDP) would qualify as an enormous issue
This paper will discuss eight frequently asked questions about public corrup-tion 1) What is corruption 2) Which countries are the most corrupt 3) What arethe common characteristics of countries with high corruption 4) What is themagnitude of corruption 5) Do higher wages for bureaucrats reduce corruption6) Can competition reduce corruption 7) Why have there been so few (recent)successful attempts to fight corruption 8) Does corruption adversely affect growthThese questions are not meant to be exhaustive and readers interested in addi-tional discussion might begin by turning to the reviews by Bardhan (1997) andRose-Ackerman (1999)
What is Corruption
A common definition of public corruption is the misuse of public office forprivate gain Misuse of course typically involves applying a legal standard Corrup-tion defined this way would capture for example the sale of government propertyby government officials kickbacks in public procurement bribery and embezzle-ment of government funds
Corruption is an outcomemdasha reflection of a countryrsquos legal economic cul-tural and political institutions Corruption can be a response to either beneficial orharmful rules For example corruption appears in response to benevolent ruleswhen individuals pay bribes to avoid penalties for harmful conduct or whenmonitoring of rules is incompletemdashas in the case of theft Conversely corruptioncan also arise because bad policies or inefficient institutions are put in place tocollect bribes from individuals seeking to get around them (Djankov LaPortaLopez-de-Silanes and Shleifer 2003)
A number of parallels have been proposed for thinking about corruptionAlthough each of these parallels can be illuminating in certain ways none of themcapture the phenomena perfectly
As one parallel corruption is often thought of as like a tax or a fee Bribes liketaxes create a wedge between the actual and privately appropriated marginalproduct of capital However along with the obvious point that bribes bring nomoney to government coffers bribes differ from taxes in other ways Bribes involvehigher transaction costs than taxes because of the uncertainty and secrecy thatnecessarily accompany bribe payments (Shleifer and Vishny 1993) Corrupt con-tracts are not enforceable in courts An official may renege on an agreement with
20 Journal of Economic Perspectives
the bribe-payer or demand another bribe for the same service (Boycko Shleiferand Vishny 1995)
Bribing also has parallels to lobbying in the form of campaign contributions orinfluence buying through other means but again they are not perfect substitutes(Harstad and Svensson 2004) Consider a situation in which a country has enactedtariffs or licence requirements for imports that affect all firms in a sector A firm canavoid paying the tariff or buying a licence by bribing a custom official Alternativelyfirms in the sector may collectively lobby the government to provide the license forfree or to remove the tariff One difference between bribery and lobbying in thiscase is that a change in the trade regime through lobbying affects all firms in thesector as well as future entrants However the return to bribing is typically firmspecific although potential externalities may arise both for other firms and con-sumers A second difference is that a change in the trade regime through lobbyingtends to be more permanent because there is some cost to re-enacting the originallaw while a bureaucrat cannot credibly commit not to ask for bribes in the futureA third difference is that decisions about government rule making involve officialsweighing the benefits of income from lobbying against the cost to the governmentof a rule change while decisions about bribes are made by individual publicofficials who consider their private costs and benefits Finally unlike bribing wherefirms weight the private benefit and cost of the action lobbying involves jointactions with associated collective action problems The question why firms chooseto lobby or bribe and the consequences of this choice is analyzed in Harstad andSvensson (2004)
Corruption or more precisely bribes is not the same as rent-seeking althoughthe terms are often interchanged Rent seeking is the socially costly pursuit of rentsoften created by governmental interventions in the economy (Tollison 1997)while bribes are technically a transfer
No definition of corruption is completely clear-cut The emphasis in this paperis on public corruption but corruption can also take the form of collusion betweenfirms or misuse of corporate assets that imposes costs on consumers and investorsSome activities will hover on a legal borderline for example legal payments thatinvolve lobbying campaign contributions or gifts can seem quite close to illegalpayments that constitute bribery or legal offers of postretirement jobs in privatesector firms to officials and politicians assigned to regulate these same firms canseem quite close to illegal kickbacks
Which Countries are the Most Corrupt
Measuring corruption across countries is a difficult task both due to thesecretive nature of corruption and the variety of forms it takes However sincecorruption reflects an underlying institutional framework different forms of cor-ruption are likely to be correlated
The past decade has seen an exponential growth in cross-country studies oncorruption Three types of corruption measures have been exploited in the
Jakob Svensson 21
literature The first type used initially by Knack and Keefer (1995) and Mauro(1995) is based on indicators of corruption assembled by private risk-assessmentfirms Of these the corruption indicator published in the International CountryRisk Guide has become the most popular due to better coverage across time andcountries According to its creators the International Country Risk Guidersquos cor-ruption indicator captures the likelihood that high government officials will de-mand special payments and the extent to which illegal payments are expectedthroughout government tiers1
The second set of variables is averages of ratings reported by a number ofperception-based sources Among policymakers the Corruption Perception Indexproduced by Transparency International is the most widely disseminated Thesource of this index varies from year to year but the data released in October 2004is based on 18 rankings from 12 institutions2 According to Transparency Interna-tional the essential conditions for inclusion are that a source must provide anordinal measurement or ranking of nations and that the data must measure theoverall extent of corruption and not the expected impact For this reason thecorruption indicator published in the International Country Risk Guide is notincluded because according to Transparency International it does not determinea countryrsquos level of corruption but the political risk involved in corruption Thesetwo issues can differ considerably depending on for example whether publictolerance toward corruption is high or low
Kaufmann Kraay and Mastruzzi (2003) derive a complementary measureControl of Corruption drawn from a large set of data sources They have a broaderdefinition of corruption and include most cross-country indices reporting rankingof countries on some aspect of corruption They also use a different strategy thanTransparency International to aggregate the corruption indicators In the enddefinitions and aggregation choice seem to matter only marginally3 The simplecorrelation between Control of Corruption (from 2002) and the Corruption Per-ceptions Index (from 2003) is 097 and the correlation between Control of Cor-ruption or the Corruption Perceptions and the corruption scores from the Inter-national Country Risk Guide (from 2001) is 075 The main difference between thethree indicators is which countries and years are covered4
1 The data are produced by Political Risk Servicesmdasha private firm providing risk assessments acrosscountries httpwwwprsgroupcomcountrydatacountrydatahtml According to Political Risk Ser-vices over 80 percent of the worldrsquos largest global companies (as ranked by Fortune magazine) use itsdata and information to make business and investment decisions The current data are costly althougholder versions are available on the web2 The Corruption Perception Index is produced by the University of Passau in Germany and byTransparency International Data for 2004 and previous years back to 1996 are available for free athttpwwwtransparencyorgsurveysindexhtmlcpi3 The Control of Corruption Index is available from the World Bank at httpinfoworldbankorggovernancekkz2002tablesasp4 The aggregation procedures used by both Kaufmann Kraay and Mastruzzi (2003) and TransparencyInternational presume that the measurement errors associated with each subindicator are independentacross sources This assumption allows them also to report measures of the precision or reliability of theestimates In reality the measurement errors are likely to be highly correlated because the producers
22 Journal of Economic Perspectives
The subjective corruption measures discussed above are ordinal indices al-though researchers have typically treated them as cardinal measures At a mini-mum this limitation should be kept in mind when interpreting changes in theindices across time and countries At least two cross-country data sets on corruptionprovide cardinal measures of corruption although few papers in the economicliterature on corruption have utilized them Both of them are based on survey dataThe EBRD-World Bank Business Environment and Enterprise Performance Surveycompiles the experiences of more than 10000 firm managers in 1999 and 2002Firm managers were asked to estimate the share of annual sales ldquofirms like yoursrdquotypically pay in unofficial payments to public officials5 Unfortunately these dataare only available for 26 transition countries
The International Crime Victim Surveys (ICVS) since 2003 under the respon-sibility of the United Nations Office on Drugs and Crime focus on individualsrather than firms The surveys are designed to produce comparable data on crimeand victimization across countries using a combination of computer-assisted tele-phone interviewing techniques in developed countries and face-to-face surveys indeveloping countries In most developing countries the survey data refer to theexperience of urban households since the surveys are only implemented in thecapital (or largest) cities With respect to corruption respondents were asked ifgovernment officials asked or expected the respondent to pay bribes for theirservice during the last year These data can be used to derive the incidence of bribesacross countries To date over 140 surveys in four waves (1989 1992 1996199720002001) have been done in over 70 different countries although the latestround includes fewer than 50 countries6 Incidence of bribes is highly correlatedwith the subjective measures (simple correlation lies between 057 and 067) butthe best predictor of the share of households that need to pay bribes is actually GDPper capita7
One obvious advantage with the EBRD-World Bank Business Environment andEnterprise Performance Survey and the International Crime Victim Surveys is thatthey provide hard evidence on corruption However collecting reliable data oncorruption through traditional survey techniques is problematic Respondents maychoose to misreport or not report at all for many reasons To the extent that thesemeasurement error problems are not systematically related to country characteris-tics however this may be less of a concern when studying variations in corruptionacross countries
A disadvantage is that the hard evidence is only available for a smaller sample
of the different indices read the same reports and most likely gauge each otherrsquos evaluations If theindependence assumption is relaxed the gain from aggregating a number of different reports is lessclear Moreover the estimates would be less precisely estimated than the stated estimates suggest5 The data are available for free at httpwwwebrdcompubseconbeepsmainhtm6 The data are available for free at httpwwwunicriiticvsdataindexhtm7 In regressions using the incidence of bribes as the dependent variable and GDP per capita (inlogarithms) and the subjective corruption indices (each entered one at the time) as the independentvariables the coefficient on GDP per capita is highly significant while the corruption indicators areinsignificantly different from zero
Eight Questions about Corruption 23
of countries Moreover the International Crime Victim Surveys only provide infor-mation on the incidence of corruption from a household perspective The inci-dence and level of corruption are not necessarily highly correlated and may verywell be driven by different factors Clearly they can also have differential impactson economic and social outcomes The subjective indices on the other hand aremainly constructed for the private sector and particularly for foreign investorsThus they primarily measure corruption related to doing businessmdashbut corrup-tion may take other forms as well
Table 1 lists the 10 percent of countries that have the worst rankings forcorruption according to the four measures with broad regional coverage theControl of Corruption index the Corruption Perceptions Index the corruptionscore produced by the International Country Risk Guide and the Incidence ofBribes from the International Crime Victim Surveys Note that not all countries areranked and that country coverage differs For example the Control of Corruptionindex includes many more countries All three measures are rescaled such that ahigher value implies higher corruption
What are the Common Characteristics of Countries with HighCorruption
Looking at the lists of most corrupt countries in Table 1 offers some hintsabout what characterizes countries with high corruption All of the countries withthe highest levels of corruption are developing or transition countries Strikinglymany are governed or have recently been governed by socialist governments Withfew exceptions the most corrupt countries have low income levels Of the countriesassigned an openness score by Sachs and Warner (1995) all of the most corrupteconomies are considered closed economies except Indonesia8
How do these intuitive connections about the common features of countrieswith high levels of corruption compare with more systematic research Theoriesabout the determinants of corruption emphasize the role of economic and struc-tural policies and also the role of institutions These theories are best viewed ascomplementary after all the choice of economic and structural policies is onechannel through which institutions influence corruption The literature is summa-rized in Acemoglu Johnson and Robinson (2004) La Porta Lopez-de-SilanesShleifer and Vishny (1999) and Djankov Glaeser La Porta Lopez-de-Silanes andShleifer (2003)
The institutional theories can be decomposed into two broad groups The first set
8 The Sachs and Warner (1995) measure of openness considered an economy to be ldquoclosedrdquo if it met anyof five criteria 1) average tariff rates above 40 percent 2) nontariff barriers that cover more than40 percent of all imports 3) a socialist economic system 4) a state monopoly of major exports and5) the black market premium exceeded 20 percent during the 1970s or the 1980s Note that byconstruction all socialist economies are defined as closed economies Rodrıgues and Rodrik (2000)argue that the Sachs-Warner indicator serves as a proxy for a wide range of policy and institutionaldifferences not only differences in openness to trade
24 Journal of Economic Perspectives
of theories argues that institutional quality (and thus corruption) is shaped by eco-nomic factors In short institutions develop in response to a countyrsquos income level anddifferential needs (Lipset 1960 Demsetz 1967) A related viewmdashthe human capitaltheorymdashargues that growth in human capital and income cause institutional develop-ment (Lipset 1960 Glaeser La Porta Lopez-de-Silanes and Shleifer 2004) Forexample education and human capital is needed for courts and other formal institu-tions to operate efficiently and government abuses are more likely to go unnoticedand unchallenged when the electorate is not literate These theories suggest looking atper capita income and education as causes of corruption
The second set of institutional theories stress the role of institutions more directly
Table 1The Most Corrupt Countries(the bottom 10 percent most corrupt countries from each data set)
Country CC Country CPI Country ICRG Country ICVS
Equatorial 19civ Bangladesh 87v Zimbabwe 58v Albania 075Guinea Nigeria 86 China 5v Uganda 036
Haiti 17v Haiti 85v Gabon 5cv Mozambique 031Iraq 14v Myanmar 84v Indonesia 5v Nigeria 030Congo Dem 14cv Paraguay 84v Iraq 5v Lithuania 024
Rep Angola 82v Lebanon 5v
Myanmar 14v Azerbaijan 82 Myanmar 5v
Afghanistan 14civ Cameroon 82v Niger 5cv
Nigeria 14 Georgia 82i Nigeria 5Laos 13civ Tajikistan 82iv Russia 5Paraguay 12v Indonesia 82v Sudan 5v
Turkmenistan 12civ Kenya 81v Somalia 5cv
Somalia 12cv Cote 79v Congo 5cv
Korea North 12cv drsquoIvoire Dem RepZimbabwe 12v Kyrgyzstan 79iv Serbia and 5v
Indonesia 12v Libya 79v MontenegroAngola 11v Papua New 79v Haiti 48v
Bangladesh 11v Guinea Papua New 48v
Cameroon 11v GuineaNiger 11cv
Sudan 11v
Azerbaijan 11Tajikistan 11iv
Sample size 195 133 140 44
Notes CC is the Control of Corruption Index for 2002 from Kaufmann Kraay and Mastruzzi (2003) Theindex takes values between 25 to 25 with a higher score indicating higher corruption (rescaled) CPIis the Corruption Perception Index for 2003 from Transparency International The index takes valuesbetween 0 to 10 with a higher score indicating higher corruption (rescaled) ICRG is the InternationalCountry Risk Guidersquos corruption indicator for 2001 (average over 12 months) The index takes valuesbetween 0 to 6 with a higher score indicating higher corruption (rescaled) ICVS is the incidence ofbribes in 2000 (share of households responding they need or are expected to pay bribes in 2000) fromthe International Crime Victim Surveysc indicates that the country is not included in the Corruption Perception Index rankingi indicates that the country is not included in the ICRG rankingv indicates that the country is not included in the ICVS survey
Jakob Svensson 25
These theories often emphasize that institutions are persistent and inherited Alongthese lines Acemoglu Johnson and Robinson (2001) argue that in former coloniesthe institutions were set for the benefit of the colonizer and only when Europeanssettled in large numbers did this also result in institutions aimed at benefiting residentsof the colony The disease environment in the colonies in turn explains why Euro-peans settled or not Thus according to Acemoglu Johnson and Robinson corruptionshould be more widespread in colonies with an inhospitable environment
Alternatively La Porta Lopez-de-Silanes Shleifer and Vishny (1998 1999)stress the identity of the colonizer and specifically the legal system transplantedfrom the colonizer to the colonies In their view French and Socialist legal origincountries (as opposed to former English colonies) regulate more and regulationleads to corruption
Yet another way in which historical traditions and colonization might affect theextent of corruption is through the influence of religion (Treisman 2000) Forexample the institutions of the Protestant church which arose in part as an oppositionto state-sponsored religion may be more inclined to monitor abuses by state officialsLandes (1998) also argues that the spread of education and learning was and poten-tially is slower in Catholic and Muslim countries Thus politicians and public officialsmight be challenged less in Catholic and Muslim countries than in Protestantcountries
Economic and political institutions in the view of the second set of theoriesinfluence the extent of corruption especially in the ways that they restrict marketand political competition Variables that capture restriction in the marketplaceinclude openness to external competition from imports (Ades and Di Tella 1999)and the extent of regulation of entry of start-up firms (Djankov La Porta Lopez-de-Silanes and Shleifer 2002) On the political side a free press provides greaterinformation than a government-controlled press to voters on government andpublic sector misbehavior including corruption (Besley and Burgess 2001 Bru-netti and Weder 2001) More generally the right to re-elect politicians can provideincentives for the incumbent to reduce rent seeking and corruption The form ofpolitical institutionsmdashparliamentary versus presidential and proportional versusmajoritarianmdashcan also affect the level of corruption as it influences the incentivesof politicians and votersrsquo ability to hold politicians accountable for abuse of power(as recently reviewed in this journal by Persson and Tabellini 2004)
What is the empirical evidence on these various hypotheses Figure 1 plots therelationship between corruption proxied by the indicator with the largest countrycoverage (Control of Corruption) and GDP per capita (in logarithms) and drawsthe line implied by the estimated regression of corruption on GDP per capita Thegraph illustrates two facts First richer countries have lower corruption Secondcorruption varies greatly across countries even controlling for income Some of thecountries far away from the regression linemdashand thus the most and least corruptfor a given level of developmentmdashare highlighted in the graph For exampleArgentina Russia and Venezuela are ranked as relatively corrupt given their levelof income Countries in sub-Saharan Africa are typically aligned close to the
26 Journal of Economic Perspectives
regression line which shows that their perceived corruption is close to the expectedlevel given their per capita GDP
The strong relationship between income and corruption is consistent with thetheories of corruption that argue that institutional quality is shaped by economicfactors However it is a weak test of these theories since economic developmentnot only may create a demand for good government and institutional change butmay also be a function of the quality of institutions Moreover the huge variationaround the regression line suggests that these theories are at best incomplete
What can account for this variation To explore this I carried out a series ofregressions where the dependent variable is corruption proxied with the threesubjective measures of corruption described earlier The explanatory variables ineach regression include initial GDP per capita and initial human capital (bothmeasured in 1970) as control variables I then add a series of country characteris-tics one at a time and test if the coefficient is significantly different from zeroThese partial correlations of course do not identify causal effects Even so thecorrelations are interesting because they reveal something about common charac-teristics of corrupt countries adjusting for initial income and human capital
What are the results Table 2 shows that corrupt countries have significantlylower levels of human capital stock proxied by years of schooling of the totalpopulation aged over 25 This relationship holds independent of what measure ofcorruption is used
Figure 1Corruption and Income
CC
200
2
Real GDP per capita 1995
30981 351442
11
439
Ethiopia
EritreaMadagascar
Burkina Faso
Mauritania
Equatorial Guinea
Haiti
Bhutan
Indonesia
Turkmenistan
Paraguay
Kazakhstan
Venezuela
Russia
Gabon
Argentina
New Zealand
Finland
Sweden
Macao
Singapore
Note The graph depicts the regression line of corruption (CC 2002) on real GDP per capita (inlogarithms) 1995
Eight Questions about Corruption 27
Corrupt countries do have some significantly different policy characteristicsTable 3 shows the regression results from a measure of openness to exter-nal competition from imports (imports of goods and services as percent of GDP)Table 4 shows the regression based on the extent of regulation of entry of start-upfirms (time it takes to obtain legal status to operate a firm) Table 5 showsregression results based on freedom of the press (a subjective score from FreedomHouse) The findings are robust across data sets although the openness proxy isinsignificant in some regressions Corrupt countries are less open and regulateboth entry to the market and the press more Replacing freedom of media with abroader measure of political freedom (like the broader Gastil index also producedby Freedom House) yields qualitatively similar results9
Using the incidence of bribes from the International Crime Victim Survey as
9 I also carried out parallel regressions using a variety of other explanatory variables that provided lessrobust results Tables showing these regression results are in an appendix attached to the on-line versionof this paper at the journalrsquos website httpwwwe-jeporg A short summary of the results is that whensettler mortality is included in this sort of regression (which is used as a proxy variable for whether it wasattractive for Europeans to settle in a certain area) it cannot account for why some countries givencurrent levels of physical and human capital are more corrupt than others Countries with a Frenchlegal system or a socialist legal system tend to have more corruption although the connection is notstatistically significant in all data sets The proportion of the population identified as Catholic ispositively correlated with several corruption indicators however correlations between the proportion ofthe population that is Muslim and measures of corruption are not statistically significant The religiousand legal variables lose significance in a multiple regression with the policy variables as additionalcontrols
Table 2Corruption and Country Characteristics Human Capital
Dep variable
Control ofCorruption
(2002)
CorruptionPerception
Index(2003)
ICRGCorruption
Score(1982ndash01)
ICRGCorruption
Score(2001)
IVSCIncidenceof Bribes(2000)
Real GDP per capita (log) 060 138 087 073 003(123) (33) (20) (19) (01)
Years of schooling (log) 062 153 053 051 006(18) (52) (27) (28) (03)
Sample size 91 79 83 83 26
Notes Control of Corruption Index for 2002 from Kaufmann Kraay and Mastruzzi (2003) The index takesvalues between 25 to 25 with a higher score indicating higher corruption (rescaled) CorruptionPerception Index for 2003 from Transparency International The index takes values between 0 to 10 witha higher score indicating higher corruption (rescaled) ICRG is the International Country Risk Guidersquoscorruption indicator for 2001 (average over 12 months) The index takes values between 0 to 6 with a higherscore indicating higher corruption (rescaled) ICVS is the incidence of bribes in 2000 (share of householdsresponding they need or are expected to pay bribes in 2000) from the International Crime Victim SurveysReal GDP per capita in 1970 is from the Penn World Tables Years of schooling of the total population agedover 25 in 1970 is from Barro and Lee (2000) Robust standard errors in parenthesis statistically significant at 1 percent level statistically significant at 5 percent level statistically significant at 10 percent level
28 Journal of Economic Perspectives
the dependent variable rather than one of the subjective measures of corruptiondrastically reduces the sample size as shown in the final column of the tablesSomewhat surprisingly only GDP per capita the proxy for initial human capitalstock and regulation of the press remain significantly correlated with corruption
These associations suggest some general conclusions First corruption isclosely related to GDP per capita and to human capital These correlations areconsistent with the economic and human capital theories of institutional develop-ment but the correlations could also be driven by reverse causality or omitted
Table 3Corruption and Country Characteristics Openness
Dep variable
Control ofCorruption
(2002)
CorruptionPerception
Index(2003)
ICRGCorruption
Score(1982ndash01)
ICRGCorruption
Score(2001)
IVSCIncidenceof Bribes(2000)
Real GDP per capita (log) 067 143 090 071 006(12) (32) (21) (20) (01)
Years of schooling (log) 051 136 047 053(18) (50) (27) (28)
ImportsGDP 001 003 000 001 000(00) (01) (00) (00) (00)
Sample size 89 77 83 81 44
Notes For details on sources of data see Table 2 ImportsGDP is imports of goods and services aspercentage of GDP (average from 1980ndash2000) from World Development Indicators (2004) statistically significant at 1 percent level statistically significant at 5 percent level statistically significant at 10 percent level
Table 4Corruption and Country Characteristics Regulation of Entry
Dep variable
Control ofCorruption
(2002)
CorruptionPerception
Index(2003)
ICRGCorruption
Score(1982ndash01)
ICRGCorruption
Score(2001)
IVSCIncidenceof Bribes(2000)
Real GDP per capita (log) 070 165 079 074 005(17) (37) (24) (22) (01)
Years of schooling (log) 018 012 017 003(31) (61) (40) (34)
No of business days toobtain legal status (log)
033 098 027 034 001(09) (20) (10) (10) (01)
Sample size 61 60 61 61 35
Notes For details on sources of data see Table 2 Number of business days to obtain legal status is thetime it takes to obtain legal status to operate a firm in business days (a week has five business days anda month has 22) from Djankov La Porta Lopez de Silanes and Shleifer (2002) statistically significant at 1 percent level statistically significant at 5 percent level statistically significant at 10 percent level
Jakob Svensson 29
variables Second for a given level of income the extent of corruption still variesgreatly The cross-country evidence suggests that this variation can partly be ac-counted for by the degree of market and political competition
What is the Magnitude of Corruption
The rankings of countries as more or less corrupt are based on subjectivejudgments and as such cannot be used to quantify the magnitude of corruptionThus until recently the magnitude of corruption had to be assessed using anec-dotal or case-study evidence10 However the past few years has seen a small butgrowing body of research on identifying and quantifying corrupt behavior11
There is some firm-survey evidence on the magnitude of corruption Svensson(2003) presents survey data from Ugandan firms Although the survey was adjustedin several ways to encourage managers to report graft payments truthfully somemisreporting surely remains in the sample Nonetheless the results provide agloomy picture of entrepreneurship in one of the fastest growing countries insub-Saharan Africa in the last 10ndash15 years Over 80 percent of Ugandan firmsreported needing to pay bribes Avoiding graft comes at a cost since the 20 percent
10 As an example in this journal see McMillan and Zoido (2004) They use recorded bribe transactionsof and by Perursquos former secret-police chief Montesinos and find that Montesinos paid television-channelowners 100 times in bribes what he paid judges and politicians Using a revealed preference argumentthey conclude that news media consistent with the cross-country evidence discussed above are thestrongest check on the governmentrsquos power11 Again the focus of this paper is on public corruption There is a related literature on privatecorruption or collusion (for instance McAfee 1992 Porter and Zona 1993 Duggan and Levitt 2002)There is also a related literature on the value of political connectedness (for instance Fisman 2001Khwaja and Mian 2004)
Table 5Corruption and Country Characteristics Freedom of Media
Dep variable
Control ofCorruption
(2002)
CorruptionPerception
Index(2003)
ICRGCorruption
Score(1982ndash01)
ICRGCorruption
Score(2001)
IVSCIncidenceof Bribes(2000)
Real GDP per capita (log) 055 129 081 068 006(11) (31) (20) (19) (01)
Years of schooling (log) 065 097 018 022(12) (59) (28) (36)
Freedom of media index 005 010 006 005 001(02) (06) (03) (03) (00)
Sample size 91 79 83 83 44
Notes For details on sources of data see Table 2 Freedom of media index is the average score of the fourcriteria ldquoLaws and regulations that influence media contentrdquo ldquoPolitical pressures and controls on mediacontentrdquo ldquoEconomic influences over media contentrdquo ldquoRepressive actionsrdquo for print and broadcastmedia average over 1994ndash2001 from the Freedom House
30 Journal of Economic Perspectives
of firms reporting that they had not paid had also chosen to minimize contacts withthe public sector Of the graft-paying firms graft on average corresponds toroughly 8 percent of total costs
Corruption is also widespread in public procurement and service deliveryprograms In another study in Uganda Reinikka and Svensson (2004a) examine apublic education program that offered a per-student grant to cover nonwageexpenditures in primary schools To estimate the magnitude of corruption ordiversion of funds they compared the flows disbursed from the central governmentto the school districts with survey data from 250 schools on the actual receipts ofcash and in-kind school material Over the period 1991ndash1995 schools received only13 percent of central government spending on the program Most schools receivednothing and the evidence suggests that the bulk of the grants was captured by localgovernment officials and politicians Subsequent studies have indicated that thesituation is similar in other sub-Saharan African countries (Reinikka and Svensson2004a) Olken (2003 2004) using a similar methodology finds that 29 percent offunds allocated to a road building project and 18 percent of subsidized rice in alarge antipoverty program in Indonesia were stolen
Price comparisons can be another fruitful method to infer the magnitude ofcorruption Di Tella and Schargrodsky (2003) compare prices paid for basichomogeneous inputs at public hospitals in the city of Buenos Aires They show thatprices paid fell by 15 percent during the first nine months of a crackdown oncorruption in 1996ndash1997 providing a lower bound of corruption in procurementin Buenos Aires hospitals in the late 1990s Hsieh and Moretti (2005) estimate theextent of underpricing of Iraqi oil during the United Nations Oil for Food Programby comparing the gap between the official selling price and various estimates of themarket price of Iraqi oil during and prior to the program They argue thatunderpricing was a way for the Iraq regime to obtain illegal kickbacks from oilbuyers and estimate that Iraq collected $1 to $4 billion in bribes from 1997 to 2001or about 2ndash10 percent of the total amount spent under the auspices of theprogram
The literature on quantifying and identifying corruption is still at its infancyThe existing contributions are scattered and often context specific Still theliterature conveys that corruption can be quantified in a variety of ways As morestudies and data points become available one should also be able to say somethingconvincingly about aggregate corruption As of now the studies discussed abovesuggest a huge variation in corruption ranging from a few percent in the Oil forFood Program that affected Iraq to 80 percent in the primary education programin Uganda When comparing numbers it is important to keep in mind that moststudies do not claim to capture all corruption within the program or sectors Forexample the hospital procurement study in Argentina estimates the extent ofcorruption affected by an increase in monitoring and Hsieh and Moretti (2005)note that there likely were other irregularities in the Oil for Food Program thatallowed Iraq to siphon funds from the program
How do these micro findings on the magnitude of corruption relate to themacro literature on the institutional determinants of corruption Here the
Eight Questions about Corruption 31
evidence is even more limited For example in the study discussed above Reinikkaand Svensson (2004) estimate the extent of corruption in a national school grantprogram and argue that economic development here conceptualized as the com-munityrsquos ability to organize and exercise voice affects the local governmentrsquosincentives for corrupt actions This hypothesis is confirmed in the data schools inbetter-off communities controlling for other community and school-specific fixedeffects experience a significantly lower degree of corruption and the size of theeffect is economically important
Di Tella and Schargrodsky (2003) and Svensson (2003) also relate quantitativemeasures of corruption to policy In a cross-section of Ugandan firms Svenssonfinds that the incidence of corruption is highly correlated with the extent to whichrules and regulations give public officials the bargaining rights to extort bribepayments from firms The level of reported graft payment on the other hand isdriven by firm-specific factors suggesting that corrupt officials condition theirbribe requests on the firmrsquos ability to pay bribes An implication of this finding isthat research on corruption should focus not only on the macro question of howinstitutional frameworks affect corruption but also on the micro question of howcorruption varies across a given institutional framework
Do Higher Wages for Bureaucrats Reduce Corruption
Aid donors and international organizations routinely recommend fightingcorruption by paying higher wages to public servants As a historical example of thispolicy Sweden which ranks among the least corrupt countries on all currentcross-country rankings was considered as one of the most corrupt countries inEurope in the seventeenth and eighteenth centuries Increased remuneration ofcivil servants combined with deregulation have been put forward as importantexplanations for the emergence of an honest and competent public administrationin Sweden in the late nineteenth century (Lindbeck 1975)
The analytical underpinning to the policy recommendation to increase publicsector wages stems from a seminal paper by Becker and Stigler (1974) who showthat by paying the official a wage above the officialrsquos opportunity wage one canensure under certain conditions that the official will behave honestly Howeverwhen the bribe level is not fixed and third-party enforcement does not exist thetheoretical relationship becomes ambiguous For example if the official andbribe-giver bargain over the bribe a higher wage strengthens the officialrsquos bargain-ing power as it raises the expected cost of being corrupt and thus leads to higherbribes (Mookherjee and Png 1995)
The systematic evidence on the relationship between pay and corruption isambiguous In cross-country studies Rauch and Evans (2000) and Treisman (2000)find no robust evidence that higher wages deter corruption while Van Rijckeghemand Weder (2001) find that it does These cross-country studies however arefraught with problems Measuring the extent of corruption using rankings isproblematic It is difficult to tell whether higher wages are a function of low
32 Journal of Economic Perspectives
corruption or vice versa In addition these studies have aggregate data on wages sothat the data on corruption and the data on wages may refer to different groups ofindividuals
Di Tella and Schargrodsky (2003) avoid most of these problems in their studyof how a crackdown on corruption in Buenos Aires affected the procurementpolicies of public hospitals They divide the 19 months of data into three distinctperiods a period with low high and intermediate audit intensity from the citygovernment Linking the wage premiummdashthe difference between the procure-ment officerrsquos wage and an estimated opportunity wagemdashto the price paid for a setof homogeneous hospital inputs they conclude that higher wages have a negativeand quantitatively important effect on procurement prices but only when auditintensity takes intermediate levels These results are not indisputable in particularthere is some concern that variation in the wage premium is driven primarily byvariation in the determinants of the opportunity wagemdashand these determinantsmay have a direct bearing on the incentives for corrupt behaviour Still the findingsprovide fairly convincing evidence that paying higher wages can deter corruptionunder certain circumstances
Should countries facing a high level of corruption react with a policy of higherwages for bureaucrats Many poor developing countries with widespread corrup-tion probably lack the third-party enforcement assumed in Becker and Stigler(1974) or the outside audits examined in Di Tella and Schargrodsky (2003) Yet theeffectiveness of anticorruption wage policies hinges on the existence of an honestthird party that can monitor the agent Similarly Besley and McLaren (1993) showthat paying high wages maximizes tax revenues only when the share of dishonestemployees available to the government is high and the monitoring apparatus iseffective
Thus wage incentives can reduce bribery but only under certain conditionsThis strategy requires a well-functioning enforcement apparatus the bribe beingoffered (or demanded) must not be a function of the officialrsquos wage and the costof paying higher wages must not be too high In many poor developing countrieswhere corruption is institutionalized these requirements appear unlikely to hold
Can Competition Reduce Corruption
Another common approach to control corruption is to increase competitionamong firms One argument is that as firmsrsquo profits are driven down by competitivepressure there are no excess profits from which to pay bribes (Ades and Di Tella1999) In reality however the connections between competition profits andcorruption are complex and not always analytically clear
For example Bliss and Di Tella (1997) construct a model where public officialshave the power to extract rents from firms In the model corruption does not needany pre-existing rents or imperfect competition since the excess profits from whichto pay bribes may be created by the official by inducing exit The level of graftdemanded per firm depends on the likelihood that firms in the market are more
Jakob Svensson 33
or less likely to exit due to a marginal increase in graft demand not on the numberof firms in the market or the degree of ldquonaturalrdquo competition
What then can account for the positive relationship between corruption andregulation of markets discussed above One plausible mechanism has to do withbureaucratic powers Government regulations that raise barriers to entry are oftenenacted because they give public officials the power to demand and collect bribes(De Soto 1989 Shleifer and Vishny 1993) Thus deregulation may reduce cor-ruption not so much by increasing competition but by reducing the extent towhich public officials have the power to extract bribes
At least in theory increased competition at the level of the official receivingthe bribes may also reduce corruption (Rose-Ackerman 1978) When officialsdispense a government-produced good such as a passport the existence of acompeting official to reapply to in case of being asked for a bribe will bid down theequilibrium amount of corruption (Shleifer and Vishny 1993) However there isas yet no convincing empirical evidence that competition among officials actuallyreduces corruption Moreover the mechanism will only work if the multipleofficials can individually produce the good If multiple officials must sign off on thegood each with the power to stop a project extremely high bribe levels may result
In public service delivery competition may not necessarily lead to lowercorruption12 Consider a parent in Uganda faced with the diversion of public fundsfrom schools Such parents have two choices voice and exit (Hirschman 1970)That is they can either voice a complaint with some formal or informal authorityor they can send their children to some other school (or have them drop out ofschool altogether) But if parents react to public corruption through exit and bysending their children to competing schools the likelihood of voice as the responseto corruption is reducedmdashand corrupt local officials may be able to extract an evengreater share of the schoolrsquos entitlements A variety of evidence suggests thatincreased competition due to deregulation and simplifications of rules and laws isnegatively correlated with corruption But it can be a difficult task to strike the rightbalance between enacting and designing beneficial rules and laws to constrainprivate misconduct while also limiting the possibilities that such laws open the doorfor public corruption (Djankov Glaeser La Porta Lopez-de-Silanes and Shleifer2003)
Why Have There Been So Few (Recent) Successful Attempts ToFight Corruption
Most anticorruption programs rely on legal and financial institutionsmdashjudiciary police and financial auditorsmdashto enforce and strengthen accountabilityin the public sector The tacit assumption is that more and better enforcement of
12 There is a large literature on school competition in developed countries focusing on other implica-tions of competition As a starting point see Hoxby (2003) or the exchange between Ladd (2002) andNeal (2002) in this journal
34 Journal of Economic Perspectives
rules and regulations will reduce corruption However in many poor countries thelegal and financial institutions are weak and often corrupt themselves In such asetting providing more resources to enforcement institutions may not be the rightsolution to the problem of corruption An illustrative example is given in Hay andShleifer (1998) When the elite units of the Russian police obtained more advancedguns to combat crime they simply sold these guns to the mafia at higher prices thanthe previous less powerful weapons could fetch
To date little evidence exists that devoting additional resources to the existinglegal and financial government monitoring institutions will reduce corruptionHong Kong and Singapore are the most cited exceptions In both countries thereduction in corruption went hand in hand with the establishment and strength-ening of an independent anticorruption agency with widespread powers Forexample in Hong Kong the Independent Commission Against Corruption createdlegal precedents such as ldquoguilty until proven innocentrdquo (Klitgaard 1988 UNDP1997) However the same types of anticorruption agencies have in many othercountries been used as an instrument of repression against political opponents notto fight corruption Why then did they work in Hong Kong and Singapore In thosecountries several reforms were implemented simultaneously with the strengthen-ing of the enforcement agencies For example in Singapore civil servantsrsquo payrelative the private sector increased substantially public officials were routinelyrotated to make it harder for corrupt official to develop strong ties to certainclients rewards were given to those who refused bribes and turned in the clientand importantly rules and procedures were simplified and often published per-mits and approvals were scrapped and fees (including import duties) were loweredor removed In both Hong Kong and Singapore the top political leadership wascommitted to fighting corruption In many developing countries this commitmentcannot be taken for granted
Alternative approaches to fighting corruption exist One method is to replacepublic with private enforcement of public laws through lawsuits at least for a time(Hay and Shleifer 1998) But litigation just as deregulation has its limitationsAnother complementary approach turns to citizen enforcement by providing easypublic access to information on the workings of public programs This informationenables citizens to demand certain standards to monitor service quality and tochallenge abuses by officials
Some data suggests that improving citizen access to information and givingcitizens a greater right to action can reduce corruption As discussed above in themid-1990s a survey revealed that primary schools in Uganda received only a smallfraction of the funds allocated to them by the central government As this evidencebecame known the central government began to publish newspaper accounts ofmonthly transfers of the capitation grants to districts so that school staff andparents could monitor local officials Reinikka and Svensson (2004b) find that thenewspaper campaign brought a large improvement In 2001 schools received anaverage of 80 percent of their annual entitlements
How can one estimate the causal effects of improved access to public infor-mation Reinikka and Svensson (2004b) employ a two-step procedure First they
Eight Questions about Corruption 35
use a simple test administered to head teachers to measure knowledge of theprogram Second they measure the distance to the nearest newspaper outlet fromthe school They find that head teachers in schools closer to a newspaper outletknow more about the rules governing the grant program and the timing of releaseof funds by the central government Using distance as an instrument they show thatthe more informed schools experienced a dramatic reduction in the share of fundscaptured by corruption Importantly prior to the newspaper campaign proximityto a newspaper outlet and changes in capture were uncorrelated
The success of the newspaper campaign happened in a particular context Theprogram was a simple entitlement program which made monitoring easier andparents and school staff in Uganda had institutions already in place to handlecollective decisionmaking But in general citizen enforcement or grass-root mon-itoring are subject to possibly large free-riding problems (Olken 2004) At the sametime grass-root monitoring initiatives are becoming increasingly popular in manyplaces Examples include participatory budgeting in Porto Allegre Brazil citizenreport cards in Bangalore India and right to information on public works andpublic hearings or jan sunwais in Rajasthan India Although there is no robustscientific evidence yet on the impact of these initiatives the preliminary evidencesuggests that corruption has been dramatically reduced
Yet another strategy to fight corruption is delegation or hiring integrity fromthe private sector In the past two decades over 50 developing countries have hiredprivate (international) firms to conduct preshipment inspection of imports and infew cases also handed over the responsibility for collecting customs duties (Yang2005) Preshipment inspection can reduce customs corruption in various ways forexample it improves the monitoring ability of higher-level enforcers and it gen-erates independent information on the contents of a shipment that could increasethe importerrsquos bargaining power vis-a-vis a corrupt customs officer Yang finds thatpreshipment programs are associated with increases in the growth rate of importduties of 6 to 8 percentage points annually The preshipment programs areaccompanied by an increase in imports (possibly due to reductions in importersrsquobribe payments) and a decline in measures of misreporting in customs
Does Corruption Adversely Affect Growth
Corruption could conceivably have a positive effect on economic growth Theproponents of ldquoefficient corruptionrdquo claim that bribery may allow firms to getthings done in an economy plagued by bureaucratic hold-ups and bad rigid laws(Leff 1964 Huntington 1968) A system built on bribery for allocating licenses andgovernment contracts may lead to an outcome in which the most efficient firms willbe able to afford to pay the highest bribes (Lui 1985) However these argumentstypically take the distortions circumvented by the corrupt actions as given In mostcases distortions and corruption are caused by or are symptoms of the same setof underlying factors As Myrdal (1968) pointed out corrupt officials may not
36 Journal of Economic Perspectives
circumvent distortions but instead actually cause greater administrative delays toattract more bribes
In most theories that link corruption to slower economic growth the corruptaction by itself does not impose the largest social cost Instead the primary sociallosses of corruption come from propping up of inefficient firms and the allocationof talent technology and capital away from their socially most productive uses(Murphy Shleifer and Vishny 1991 1993) When profits or potential profits aretaken away from firms through corruption entrepreneurs choose not to start firmsor to expand less rapidly Entrepreneurs may also choose to shift part or all of theirsavings toward the informal sector or to organize production in a way that the needor demand for public services is minimized Moreover if entrepreneurs expect theywill be forced to bargain over bribes in the future they have incentives to adoptinefficient ldquofly-by-nightrdquo technologies of production with an inefficiently highdegree of reversibility which allows them to react more flexibly to future demandsfrom corrupt officialsmdashand more credibly threaten to shut down operations (Choiand Thum 1998 Svensson 2003)
Corruption also affects the allocation of entrepreneurial skills When corrup-tion is widespread and institutionalized some firms may devote resources toobtaining valuable licenses and preferential market access while others focus onimproving productivity (Murphy Shleifer and Vishny 1991) In the extreme it maybe financially more rewarding for an entrepreneur to leave the private sectoraltogether and instead become a corrupt public official
What does the evidence say The micro and case study evidence tend tosupport to the theoretical predictions laid out above but the macro evidence isinconclusive
Bates (1981) for example shows that in many sub-Saharan African countriespeasant farmers avoided corruption by taking refuge in subsistence productionwith a consequent subsequent decline in productivity and living standards Manyformal sector firms on the other hand specialized in securing special advantagesthat they were unable to secure by competing in the marketplace De Soto (1989)documents similar effects in Peru where high start-up costs due to regulatoryconstraints and corruption forced entrepreneurs to establish new firms under-ground and on a smaller scale
Does corruption affect firmsrsquo choice of technology and the allocation of talentExploiting firm-level capital stock data on reported resale and replacement valuesSvensson (2003) provides evidence suggesting that the amount of bribes a firmneeds to pay is negatively correlated with the degree of reversibility of the capitalstockmdasha result consistent with the ldquofly-by-nightrdquo hypothesis discussed above Fis-manrsquos (2001) findings on political connectedness in Indonesia suggest that somefirms do specialize in corruption and rent seeking as means of growth and Khwajaand Mianrsquos (2004) results on borrowing and default rates of politically connectedfirms in Pakistan suggest that one of the reasons politicians start firms or joinexisting ones is that it enables them to capture public resources throughcorruption
Specialization in corruption also occurs in the public sector Wadersquos (1982)
Jakob Svensson 37
vivid account of corruption in the canal irrigation department in a south Indianstate describes how some irrigation engineers raise vast amounts in bribes from thedistribution of water and contracts and redistribute part to superior officers andpoliticians The system of corruption is institutionalized and there is even asecond-hand market for posts that provide the holder an opportunity to extractbribes Thus politicians and senior officers are able to obtain for themselves partof the engineersrsquo income from corruption by auctioning available posts Moreoverthose specializing in corruptionmdashand thereby able to earn many times their annualofficial income though bribesmdashwill be able to outbid other contenders less able orless inclined to exploit their official powers to extract bribes In this examplecompetition results in higher corruption
Micro studies on corruption have also yielded insights about the long-run costof corruption Reinikka and Svensson (2005) building on the Ugandan newspapercampaign study by Reinikka and Svensson (2004b) find that the reduction incorruption caused by the information campaign had a significant and economicallylarge effect on school enrollment and academic achievement To the extent thathuman capital accumulation drives long-run growth the results suggest an impor-tant mechanism through which corruption can hurt growth Social service deliveryin developing countries is often plagued by corruption of a variety of formsmdashbribesare charged for services to be provided and public funds are embezzled Corrup-tion is therefore a leading candidate to explain why the impact of public spendingon growth and social welfare has been so disappointingly low in many countries
Some suggestive evidence also exists on the relationship between corruptionand growth at the firm level Fisman and Svensson (2001) use firm-survey data onthe estimated bribe payments of Ugandan firms to study the relationship betweenbribery payments taxes and firm growth over the period 1995ndash1997 Usingindustry-location averages to circumvent the potential problem of endogeneitythey find that both the rate of taxation and bribery are negatively correlated withfirm growth For the full data set a one percentage point increase in the briberyrate is associated with a reduction in firm growth of three percentage points aneffect that is about three times greater than that of taxation
What about the macro evidence Mauro (1995) is the first attempt to study therelationship between corruption and growth in a large cross-section of countriesContrary to what is sometimes claimed Mauro does not find robust evidence of alink between corruption and growth although a broader measure of bureaucraticefficiency is correlated with investment and growth In Table 6 I updated Maurorsquoscalculations I ran regressions with economic growth (over the period 1980ndash2000)as dependent variable and corruption (the International Country Risk Guidersquoscorruption indicator averaged over 1982ndash2000) initial GDP per capita and humancapital as the explanatory variables The estimated coefficient on corruption in thisregression is negativemdashthat is less corruption is correlated with higher growthmdashbut it is not significantly different from zero I then added broad range of explan-atory variables that have been suggested in the growth literature but the coefficienton corruption remained insignificantly correlated with growth Exploiting thepanel dimension that is using five-year averages for corruption and growth and
38 Journal of Economic Perspectives
country-specific fixed effects to control for time-invariant country characteristicsalso yields insignificant results13
This finding seems to lead to a puzzle Most of the theoretical literature as well ascase study and micro evidence suggest that corruption severely retards developmentHowever to the extent we can measure corruption in a cross-country setting it doesnot affect growth The puzzle may arise from econometric problems involved inestimating the effects of corruption on growth using cross-country data For examplethe difficulties of measuring corruption may include omitted variables like the extentof market regulation and reverse causality like whether modernization and rapidgrowth may increase corruption as Huntington (1968) argued Another plausibleexplanation for the mismatch between the micro and macro evidence is that corrup-tion takes many forms and there is no reason to believe that all types of corruption areequally harmful for growth Existing data however are by and large too coarse toexamine different types of corruption in a cross-section of countries
Conclusion
In this paper I posed eight questions about corruption The answers are oftennot clear-cut and there are many issues about corruption we simply know too littleabout As the study of corruption evolves three areas are of particular importance
13 Using the two other subjective corruption indicators yields in some specifications a statisticallysignificant negative effect of corruption on growth However these indicators are measured at the endof the sample period thus making it even more difficult to draw causal interpretations from corruptionto growth
Table 6Growth and Corruption
Growth(1980ndash2000)
Growth(1980ndash2000)
Dep variable Ordinary least squares Fixed effects
Real GDP per capita (log) 082 650(47) (103)
Years of schooling (log) 186 663(66) (136)
Corruption 033 011(24) (24)
Countries 85 86Observations 85 335
Notes For details on sources of data see Table 2 Growth is growth in real GDP per capita overthe period 1980ndash2000 in specification (1) and growth in real GDP per capita over the periods1981ndash1985 1986ndash1990 1991ndash1995 1996ndash2000 in specification (2) Real GDP per capita andyears of schooling are measured at the start of the sample period (in 1980 for specification (1)and in 1980 85 90 95 for specification (2)) Corruption is the International Country RiskGuidersquos corruption indicator average for 1982ndash2000 in specification (1) and average over1982ndash1985 1986ndash1990 1991ndash1995 1996ndash2000 in specification (2)
Eight Questions about Corruption 39
First and most urgently scant evidence exists on how to combat corruptionBecause traditional approaches to improve governance have produced ratherdisappointing results experimentation and evaluation of new tools to enhanceaccountability should be at the forefront of research on corruption
Second the differential effect of corruption is an important area for researchFor example China has been able to grow fast while being ranked among the mostcorrupt countries Is corruption less harmful in China Or would China have growneven faster if corruption was lower These types of questions have received someattention but more work along what context and type of corruption matters islikely to be fruitful
Finally the link between the macro literature on how institutions provide amore-or-less fertile breeding ground for corruption and the micro literature onhow much corruption actually occurs in specific contexts is weak As more forms ofcorruption and techniques to quantify them at the micro level are developed itshould be possible to reduce this mismatch between macro and micro evidence oncorruption
y I am grateful for comments and suggestions by Nicola Gennaioli Assar Lindbeck TorstenPersson and David Stromberg as well as editors James Hines Andrei Shleifer Timothy Taylorand Michael Waldman The views expressed here do not represent the official opinion of theWorld Bank
References
Acemoglu Daron James A Robinson and Si-mon Johnson 2001 ldquoThe Colonial Origins ofComparative Development An Empirical Inves-tigationrdquo American Economic Review December91 pp 1369ndash401
Acemoglu Daron Simon Johnson and JamesA Robinson 2004 ldquoInstitutions as the Funda-mental Cause of Long-Run Growthrdquo Manu-script MIT
Ades Alberto and Rafael Di Tella 1999ldquoRents Competition and Corruptionrdquo AmericanEconomic Review 894 pp 982ndash93
Albouy David 2004 ldquoThe Colonial Origins ofComparative Development A Reinvestigation ofthe Datardquo Mimeo UC Berkeley
Bardhan Pranab 1997 ldquoCorruption and De-velopment A Review of Issuesrdquo Journal of Eco-nomic Literature 353 pp 1320ndash346
Becker Gary and George Stigler 1974 ldquoLawEnforcement Malfeasance and the Compensa-
tion of Enforcersrdquo Journal of Legal Studies 31pp 1ndash19
Besley Timothy and Robin Burgess 2002ldquoThe Political Economy of Government Respon-siveness Theory and Evidence From IndiardquoQuarterly Journal of Economics 1174 pp 1415ndash451
Besley Timothy and John McLaren 1993ldquoTaxes and Bribery The Role of Wage Incen-tivesrdquo Economic Journal 103416 pp 119ndash41
Bliss Christopher and Rafael Di Tella 1997ldquoDoes Competition Kill Corruptionrdquo Journal ofPolitical Economy 1055 pp 1001ndash023
Boycko Maxim Andrei Shleifer and RobertVishny 1995 Privatizing Russia CambridgeMass MIT Press
Brunetti Aymo and Beatrice Weder 2003 ldquoAFree Press is Bad News for Corruptionrdquo Journalof Public Economics 877ndash8 pp 1801ndash824
Choi Jay P and Marcel P Thum 1998 ldquoThe
40 Journal of Economic Perspectives
Economics of Repeated Extortionrdquo ColumbiaUniversity Working Paper No 9899-03
De Soto Hernando 1989 The Other Path NewYork Harper and Row
Demsetz Harold 1967 ldquoTowards a Theory ofProperty Rightsrdquo American Economic Review 572pp 61ndash70
Di Tella Rafael and Ernesto Schargrodsky2003 ldquoThe Role of Wages and Auditing during aCrackdown on Corruption in the City of BuenosAiresrdquo Journal of Law and Economics 461pp 269ndash92
Djankov Simeon Edward Glaeser Rafael LaPorta Florencio Lopez-de-Silanes and AndreiShleifer 2003 ldquoThe New Comparative Econom-icsrdquo Journal of Comparative Economics 314pp 595ndash619
Djankov Simeon Rafeal La Porta FlorencioLopez-De-Silanes and Andrei Shleifer 2002ldquoThe Regulation of Entryrdquo Quarterly Journal ofEconomics 1171 pp 1ndash37
Duggan Mark and Steven D Levitt 2002ldquoCorruption in Sumo Wrestlingrdquo American Eco-nomic Review 925 pp 1594ndash605
Fisman Raymond 2001 ldquoEstimating theValue of Political Connectionsrdquo American Eco-nomic Reviev 914 pp 1095ndash102
Fisman Raymond and Jakob Svensson 2001ldquoAre Corruption and Taxation Really Harmfulto Growth Firm Level Evidencerdquo ManuscriptIIES Stockholm University
Glaeser Edward Rafael La Porta FlorencioLopez-de-Silanes and Andrei Shleifer 2004 ldquoDoInstitutions Cause Growthrdquo Journal of EconomicGrowth 93 pp 271ndash303
Harstad Bard and Jakob Svensson 2004ldquoBribes Lobbying and Developmentrdquo MimeoIIES Stockholm University
Hay Jonathan and Andrei Shleifer 1998 ldquoPri-vate Enforcement of Public Laws a Theory ofLegal Reformrdquo American Economic Reviev 882pp 398ndash403
Hirschman Albert O 1970 Exit Voice andLoyalty Responses to Decline in Firms Organizationsand States Cambridge Mass Harvard UniversityPress
Hoxby Caroline 2003 ldquoSchool Choice andSchool Productivity Could School Choice be aTide that Lifts All Boatsrdquo in The Economics ofSchool Choice Caroline Hoxby ed Chicago Uni-versity of Chicago Press pp 287ndash342
Huntington Samuel P 1968 Political Order inChanging Societies New Haven Yale UniversityPress
Jacob Brian and Steven D Levitt 2003 ldquoRot-ten Apples An Investigation of the Prevalenceand Predictors of Teacher Cheatingrdquo QuarterlyJournal of Economics 1183 pp 843ndash77
Kaufmann Daniel Aart Kraay and MassimoMastruzzi 2003 ldquoGovernance Matters III Gov-ernance Indicators for 1996ndash2002rdquo World BankPolicy Research Working Paper No 3106 Wash-ington DC
Khwaja Asim I and Atif Mian 2004 ldquoDoLenders Favor Politically Connected Firms RentProvision in an Emerging Financial MarketrdquoManuscript Kennedy School of GovernmentHarvard University
Kinzer Stephen 1999 ldquoThe Turkish QuakersquosSecret Accomplice Corruptionrdquo New York TimesAugust 29 sec 4 p 3
Klitgaard Robert 1988 Controlling CorruptionBerkeley Calif University of California Press
Knack Stephen and Philip Keefer 1995 ldquoIn-stitutions and Economic Performance Cross-Country Tests Using Alternative InstitutionalMeasuresrdquo Economics and Politics 73 pp 207ndash27
La Porta Rafael Florencio Lopez-de-SilanesAndrei Shleifer and Robert Vishny 1998 ldquoLawand Financerdquo Journal of Political Economy 106pp 1113ndash155
La Porta Rafael Florencio Lopez-de-SilanesAndrei Shleifer and Robert Vishny 1999 ldquoTheQuality of Governmentrdquo Journal of Law Econom-ics and Organization 151 pp 222ndash79
Ladd Helen 2002 ldquoSchool Vouchers A Crit-ical Viewrdquo Journal of Economic Perspectives 164pp 3ndash24
Landes David 1998 The Wealth and Poverty ofNations New York NY W W Norton
Leff Nathanial H 1964 ldquoEconomic Develop-ment through Bureaucratic Corruptionrdquo Ameri-can Behavioral Scientist 822 pp 337ndash41
Lindbeck Assar 1975 Swedish Economic PolicyLondon MacMillan Press
Lipset Seymour M 1960 Political Man TheSocial Basis of Modern Politics New York Doubleday
Lui Francis T 1985 ldquoAn Equilibrium Queu-ing Model of Briberyrdquo Journal of Political Economy934 pp 760ndash81
Mauro Paolo 1995 ldquoCorruption andGrowthrdquo Quarterly Journal of Economics 110pp 681ndash712
McAfee R Preston 1992 ldquoBidding RingsrdquoAmerican Economic Review 823 pp 681ndash711
McMillan John and Pablo Zoido 2004 ldquoHowto Subvert Democracy Montesinos in PerurdquoJournal of Economic Perspectives 184 pp 69ndash92
Mookherjee Dilip and I P L Png 1995ldquoCorruptible Law Enforcers How Should TheyBe Compensatedrdquo Economic Journal 105pp 145ndash59
Murphy Kevin Andrei Shleifer and RobertVishny 1991 ldquoThe Allocation of Talent Impli-cations for Growthrdquo Quarterly Journal of Econom-ics 106 pp 503ndash30
Jakob Svensson 41
Murphy Kevin Andrei Shleifer and RobertVishny 1993 ldquoWhy is Rent-seeking so Costly toGrowthrdquo American Economic Review 832pp 409ndash14
Myrdal Gunnar 1968 Asian Drama NewYork Random House
Neal Derek 2002 ldquoHow Vouchers CouldChange the Market for Educationrdquo Journal ofEconomic Perspectives 164 pp 24ndash44
North Douglass C and Robert P Thomas1973 The Rise of the Western World A New EconomicHistory Cambridge UK Cambridge UniversityPress
Olken Benjamin 2003 ldquoCorruption and theCosts of Redistribution Micro Evidence fromIndonesiardquo Manuscript Harvard University
Olken Benjamin 2004 ldquoMonitoring Corrup-tion Evidence from a Field Experiment in Indo-nesiardquo Manuscript Harvard University
Pearce Justin 2002 ldquoIMF Angolarsquos rsquomissingmillionsrsquordquo BBC News October 18 Available athttpnewsbbccouk2hiafrica2338669stm
Persson Torsten and Guido Tabellini 2004ldquoConstitutions and Economic Policyrdquo Journal ofEconomic Perspectives 181 pp 75ndash98
Porter Robert H and J Douglas Zona 1993ldquoDetection of Bid Rigging in ProcurementAuctionsrdquo Journal of Political Economy 1013pp 518ndash38
ldquoPublic Inquiry into Kenya Gold Scamrdquo 2003BBC News March 14 Available at httpnewsbbccouk1hibusiness2851519stm
Rauch James and Peter Evans 2000 ldquoBureau-cratic Structure and Bureaucratic Performancein Less Developed Countriesrdquo Journal of PublicEconomics 751 pp 49ndash71
Reinikka Ritva and Jakob Svensson 2004aldquoLocal Capture Evidence from a Central Gov-ernment Transfer Program in Ugandardquo Quar-terly Journal of Economics 1192 pp 679ndash705
Reinikka Ritva and Jakob Svensson 2004bldquoThe Power of Information Evidence from aNewspaper Campaign to Reduce CapturerdquoManuscript IIES Stockholm University
Reinikka Ritva and Jakob Svensson 2005ldquoFighting Corruption to Improve Schooling Ev-
idence from a Newspaper Campaign inUgandardquo Journal of European Economic AssociationForthcoming
Rose-Ackerman Susan 1978 Corruption AStudy in Political Economy New York AcademicPress
Rose-Ackerman Susan 1999 Corruption andGovernment Causes Consequences and Strategies forReform Cambridge Cambridge University Press
Rose-Ackerman Susan 2004 ldquoGovernanceand Corruptionrdquo in Global Crises Global SolutionsB Lomborg ed Cambridge Cambridge Univer-sity Press chapter 6
Sachs Jeffrey D and Andrew M Warner1995 ldquoEconomic Reform and the Process ofGlobal Integrationrdquo Brookings Papers on EconomicActivity 1 pp 1ndash118
Shleifer Andrei and Robert Vishny 1993ldquoCorruptionrdquo Quarterly Journal of Economics1083 pp 599ndash617
Svensson Jakob 2003 ldquoWho Must Pay Bribesand How Muchrdquo Quarterly Journal of Economics1181 pp 207ndash30
Transparency International 2004 Global Cor-ruption Report 2004 London Pluto Press
Treisman Daniel 2000 ldquoThe Causes of Cor-ruption A Cross-National Studyrdquo Journal of Pub-lic Economics 763 pp 399ndash457
UNDP 1997 ldquoCorruption and Good Gover-nancerdquo Discussion Paper No 3 ManagementDevelopment and Governance Division
Van Rijckeghem Caroline and BeatriceWeder 2001 ldquoBureaucratic Corruption and theRate of Temptation Do Wages in the Civil Ser-vice Affect Corruption and by How Muchrdquo Jour-nal of Development Economics 652 pp 307ndash31
Wade Robert 1982 ldquoThe System of Adminis-trative and Political Corruption Canal Irrigationin South Indialdquo Journal of Development Studies183 pp 287ndash328
Yang Dean 2005 ldquoIntegrity for Hire AnAnalysis of a Widespread Program for Combat-ing Customs Corruptionrdquo Manuscript Gerald RFord School of Public Policy University of Mich-igan
42 Journal of Economic Perspectives
Appendix Table 1Corruption and Country Characteristics Settler Mortality
Dep variable
Control ofCorruption
(2002)
CorruptionPerception
Index(2003)
ICRGCorruption
Score(1982ndash2001)
ICRGCorruption
Score(2001)
IVSCIncidenceof Bribes(2000)
Real GDP per capita (log) 042 079 075 053 005(20) (47) (24) (22) (04)
Years of schooling (log) 040 103 011 064(33) (82) (35) (42)
Mortality (log) 020 058 027 002 003(17) (41) (16) (13) (03)
Sample size 47 42 47 47 9
Notes For details on sources of data see Table 2 in main text Mortality is settler mortality between1604ndash1848 from Acemoglu Robinson and Johnson (2001)
Appendix Table 2Corruption and Country Characteristics Socialist Legal System
Dep variable
Control ofCorruption
(2002)
CorruptionPerception
Index(2003)
ICRGCorruption
Score(1982ndash2001)
ICRGCorruption
Score(2001)
IVSCIncidenceof Bribes(2000)
Real GDP per capita (log) 060 125 088 068 006(12) (32) (21) (20) (01)
Years of schooling (log) 066 183 049 060(18) (51) (28) (29)
Socialist legal system 045 219 032 078 005(12) (47) (20) (23) (03)
Sample size 91 79 83 83 44
Notes For details on sources of data see Table 2 Socialist legal system is a binary variable (0 1)indicating if the legal origin of the company law or commercial code is socialist (1) from La PortaLopez de Silanes Shleifer and Vishny (1999)
Journal of Economic PerspectivesmdashVolume Number mdashmdashPages
Appendix Table 3Corruption and Country Characteristics French Legal System
Dep variable
Control ofCorruption
(2002)
CorruptionPerception
Index(2003)
ICRGCorruption
Score(1982ndash2001)
ICRGCorruption
Score(2001)
IVSCIncidenceof Bribes(2000)
Real GDP per capita (log) 075 172 103 077 006(12) (32) (18) (20) (01)
Years of schooling (log) 032 075 014 040(21) (60) (28) (33)
French legal system 052 138 067 019 002(16) (41) (19) (23) (04)
Sample size 91 79 83 83 44
Notes For details on sources of data see Table 2 French legal system is a binary variable (0 1) indicatingif the legal origin of company law or commercial code is French (1) from La Porta Lopez de SilanesShleifer and Vishny (1999)
Appendix Table 4Corruption and Country Characteristics Muslim(percentage of population)
Dep variable
Control ofCorruption
(2002)
CorruptionPerception
Index(2003)
ICRGCorruption
Score(1982ndash2001)
ICRGCorruption
Score(2001)
IVSCIncidenceof Bribes(2000)
Real GDP per capita (log) 061 133 085 071 006(12) (34) (21) (20) (01)
Years of schooling (log) 069 187 060 056(20) (56) (32) (32)
Muslim 000 001 000 000 000(00) (01) (00) (00) (00)
Sample size 91 79 83 83 44
Notes For details on sources of data see Table 2 Muslim is percentage of the population identified asMuslim in 1980 (for countries of recent formation the data are for 1990ndash1995) from La Porta Lopezde Silanes Shleifer and Vishny (1999)
A2 Journal of Economic Perspectives
Appendix Table 5Corruption and Country Characteristics Catholic(percentage of population)
Dep variable
Control ofCorruption
(2002)
CorruptionPerception
Index(2003)
ICRGCorruption
Score(1982ndash2001)
ICRGCorruption
Score(2001)
IVSCIncidenceof Bribes(2000)
Real GDP per capita (log) 065 145 089 074 006(11) (31) (19) (19) (01)
Years of schooling (log) 065 162 058 053(17) (49) (28) (28)
Catholic 001 002 001 000 000(00) (00) (00) (00) (00)
Sample size 91 79 83 83 44
Notes For details on sources of data see Table 2 in main text Catholic is the percentage of thepopulation identified as Catholic in 1980 (for countries of recent formation the data are for 1990ndash1995) from La Porta Lopez de Silanes Shleifer and Vishny (1999)
A3
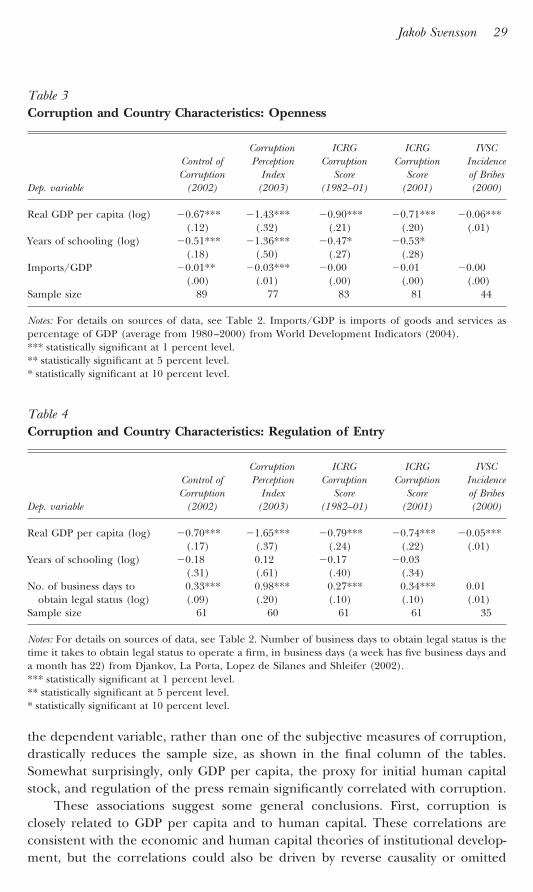