eiip vol iii, ch 5: graphic arts - us epa · acknowledgement this document was prepared by donna...
TRANSCRIPT

VOLUMEVOLUME III:III: CHAPTERCHAPTER 77
GRAPHIC ARTS
FinalFina l Repor tReport
Novembe rNovembe r 19961996
Prepared by:Eastern Research Group, Inc.Post Office Box 2010Morrisville, North Carolina 27560-2010
Prepared for:Area Sources CommitteeEmission Inventory Improvement Program

DISCLAIMER
As the Environmental Protection Agency has indicated in Emission Inventory ImprovementProgram (EIIP) documents, the choice of methods to be used to estimate emissions depends onhow the estimates will be used and the degree of accuracy required. Methods using site-specificdata are preferred over other methods. These documents are non-binding guidance and not rules. EPA, the States, and others retain the discretion to employ or to require other approaches thatmeet the requirements of the applicable statutory or regulatory requirements in individualcircumstances.

ACKNOWLEDGEMENT
This document was prepared by Donna Jones of Radian Corporation and Lucy Adams ofEastern Research Group, Inc., for the Area Sources Committee of the Emission InventoryImprovement Program and for Charles Mann of the Air Pollution Prevention and ControlDivision, U.S. Environmental Protection Agency. Members of the Area Sources Committeecontributing to the preparation of this document are:
Charles Mann, Air Pollution Prevention and Control Division, U.S. Environmental Protection AgencyChris Nguyen, California Air Resources BoardKwame Agyei, Puget Sound Air Pollution Control AgencyMike Fishburn, Texas Natural Resource Conservation CommissionLarry Jones, Air Pollution Prevention and Control Division, U.S. Environmental Protection AgencyGwen Judson, Wisconsin Department of Natural ResourceJo Crumbaker, Maricopa County Air Pollution ControlLinda Murchison, California Air Resources BoardSally Otterson, Washington Department of EcologyLee Tooly, Emission Factor and Inventory Control, U.S. Environmental Protection AgencyChris Mulcahy, Connecticut Department of Environmental ProtectionJim Wilkinson, Maryland Department of the EnvironmentGeorge Leney, Allegheny County Health Department
Other reviewers of this document are:
Demian P. Ellis, U.S. Environmental Protection Agency, Region 2Raymond K. Forde, U.S. Environmental Protection Agency, Region 2
EIIP Volume III iii

CONTENTSSection Page
1 Introduction . . . . . . . . . . . . . . . . . . . . . . . . . . . . . . . . . . . . . . . . . . . . . . .7.1-1
2 Source Category Description. . . . . . . . . . . . . . . . . . . . . . . . . . . . . . . . . . . .7.2-1
2.1 (Roto)gravure Printing. . . . . . . . . . . . . . . . . . . . . . . . . . . . . . . . . . .7.2-3
2.2 Flexograpic Printing . . . . . . . . . . . . . . . . . . . . . . . . . . . . . . . . . . . .7.2-7
2.3 Offset Lithographic Printing. . . . . . . . . . . . . . . . . . . . . . . . . . . . . . .7.2-8
2.4 Letterpress Printing. . . . . . . . . . . . . . . . . . . . . . . . . . . . . . . . . . . . .7.2-9
2.5 Screen Printing. . . . . . . . . . . . . . . . . . . . . . . . . . . . . . . . . . . . . . . .7.2-9
2.6 Plateless Printing. . . . . . . . . . . . . . . . . . . . . . . . . . . . . . . . . . . . . .7.2-10
2.7 Point Source Considerations. . . . . . . . . . . . . . . . . . . . . . . . . . . . . .7.2-10
2.8 Emission Sources. . . . . . . . . . . . . . . . . . . . . . . . . . . . . . . . . . . . .7.2-12
2.9 Factors Influencing Emissions. . . . . . . . . . . . . . . . . . . . . . . . . . . . .7.2-122.9.1 Process Operating Factors. . . . . . . . . . . . . . . . . . . . . . . . . .7.2-122.9.2 Control Techniques. . . . . . . . . . . . . . . . . . . . . . . . . . . . . . .7.2-15
3 Overview of Available Methods. . . . . . . . . . . . . . . . . . . . . . . . . . . . . . . . .7.3-1
3.1 Emission Estimation Methodologies. . . . . . . . . . . . . . . . . . . . . . . . .7.3-1
3.2 Available Methodologies. . . . . . . . . . . . . . . . . . . . . . . . . . . . . . . . .7.3-13.2.1 Volatile Organic Compounds. . . . . . . . . . . . . . . . . . . . . . . . .7.3-13.2.2 Hazardous Air Pollutants. . . . . . . . . . . . . . . . . . . . . . . . . . . .7.3-2
3.3 Data Needs. . . . . . . . . . . . . . . . . . . . . . . . . . . . . . . . . . . . . . . . . . .7.3-23.3.1 Data Elements. . . . . . . . . . . . . . . . . . . . . . . . . . . . . . . . . . .7.3-23.3.2 Double Counting Considerations. . . . . . . . . . . . . . . . . . . . . . .7.3-43.3.3 Application of Controls. . . . . . . . . . . . . . . . . . . . . . . . . . . . .7.3-43.3.4 Spatial Allocation. . . . . . . . . . . . . . . . . . . . . . . . . . . . . . . . .7.3-43.3.5 Temporal Resolution . . . . . . . . . . . . . . . . . . . . . . . . . . . . . .7.3-53.3.6 Projecting Emissions. . . . . . . . . . . . . . . . . . . . . . . . . . . . . . .7.3-5
Volume IIIiv

CONTENTS (CONTINUED)Section Page
4 Preferred Methods for Estimating Emissions. . . . . . . . . . . . . . . . . . . . . . . . .7.4-1
4.1 Planning. . . . . . . . . . . . . . . . . . . . . . . . . . . . . . . . . . . . . . . . . . . . .7.4-1
4.2 Distribution . . . . . . . . . . . . . . . . . . . . . . . . . . . . . . . . . . . . . . . . . .7.4-2
4.3 Survey Compilation and Scaling. . . . . . . . . . . . . . . . . . . . . . . . . . . .7.4-2
5 Alternative Methods for Estimating Emissions. . . . . . . . . . . . . . . . . . . . . . .7.5-1
5.1 Ink Sales Emission Factor Method. . . . . . . . . . . . . . . . . . . . . . . . . .7.5-1
5.2 Per Capita Emission Factor Method. . . . . . . . . . . . . . . . . . . . . . . . . .7.5-9
6 Quality Assurance/Quality Control. . . . . . . . . . . . . . . . . . . . . . . . . . . . . . . .7.6-1
6.1 Emission Estimate Quality Indicators. . . . . . . . . . . . . . . . . . . . . . . . .7.6-16.1.1 Data Attribute Rating System (DARS) Scores. . . . . . . . . . . . . 7.6-16.1.2 Sources of Uncertainty. . . . . . . . . . . . . . . . . . . . . . . . . . . . .7.6-2
7 Data Coding Procedures. . . . . . . . . . . . . . . . . . . . . . . . . . . . . . . . . . . . . . .7.7-1
7.1 Process and Control Codes. . . . . . . . . . . . . . . . . . . . . . . . . . . . . . . .7.7-1
8 References. . . . . . . . . . . . . . . . . . . . . . . . . . . . . . . . . . . . . . . . . . . . . . . .7.8-1
EIIP Volume III v

TABLESTable Page
7.2-1 Product Printed by Each Graphics Arts Technology. . . . . . . . . . . . . . . . . . . .7.2-2
7.2-2 SIC Codes that May Include Graphic Arts Operations(EPA, 1995b) . . . . . . . . . . . . . . . . . . . . . . . . . . . . . . . . . . . . . . . . .7.2-4
7.2-3 Distribution of Products and Ink Sales by Printing Type. . . . . . . . . . . . . . . . 7.2-6
7.2-4 Estimated Small Business Distribution of Printing Facilities. . . . . . . . . . . . . 7.2-11
7.2-5 National Regulations for the Graphic Arts Industry. . . . . . . . . . . . . . . . . . . 7.2-18
7.5-1 AFS Source Classification Codes for Graphic Arts. . . . . . . . . . . . . . . . . . . .7.5-3
7.5-2 Component VOC Emission Factors for Graphic Arts Operations. . . . . . . . . . . 7.5-8
7.6-1 Facility Survey Method DARS Scores. . . . . . . . . . . . . . . . . . . . . . . . . . . . .7.6-3
7.6-2 Ink Sales Emission Factor Method DARS Scores. . . . . . . . . . . . . . . . . . . . .7.6-3
7.6-3 Per Capita Method DARS Scores. . . . . . . . . . . . . . . . . . . . . . . . . . . . . . . .7.6-4
7.7-1 AIRS AMS Codes for the Graphic Arts. . . . . . . . . . . . . . . . . . . . . . . . . . . .7.7-2
7.7-2 AIRS Control Device Codes. . . . . . . . . . . . . . . . . . . . . . . . . . . . . . . . . . . .7.7-2
Volume IIIvi

1
INTRODUCTION
This chapter describes the procedures and recommended approaches for estimating emissionsfrom graphic arts. Section 2 of this chapter contains a general description of the graphic artscategory and an overview of available emission control technologies. Section 3 of thischapter provides an overview of available emission estimation methods. Section 4 presentsthe preferred emission estimation method for the graphic arts industry, and Section 5 presentsalternative emission estimation techniques. Quality assurance/quality control (QA/QC) issuesare discussed in Section 6. Data coding procedures are discussed in Section 7, and Section 8is the reference section.
EIIP Volume III 7.1-1
CHAPTER 7 - GRAPHIC ARTS Final 11/18/96
This page is intentionally left blank.
Volume III7.1-2

2
SOURCE CATEGORY DESCRIPTION
The graphic arts industry can be divided by technology into six different printing segments:rotogravure, flexographic, offset lithographic, letterpress, screen, and plateless (xerographic,electrostatic, magnetic, thermal, ink-jet, etc.). The technology (i.e., the type of pressequipment) dictates the types of inks and coatings that can be used and defines to a largeextent the emissions and the control techniques that are applicable (Environmental ProtectionAgency [EPA], 1995a).
The printing industry can also be divided by the type of substrate that is used. Among theflexible substrates, paper, foil, and films are used. Paper can be further classified in manyways, including coated versus uncoated. Films include polyethylene and a number of otherpolymers. Rigid substrates include cardboard, vinyl, and metal cans. A given substrate maybe printed upon using different technologies depending on factors such as the end use, qualityrequirements, quantity, cost, and environmental considerations (EPA, 1995a). Textiles arespecifically excluded from the graphic arts operations source category.
A third way to segment the printing industry is by the type of product or end use. In general,the end use falls into the broad categories of publications, packaging, or products. Publicationprinting includes newspapers, magazines, books, and advertising. Packaging includes paper,plastic and foil bags, wrappers, cardboard cartons, and metal cans. Products include wall andfloor covering, greeting cards, and paper towels. Various technologies can be used to printspecific items within the broad categories (EPA, 1995a). Table 7.2-1 shows the six majortypes of printing and the types of products printed by each (EPA, 1995b).
Graphic arts operations are performed on printing presses that are made up of one or more"units." Each unit can print only one color. The substrate in graphic arts operations is eithercontinuous and called a "web," or individual pieces of substrate called "sheets." The patternthat is printed on the substrate is called the "image."
The graphics arts industry includes operations classified by Standard Industrial Classification(SIC) Codes 2752 (Commercial Printing-Lithography), 2754 (Commercial Printing-Gravure),and 2759 (Commercial Printing Not Elsewhere Classified [n.e.c.], which includes letterpress,flexographic, screen, and other commercial printing). Other four-digit codes under major SICCode 27 cover printing-related industries such as
TABLE 7.2-1
EIIP Volume III 7.2-1

CHAPTER 7 - GRAPHIC ARTS Final 11/18/96
PRODUCTS PRINTED BY EACH GRAPHICS ARTS TECHNOLOGYa
Technology Products
Rotogravure Packaging, advertising, greeting cards, artbooks, catalogues, and directories
Flexography Packaging, advertising newspapers, books,magazines, financial and legal documentdirectories
Offset Lithography Magazines, catalogues and directories,newspapers, books, stationary, financial andlegal documents, advertising, journals,packaging, metal cans
Letterpress Magazines, catalogues and directories,newspapers, books, stationary, financial andlegal documents, advertising, journals,packaging, metal cans
Screen Signs, electronics, wallpaper, greeting cards,ceramics, decals, banners, plastic bottles
Plateless Images printed on paper by laser printers,xerographic copiers, fax machines, and ink jets
a Source: EPA, 1995a and 1995b.
Volume III7.2-2

Final 11/18/96 CHAPTER 7 - GRAPHIC ARTS
publishing, book printing, and other printing-related service trades. Because graphic artsoperations include not only those whose primary business involves printing, potentially anyentities classified under the major SIC Code 27 may perform graphic arts operations.The SIC Codes 26 (Paper and Allied Products), 30 (Rubber and Miscellaneous PlasticProducts), 32 (Stone, Clay, and Glass Products), 34 (Fabricated Metal Products),39 (Miscellaneous Manufacturing Industries), and 86 (Membership Organizations) may alsoinclude graphic arts operations. Some of these operations may be inventoried as part of theindustrial surface coating source category. Inventory preparers should take care to avoiddouble counting between these two source categories within an area source inventory. Also,the point source and area source inventory definitions of graphic arts and industrial surfacecoating should match. This is particularly important when subtracting point source emissionsfrom total estimated emissions in order to get area source emissions. Table 7.2-2 lists theSIC Codes that are likely to have graphic arts operations.
The following six sections discuss the six types of graphic arts operations grouped by printingtechnology. The importance of the type of printing on a national level, in regard to totalemissions, is likely to be a reflection of the product market share and ink sales data presentedin Table 7.2-3. The importance of each type of printing on a regional and local level maydiffer from these national trends.
2.1 (ROTO)GRAVURE PRINTING
Gravure is a printing process in which an image is etched or engraved below the surface of aplate or cylinder. Nearly all gravure printing is done by rotogravure. On the gravure plate orcylinder (roto), the printing image consists of millions of minute cells. Gravure printingrequires very fluid inks that flow from the cells to the substrate at high press speeds.Solventborne or waterborne ink systems can be used in gravure printing but these ink systemsare not interchangeable. Both the printing cylinders and the drying systems are specific to thesolvent system in use. Rotogravure printing is usually performed on a web (EPA, 1995b).
Rotogravure printing can be divided into publication and product/packaging segments.Publication gravure presses in the United States use solventborne (toluene/xylene-based) inksystems exclusively. Because of the expense and complexity of rotogravure cylinderengraving, it is particularly suited to long-run printing jobs. Packaging/product gravure inksinclude nitrocellulose and water-based inks (EPA, 1995b).
EIIP Volume III 7.2-3

CHAPTER 7 - GRAPHIC ARTS Final 11/18/96
TABLE 7.2-2
SIC CODES THAT MAY INCLUDE GRAPHIC ARTS OPERATIONSa
(EPA, 1995B)
SIC Code Industry Description
2652 Set up paperboard boxes
2653 Corrugated and solid fiber boxes
2655 Fiber cans, drums, and similar products
2656 Sanitary food containers
2657 Folding paperboard boxes
2671 Paper coated and laminated, packaging
2672 Paper coated and laminated, n.e.c.
2673 Bags: plastics, laminated, and coated
2674 Bags: uncoated paper and multiwall
2676 Sanitary paper products
2677 Envelopes
2678 Stationary products
2679 Converted paper products, wall coverings, gift wrap, n.e.c.
271x Newspapers
272x Periodicals
2731 Book publishing
2732 Book printing
274x Miscellaneous publishing
2752 Commercial printing, lithographic
2754 Commercial printing, gravure
2759 Commercial printing, n.e.c.
2761 Manifold business forms
2771 Greeting cards
3081 Unsupported plastics, film and sheet
Volume III7.2-4

Final 11/18/96 CHAPTER 7 - GRAPHIC ARTS
TABLE 7.2-2
(CONTINUED)
SIC Code Industry Description
3083 Laminated plastics, plate and sheet
3085 Plastic bottles
3089 Plastics, n.e.c.
3221 Glass containers
3411 Metal cans
3412 Metal barrels, drums, and pails
3466 Crowns and closures
3996 Floor coverings
86xx Membership organizations
a n.e.c. = not elsewhere classified.
EIIP Volume III 7.2-5

CHAPTER 7 - GRAPHIC ARTS Final 11/18/96
TABLE 7.2-3
DISTRIBUTION OF PRODUCTS AND INK SALES BY PRINTING TYPE
Type of Printing
EstimatedNumber ofFacilitiesa
EstimatedPercentageof Product
Market ShareaPercentage of
Ink Solvent Useb
Rotogravure 427 18 22
Flexography 1,587 18 16
Offset Lithography 54,000 47 35
Letterpress 21,000 8 8
Screen 21,000 3 part of remaining19 percent
Plateless unknown 3
a Source: EPA, 1995a.b Compiled from: Darnay, 1990; Renson, 1991; and National Association of Printing Ink Manufacturers, 1988.
Volume III7.2-6

Final 11/18/96 CHAPTER 7 - GRAPHIC ARTS
Gravure ink solvents include alcohols, aliphatic naphtha, aromatic hydrocarbons, esters, glycolethers, ketones, and nitroparaffins. Gravure water-based inks are in regular production use atsome facilities to reduce volatile organic compound (VOC) emissions from the press (EPA,1993a).
In rotogravure printing, the web is printed on one side at a time and must be dried after theapplication of each color. Thus, for four-color, two-sided publication printing, eightpassesthrough the press are employed, each including a pass over a steam drum or through a hot-airdryer at temperatures from ambient up to 120oC (250oF) to remove nearly all of the solvent(EPA, 1993a).
In addition to inks, other materials including adhesives, primers, coatings, and varnishes maybe applied with rotogravure cylinders. These materials dry by evaporation as the substratepasses through hot air dryers. Cleaning solutions containing solvents are also used in therotogravure printing process (EPA, 1995a).
2.2 FLEXOGRAPIC PRINTING
In flexographic printing, the image area is raised from the surface of a plate (like atypewriter) with a rubber (flexible) image carrier. Alcohol-based inks are generally used.The process is usually webfed and used for medium or long multicolor runs on a variety ofsubstrates, including heavy paper, fiberboard, and metal and plastic foil. Almost all milkcartons and multiwall bags, and half of all flexible packaging are printed by this process(EPA, 1993a).
Steam-set inks, employed in the "water flexo" or "steam-set flexo" process, are low-viscosity inks of a paste consistency that are gelled by water or steam. Steam-set inks areused for paper bag printing and produce no significant emissions (EPA, 1993a).
Solvent-based inks are used primarily in publication printing and contain about 75 percent (byvolume) organic solvent. The solvent, which must be rubber compatible, may be alcohol oralcohol mixed with an aliphatic hydrocarbon or ester. Typical solvents also includenonaromatic glycols, ketones, and ethers. The inks dry by solvent absorption into the weband by evaporation, usually in high-velocity steam drums or hot-air dryers, at temperaturesbelow 120oC (250oF). Most of the solventborne flexographic inks contain few or nohazardous air pollutants (HAPs). As in rotogravure publishing, the web is printed on onlyone side at a time. The web passes over chill rolls after drying; no emissions occur fromchilling (EPA, 1993a).
When flexography is used to print corrugated board and most paperboard, water-based inkscan be used; however, fast-drying inks are required for plastic films and packaging papers so
EIIP Volume III 7.2-7

CHAPTER 7 - GRAPHIC ARTS Final 11/18/96
the web can be rewound or processed into the final product at the end of the press.Flexography is becoming popular for printing pressure-sensitive labels, a process in which theink must dry quickly without penetration. Use of inks that dry by exposure to ultravioletradiation (producing no emissions) have been used in label printing with much success (EPA,1995b).
Additional converting operations, which are often done at the flexographic press stations orin-line with the presses, such as film blowing, laminating, coating, adhesive application, andcutting, may result in additional emissions. Cleaning operations also use solvents thatcontribute to emissions (EPA, 1995b).
2.3 OFFSET LITHOGRAPHIC PRINTING
Lithographic printing is characterized by a planographic printing process (i.e., the image andnonimage areas are on the same plane). The image area is ink-wettable and water- repellent,and the nonimage area is chemically repellent to ink and hydrophilic. The inks used inlithography are either heatset or nonheatset. In offset printing, the graphic image is appliedfrom an ink-covered print plate to a rubber-covered "blanket" cylinder and then transferredonto the substrate, hence the name "offset" lithography (EPA, 1993a). The substrate in offsetlithography can be either a web or sheet. A web substrate can be used with either heatset ornonheatset inks; sheets are used with nonheatset inks only. Some offset presses print on bothsides of the paper at the same time (called "perfecting"); others print on one side only or twosides sequentially (EPA, 1994a).
An aqueous solution of isopropyl alcohol is commonly used to dampen the nonimage area onthe plate and is called the "fountain" or "dampening" solution. The fountain solution in offsetlithographic printing has traditionally contained about 15 percent alcohol; at times as high as30 percent alcohol could be used. Because of environmental pressures, the use of isopropylalcohol (a VOC) is decreasing. Fountain solutions that contain lower VOCs and/or alcoholsubstitutes are now in use. The newspaper industry segment of offset lithographic printingpredominantly uses alcohol substitutes. Some facilities may use both alcohol and alcoholsubstitutes; in this case, the alcohol is generally much lower than 15 percent in the fountainsolution (EPA, 1994a).
Offset lithographers also use cleaning solutions to clean the press and parts. These cleaningsolutions have traditionally been high-solvent-containing (90 to 100 percent) solutions. Somelower- or no-solvent cleaners are becoming available, in which the solvent content is 0 to 30percent (EPA, 1994a).
Volume III7.2-8

Final 11/18/96 CHAPTER 7 - GRAPHIC ARTS
2.4 LETTERPRESS PRINTING
Letterpress printing is the oldest form of movable type printing. Letterpress printing uses arelief printing plate (as does flexography) and viscous inks similar to lithographic inks.Various types of letterpress plates are available. These plates differ from flexographic platesin that they have a rigid backing (metal or plastic) and are not "flexible." Both sheetfed andweb presses are in use. Web letterpress equipment uses heatset and nonheatset inks.Letterpress printing uses no fountain solutions; the cleaning solvents are similar to those usedin lithography. Traditionally, letterpress printing dominated periodical and newspaperpublishing; however, the majority of newspapers have converted to nonheatset web offsetprinting (EPA, 1995a).
Letterpress printing uses a paper web that is printed on both sides, one side at a time, anduses heatset inks, usually of about 40 percent (by volume) solvent. The web is dried aftereach color is applied. Heatset letterpress ink is similar to heatset lithographic ink. These inkscontain resins dissolved in aliphatic hydrocarbons and are dried in hot-air ovens. The inkscan be entirely HAP free (EPA, 1993a).
"Moisture set" inks used in some packaging applications contain trimethylene glycol (a HAP)."Water washable" letterpress inks are sometimes used for printing paper and corrugatedboxes. These inks contain glycol-based solvents that may contain HAPs (EPA, 1995a).
2.5 SCREEN PRINTING
Screen printing involves forcing ink through a stencil in which the image areas are porous.The screens are generally made of silk, nylon or metal mesh. Screen printing is used forsigns, displays, electronics, wallpaper, greeting cards, ceramics, decals, banners, and textiles.Nearly half of the screen printing plants in the United States print on textiles. Ink systemsused in screen printing include ultraviolet cure, waterborne, solventborne, and plastisol, withplastisol (polyvinyl chloride) being mainly used in textile printing. Solvent-based ink systemscontain aliphatic, aromatic, and oxygenated organic solvents (EPA, 1995a).
Both sheetfed and web presses are used in screen printing. Depending on the substrateprinted, the substrate can be dried after each printing station or, for absorbent substrates, afterall colors are printed. Solvent- and waterborne inks are dried in hot-air or infrared dryingovens. Dryer gases are partially recycled and partially vented (EPA, 1995a).
2.6 PLATELESS PRINTING
This technology is a relatively new process used primarily for short runs on paper substrates.Plateless printing processes include electronic (e.g., laser printers), electrostatic (e.g.,
EIIP Volume III 7.2-9

CHAPTER 7 - GRAPHIC ARTS Final 11/18/96
xerographic copiers), magnetic, thermal (e.g., facsimile machines) and ink jet printing.Plateless printing processes are estimated to account for only 3 percent (by value) of printedproducts. Electrostatic toners and ink jet printer inks maycontain HAPs; however thequantities emitted at any location are small (EPA, 1995a).
2.7 POINT SOURCE CONSIDERATIONS
Although 80 percent of graphic arts facilities are estimated to have fewer than 20 employeesand less than 10 tons per year (tpy) VOC emissions (Ulconovic, 1991), there are likely to besome point sources and/or point source emissions for this source category in most inventoryareas. Forty percent of VOC emissions from graphic arts operations are estimated to be fromplants in the 10- to 100-tpy range.
This indicates that the interface between point and area sources, as well as the attainmentstatus of the region, will be especially important for inventories of this source category. Atypical scenario is to find a few large graphic arts operations and numerous small graphic artsoperations with an equal potential for a significant amount of emissions from both sizegroups.
Table 7.2-4 presents the available information about the estimated percentage of facilities thatare area sources among the various printing processes. These estimates substantiate theassumption that there are a significant number of area source facilities among all types ofprinting.
Also, many of these small graphic arts operations may be located at facilities whosepredominant operation is not printing. This fact is reflected in the SIC Codes for graphic artsoperations (Table 7.2-2) that are outside of major SIC Code 27 (Printing and Publishing).
According to Title V permit requirements, if a source qualifies as a major source for oneHAP, the facility needs to inventory all HAP sources, regardless of their size. Therefore, datamay exist for some small printing operations if they are located in facilities large enough toqualify for Title V permitting. These sources will also be included in a point sourceinventory.
Volume III7.2-10

Final 11/18/96 CHAPTER 7 - GRAPHIC ARTS
TABLE 7.2-4
ESTIMATED SMALL BUSINESS DISTRIBUTION OF PRINTING FACILITIES
Type of Printing
EstimatedNumber ofFacilitiesa
EstimatedPercentage of
Small Businesses
Rotogravure 427 0 for publication; 48 percent ofpackaging/product printingare small businesses (<500 employees)b
Flexography 1,587 Out of 600 responses to an EPA surveyof flexographic printing, 98 percent wereconsidered small businesses (<500employees)b
Offset Lithography 54,000 Manyc
Letterpress 21,000 Unknown
Screen 21,000 Manyd
Plateless Unknown Manyd
a EPA, 1995a.b EPA, 1995b.c EPA, 1994a.d Assumed.
EIIP Volume III 7.2-11

CHAPTER 7 - GRAPHIC ARTS Final 11/18/96
2.8 EMISSION SOURCES
The predominant emissions from graphic arts printing are VOCs contained in the printinginks, fountain solutions, and cleaning solutions. Many of these VOCs are also likely to beHAPs. To a lesser extent, VOCs and HAPs are emitted from binding and laminatingoperations (EPA, 1995a).
Printing inks vary widely in composition, but all consist of three major components:pigments, which produce the desired colors and are composed of finely divided organic andinorganic materials; binders, the solid components that lock the pigments to the substrate andare composed of organic resins and polymers or, in some inks, oils and rosins; and solvents,which dissolve or disperse the pigments and binders and are usually composed of organiccompounds. The binder and solvent make up the "vehicle" part of the ink (EPA, 1993a).
In "heatset" printing processes, the solvent evaporates from the ink into the atmosphere duringa drying step. In nonheatset processes, minimal VOCs or HAPs are emitted from inks,although emissions still result from fountain solution (offset lithographic printing only) andcleaning solution use. Ultraviolet inks may be used in graphic arts operations; in this case,there will be no emissions from inks (EPA, 1994a).
Emissions from proofing presses, cleaning operations, ink storage tanks, and ink mixingoperations are relatively minor compared to the emissions during the printing process, butthey do contribute to overall emissions (EPA, 1995a).
2.9 FACTORS INFLUENCING EMISSIONS
2.9.1 PROCESS OPERATING FACTORS
The type of printing and/or ink (offset heatset, offset nonheatset, gravure, flexographic, etc.) isthe most important process operating factor for estimating emissions from graphic artsoperations. For similar processes, the next most important process operating factor affectingemissions is the production volume (i.e., amount of material printed [area times length]). Theamount of ink used per unit of substrate (i.e., the relative amount of inked versus noninkedareas), which is determined by the type of product (newspaper, cereal box, greeting card,etc.), is another important factor. All things being equal, the production volume will be thedetermining factor in the relative magnitude of emissions. The type of substrate has littleeffect on the quantity of emissions.
Since printing is not a high-profit-margin production activity, it is in the interest of the printerto minimize the use of raw materials and time needed for each product. Therefore, it wouldappear that emissions minimization would be an auxiliary goal of the printer to minimize the
Volume III7.2-12

Final 11/18/96 CHAPTER 7 - GRAPHIC ARTS
use of raw materials. A factor that supersedes these goals, however, is customer satisfaction.It is because of the customer’s perception of the final product that this source category retainsthe descriptor of an "art." Consequently, the printer may alter process variables that increasechemical use and, thus, possibly emissions, to achieve an end result that meets the customer’sscrutiny. Chemical use may also be increased in the interest of shorter production time andless product waste to increase the profit margin.
One example of this trend in graphic arts operations is in offset lithographic printing, wherethe use of alcohol, one of the more expensive raw materials, may be used at a higher rate if itappears to be the only way to print a product that pleases the customer. This was shown inthe case of a press operator who was found to purchase his own alcohol--at his own expense--to ensure high quality of a printing job when alcohol purchases had been eliminated by theplant management for environmental reasons (EPA, 1994a).
The following process variables relate to specific types of printing or operations common toall types:
Rotogravure
In publication rotogravure printing, the inks contain from 55 to 95 percent (by volume)low-boiling-point solvent (average is 75 percent by volume) with low viscosities (EPA,1993a). It is important that the ink or other coating dry quickly between each color;therefore, the ink vehicle must be evaporated between stations (EPA, 1995b). Organicsolvents (such as toluene, xylene, and ethylbenzene, which are HAPs) and alcohol are mainlyused as the volatile portion of the ink, but water-based inks are becoming more popularbecause of their lower cost and less potential for air pollution. However, a single press is notcompatible for use with both systems because water-based inks require more equipmentdrying capacity and a different cell design.
Although some rotogravure inks contain solvents, additional solvents may be mixed into theink as well to obtain the desired viscosity. Publication gravure plants recover a large portionof spent solvents from their ink, some of which is reused and some excess that is sold back tothe ink suppliers. Some virgin solvent, which has the same composition as the solvent in theinks, is purchased for replenishment purposes, and a small amount is used for cleaning thepresses (EPA, 1995a).
Flexography
The ink used in flexography is of low viscosity because the ink must be fluid to printproperly. Most flexographic printing (including all flexographic newspaper and corrugatedcarton printing) is done with waterborne inks, but alcohol or other low-viscosity, volatileliquids are also used as the ink base. Solvents used must be compatible with the rubber or
EIIP Volume III 7.2-13

CHAPTER 7 - GRAPHIC ARTS Final 11/18/96
polymeric plates; thus, aromatic solvents are not used. Some of the components of solvent-based flexographic ink include ethyl, methyl, n-propyl, and isopropyl alcohols; glycol ethers;ethylene glycol; aliphatic hydrocarbons; acetates; and esters. Most of the solventborneflexographic inks contain little or no HAPs (EPA, 1995b).
When flexography is used to print corrugated board and most paperboard, water-based inkscan be used; however, fast-drying inks are required for plastic films and packaging papers sothe web can be rewound or processed into the final product at the end of the press. Whenprinting pressure-sensitive labels, the ink must dry quickly without penetration (EPA, 1995b).
Offset Lithography
The solvents (high-boiling-temperature petroleum oils >400oF) in heatset inks are driven offin a hot air or direct-flame dryer (400-500oF) to set the ink. Nonheatset inks dry byadsorption or oxidation and are not released from the substrate under normal conditions.Approximately 20 to 40 percent of the solvent remains in the substrate with heatset inks; 95to 100 percent remains in the substrate with nonheatset inks (EPA, 1993a).
Emissions from the fountain solution will depend on whether alcohol or nonalcohol additivesare used. The concentration of VOCs in the fountain solution can vary from facility tofacility, and from job to job within any one facility (EPA, 1994a).
Solvents used for press cleanup are usually kerosene-type high-boiling-point hydrocarbons,sometimes mixed with detergents (EPA, 1995a). These materials can contain up to100 percent VOCs but are generally free of HAPs. Low-VOC cleaning solutions are also inuse where the VOC content is less than 70 percent, and often less than 30 percent VOCs(EPA, 1994a).
Letterpress
Only web presses using solventborne inks are sources of emissions in this industry.Letterpress newspaper and sheetfed printing use oxidative drying inks and are not a source ofemissions. Cleaning solutions are used with all letterpress operations (EPA, 1993a).
Screen Printing
Ink systems used in screen printing include ultraviolet cure, waterborne, solventborne, andplastisol, with plastisol (polyvinyl chloride) being mainly used in textile printing.Solvent-based ink systems contain aliphatic, aromatic, and oxygenated organic solvents (EPA,1995a).
In-Process Fuel
Volume III7.2-14

Final 11/18/96 CHAPTER 7 - GRAPHIC ARTS
Fuels such as oil or natural gas are used to operate the dryers used in heatset offsetlithography, heatset letterpress, gravure, and alcohol-based flexography. In some cases,recovered solvent may be used as supplemental fuel in the dryer. A boiler may be used togenerate steam for steam-/water-based flexography and to regenerate the activated carbonbeds used as control devices. The combustion byproducts include particulate matter (PM),particulate matter with diameters less than 10 µg (PM10), sulfur oxides (SOx), nitrogen oxides(NOx), VOCs, and carbon dioxide (CO). Recovered solvent may be burned in the dryer(EPA, 1994a).
Storage Tanks
Graphic arts operations may use storage tanks to store inks, solvents, and fuels (oil).
2.9.2 CONTROL TECHNIQUES
Afterburners, both thermal and catalytic, can be used to control VOC emissions from theheatset web offset lithography, rotogravure printing, and flexography. Activated carbonadsorption can be used to control VOC emissions from rotogravure printing and flexography(EPA, 1995a). Condenser filters with and without activated carbon can be used to controlVOC emissions from heatset offset lithography (EPA, 1994a). The condensers alone canachieve 90 percent control, while activated carbon increases the control to 95 percent. Totalenclosure, with venting of collected VOCs to a control device, is used with rotogravureprinting. Pebble-bed incinerators that combine the functions of a heat exchanger and acombustion device also can be used to control VOCs in the graphic arts industry (EPA,1995a).
Refrigeration of the dampening solution is a process change that can achieve approximately40 percent reduction of the alcohol emissions (which are VOCs) from offset lithographicprinting operations. The use of alcohol substitutes in the dampening solution of offsetlithographic printing operations can reduce or eliminate the use of alcohol (EPA, 1994a).
The use of lower-VOC-containing or lower-vapor-pressure cleaning solutions can reduce VOCand HAP emissions from cleaning operations in all types of printing. Storing cleaning rags inclosed containers can control some of the fugitive emissions from cleaning (EPA, 1994a). Inscreen printing, low-VOC- and/or HAP-emitting screen printing cleaning products areavailable for the removal/reclamation of the stencil from the screen. Process modifications tolower VOC/HAP emissions in screen reclamation are also being used, such as the ScreenPrinting Association International (SPAI) Workshop Process, high-pressure water blaster, andautomatic screen washing system.
In 1978, a control technique guidelines (CTG) document (EPA, 1994a) was published for thecontrol of VOCs from rotogravure and flexographic printing operations (EPA, 1978). New
EIIP Volume III 7.2-15

CHAPTER 7 - GRAPHIC ARTS Final 11/18/96
Source Performance Standards (NSPS) for VOC emissions from publication rotogravureprinting were proposed in the Federal Register (FR) October 28, 1980 (45 FR 71538), andpromulgated November 8, 1982 (47 FR 50644). NSPS for VOC emissions from rotogravureprinting and coating of flexible vinyl were promulgated June 29, 1984 (49 FR 26885). In1993, a draft CTG document was published for the control of VOC emissions from offsetlithographic printing. The draft CTG document was presented as an "Alternative ControlTechniques" (ACT) document and announced in June 1994, with modifications, as a result ofpublic comments submitted to EPA in response to the draft CTG (EPA, 1994a).
The following is a chronology of VOC regulations for the graphic arts industry:
1978: A CTG document was published for the control of VOCs fromrotogravure and flexographic printing operations (EPA, 1978).
1982: NSPS for VOC emissions from publication rotogravure were proposedOctober 28, 1980 (45 FR 71538) and promulgated November 8, 1982 (47 FR50644).
1984: NSPS for VOC emissions from rotogravure printing and coating offlexible vinyl were promulgated June 29, 1984 (49 FR 26885).
1994: A draft CTG document was published for the control of VOC emissionsfrom offset lithographic printing in November 1993. The draft CTG wasreclassified as an ACT document and announced in June 1994. The ACTinformation included revisions made in response to public comments to the1993 draft CTG document (EPA, 1994a).
Although none of these above regulatory efforts were specifically directed towards HAPs,many HAPs of concern in the printing industry are VOCs and, therefore, the same controldevices used to limit VOC emissions are also applicable to control of HAPs. A NationalEmission Standard for Hazardous Air Pollutant (NESHAP) for the printing and publishingindustry was proposed in March 1995 (60 FR 13664; 40 CFR Part 63); the backgroundinformation document for the NESHAP is available (EPA, 1995a).
Table 7.2-5 summaries the national regulations that affect the graphic arts industry. Note thatin most cases there is no size cutoff for applicability of the regulation. State regulations mayalso be in effect that are more stringent than federal regulations. The size cutoffs of theseregulations should be noted when preparing an area source inventory; in many cases the statemay make the federal rule more stringent by eliminating the size cutoff or facility ageexemption that will bring all sources under the regulation or extend the regulations statewidethat are primarily targeted for nonattainment areas.
Volume III7.2-16

Final11/18/96
CH
AP
TE
R7
-G
RA
PH
ICA
RT
STABLE 7.2-5
NATIONAL REGULATIONS FOR THE GRAPHIC ARTS INDUSTRY
Type ofPrinting
Type ofRegulation Applicability
RegulatedPollutant Control Requirement Control Method(s)
Rotogravure CTG (1978)a Packaging facilities innonattainment areas
VOCs 70-80% capture
90% destruction Incineration
65% overall control
Publication facilitiesin nonattainment areas
VOCs 75-85% capture
90% removal Carbon adsorption
75% overall control
Packaging andpublication facilitiesin nonattainment areas
VOCs Inks with 25% or less solvent Material substitution
Ink with 60% nonvolatilecomponent
Material substitution
NSPS (1982)b Publication facilities VOCs 84% overall control Solvent recoverysystems orwaterborne inks
NESHAP(proposed 1995)
Publication facilitiesthat are major sourcesc
HAPs 92% overall control
Product and packagingfacilities that aremajor sourcesc
HAPs 95% overall control
≤0.2 kg emitted per kg ink solids
≤0.04 kg emitted per kg ink solidsfor presses with a common solventrecovery system
EIIP
Volum
eIII
7.2-17

CH
AP
TE
R7
-G
RA
PH
ICA
RT
SF
inal11/18/96TABLE 7.2-5
(CONTINUED)
Type ofPrinting
Type ofRegulation Applicability
RegulatedPollutant Control Requirement Control Method(s)
Flexography CTG (1978)a Packaging facilities innonattainment areas
VOCs 70-80% capture
90% destruction Incineration
65% overall control
Publication facilities innonattainment areas
VOCs 75-85% capture
90% removal Carbon adsorption
75% overall control
Packaging andpublication facilities innonattainment areas
VOCs Inks with 25% or less solvent Material substitution
Inks with 60% nonvolatile component Material substitution
NESHAP(proposed 1995)
Wide web flexographicfacilities that are majorsourcesc
HAPs 95% overall control
≤0.2 kg emitted per kg ink solids
≤0.04 kg emitted per kg ink solids forpresses with a common solventrecovery system
Volum
eIII
7.2-18

Final11/18/96
CH
AP
TE
R7
-G
RA
PH
ICA
RT
STABLE 7.2-5
(CONTINUED)
Type ofPrinting
Type ofRegulation Applicability
RegulatedPollutant Control Requirement Control Method(s)
OffsetLithography
ACT (1994)d,e Heatset web facilitiesthat emit≥15 lb per daytotal emissions
VOCs 95% control of ink emissions
Fountain solution VOCs≤ 1.6% (weight)
Fountain solution VOCs≤ 3% (weight) Refrigeration
Fountain solution VOCs≤ 5% (weight) Alcohol substitutes
Nonheatset web facilitiesthat emit≥15 lb per daytotal emissions
VOCs Fountain solution VOCs≤ 5% (weight) Alcohol substitutes
Nonheatset sheetfacilities that emit≥15 lb per day totalemissions
VOCs Fountain solution VOCs≤ 5% (weight)
Fountain solution VOCs≤ 8.5% (weight) Refrigeration
Cleaning solution VOCs≤ 5% (weight) Alcohol substitutes
Newspaper facilities thatemit ≥15 lb per day totalemissions
VOCs Fountain solution VOCs≤ 5% (weight)Alcohol substitutes
Cleaning solution at anyfacilities that emit≥15 lb per day totalemissions
VOCs VOCs ≤ 30% (weight)
Vapor pressure≤ 10 mm Hg at 20oC
a EPA, 1978.b EPA, 1980.c Emit over 10 tpy of any one HAP or over 25 tpy total of two or more HAPs.d EPA, 1994a.e Recommended for nonattainment areas.
EIIP
Volum
eIII
7.2-19

3
OVERVIEW OF AVAILABLE METHODS
3.1 EMISSION ESTIMATION METHODOLOGIES
A number of methodologies are available for estimating emissions from the graphic artsindustry. The method used is dependent upon the degree of accuracy required in the estimate,the available data, and the available resources.
This section discusses the methods available for estimating emissions from area sources in thegraphic arts industry and identifies the preferred method. A discussion of the data elementsneeded for each method is also provided. All methods must take into account point sourcefacilities of graphic arts operations and their emissions.
3.2 AVAILABLE METHODOLOGIES
3.2.1 VOLATILE ORGANIC COMPOUNDS
The VOCs released into the air by graphic arts operations are from the evaporation of theVOCs contained in the raw materials such as inks, fountain solution (offset lithographicprinting only), and cleaning solutions used in the printing processes. There are threeapproaches to estimating the amount of VOCs emitted from this source category:
Facility Survey Method;
Ink Sales Emission Factor Method; and
Per Capita Emission Factor Method.
The Facility Survey Method, the preferred method, and Ink Sales Emission Factor Method,the first alternative method, take into account the variations in VOC emissions between eachprinting type and in the type of emission controls for each type. With the Facility SurveyMethod, the amount of VOCs recycled can also be addressed. However, for offsetlithographic printing processes, the Facility Survey Method requires incorporating assumptionsabout the amount of VOCs in the inks that are retained in the substrate and not releasedduring printing. The emissions estimate for offset lithographic printing facilities will not be asimple mass balance calculation (because some ink solvent VOCs are retained in the
EIIP Volume III 7.3-1

CHAPTER 7 - GRAPHIC ARTS Final 11/18/96
substrate). Therefore, an emissions estimate from facility surveys for offset lithography willbe more uncertain than for other than printing processes where all the solvent used is emitted.
The Per Capita Emission Factor Method assumes a correlation between population size andgraphic arts emissions, which is probably a very weak assumption. Emissions estimated usingthe Per Capita Emission Factor Method will not reflect variability between regions and,depending on the emission factor used, may not reflect the distribution of the different typesof printing within the region and the controls that are being used.
3.2.2 HAZARDOUS AIR POLLUTANTS
HAP emissions from graphic arts operations can be estimated using two methods:
Facility Survey Method; or
Applying speciation profiles to the VOC emission estimate obtained using theInk Sales Emission Factor or Per Capita Emission Factor Methods.
The Facility Survey Method is the preferred method because it provides the most accurateinformation on material usage and HAP content. The effect of VOC controls on HAPemissions can also be obtained when using this method.
Speciation profiles can be used with either the Facility Survey or Ink Sales Emission FactorMethods as alternative approaches when a detailed survey is not practical. The least desirablemethod is the use of speciation profiles with the Per Capita Emission Factor Method.
The speciation profiles will need to be updated frequently as a result of changes in productuse that are now occurring to meet new regulations (Titles I, III, and V of the Clean Air ActAmendments) and/or as better quality profiles are available. Local speciation profiles mayalso be available.
3.3 DATA NEEDS
3.3.1 DATA ELEMENTS
The data elements used to calculate emission estimates for the graphic arts operations willdepend on the methodology used for emission estimation. The following data elements arenecessary for emissions calculations and should be obtained for each method.
For the Facility Survey Method (from each facility sampled):
Volume III7.3-2

Final 11/18/96 CHAPTER 7 - GRAPHIC ARTS
Type of printing (rotogravure, flexography, etc.);
Primary business;
Number of employees, and number of employees involved in printingoperations;
Amount of VOC-containing raw materials by type;
VOC content of each product type (weight percent);
Percentage of VOCs contained in the material that is emitted during graphicarts operations that is estimated or obtained from source test measurements;
HAP content of product or solvent by type (weight percent) for all HAPs in theproduct and estimated amount of HAPs emitted during printing operations;
Controls used at facility, control efficiency; and
Amount of VOCs or HAPs recycled.
For the first alternative method, the Ink Sales Emission Factor Method:
Ink sales for the state, or data from the U.S. Census Bureau;
Uncontrolled point source emissions for graphic arts operations; and
Controls in use in the inventory region.
For the second alternative method, the Per Capita Emission Factor Method:
Population of the inventory area; and
Per capita emission factor from a national database or local survey.
3.3.2 DOUBLE COUNTING CONSIDERATIONS
Double counting can occur for this source category either because emission sources arecounted as both graphic arts and as industrial surface coating area sources, or because pointsource emissions are not properly subtracted from estimates of total emissions. In either case,a clear definition of what processes and industries are included in the graphic arts and
EIIP Volume III 7.3-3

CHAPTER 7 - GRAPHIC ARTS Final 11/18/96
industrial surface coating source categories should be made before data collection for eithersource category begins. In particular, industries with SIC codes that arenot in the printingand publishing SIC of 27 should be examined for overlap between the two source categories.
3.3.3 APPLICATION OF CONTROLS
Add-on controls may be used to control ink emissions in the graphic arts industry. Materialsubstitution may also be used to control emissions from all aspects of printing that include theuse of water-based inks, reduced alcohol and/or alcohol substitutes in fountain solution, andthe use of lower-VOC or low-vapor-pressure cleaning solutions. Rule effectiveness (RE) maybe less than 100 percent for add-on controls; RE for material substitution can be assumed tobe 100 percent.
Rule penetration will depend on the cutoff size or exemptions for the applicable regulationsand can be calculated based on the percentage of sources within the category that are affectedby the rule. Because a large number of small sources contribute to total emissions forgraphic arts operations, many of the regulations will apply to area sources as well as pointsources. In some cases, a lower size cutoff that does not correspond with point versus areadistinctions may be specified by the regulation.
3.3.4 SPATIAL ALLOCATION
Spatial allocation may be needed in two possible cases: (1) allocation of state or regionalactivity to a county level, and (2) allocation of county level emission estimates to a modelinggrid cell. In each case, a surrogate for activity should be found that can approximate spatialvariation for this category, if specific locations cannot be identified. The preferred method ofspatial allocation is to use the facility location collected with other survey information underthe preferred method.
Most printing operations occur in or near urban areas to be close to the customers, laborforce, or transportation centers. Some national companies locate their large printing plants insuburban or rural areas where land is less expensive. Spatial apportioning can be performedwith land use data obtained from county planning departments or population distributionsavailable from the U.S. Census Bureau. Using population to allocate estimated emissions oractivity by county or within a grid cell is fairly straightforward and is discussed in Chapter 1,Introduction to Area Source Emission Inventory Development. Land use data can be used togeneralize building type (i.e., commercial versus residential).
Volume III7.3-4

Final 11/18/96 CHAPTER 7 - GRAPHIC ARTS
Alternatively, printing facility distributions can be used fromCounty Business Patternsa (U.S.Bureau of the Census, Department of Commerce) or the local "Yellow Pages" to allocatesome segments of the category, such as lithographers. However, these indicators may not beuseful for in-house or captive printing operations. The importance of these smaller sources tothe total area source inventory will determine the usefulness of the data.
3.3.5 TEMPORAL RESOLUTION
Seasonal Apportioning
There are no dramatic seasonal fluctuations in production in the graphic arts industry;therefore, it can be assumed that emissions are distributed uniformly throughout the year. Todetermine seasonal emissions, the fraction of the year that corresponds to the season ofinterest can be multiplied times annual emissions to obtain seasonal emissions.
Daily Resolution
Based on a review of the National Acid Precipitation Assessment Program (NAPAP) data(EPA, 1990), 75 percent of emissions activity occurs on weekdays, 20 percent on Saturdays,and 5 percent on Sunday. For allocation on a hourly basis, 65 percent of activity occursbetween 9 a.m. and 6 p.m., with the remaining 35 percent occurring between 7 p.m. and 12a.m.
3.3.6 PROJECTING EMISSIONS
The following equation should be applied when the base year emissions are calculated by theemission factor method and the emission factor takes into account the control level for theprojection year (EPA, 1993b):
a See the most recent publication, which can be obtained from the U.S. Bureau of theCensus, Department of Commerce, Washington, D.C.
EIIP Volume III 7.3-5

CHAPTER 7 - GRAPHIC ARTS Final 11/18/96
(7.3-1)EMISPY ORATEBY EMFPY
1
CEPY
100
REPY
100
RPPY
100GF
where:
EMISPY = Projection year emissions: ozone season typical weekday (mass ofpollutant/day);
ORATEBY = Base year operating rate (activity level);EMFPY = Projection year (postcontrol) emission factor (mass of pollutant/
production unit);CEPY = Projection year control efficiency (percent);REPY = Projection year rule effectiveness (percent);RPPY = Projection year rule penetration (percent); andGF = Growth factor (dimensionless).
Current control projection emissions in this case are calculated if the projection year emissionfactor and RE values represent current regulatory or permit conditions and/or actual conditionswhen appropriate.
Tools for the development and use of growth factors are discussed in Chapter 1 of this volume.Forecasts of ink or paper sales from the data sources discussed in Section 5 of this chapter canalso be used to estimate future growth in the graphic arts.
Volume III7.3-6

4
PREFERRED METHODS FORESTIMATING EMISSIONS
The preferred method for calculating emissions from graphic arts is the Facility Survey Method.In this method, graphic arts facilities in the inventory area will need to identified. Althoughinitially this is a labor-intensive approach, the results can be used to develop an emission factorspecific to the inventory region. Subsequent inventories can use this factor with updated activitydata to estimate emissions. If it is not possible to inventory all of the graphic arts facilities inthe area, then a representative sample of these graphic arts facilities can be surveyed, and theresults can then be scaled up for all facilities in the area. Please refer to Volume I of this series,Chapter 5,Inventory Development; Chapter 1 of this volume; and Volume VI of this series,Quality Assurance Procedures, for more detailed information about using surveys.
4.1 PLANNING
Identify facilities that would be suitable survey recipients, noting those that are point sources.Facilities engaged in graphic arts may be listed as part of a state or local permitting program.Look for facilities that may have graphic arts facilities as part of another, more significantoperation. Title V or other operating permits may include information from such facilities.Facilities can also be identified from the local employment office, professional organizations,and entries in local tax records for printing equipment.
Prepare a survey form or forms that collect the information needed for the inventory. At aminimum, the survey should request:
Name, location, and contact person of the operation;
Primary activity and type of graphic arts process(es) used at the facility;
Amount of inks, fountain solution, and cleaning solution used at the facility. Ifthe amount is expressed in gallons, the density of the materials will be needed aswell, in order to calculate emissions in weight units such as pounds or kilograms;
The VOC or the HAP content of each material, in pounds, or as a weightpercentage;
EIIP Volume III 7.4-1

CHAPTER 7 - GRAPHIC ARTS Final 11/18/96
The amount of material that is recovered and recycled, but not reused within thefacility; and
Control equipment and control efficiency.
During the planning phase, a scaling method should be identified and the survey form shouldrequest the information needed to scale up the data collected, such as total employment orproduction workers. If the survey results are to be converted into an area-specific emissionfactor, the surrogate activity will also need to be collected. Possible surrogate factors would beper unit, per facility, or per employee factors. If practical, use production workers rather thanthe total number of employees.
4.2 DISTRIBUTION
Survey distribution will be determined by the budget for the category. Surveys can bedistributed by mailing, with initial and follow-up telephone calls. Initial calls may be useful toidentify the portion of the survey set that does not have graphic arts processes occurring on theirpremises. These facilities are an important part of the sample because when the survey is scaledup, if that portion of facilities were to have emissions assigned to them, the emission estimateswould be too high. Survey distribution issues are discussed in Chapter 1,Introduction to AreaSource Emission Inventory Development,under Surveys, in Section 6.
4.3 SURVEY COMPILATION AND SCALING
Use the survey results to either develop an emission factor or an areawide emission estimate. Ifmaterial amounts were reported in gallons, then the gallons need to be converted to weight units:
Note that the amount of VOCs emitted during printing (volatile fraction) is not always
(7.4-1)Amount usedin pounds
Amount ofmaterial (gal) x
Density factor(lb/gal)
equivalent to the measured or estimated VOC content of the raw material (especially for offsetlithographic printing), since all the VOCs contained in the raw material may not be emittedduring printing. The data used in the alternative Ink Sales Emission Factor Method to determinethe VOC emissions by amount of ink used should be used with the Facility Survey Method ifthe volatile fraction specific to the process is not available. Refer to the Ink Sales EmissionFactor Method description and emission factors in Section 5 of this chapter. For example,although nonheatset lithographic inks may contain some VOCs, only 2 percent of the VOCs areemitted during printing.
Volume III7.4-2

Final 11/18/96 CHAPTER 7 - GRAPHIC ARTS
Use the equation below to estimate uncontrolled total emissions for each pollutant (P) emitted,from each type of graphic arts operation (i). Point source emissions should calculated using thesame equation and subtracted from the total emissions calculated using Equation 7.4-2.
An area source emission factor can be developed by calculating the area source emissions and
(7.4-2)
TotalUncontrolled EmissionsP
fromGraphic Arts
AmountRaw Materiali
Used
VolatileFractionP,i
AmountRecycledi
dividing the area source emissions by the area source activity rate:
When the emission factor is used, control efficiency (CE), rule penetration (RP), and rule
(7.4-3)Graphic Arts
EmissionFactorP,i
TotalUncontrolledEmissionsP,i
UncontrolledPoint SourceEmissionsP,i
÷Area Source
ActivityRatei
effectiveness (RE) need to be included as part of the emissions calculation. Please refer toSection 4.2 in Chapter 1 of this volume,Introduction to Area Source Emission InventoryDevelopmentfor more information about developing these factors.
EIIP Volume III 7.4-3

CHAPTER 7 - GRAPHIC ARTS Final 11/18/96
This page is intentionally left blank.
Volume III7.4-4

5
ALTERNATIVE METHODS FORESTIMATING EMISSIONS
The alternative methods for calculating emissions from the graphic arts source category are theInk Sales Emission Factor Method and the Per Capita Emission Factor Method. This sectionprovides an outline for estimating emissions from either ink sales or population data. Theprocedures follow below.
5.1 INK SALES EMISSION FACTOR METHOD
In the Ink Sales Emission Factor Method, total uncontrolled emissions from all graphic artsoperations sources are estimated using national or state ink sales data. This method’s advantagesare:
Inks are common to all printers and not used by any other source except printers;
The VOC content of the inks is fairly consistent and can be estimated on theaverage; and
The printing processes are technically consistent within each printing type (i.e.,emissions per unit of ink will be approximately the same from one facility toanother) for ink with the same VOC content used in the same type of printingprocess.
If the amount of printing ink that is recycled is expected to be significant in the inventory area,the emission estimate needs to be adjusted accordingly. Use information collected from thepoint source inventory to determine the rate of recycling at graphic arts facilities.
Uncontrolled point source emissions for each printing type are subtracted from the totaluncontrolled emissions calculated using this method to obtain uncontrolled area sourceemissions. If the uncontrolled point source emissions from graphic arts operations are notavailable or cannot be estimated, then the Facility Survey Method or the other alternative methodshould be used.
The total area source emissions from graphic arts operations are estimated from the sum ofemissions estimated for each of the six types of printing. If local information on ink sales is
EIIP Volume III 7.5-1

CHAPTER 7 - GRAPHIC ARTS 11/18/96
available, it should be used for this method. If local information is not available, the followingapproach should be used to estimate ink sales in the inventory area:
First, obtain apportioned ink sales by the following steps:
Obtain the amount of inks produced, in pounds, in the United States for theinventory year, from the Census Bureau’sCensus of Manufactures, Industry Seriesfor SIC Code 289, Miscellaneous Chemical Products.a
Apportion the nationwide ink amount produced for the inventory year to the statelevel by the ratio between state and national employment in printing andpublishing (SIC Code 27). The Census Bureau’s report,Statistics for IndustryGroups and Industries, can provide this information.a The equation to use is:
Next, correct the apportioned ink sales amount for point sources in the state. To do this,
(7.5-1)Total InkSales for
State
Total InkSales for
US
PrintingEmployment
in State
PrintingEmployment
in US
identify point sources (from the point source inventory) that have graphic arts processes at theirfacilities. The Aerometric Information Retrieval System (AIRS) Facility Subsystem (AFS)Source Classification Codes (SCCs) in Table 7.5-1 can be used to identify the applicable graphicarts emissions from the point source inventory. For these facilities, the following additionalinformation should be collected:
Facility location (county or inventory area);
Amount of ink used by the facility (amount purchased minus amount recycled);
SIC Code for the facility’s primary operation; and
a See the most recent publication, which can be obtained from the U.S. Bureau of theCensus, Department of Commerce, Washington, D.C.
Volume III7.5-2

11/18/96 CHAPTER 7 - GRAPHIC ARTS
TABLE 7.5-1
AFS SOURCE CLASSIFICATION CODES FOR GRAPHIC ARTS
Point SourceDescription Process Description SCC Units
Offset Lithography -All Processes
Dampening Solutionwith Isopropyl Alcohol
4-05-004-13 Tons Alcohol Used
Dampening Solutionwith Alcohol Substitute
4-05-004-15 Tons Substitute Used
Cleaning Solution -High Solvent Content
4-05-004-16 Tons Pure SolventUsed
Cleaning Solution -Water-Based
4-05-004-17 Tons Used
Heatset OffsetLithography
Heatset LithographicInks
4-05-004-11 Tons Solvent in Ink
Heatset LithographicInks
4-05-004-12 Gallons Ink
Heatset LithographicInks
4-05-004-01 Tons Ink
Heatset Ink Mixing 4-05-004-21 Tons Solvent in Ink
Heatset SolventStorage
4-05-004-22 Tons Solvent Stored
Nonheatset OffsetLithography
NonheatsetLithographic Inks
4-05-004-31 Tons Ink
NonheatsetLithographic Inks
4-05-004-32 Tons Solvent in Ink
NonheatsetLithographic Inks
4-05-004-33 Gallons Ink
Letterpress - AllProcesses
Letterpress CleaningSolution
4-05-002-15 Tons SolventConsumed
EIIP Volume III 7.5-3

CHAPTER 7 - GRAPHIC ARTS Final 11/18/96
TABLE 7.5-1
(CONTINUED)
Point SourceDescription Process Description SCC Units
Heatset Letterpress Heatset Letterpress Ink 4-05-002-01 Tons Ink
Heatset Letterpress Ink 4-05-002-11 Tons Solvent in Ink
Heatset Letterpress Ink 4-05-002-12 Gallons Ink
Ink Mixing 4-05-006-01 Tons Solvent in Ink
Storage 4-05-007-01 Tons Solvent Stored
Gravure Printing Gravure Ink 4-05-005-01 Tons Ink
Gravure Ink 4-05-005-11 Tons Solvent in Ink
Gravure Ink - HighSolvent Content
4-05-005-13 Gallons Ink
Gravure Ink -Water-Based
4-05-005-12 Gallons Ink
Ink Mixing 4-05-006-01 Tons Solvent In Ink
Solvent Storage 4-05-007-01 Tons Solvent Stored
Gravure CleanupSolvent
4-05-005-14 Tons SolventConsumed
FlexographicAlcohol-Based Inks
Flexographic Ink Use -Alcohol-Based
4-05-003-01 Tons Ink
Flexographic Ink Use -Alcohol-Based
4-05-003-11 Tons Solvent in Ink
Flexographic Ink Use -Alcohol-Based
4-05-003-13 Gallons Ink
Volume III7.5-4

Final 11/18/96 CHAPTER 7 - GRAPHIC ARTS
TABLE 7.5-1
(CONTINUED)
Point SourceDescription Process Description SCC Units
FlexographicAlcohol-Based Inks(Continued)
Flexographic Ink Use -Alcohol-Based
4-05-003-12 Gallons Ink
Flexographic-AlcoholCleanup
4-05-003-14 Tons SolventConsumed
Ink Mixing 4-05-003-01 Tons Solvent in Ink
Solvent Storage 4-05-007-01 Tons Solvent Stored
Flexographic Steam/Water-Based Ink
Flexographic Ink Use -Steam/Water-Based
4-05-003-15 Tons Ink
Flexographic Ink Use -Steam/Water-Based
4-05-003-16 Tons Solvent in Ink
Flexographic Ink Use -Steam/Water-Based
4-05-003-17 Tons Solvent Stored
Steam/Water-Based InkMixing
4-05-003-18 Tons Solvent Stored
Steam/Water-Based InkStorage
4-05-003-19 Tons Solvent Stored
Miscellaneous Cleaning Rags 4-05-008-01 Tons Solvent Used
EIIP Volume III 7.5-5

CHAPTER 7 - GRAPHIC ARTS Final 11/18/96
Facility’s employment, if the SIC Code is 27, and if it is available.
Subtract the amount of ink (do not include fountain solutions or cleaning solutions) used by allpoint source facilities in the state from the total amount of ink allocated to the state:
Determine the number of employees at printing and publishing point sourcefacilities (SIC Code 27) in the state and subtract those employees from the statetotal. The remaining employee numbers will be used to apportion the area sourceink sales numbers.
If the numbers of employees at the printing and publishing point source facilitiesis not available from the facilities’ permits, point source inventory information, orlocal employment data, then the employment can be derived from the U.S Bureauof the Census report,County Business Patterns.
When employment inCounty Business Patternsis presented as a number offacilities that have employment within a range of values, the total number ofemployees for all the facilities listed in each range can be estimated using themidpoint of the indicated size range. See Example 7.5-1 for more details.
The remaining amount of ink can be assumed to be responsible for area source emissions. Thisink should be apportioned from the state level to the inventory area, using the non-point-sourceemployment in facilities with SIC Codes of 27.
Apportion the statewide ink sales data for each type of printing to the inventory region by theratio of the printing employment in the inventory region for each printing type (t) to the stateprinting employment, as follows:
Apportion the inventory region ink sales to each type of printing, using the
(7.5-2)Total InkSales for
Inventory Region
Total InkSales for
State
PrintingEmploymentin Inventory
Region
PrintingEmployment
in State
estimated percentage product market share of ink sales for each type of printing inTable 7.2-3.
Volume III7.5-6

Final 11/18/96 CHAPTER 7 - GRAPHIC ARTS
Uncontrolled emission factors for ink, fountain solution, and cleaning solution, in
Example 7.5-1:
If an inventory for the region contains five graphic arts point sources, and the top fivegraphic arts facilities, by total employment, in theCounty Business Patternsfor theregion are distributed as follows: three facilities in the 100 to 149 employees perfacility size range and two facilities in the 50 to 99 employee per facility size range,then the total number of employees for point sources can be calculated using themidpoint of the employee size ranges, as in the equation below:
Total Employeesat Point Sources = 3
(100 + 149)+ 2
(50 + 99)= 3(124.5) + 2(74.5) = 523
2 2
Assume that point sources correspond to the facilities with the highest number ofemployees. Start with the facilities with the largest number of employees and sum thenumber of employees at the largest facilities for as many facilities as there are pointsource graphic arts facilities in the county for the desired SIC.
terms of pounds of VOCs emitted per pound of ink used, are in Table 7.5-2. Theequation to calculate uncontrolled emissions for a single printing type (t) is:
(7.5-3)
UncontrolledVOC Emissions
Area SourceInk t Sales
in theInventory Region
x
Ink EmissionFactort
FountainSolutionEmissionFactort
CleaningSolutionEmissionFactort
See Table 7.2-5 in this chapter for a summary of national rules for the graphic arts industry.Other types of controls and control efficiencies will vary from area to area and more stringentcontrols may be required, which will need to be identified from local rules or, if necessary,through a survey of a small cross section of area source graphic arts facilities. Please refer toSection 4.2 in Chapter 1 of this volume,Introduction to Area Source Emission InventoryDevelopmentfor more information about developing these factors. Alternatively, no controlscould be applied to the area source emission estimates, which will result in the mostconservative estimate.
EIIP Volume III 7.5-7

CHAPTER 7 - GRAPHIC ARTS 11/18/96
TABLE 7.5-2
COMPONENT VOC EMISSION FACTORS FOR GRAPHIC ARTS OPERATIONS
Type of Printing
Component Emission Factors(Pounds of VOC Emitted per Pound of Ink Used)
Ink Fountain Solution Cleaning Solution
Rotogravure 0.70a NAb 0.03a
Flexography 0.60a NA 0.04a
Offset Lithography
Heatset 0.32c 0.90c 0.03c
Nonheatset Web 0.02c 0.53c 0.03c
Nonheatset Sheet 0.02c 1.25c 1.10c
Newspaper 0.02c 0.07c 0.07c
Letterpress 0.24d NA e
Screen f NA f
Planographic f NA f
a Bay Area SIP (engineering judgement).b NA = not applicable.c EPA, 1994a.d EPA, 1993a.e Unknown at this time; use the emission factor for newspaper offset lithography if no other information is
available.f Unknown at this time. The Facility Survey Method should be used for these sources until information is
available if they are expected to be significant area source emissions.
Volume III7.5-8

Final 11/18/96 CHAPTER 7 - GRAPHIC ARTS
Calculate controlled area source emissions for each printing type (t) for theinventory region with the following equation:
(7.5-4)
ControlledArea SourceEmissionst
=
Area SourceInkt Sales
in the Inventory Regionx
Ink EmissionFactort
x
1
CE1
100x
RE1
100x
RP1
100
Fountain SolutionEmission Factort
x
1
CEFS
100x
REFS
100x
RPFS
100
Cleaning SolutionEmission Factort
x
1
CECS
100x
RECS
100x
RPCS
100
where:
(CEI,FS,CS) = Control efficiency (percent) for each material used: ink (I), fountainsolution (FS), and cleaning solution (CS);
(REI,FS,CS) = Rule effectiveness (percent); and
(RPI,FS,CS) = Rule penetration (percent).
Calculate the total area source controlled VOC emissions from graphic artsoperations in the inventory region by summing the controlled VOC emissions foreach type of printing (t):
(7.5-5)Total Controlled
Area SourceVOC Emissions inInventory Region
Total ControlledVOC Emissionst in the
Inventory Region
5.2 PER CAPITA EMISSION FACTOR METHOD
EIIP Volume III 7.5-9

CHAPTER 7 - GRAPHIC ARTS Final 11/18/96
This method calculates graphic arts emissions from the inventory area population. Thecorrelation between population and graphic arts activity is not strong and emissions calculatedusing this method will not reflect local variability in activity, controls, or types of printingtaking place.
Obtain the population of the inventory region from federal, state, or local censusdata for the current inventory year and the most recent year for which emissionestimates derived from survey data are available.
Estimate the total VOC emissions from graphic arts facilities with less than 100tons per year VOC emissions, as in the equation below:
(7.5-6)
Total UncontrolledEmissions from
Graphic ArtsFacilities with
<100 tpy Emissions(tons)
Population ofInventory
Region
0.00065(tons VOC per capita)
Note: The factor 0.00065 tons VOC per capita is equivalent to 1.3 pounds perperson per year (EPA, 1991). This factor was derived for facilities withemissions that are less than 10 tpy, and is independent of the number offacilities with emissions greater than 100 tpy in the inventory area.
Subtract the emissions from point sources in the inventory region (as defined bythe region) with emissions less than 100 tons per year using data from the pointsource inventory as in the equation below:
(7.5-7)Total UncontrolledEmissions from
Graphic ArtsArea Sources
Total UncontrolledEmissions from
Graphic ArtsFacilities with
<100 tpy Emissions
Total UncontrolledEmissions from
Graphic ArtsPoint Sources with<100 tpy Emissions
If information about CE, RE, and RP is available, then the following equationshould be used:
Volume III7.5-10
Final 11/18/96 CHAPTER 7 - GRAPHIC ARTS
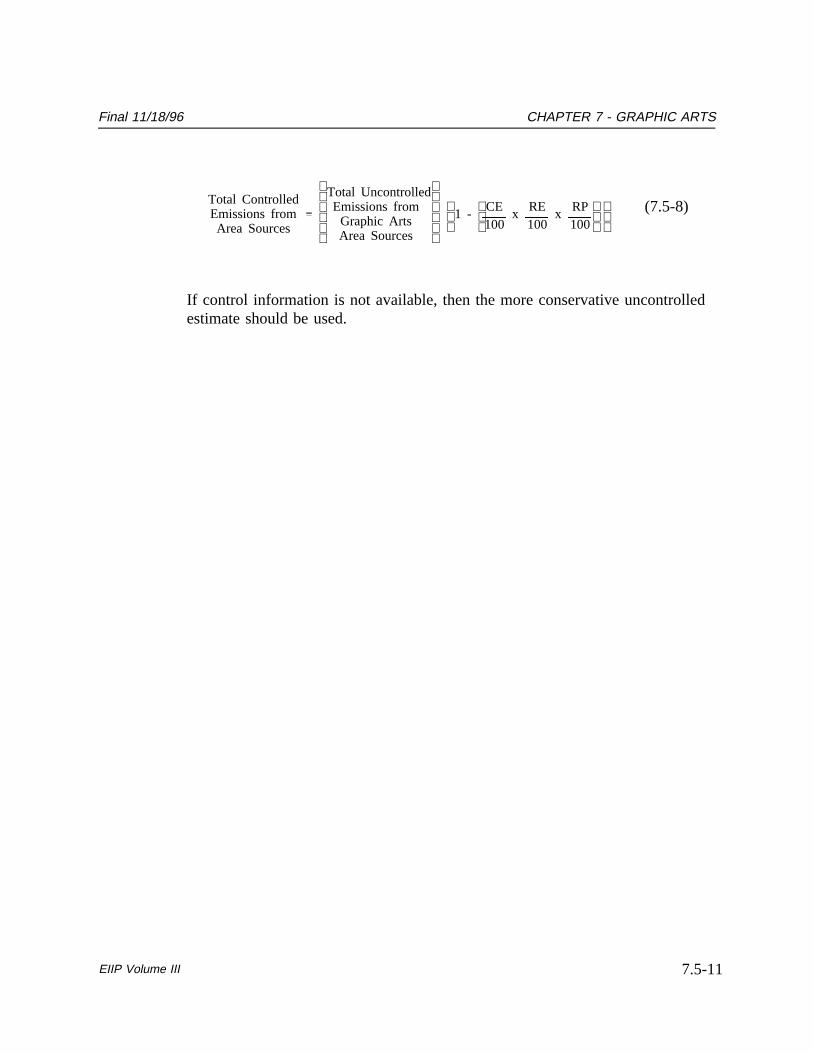
(7.5-8)Total ControlledEmissions fromArea Sources
Total UncontrolledEmissions from
Graphic ArtsArea Sources
1 -
CE100
x RE100
x RP100
If control information is not available, then the more conservative uncontrolledestimate should be used.
EIIP Volume III 7.5-11

CHAPTER 7 - GRAPHIC ARTS Final 11/18/96
This page is intentionally left blank.
Volume III7.5-12

6
QUALITY ASSURANCE/QUALITY CONTROL (QA/QC)
Data handling for all of the methods do not involve any category-specific issues; refer to thediscussion of data handling QA/QC in Volume VI for more information. When using theFacility Survey Method, the survey planning, sample design, and data handling should beplanned and documented in the inventory QA/QC plan. Refer to the discussion of surveyplanning and survey QA/QC in Chapter 1 of this volume.
6.1 EMISSION ESTIMATE QUALITY INDICATORS
The preferred method gives higher quality estimates than the alternative methods, but requiressignificantly more effort. The level of effort for the Facility Survey Method requires from 100to 800 hours depending on the size of the inventory region, the number of graphic artsoperation facilities, and the level of detail in the survey. The level of effort for the Ink SalesEmission Factor Method requires between 100 and 200 hours depending on the size of theinventory region, the number of graphic arts operation facilities, and the ease in obtaining theappropriate ink sales data. The level of effort required to calculate emissions using the PerCapita Emission Factor Method ranges from 8 to 40 hours.
6.1.1 DATA ATTRIBUTE RATING SYSTEM (DARS) SCORES
The DARS scores for each method are summarized in Tables 7.6-1, 7.6-2, and 7.6-3. A rangeof scores is given for the preferred and first alternative method because the implementation ofthese methods can vary. All scores assume that good QA/QC measures are performed and thatno significant deviations from the prescribed methods have been made. If these assumptionsare not met, new DARS scores should be developed according to the guidance in Appendix Fof EIIP Volume VI, Quality Assurance Procedures.
The preferred method gives a higher DARS score than the alternative methods, with theFacility Survey Method scoring higher than the Ink Sales Emission Factor Method that in turnscored higher than the Per Capita Emission Factor Method. The alternative methods havescores of 0.5 and 0.31, and the preferred method has a score ranging from 0.56 to 0.76. Therelatively high score for the Ink Sales Method assumes that ink sales data are available. Thismethod will have a lower score if the data cannot be obtained directly, and national data mustbe apportioned.
EIIP Volume III 7.6-1

CHAPTER 7 - GRAPHIC ARTS Final 11/18/96
6.1.2 SOURCES OF UNCERTAINTY
Some of the uncertainty of the emissions estimates based on the Facility Survey Method can bequantified using standard statistical methods. A relative and qualitative assessment can bemade for other methods. The Facility Survey Method will be the least uncertain, since (intheory) the local mix of process types and sizes will be accounted for. Emissions from printingtypes in which most of the ink evaporates from the substrate can be estimated by mass balancewith a high degree of certainty. The uncertainty in the emissions estimate is highest formaterial when an estimate of the amount of VOCs retained in the substrate is needed and iscomparable in magnitude to that emitted (for heatset offset lithographic printing only).However, the scaling of the survey results will need to be planned with care. The surrogate(s)should reflect the printing activity for each facility including the nonpublishing and printingindustries that use graphic arts processes.
The Ink Sales Emission Factor Method’s advantage is that the ink sales data and theinformation used for the apportioning method are readily available and inexpensive. However,the use of surrogate apportioning factors to apportion the national ink usage to the inventoryarea and national percentages to allocate ink usage to the different types of printing introducesuncertainty. Because the estimated emissions of each type of material used in printing is notexpected to vary widely from facility to facility, and because the type of printing is usuallyknown with a high degree of certainty, the emission factors used in the Ink Sales EmissionFactor Method will have the same certainty as that used in the Facility Survey Method.
The Per Capita Emission Factor Method will have the highest degree of uncertainty, since atrue relationship between population and printing has not been established. Since the per capitaemission factor was developed from national data, as the spatial scale is reduced from thenational level, the uncertainty of the emissions estimated is greatly increased. Also, because ofvariation in emissions among the types of printing, population data will likely not reflect thelocal distribution of printing type, and consequently, emissions.
Volume III7.6-2

Final 11/18/96 CHAPTER 7 - GRAPHIC ARTS
TABLE 7.6-1
FACILITY SURVEY METHOD DARS SCORES
Attribute
Scores
Factor Activity Emissions
Measurement 0.5 0.8 - 0.9 0.4 - 0.45
Source Specificity 0.8 - 0.9 0.5 - 0.8 0.4 - 0.72
Spatial 0.9 0.9 - 1.0 0.81 - 0.90
Temporal 0.8 - 1.0 0.8 - 1.0 0.64 - 1.0
Composite Scores 0.83 - 0.90 0.75 - 0.85 0.56 - 0.76
TABLE 7.6-2
INK SALES EMISSION FACTOR METHOD DARS SCORES
Attribute
Scores
Factor Activity Emissions
Measurement 0.4 - 0.5 0.6 0.24 - 0.30
Source Specificity 0.8 - 0.9 0.8 - 0.9 0.64 - 0.81
Spatial 0.7 - 0.6 0.7 - 0.6 0.49 - 0.36
Temporal 0.7 - 0.6 0.9 0.63 - 0.54
Composite Scores 0.65 0.75 0.5 - 0.49
EIIP Volume III 7.6-3

CHAPTER 7 - GRAPHIC ARTS Final 11/18/96
TABLE 7.6-3
PER CAPITA METHOD DARS SCORES
Attribute
Scores
Factor Activity Emissions
Measurement 0.4 0.8 0.32
Source Specificity 0.5 0.4 0.2
Spatial 0.3 1.0 0.27
Temporal 0.5 1.0 0.45
Composite Scores 0.43 0.75 0.31
Volume III7.6-4

7
DATA CODING PROCEDURES
This section describes the codes available to characterize the graphic arts emission estimates.Consistent categorization and coding will result in greater uniformity between inventories.Inventory planning for data collection calculations and inventory presentation should take thedata formats presented in this section into account. Available codes and process definitionsmay impose constraints or requirements on the preparation of emission estimates for thiscategory.
7.1 PROCESS AND CONTROL CODES
The source category process codes for the graphic arts operations are shown in Table 7.7-1.These codes are derived from the EPA’s AIRS Area and Mobile Source (AMS) sourcecategory codes (EPA, 1994b).
The control device codes shown in Table 7.7-2 may be used in AMS to record the level ofcontrol used for this source in the inventory region. Federal, state, and local regulations can beused as guides to estimate the type of control used and the level of efficiency that can beachieved. Be careful to apply only the regulations that specifically include area sources. If aregulation is applicable only to point sources, it should not be assumed that similar controlsexist at area sources without a survey. The equations that utilize the control efficiency tocalculate area source emissions for the inventory region are discussed in Chapter 1 of thisvolume.
Other control devices may be used in the graphic arts industry. The "099" code can be usedfor miscellaneous control devices that do not have a unique control device identification code.The "999" code can be used for a combination of control devices where only the overallcontrol efficiency is known.
EIIP Volume III 7.7-1

CHAPTER 7 - GRAPHIC ARTS Final 11/18/96
TABLE 7.7-1
AIRS AMS CODES FOR THE GRAPHIC ARTS
Category Description Process Description AMS Code Units
Graphics Arts: All Processes Total: All Solvent Types 24-25-000-000 Tons VOCs Emitted
TABLE 7.7-2
AIRS CONTROL DEVICE CODES
Control Device Code
Catalytic AfterburnerCatalytic Afterburner with Heat ExchangerDirect Flame AfterburnerDirect Flame Afterburner with Heat ExchangerActivated Carbon AdsorptionVapor Recovery SystemProcess ChangeProcess EnclosedMiscellaneous Control DeviceCombined Control Devices
019020021022048047046054099999
Volume III7.7-2

8
REFERENCES
Darnay, A.J. (Editor). 1990.Manufacturing USA, A Ward’s Business Directory(First Edition).Gale Research, Inc., Detroit, Michigan.
EPA. 1995a. National Emission Standards for Hazardous Air Pollutants: Printing andPublishing Industry-Background for Proposed Standards. U.S. Environmental ProtectionAgency, Office of Air Quality Planning and Standards, EPA-453/R-95-002a. Research TrianglePark, North Carolina.
EPA. 1995b. Economic Impact Analysis for the Printing and Publishing NESHAP.U.S. Environmental Protection Agency, Office of Air Quality Planning and Standards,EPA-452/D-95-001. Research Triangle Park, North Carolina.
EPA. 1994a. Alternative Control Techniques Document: Offset Lithographic Printing.U.S. Environmental Protection Agency, Office of Air Quality Planning and Standards,EPA-453/R-94-054. Research Triangle Park, North Carolina.
EPA. 1994b. AIRS Database. U.S. Environmental Protection Agency, Office of Air QualityPlanning and Standards. Research Triangle Park, North Carolina.
EPA. 1993a. Compilation of Air Pollution Emission Factors, Volume I: Stationary Point andArea Sources, Fourth Edition and Supplements A-F, AP-42(September 1985 throughSeptember 1991), GPO 055-000-00251-7. U.S. Environmental Protection Agency, Office ofAir Quality Planning and Standards. Research Triangle Park, North Carolina.
EPA. 1993b. Guidance on the Relationship Between the 15 Percent Rate of Progress Plansand Other Provisions of the Clean Air Act. U.S. Environmental Protection Agency,EPA-452/R-93-007 (NTIS PB93-200525). Research Triangle Park, North Carolina.
EPA. 1991. Procedures for the Preparation of Emissions Inventories for Carbon Monoxideand Precursors of Ozone, Volume 1: General Guidance for Stationary Sources.U.S. Environmental Protection Agency, Office of Air Quality Planning and Standards,EPA-450/4-91-016 (NTIS PB92-112168). Research Triangle Park, North Carolina.
EIIP Volume III 7.8-1

CHAPTER 7 - GRAPHIC ARTS Final 11/18/96
EPA. 1990. The 1985 NAPAP Emission Inventory: Development of Temporal AllocationFactors. U.S. Environmental Protection Agency, EPA-600/7-89-010d. Research Triangle Park,North Carolina.
EPA. 1980. Publication Rotogravure Printing - Background Information for ProposedStandards. U.S. Environmental Protection Agency, Office of Air Quality Planning andStandards, EPA-450/3-80-031a. Research Triangle Park, North Carolina.
EPA. 1978. Control of Volatile Organic Compound Emissions from Existing StationarySources-Volume VIII: Graphic Arts-Rotogravure and Flexography. U.S. EnvironmentalAgency, Office of Air Quality Planning and Standards, EPA-450/2-78-033. Washington, D.C.
Renson, James, National Association of Printing Ink Manufacturers. September 10, 1991.Printing Inks and Solvent Use. Letter and attachments to George Viconovic, E.H. Pechan &Associates.
Ulconovic, George, E.H. Pechan & Associates, Durham, North Carolina, with Gary Jones,Graphic Arts Technical Foundation, Pittsburgh, Pennsylvania. July 22, 1991.
National Association of Printing Ink Manufacturers. 1988.The Printing Ink Handbook(FifthEdition). Product and Technical Committees, Harrison, New York.
Volume III7.8-2