eindhoven university of technology master designing viable networked business … · designing...
TRANSCRIPT
Eindhoven University of Technology
MASTER
Designing viable networked business models for the internet of things
van der Mierden, A.B.M.
Award date:2015
Link to publication
DisclaimerThis document contains a student thesis (bachelor's or master's), as authored by a student at Eindhoven University of Technology. Studenttheses are made available in the TU/e repository upon obtaining the required degree. The grade received is not published on the documentas presented in the repository. The required complexity or quality of research of student theses may vary by program, and the requiredminimum study period may vary in duration.
General rightsCopyright and moral rights for the publications made accessible in the public portal are retained by the authors and/or other copyright ownersand it is a condition of accessing publications that users recognise and abide by the legal requirements associated with these rights.
• Users may download and print one copy of any publication from the public portal for the purpose of private study or research. • You may not further distribute the material or use it for any profit-making activity or commercial gain
Eindhoven, July 2015
Designing viable Networked
Business Models
for the Internet of Things
by A.B.M. (Fonzie) van der Mierden
in partial fulfilment of the requirements for the degree of
Master of Science in Innovation Management
Supervisors:
TU/e dr. ir. I.M.M.J. (Isabelle) Reymen
TU/e dr. J.J.L. (Jeroen) Schepers
Innovalor dr. W. (Wil) Janssen
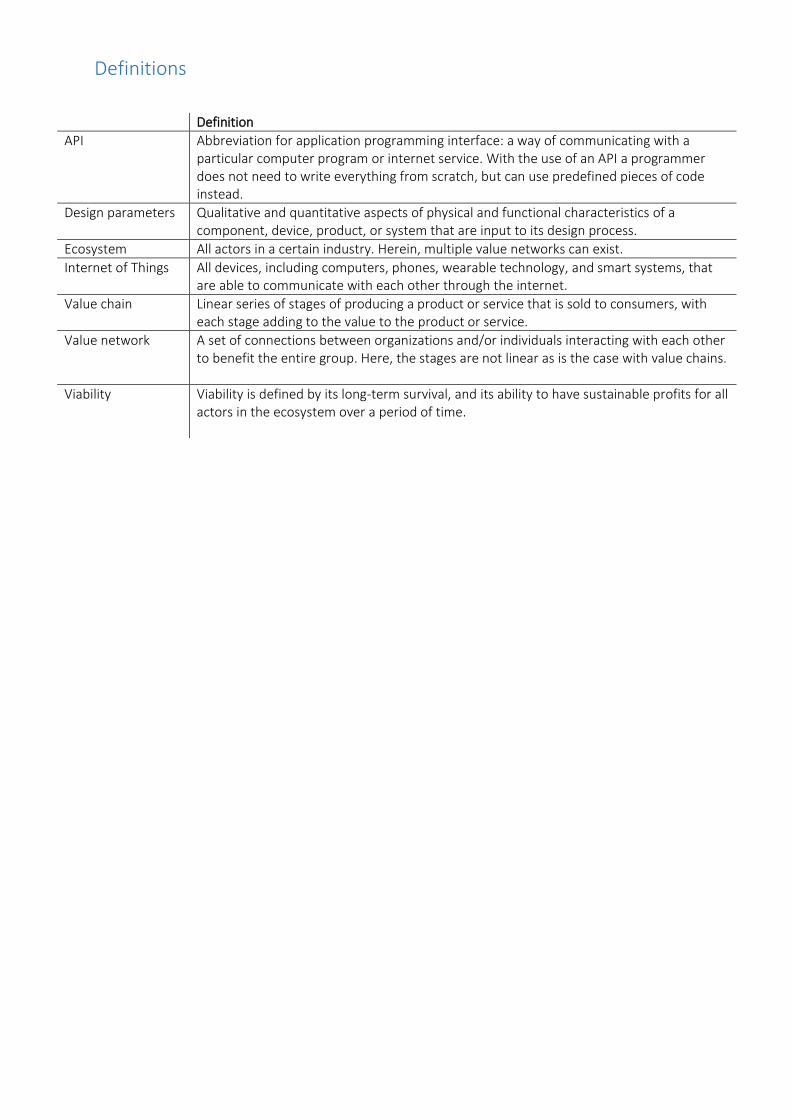
Definitions
Definition
API Abbreviation for application programming interface: a way of communicating with a particular computer program or internet service. With the use of an API a programmer does not need to write everything from scratch, but can use predefined pieces of code instead.
Design parameters Qualitative and quantitative aspects of physical and functional characteristics of a component, device, product, or system that are input to its design process.
Ecosystem All actors in a certain industry. Herein, multiple value networks can exist.
Internet of Things All devices, including computers, phones, wearable technology, and smart systems, that are able to communicate with each other through the internet.
Value chain Linear series of stages of producing a product or service that is sold to consumers, with each stage adding to the value to the product or service.
Value network A set of connections between organizations and/or individuals interacting with each other to benefit the entire group. Here, the stages are not linear as is the case with value chains.
Viability Viability is defined by its long-term survival, and its ability to have sustainable profits for all actors in the ecosystem over a period of time.
Management summary
Problem and Research question This master thesis is about business models in value networks. Industries have become more connected,
forming complex ecosystems. Therefore, the linear way of thinking of the value chain does not apply
any longer. Because of this complexity, practitioners find it difficult to define the influences of their
business model on the value network and vice versa. The general solution direction should deliver value
for practitioners in the field of IT on the management level, where new trends are making their way to
business practices. The results should provide a rationale in how to act upon one of these trends, the
Internet of Things. This leads to the main research question:
RQ: What are viable Networked Business Models for the Internet of Things?
Broadly the research can be divided in two parts, the first is aimed at finding a method to describe the
Networked Business Model, while the second is aimed at finding design parameters that determine
viability of the Networked Business Model of the Internet of Things.
Literature Industries that were once separately from each other are now converging (de Man, 2004). This is
because of rising R&D costs, shorter product life cycle time (Chesbrough, 2007), the distribution of
knowledge (Chesbrough, 2013), and innovation inefficiencies. It is argued that business models should
be an integral part of innovation, rather than just technology and R&D (Chesbrough, 2007). Business
models have made a shift from closed to open to counter these problems.
When taking a look at the IT sector, the ubiquitous growth of information technology itself combined
with the internet has brought about changes in the new product development sector described above.
The easiness to plug into this universal platform has removed many traditional barriers to enter, with
many competitors as a result. Customers find it easier than ever to switch providers. According to
Gershenfeld and Vasseur (2014) the impressive growth of the internet in the past two decades is about
to be overshadowed as the "things" that surround us start going online. Kevin Ashton of Procter &
Gamble has introduced the term Internet of Things in 1998. This Internet of Things has become a new
paradigm, that connects every object around us, providing anyone with anytime, anywhere access to
information (ITU, 2005) (Gomez, Huete, Hoyos, Perez, & Grigori, 2013). These connected objects, also
called “things”, can have different purposes including identification, communication, sensing, and data
collection (Oriwoh, Sant, & Epiphaniou, 2013). To further define these “things” it can be said that it
ranges from mobile devices to general household objects with the capability for sensing or
communication through the use of technologies such as radio frequency identification (RFID) (Oriwoh,
Sant, & Epiphaniou, 2013) (Gomez, Huete, Hoyos, Perez, & Grigori, 2013). Only specialization will enable
firms to deliver value to their customers, employees and shareholders (IBM Business Consulting
Services, 2005). One way of specialization as described by IBM is external specialization. In this last
phase, companies focus on their specific areas of expertise and began to become a part of the
ecosystem, flexible networks driven by collaboration, universal connectivity and standardized
contracting (IBM Business Consulting Services, 2005).
It is no longer effective to think about networks as closed systems, where companies are subject of
uncontrollable outside influences (Peppard & Rylander, 2006). These influences can and maybe must
be acted upon by each actor in the network in order to enhance value creation. Thus the value chain is
becoming an inappropriate tool, as products and services become dematerialized and the value chain
in many cases does not any longer has a physical dimension. A Network value concept should be
adopted, in which value is not encompassed downstream to the next link in the value chain, but is co-
created by a combination of actors in the value network. Here, the focus is not on the firm itself, but on
the network as a whole (Peppard & Rylander, 2006).
Looking at business model development, the next step could be the development of the Networked
Business Model, or as Ehrenhard, Kijl, and Nieuwenhuis (2014) suggest a ‘value network canvas’ to help
businesses get an understanding of the ecosystem they are part of and the underlying value network.
Whereas the business model canvas and other methods, as described in this thesis, are company-
centric, the Networked Business Model should have a multi-actor focus which is also more in line with
platform based service offerings.
Research design To answer the question how to describe the Networked Business Model, first a list of requirements to
describe the Networked Business Model is needed, after this we can look how existing business
modeling methods perform in terms of these requirements. Here, academic as well as non-academic
literature is reviewed, to identify business modeling methods used specifically in an ecosystem. To
determine how existing business modeling methods perform in term of the requirements, a focus group
with experts on business modeling is used. The goal is to find one or more methods that sufficiently can
describe the Networked Business Model. The focus group consisted of people that have experience with
business modeling and have worked with multiple business modeling techniques before.
To find design parameters that determine viability of the Networked Business Model, literature, case
studies are studied and practitioners in the field of the Internet of Things are interviewed. Case studies
are used to identify design parameters that determine viability of the Networked Business Model in
general. The interviews in their turn were held to describe the Networked Business Model of the
Internet of Things, making use of the method identified in this thesis to describe the Networked Business
Model. The interviews were also aimed at revealing new design parameters that make up viability of
the Networked Business Model of the Internet of Things. These design parameters, combined with the
design parameters identified from the case studies and literature were used to design viable Networked
Business Models for the Internet of Things.
Analysis
Requirements for the Networked Business Model Hearn & Pace (2006), which argue that the name ‘value chain’ in the digital era is not appropriate any
longer. They identify five component shifts in order to get from the value chain to a value ecology, which
are rewritten to the following requirements for the Networked Business Model:
R1. Takes into account co-creators of value, rather than solely consumers.
R2. Is concerned with value networks, rather than value chains.
R3. Is concerned with network value, rather than product value.
R4. Is concerned with complex co-opetition, rather than simple co-operation or competition.
R5. Is concerned with strategy in relation to the value ecology as a whole, rather than thinking
about individual firm strategy.
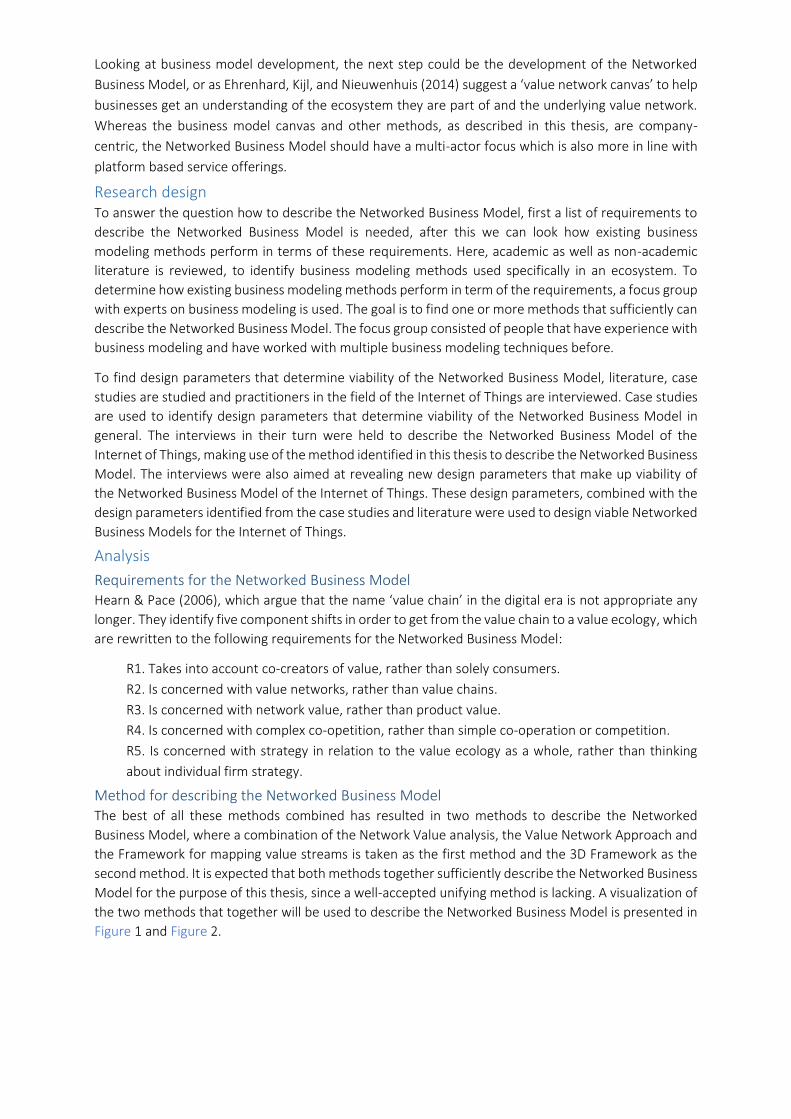
Method for describing the Networked Business Model The best of all these methods combined has resulted in two methods to describe the Networked
Business Model, where a combination of the Network Value analysis, the Value Network Approach and
the Framework for mapping value streams is taken as the first method and the 3D Framework as the
second method. It is expected that both methods together sufficiently describe the Networked Business
Model for the purpose of this thesis, since a well-accepted unifying method is lacking. A visualization of
the two methods that together will be used to describe the Networked Business Model is presented in
Figure 1 and Figure 2.
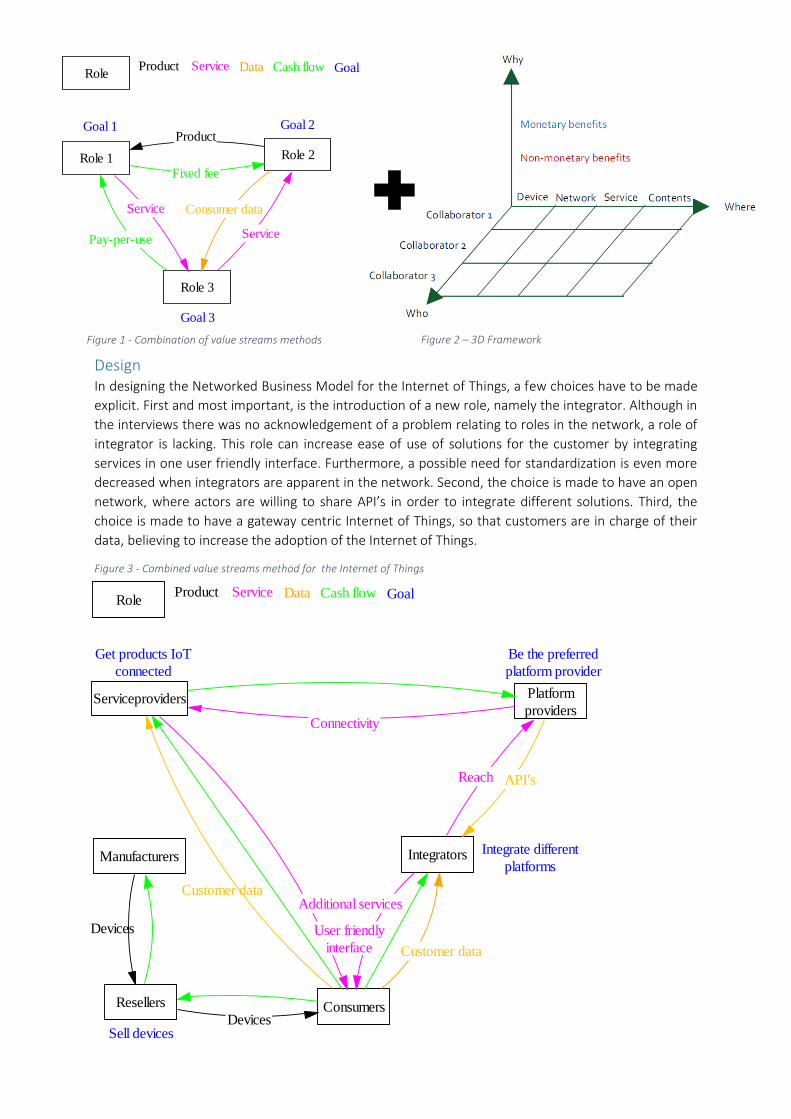
Figure 2 – 3D Framework Figure 1 - Combination of value streams methods
RoleProduct Service Cash flow GoalData
Role 1 Role 2
Role 3
Goal 1 Goal 2
Goal 3
Fixed fee
Product
Consumer data
Service
Service
Pay-per-use
Serviceproviders Platform
providers
Integrators
ConsumersResellers
RoleProduct Service Cash flow GoalData
Customer data
Reach
Devices
Devices
Be the preferred
platform provider
Get products IoT
connected
Sell devices
API's
Integrate different
platforms
Connectivity
Additional services
User friendly
interface Customer data
Manufacturers
Design In designing the Networked Business Model for the Internet of Things, a few choices have to be made
explicit. First and most important, is the introduction of a new role, namely the integrator. Although in
the interviews there was no acknowledgement of a problem relating to roles in the network, a role of
integrator is lacking. This role can increase ease of use of solutions for the customer by integrating
services in one user friendly interface. Furthermore, a possible need for standardization is even more
decreased when integrators are apparent in the network. Second, the choice is made to have an open
network, where actors are willing to share API’s in order to integrate different solutions. Third, the
choice is made to have a gateway centric Internet of Things, so that customers are in charge of their
data, believing to increase the adoption of the Internet of Things.
Figure 3 - Combined value streams method for the Internet of Things
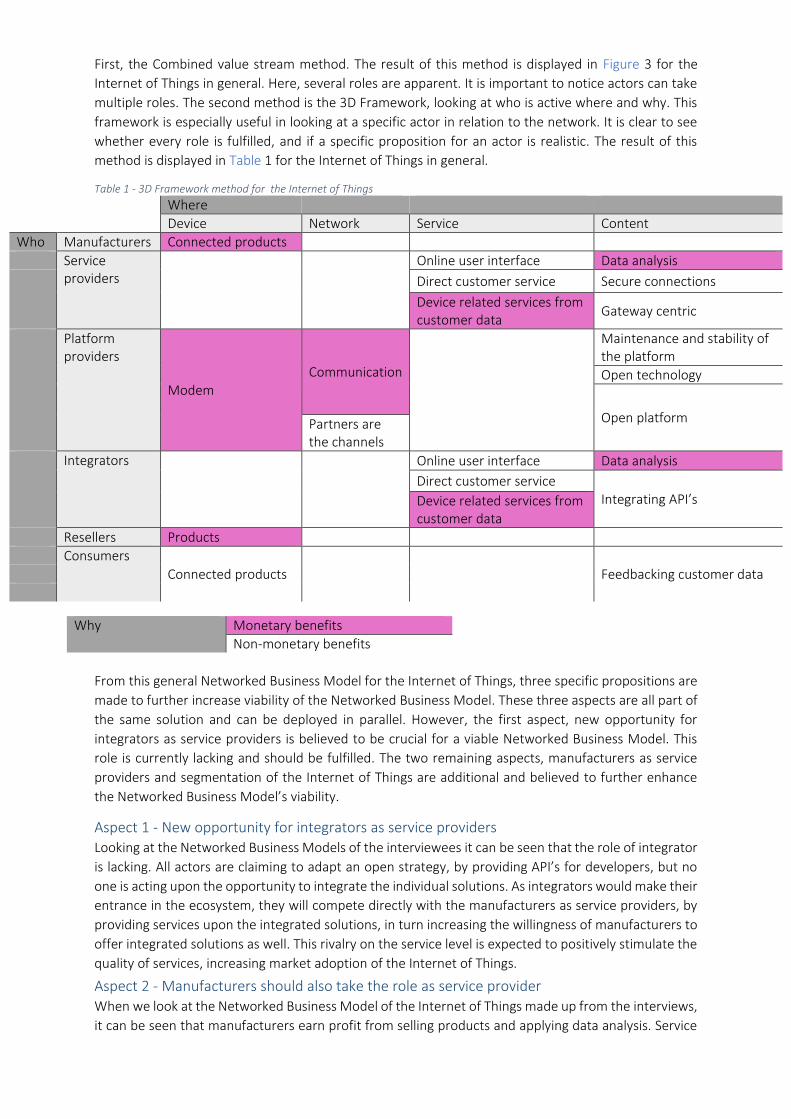
First, the Combined value stream method. The result of this method is displayed in Figure 3 for the
Internet of Things in general. Here, several roles are apparent. It is important to notice actors can take
multiple roles. The second method is the 3D Framework, looking at who is active where and why. This
framework is especially useful in looking at a specific actor in relation to the network. It is clear to see
whether every role is fulfilled, and if a specific proposition for an actor is realistic. The result of this
method is displayed in Table 1 for the Internet of Things in general.
Table 1 - 3D Framework method for the Internet of Things
Where
Device Network Service Content
Who Manufacturers Connected products
Service providers
Online user interface Data analysis
Direct customer service Secure connections
Device related services from customer data
Gateway centric
Platform providers
Modem Communication
Maintenance and stability of the platform
Open technology
Open platform Partners are the channels
Integrators
Online user interface Data analysis
Direct customer service Integrating API’s Device related services from
customer data
Resellers Products
Consumers
Connected products Feedbacking customer data
Why Monetary benefits
Non-monetary benefits
From this general Networked Business Model for the Internet of Things, three specific propositions are
made to further increase viability of the Networked Business Model. These three aspects are all part of
the same solution and can be deployed in parallel. However, the first aspect, new opportunity for
integrators as service providers is believed to be crucial for a viable Networked Business Model. This
role is currently lacking and should be fulfilled. The two remaining aspects, manufacturers as service
providers and segmentation of the Internet of Things are additional and believed to further enhance
the Networked Business Model’s viability.
Aspect 1 - New opportunity for integrators as service providers Looking at the Networked Business Models of the interviewees it can be seen that the role of integrator
is lacking. All actors are claiming to adapt an open strategy, by providing API’s for developers, but no
one is acting upon the opportunity to integrate the individual solutions. As integrators would make their
entrance in the ecosystem, they will compete directly with the manufacturers as service providers, by
providing services upon the integrated solutions, in turn increasing the willingness of manufacturers to
offer integrated solutions as well. This rivalry on the service level is expected to positively stimulate the
quality of services, increasing market adoption of the Internet of Things.
Aspect 2 - Manufacturers should also take the role as service provider When we look at the Networked Business Model of the Internet of Things made up from the interviews,
it can be seen that manufacturers earn profit from selling products and applying data analysis. Service
providers are mentioned separately from manufacturers. My vision is that manufacturers should make
a shift from solely manufacturer to service provider, by providing the customer with a service rather
than just a connected product. An example of such a service could be to deliver ‘personalized light’
instead of lamps. This way, actors in the network would be more willing to integrate different solutions
to improve their service offering. This service oriented focus is expected to increase the ease of use of
provided solutions. These services, belonging to certain products should be gateway centric. By doing
this, manufacturers do not have to share their software codes and customers could be provided with
the option to opt in or opt out from customer data sharing. Another benefit is that making the solutions
gateway centric sets the manufacturer independent from the platform provider in terms of data sharing
possibilities. This being said, the Networked Business Model looks at roles, rather than actors, leaving
the possibility open for an actor to exploit multiple roles.
Aspect 3 - Segmentation of the Internet of Things To further increase the chances of successful adoption of the Internet of Things, segmentation should
be applied. For example, the Internet of Things for connected homes is not expected to have a lot to do
with the Internet of Things in a public area, such as public transportation, and therefore should be
separated from each other in terms of actors. Different segments are served by different integrators,
who integrate the solutions provided by manufacturers as service providers. By applying segmentation,
the chances of each individual segment of the Internet of Things to succeed is increased, being
independent from the success of the Internet of Things as a whole.
Discussion This research is contributing to literature in a couple of ways. First, it is contributing to recent
propositions that argue for the need of a new business model in this world of complex ecosystems
(Ehrenhard, Kijl, & Nieuwenhuis, 2014). This thesis is contributing by performing a meta-analysis of 13
existing business modeling methods to come to the best way to describe the Networked Business
Model. Second, this research provides design parameters for the Networked Business Model in general,
and specifically for the Networked Business Model of the Internet of Things. Contribution of this
research is by providing an integrated table that contains design factors for the Internet of Things in
general. This is done to come to a design that is well-grounded in theory, besides being practically
relevant. Last, not much is written about the Internet of Things and the Networked Business Model.
Therefore, the results of this thesis is believed contribute to the understanding of researchers on these
two unfamiliar topics.
Practical implications First, the advise is to start small, by segmenting the Internet of Things. Not everything should be
connected. Take a look at the combination of products and data available and decide which goal you
want to achieve. This should be the first step in becoming active in the Internet of Things.
Second, entrepreneurs wanting to be active in the field of the Internet of Things should take the role as
integrator. However there is no acknowledgement of a problem on the integration part, this role is
clearly lacking. As an integrator you must combine services to come to a unique offering, adding extra
value for the customers. This does not come without risk, however, there is a chance manufacturers will
turn from open to closed when rivalry on the service level is considered to be too big. On the other
hand, the integrator role does not come with high investments. Partnerships are not considered to be
a limiting effect, since these are not long-term.
Third, manufacturers should also take the role as service provider. This service oriented focus is
expected to increase the ease of use of provided solutions. These services, belonging to certain products
should be gateway centric. By doing this, manufacturers do not have to share their software codes and
customers could be provided with the option to opt in or opt out from customer data sharing.
Fourth, the advice is not to wait acting upon the opportunities of the Internet of Things. A start can
already be made by becoming active in the field of the Internet of Things by applying the segmentation
rationale as explained above.
Table of content 1. Introduction ..................................................................................................................................... 7
2. Research methodology .................................................................................................................... 8
2.1 Research questions ........................................................................................................................ 8
2.2 Research design ............................................................................................................................. 9
2.2.1 Performance of existing business modeling methods in terms of the requirements of the
Networked Business Model ........................................................................................................... 11
2.2.1.1 Selecting existing business modeling methods .............................................................. 11
2.2.1.2 Requirements ................................................................................................................ 12
2.2.1.3 Focus group ................................................................................................................... 12
2.2.1.4 Analysis .......................................................................................................................... 13
2.2.2 Case studies to determine the viability of Networked Business Models .............................. 13
2.2.2.1 Case selection ................................................................................................................ 13
2.2.2.2 Analysis .......................................................................................................................... 13
2.2.3 Interviews practitioners to indicate design parameters that determine the viability of the
Internet of Things .......................................................................................................................... 14
2.2.3.1 Company selection......................................................................................................... 14
2.2.3.2 Data collection ............................................................................................................... 14
2.2.3.3 Analysis .......................................................................................................................... 14
2.2.4 Designing viable Networked Business Models ...................................................................... 15
3. Literature ....................................................................................................................................... 16
3.1 The Networked Business Model .................................................................................................. 16
3.1.1 Introduction and context ...................................................................................................... 16
3.1.1 History of value ecologies ................................................................................................. 16
3.1.2 From value chain to value network ................................................................................... 18
3.1.2 Existing Business Modeling methods .................................................................................... 19
3.1.3 Requirements for the Networked Business Model ............................................................... 19
3.1.4 Design parameters that determine viability of Networked Business Models according to
theory ............................................................................................................................................ 21
3.1.4.1 Platform theory .............................................................................................................. 21
3.1.4.2 Network theory .............................................................................................................. 22
3.1.4.3 Business ecosystems theory .......................................................................................... 22
3.1.4.4 Conclusion ..................................................................................................................... 22
3.2 The Internet of Things .................................................................................................................. 23
3.2.1 Developments in IT ............................................................................................................... 24
3.2.2 Description of the Internet of Things .................................................................................... 23
3.2.3 Use cases of the Internet of Things ....................................................................................... 25
3.2.3.1 eTag and eTrack ............................................................................................................. 25
3.2.3.2 CeNSE ............................................................................................................................. 25
3.2.3.3 Webfleet ........................................................................................................................ 26
3.2.4 Architecture of the Internet of Things .................................................................................. 26
4. Analysis .......................................................................................................................................... 27
4.1 Describing the Networked Business Model ................................................................................. 27
4.1.1 Existing Business Modeling methods in terms of the Networked Business Model ............... 27
4.1.2 Conclusion ............................................................................................................................ 28
4.2 Design parameters that determine the viability of Networked Business Models according to use
cases .................................................................................................................................................. 29
4.2.1 Case studies .......................................................................................................................... 29
4.2.1.1 Mobile payment ............................................................................................................. 29
4.2.1.2 Smart homes .................................................................................................................. 29
4.2.1.3 e-Health ......................................................................................................................... 30
4.2.2 Conclusion ............................................................................................................................ 30
4.3 The Networked Business Model of the Internet of Things .......................................................... 34
4.3.1 Interviews practitioners ........................................................................................................ 34
4.3.1.1 The Networked Business Model of Company 1 ............................................................. 34
4.3.1.2 The Networked Business Model of Company 2 ............................................................. 35
4.3.1.3 The Networked Business Model of Company 3 ............................................................. 36
4.3.1.4 The Networked Business Model of Company 4 ............................................................. 37
4.3.1.5 The Networked Business Model of Company 5 ............................................................. 39
4.3.2 Conclusion ............................................................................................................................ 41
4.3.3 Design parameters that determine the viability of Networked Business Models in the
Internet of Things according to practitioners ................................................................................ 41
5. Design ............................................................................................................................................ 43
5.1 Design .......................................................................................................................................... 46
5.1.1 Aspect 1 - New opportunity for integrators as service providers ......................................... 48
5.1.2 Aspect 2 - Manufacturers should also take the role as service provider .............................. 49
5.1.3 Aspect 3 - Segmentation of the Internet of Things ............................................................... 50
5.2 SWOT analysis .............................................................................................................................. 51
6. Discussion ...................................................................................................................................... 53
6.1 Contributions to literature ........................................................................................................... 54
6.2 Limitations and further research ................................................................................................. 55
6.3 Practical implications ................................................................................................................... 56
References ............................................................................................................................................. 58
Appendix A ............................................................................................................................................. 64
A1 Osterwalder – Business Model Canvas ..................................................................................... 64
A2 Gordijn – E3-value .................................................................................................................... 64
A3 Chesbrough – The Business Model Framework ........................................................................ 66
A4 Peppard – Network Value Analysis ........................................................................................... 67
A5 Pieter Ballon – Business Model Design Matrix.......................................................................... 68
A6 Allee – Value Network Approach .............................................................................................. 69
A7 Bouwman – STOF model........................................................................................................... 70
A8 IBM – Component Business Model ........................................................................................... 73
A9 Pynnönen – Framework for mapping value streams ................................................................ 74
A10 Solaimani – VIP Framework .................................................................................................... 76
A11 Bouwman – Stress test ........................................................................................................... 77
A12 Lindgren – The Business Model Cube ..................................................................................... 79
A13 El Sawy - VISOR ....................................................................................................................... 81
A14 Søilen – The value grid framework ......................................................................................... 81
A15 Turber – 3D Framework .......................................................................................................... 82
Appendix B ............................................................................................................................................. 84
7
1. Introduction This master thesis is about business models in value networks. Industries have become more connected,
forming complex ecosystems. Therefore, the linear way of thinking of the value chain does not apply
any longer. Because of this complexity, practitioners find it difficult to define the influences of their
business model on the value network and vice versa.
Although there is consensus on the business model on the firm-level (Rajala & Westerlund, 2008),
literature on business ecosystems suggests a network view on business models is needed (Carbone,
2009) (Muegge, 2013). Or, as Weiler & Neely (2013) state the problem, the existing methods for
business modeling are firm-centric by focusing on the challenges facing single organizations, but are
suited to analyze the interdependent nature of the growth and success of companies that are evolving
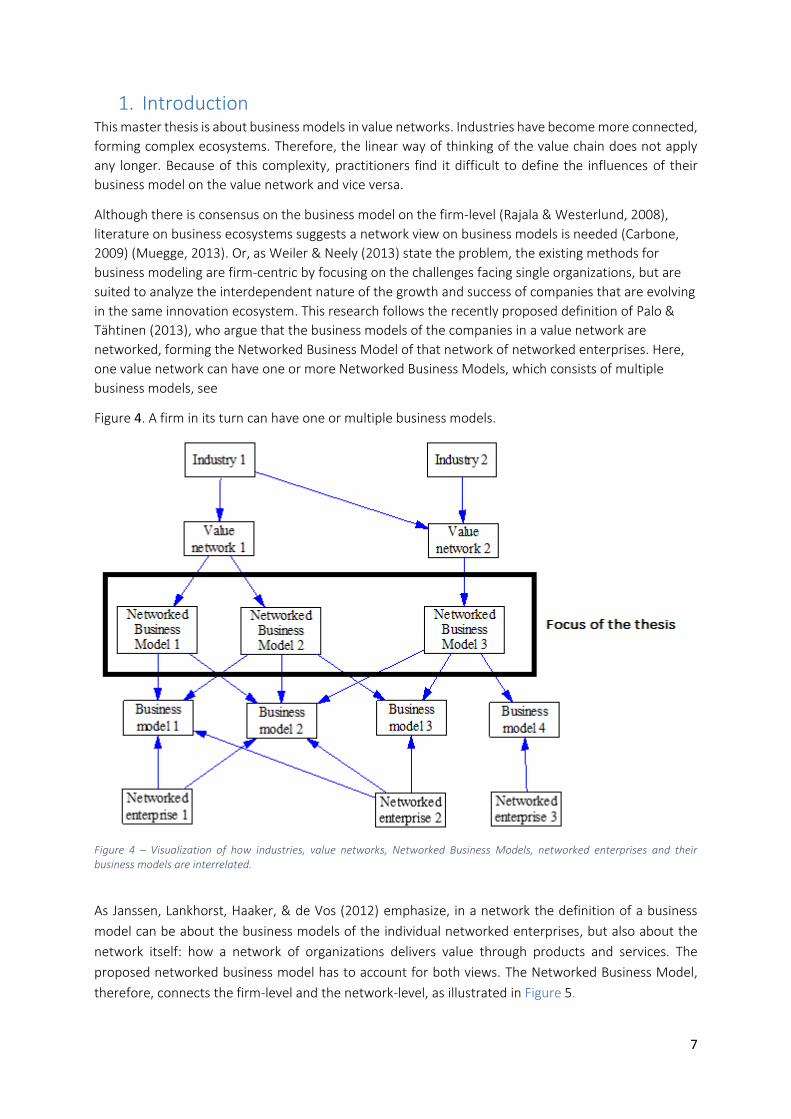
in the same innovation ecosystem. This research follows the recently proposed definition of Palo &
Tähtinen (2013), who argue that the business models of the companies in a value network are
networked, forming the Networked Business Model of that network of networked enterprises. Here,
one value network can have one or more Networked Business Models, which consists of multiple
business models, see
Figure 4. A firm in its turn can have one or multiple business models.
Figure 4 – Visualization of how industries, value networks, Networked Business Models, networked enterprises and their business models are interrelated.
As Janssen, Lankhorst, Haaker, & de Vos (2012) emphasize, in a network the definition of a business
model can be about the business models of the individual networked enterprises, but also about the
network itself: how a network of organizations delivers value through products and services. The
proposed networked business model has to account for both views. The Networked Business Model,
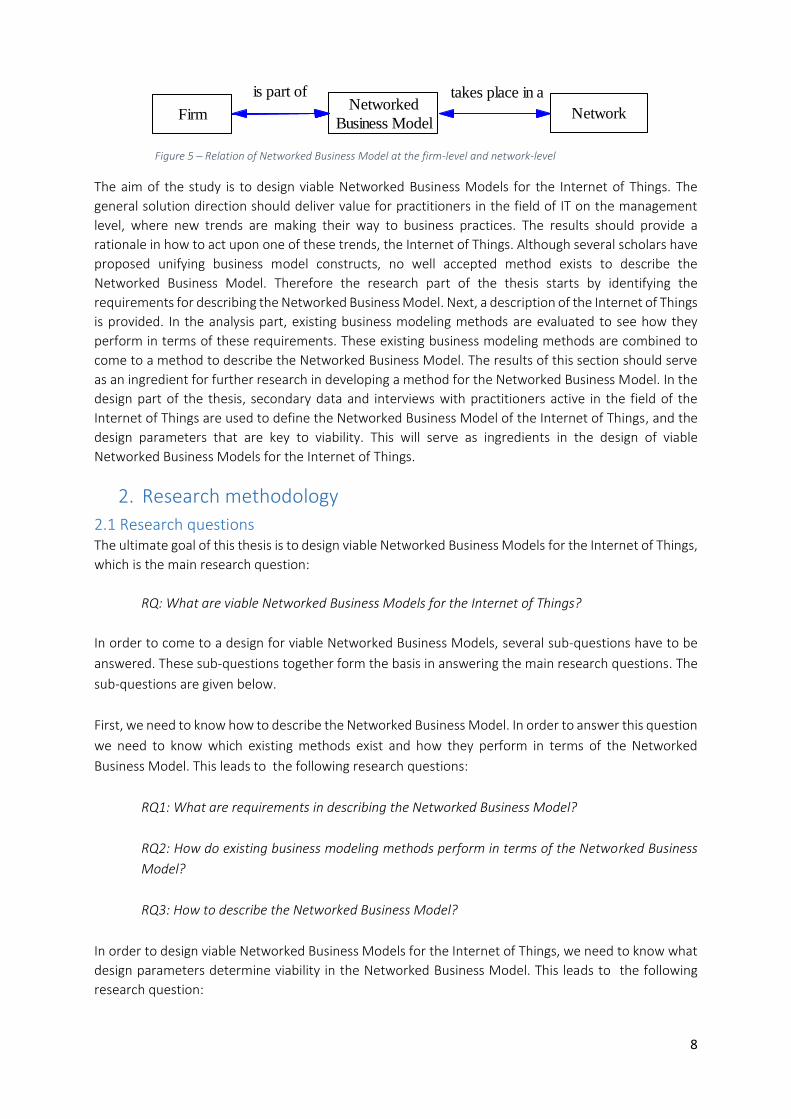
therefore, connects the firm-level and the network-level, as illustrated in Figure 5.
8
Figure 5 – Relation of Networked Business Model at the firm-level and network-level
The aim of the study is to design viable Networked Business Models for the Internet of Things. The
general solution direction should deliver value for practitioners in the field of IT on the management
level, where new trends are making their way to business practices. The results should provide a
rationale in how to act upon one of these trends, the Internet of Things. Although several scholars have
proposed unifying business model constructs, no well accepted method exists to describe the
Networked Business Model. Therefore the research part of the thesis starts by identifying the
requirements for describing the Networked Business Model. Next, a description of the Internet of Things
is provided. In the analysis part, existing business modeling methods are evaluated to see how they
perform in terms of these requirements. These existing business modeling methods are combined to
come to a method to describe the Networked Business Model. The results of this section should serve
as an ingredient for further research in developing a method for the Networked Business Model. In the
design part of the thesis, secondary data and interviews with practitioners active in the field of the
Internet of Things are used to define the Networked Business Model of the Internet of Things, and the
design parameters that are key to viability. This will serve as ingredients in the design of viable
Networked Business Models for the Internet of Things.
2. Research methodology
2.1 Research questions The ultimate goal of this thesis is to design viable Networked Business Models for the Internet of Things,
which is the main research question:
RQ: What are viable Networked Business Models for the Internet of Things?
In order to come to a design for viable Networked Business Models, several sub-questions have to be
answered. These sub-questions together form the basis in answering the main research questions. The
sub-questions are given below.
First, we need to know how to describe the Networked Business Model. In order to answer this question
we need to know which existing methods exist and how they perform in terms of the Networked
Business Model. This leads to the following research questions:
RQ1: What are requirements in describing the Networked Business Model?
RQ2: How do existing business modeling methods perform in terms of the Networked Business
Model?
RQ3: How to describe the Networked Business Model?
In order to design viable Networked Business Models for the Internet of Things, we need to know what
design parameters determine viability in the Networked Business Model. This leads to the following
research question:
Firm NetworkNetworked
Business Model
is part of takes place in a
9
RQ4: What design parameters determine viability of Networked Business Models?
The context of this thesis is about the Internet of Things, a recent trend in the IT industry. Therefore,
first a description of the Internet of Things is needed, what it is and what it comprises. This leads to the
following research question:
RQ5: What is the Internet of Things?
To come to the ultimate goal of this thesis, designing viable Networked Business Models for the Internet
of Things, first a view on the Networked Business Model is needed. Which actors make up the network,
what role do they have, who adds value where, etc. These questions can be summarized in the following
research question:
RQ6: What is the Networked Business Model of the Internet of Things?
Finally, we need to know what determines viability of the Networked Business Model of the Internet of
Things. The result of this section leads to the design parameters of the main research question, in other
words the buttons that can be adjusted to come to the ultimate design of viable Networked Business
Models for the Internet of Things. This can be summarized in the following research question:
RQ7: What determines viability of the Networked Business Model of the Internet of Things?
2.2 Research design The main aim of this thesis is to make a design, which is supposed to provide value to practitioners in
the field of the Internet of Things. However, besides being practically relevant, it must also be well-
grounded in theory to guarantee the quality of the solution. Therefore, it is following a design science
perspective, ‘A methodology that imbues the full spectrum of innovation activities with a human-
centered design ethos’ (Brown, 2008). This approach is looking at what people really want and need in
their lives, and what they like and dislike. Management research should be both relevant as well as
academic, according van Aken (2005). However, much literature is purely descriptive. Van Aken (2005)
argues that this literature is not practically relevant, since their results are too general and not applicable
to real problems faced by practitioners. Design science can be used to bridge this gap between rigor
and relevance (Romme, 2003). Since organizations are fuzzy, ambiguous, complex, and socially
constructed, they cannot be understood from a single academic perspective. Therefore, research should
focus on trying to solve field problems, instead of searching for scientific “truth” (Denyer, Tranfield, &
van Aken, 2008).
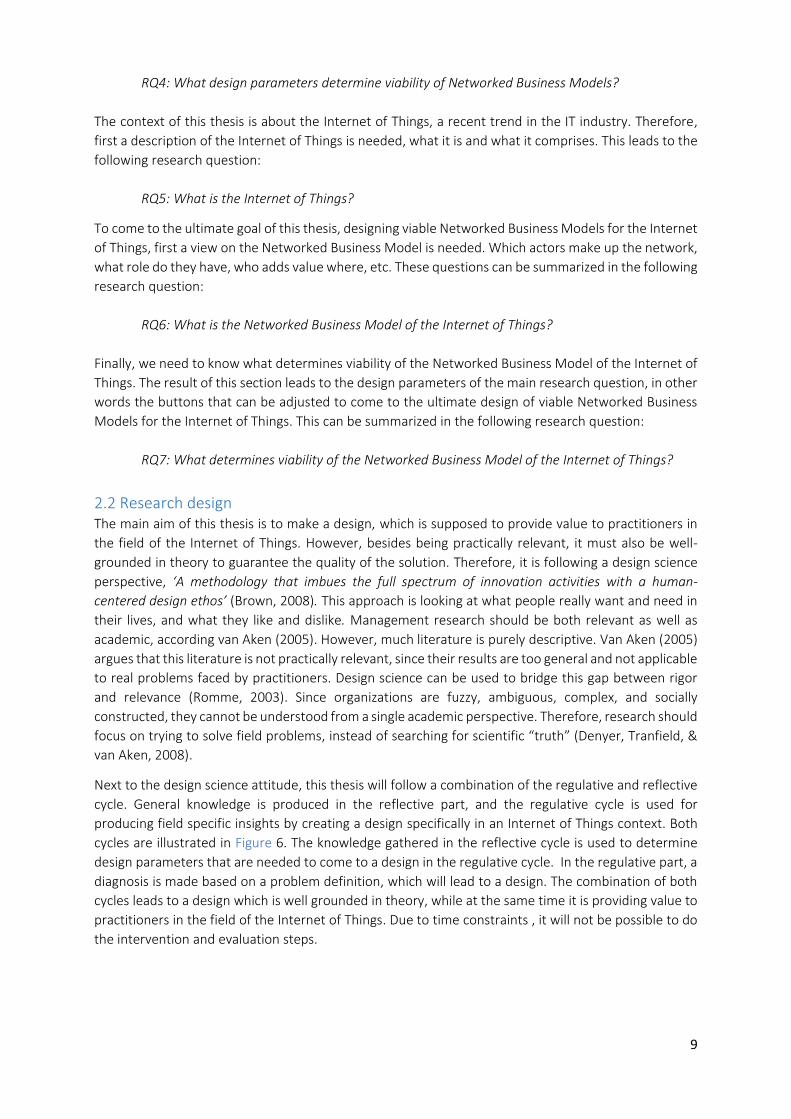
Next to the design science attitude, this thesis will follow a combination of the regulative and reflective
cycle. General knowledge is produced in the reflective part, and the regulative cycle is used for
producing field specific insights by creating a design specifically in an Internet of Things context. Both
cycles are illustrated in Figure 6. The knowledge gathered in the reflective cycle is used to determine
design parameters that are needed to come to a design in the regulative cycle. In the regulative part, a
diagnosis is made based on a problem definition, which will lead to a design. The combination of both
cycles leads to a design which is well grounded in theory, while at the same time it is providing value to
practitioners in the field of the Internet of Things. Due to time constraints , it will not be possible to do
the intervention and evaluation steps.
10
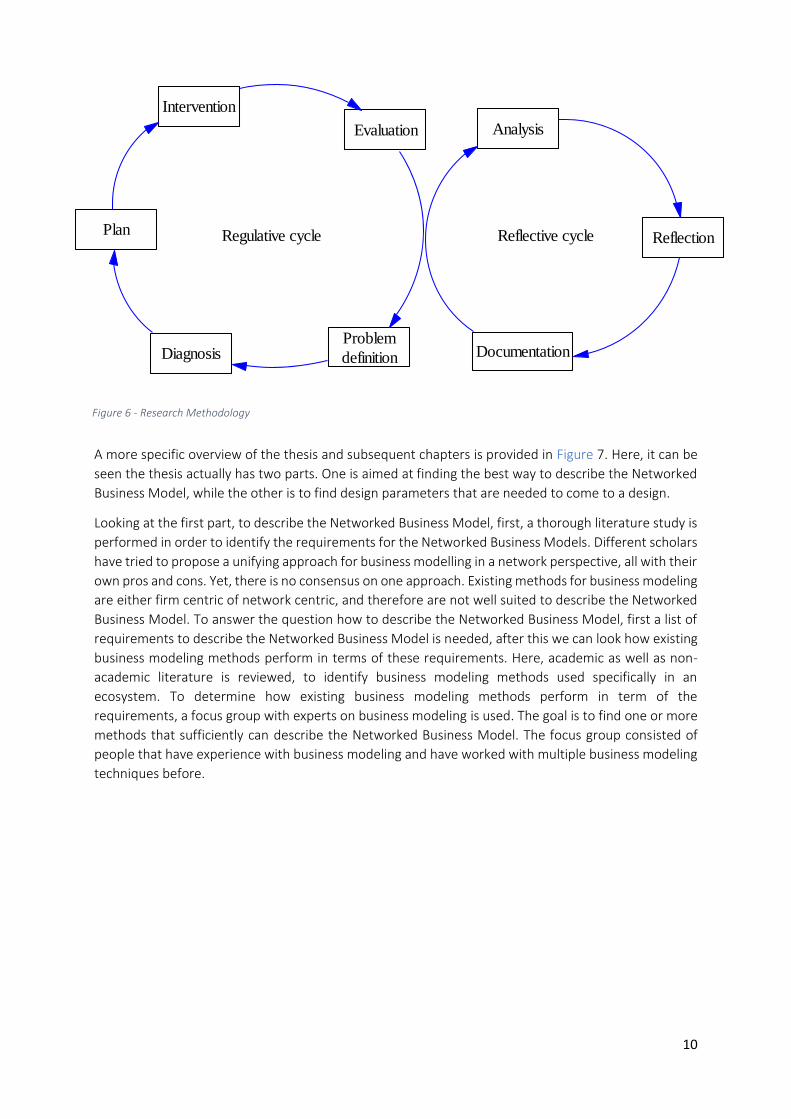
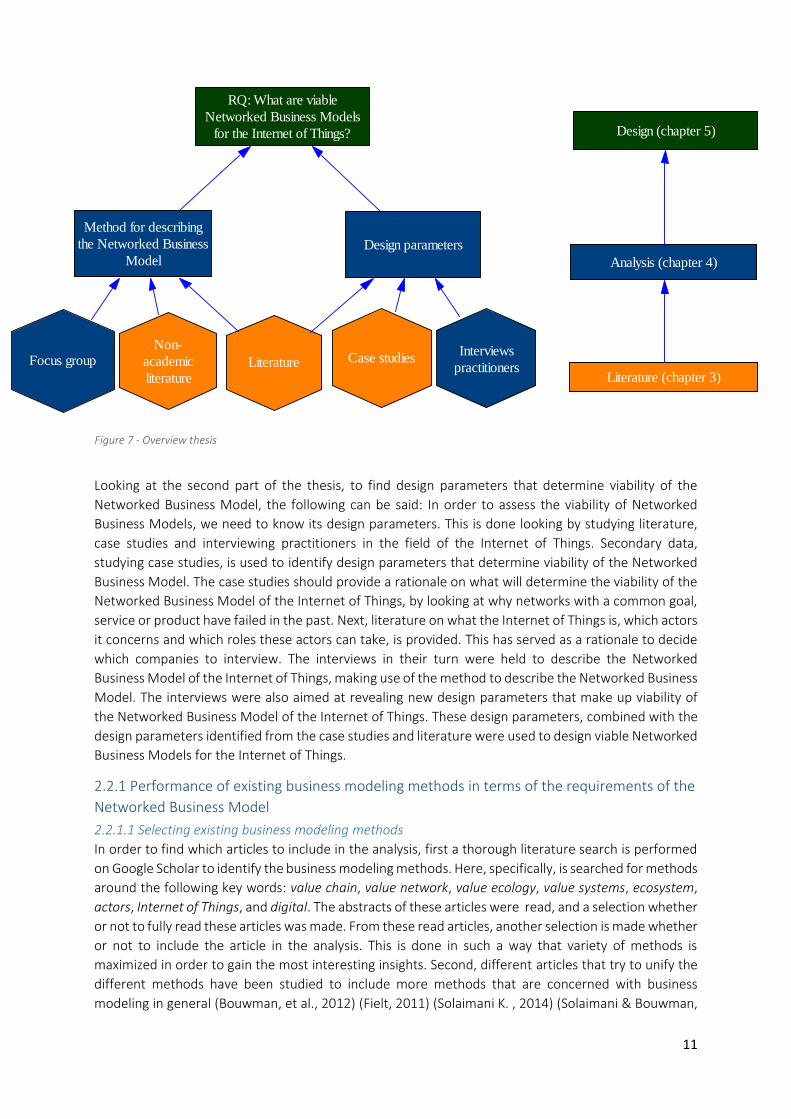
A more specific overview of the thesis and subsequent chapters is provided in Figure 7. Here, it can be
seen the thesis actually has two parts. One is aimed at finding the best way to describe the Networked
Business Model, while the other is to find design parameters that are needed to come to a design.
Looking at the first part, to describe the Networked Business Model, first, a thorough literature study is
performed in order to identify the requirements for the Networked Business Models. Different scholars
have tried to propose a unifying approach for business modelling in a network perspective, all with their
own pros and cons. Yet, there is no consensus on one approach. Existing methods for business modeling
are either firm centric of network centric, and therefore are not well suited to describe the Networked
Business Model. To answer the question how to describe the Networked Business Model, first a list of
requirements to describe the Networked Business Model is needed, after this we can look how existing
business modeling methods perform in terms of these requirements. Here, academic as well as non-
academic literature is reviewed, to identify business modeling methods used specifically in an
ecosystem. To determine how existing business modeling methods perform in term of the
requirements, a focus group with experts on business modeling is used. The goal is to find one or more
methods that sufficiently can describe the Networked Business Model. The focus group consisted of
people that have experience with business modeling and have worked with multiple business modeling
techniques before.
Figure 6 - Research Methodology
Reflection
Documentation
Analysis
Reflective cycle
Evaluation
Problem
definitionDiagnosis
Plan
Intervention
Regulative cycle
11
Looking at the second part of the thesis, to find design parameters that determine viability of the
Networked Business Model, the following can be said: In order to assess the viability of Networked
Business Models, we need to know its design parameters. This is done looking by studying literature,
case studies and interviewing practitioners in the field of the Internet of Things. Secondary data,
studying case studies, is used to identify design parameters that determine viability of the Networked
Business Model. The case studies should provide a rationale on what will determine the viability of the
Networked Business Model of the Internet of Things, by looking at why networks with a common goal,
service or product have failed in the past. Next, literature on what the Internet of Things is, which actors
it concerns and which roles these actors can take, is provided. This has served as a rationale to decide
which companies to interview. The interviews in their turn were held to describe the Networked
Business Model of the Internet of Things, making use of the method to describe the Networked Business
Model. The interviews were also aimed at revealing new design parameters that make up viability of
the Networked Business Model of the Internet of Things. These design parameters, combined with the
design parameters identified from the case studies and literature were used to design viable Networked
Business Models for the Internet of Things.
2.2.1 Performance of existing business modeling methods in terms of the requirements of the
Networked Business Model
2.2.1.1 Selecting existing business modeling methods
In order to find which articles to include in the analysis, first a thorough literature search is performed
on Google Scholar to identify the business modeling methods. Here, specifically, is searched for methods
around the following key words: value chain, value network, value ecology, value systems, ecosystem,
actors, Internet of Things, and digital. The abstracts of these articles were read, and a selection whether
or not to fully read these articles was made. From these read articles, another selection is made whether
or not to include the article in the analysis. This is done in such a way that variety of methods is
maximized in order to gain the most interesting insights. Second, different articles that try to unify the
different methods have been studied to include more methods that are concerned with business
modeling in general (Bouwman, et al., 2012) (Fielt, 2011) (Solaimani K. , 2014) (Solaimani & Bouwman,
Figure 7 - Overview thesis
Literature
Non-
academic
literature
Interviews
practitionersCase studiesFocus group
Design parameters
RQ: What are viable
Networked Business Models
for the Internet of Things?
Analysis (chapter 4)
Design (chapter 5)
Method for describing
the Networked Business
Model
Literature (chapter 3)
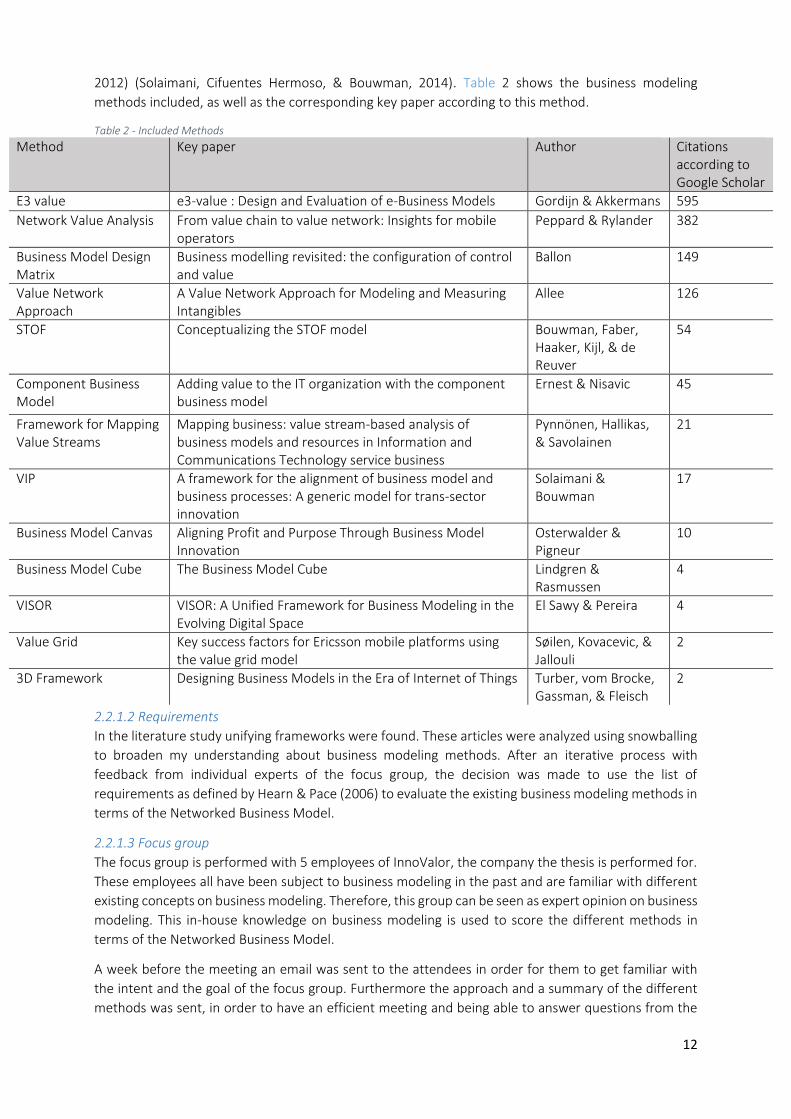
12
2012) (Solaimani, Cifuentes Hermoso, & Bouwman, 2014). Table 2 shows the business modeling
methods included, as well as the corresponding key paper according to this method.
Table 2 - Included Methods
Method Key paper Author Citations according to Google Scholar
E3 value e3-value : Design and Evaluation of e-Business Models Gordijn & Akkermans 595
Network Value Analysis From value chain to value network: Insights for mobile operators
Peppard & Rylander 382
Business Model Design Matrix
Business modelling revisited: the configuration of control and value
Ballon 149
Value Network Approach
A Value Network Approach for Modeling and Measuring Intangibles
Allee 126
STOF Conceptualizing the STOF model Bouwman, Faber, Haaker, Kijl, & de Reuver
54
Component Business Model
Adding value to the IT organization with the component business model
Ernest & Nisavic 45
Framework for Mapping Value Streams
Mapping business: value stream-based analysis of business models and resources in Information and Communications Technology service business
Pynnönen, Hallikas, & Savolainen
21
VIP A framework for the alignment of business model and business processes: A generic model for trans-sector innovation
Solaimani & Bouwman
17
Business Model Canvas Aligning Profit and Purpose Through Business Model Innovation
Osterwalder & Pigneur
10
Business Model Cube The Business Model Cube Lindgren & Rasmussen
4
VISOR VISOR: A Unified Framework for Business Modeling in the Evolving Digital Space
El Sawy & Pereira 4
Value Grid Key success factors for Ericsson mobile platforms using the value grid model
Søilen, Kovacevic, & Jallouli
2
3D Framework Designing Business Models in the Era of Internet of Things Turber, vom Brocke, Gassman, & Fleisch
2
2.2.1.2 Requirements
In the literature study unifying frameworks were found. These articles were analyzed using snowballing
to broaden my understanding about business modeling methods. After an iterative process with
feedback from individual experts of the focus group, the decision was made to use the list of
requirements as defined by Hearn & Pace (2006) to evaluate the existing business modeling methods in
terms of the Networked Business Model.
2.2.1.3 Focus group
The focus group is performed with 5 employees of InnoValor, the company the thesis is performed for.
These employees all have been subject to business modeling in the past and are familiar with different
existing concepts on business modeling. Therefore, this group can be seen as expert opinion on business
modeling. This in-house knowledge on business modeling is used to score the different methods in
terms of the Networked Business Model.
A week before the meeting an email was sent to the attendees in order for them to get familiar with
the intent and the goal of the focus group. Furthermore the approach and a summary of the different
methods was sent, in order to have an efficient meeting and being able to answer questions from the
13
attendees upfront. The summary that had been sent can be found in Appendix A. A presentation was
made in order to guide the meeting in which the goal and the approach was once more repeated. In
this presentation, a recap of the different methods was provided. Furthermore, a contemplation of the
problem of the need for a Networked Business Model was given as well as the goal of the thesis the
focus group is held for. After this ambiguities were discussed and clarified. The methodology to compare
the different methods by use of the requirements of Hearn & Pace (2006) is validated and the methods
were scored in terms of these requirements. Heat maps were made based upon the scorings in order
to visualize the outcome.
2.2.1.4 Analysis
The scoring of the methods in terms of the requirement of the Networked Business Model were color
coded in order to identify areas in which the methods perform good. These areas have been studied by
looking at the aspects of the methods according to the requirements in which they score positively.
Combining the best practices of the different methods, resulted in the method used in this thesis for
describing the Networked Business Model.
2.2.2 Case studies to determine the viability of Networked Business Models
2.2.2.1 Case selection
Talking to senior advisors of Innovalor, has yield the insight that in order to find case studies to learn
from can best be searched for in the digital domain. Initiatives in this domain are considered to be
analogous to initiatives on the Internet of Things. Where a definition of digital is provided by Mark
McDonald of Accenture:
“Digital is an adjective describing an increasing information intensity and connectedness of
physical resources. Resources like facilities, processes, people, teams become digital through the
application of technologies that extract information and connect resource and its information to
other resources.” (McDonald, 2013)
Within this digital domain, articles were searched that provide information on why certain initiatives
succeeded or failed. What were success factors or barriers? What can be learned from these initiatives?
Where typical questions to be answered. This search resulted in case studies on mobile payment, smart
homes and e-health initiatives. It is good to notice that the selected use cases could as well be replaced
with initiatives on connected cars, smart cities or any other initiative in the digital domain. The choice is
made based on information available on success factors and barriers.
In order to find relevant Networked Business Model applications in the digital domain, a search on
Google Scholar was performed. Here, keywords as ‘Barriers’, ‘Market barriers’, ‘Market adoption’, ‘Slow
adoption’, ‘Problems’, ‘Collaborative action’, ‘Difficulties’ and ‘Lessons learned’, were used in
combination with the areas of interest, ‘mobile payment’, ‘smart homes’ and ‘e-health’ to find case
reviews. The abstracts of these articles were carefully read and a selection based on relevance was
made. An article was considered relevant when it took a multi-actor approach, in a network, and
discussed success and failure factors of the initiative. This search resulted in four articles, reviewing five
use cases. One for mobile payment, two for smart homes and one for e-health.
2.2.2.2 Analysis
The articles found have been carefully studied in order to get to know the things that went good and
wrong in the initiatives. Most articles only focused on the things that went wrong, resulting in lessons
learned. Sometimes these lessons learned were clearly defined in the articles, and other times it had to
be extracted from the interview transcripts provided in the article. The influences that were extracted
have been coded and merged in order to get more general terms, accounting for possible overlap. This
is done using open coding. The result of this coding resulted in eleven points of attention when dealing
14
with initiatives embedded in ecosystems. These points of attention are the things that can be adjusted
and thus are the design parameters that determine the viability of Networked Business Models.
2.2.3 Interviews practitioners to indicate design parameters that determine the viability of the
Internet of Things
2.2.3.1 Company selection
Companies were selected in such a way that it was evenly spread around the different roles as identified
in paragraph 3.2.4 Architecture of the Internet of Things. People were selected based upon which role
they occupy within their organization. Every role of this architecture should be covered to cover all
possible alternative views. People were invited for the interview by use of Linked-In and email. The
interviews were held face-to-face and lasted from one hour to one and a half hour. The interviews were
concluded when no additional insights or information were presented.
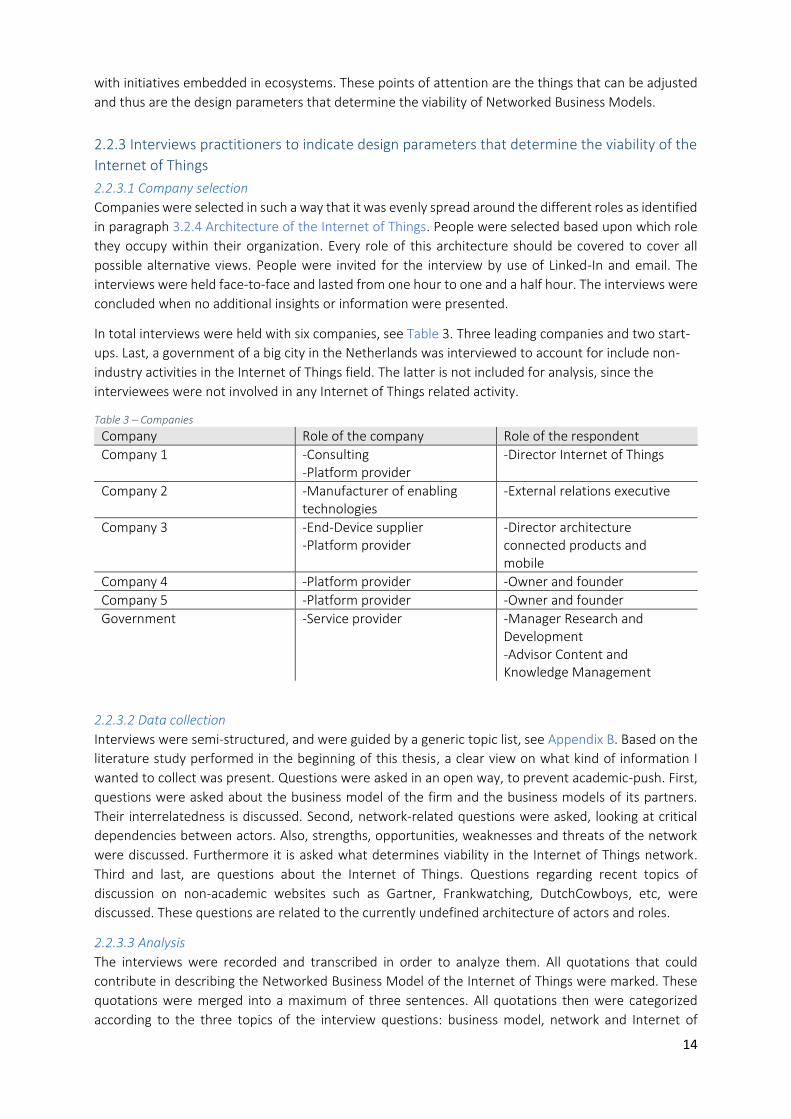
In total interviews were held with six companies, see Table 3. Three leading companies and two start-
ups. Last, a government of a big city in the Netherlands was interviewed to account for include non-
industry activities in the Internet of Things field. The latter is not included for analysis, since the
interviewees were not involved in any Internet of Things related activity.
Table 3 – Companies
Company Role of the company Role of the respondent
Company 1 -Consulting -Platform provider
-Director Internet of Things
Company 2 -Manufacturer of enabling technologies
-External relations executive
Company 3 -End-Device supplier -Platform provider
-Director architecture connected products and mobile
Company 4 -Platform provider -Owner and founder
Company 5 -Platform provider -Owner and founder
Government -Service provider -Manager Research and Development -Advisor Content and Knowledge Management
2.2.3.2 Data collection
Interviews were semi-structured, and were guided by a generic topic list, see Appendix B. Based on the
literature study performed in the beginning of this thesis, a clear view on what kind of information I
wanted to collect was present. Questions were asked in an open way, to prevent academic-push. First,
questions were asked about the business model of the firm and the business models of its partners.
Their interrelatedness is discussed. Second, network-related questions were asked, looking at critical
dependencies between actors. Also, strengths, opportunities, weaknesses and threats of the network
were discussed. Furthermore it is asked what determines viability in the Internet of Things network.
Third and last, are questions about the Internet of Things. Questions regarding recent topics of
discussion on non-academic websites such as Gartner, Frankwatching, DutchCowboys, etc, were
discussed. These questions are related to the currently undefined architecture of actors and roles.
2.2.3.3 Analysis
The interviews were recorded and transcribed in order to analyze them. All quotations that could
contribute in describing the Networked Business Model of the Internet of Things were marked. These
quotations were merged into a maximum of three sentences. All quotations then were categorized
according to the three topics of the interview questions: business model, network and Internet of
15
Things, which were used in describing the Networked Business Model of the Internet of Things.
Furthermore, in the interview specifically was asked what determines the viability of the Networked
Business Model for the Internet of Things. The answers were merged into design parameters and
combined with design parameters from secondary data.
2.2.4 Designing viable Networked Business Models This thesis is following a design science perspective by designing a solution that creates value for
practitioners in the field. It deals with real life problems, experienced by real people (Brown, 2008) (van
Aken, 2005). Although this thesis is well grounded in literature, it also deals with creativity by its design
attitude.
In order to boost creativity, a few practices have been applied. First, the secondary data of the case
studies was used to get familiar in organizing data in regard to design parameters. Due to this
preliminary work, in the design phase, focus can be on creativity instead of on how to effectively
organize information present. Second, during the design phase, I worked with time slots. Every time slot
lasted for 15 minutes. The goal was to deliver as many as possible different viable Networked Business
Models. In the first 15 minutes, a design was made, the following 15 minutes videos were watched on
the Internet of Things in general. This cycle was repeated every two days, lasting 5 days in total. Next,
these designs have been compared and elaborated upon in more detail, which resulted in one final
design.
16
3. Literature The literature part can be divided in two parts, the first being about the Networked Business Model and
the second about the Internet of Things. The Networked Business Model part starts with a brief
introduction on the networked enterprise and the recent developments they faced, in order to fully
understand the complex ecosystems companies nowadays are embedded in, to know why we need a
Networked Business Model. The remaining part of this section is a mean to answering research
questions 1, 2 and 4, by providing existing business modeling methods, requirements for describing the
Networked Business Model and design parameters for the Networked Business Model by looking at
platform theory and business ecosystems. The internet of Things part starts by providing developments
in IT that are at the heart of the Internet of Things development. Furthermore it provides a description
of what the Internet of Things is, what it comprises, several use cases and its architecture.
3.1 The Networked Business Model
3.1.1 Introduction and context As noted earlier, the need for a Networked Business Model is because of firms becoming more
connected with each other in a complex value network, rather than a simple linear value chain.
Literature on networked enterprise yields the following definition of the ‘Networked Enterprise’:
“…any coordinated undertaking that involves at least two autonomous parties that interact
using information and communication technology (ICT).” (Steen, Lankhorst, & van de Wetering,
2002)
“a loosely coupled, self‑organizing network of enterprises that combine their output to provide
products and services offerings to the market. Partners in the networked enterprise may
operate independently through market mechanisms or cooperatively through agreements and
contracts.” (Li, et al., 2010)
The first being more general, the second more specific. Both definitions will suffice for the purpose of
this thesis. However, since the Networked Business Model is a recently proposed definition, the first
definition is taken as a working definition because of its broad view.
3.1.1 History of value ecologies
Until the 1900s, organizations were characterized by small scale operations, having a limited number of
employees, working in a certain craft that was supervised by an artisan. Later, larger scale companies
began to emerge as a consequence of the industrial revolution (Landes, 1998), which evolved into large
scale organizations build around steel production and railways (Chandler, 2009). The basic premise of
organizations of that time was that they had to operate autonomously: each company needed to own
the most important resources and competences, in order to function as independently from the outside
world as possible. The reason for this is that communications structure was not well developed, making
transport unreliable which was crucial for production processes as throughput of raw materials had to
be ensured in order to meet production demands. However, in the 1980s companies slowly shifted away
from this way of working, and collaborations made their entrance. Companies focused on their core
competences more, outsourcing the less important activities. In the course of the 1980s the number of
technology alliances increased rapidly to several thousands of new alliances annually. Along with this
increase, also the number of alliances per company increased (de Man, 2004), as can be seen in Table
4.
17
Figure 8 - Closed vs open business models
Table 4 - Number of alliances announced by a sample of companies between 1998 and 2002 (de Man, 2004)
Company Alliances Company Alliances
Cisco 56 Microsoft 125
Dell 22 Motorola 105
Ebay 26 Nokia 65
Eli Lilly 40 Nortel 30
Glaxo 74 Pfizer 59
HP-Compaq 145 Philips 61
IBM 168 Siebel 31
Infineon 32 Toshiba 49
Intel 66 STMicroelectronics 27
Merck 49 SUN Microsystems 81
Since then, the number of alliances per company have increased even more and firms are embedded in
networks of alliances. However, nowadays companies are looking for partnerships that are closer to
their core business. Next to that, knowledge sharing and knowledge development, have taken a central
role in alliances instead of the production of tangible goods (de Man, 2004).
Next to this, Innovation meant having the right resources in-house: having big internal R&D
departments, hire the most brilliant employees and patiently wait for novel products to emerge. This
time has changed due to rising R&D costs, shorter product life cycle time (Chesbrough, 2007), the
distribution of knowledge (Chesbrough, 2013), and innovation inefficiencies. It is even estimated that
between 75% and 95% of all patented technologies are dormant (Chesbrough, 2007).
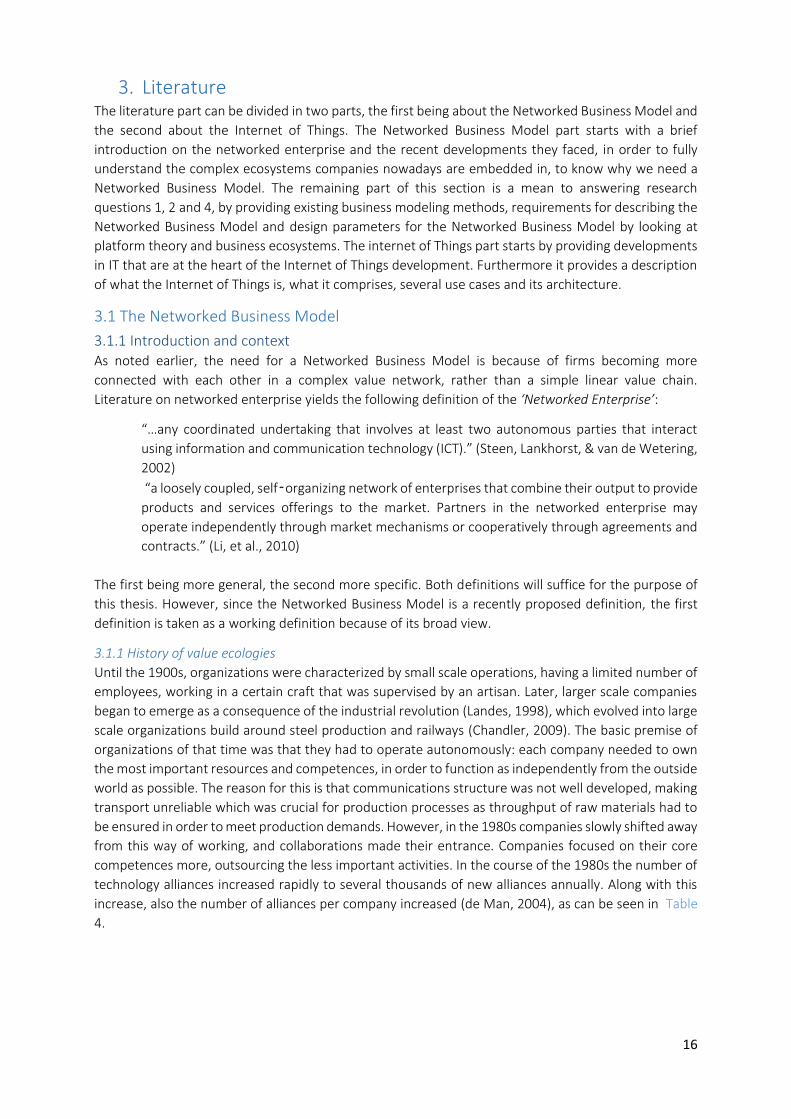
Business models should be an integral part of innovation, rather than just technology and R&D
(Chesbrough, 2007). Opening up the business models is a mean to counter the problems described
above. A nice representation of the change described above and the impact of open business models is
seen in Figure 8. It can be seen that working together will shorten R&D costs, by leveraging external
development and revenues are higher by commercializing internal knowledge (Chesbrough, 2013).
A more thorough definition is given by (Chesbrough, Vanhaverbeke, & West, 2006): ‘The use of
purposive inflows and outflows of knowledge to accelerate internal innovation, and to expand the
18
Figure 9 - Phases of external specialization (IBM Business Consulting Services, 2005)
markets for external use of innovation, respectively.’ It comprises both outside-in and inside-out
movements of technologies and ideas (Lichtenthaler, 2008).
Because of this, industries that were once separately from each other are now converging. One example
is bioinformatics, were IT and biotechnology are converging. It is now possible to calculate the
pharmaceutical merits of a certain chemical compound (de Man, 2004).
3.1.2 From value chain to value network
When taking a look at the IT sector, the ubiquitous growth of information technology itself combined
with the internet has brought about changes as well, for example in the new product development
sector described above. Widespread adoption of standard communication technologies and enterprise
software systems has provided firms many of the same channel capabilities as well as a similar outlook
on their organizations. Furthermore data standards have driven transaction costs down. The easiness
to plug into this universal platform has removed many traditional barriers to enter, with many
competitors as a result. Customers find it easier than ever to switch providers. Only specialization will
enable firms to deliver value to their customers, employees and shareholders (IBM Business Consulting
Services, 2005).
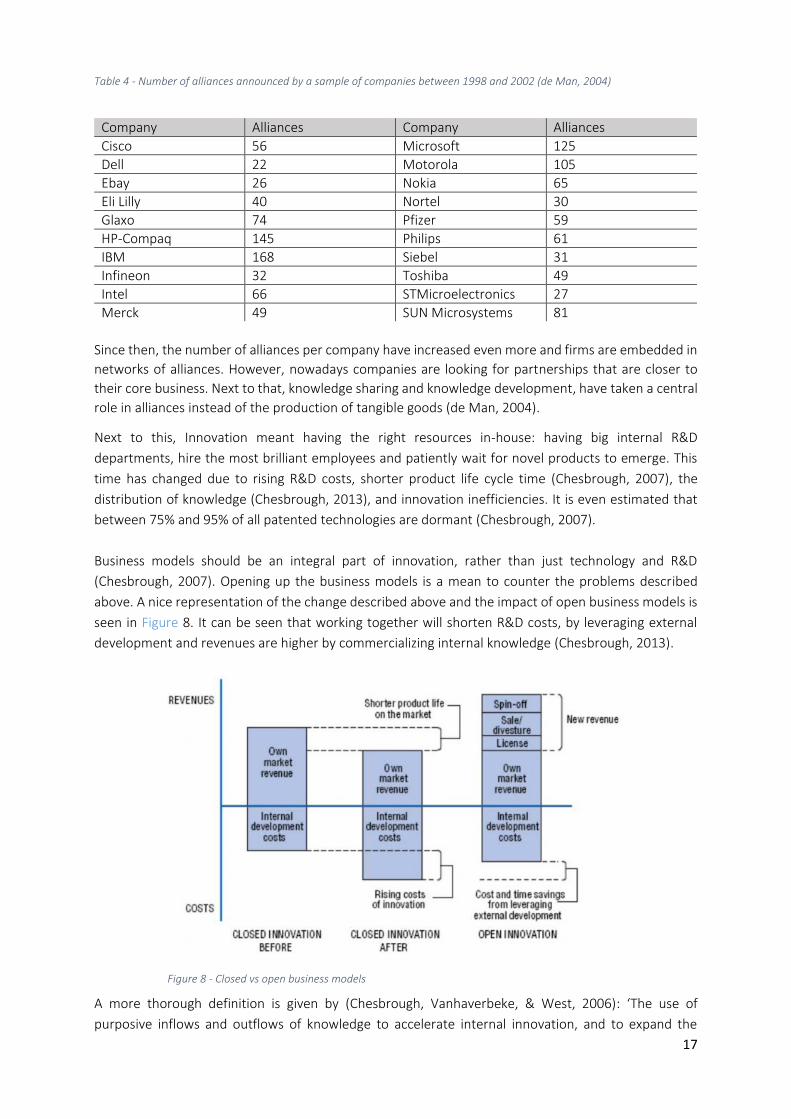
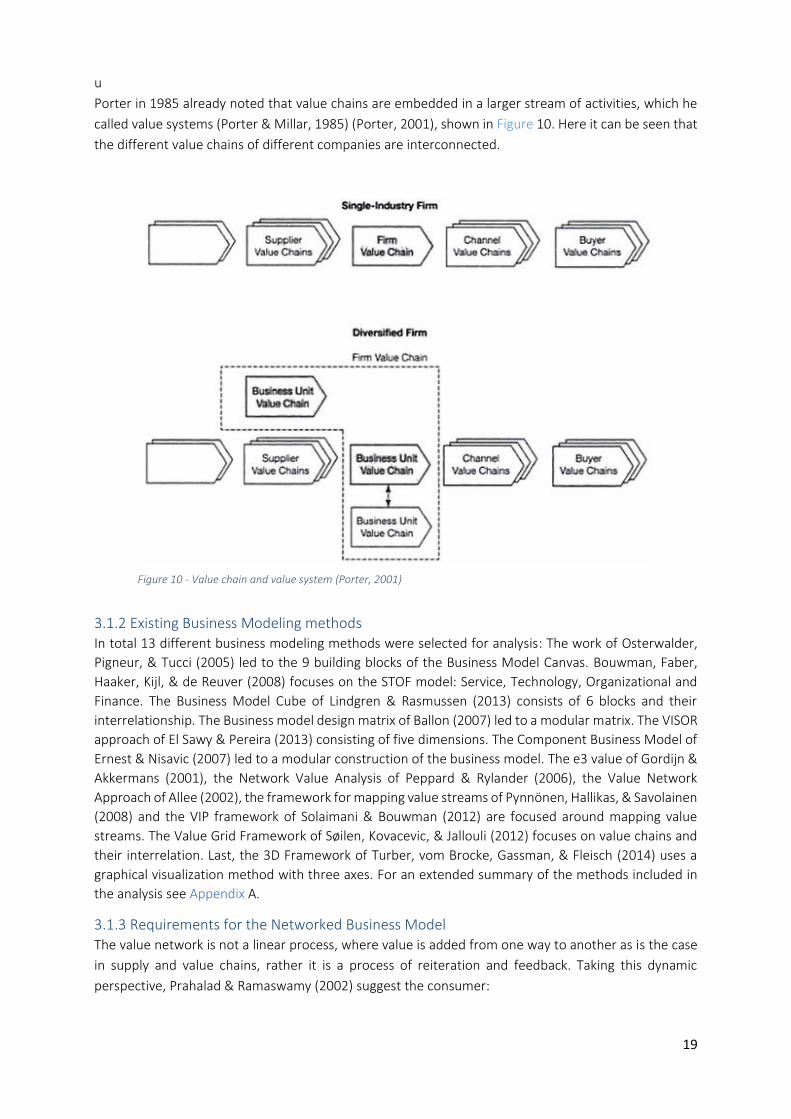
One way of specialization as described by IBM is external specialization, see Figure 9. In past decades
firms were pursuing ‘internal integration’, forming silos linked by proprietary processes. These
processes were put in place to control the value chain by driving quality, reducing risk and manage
availability. Later, in the 1990s firms began to selectively forming strategic partnerships with specialized
providers along the value chain. These partnerships allowed firms to increase margins and enter markets
that were previously not available. This strategically partnered phase also came with a downside, as
contracting and coordination costs tended to creep up when the number of partners increased. This is
due to the inefficiencies caused by proprietary partnerships, architectures and technologies. So even in
the strategically partnered phase firms are vulnerable to upstart peers designed to take the full
advantage of the universal platform. To avoid being outclassed by these start-ups, firms are pursuing
the last phase of external specialization, being industry networked. In this last phase, companies focus
on their specific areas of expertise and began to become a part of the ecosystem, flexible networks
driven by collaboration, universal connectivity and standardized contracting (IBM Business Consulting
Services, 2005).
19
Figure 10 - Value chain and value system (Porter, 2001)
u
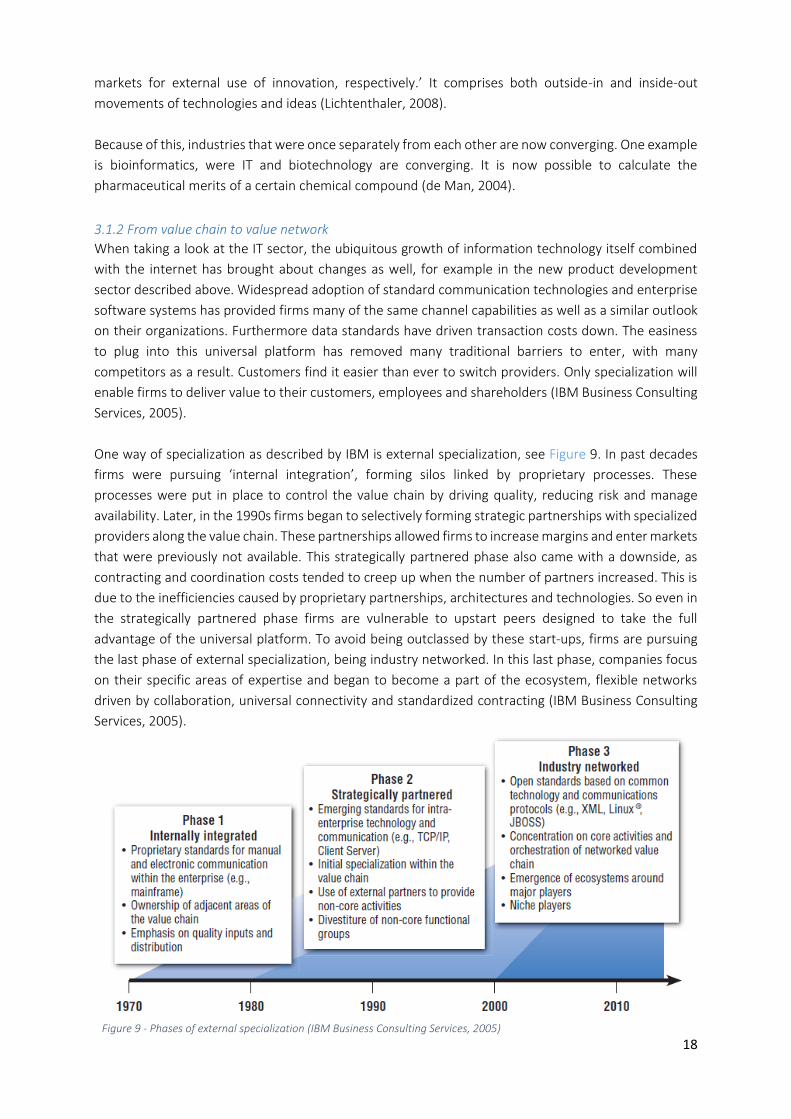
Porter in 1985 already noted that value chains are embedded in a larger stream of activities, which he
called value systems (Porter & Millar, 1985) (Porter, 2001), shown in Figure 10. Here it can be seen that
the different value chains of different companies are interconnected.
3.1.2 Existing Business Modeling methods In total 13 different business modeling methods were selected for analysis: The work of Osterwalder,
Pigneur, & Tucci (2005) led to the 9 building blocks of the Business Model Canvas. Bouwman, Faber,
Haaker, Kijl, & de Reuver (2008) focuses on the STOF model: Service, Technology, Organizational and
Finance. The Business Model Cube of Lindgren & Rasmussen (2013) consists of 6 blocks and their
interrelationship. The Business model design matrix of Ballon (2007) led to a modular matrix. The VISOR
approach of El Sawy & Pereira (2013) consisting of five dimensions. The Component Business Model of
Ernest & Nisavic (2007) led to a modular construction of the business model. The e3 value of Gordijn &
Akkermans (2001), the Network Value Analysis of Peppard & Rylander (2006), the Value Network
Approach of Allee (2002), the framework for mapping value streams of Pynnönen, Hallikas, & Savolainen
(2008) and the VIP framework of Solaimani & Bouwman (2012) are focused around mapping value
streams. The Value Grid Framework of Søilen, Kovacevic, & Jallouli (2012) focuses on value chains and
their interrelation. Last, the 3D Framework of Turber, vom Brocke, Gassman, & Fleisch (2014) uses a
graphical visualization method with three axes. For an extended summary of the methods included in
the analysis see Appendix A.
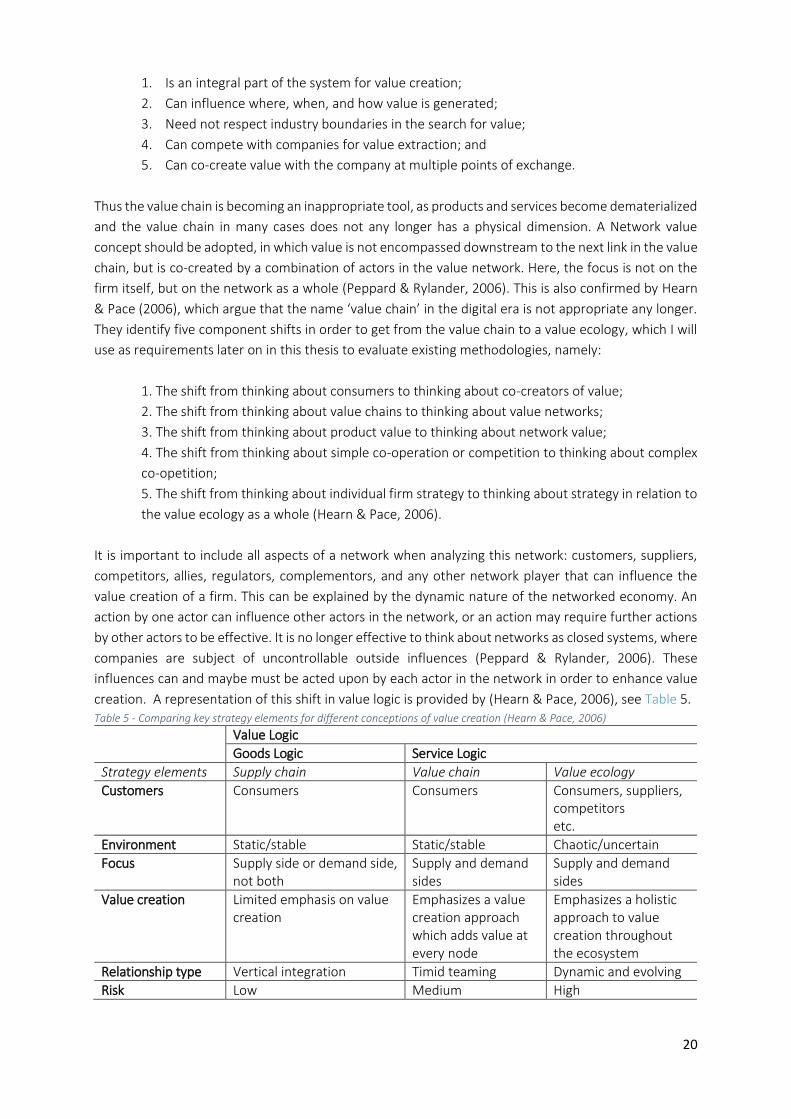
3.1.3 Requirements for the Networked Business Model The value network is not a linear process, where value is added from one way to another as is the case
in supply and value chains, rather it is a process of reiteration and feedback. Taking this dynamic
perspective, Prahalad & Ramaswamy (2002) suggest the consumer:
20
1. Is an integral part of the system for value creation;
2. Can influence where, when, and how value is generated;
3. Need not respect industry boundaries in the search for value;
4. Can compete with companies for value extraction; and
5. Can co-create value with the company at multiple points of exchange.
Thus the value chain is becoming an inappropriate tool, as products and services become dematerialized
and the value chain in many cases does not any longer has a physical dimension. A Network value
concept should be adopted, in which value is not encompassed downstream to the next link in the value
chain, but is co-created by a combination of actors in the value network. Here, the focus is not on the
firm itself, but on the network as a whole (Peppard & Rylander, 2006). This is also confirmed by Hearn
& Pace (2006), which argue that the name ‘value chain’ in the digital era is not appropriate any longer.
They identify five component shifts in order to get from the value chain to a value ecology, which I will
use as requirements later on in this thesis to evaluate existing methodologies, namely:
1. The shift from thinking about consumers to thinking about co-creators of value;
2. The shift from thinking about value chains to thinking about value networks;
3. The shift from thinking about product value to thinking about network value;
4. The shift from thinking about simple co-operation or competition to thinking about complex
co-opetition;
5. The shift from thinking about individual firm strategy to thinking about strategy in relation to
the value ecology as a whole (Hearn & Pace, 2006).
It is important to include all aspects of a network when analyzing this network: customers, suppliers,
competitors, allies, regulators, complementors, and any other network player that can influence the
value creation of a firm. This can be explained by the dynamic nature of the networked economy. An
action by one actor can influence other actors in the network, or an action may require further actions
by other actors to be effective. It is no longer effective to think about networks as closed systems, where
companies are subject of uncontrollable outside influences (Peppard & Rylander, 2006). These
influences can and maybe must be acted upon by each actor in the network in order to enhance value
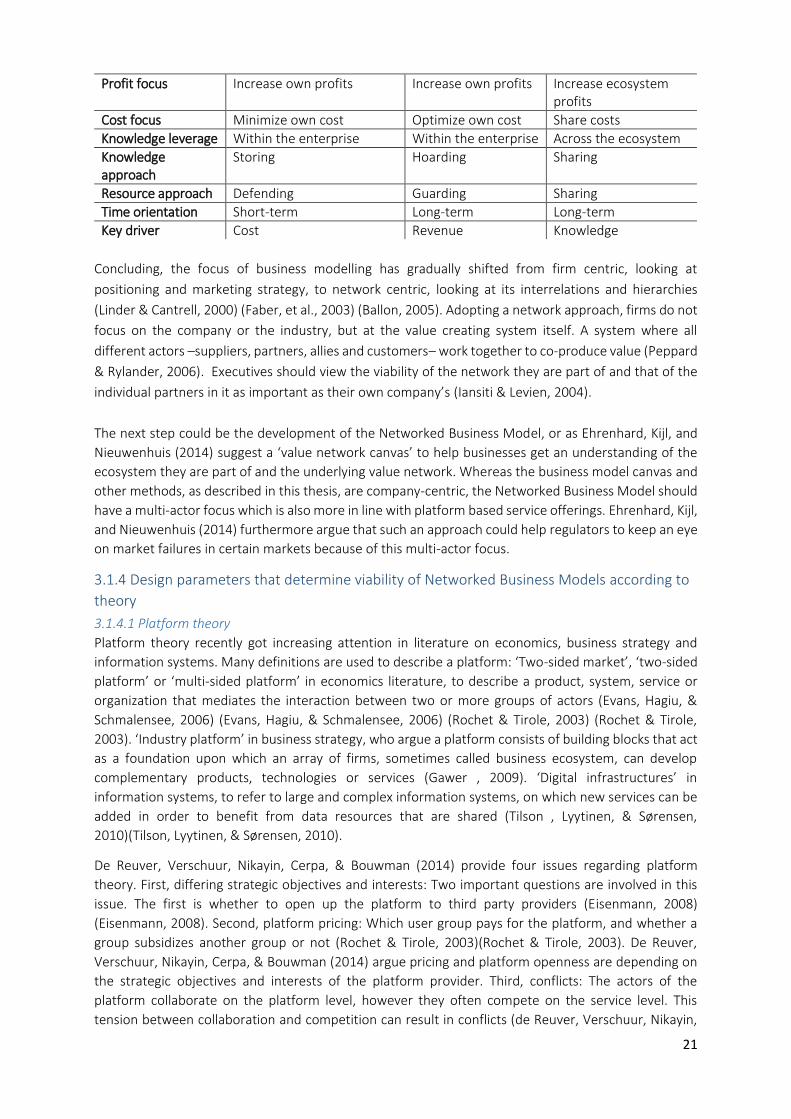
creation. A representation of this shift in value logic is provided by (Hearn & Pace, 2006), see Table 5. Table 5 - Comparing key strategy elements for different conceptions of value creation (Hearn & Pace, 2006)
Value Logic
Goods Logic Service Logic
Strategy elements Supply chain Value chain Value ecology
Customers
Consumers Consumers Consumers, suppliers, competitors etc.
Environment Static/stable Static/stable Chaotic/uncertain
Focus Supply side or demand side, not both
Supply and demand sides
Supply and demand sides
Value creation Limited emphasis on value creation
Emphasizes a value creation approach which adds value at every node
Emphasizes a holistic approach to value creation throughout the ecosystem
Relationship type Vertical integration Timid teaming Dynamic and evolving
Risk Low Medium High
21
Profit focus Increase own profits Increase own profits Increase ecosystem profits
Cost focus Minimize own cost Optimize own cost Share costs
Knowledge leverage Within the enterprise Within the enterprise Across the ecosystem
Knowledge approach
Storing Hoarding Sharing
Resource approach Defending Guarding Sharing
Time orientation Short-term Long-term Long-term
Key driver Cost Revenue Knowledge
Concluding, the focus of business modelling has gradually shifted from firm centric, looking at
positioning and marketing strategy, to network centric, looking at its interrelations and hierarchies
(Linder & Cantrell, 2000) (Faber, et al., 2003) (Ballon, 2005). Adopting a network approach, firms do not
focus on the company or the industry, but at the value creating system itself. A system where all
different actors –suppliers, partners, allies and customers– work together to co-produce value (Peppard
& Rylander, 2006). Executives should view the viability of the network they are part of and that of the
individual partners in it as important as their own company’s (Iansiti & Levien, 2004).
The next step could be the development of the Networked Business Model, or as Ehrenhard, Kijl, and
Nieuwenhuis (2014) suggest a ‘value network canvas’ to help businesses get an understanding of the
ecosystem they are part of and the underlying value network. Whereas the business model canvas and
other methods, as described in this thesis, are company-centric, the Networked Business Model should
have a multi-actor focus which is also more in line with platform based service offerings. Ehrenhard, Kijl,
and Nieuwenhuis (2014) furthermore argue that such an approach could help regulators to keep an eye
on market failures in certain markets because of this multi-actor focus.
3.1.4 Design parameters that determine viability of Networked Business Models according to
theory
3.1.4.1 Platform theory
Platform theory recently got increasing attention in literature on economics, business strategy and
information systems. Many definitions are used to describe a platform: ‘Two-sided market’, ‘two-sided
platform’ or ‘multi-sided platform’ in economics literature, to describe a product, system, service or
organization that mediates the interaction between two or more groups of actors (Evans, Hagiu, &
Schmalensee, 2006) (Evans, Hagiu, & Schmalensee, 2006) (Rochet & Tirole, 2003) (Rochet & Tirole,
2003). ‘Industry platform’ in business strategy, who argue a platform consists of building blocks that act
as a foundation upon which an array of firms, sometimes called business ecosystem, can develop
complementary products, technologies or services (Gawer , 2009). ‘Digital infrastructures’ in
information systems, to refer to large and complex information systems, on which new services can be
added in order to benefit from data resources that are shared (Tilson , Lyytinen, & Sørensen,
2010)(Tilson, Lyytinen, & Sørensen, 2010).
De Reuver, Verschuur, Nikayin, Cerpa, & Bouwman (2014) provide four issues regarding platform
theory. First, differing strategic objectives and interests: Two important questions are involved in this
issue. The first is whether to open up the platform to third party providers (Eisenmann, 2008)
(Eisenmann, 2008). Second, platform pricing: Which user group pays for the platform, and whether a
group subsidizes another group or not (Rochet & Tirole, 2003)(Rochet & Tirole, 2003). De Reuver,
Verschuur, Nikayin, Cerpa, & Bouwman (2014) argue pricing and platform openness are depending on
the strategic objectives and interests of the platform provider. Third, conflicts: The actors of the
platform collaborate on the platform level, however they often compete on the service level. This
tension between collaboration and competition can result in conflicts (de Reuver, Verschuur, Nikayin,
22
Cerpa, & Bouwman, 2014) (de Reuver, Verschuur, Nikayin, Cerpa, & Bouwman, 2014). Fourth,
interdependencies: Should be high in order for all parties to stay in the platform. These
interdependencies are being increased by direct and indirect network effects (Gawer & Cusumano,
2002; Roson, 2005)Invalid source specified. Fifth, and last, governance: This issue is two sided, since
governance affects external third party providers as well as the internal governance of the platform. The
tradeoff how to balance control over these third party service providers against granting them the
flexibility to be creative on the platform can result in internal governance issues (Tilson , Lyytinen, &
Sørensen, 2010)(Tilson , Lyytinen, & Sørensen, 2010) (Tiwana, Konsynski, & Bush, 2010) (Tiwana,
Konsynski, & Bush, 2010).
3.1.4.2 Network theory
Building upon network theory, de Man (2004) provides five building blocks, which can be used to an
influence the network as such that firms attain the desired positions: The first is ‘alliance tie strength -
are intimate or loose alliances required in the network?’, which will be merged with the issue of
interdependency of de Reuver et al. The second is ‘Network size - is it better to have many partners or
only a few?’, which is appearing to be contradicting with the issue of interdependency provided by de
Reuver et al that states that network effects should be high. In this thesis we will look at both factors in
order to gain full insights from the interviews with practitioners. The third is ‘Membership mix - is
similarity or diversity of partners required?’. The fourth is ‘Collective governance - how should decision-
making, planning and control be organized?’, which will be merged with the issue of governance of de
Reuver et al. The fifth and last is ‘Clustering - do all partners need to be allied with all others?’.
3.1.4.3 Business ecosystems theory
A growing number of technology companies are located in a certain geographic hotspot. As knowledge
is more and more dispersed and no longer a sustainable competitive advantage, knowledge increasingly
needs to be shared in order to enhance the survival of the ecosystem (Jarzabkowski & Wilson, 2006).
The main driver to be in such a hotspot is the exchange of this knowledge, which heavily depends on
social interaction and therefore on physical proximity (van der Borgh, Cloodt, & Romme, 2012). Their
work investigated how knowledge-based business ecosystems create value for the actors in it, from a
business model perspective. Where the term ‘business ecosystems’ is adopted from Lansiti & Levien
(2004). Business ecosystems offer individual firms an environment that thrives on heterogeneity,
learning, connectivity, and mutually influencing interactions.
Drawing on the work of Amit & Zott (2001), four value creating elements of the ecosystem’s business
models are defined, that determine the actors’ willingness to pay for the ecosystem’s offering:
Novelty – Producing something that is considered to be original. In the ecosystem novelty can
be about introducing new ways of interaction, creating new partnerships, or stimulating new
ways of doing business.
Complementarities – A bundle of activities that together deliver more value than separate. In
an ecosystem, interaction between actors is more likely when physical proximity is close.
Efficiency – Transaction costs can be reduced by management of the ecosystem. This can be
done for example by reducing information asymmetry, search and bargaining costs,
opportunistic behavior and coordination costs.
Lock-in – Actors in the ecosystem are demotivated to leave the ecosystem and to source critical
services externally. Several lock-in mechanisms in an ecosystem are externalities, reputation,
customized facilities, and knowledge availability by internationalization.
3.1.4.4 Conclusion
From platform and network theory seven, and business ecosystems four elements are found to be taken
into account when dealing with value networks. These seven issues can be seen as design parameters
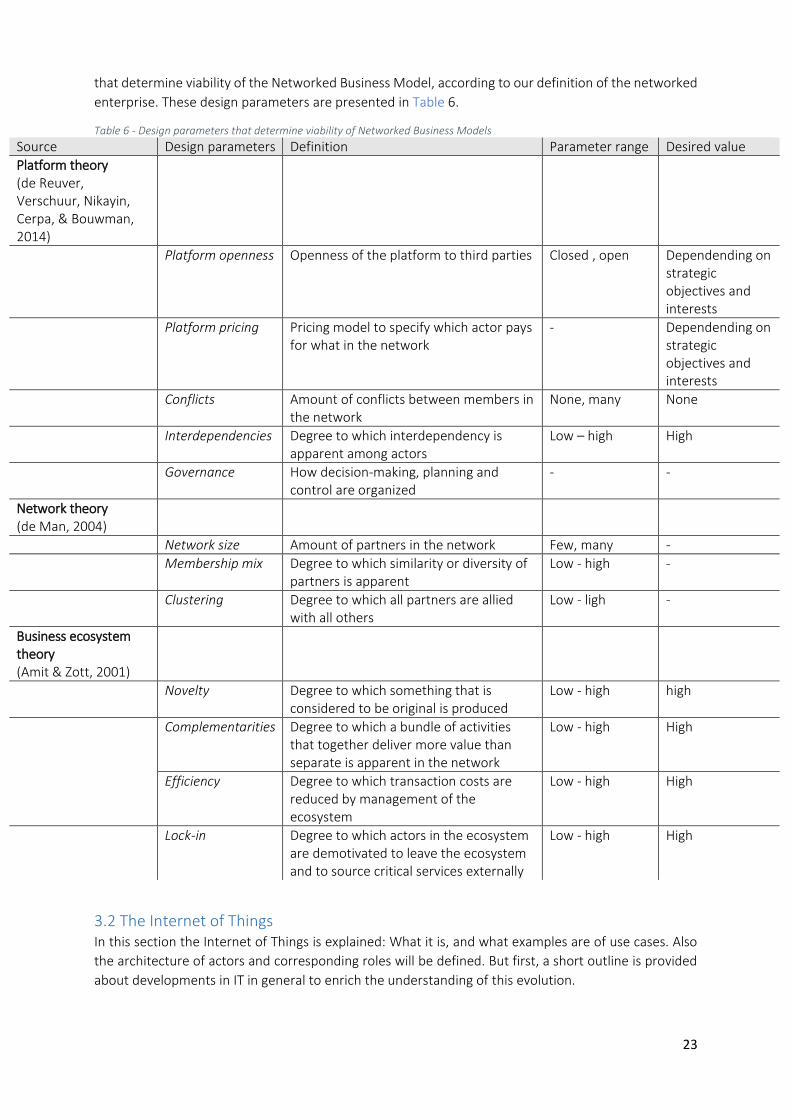
23
that determine viability of the Networked Business Model, according to our definition of the networked
enterprise. These design parameters are presented in Table 6.
Table 6 - Design parameters that determine viability of Networked Business Models
Source Design parameters Definition Parameter range Desired value
Platform theory (de Reuver, Verschuur, Nikayin, Cerpa, & Bouwman, 2014)
Platform openness Openness of the platform to third parties Closed , open Dependending on strategic objectives and interests
Platform pricing Pricing model to specify which actor pays for what in the network
- Dependending on strategic objectives and interests
Conflicts Amount of conflicts between members in the network
None, many None
Interdependencies Degree to which interdependency is apparent among actors
Low – high High
Governance How decision-making, planning and control are organized
- -
Network theory (de Man, 2004)
Network size Amount of partners in the network Few, many -
Membership mix Degree to which similarity or diversity of partners is apparent
Low - high -
Clustering Degree to which all partners are allied with all others
Low - ligh -
Business ecosystem theory (Amit & Zott, 2001)
Novelty Degree to which something that is considered to be original is produced
Low - high high
Complementarities Degree to which a bundle of activities that together deliver more value than separate is apparent in the network
Low - high High
Efficiency Degree to which transaction costs are reduced by management of the ecosystem
Low - high High
Lock-in Degree to which actors in the ecosystem are demotivated to leave the ecosystem and to source critical services externally
Low - high High
3.2 The Internet of Things In this section the Internet of Things is explained: What it is, and what examples are of use cases. Also
the architecture of actors and corresponding roles will be defined. But first, a short outline is provided
about developments in IT in general to enrich the understanding of this evolution.
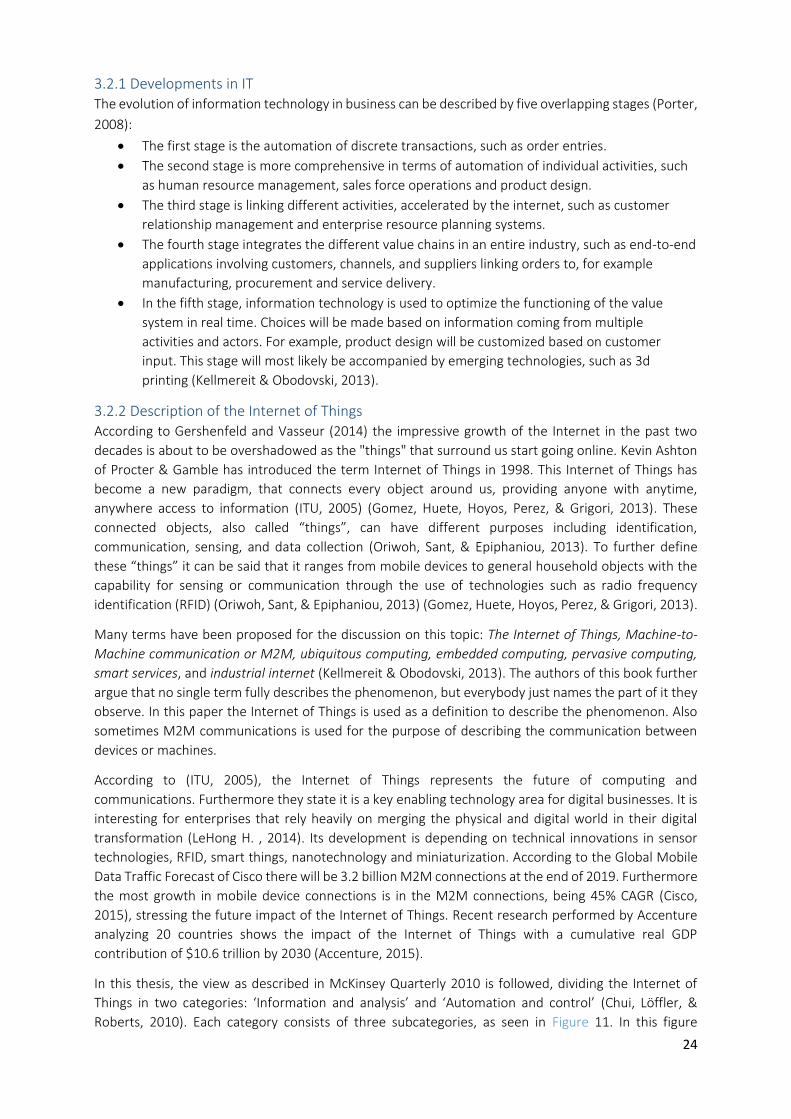
24
3.2.1 Developments in IT The evolution of information technology in business can be described by five overlapping stages (Porter,
2008):
The first stage is the automation of discrete transactions, such as order entries.
The second stage is more comprehensive in terms of automation of individual activities, such
as human resource management, sales force operations and product design.
The third stage is linking different activities, accelerated by the internet, such as customer
relationship management and enterprise resource planning systems.
The fourth stage integrates the different value chains in an entire industry, such as end-to-end
applications involving customers, channels, and suppliers linking orders to, for example
manufacturing, procurement and service delivery.
In the fifth stage, information technology is used to optimize the functioning of the value
system in real time. Choices will be made based on information coming from multiple
activities and actors. For example, product design will be customized based on customer
input. This stage will most likely be accompanied by emerging technologies, such as 3d
printing (Kellmereit & Obodovski, 2013).
3.2.2 Description of the Internet of Things According to Gershenfeld and Vasseur (2014) the impressive growth of the Internet in the past two
decades is about to be overshadowed as the "things" that surround us start going online. Kevin Ashton
of Procter & Gamble has introduced the term Internet of Things in 1998. This Internet of Things has
become a new paradigm, that connects every object around us, providing anyone with anytime,
anywhere access to information (ITU, 2005) (Gomez, Huete, Hoyos, Perez, & Grigori, 2013). These
connected objects, also called “things”, can have different purposes including identification,
communication, sensing, and data collection (Oriwoh, Sant, & Epiphaniou, 2013). To further define
these “things” it can be said that it ranges from mobile devices to general household objects with the
capability for sensing or communication through the use of technologies such as radio frequency
identification (RFID) (Oriwoh, Sant, & Epiphaniou, 2013) (Gomez, Huete, Hoyos, Perez, & Grigori, 2013).
Many terms have been proposed for the discussion on this topic: The Internet of Things, Machine-to-
Machine communication or M2M, ubiquitous computing, embedded computing, pervasive computing,
smart services, and industrial internet (Kellmereit & Obodovski, 2013). The authors of this book further
argue that no single term fully describes the phenomenon, but everybody just names the part of it they
observe. In this paper the Internet of Things is used as a definition to describe the phenomenon. Also
sometimes M2M communications is used for the purpose of describing the communication between
devices or machines.
According to (ITU, 2005), the Internet of Things represents the future of computing and
communications. Furthermore they state it is a key enabling technology area for digital businesses. It is
interesting for enterprises that rely heavily on merging the physical and digital world in their digital
transformation (LeHong H. , 2014). Its development is depending on technical innovations in sensor
technologies, RFID, smart things, nanotechnology and miniaturization. According to the Global Mobile
Data Traffic Forecast of Cisco there will be 3.2 billion M2M connections at the end of 2019. Furthermore
the most growth in mobile device connections is in the M2M connections, being 45% CAGR (Cisco,
2015), stressing the future impact of the Internet of Things. Recent research performed by Accenture
analyzing 20 countries shows the impact of the Internet of Things with a cumulative real GDP
contribution of $10.6 trillion by 2030 (Accenture, 2015).
In this thesis, the view as described in McKinsey Quarterly 2010 is followed, dividing the Internet of
Things in two categories: ‘Information and analysis’ and ‘Automation and control’ (Chui, Löffler, &
Roberts, 2010). Each category consists of three subcategories, as seen in Figure 11. In this figure
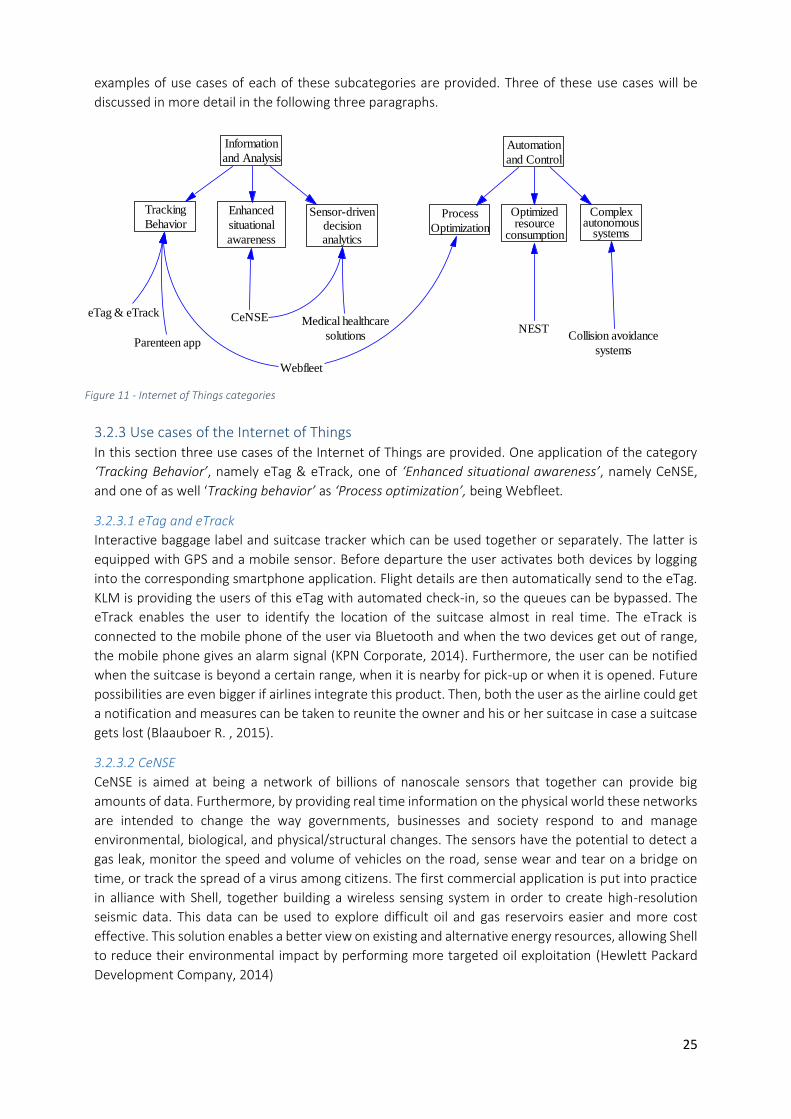
25
Figure 11 - Internet of Things categories
examples of use cases of each of these subcategories are provided. Three of these use cases will be
discussed in more detail in the following three paragraphs.
3.2.3 Use cases of the Internet of Things In this section three use cases of the Internet of Things are provided. One application of the category
‘Tracking Behavior’, namely eTag & eTrack, one of ‘Enhanced situational awareness’, namely CeNSE,
and one of as well ‘Tracking behavior’ as ‘Process optimization’, being Webfleet.
3.2.3.1 eTag and eTrack
Interactive baggage label and suitcase tracker which can be used together or separately. The latter is
equipped with GPS and a mobile sensor. Before departure the user activates both devices by logging
into the corresponding smartphone application. Flight details are then automatically send to the eTag.
KLM is providing the users of this eTag with automated check-in, so the queues can be bypassed. The
eTrack enables the user to identify the location of the suitcase almost in real time. The eTrack is
connected to the mobile phone of the user via Bluetooth and when the two devices get out of range,
the mobile phone gives an alarm signal (KPN Corporate, 2014). Furthermore, the user can be notified
when the suitcase is beyond a certain range, when it is nearby for pick-up or when it is opened. Future
possibilities are even bigger if airlines integrate this product. Then, both the user as the airline could get
a notification and measures can be taken to reunite the owner and his or her suitcase in case a suitcase
gets lost (Blaauboer R. , 2015).
3.2.3.2 CeNSE
CeNSE is aimed at being a network of billions of nanoscale sensors that together can provide big
amounts of data. Furthermore, by providing real time information on the physical world these networks
are intended to change the way governments, businesses and society respond to and manage
environmental, biological, and physical/structural changes. The sensors have the potential to detect a
gas leak, monitor the speed and volume of vehicles on the road, sense wear and tear on a bridge on
time, or track the spread of a virus among citizens. The first commercial application is put into practice
in alliance with Shell, together building a wireless sensing system in order to create high-resolution
seismic data. This data can be used to explore difficult oil and gas reservoirs easier and more cost
effective. This solution enables a better view on existing and alternative energy resources, allowing Shell
to reduce their environmental impact by performing more targeted oil exploitation (Hewlett Packard
Development Company, 2014)
eTag & eTrack
Webfleet
Parenteen app
Information
and Analysis
Tracking
BehaviorEnhanced
situational
awareness
Sensor-drivendecisionanalytics
Automation
and Control
Process
Optimization
Optimizedresource
consumption
Complexautonomous
systems
NESTCeNSE
Collision avoidance
systems
Medical healthcare
solutions
26
3.2.3.3 Webfleet
Many firms have a fleet of vehicles to manage. TomTom is connecting the control system of the engines
of these vehicles to the internet to improve fleet management TomTom (2015): Data is provided to the
managers of these fleets, which can be used for multiple purposes. First, information about the vehicles
can be tracked. Such information can be used to know whether a fuel tank is full, which vehicles need
service and how many kilometers are driven. Second, information about the driver can be provided, the
time a driver has been in a specific location, but also information about the driver’s behavior.
Furthermore, efficiency can be increased by allocating new orders to the vehicle most close to the
location. Finally, information can be send to the consumer in case of example a package delivery just on
time. Webfleet is accessible on the website of TomTom, and does not need installation. It works with
almost every browser and operating system. Information is showed on top of TomTom maps online on
the street level.
3.2.4 Architecture of the Internet of Things In order to design viable Networked Business Models for the Internet of Things, first its architecture
must be known. Who is in the value ecology, and which role do they have? To answer this question, the
architectures proposed by Gartner (Jones, 2014) and (Narayanankannankutt, 2014) are combined to
come to a clear division of objects needed, see Figure 12. In this figure a clear subdivision of layers can
be seen, being enterprise centric, cloud centric, gateway centric and thing-centric. Another study of
gartner stresses this subdivision, by defining five architecture styles, adding smartphone-centric
(LeHong H. , 2014).
Thing-centric. Things are smart themselves and have to store most of the data on-board. Things are self-sufficient and communicate to the Internet only for centralized coordination and analysis.
Smartphone-centric. The smartphone (or any mobile device) houses the application logic, stores data and communicates with the Internet for the things that are connected to it. Things don't have to be as smart, because the smartphone provides these resources.
Gateway-centric. The gateway houses the application logic, stores data and communicates with the Internet for the things that are connected to it. Data is first collected, filtered and consolidated before it is forwarded to other systems; gateways may also be necessary to bridge different communications technologies (Jones, 2014). Things don't have to be as smart, because the gateway provides these resources.
Cloud-centric. The cloud or middleware will act as the central connection hub, power analytics and provision data storage. Things don't have to be as smart, because the cloud will provide these resources. According to (Jones, 2014) many of this middleware is provided via cloud services, however they can also be hosted on-premise. Furthermore he argues that this layer is optional and therefore can be bypassed, as smart objects can also communicate directly with business systems. However, complex systems often benefit from an intermediate layer between the things and the business systems.
Enterprise-centric. Things are behind a firewall and are geographically colocated. There is little need to extend out to the external Internet.
Source: Gartner (LeHong H. , 2014)
In this thesis, smartphone-centric is taken as a subpart of thing-centric and thus four categories are included.
27
Figure 12 – Internet of Things Architecture
4. Analysis
4.1 Describing the Networked Business Model
4.1.1 Existing Business Modeling methods in terms of the Networked Business Model
As said earlier the five component shifts identified in paragraph 3.1.3 Requirements for the
Networked Business Model needed for the Networked Business Model are used as requirements to
evaluate the existing Business Modeling methods in terms of the Networked Business Model. These
component shift have been rewritten to the following requirements:
R1. Takes into account co-creators of value, rather than solely consumers.
R2. Is concerned with value networks, rather than value chains.
R3. Is concerned with network value, rather than product value.
R4. Is concerned with complex co-opetition, rather than simple co-operation or competition.
R5. Is concerned with strategy in relation to the value ecology as a whole, rather than thinking
about individual firm strategy.
The results of the focus group is presented in Table 7. The individual scores of the five group members
have been merged into one score, by computing the average score and rounding up to one decimal.
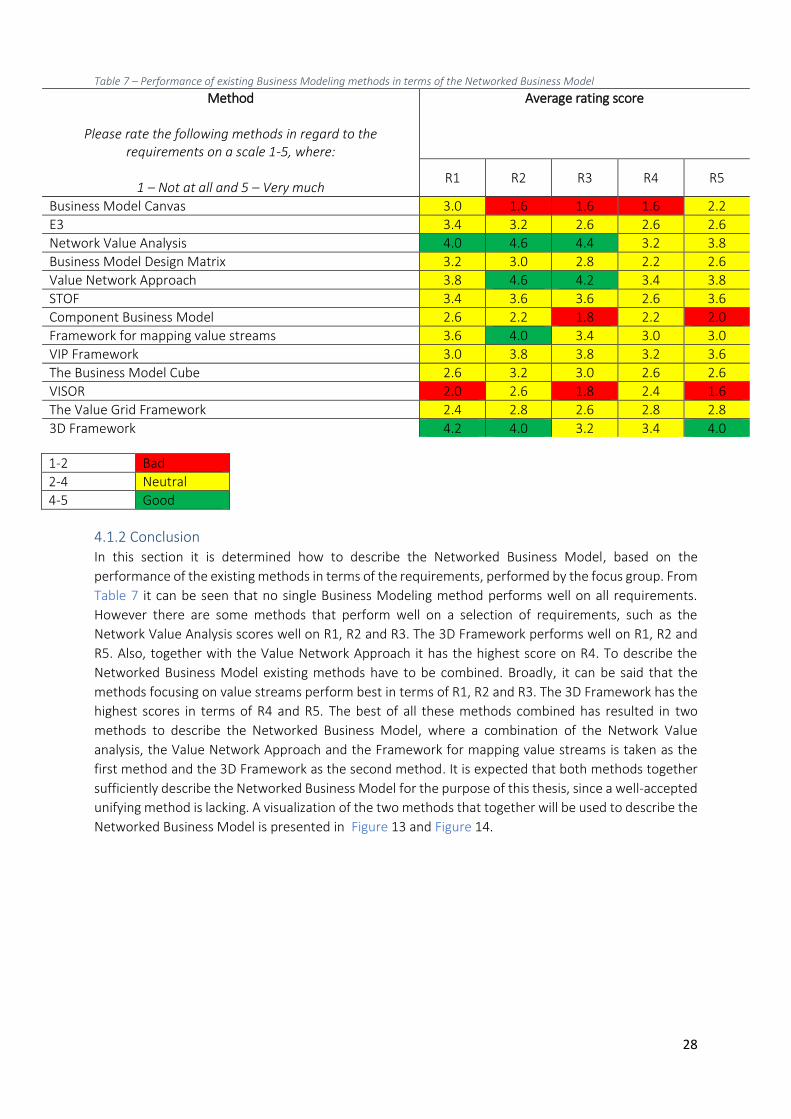
28
Table 7 – Performance of existing Business Modeling methods in terms of the Networked Business Model
Method
Please rate the following methods in regard to the requirements on a scale 1-5, where:
1 – Not at all and 5 – Very much
Average rating score
R1 R2 R3 R4 R5
Business Model Canvas 3.0 1.6 1.6 1.6 2.2
E3 3.4 3.2 2.6 2.6 2.6
Network Value Analysis 4.0 4.6 4.4 3.2 3.8
Business Model Design Matrix 3.2 3.0 2.8 2.2 2.6
Value Network Approach 3.8 4.6 4.2 3.4 3.8
STOF 3.4 3.6 3.6 2.6 3.6
Component Business Model 2.6 2.2 1.8 2.2 2.0
Framework for mapping value streams 3.6 4.0 3.4 3.0 3.0
VIP Framework 3.0 3.8 3.8 3.2 3.6
The Business Model Cube 2.6 3.2 3.0 2.6 2.6
VISOR 2.0 2.6 1.8 2.4 1.6
The Value Grid Framework 2.4 2.8 2.6 2.8 2.8
3D Framework 4.2 4.0 3.2 3.4 4.0
4.1.2 Conclusion In this section it is determined how to describe the Networked Business Model, based on the
performance of the existing methods in terms of the requirements, performed by the focus group. From
Table 7 it can be seen that no single Business Modeling method performs well on all requirements.
However there are some methods that perform well on a selection of requirements, such as the
Network Value Analysis scores well on R1, R2 and R3. The 3D Framework performs well on R1, R2 and
R5. Also, together with the Value Network Approach it has the highest score on R4. To describe the
Networked Business Model existing methods have to be combined. Broadly, it can be said that the
methods focusing on value streams perform best in terms of R1, R2 and R3. The 3D Framework has the
highest scores in terms of R4 and R5. The best of all these methods combined has resulted in two
methods to describe the Networked Business Model, where a combination of the Network Value
analysis, the Value Network Approach and the Framework for mapping value streams is taken as the
first method and the 3D Framework as the second method. It is expected that both methods together
sufficiently describe the Networked Business Model for the purpose of this thesis, since a well-accepted
unifying method is lacking. A visualization of the two methods that together will be used to describe the
Networked Business Model is presented in Figure 13 and Figure 14.
1-2 Bad
2-4 Neutral
4-5 Good
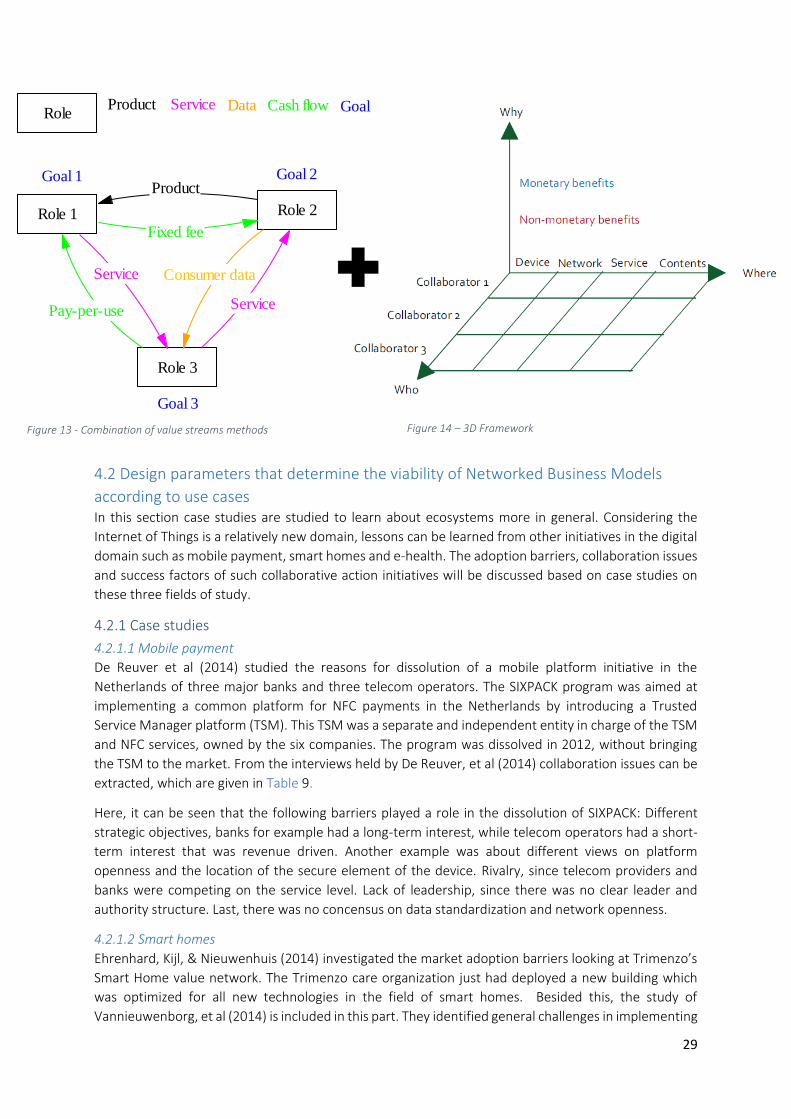
29
Figure 14 – 3D Framework Figure 13 - Combination of value streams methods
RoleProduct Service Cash flow GoalData
Role 1 Role 2
Role 3
Goal 1 Goal 2
Goal 3
Fixed fee
Product
Consumer data
Service
Service
Pay-per-use
4.2 Design parameters that determine the viability of Networked Business Models
according to use cases In this section case studies are studied to learn about ecosystems more in general. Considering the
Internet of Things is a relatively new domain, lessons can be learned from other initiatives in the digital
domain such as mobile payment, smart homes and e-health. The adoption barriers, collaboration issues
and success factors of such collaborative action initiatives will be discussed based on case studies on
these three fields of study.
4.2.1 Case studies
4.2.1.1 Mobile payment
De Reuver et al (2014) studied the reasons for dissolution of a mobile platform initiative in the
Netherlands of three major banks and three telecom operators. The SIXPACK program was aimed at
implementing a common platform for NFC payments in the Netherlands by introducing a Trusted
Service Manager platform (TSM). This TSM was a separate and independent entity in charge of the TSM
and NFC services, owned by the six companies. The program was dissolved in 2012, without bringing
the TSM to the market. From the interviews held by De Reuver, et al (2014) collaboration issues can be
extracted, which are given in Table 9.
Here, it can be seen that the following barriers played a role in the dissolution of SIXPACK: Different
strategic objectives, banks for example had a long-term interest, while telecom operators had a short-
term interest that was revenue driven. Another example was about different views on platform
openness and the location of the secure element of the device. Rivalry, since telecom providers and
banks were competing on the service level. Lack of leadership, since there was no clear leader and
authority structure. Last, there was no concensus on data standardization and network openness.
4.2.1.2 Smart homes
Ehrenhard, Kijl, & Nieuwenhuis (2014) investigated the market adoption barriers looking at Trimenzo’s
Smart Home value network. The Trimenzo care organization just had deployed a new building which
was optimized for all new technologies in the field of smart homes. Besided this, the study of
Vannieuwenborg, et al (2014) is included in this part. They identified general challenges in implementing

30
smart home platforms. The market adoption barriers extracted from the Trimenzo case and the general
challenges provided by Vannieuwenborg, et al (2014) are given in Table 9.
Here, it can be seen that the following barriers played a role in the use case of Trimenzo: Low customer
value, since customer had fear of losing control. Besides this, they also expressed privacy concerns. Lack
of data standardization, since maintenance costs substantially increased when multiple solutions were
implemented. Next to this, initial set-up costs were too high. Regulators, since they are able to change
regulations during the project.
4.2.1.3 e-Health
Murray et al (2011) investigated the implementation phase of three use cases in e-Health:
1. Choose and Book (C&B)
An electronic service that provided patients with the possibility to choose which hospital their
general practitioner referred them to and to book the date and time of the first appointment.
2. Picture Archive and Communication System (PACS)
A system for digitizing images, such as X-rays, scans, or photographs. These digitized images
could be stored online and accessed by multiple persons at the same time.
3. Community Nursing Information System (CNIS)
A system consisting of hand-held wireless enabled Personal Digital Assistant devices (iPAQs).
Clinical data could be recorded while out in the field and uploaded to the central server once
they were back at the base. The system also included some degree of decision support by
providing standardized assessment tools with associated care algorithms. The system was
intended to be a single share point for district nursed and social services.
From the interviews held for the report of Murray et al (2011), the barriers and success factors of the
solution in regard of the ecosystem they are embedded in can be extracted, given in Table 8.
Here, it can be seen that the following barriers played a role in the use case of C&B: Low ease of use,
for example it took a lot of time to make a referral, which had a negative effect on patient consultations.
Low customer value, since general practitioners perceived the use of the C&B solution as a poor use of
their clinical skill.
The following barriers played a role in the use case of CNIS: Low commitment, since for example one of
the parties involved did not use the solution. Low ease of use, because not all nurses felt comfortable
using the solution, with the hand-held devices still seen as new or strange. Low customer value, since
there was loss of personal contact between specialist and the referring doctor. Lack of leadership, since
the dedicated implementation group was disbanded.
The following success factors played a role in the use case of CNIS: High intended ease of use, since
iPAQ’s were cheap, robust and portable, allowing nurses to feel comfortable carrying them. High initial
commitment, since awareness of importance of the system resulted in considerable investment of
energy and resources into implementation.
The following success factors played a role in the use case of PACS: High customer value, since for
example the availability of images was increased, enabling making decisions in a timely matter. High
ease of use, since the solution was perceived intuitive. Training, since intensive effort were put into
training the clinical staff before implementation. Aligned strategic objectives, since the goals of the
organizations matched. High commitment and leadership, since the CEO was committed to the solution
and showed strong leadership.
4.2.2 Conclusion The influences that were extracted have been coded and merged in order to get more general terms,
accounting for possible overlap. This is done using open coding. This provides us with twelve design
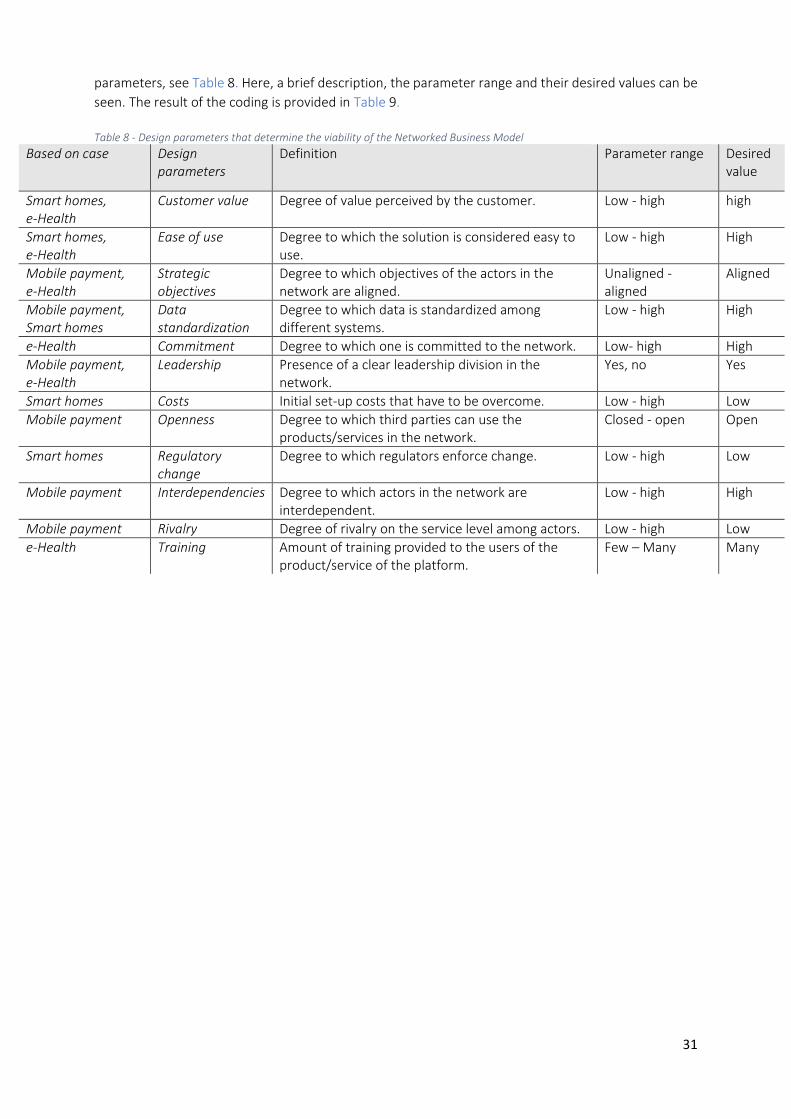
31
parameters, see Table 8. Here, a brief description, the parameter range and their desired values can be
seen. The result of the coding is provided in Table 9. Table 8 - Design parameters that determine the viability of the Networked Business Model
Based on case Design parameters
Definition Parameter range Desired value
Smart homes, e-Health
Customer value Degree of value perceived by the customer. Low - high high
Smart homes, e-Health
Ease of use Degree to which the solution is considered easy to use.
Low - high High
Mobile payment, e-Health
Strategic objectives
Degree to which objectives of the actors in the network are aligned.
Unaligned - aligned
Aligned
Mobile payment, Smart homes
Data standardization
Degree to which data is standardized among different systems.
Low - high High
e-Health Commitment Degree to which one is committed to the network. Low- high High
Mobile payment, e-Health
Leadership Presence of a clear leadership division in the network.
Yes, no Yes
Smart homes Costs Initial set-up costs that have to be overcome. Low - high Low
Mobile payment Openness Degree to which third parties can use the products/services in the network.
Closed - open Open
Smart homes Regulatory change
Degree to which regulators enforce change. Low - high Low
Mobile payment Interdependencies Degree to which actors in the network are interdependent.
Low - high High
Mobile payment Rivalry Degree of rivalry on the service level among actors. Low - high Low
e-Health Training Amount of training provided to the users of the product/service of the platform.
Few – Many Many
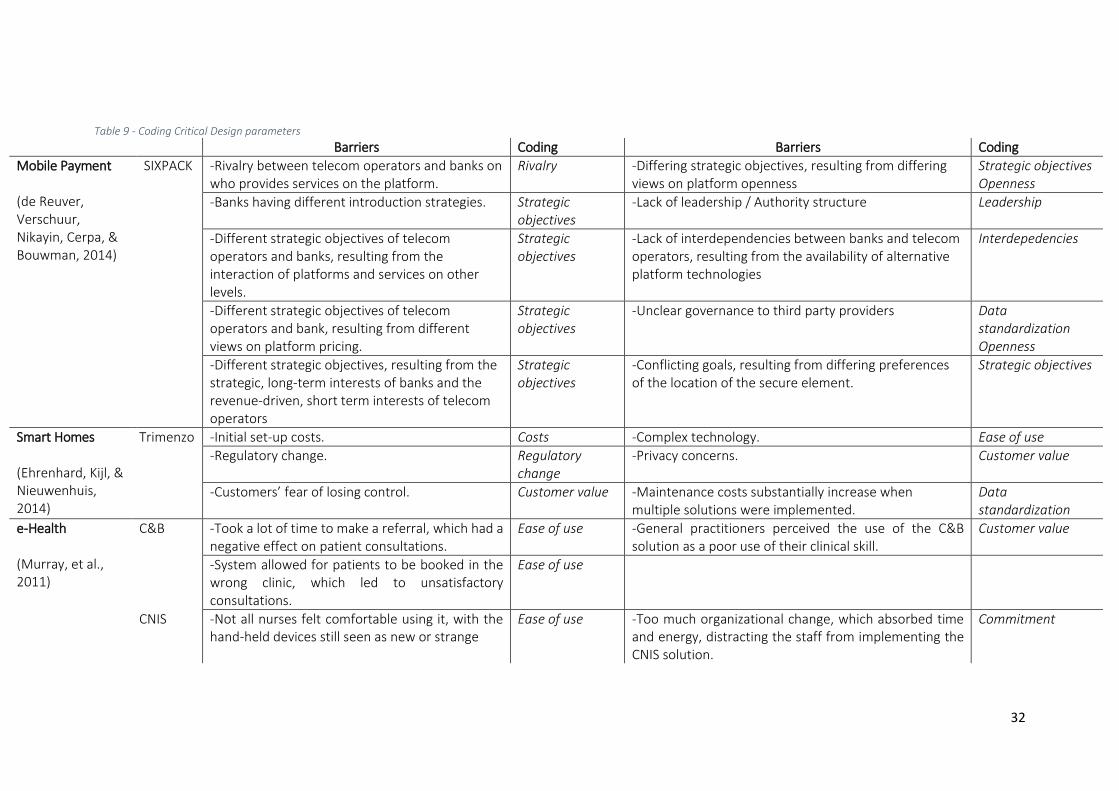
32
Table 9 - Coding Critical Design parameters
Barriers Coding Barriers Coding
Mobile Payment (de Reuver, Verschuur, Nikayin, Cerpa, & Bouwman, 2014)
SIXPACK
-Rivalry between telecom operators and banks on who provides services on the platform.
Rivalry -Differing strategic objectives, resulting from differing views on platform openness
Strategic objectives Openness
-Banks having different introduction strategies. Strategic objectives
-Lack of leadership / Authority structure Leadership
-Different strategic objectives of telecom operators and banks, resulting from the interaction of platforms and services on other levels.
Strategic objectives
-Lack of interdependencies between banks and telecom operators, resulting from the availability of alternative platform technologies
Interdepedencies
-Different strategic objectives of telecom operators and bank, resulting from different views on platform pricing.
Strategic objectives
-Unclear governance to third party providers Data standardization Openness
-Different strategic objectives, resulting from the strategic, long-term interests of banks and the revenue-driven, short term interests of telecom operators
Strategic objectives
-Conflicting goals, resulting from differing preferences of the location of the secure element.
Strategic objectives
Smart Homes (Ehrenhard, Kijl, & Nieuwenhuis, 2014)
Trimenzo
-Initial set-up costs. Costs -Complex technology. Ease of use
-Regulatory change. Regulatory change
-Privacy concerns. Customer value
-Customers’ fear of losing control. Customer value -Maintenance costs substantially increase when multiple solutions were implemented.
Data standardization
e-Health (Murray, et al., 2011)
C&B
-Took a lot of time to make a referral, which had a negative effect on patient consultations.
Ease of use -General practitioners perceived the use of the C&B solution as a poor use of their clinical skill.
Customer value
-System allowed for patients to be booked in the wrong clinic, which led to unsatisfactory consultations.
Ease of use
CNIS
-Not all nurses felt comfortable using it, with the hand-held devices still seen as new or strange
Ease of use -Too much organizational change, which absorbed time and energy, distracting the staff from implementing the CNIS solution.
Commitment
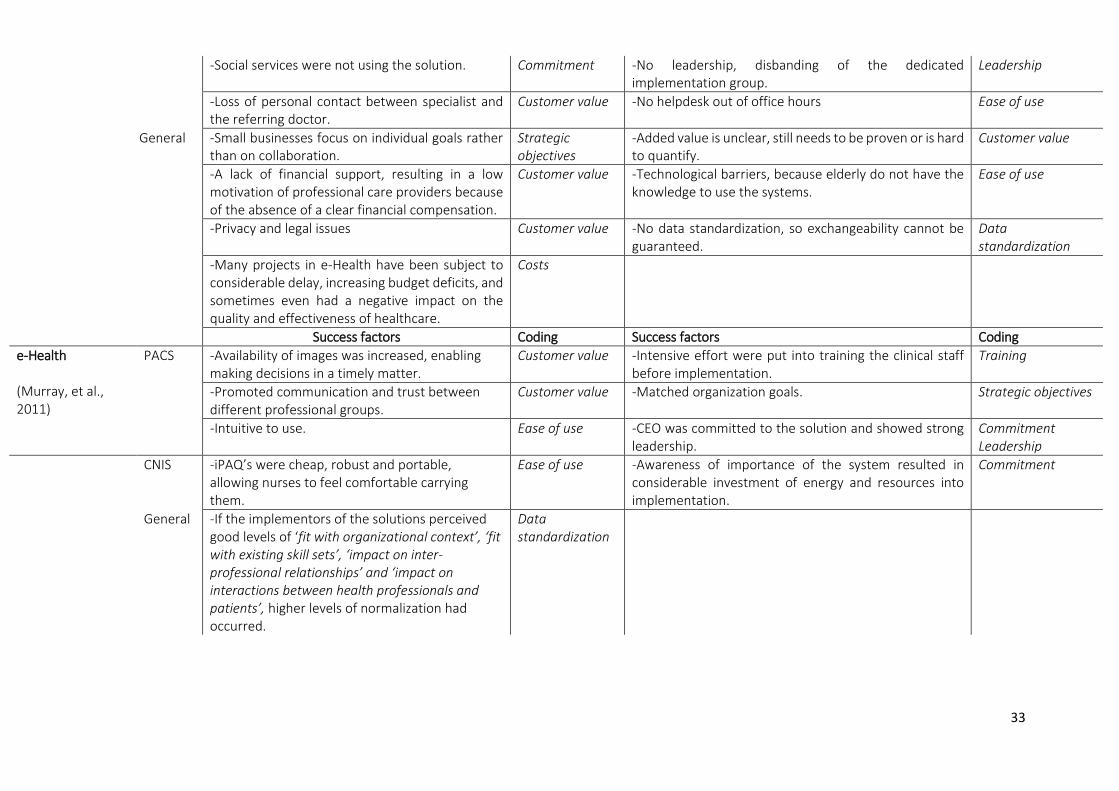
33
-Social services were not using the solution. Commitment -No leadership, disbanding of the dedicated implementation group.
Leadership
-Loss of personal contact between specialist and the referring doctor.
Customer value -No helpdesk out of office hours Ease of use
General -Small businesses focus on individual goals rather than on collaboration.
Strategic objectives
-Added value is unclear, still needs to be proven or is hard to quantify.
Customer value
-A lack of financial support, resulting in a low motivation of professional care providers because of the absence of a clear financial compensation.
Customer value -Technological barriers, because elderly do not have the knowledge to use the systems.
Ease of use
-Privacy and legal issues Customer value -No data standardization, so exchangeability cannot be guaranteed.
Data standardization
-Many projects in e-Health have been subject to considerable delay, increasing budget deficits, and sometimes even had a negative impact on the quality and effectiveness of healthcare.
Costs
Success factors Coding Success factors Coding
e-Health (Murray, et al., 2011)
PACS
-Availability of images was increased, enabling making decisions in a timely matter.
Customer value -Intensive effort were put into training the clinical staff before implementation.
Training
-Promoted communication and trust between different professional groups.
Customer value -Matched organization goals. Strategic objectives
-Intuitive to use. Ease of use -CEO was committed to the solution and showed strong leadership.
Commitment Leadership
CNIS -iPAQ’s were cheap, robust and portable, allowing nurses to feel comfortable carrying them.
Ease of use -Awareness of importance of the system resulted in considerable investment of energy and resources into implementation.
Commitment
General
-If the implementors of the solutions perceived good levels of ‘fit with organizational context’, ‘fit with existing skill sets’, ‘impact on inter-professional relationships’ and ‘impact on interactions between health professionals and patients’, higher levels of normalization had occurred.
Data standardization
34
4.3 The Networked Business Model of the Internet of Things In this chapter the combination of methods as described in 4.1 Describing the Networked Business
Model is used to describe the Networked Business Model of the Internet of Things. This is done by
analyzing the interviews held with practitioners. Before doing this, a summary of these interviews is
provided for each actor involved.
4.3.1 Interviews practitioners From the information provided in the interview, the Networked Business Model the actor is embedded
in can be provided. This will be done using the two methods indicated earlier, the combined value
streams method and the 3D Framework. The result of this is shown after a short description of the
interview.
4.3.1.1 The Networked Business Model of Company 1
Company 1 is a communication provider and wants to be thought leader in the Internet of Things and
partner for every Internet of Things partner. Their key activity is transmitting data packages in a secure
manner and save it somewhere. Company 1 delivers enhanced connectivity with additional extra
services such as storage, housing, hosting, data analysis and security. The manufacturers pay an monthly
fixed fee, plus extra for the use of data. They notice a shift in customer base from consumers to the
developer of end solutions. Another shift is from high monthly recurring fees to high volume selling with
low margins. Company 1 works together with a third party modem supplier, and tries to set the
standard in Internet of Things communication. This modem delivers a module in which different sensors
can be plugged in and offers low power technology, which Company 1 uses to send the data packages.
Our connectivity is open and we provide APIs for it. Furthermore, they argue it is hard to find partners,
since most of the time they are startups. The idea is that these startups start today and grow big
tomorrow. This is also the reason that Company 1 organizes several activities to come across these new
players. Next to this, they participate in several projects such as a smart cities project. Also they invested
in a department of employees who have an entrepreneurial mindset, who are responsible for mapping
the startups for the Internet of Things in the Netherlands. Once found, Company 1 does not apply
strangling contract, but rather shows where they can add value in their business model. If they come
across small players that are considered competitive, often they cannot deliver the security demands
and therefore are acquired by Company 1. Professional parties on the other hand, who are further in
their development in the Internet of Things, are waiting for them to enroll the national network.
Partners in general are considered also to be the channels. Viability of the Internet of Things is enhanced
by the introduction of low power communication, which is less expensive and has a longer life time. This
has a positive influence on the usability of the Internet of Things. If you can positively influence usability,
security, efficiency, cost reduction, comfort, you will be able to earn money with your solution.
From the information provided in the interview, the Networked Business Model Company 1 is
embedded in can be provided. The result is shown in Figure 15 and Table 10 - 3D Framework for .
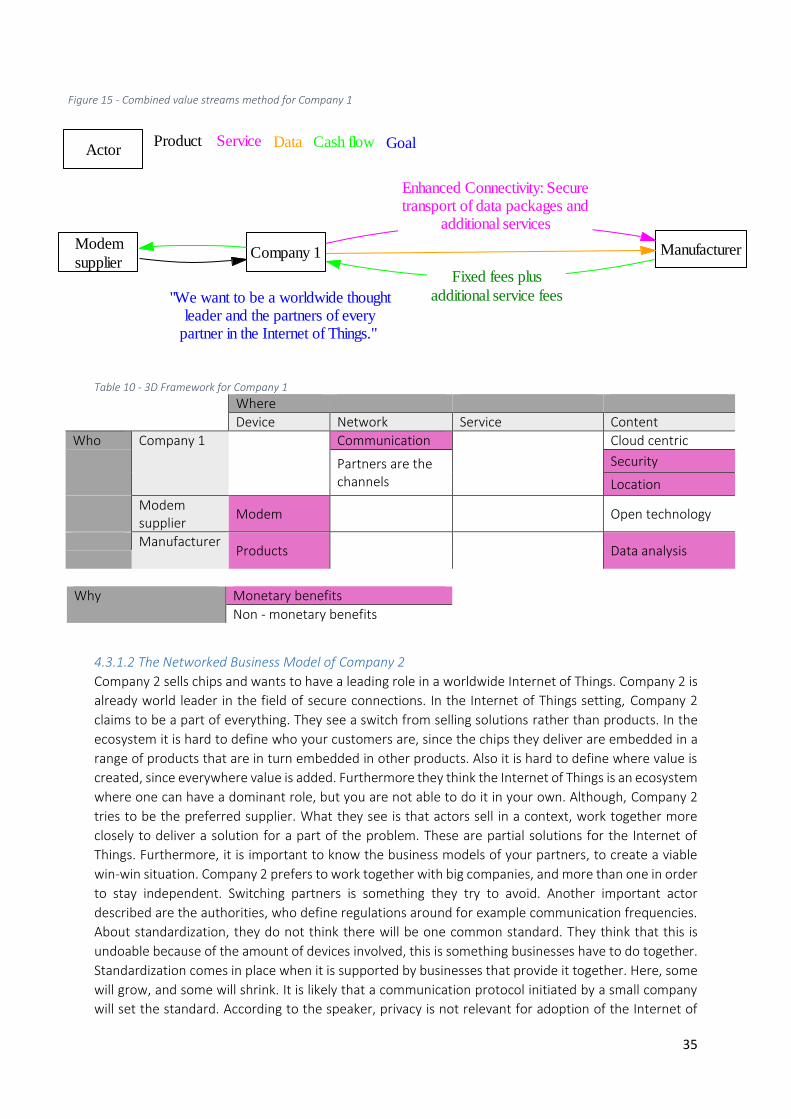
35
Company 1 ManufacturerModem
supplier
ActorProduct Service Cash flow GoalData
"We want to be a worldwide thoughtleader and the partners of every
partner in the Internet of Things."
Fixed fees plus
additional service fees
Enhanced Connectivity: Securetransport of data packages and
additional services
Table 10 - 3D Framework for Company 1
Where
Device Network Service Content
Who Company 1
Communication
Cloud centric
Partners are the channels
Security
Location
Modem supplier
Modem Open technology
Manufacturer Products Data analysis
Why Monetary benefits
Non - monetary benefits
4.3.1.2 The Networked Business Model of Company 2
Company 2 sells chips and wants to have a leading role in a worldwide Internet of Things. Company 2 is
already world leader in the field of secure connections. In the Internet of Things setting, Company 2
claims to be a part of everything. They see a switch from selling solutions rather than products. In the
ecosystem it is hard to define who your customers are, since the chips they deliver are embedded in a
range of products that are in turn embedded in other products. Also it is hard to define where value is
created, since everywhere value is added. Furthermore they think the Internet of Things is an ecosystem
where one can have a dominant role, but you are not able to do it in your own. Although, Company 2
tries to be the preferred supplier. What they see is that actors sell in a context, work together more
closely to deliver a solution for a part of the problem. These are partial solutions for the Internet of
Things. Furthermore, it is important to know the business models of your partners, to create a viable
win-win situation. Company 2 prefers to work together with big companies, and more than one in order
to stay independent. Switching partners is something they try to avoid. Another important actor
described are the authorities, who define regulations around for example communication frequencies.
About standardization, they do not think there will be one common standard. They think that this is
undoable because of the amount of devices involved, this is something businesses have to do together.
Standardization comes in place when it is supported by businesses that provide it together. Here, some
will grow, and some will shrink. It is likely that a communication protocol initiated by a small company
will set the standard. According to the speaker, privacy is not relevant for adoption of the Internet of
Figure 15 - Combined value streams method for Company 1
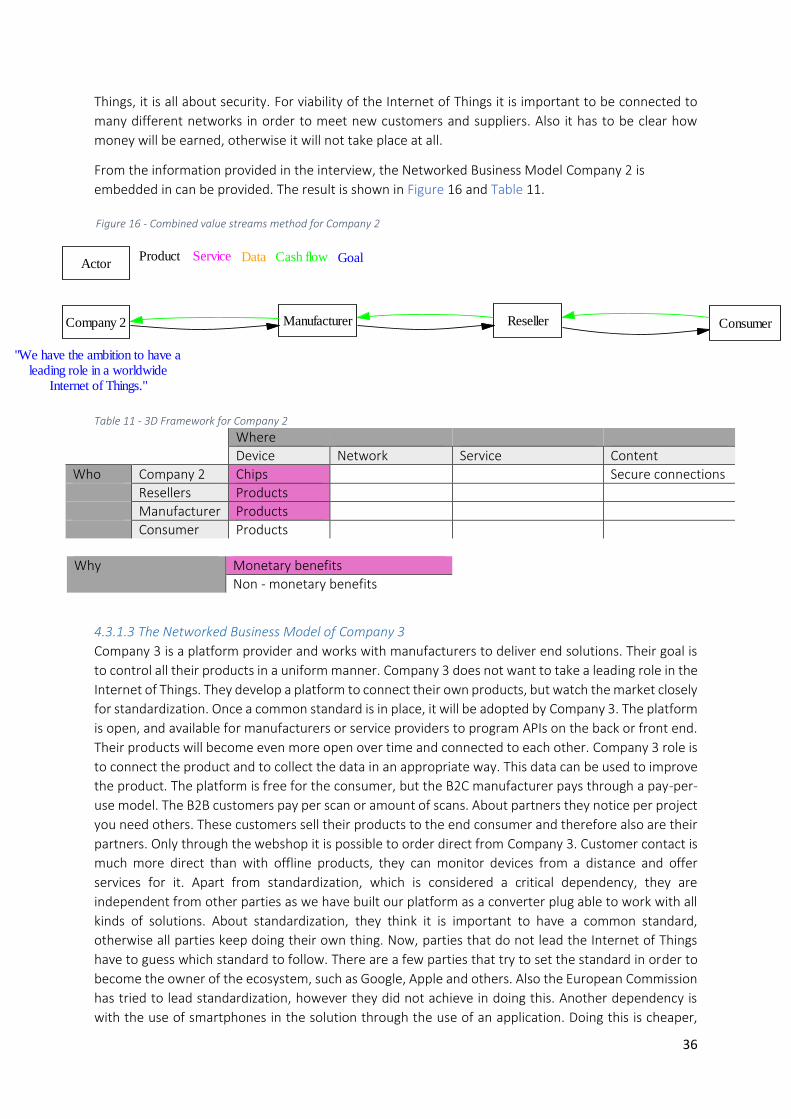
36
Things, it is all about security. For viability of the Internet of Things it is important to be connected to
many different networks in order to meet new customers and suppliers. Also it has to be clear how
money will be earned, otherwise it will not take place at all.
From the information provided in the interview, the Networked Business Model Company 2 is
embedded in can be provided. The result is shown in Figure 16 and Table 11.
Table 11 - 3D Framework for Company 2
Where
Device Network Service Content
Who Company 2 Chips Secure connections
Resellers Products
Manufacturer Products
Consumer Products
Why Monetary benefits
Non - monetary benefits
4.3.1.3 The Networked Business Model of Company 3
Company 3 is a platform provider and works with manufacturers to deliver end solutions. Their goal is
to control all their products in a uniform manner. Company 3 does not want to take a leading role in the
Internet of Things. They develop a platform to connect their own products, but watch the market closely
for standardization. Once a common standard is in place, it will be adopted by Company 3. The platform
is open, and available for manufacturers or service providers to program APIs on the back or front end.
Their products will become even more open over time and connected to each other. Company 3 role is
to connect the product and to collect the data in an appropriate way. This data can be used to improve
the product. The platform is free for the consumer, but the B2C manufacturer pays through a pay-per-
use model. The B2B customers pay per scan or amount of scans. About partners they notice per project
you need others. These customers sell their products to the end consumer and therefore also are their
partners. Only through the webshop it is possible to order direct from Company 3. Customer contact is
much more direct than with offline products, they can monitor devices from a distance and offer
services for it. Apart from standardization, which is considered a critical dependency, they are
independent from other parties as we have built our platform as a converter plug able to work with all
kinds of solutions. About standardization, they think it is important to have a common standard,
otherwise all parties keep doing their own thing. Now, parties that do not lead the Internet of Things
have to guess which standard to follow. There are a few parties that try to set the standard in order to
become the owner of the ecosystem, such as Google, Apple and others. Also the European Commission
has tried to lead standardization, however they did not achieve in doing this. Another dependency is
with the use of smartphones in the solution through the use of an application. Doing this is cheaper,
Figure 16 - Combined value streams method for Company 2
Company 2 Manufacturer ConsumerReseller
ActorProduct Service Cash flow GoalData
"We have the ambition to have aleading role in a worldwide
Internet of Things."
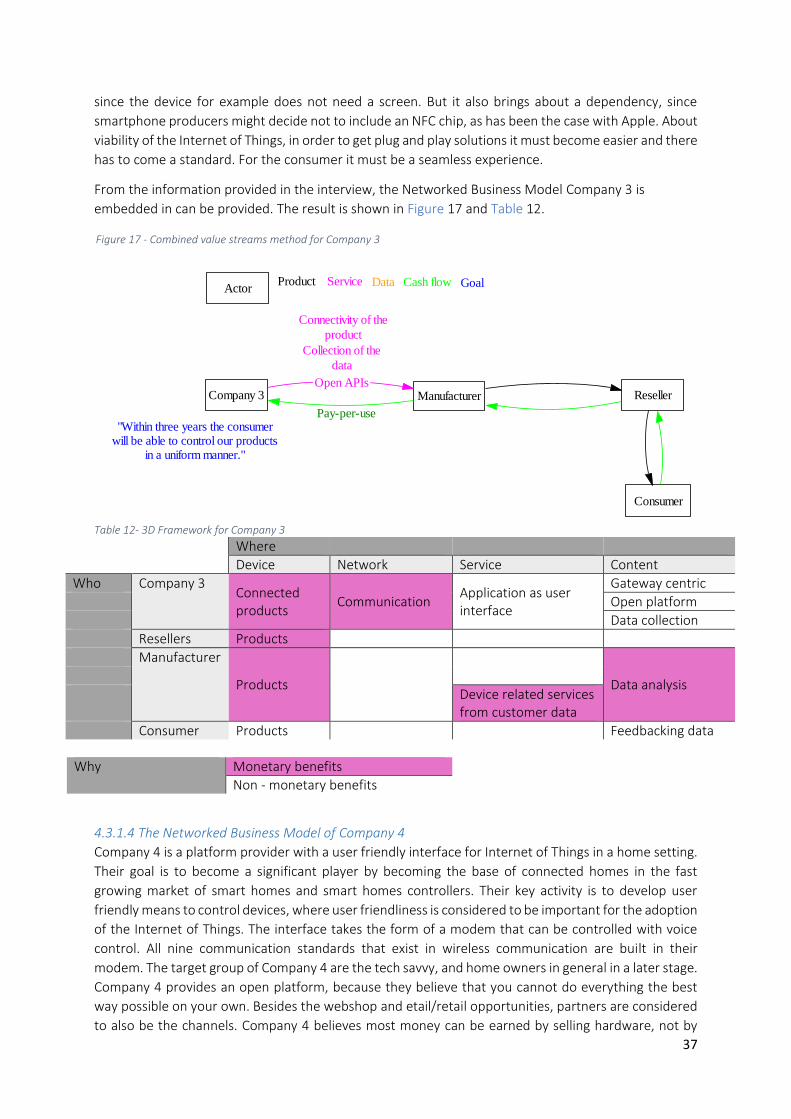
37
since the device for example does not need a screen. But it also brings about a dependency, since
smartphone producers might decide not to include an NFC chip, as has been the case with Apple. About
viability of the Internet of Things, in order to get plug and play solutions it must become easier and there
has to come a standard. For the consumer it must be a seamless experience.
From the information provided in the interview, the Networked Business Model Company 3 is
embedded in can be provided. The result is shown in Figure 17 and Table 12.
Table 12- 3D Framework for Company 3
Where
Device Network Service Content
Who Company 3 Connected products
Communication Application as user interface
Gateway centric
Open platform
Data collection
Resellers Products
Manufacturer
Products
Data analysis
Device related services from customer data
Consumer Products Feedbacking data
Why Monetary benefits
Non - monetary benefits
4.3.1.4 The Networked Business Model of Company 4
Company 4 is a platform provider with a user friendly interface for Internet of Things in a home setting.
Their goal is to become a significant player by becoming the base of connected homes in the fast
growing market of smart homes and smart homes controllers. Their key activity is to develop user
friendly means to control devices, where user friendliness is considered to be important for the adoption
of the Internet of Things. The interface takes the form of a modem that can be controlled with voice
control. All nine communication standards that exist in wireless communication are built in their
modem. The target group of Company 4 are the tech savvy, and home owners in general in a later stage.
Company 4 provides an open platform, because they believe that you cannot do everything the best
way possible on your own. Besides the webshop and etail/retail opportunities, partners are considered
to also be the channels. Company 4 believes most money can be earned by selling hardware, not by
Figure 17 - Combined value streams method for Company 3
Company 3 Manufacturer
Consumer
Reseller
ActorProduct Service Cash flow GoalData
"Within three years the consumerwill be able to control our products
in a uniform manner."
Pay-per-use
Connectivity of the
product
Collection of the
data
Open APIs
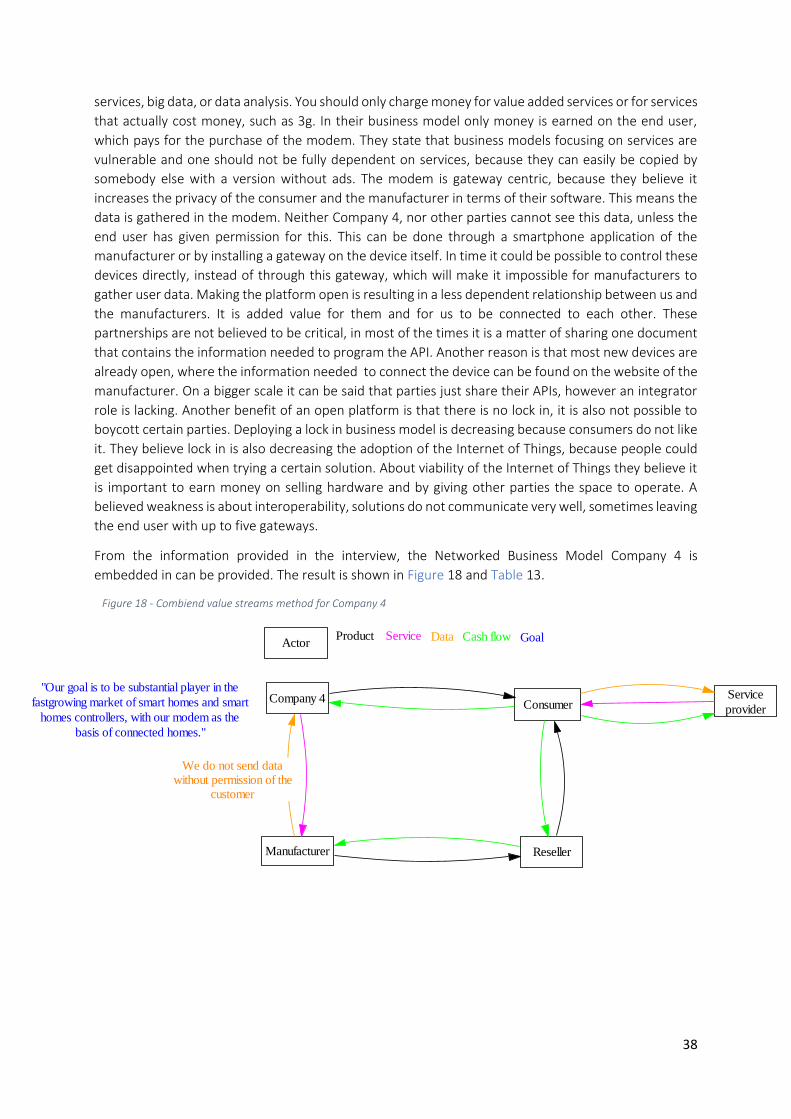
38
services, big data, or data analysis. You should only charge money for value added services or for services
that actually cost money, such as 3g. In their business model only money is earned on the end user,
which pays for the purchase of the modem. They state that business models focusing on services are
vulnerable and one should not be fully dependent on services, because they can easily be copied by
somebody else with a version without ads. The modem is gateway centric, because they believe it
increases the privacy of the consumer and the manufacturer in terms of their software. This means the
data is gathered in the modem. Neither Company 4, nor other parties cannot see this data, unless the
end user has given permission for this. This can be done through a smartphone application of the
manufacturer or by installing a gateway on the device itself. In time it could be possible to control these
devices directly, instead of through this gateway, which will make it impossible for manufacturers to
gather user data. Making the platform open is resulting in a less dependent relationship between us and
the manufacturers. It is added value for them and for us to be connected to each other. These
partnerships are not believed to be critical, in most of the times it is a matter of sharing one document
that contains the information needed to program the API. Another reason is that most new devices are
already open, where the information needed to connect the device can be found on the website of the
manufacturer. On a bigger scale it can be said that parties just share their APIs, however an integrator
role is lacking. Another benefit of an open platform is that there is no lock in, it is also not possible to
boycott certain parties. Deploying a lock in business model is decreasing because consumers do not like
it. They believe lock in is also decreasing the adoption of the Internet of Things, because people could
get disappointed when trying a certain solution. About viability of the Internet of Things they believe it
is important to earn money on selling hardware and by giving other parties the space to operate. A
believed weakness is about interoperability, solutions do not communicate very well, sometimes leaving
the end user with up to five gateways.
From the information provided in the interview, the Networked Business Model Company 4 is
embedded in can be provided. The result is shown in Figure 18 and Table 13.
Figure 18 - Combiend value streams method for Company 4
Company 4
Manufacturer
ConsumerService
provider
Reseller
ActorProduct Service Cash flow GoalData
"Our goal is to be substantial player in the
fastgrowing market of smart homes and smart
homes controllers, with our modem as the
basis of connected homes."
We do not send datawithout permission of the
customer
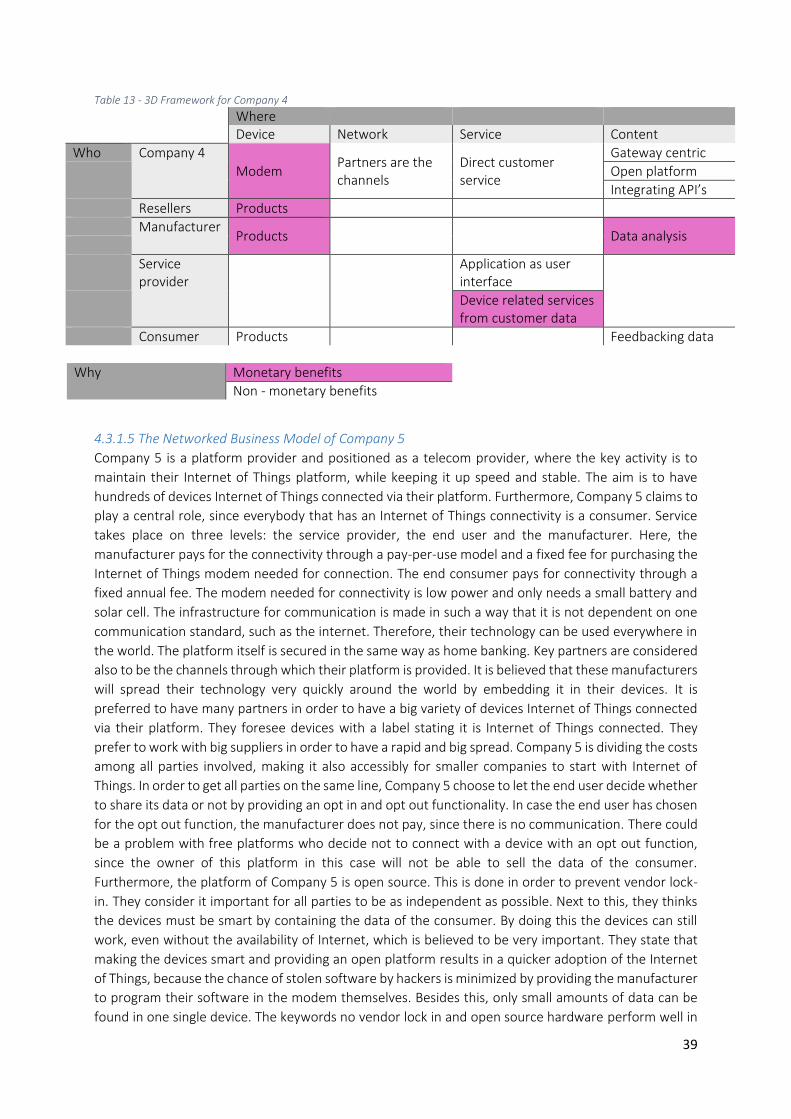
39
Table 13 - 3D Framework for Company 4
Where Device Network Service Content
Who Company 4
Modem Partners are the channels
Direct customer service
Gateway centric
Open platform
Integrating API’s
Resellers Products
Manufacturer Products Data analysis
Service provider
Application as user interface
Device related services
from customer data
Consumer Products Feedbacking data
Why Monetary benefits
Non - monetary benefits
4.3.1.5 The Networked Business Model of Company 5
Company 5 is a platform provider and positioned as a telecom provider, where the key activity is to
maintain their Internet of Things platform, while keeping it up speed and stable. The aim is to have
hundreds of devices Internet of Things connected via their platform. Furthermore, Company 5 claims to
play a central role, since everybody that has an Internet of Things connectivity is a consumer. Service
takes place on three levels: the service provider, the end user and the manufacturer. Here, the
manufacturer pays for the connectivity through a pay-per-use model and a fixed fee for purchasing the
Internet of Things modem needed for connection. The end consumer pays for connectivity through a
fixed annual fee. The modem needed for connectivity is low power and only needs a small battery and
solar cell. The infrastructure for communication is made in such a way that it is not dependent on one
communication standard, such as the internet. Therefore, their technology can be used everywhere in
the world. The platform itself is secured in the same way as home banking. Key partners are considered
also to be the channels through which their platform is provided. It is believed that these manufacturers
will spread their technology very quickly around the world by embedding it in their devices. It is
preferred to have many partners in order to have a big variety of devices Internet of Things connected
via their platform. They foresee devices with a label stating it is Internet of Things connected. They
prefer to work with big suppliers in order to have a rapid and big spread. Company 5 is dividing the costs
among all parties involved, making it also accessibly for smaller companies to start with Internet of
Things. In order to get all parties on the same line, Company 5 choose to let the end user decide whether
to share its data or not by providing an opt in and opt out functionality. In case the end user has chosen
for the opt out function, the manufacturer does not pay, since there is no communication. There could
be a problem with free platforms who decide not to connect with a device with an opt out function,
since the owner of this platform in this case will not be able to sell the data of the consumer.
Furthermore, the platform of Company 5 is open source. This is done in order to prevent vendor lock-
in. They consider it important for all parties to be as independent as possible. Next to this, they thinks
the devices must be smart by containing the data of the consumer. By doing this the devices can still
work, even without the availability of Internet, which is believed to be very important. They state that
making the devices smart and providing an open platform results in a quicker adoption of the Internet
of Things, because the chance of stolen software by hackers is minimized by providing the manufacturer
to program their software in the modem themselves. Besides this, only small amounts of data can be
found in one single device. The keywords no vendor lock in and open source hardware perform well in
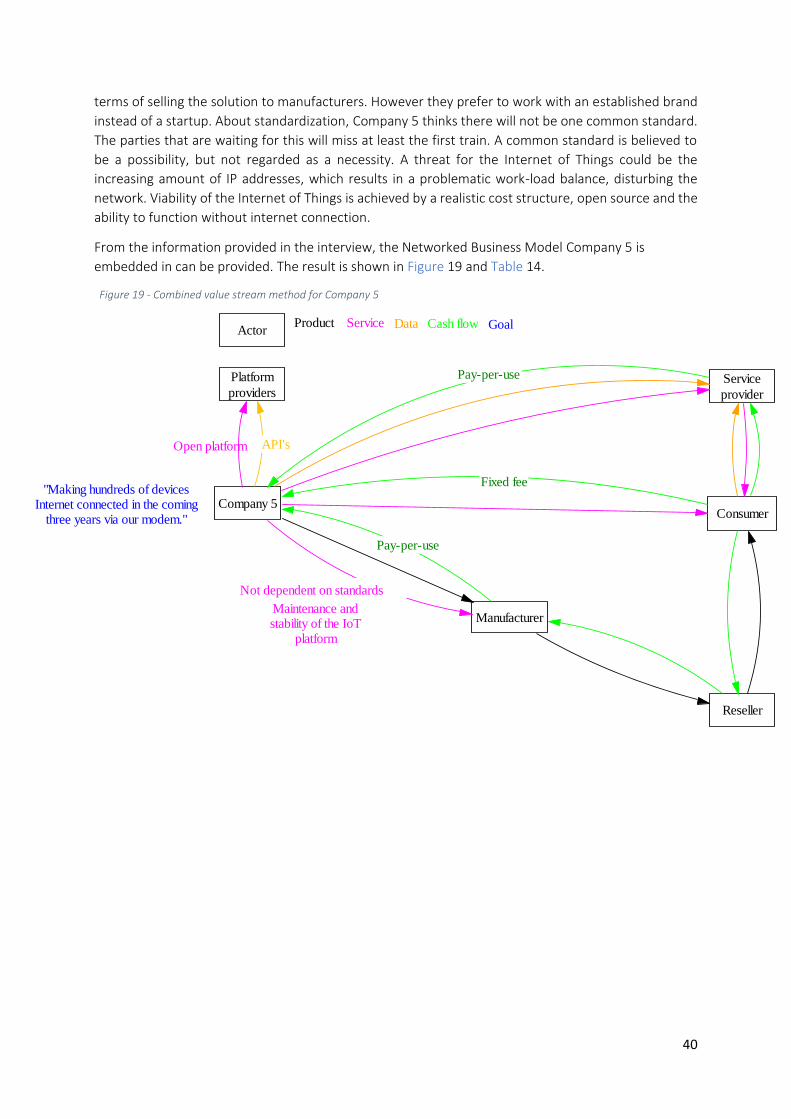
40
terms of selling the solution to manufacturers. However they prefer to work with an established brand
instead of a startup. About standardization, Company 5 thinks there will not be one common standard.
The parties that are waiting for this will miss at least the first train. A common standard is believed to
be a possibility, but not regarded as a necessity. A threat for the Internet of Things could be the
increasing amount of IP addresses, which results in a problematic work-load balance, disturbing the
network. Viability of the Internet of Things is achieved by a realistic cost structure, open source and the
ability to function without internet connection.
From the information provided in the interview, the Networked Business Model Company 5 is
embedded in can be provided. The result is shown in Figure 19 and Table 14.
Figure 19 - Combined value stream method for Company 5
Company 5
Manufacturer
Consumer
Service
provider
Reseller
ActorProduct Service Cash flow GoalData
"Making hundreds of devicesInternet connected in the coming
three years via our modem."
Fixed fee
Pay-per-use
Maintenance andstability of the IoT
platform
Not dependent on standards
Pay-per-use
Platform
providers
Open platform API's
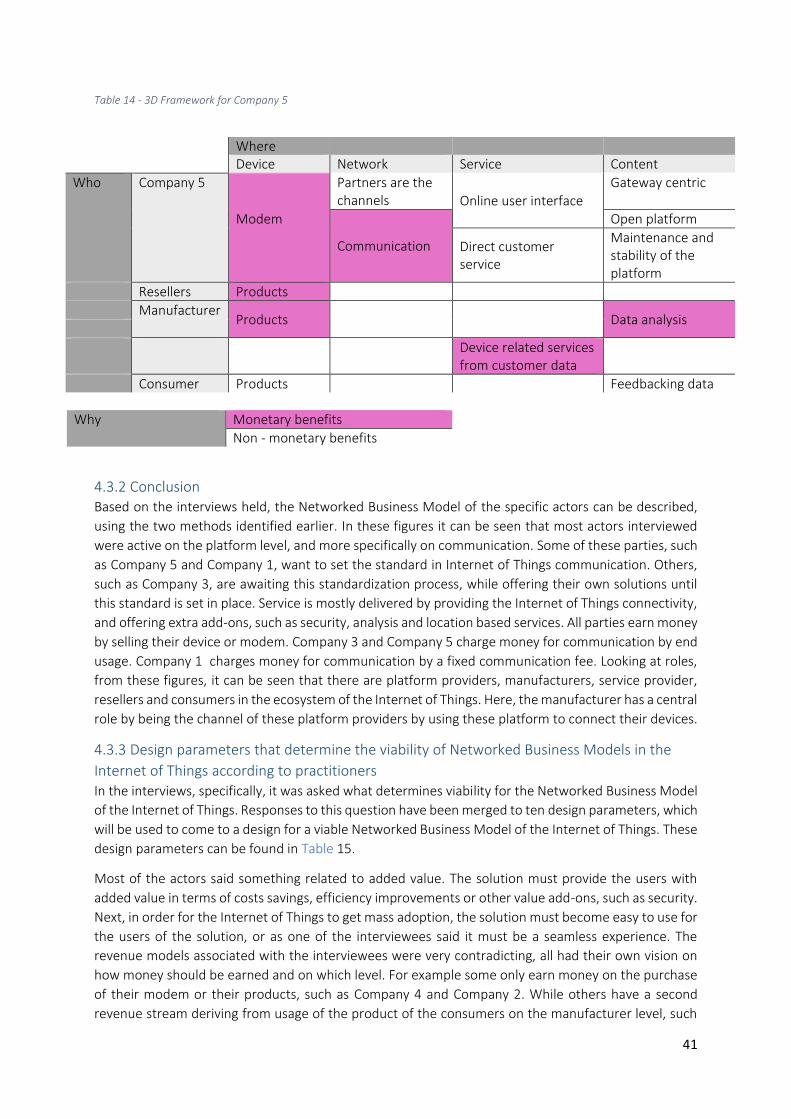
41
Table 14 - 3D Framework for Company 5
Where Device Network Service Content
Who Company 5
Modem
Partners are the channels Online user interface
Gateway centric
Communication
Open platform
Direct customer service
Maintenance and stability of the platform
Resellers Products
Manufacturer Products Data analysis
Device related services from customer data
Consumer Products Feedbacking data
Why Monetary benefits
Non - monetary benefits
4.3.2 Conclusion Based on the interviews held, the Networked Business Model of the specific actors can be described,
using the two methods identified earlier. In these figures it can be seen that most actors interviewed
were active on the platform level, and more specifically on communication. Some of these parties, such
as Company 5 and Company 1, want to set the standard in Internet of Things communication. Others,
such as Company 3, are awaiting this standardization process, while offering their own solutions until
this standard is set in place. Service is mostly delivered by providing the Internet of Things connectivity,
and offering extra add-ons, such as security, analysis and location based services. All parties earn money
by selling their device or modem. Company 3 and Company 5 charge money for communication by end
usage. Company 1 charges money for communication by a fixed communication fee. Looking at roles,
from these figures, it can be seen that there are platform providers, manufacturers, service provider,
resellers and consumers in the ecosystem of the Internet of Things. Here, the manufacturer has a central
role by being the channel of these platform providers by using these platform to connect their devices.
4.3.3 Design parameters that determine the viability of Networked Business Models in the
Internet of Things according to practitioners In the interviews, specifically, it was asked what determines viability for the Networked Business Model
of the Internet of Things. Responses to this question have been merged to ten design parameters, which
will be used to come to a design for a viable Networked Business Model of the Internet of Things. These
design parameters can be found in Table 15.
Most of the actors said something related to added value. The solution must provide the users with
added value in terms of costs savings, efficiency improvements or other value add-ons, such as security.
Next, in order for the Internet of Things to get mass adoption, the solution must become easy to use for
the users of the solution, or as one of the interviewees said it must be a seamless experience. The
revenue models associated with the interviewees were very contradicting, all had their own vision on
how money should be earned and on which level. For example some only earn money on the purchase
of their modem or their products, such as Company 4 and Company 2. While others have a second
revenue stream deriving from usage of the product of the consumers on the manufacturer level, such
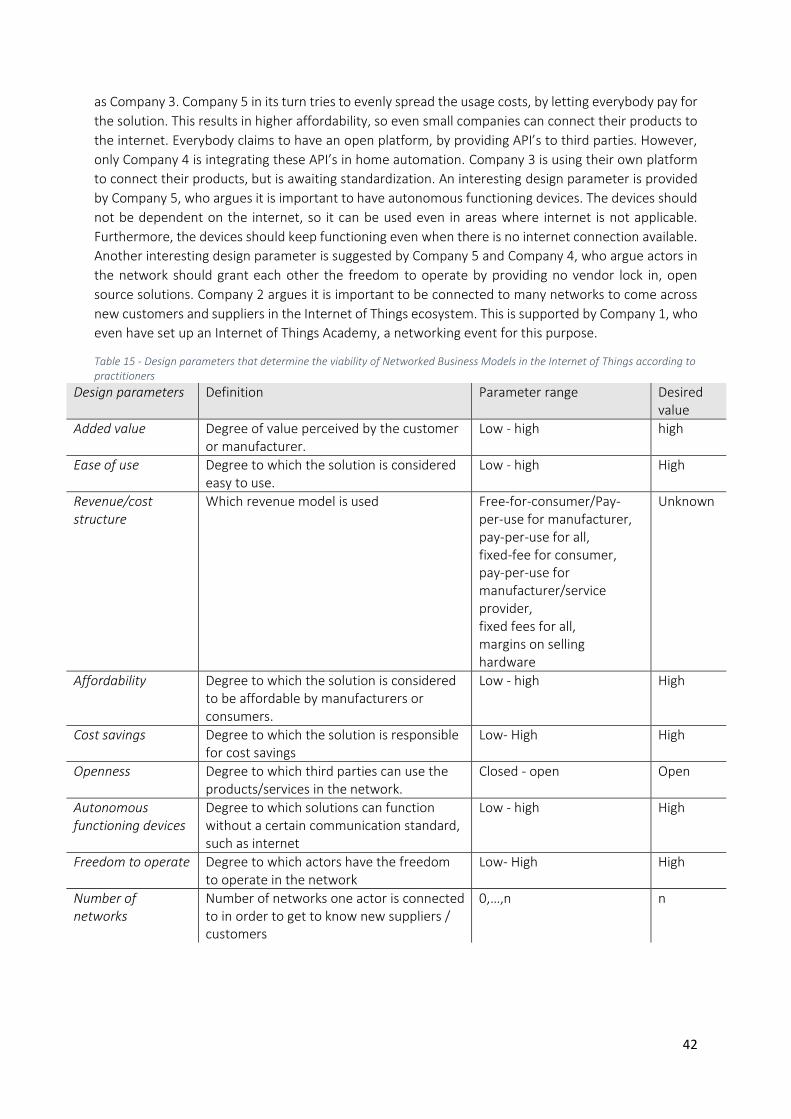
42
as Company 3. Company 5 in its turn tries to evenly spread the usage costs, by letting everybody pay for
the solution. This results in higher affordability, so even small companies can connect their products to
the internet. Everybody claims to have an open platform, by providing API’s to third parties. However,
only Company 4 is integrating these API’s in home automation. Company 3 is using their own platform
to connect their products, but is awaiting standardization. An interesting design parameter is provided
by Company 5, who argues it is important to have autonomous functioning devices. The devices should
not be dependent on the internet, so it can be used even in areas where internet is not applicable.
Furthermore, the devices should keep functioning even when there is no internet connection available.
Another interesting design parameter is suggested by Company 5 and Company 4, who argue actors in
the network should grant each other the freedom to operate by providing no vendor lock in, open
source solutions. Company 2 argues it is important to be connected to many networks to come across
new customers and suppliers in the Internet of Things ecosystem. This is supported by Company 1, who
even have set up an Internet of Things Academy, a networking event for this purpose.
Table 15 - Design parameters that determine the viability of Networked Business Models in the Internet of Things according to practitioners
Design parameters Definition Parameter range Desired value
Added value Degree of value perceived by the customer or manufacturer.
Low - high high
Ease of use Degree to which the solution is considered easy to use.
Low - high High
Revenue/cost structure
Which revenue model is used Free-for-consumer/Pay-per-use for manufacturer, pay-per-use for all, fixed-fee for consumer, pay-per-use for manufacturer/service provider, fixed fees for all, margins on selling hardware
Unknown
Affordability Degree to which the solution is considered to be affordable by manufacturers or consumers.
Low - high High
Cost savings Degree to which the solution is responsible for cost savings
Low- High High
Openness Degree to which third parties can use the products/services in the network.
Closed - open Open
Autonomous functioning devices
Degree to which solutions can function without a certain communication standard, such as internet
Low - high High
Freedom to operate Degree to which actors have the freedom to operate in the network
Low- High High
Number of networks
Number of networks one actor is connected to in order to get to know new suppliers / customers
0,…,n n
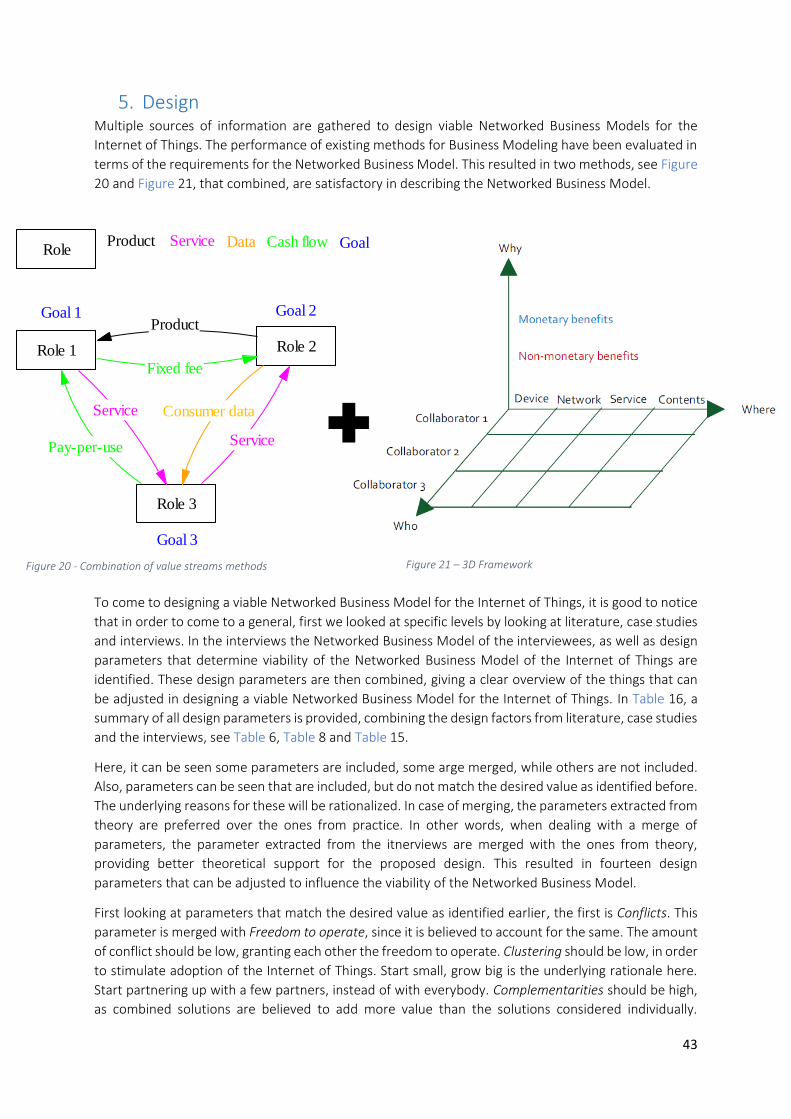
43
Figure 21 – 3D Framework Figure 20 - Combination of value streams methods
RoleProduct Service Cash flow GoalData
Role 1 Role 2
Role 3
Goal 1 Goal 2
Goal 3
Fixed fee
Product
Consumer data
Service
Service
Pay-per-use
5. Design Multiple sources of information are gathered to design viable Networked Business Models for the
Internet of Things. The performance of existing methods for Business Modeling have been evaluated in
terms of the requirements for the Networked Business Model. This resulted in two methods, see Figure
20 and Figure 21, that combined, are satisfactory in describing the Networked Business Model.
To come to designing a viable Networked Business Model for the Internet of Things, it is good to notice
that in order to come to a general, first we looked at specific levels by looking at literature, case studies
and interviews. In the interviews the Networked Business Model of the interviewees, as well as design
parameters that determine viability of the Networked Business Model of the Internet of Things are
identified. These design parameters are then combined, giving a clear overview of the things that can
be adjusted in designing a viable Networked Business Model for the Internet of Things. In Table 16, a
summary of all design parameters is provided, combining the design factors from literature, case studies
and the interviews, see Table 6, Table 8 and Table 15.
Here, it can be seen some parameters are included, some arge merged, while others are not included.
Also, parameters can be seen that are included, but do not match the desired value as identified before.
The underlying reasons for these will be rationalized. In case of merging, the parameters extracted from
theory are preferred over the ones from practice. In other words, when dealing with a merge of
parameters, the parameter extracted from the itnerviews are merged with the ones from theory,
providing better theoretical support for the proposed design. This resulted in fourteen design
parameters that can be adjusted to influence the viability of the Networked Business Model.
First looking at parameters that match the desired value as identified earlier, the first is Conflicts. This
parameter is merged with Freedom to operate, since it is believed to account for the same. The amount
of conflict should be low, granting each other the freedom to operate. Clustering should be low, in order
to stimulate adoption of the Internet of Things. Start small, grow big is the underlying rationale here.
Start partnering up with a few partners, instead of with everybody. Complementarities should be high,
as combined solutions are believed to add more value than the solutions considered individually.
44
Revenue / cost structure should be defined for all actors. It is important to take a certain role with
corresponding revenue model. Also, the cost structure should be clear for all stakeholders. Here, the
choice is made to merge the theoratical parameter, Platform pricing, with Revenue / cost structure.
Revenue / cost structure in general is believed to be more applicable to the Internet of Things than solely
pricing of the platform. Another parameter that is mentioned in literature and case studies as well as in
the interviews is Platform openness, which should be open. This is considered a crucial dependency for
adoption of the Internet of Things. Ease of use, mentioned in the case studies as well as the interviews,
is included. Solutions should be easy to use for the users, as nowadays Internet of Things use cases are
hard to understand even for technical people, according to one of the interviewees. Additonally,
solutions should have Added value, in terms of efficiency increase, cost decrease, security or comfort.
Here Customer Value, and Costs Savings are merged with this parameter. Added value in general is
believed to be more applicable to the ecosystem than solely Customer value. Furthermore, solutions
must be affordable for the consumer and manufacturers, so Costs should be low. Here, Affordability is
merged with Costs.
Looking at paramters that do not match their desired value as identified, the first is Lock-in, which is
specified to be high. However, in the case of the Internet of Things, this is not the case. No actor is able
to do things on their own. Also consumers are making the shift to not accepting lock in solutions any
more. Interdependencies between actors should be low instead of high, because of the high number of
actors in the ecosystem. In other words, the more flexible these partnerships are, the better. This is
supported by the interviewees, indicating that partnerships is more about sharing API’s than it is forming
real dependencies, which is believed to be a positive attribute of the ecosystem. Data standardization,
as this parameter can be either low or high. However, it would make it easier to integrate different
platforms and devices and therefore its desired value is high. Also, no Leadership division is attributed
to the ecosystem, as this is not believed to positively contribute to the adoption of the Internet of Things.
A fair amount of Rivalry on the service level, between service providers and integrators, is even believed
to stimulate this adoption. Next to this, Commitment is not needed to be high, as there is a high shifting
in partners. New companies can enter the market very quick, pushing away existing ones.
Looking at paramters that are not believed to have significant effect on viability of the Networked
Business Model of the Internet of Things, the following can be said: As Membership mix, Novelty,
Training and Efficiency as specified in the design parameters tables are regarded not applicable to the
Internet of Things ecosystem. Governance, can be described by Leadership, Openness and Revenue /
costs structure and therefore is not included in the integrated table. Network size, should be big enough
in order to fulfill all roles. Nothing can be said in this stage about how many partners should be in the
network. The Strategic objectives are believed to be aligned on the highest level, being to connect as
many devices as possible to the internet. Here, no significant differences in time span or revenue model
are believed to influence the viability of the Networked Business Model. Regulatory change can be
positive as negative, as for example regulators would force actors to apply a certain communication
standard this would be considered positive. Autonomous functioning devices, is believed to positively
contribute the sustainability of the Internet of Things in case of a shift in communication standards,
however to specific to include for the whole ecosystem. Last, Number of networks could be high for
platform providers to increase their chances of selling their product as partners are their channels.
However, this design parameter is not believed to be applicable for each role in the ecosystem.
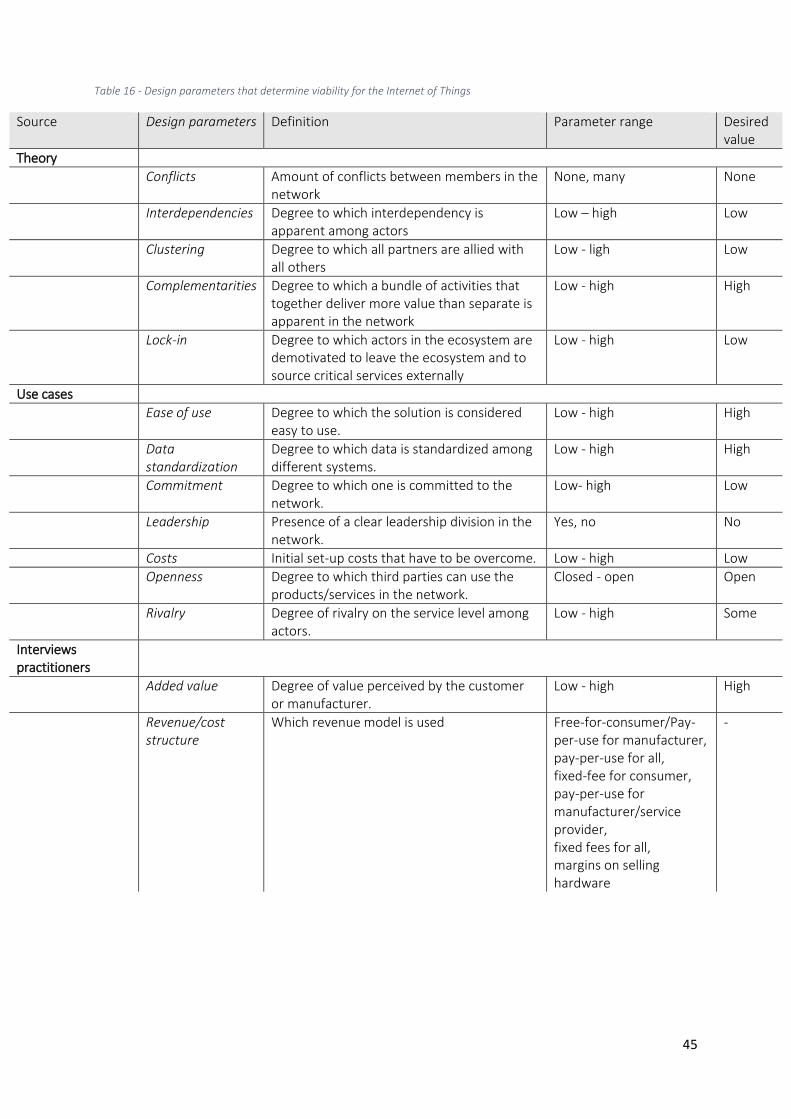
45
Table 16 - Design parameters that determine viability for the Internet of Things
Source Design parameters Definition Parameter range Desired value
Theory
Conflicts Amount of conflicts between members in the network
None, many None
Interdependencies Degree to which interdependency is apparent among actors
Low – high Low
Clustering Degree to which all partners are allied with all others
Low - ligh Low
Complementarities Degree to which a bundle of activities that together deliver more value than separate is apparent in the network
Low - high High
Lock-in Degree to which actors in the ecosystem are demotivated to leave the ecosystem and to source critical services externally
Low - high Low
Use cases
Ease of use Degree to which the solution is considered easy to use.
Low - high High
Data standardization
Degree to which data is standardized among different systems.
Low - high High
Commitment Degree to which one is committed to the network.
Low- high Low
Leadership Presence of a clear leadership division in the network.
Yes, no No
Costs Initial set-up costs that have to be overcome. Low - high Low
Openness Degree to which third parties can use the products/services in the network.
Closed - open Open
Rivalry Degree of rivalry on the service level among actors.
Low - high Some
Interviews practitioners
Added value Degree of value perceived by the customer or manufacturer.
Low - high High
Revenue/cost structure
Which revenue model is used Free-for-consumer/Pay-per-use for manufacturer, pay-per-use for all, fixed-fee for consumer, pay-per-use for manufacturer/service provider, fixed fees for all, margins on selling hardware
-
46
5.1 Design In this section a design is proposed which answers the main research question: ‘What are viable
Networked Business Models for the Internet of Things?’. The purpose of the design solution is to provide
practitioners a clear view on the Networked Business Model, and thus on the ecosystem, of the Internet
of Things on the network level as well as on the firm level.
In this chapter, first, a description of the Networked Business Model is provided using the two identified
methods earlier, see Figure 22 and Table 17. Second, the solution and what it comprises will be
discussed. Third, the solution is critically discussed, using a SWOT analysis.
Before explaining the proposed Networked Business Model, a few choices have to be made explicit.
First and most important, is the introduction of a new role, namely the integrator. Although in the
interviews there was no acknowledgement of a problem relating to roles in the network, a role of
integrator is lacking. This role can increase ease of use of solutions for the customer by integrating
services in one user friendly interface. Furthermore, a possible need for standardization is even more
decreased when integrators are apparent in the network. Second, the choice is made to have an open
network, where actors are willing to share API’s in order to integrate different solutions. Third, the
choice is made to have a gateway centric Internet of Things, so that customers are in charge of their
data, believing to increase the adoption of the Internet of Things.
Two methods have been identified to describe the Networked Business Model. First, the Combined
value stream method. The result of this method is displayed in Figure 22 for the Internet of Things in
general. Here, several roles are apparent. It is important to notice actors can take multiple roles. First,
manufacturers, providing connected products and selling them to the consumers through resellers, or
directly if they also take the role as reseller. Second, service provider, who should be aimed at earning
money by providing services. These services could be further optimized through use of customer data.
Third, platform providers. This role should be focused on selling the modem needed for communication
and the communication itself as well as stability and maintenance of the platform. Here, partners are
the channel. The platform and technology used should be open by sharing API’s, allowing service
providers to control the products connected to the platform. Fourth, the integrator. This role should
focus on integrating the different platforms and associated products and provide services upon them.
Last, consumers, who should use the connected products and feedbacking customer data to the service
providers. The solutions should be gateway centric, collecting customer data. This data can be used for
data analysis to increase service offerings.
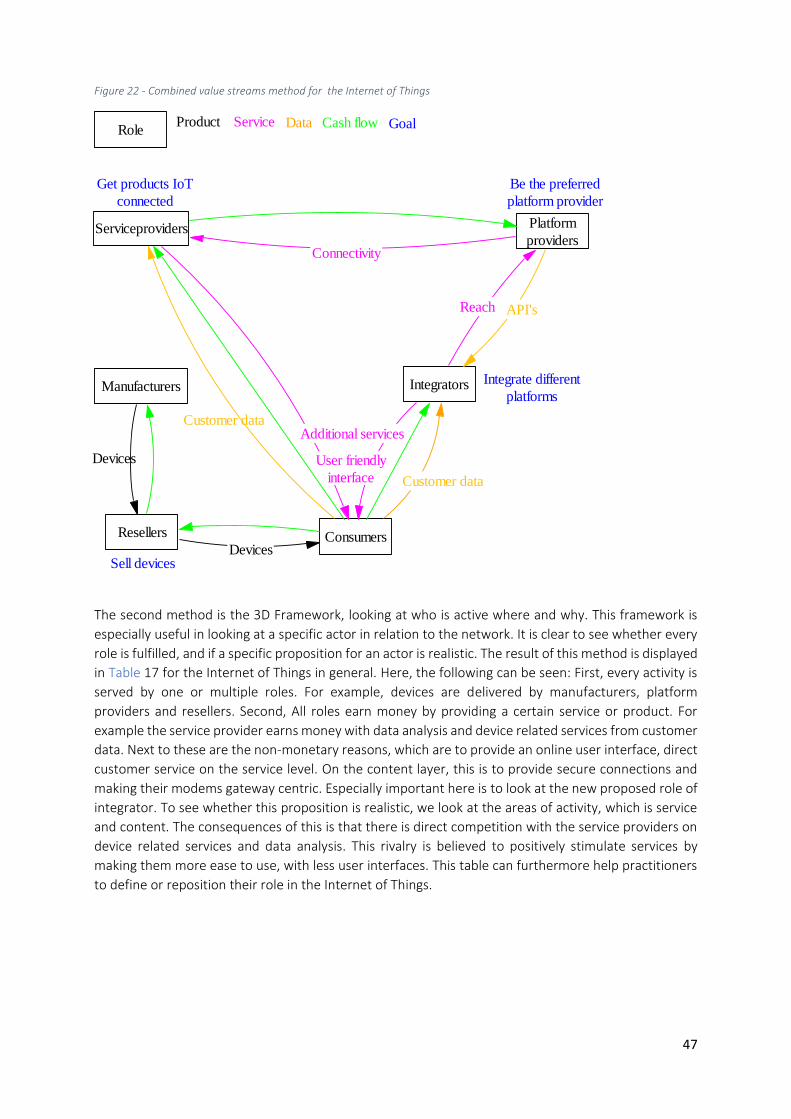
47
Serviceproviders Platform
providers
Integrators
ConsumersResellers
RoleProduct Service Cash flow GoalData
Customer data
Reach
Devices
Devices
Be the preferred
platform provider
Get products IoT
connected
Sell devices
API's
Integrate different
platforms
Connectivity
Additional services
User friendly
interface Customer data
Manufacturers
Figure 22 - Combined value streams method for the Internet of Things
The second method is the 3D Framework, looking at who is active where and why. This framework is
especially useful in looking at a specific actor in relation to the network. It is clear to see whether every
role is fulfilled, and if a specific proposition for an actor is realistic. The result of this method is displayed
in Table 17 for the Internet of Things in general. Here, the following can be seen: First, every activity is
served by one or multiple roles. For example, devices are delivered by manufacturers, platform
providers and resellers. Second, All roles earn money by providing a certain service or product. For
example the service provider earns money with data analysis and device related services from customer
data. Next to these are the non-monetary reasons, which are to provide an online user interface, direct
customer service on the service level. On the content layer, this is to provide secure connections and
making their modems gateway centric. Especially important here is to look at the new proposed role of
integrator. To see whether this proposition is realistic, we look at the areas of activity, which is service
and content. The consequences of this is that there is direct competition with the service providers on
device related services and data analysis. This rivalry is believed to positively stimulate services by
making them more ease to use, with less user interfaces. This table can furthermore help practitioners
to define or reposition their role in the Internet of Things.
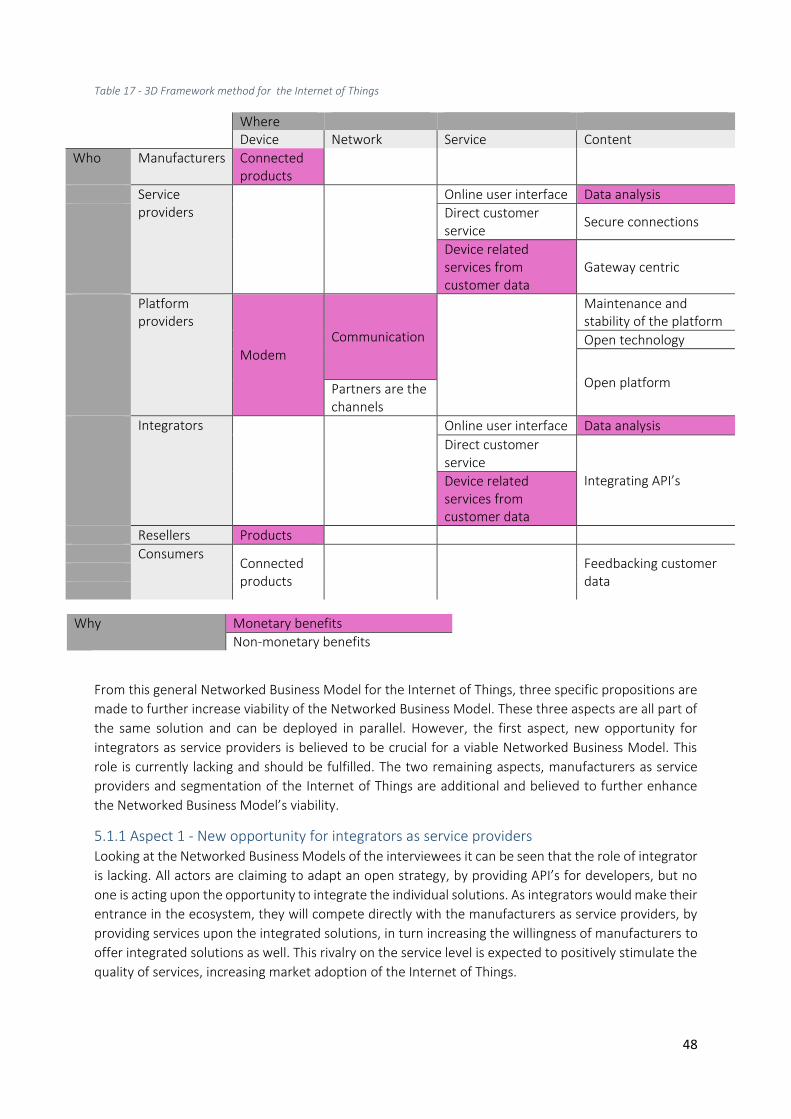
48
Table 17 - 3D Framework method for the Internet of Things
Where Device Network Service Content
Who Manufacturers Connected products
Service providers
Online user interface Data analysis
Direct customer service
Secure connections
Device related services from customer data
Gateway centric
Platform providers
Modem Communication
Maintenance and stability of the platform
Open technology
Open platform Partners are the channels
Integrators
Online user interface Data analysis
Direct customer service
Integrating API’s Device related services from customer data
Resellers Products
Consumers Connected products
Feedbacking customer data
Why Monetary benefits
Non-monetary benefits
From this general Networked Business Model for the Internet of Things, three specific propositions are
made to further increase viability of the Networked Business Model. These three aspects are all part of
the same solution and can be deployed in parallel. However, the first aspect, new opportunity for
integrators as service providers is believed to be crucial for a viable Networked Business Model. This
role is currently lacking and should be fulfilled. The two remaining aspects, manufacturers as service
providers and segmentation of the Internet of Things are additional and believed to further enhance
the Networked Business Model’s viability.
5.1.1 Aspect 1 - New opportunity for integrators as service providers Looking at the Networked Business Models of the interviewees it can be seen that the role of integrator
is lacking. All actors are claiming to adapt an open strategy, by providing API’s for developers, but no
one is acting upon the opportunity to integrate the individual solutions. As integrators would make their
entrance in the ecosystem, they will compete directly with the manufacturers as service providers, by
providing services upon the integrated solutions, in turn increasing the willingness of manufacturers to
offer integrated solutions as well. This rivalry on the service level is expected to positively stimulate the
quality of services, increasing market adoption of the Internet of Things.
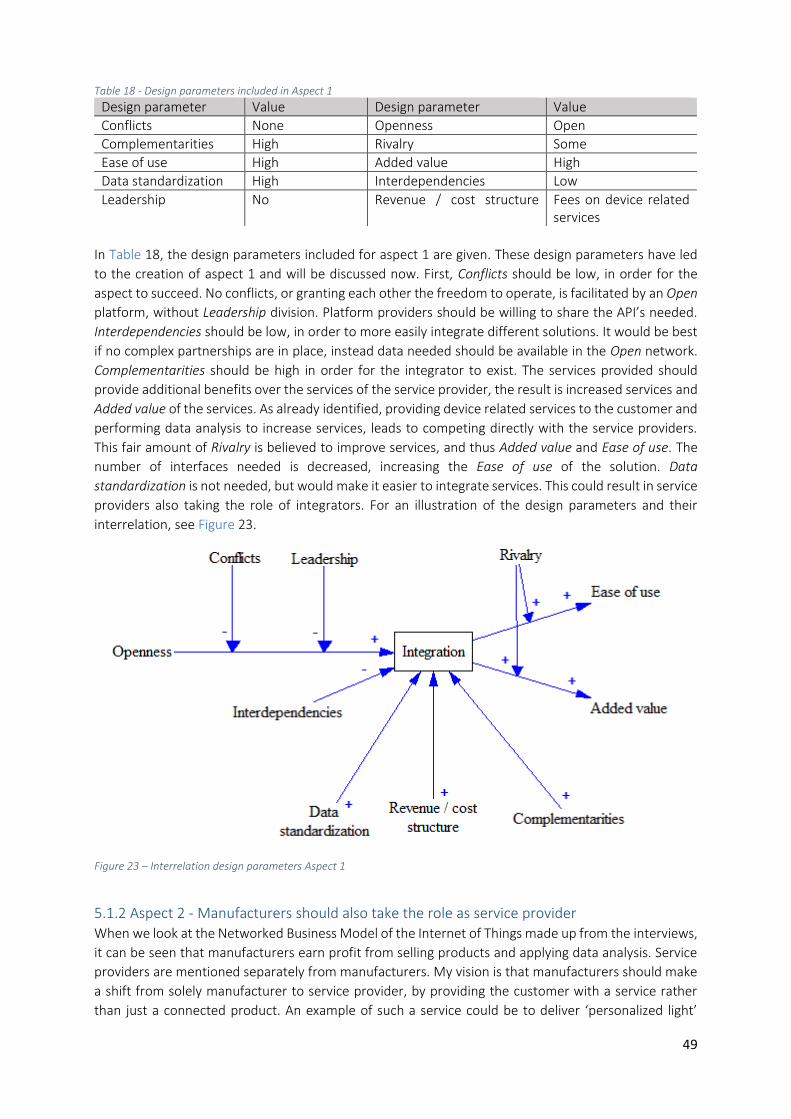
49
Table 18 - Design parameters included in Aspect 1
Design parameter Value Design parameter Value
Conflicts None Openness Open
Complementarities High Rivalry Some
Ease of use High Added value High
Data standardization High Interdependencies Low
Leadership No Revenue / cost structure
Fees on device related services
In Table 18, the design parameters included for aspect 1 are given. These design parameters have led
to the creation of aspect 1 and will be discussed now. First, Conflicts should be low, in order for the
aspect to succeed. No conflicts, or granting each other the freedom to operate, is facilitated by an Open
platform, without Leadership division. Platform providers should be willing to share the API’s needed.
Interdependencies should be low, in order to more easily integrate different solutions. It would be best
if no complex partnerships are in place, instead data needed should be available in the Open network.
Complementarities should be high in order for the integrator to exist. The services provided should
provide additional benefits over the services of the service provider, the result is increased services and
Added value of the services. As already identified, providing device related services to the customer and
performing data analysis to increase services, leads to competing directly with the service providers.
This fair amount of Rivalry is believed to improve services, and thus Added value and Ease of use. The
number of interfaces needed is decreased, increasing the Ease of use of the solution. Data
standardization is not needed, but would make it easier to integrate services. This could result in service
providers also taking the role of integrators. For an illustration of the design parameters and their
interrelation, see Figure 23.
Figure 23 – Interrelation design parameters Aspect 1
5.1.2 Aspect 2 - Manufacturers should also take the role as service provider When we look at the Networked Business Model of the Internet of Things made up from the interviews,
it can be seen that manufacturers earn profit from selling products and applying data analysis. Service
providers are mentioned separately from manufacturers. My vision is that manufacturers should make
a shift from solely manufacturer to service provider, by providing the customer with a service rather
than just a connected product. An example of such a service could be to deliver ‘personalized light’
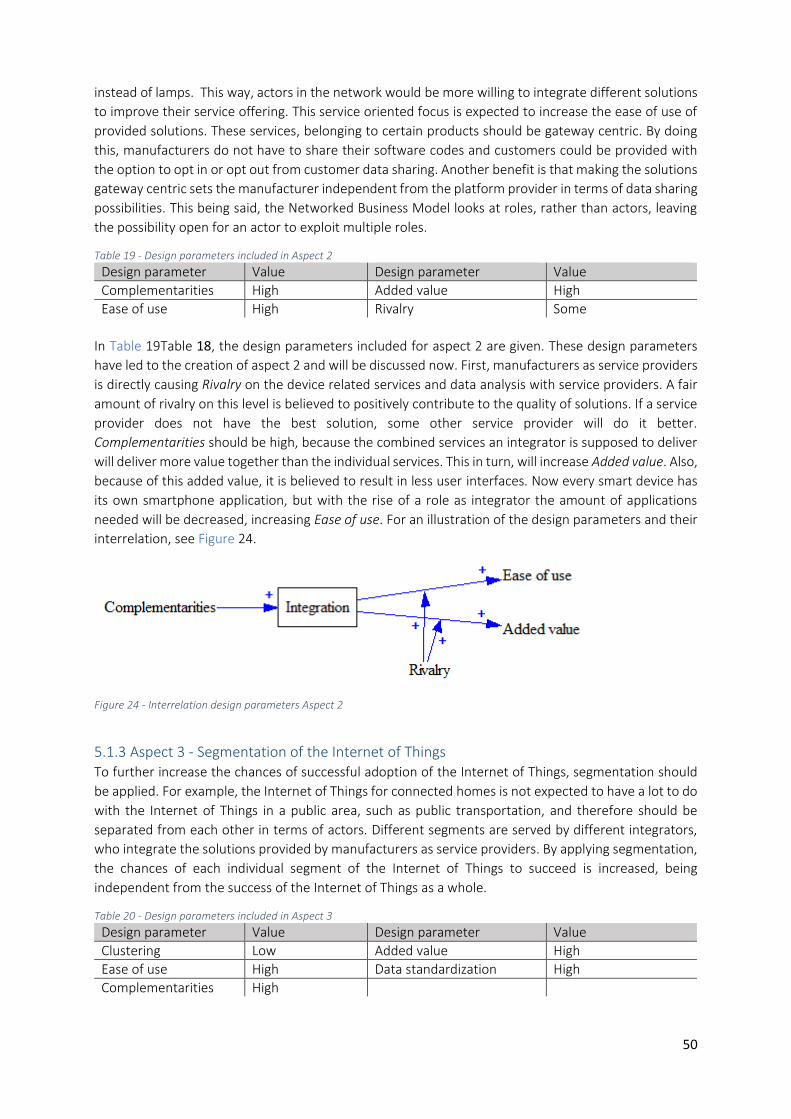
50
instead of lamps. This way, actors in the network would be more willing to integrate different solutions
to improve their service offering. This service oriented focus is expected to increase the ease of use of
provided solutions. These services, belonging to certain products should be gateway centric. By doing
this, manufacturers do not have to share their software codes and customers could be provided with
the option to opt in or opt out from customer data sharing. Another benefit is that making the solutions
gateway centric sets the manufacturer independent from the platform provider in terms of data sharing
possibilities. This being said, the Networked Business Model looks at roles, rather than actors, leaving
the possibility open for an actor to exploit multiple roles.
Table 19 - Design parameters included in Aspect 2
Design parameter Value Design parameter Value
Complementarities High Added value High
Ease of use High Rivalry Some
In Table 19Table 18, the design parameters included for aspect 2 are given. These design parameters
have led to the creation of aspect 2 and will be discussed now. First, manufacturers as service providers
is directly causing Rivalry on the device related services and data analysis with service providers. A fair
amount of rivalry on this level is believed to positively contribute to the quality of solutions. If a service
provider does not have the best solution, some other service provider will do it better.
Complementarities should be high, because the combined services an integrator is supposed to deliver
will deliver more value together than the individual services. This in turn, will increase Added value. Also,
because of this added value, it is believed to result in less user interfaces. Now every smart device has
its own smartphone application, but with the rise of a role as integrator the amount of applications
needed will be decreased, increasing Ease of use. For an illustration of the design parameters and their
interrelation, see Figure 24.
Figure 24 - Interrelation design parameters Aspect 2
5.1.3 Aspect 3 - Segmentation of the Internet of Things To further increase the chances of successful adoption of the Internet of Things, segmentation should
be applied. For example, the Internet of Things for connected homes is not expected to have a lot to do
with the Internet of Things in a public area, such as public transportation, and therefore should be
separated from each other in terms of actors. Different segments are served by different integrators,
who integrate the solutions provided by manufacturers as service providers. By applying segmentation,
the chances of each individual segment of the Internet of Things to succeed is increased, being
independent from the success of the Internet of Things as a whole.
Table 20 - Design parameters included in Aspect 3
Design parameter Value Design parameter Value
Clustering Low Added value High
Ease of use High Data standardization High
Complementarities High
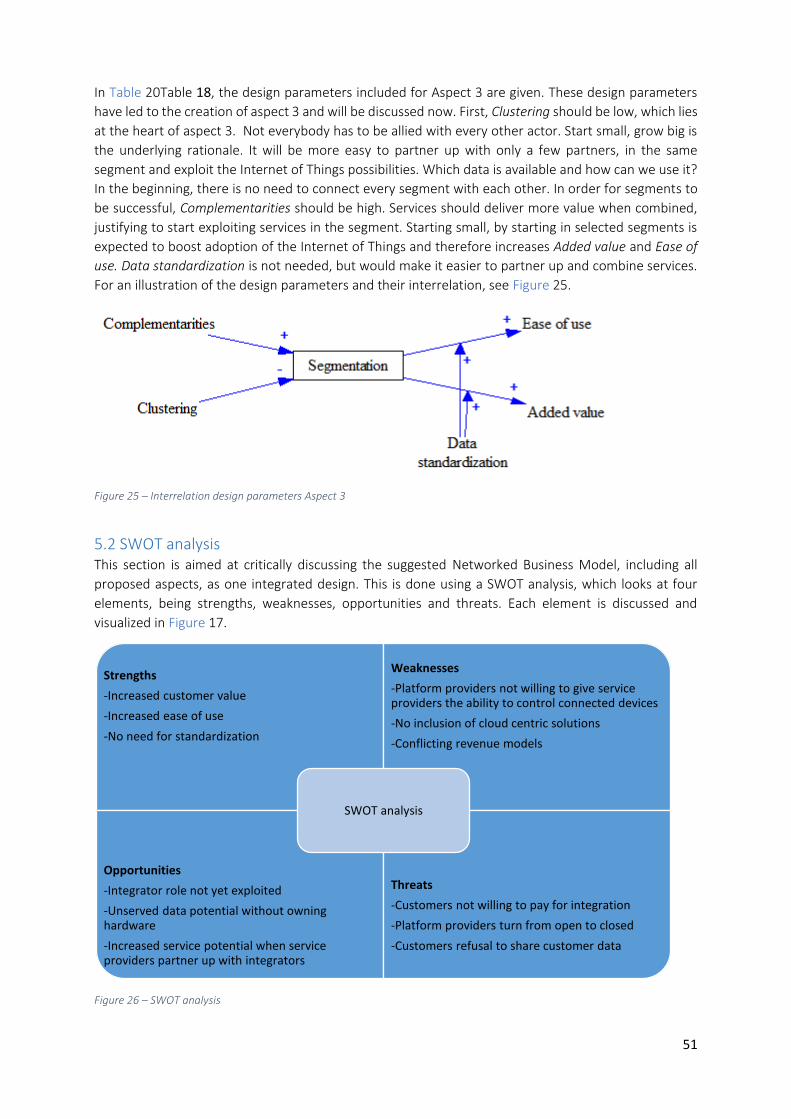
51
In Table 20Table 18, the design parameters included for Aspect 3 are given. These design parameters
have led to the creation of aspect 3 and will be discussed now. First, Clustering should be low, which lies
at the heart of aspect 3. Not everybody has to be allied with every other actor. Start small, grow big is
the underlying rationale. It will be more easy to partner up with only a few partners, in the same
segment and exploit the Internet of Things possibilities. Which data is available and how can we use it?
In the beginning, there is no need to connect every segment with each other. In order for segments to
be successful, Complementarities should be high. Services should deliver more value when combined,
justifying to start exploiting services in the segment. Starting small, by starting in selected segments is
expected to boost adoption of the Internet of Things and therefore increases Added value and Ease of
use. Data standardization is not needed, but would make it easier to partner up and combine services.
For an illustration of the design parameters and their interrelation, see Figure 25.
Figure 25 – Interrelation design parameters Aspect 3
5.2 SWOT analysis This section is aimed at critically discussing the suggested Networked Business Model, including all
proposed aspects, as one integrated design. This is done using a SWOT analysis, which looks at four
elements, being strengths, weaknesses, opportunities and threats. Each element is discussed and
visualized in Figure 17.
Figure 26 – SWOT analysis
Strengths
-Increased customer value
-Increased ease of use
-No need for standardization
Weaknesses
-Platform providers not willing to give service providers the ability to control connected devices
-No inclusion of cloud centric solutions
-Conflicting revenue models
Opportunities
-Integrator role not yet exploited
-Unserved data potential without owning hardware
-Increased service potential when service providers partner up with integrators
Threats
-Customers not willing to pay for integration
-Platform providers turn from open to closed
-Customers refusal to share customer data
SWOT analysis
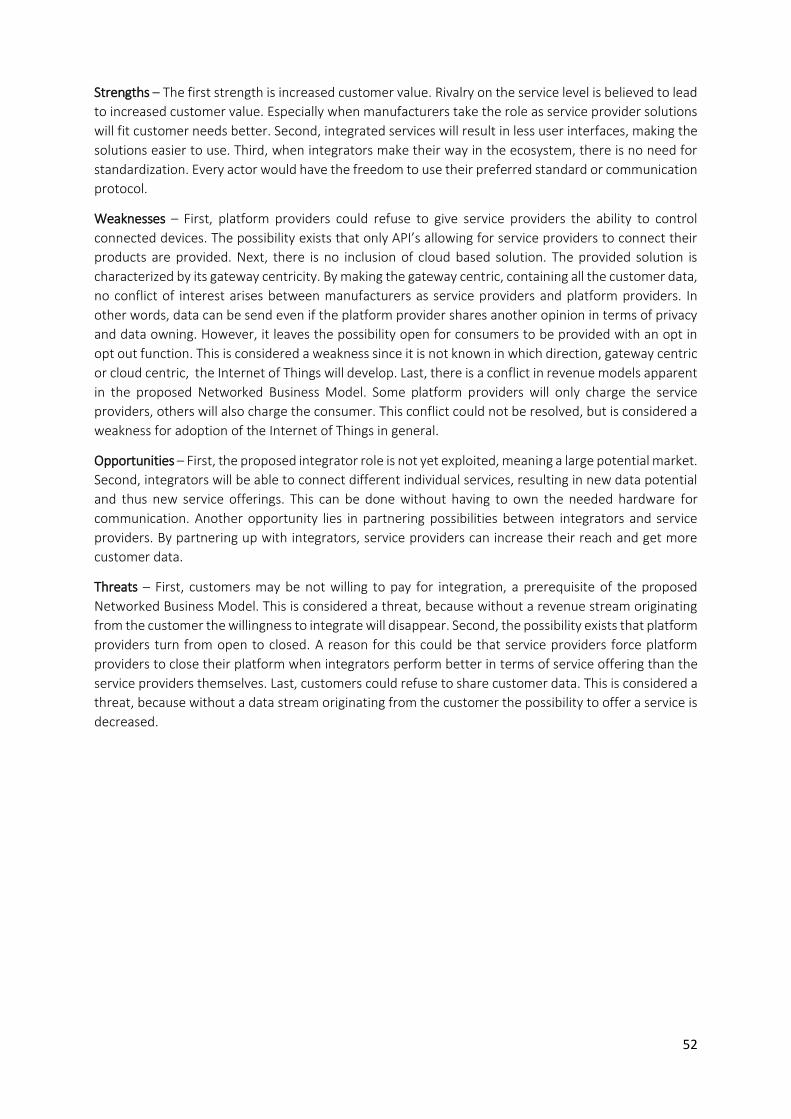
52
Strengths – The first strength is increased customer value. Rivalry on the service level is believed to lead
to increased customer value. Especially when manufacturers take the role as service provider solutions
will fit customer needs better. Second, integrated services will result in less user interfaces, making the
solutions easier to use. Third, when integrators make their way in the ecosystem, there is no need for
standardization. Every actor would have the freedom to use their preferred standard or communication
protocol.
Weaknesses – First, platform providers could refuse to give service providers the ability to control
connected devices. The possibility exists that only API’s allowing for service providers to connect their
products are provided. Next, there is no inclusion of cloud based solution. The provided solution is
characterized by its gateway centricity. By making the gateway centric, containing all the customer data,
no conflict of interest arises between manufacturers as service providers and platform providers. In
other words, data can be send even if the platform provider shares another opinion in terms of privacy
and data owning. However, it leaves the possibility open for consumers to be provided with an opt in
opt out function. This is considered a weakness since it is not known in which direction, gateway centric
or cloud centric, the Internet of Things will develop. Last, there is a conflict in revenue models apparent
in the proposed Networked Business Model. Some platform providers will only charge the service
providers, others will also charge the consumer. This conflict could not be resolved, but is considered a
weakness for adoption of the Internet of Things in general.
Opportunities – First, the proposed integrator role is not yet exploited, meaning a large potential market.
Second, integrators will be able to connect different individual services, resulting in new data potential
and thus new service offerings. This can be done without having to own the needed hardware for
communication. Another opportunity lies in partnering possibilities between integrators and service
providers. By partnering up with integrators, service providers can increase their reach and get more
customer data.
Threats – First, customers may be not willing to pay for integration, a prerequisite of the proposed
Networked Business Model. This is considered a threat, because without a revenue stream originating
from the customer the willingness to integrate will disappear. Second, the possibility exists that platform
providers turn from open to closed. A reason for this could be that service providers force platform
providers to close their platform when integrators perform better in terms of service offering than the
service providers themselves. Last, customers could refuse to share customer data. This is considered a
threat, because without a data stream originating from the customer the possibility to offer a service is
decreased.
53
6. Discussion The aim of this thesis was to design a viable Networked Business Model for the Internet of Things. The
thesis is twofold. The first part is aimed at finding a way to sufficiently describe the Networked Business
Model, while the second is aimed at finding design parameters that determine viability of the
Networked Business Model for the Internet of Things.
Looking at the first part, aimed at how to describe the Networked Business Model, a thorough literature
study is performed in order to identify the requirements for the Networked Business Models. Next,
existing business modeling methods are selected and their performance in terms of these requirements
is given. This resulted in two methods to describe the Networked Business Model. The Combined value
stream method and the 3D Framework, where the combined value stream method is a combination of
the Network Value Analysis, the Value Network Approach and the Framework for mapping value
streams.
Looking at the second part, aimed at finding design parameters that determine viability of the
Networked Business Model, design parameters have been extracted from literature on platform-,
network- and business ecosystem theory. Furthermore, design parameters are extracted on case
studies on Mobile payment, Smart homes and e-Health. These case studies provided information on
why networks with a common goal, service or product have failed in the past. Last interviews have been
held to identify design parameters from practitioners active in the field of the Internet of Things. These
interviews were also aimed at describing the Networked Business Model of the interviewees as well as
the Internet of Things in general, using the two methods identified in the first part.
From these design parameters a design is made for a viable Networked Business Model for the Internet
of Things. In the proposed Networked Business Model, three main principles are provided:
1. Manufacturers should also take the role as service provider: Manufacturers should make a shift from
solely manufacturer to service provider, by providing the customer with a service rather than just a
connected product. By doing this, actors in the network would be more willing to integrate different
solutions to improve their service offering. Also, this service oriented focus is expected to increase the
ease of use of provided solutions. These services, should be gateway centric. By doing this,
manufacturers do not have to share their software codes and customers could be provided with the
option to opt in or opt out from customer data sharing. Another benefit is that making the solutions
gateway centric sets the manufacturer independent from the platform provider in terms of data sharing
possibilities.
2. New opportunity for integrators as service providers: However interviewees did not share information
about problems with integration, it is clear the role of integrator is lacking. All actors still have a firm
centric view on the network, resulting in actors claiming to adapt an open strategy, by providing API’s
for developers, but no one acting upon the opportunity to integrate the individual solutions. As
integrators would make their entrance in the ecosystem, they will compete directly with the
manufacturers as service providers, by providing services upon the integrated solutions, in turn
increasing the willingness of manufacturers to offer integrated solutions as well. This rivalry on the
service level is expected to positively stimulate the quality of services, increasing market adoption of
the Internet of Things.
3. Segmentation of the Internet of Things: There should be segmentation of the Internet of Things. For
example, the Internet of Things for connected homes is not expected to have a lot to do with the
Internet of Things in a public area, such as public transportation, and therefore should be separated
from each other in terms of actors. Different segments are served by different integrators, who
integrate the solutions provided by manufacturers as service providers. By applying segmentation, the
54
chances of each individual segment of the Internet of Things to succeed is increased, being independent
from the success of the Internet of Things as a whole.
If we look at the three different aspects in relation to recent developments in the market, the following
can be said: In the first aspect, it is argued the service rationale should be adapted. A good example of
a company embracing this service attitude as meant in the solution is DOW Chemicals. A company who
shifted from selling to leasing of their chemicals. This is been done by selling clean squared meters
instead of the chemicals needed to clean these areas. When this shift is made, and performance is what
is paid for, we see that maintenance, quick updating and upgrading become design parameters
(Blaauboer R. , 2014).
The need to integrate already is apparent in the business model of Company 4. However recently new
home automation solutions have been introduced, such as the Mediola AIO GATEWAY. A gateway used
in home automation to wireless control home devices. This indicates the acknowledgement of the
possibilities an integrator role comprises. I argue this integration role as seen in home automation
should be apparent in other segments of the Internet of Things as well. The idea of segmenting the
Internet of Things is supported by (Briggs, 2015), who argue the goal should not be to create the Internet
of Everything; it should be to construct a “Network of Some Things” deliberately chosen and
purposefully deployed.
With the introduction of LTE for M2M Communication (Sequans, 2015), standardization is more likely
to happen. LTE stands for Long Term Evolution, which is a wireless broadband technology introduced
by an industry trade group. However, the process of adapting such a new standard is slow and very well
still can take a couple of years. However, when introduced it will be more easy to integrate different
services. The role of integrator could be affected by becoming obsolete due to simplification of
integration.
As mentioned, actors can take multiple roles in the Networked Business Model. Therefore, it could very
well be the case that existing leaders in the digital space will also take a leading role in the Internet of
Things. Parties as Apple and Google have already introduced their own Internet of Things Platform.
Apple has recently introduced their Home app in IOS9, an operating system, which is used in home
automation (Zwaag, 2015). Google, who also is the owner of the smart NEST thermostat, has announced
Google Brillo, an Internet of Things platform which supports Bluetooth low power and Wi-Fi (Miller,
2015). When these platforms will grow rapidly and become the standard as Internet of Things platform,
the Networked Business Model as designed in this thesis will not be affected. Only less players will
occupy the different roles. Also, the role of integrator is expected to disappear when leading parties
such as Google and Apple will dominate the Internet of Things.
6.1 Contributions to literature This research is contributing to literature in a couple of ways. First, it is contributing to recent
propositions that argue for the need of a new business model in this world of complex ecosystems
(Ehrenhard, Kijl, & Nieuwenhuis, 2014). Previous studies have made attempts to propose new methods
to describe the Networked Business Model (Janssen, Lankhorst, Haaker, & de Vos, 2012) (Ballon, 2007)
(Lindgren & Rasmussen, 2013) (Solaimani & Bouwman, 2012) or identified the requirements for such
new methods (Prahalad & Ramaswamy, 2002) (Hearn & Pace, 2006). This study is combining both to
come to a method to describe such a Networked Business Model. It is argued, existing business
modeling methods are either firm-centric or network centric (Turber, vom Brocke, Gassman, & Fleisch,
2014) (Søilen, Kovacevic, & Jallouli, 2012). Although, several scholars have proposed unifying
frameworks that account for both, no well-accepted method exists. Therefore, in this study, a concise
overview of existing business modeling methods is provided. These methods are then rated in terms of
their performance on the requirements of (Hearn & Pace, 2006). This has led to a combination of two
55
methods that together suffice in describing the Networked Business Model. Thus, this thesis is
contributing by performing a meta-analysis of 13 existing business modeling methods to come to the
best way to describe the Networked Business Model.
Second, this research provides design parameters for the Networked Business Model in general, and
specifically for the Networked Business Model of the Internet of Things. Previous research has identified
design parameters for networks (de Man, 2004), platforms (de Reuver, Verschuur, Nikayin, Cerpa, &
Bouwman, 2014) and business ecosystems (Amit & Zott, 2001). Others, have studied reasons for success
and failure of Internet of Things use cases, such as in mobile payment (de Reuver, Verschuur, Nikayin,
Cerpa, & Bouwman, 2014), smart homes (Ehrenhard, Kijl, & Nieuwenhuis, 2014) and e-health (Murray,
et al., 2011). This study contributes by combining the insights of these different disciplines and identify
their impact on the Internet of Things through interviews with practitioners active in this field. In these
same interviews, new parameters are identified. Contribution of this research is by providing an
integrated table that contains design factors for the Internet of Things in general. This is done to come
to a design that is well-grounded in theory, besides being practically relevant.
Last, not much is written about the Internet of Things. Therefore, this thesis is also considered to be
innovative in bundling two relatively unfamiliar concepts, namely the Networked Business Model and
the Internet of Things. The two methods identified for describing the Networked Business Model have
been applied to the Internet of Things in general. This provides researchers with a clear view on the
actors in the network, which role they have, what the interdependencies are, and what determines its
viability. This knowledge is believed contribute to the understanding of researchers on these two
unfamiliar topics.
6.2 Limitations and further research As always, there are certain limitations to this study. First, and most important, no feedback has been
provided on the design by the interviewees because of time constraints. The design would have been
more relevant if at least one round of feedback was collected. However, the general Networked
Business Model for the Internet of Things is still believed to give a good representation of the different
actors, their roles and their interdependencies. Also, the design parameters that are used for the design
phase are valid without feedback. However it is believed the work still contributes to literature and
business practice, future research should include additional feedback rounds to further optimize the
design.
Second, no manufacturer was interviewed. Company 3 was expected to be in the role of manufacturer,
but turned out to be a service provider working together with the manufacturer. Therefore the design
could lack information needed to come to an optimal design, and the proposed design could turn out
to be sub optimal. Further research should include this manufacturing role, so every role is included in
the analysis.
Third, about the interview process itself, the researcher had no experience in interviewing. Although
the information was saturated, in other words no new information showed up during new rounds of
interviews, it cannot be said with full confidence the information is gathered fully and therefore gives a
complete view on the situation. It would have been better if a more experienced interviewer was
present at the interviews with practitioners.
Fourth, there could be a bias in the selection process because of uncertainty of the market of the
Internet of Things. Although the interviewees were selected carefully, not all companies provide
information on their activities in the Internet of Things. This research is limited to the information
publicly available on the internet. Further research should use a snowballing technique by asking the
56
interviewees who are influential actors in the field of the Internet of Things. This should be done until a
saturation in new information occurs.
Fifth, it would have been better for the quality of the design to include insights from leaders in the digital
domain, as it could be possible the Internet of Things will be dominated by these actors in the near
future, such as Apple and Google. This information is not believed to impact the validity of the design,
as the design allows for monopoly as it looks at roles rather than actors. However, it could reveal new
insights that further enhance the applicability of the design. However, no information on vision was
available at the time of writing.
Sixth, uncertainty on the Internet of Things is also comprised by privacy issues. No attention is given on
privacy in the thesis. Nevertheless, this topic is considered to be major in defining the Internet of Things.
Future research could enhance the proposed design by integrating privacy concerns. A
Last, only Google Scholar is used in the literature search performed. Other, well known sources exist,
which are not taken in account. Future research could enhance the integrated table with design
parameters originating from other sources, which in theory could lead to another design.
Further research should provide insights in who will fit the role as integrator best. What type of
organization is best positioned to take the role as integrator in the Internet of Things could be a research
question. Next to this, it would make a good contribution if the customer would be integrated. Typical
questions could be what the customer wants and what the customer is willing to pay for.
6.3 Practical implications The aim of this thesis was to design viable Networked Business Models for the Internet of Things. The
solution itself was intended to add value for practitioners in the field of the Internet of Things by
providing a ratinale on how to act upon this recent IT trend. The design proposed in this thesis is build
upon the assumption the Networked Business Model is characterized by an open network and a
gateway centric Internet of Things.
Four practical implications are apparent. First, the advise is to start small, by segmenting the Internet of
Things. Not everything should be connected. Take a look at the combination of products and data
available and decide which goal you want to achieve. This should be the first step in becoming active in
the Internet of Things. Possibilities are endless when everything becomes connected to the internet and
thus with each other. By segmenting, however, a clear and workable overview of possibilities will be
seen. When the products of a manufacturer mostly comprise consumer products for home use, start by
Internet of Things in a home setting.
Second, entrepreneurs wanting to be active in the field of the Internet of Things should take the role as
integrator. However there is no acknowledgement of a problem on the integration part, this role is
clearly lacking. Almost every actor sees themselves as the center of the Internet of Things. The result is
an offer of numerous connected products that all have their own platform and available API. These
products can be controlled by their own user interfaces, mostly in the form of smartphone applications,
resulting in numerous application to control several products. This role of integrator is not yet occupied
in all segments and provides new business opportunities. As an integrator you must combine services
to come to a unique offering, adding extra value for the customers. This does not come without risk,
however, there is a chance manufacturers will turn from open to closed when rivalry on the service level
is considered to be too big. On the other hand, the integrator role does not come with high investments.
In principal no hardware is needed, depending on which user interface the integrator has. Partnerships
are not considered to be a limiting effect, since these are not long-term. Most new products from
manufacturers are allready open source, where the API is already available.

57
Third, manufacturers should also take the role as service provider. An example of such a service could
be to deliver ‘personalized light’ instead of lamps. This service oriented focus is expected to increase
the ease of use of provided solutions. These services, belonging to certain products should be gateway
centric. By doing this, manufacturers do not have to share their software codes and customers could be
provided with the option to opt in or opt out from customer data sharing. Another benefit is that making
the solutions gateway centric sets the manufacturer independent from the platform provider in terms
of data sharing possibilities.
Fourth, and last, it is expected no standardization will be in place. At least, not in the upcoming years.
The advice therefore is not to wait for it. A start can already be made by becoming active in the field of
the Internet of Things by applying the segmentation rationale as explained above.
58
References
(n.d.). Retrieved from Cambridge Dictionary: http://dictionary.cambridge.org/
Accenture. (2015). Country Spotlights How much can the Industrial Internet of Things Fast-Track Your
Economic Growth? 1-16.
Al-Debei, M., El-Haddadeh, R., & Avison, D. (2008). Defining the business model in the new world of
digital business. Proceedings of the Americas Conference on Information Systems (AMCIS), 1-
11.
Allee, V. (2002). A Value Network Approach for Modeling and Measuring Intangibles. Transparent
Enterprise, Madrid, November, 1-23.
Amit, R., & Zott, C. (2001). Value creation in e-business. Strategic Management Journal, 493–520.
Ballon , P. (2009). Platform types and gatekeeper roles: the case of the mobile communications
industry. Paper presented to Summer Conference in CBS. Copenhagen Business School.
Ballon, P. (2005). Best Practices in Business Modelling for ICT Services. Delft: TNO Report no. 33561.
Ballon, P. (2007). Business modelling revisited: the configuration of control and value. 9(5), 6-19.
Bellman, R., Clark, C., & et al. (1957). On the Construction of a Multi-Stage, Multi-Person Business
Game. Operations Research, 5(4), 469- 503.
Blaauboer, R. (2014, December 27). Het Internet of Things: kopen of leasen? Retrieved from
Frankwatching: http://www.frankwatching.com/archive/2014/12/27/het-internet-of-things-
kopen-of-leasen/
Blaauboer, R. (2015, January 13). Nooit meer je koffer kwijt dankzij eTag en eTrack. Retrieved from
Frankwatching: http://www.frankwatching.com/archive/2015/01/13/nooit-meer-je-koffer-
kwijt-dankzij-etag-en-etrack/
Bouwman, H., de Reuver, M., Solaimani, S., Daas, D., Haaker, T., Janssen, W., . . . Walenkamp, B.
(2012). Business Models Tooling and a Research Agenda. 1-22.
Bouwman, H., Faber, E., Fielt, E., Haaker, T., & de Reuver, M. (2008). STOF model: Critical design issues
and critical success factors. In Mobile service innovation and business models (pp. 71-88).
Springer Berlin Heidelberg.
Bouwman, H., Faber, E., Haaker, T., Kijl, B., & de Reuver, M. (2008). Conceptualizing the STOF Model.
In Mobile service innovation and business models. (pp. 31-70). Springer Berlin Heidelberg.
Bouwman, H., Vos, H. d., & Haaker, T. (2008). 2.1 Business Model Concept, Typologies and
Components. In Mobile Service Innovation and Business Models (pp. 31-36).
Briggs, B. (2015, May 19). The Internet Of (Some) Things. Retrieved from Techcrunch:
http://techcrunch.com/2015/05/19/the-internet-of-some-things/#.lno5jm:CpD3
Brown, T. (2008). Design Thinking. harvard business review, 1-10.
Carbone, P. (2009). The Emerging Promise of Business Ecosystems. Open Source Business Resource,
11-16.
Chandler, A. (2009). Scale and scope: The dynamics of industrial capitalism. Harvard University Press.
59
Chesbrough, H. (2006). The Business Model Framework. In Open Business Models: How To Thrive In
The New Innovation Landscape (pp. 110-130).
Chesbrough, H. (2007). Business model innovation: it's not just about technology anymore. Strategy &
Leadership, 35(6), 12-17.
Chesbrough, H. (2007). Why Companies Should Have Open Business Models. MIT Sloan Management
Review, 48(2), 22-28.
Chesbrough, H. (2010). Business Model Innovation: Opportunities and Barriers. Elsevier, 354-363.
Chesbrough, H. (2013). Open business models: How to thrive in the new innovation landscape. .
Harvard Business Press.
Chesbrough, H., Vanhaverbeke, W., & West, J. (2006). Open innovation: Researching a new paradigm.
Chui, M., Löffler, M., & Roberts, R. (2010, March). The Internet of Things. McKinsey Quarterly.
Cisco. (2015, February). Global Mobile Data Traffic Forecast Update, 2014–2019. Cisco Visual
Networking Index, pp. 1-42.
Cusumano, M. (2010). Staying power: Six enduring principles for managing strategy and innovation in
an uncertain world (lessons from Microsoft, Apple, Intel, Google, Toyota and more). . Oxford
University Press.
de Man, A. P. (2004). The network economy: strategy, structure and management. Edward Elgar.
de Reuver, M., Verschuur, E., Nikayin, F., Cerpa, N., & Bouwman, H. (2014). Collective action for
mobile payment platforms: A case study on collaboration issues between banks and telecom
operators. Electronic Commerce Research and Applications.
Denyer, D., Tranfield, D., & van Aken, J. (2008). Developing Design Propositions through Research
Synthesis. Organization Studies, 29(3), 393-413.
Ehrenhard, M., Kijl, B., & Nieuwenhuis, L. (2014). Market adoption barriers of multi-stakeholder
technology: Smart homes for the aging population. Technological Forecasting & Social
Change, 89, 306–315.
Eisenmann, T. (2008). Managing proprietary and shared platforms.
El Sawy, O., & Pereira, F. (2013). VISOR: A Unified Framework for Business Modeling in the Evolving
Digital Space. In Business Modelling in the Dynamic Digital Space (pp. 21-35). Springer Berlin
Heidelberg.
Ernest, M., & Nisavic, J. (2007). Adding value to the IT organization with the Component Business
Model. IBM SYSTEMS JOURNAL, 46(3).
Evans, D., Hagiu, A., & Schmalensee, R. (2006). Invisible Engines: How Software Platforms Drive
Innovation and Transform Industries. The MIT Press.
Faber, E., Ballon, P., Bouwman , H., Haaker, T., Rietkerk, O., & Steen, M. (2003). Designing Business
Models for Mobile ICT Services. Bled, Slovenia, 9-11 June 2003.
Fielt, E. (2011). Business service management: understanding business models.
Gawer, A. (2009). Platform dynamics and strategies: from products to services. Platforms, markets and
innovation, 45(57).
60
Gawer, A., & Cusumano, M. (2002). Platform leadership: How Intel, Microsoft, and Cisco drive industry
innovation. Boston: Harvard Business School Press.
Gomez, J., Huete, J., Hoyos, O., Perez, L., & Grigori, D. (2013). Interaction System Based on Internet of
Things as Support for Education. Procedia Computer Science, 21, 132–139.
Gordijn, J., & Akkermans, H. (2001). e3-value : Design and Evaluation of e-Business Models. Submission
IEEE Intelligent Systems, special issue on intelligent e-business.
Hearn, G., & Pace, C. (2006). Value-creating ecologies: understanding next generation business
systems. Foresight, 8(1), 55-65.
Hewlett Packard Development Company. (2014). HP Labs' Central Nervous System for the Earth
project aims to build a planetwide sensing network. Retrieved from HP Labs Feature Article:
http://www.hpl.hp.com/news/2009/oct-dec/cense.html
Iansiti, M., & Levien, R. (2004). The keystone advantage: what the new dynamics of business
ecosystems mean for strategy, innovation, and sustainability.
Iansiti, M., & Levien, R. (2004). The Keystone Advantage: What the New Dynamics of Business
Ecosystems Means for Strategy, Innovation and Sustainability. Harvard Business School Press.
IBM Business Consulting Services. (2005). Component Business Model. Strategy and Change.
ITU. (2005). The Internet of Things. ITU Internet Reports 2005.
Janssen, W., Lankhorst, M., Haaker, T., & de Vos, H. (2012). From Service Innovation to Service
Engineering. Cloud Computing and Services Science , 33-51.
Jarzabkowski, P., & Wilson, D. (2006). Actionable strategy knowledge: a practice perspective. European
Management Journal, 24, 348–367.
Jones, N. (2014). The Internet of Things Will Demand New Application Architectures, Skills and Tools.
Gartner, 1-9.
Kellmereit, D., & Obodovski, D. (2013). The Silent Intelligence: The Internet of Things.
Konczal, E. (1975). Models Are for Managers, Not Mathematicians. Journal of Systems Management,
26(165), 12-15.
KPN Corporate. (2014, March 27). Nooit meer bagage kwijt dankzij connected koffers. Retrieved from
KPN Corporate: http://corporate.kpn.com/pers/persberichten/nooit-meer-bagage-kwijt-
dankzij-connected-koffers.htm
Landes, D. (1998). The wealth and poverty of nations. WORLD AND I, 258-263.
LeHong, H. (2014). A Guide to the Internet of Things for Digital Business Technologies. Gartner, 1-4.
LeHong, H. (2014). Build Your Blueprint for the Internet of Things, Based on Five Architecture Styles.
Gartner, 1-19.
Li, Q., Zhou, J., Peng, Q., Li C Q, Wang , C., Wu , J., & Shao , B. (2010). Business processes oriented
heterogeneous systems integration platform for networked enterprises. Computers in
Industry, 2, 127-144.
Lichtenthaler, U. (2008). Open innovation in practice: an analysis of strategic approaches to
technology transactions. Engineering Management, IEEE Transactions on, 55(1), 148-157.
61
Linder, J., & Cantrell, S. (2000). Changing Business Models: Surveying the Landscape. Institute for
Strategic Change.
Lindgren, P., & Rasmussen, O. (2013). The Business Model Cube. 1-48.
McDonald, M. (2013, August 09). Defining digital, technology’s current tower of Babel. Retrieved from
Accenture: https://www.accenture.com/us-en/blogs/blogs-defining-digital-technologys-
tower-babel.aspx
Miller, R. (2015, May 28). Google announces Brillo, an operating system for the Internet of Things.
Retrieved from The Verge: http://www.theverge.com/2015/5/28/8677119/google-project-
brillo-iot-google-io-2015
Muegge, S. (2013). Platforms, Communities, and Business Ecosystems: Lessons Learned About
Technology Entrepreneurship in an Interconnected World. Technology Innovation
Management Review, 3(2), 5-15.
Murray, E., Burns, J., May , C., Finch, T., O’Donnell, C., Wallace, P., & Mair, F. (2011). Why is it difficult
to implement e-health initiatives? A qualitative study. Implement Sci, 6(6), 1-11.
Narayanankannankutt, R. N. (2014). Innovating Independent Living: Business Models for Internet of
Things in Ambient Assisted Living. (Doctoral dissertation, TU Delft, Delft University of
Technology).
Oriwoh, E., Sant, P., & Epiphaniou, G. (2013). Guidelines for Internet of Things Deployment
Approaches – The Thing Commandments. Procedia Computer Science, 21, 122–131.
Osterwalder, A., & Pigneur, Y. (2010). Aligning Profit and Purpose Through Business Model. 1-17.
Osterwalder, A., & Pigneur, Y. (2010). Business Model Generation: A Handbook For Visionaries, Game
Changers, And Challengers. 1-169.
Osterwalder, A., Pigneur, Y., & Tucci, C. L. (2005). Clarifying Business Models: Origins, Present, and
Future of the Concept. Communications of the Association for Information Systems, 16(1), 1-
25.
Palo, T., & Tähtinen, J. (2013). Networked business model development for emerging technology-
based services. Industrial Marketing Management, 42, 773–782.
Peine, A. (2008). Technological paradigms and complex technical systems—the case of smart homes.
Research Policy, 37(3), 508-529.
Peppard, J., & Rylander, A. (2006). From Value Chain to Value Network: Insights for Mobile Operators.
European Management Journal, 24(2-3), 128-141.
Porter, M. (2001). The value chain and competitive advantage. In Understanding business: Processes
(pp. 50-66).
Porter, M. (2008). On competition (Vol. 79).
Porter, M., & Millar, V. (1985). How information gives you competitive advantage.
Prahalad, C., & Ramaswamy, V. (2002). The Co-Creation Connection. Strategy and Business, 27, 50-61.
Pynnönen, M., Hallikas, J., & Savolainen, P. (2008). Mapping business: value stream-based analysis of
business models and resources in Information and Communications Technology service
business. Int. J. Business and Systems Research, 2(3), 305-323.
62
Rajala, R., & Westerlund, M. (2008). Capability Perspective of Business Model Innovation: An Analysis
in the Software Industry. International Journal of Business Innovation and Research, 2(1), 71-
89.
Rochet, J., & Tirole, J. (2003). Platform competition in two-sided markets. J. Eur. Econ. Assoc., 990-
1029.
Romme, A. (2003). Making a Difference: Organization as Design. Organization Science, 558-573.
Roson, R. (2005). Two-sided markets: A tentative survey. Review of Network Economics, 4(2).
Sequans. (2015, April 3). LTE for M2M and IoT – Viable Now with LTE Cat 1. Retrieved from Sequans:
http://www.sequans.com/lte-m2m-iot-viable-now-lte-cat-1/
Søilen, K., Kovacevic, M., & Jallouli, R. (2012). Key success factors for Ericsson mobile platforms using
the value grid model. Journal of Business Research, 65(9), 1335-1345.
Solaimani , K. (2014). The Alignment of Business Model and Business Operations within Networked-
Enterprise Environments. (Doctoral dissertation, TU Delft, Delft University of Technology).
Solaimani, S., & Bouwman, H. (2012). A framework for the alignment of business model and business
processes. Business Process Management Journal, 18(4), 655-679.
Solaimani, S., Cifuentes Hermoso, J., & Bouwman, H. (2014). A qualitative analysis on Business Model
Implementation: A design case on a Dutch bank. Faculty Technology, Policy, and Management.
Delft University of Technology, 1-24.
Solaimani, S., Keijzer-Broers, W., & Bouwman, H. (2013). What we do–and don’t–know about the
Smart Home: an analysis of the Smart Home literature. Indoor and Built Environment.
Stähler, P. (2002). Geschäftsmodelle in der digitalen Ökonomie. Merkmale, Strategien und
Auswirkungen.
Steen, M., Lankhorst, M., & van de Wetering, R. (2002). Modelling networked enterprises. Proceedings
of the 6th International Enterprise Distributed Object Computing Conference, (EDO'02) (pp.
109-119). IEEE.
Tichy, N., & Fombrun, A. (1979). Network Analysis in Organisational Settings. 923-965.
Tilson , D., Lyytinen, K., & Sørensen, C. (2010). Research commentary: digital infrastructures: the
missing is research agenda. Inf. Syst. Res., 21(4), 748-759.
Tiwana, A., Konsynski, B., & Bush, A. (2010). Research commentary-Platform evolution: Coevolution of
platform architecture, governance, and environmental dynamics. Information Systems
Research, 21(4), 675-687.
TomTom. (2015). Webfleet. Retrieved from Business TomTom:
http://business.tomtom.com/nl_nl/products/webfleet/highlights/
Turber, S., vom Brocke, J., Gassman, O., & Fleisch, E. (2014). Designing Business Models in the Era of
Internet of Things. Towards a Reference Framework. 17-31.
University of Cambridge, & IBM. (2008). Succeeding Through Service Innovation: A Service Perspective
for Education, Research, Business and Government. White Paper.
van Aken, J. (2005). Management Research as a Design Science: Articulating the Research Products of
Mode 2 Knowledge Production in Management. British journal of management, 16(1), 19-36.
63
van Buuren, R., Chadha, D., Haaker, T., Sealy, T., Bouwman, H., & de Reuver, H. (2012). Business model
stress testing with scenarios. In Creating Robust Business Models, Practical tools to harness
your business (pp. 32-50).
van der Borgh, M., Cloodt, M., & Romme, A. (2012). Value creation by knowledge-based ecosystems:
evidence from a field study. R&D Management, 42(2), 150-169.
Vannieuwenborg, F., Van Auwermeulen, T., Van Ooteghem, J., Jacobs, A., Verbrugge, S., Colle, D., &
Pickavet, M. (2014). Smart home care platforms: where is the added value?
Weiller, C., & Neely, A. (2013). Business Model Design in an Ecosystem Context. University of
Cambridge Working Papers.
Westerlund, M., Leminen, S., & Rajahonka, M. (2014). Designing Business Models for the Internet of
Things. Technology Innovation Management Review, 5-14.
Zwaag, G. v. (2015, May 20). iOS 9 krijgt Home-app om apparaten in huis te bedienen’. Retrieved from
iCulture: http://www.iculture.nl/ios-9-krijgt-home-app-met-virtuele-kamers-voor-homekit-
apparaten/
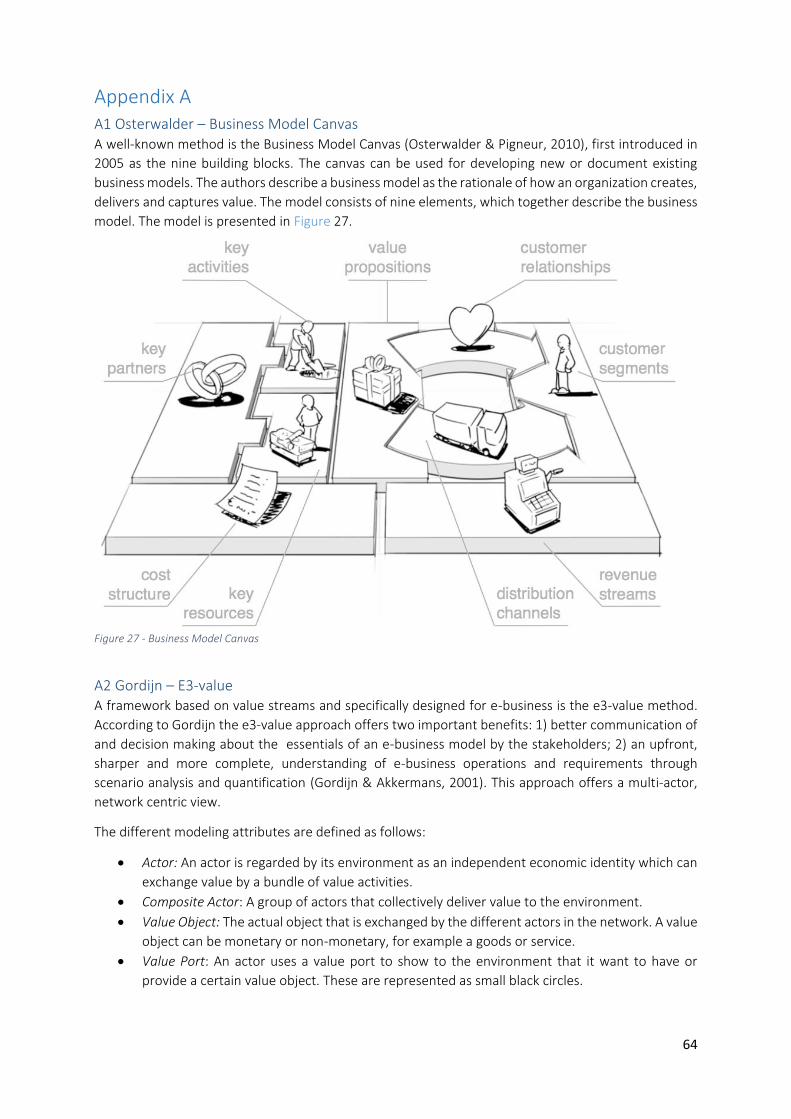
64
Figure 26
Appendix A A1 Osterwalder – Business Model Canvas A well-known method is the Business Model Canvas (Osterwalder & Pigneur, 2010), first introduced in
2005 as the nine building blocks. The canvas can be used for developing new or document existing
business models. The authors describe a business model as the rationale of how an organization creates,
delivers and captures value. The model consists of nine elements, which together describe the business
model. The model is presented in Figure 27.
Figure 27 - Business Model Canvas
A2 Gordijn – E3-value A framework based on value streams and specifically designed for e-business is the e3-value method.
According to Gordijn the e3-value approach offers two important benefits: 1) better communication of
and decision making about the essentials of an e-business model by the stakeholders; 2) an upfront,
sharper and more complete, understanding of e-business operations and requirements through
scenario analysis and quantification (Gordijn & Akkermans, 2001). This approach offers a multi-actor,
network centric view.
The different modeling attributes are defined as follows:
Actor: An actor is regarded by its environment as an independent economic identity which can
exchange value by a bundle of value activities.
Composite Actor: A group of actors that collectively deliver value to the environment.
Value Object: The actual object that is exchanged by the different actors in the network. A value
object can be monetary or non-monetary, for example a goods or service.
Value Port: An actor uses a value port to show to the environment that it want to have or
provide a certain value object. These are represented as small black circles.

65
Value Interface: A grouping of value ports. It shows the value object what the actor want in
return for a certain value object. These constraints are defined by a decision function on the
value interface.
Value Exchange: Connects two value ports. It represents one or more potential trades of value
objects.
Value Offering: Set of value exchanges. If a value offering instance occurs, all value exchanges
should occur or none at all.
Market Segment: A group of actors that share the same decision function. In modeling a real
world scenario case, this is almost never the case. Therefore this is more an assumption to
increase interpretability.
Value Activity: The activities that are performed by an actor to increase profits.
An example of the e3-value approach can be seen in Figure 28.
This model can then be analyzed in three ways:
1- Profit sheets, at the actor or value activity level. On the actor level it can be used to create
confidence in an e-business idea. On the value activity level it can be used whether to assess
activities are profitable.
2- Valuation of the value object in the profit sheets by the actors. All value objects in the profit
sheet have to be assigned a monetary value.
3- E-valuation of what-if scenario’s. Evaluation based on scenario planning taking the profit sheets
as input.
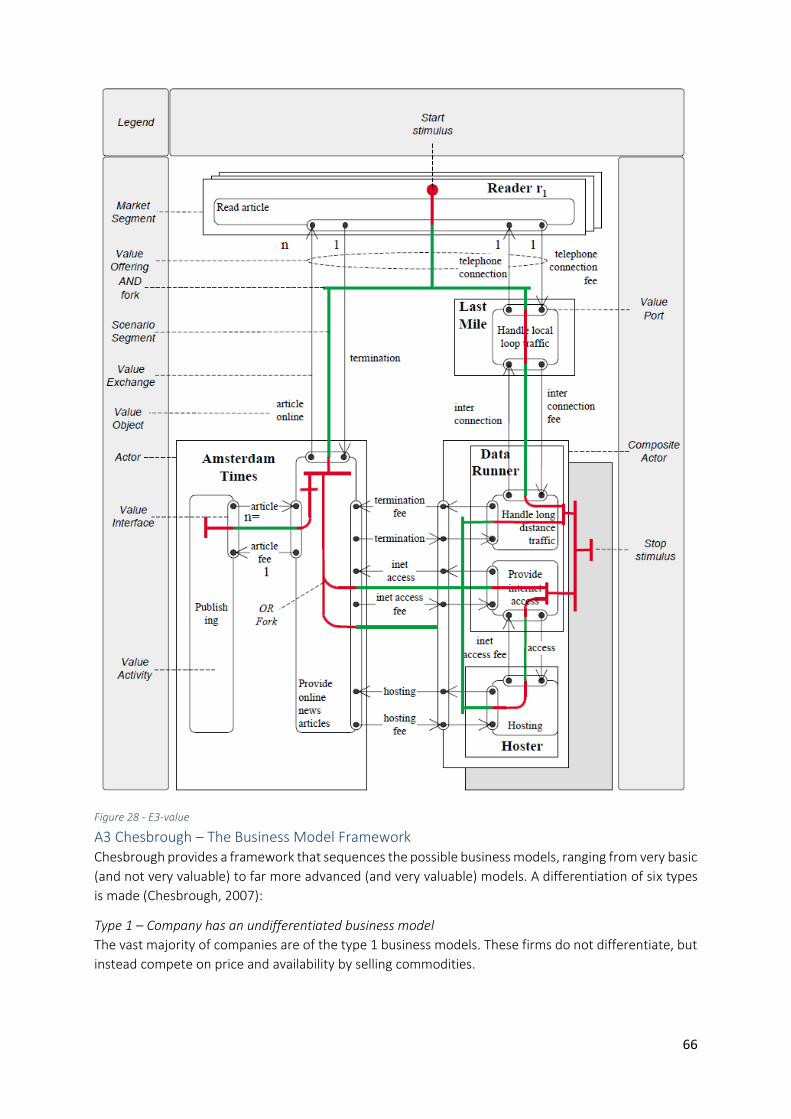
66
Figure 28 - E3-value
A3 Chesbrough – The Business Model Framework Chesbrough provides a framework that sequences the possible business models, ranging from very basic
(and not very valuable) to far more advanced (and very valuable) models. A differentiation of six types
is made (Chesbrough, 2007):
Type 1 – Company has an undifferentiated business model
The vast majority of companies are of the type 1 business models. These firms do not differentiate, but
instead compete on price and availability by selling commodities.
67
Type 2 – Company has some differentiation in its business model
Companies of type 2 business models offer some degree of differentiation, targeting another customer
group than the one of type 1, which only buy based on price and availability. These companies may lack
the resources to stay in this category, which could make them “one hit wonders”.
Type 3 – Company develops a segmented business model
The companies of this type can compete in different market segments, because of their segmented
business model. They can serve a low margin, high volume segment and a high margin, low volume
segment at once. Problems still remain, since companies are vulnerable to major shifts in the market or
technology.
Type 4 – Company has an externally aware business model
Here, firms have begun to open itself to external ideas. Now more resources are available to the firm,
risk is shared with external parties and time to market is reduced. Furthermore roadmaps of the firm
are shared with suppliers and customers, allowing the firms to more efficiently make use of the
innovative ideas of these suppliers and customers.
Type 5 – Company integrates its innovation process with its business model
The type 5 companies offer services instead of products. Business models have become a integrative
role within the company. Companies begin to experiment with the business model. The supply chain is
understood all the way back to the raw materials. Also the customers’ customers are studied in order
to learn about the deeper unmet needs and opportunities in the market. Roadmaps of the supplier and
customers are now shared.
Type 6 – Company’s business model is an adaptive platform
The business models have opened up even more and is also more adaptive than the type 4 and type 5
business models. This ability to adapt requires a commitment to experimentation with one or more
business model variant. Some take the form of spin-offs, but other forms as incubators are also possible.
In this type 6 business model, customers and suppliers become business partners. These partnerships
allow technological but also business risk to be shared. The business plans of suppliers are integrated
into the planning processes of the firm. The supplier in return has integrated its business model into the
business model of its key customers.
The Business Framework allows companies to assess of which type their current business model is. Once
this is done, guidelines should be made up looking at the attributes of the next type in order to advance
their business. The goal is to reach a type 6 business model. The authors stretch the fact that even type
6 is no end point, since no great business model lasts forever. In every stage companies should think
about how to improve business.
A4 Peppard – Network Value Analysis Adopting a network perspective is more suited to the ‘new economy’, especially when both the product
and supply chain are digitized. The Network Value Analysis is a way to analyze competitive ecosystems.
It is supposed to include all relevant aspects of a network: customer, suppliers, complementors,
competitors, regulators, and other actors that may influence value creation of the firm (Peppard &
Rylander, 2006).
The different types of influences can be categorized as follows (Tichy & Fombrun, 1979):
Exchange of goods and services
Affection and liking (expressive/emotional)
Information and ideas (cognitive
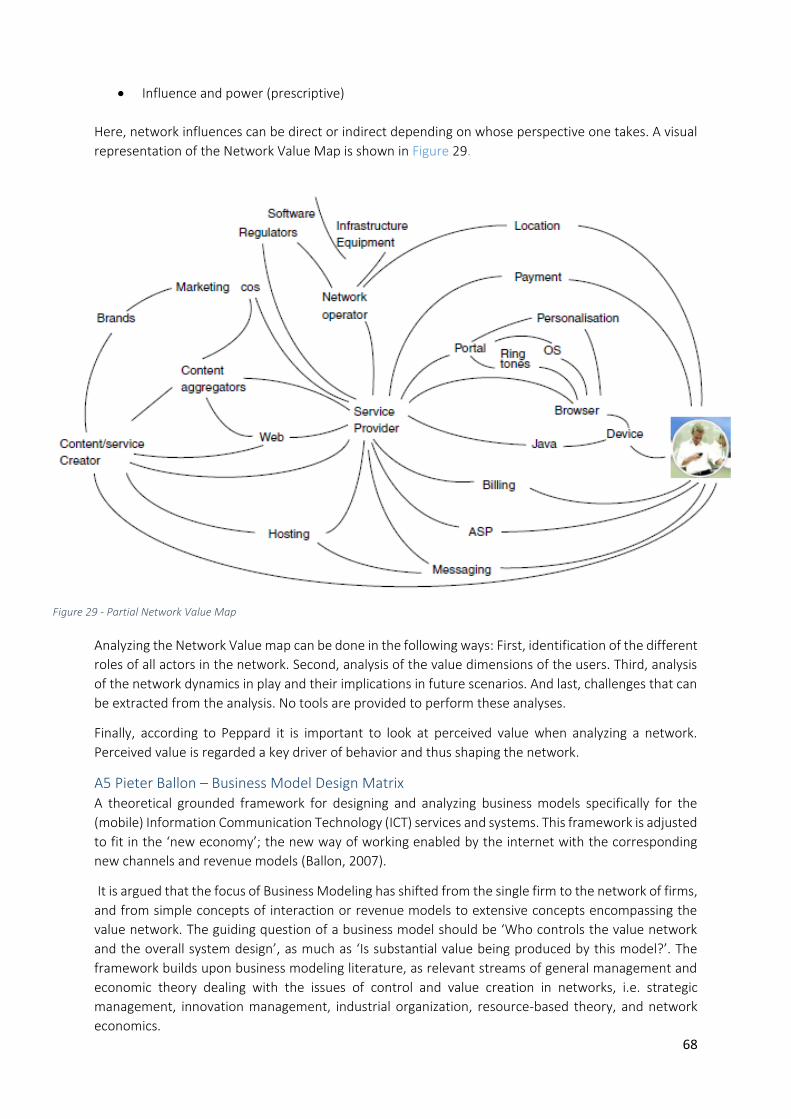
68
Influence and power (prescriptive)
Here, network influences can be direct or indirect depending on whose perspective one takes. A visual
representation of the Network Value Map is shown in Figure 29.
Analyzing the Network Value map can be done in the following ways: First, identification of the different
roles of all actors in the network. Second, analysis of the value dimensions of the users. Third, analysis
of the network dynamics in play and their implications in future scenarios. And last, challenges that can
be extracted from the analysis. No tools are provided to perform these analyses.
Finally, according to Peppard it is important to look at perceived value when analyzing a network.
Perceived value is regarded a key driver of behavior and thus shaping the network.
A5 Pieter Ballon – Business Model Design Matrix A theoretical grounded framework for designing and analyzing business models specifically for the
(mobile) Information Communication Technology (ICT) services and systems. This framework is adjusted
to fit in the ‘new economy’; the new way of working enabled by the internet with the corresponding
new channels and revenue models (Ballon, 2007).
It is argued that the focus of Business Modeling has shifted from the single firm to the network of firms,
and from simple concepts of interaction or revenue models to extensive concepts encompassing the
value network. The guiding question of a business model should be ‘Who controls the value network
and the overall system design’, as much as ‘Is substantial value being produced by this model?’. The
framework builds upon business modeling literature, as relevant streams of general management and
economic theory dealing with the issues of control and value creation in networks, i.e. strategic
management, innovation management, industrial organization, resource-based theory, and network
economics.
Figure 29 - Partial Network Value Map
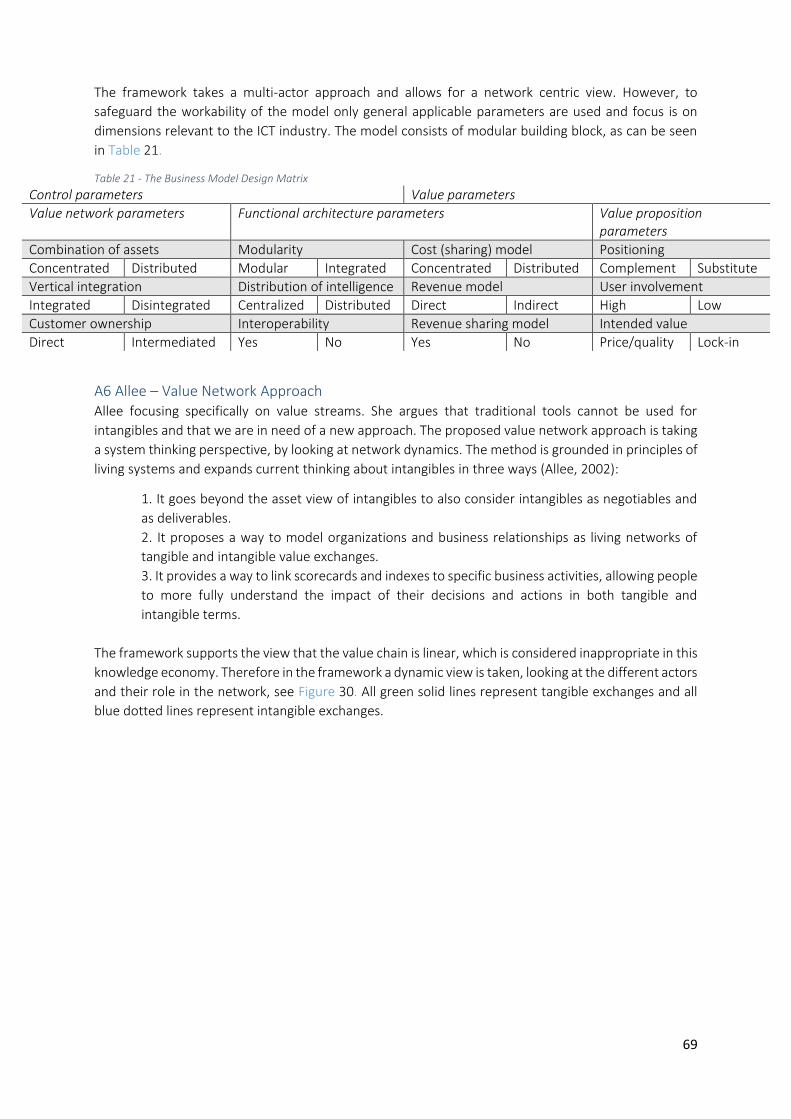
69
The framework takes a multi-actor approach and allows for a network centric view. However, to
safeguard the workability of the model only general applicable parameters are used and focus is on
dimensions relevant to the ICT industry. The model consists of modular building block, as can be seen
in Table 21.
Table 21 - The Business Model Design Matrix
Control parameters Value parameters
Value network parameters Functional architecture parameters Value proposition parameters
Combination of assets Modularity Cost (sharing) model Positioning
Concentrated Distributed Modular Integrated Concentrated Distributed Complement Substitute
Vertical integration Distribution of intelligence Revenue model User involvement
Integrated Disintegrated Centralized Distributed Direct Indirect High Low
Customer ownership Interoperability Revenue sharing model Intended value
Direct Intermediated Yes No Yes No Price/quality Lock-in
A6 Allee – Value Network Approach Allee focusing specifically on value streams. She argues that traditional tools cannot be used for
intangibles and that we are in need of a new approach. The proposed value network approach is taking
a system thinking perspective, by looking at network dynamics. The method is grounded in principles of
living systems and expands current thinking about intangibles in three ways (Allee, 2002):
1. It goes beyond the asset view of intangibles to also consider intangibles as negotiables and
as deliverables.
2. It proposes a way to model organizations and business relationships as living networks of
tangible and intangible value exchanges.
3. It provides a way to link scorecards and indexes to specific business activities, allowing people
to more fully understand the impact of their decisions and actions in both tangible and
intangible terms.
The framework supports the view that the value chain is linear, which is considered inappropriate in this
knowledge economy. Therefore in the framework a dynamic view is taken, looking at the different actors
and their role in the network, see Figure 30. All green solid lines represent tangible exchanges and all
blue dotted lines represent intangible exchanges.
70
Analysis is done based on this figure. First, the patterns of exchange can be assessed. The analyst can
ask questions as “Is there a coherent logic and flow to the way value moves through the system?”, “Does
the system have healthy exchanges of both tangibles and intangibles, or is one type of exchange more
dominant? If so, why might that be?”, or “Are there missing or “dead” links, weak and ineffective links,
value “dead ends,” or participant bottlenecks?”
Second and third, an impact analysis can be performed, one looking at all the input and the other at all
the output of actors. Then it depicts the costs and risks associated with the specific links. Both allow for
company scorecards to be used.
A7 Bouwman – STOF model A method aimed at service innovation is the STOF model. According to Bouwman et al. business models
have to focus on four domains: service, technology, organization and finance. Within each building block
different components play a role. The model takes a customer point of view by focusing on customer
value, then it looks at what organizational, technical and financial arrangement are needed to provide
this value and allow for the provider of that service to capture value as well.
Since the model is focusing on customer value, the most important domain is the service and serves as
a reference for the other domains. The authors note others could suggest that technology should be
the main domain, but from a customer point of view technology is just an enabler, following the
technology pull model (Bouwman, Faber, Haaker, Kijl, & de Reuver, 2008).
A description of the four domains can be found here:
Service – The reference point for the other domains. The service domain focuses around value,
how value is created for the customer and how that value is perceived by that customer. The
inter-related components of this domain are intended and delivered value on the part of the
provider, and expected and perceived value on the part of the customer or end-user.
Technology – The enabler of the service provided as specified in the service domain. The
technology domain specifies the requirements needed in the technology architecture, which
are translated in applications, devices, service platforms, access networks and backbone
infrastructure.
Figure 30 - Value network
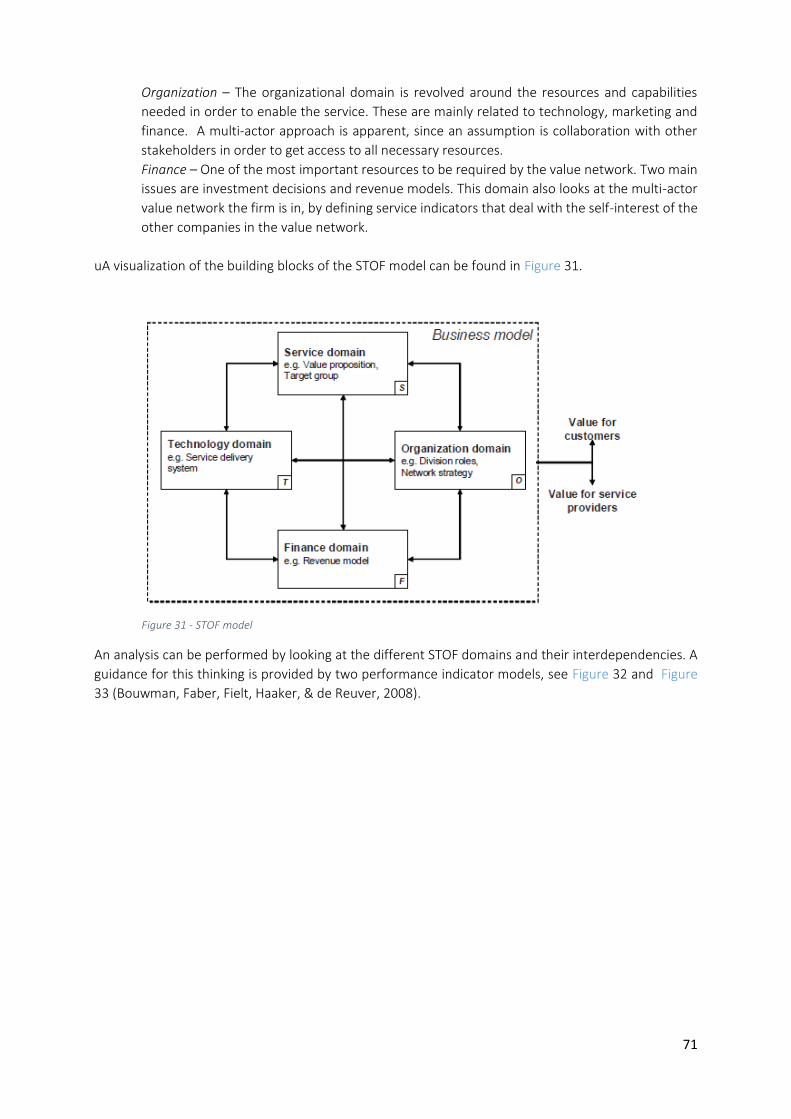
71
Organization – The organizational domain is revolved around the resources and capabilities
needed in order to enable the service. These are mainly related to technology, marketing and
finance. A multi-actor approach is apparent, since an assumption is collaboration with other
stakeholders in order to get access to all necessary resources.
Finance – One of the most important resources to be required by the value network. Two main
issues are investment decisions and revenue models. This domain also looks at the multi-actor
value network the firm is in, by defining service indicators that deal with the self-interest of the
other companies in the value network.
uA visualization of the building blocks of the STOF model can be found in Figure 31.
An analysis can be performed by looking at the different STOF domains and their interdependencies. A
guidance for this thinking is provided by two performance indicator models, see Figure 32 and Figure
33 (Bouwman, Faber, Fielt, Haaker, & de Reuver, 2008).
Figure 31 - STOF model
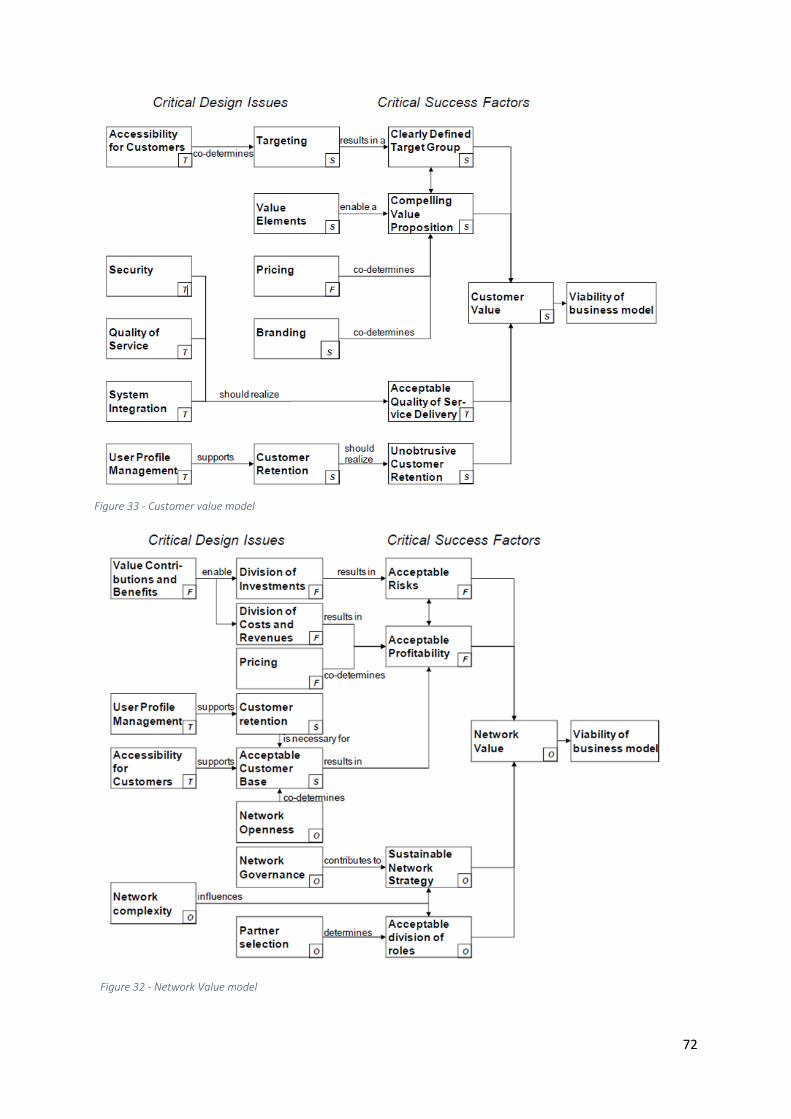
72
Figure 32 - Network Value model
Figure 33 - Customer value model
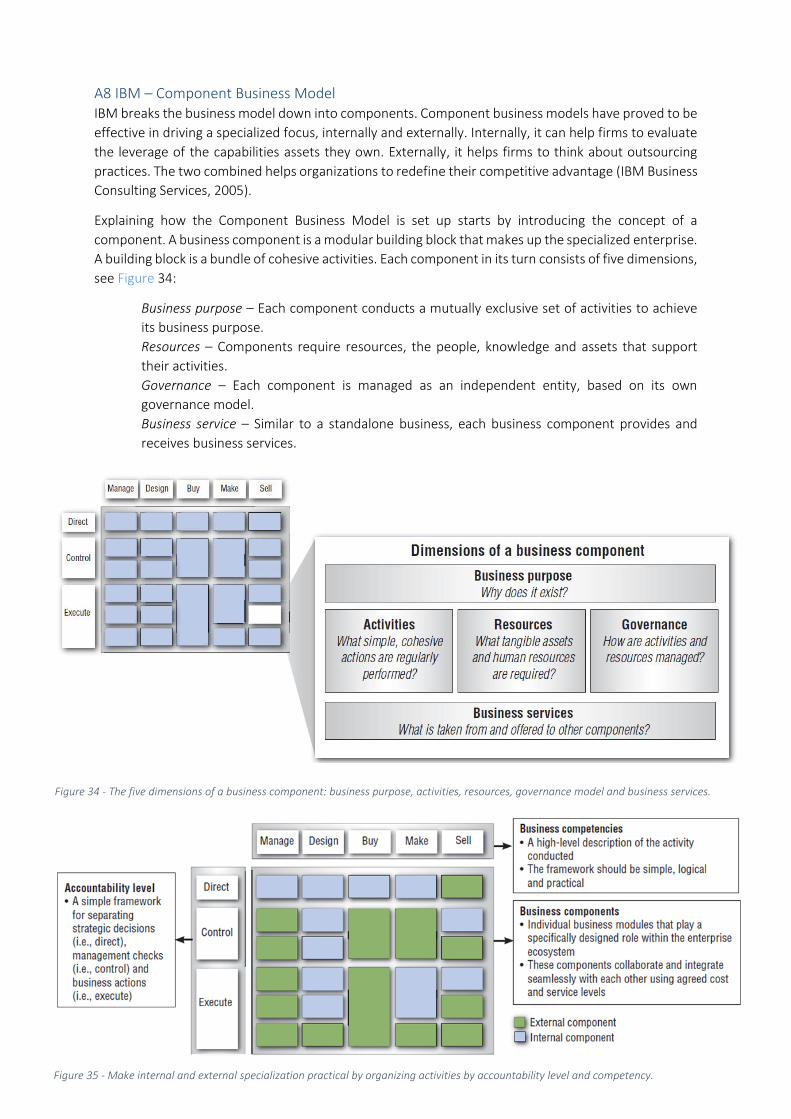
73
Figure 34 - The five dimensions of a business component: business purpose, activities, resources, governance model and business services.
Figure 35 - Make internal and external specialization practical by organizing activities by accountability level and competency.
A8 IBM – Component Business Model IBM breaks the business model down into components. Component business models have proved to be
effective in driving a specialized focus, internally and externally. Internally, it can help firms to evaluate
the leverage of the capabilities assets they own. Externally, it helps firms to think about outsourcing
practices. The two combined helps organizations to redefine their competitive advantage (IBM Business
Consulting Services, 2005).
Explaining how the Component Business Model is set up starts by introducing the concept of a
component. A business component is a modular building block that makes up the specialized enterprise.
A building block is a bundle of cohesive activities. Each component in its turn consists of five dimensions,
see Figure 34:
Business purpose – Each component conducts a mutually exclusive set of activities to achieve
its business purpose.
Resources – Components require resources, the people, knowledge and assets that support
their activities.
Governance – Each component is managed as an independent entity, based on its own
governance model.
Business service – Similar to a standalone business, each business component provides and
receives business services.
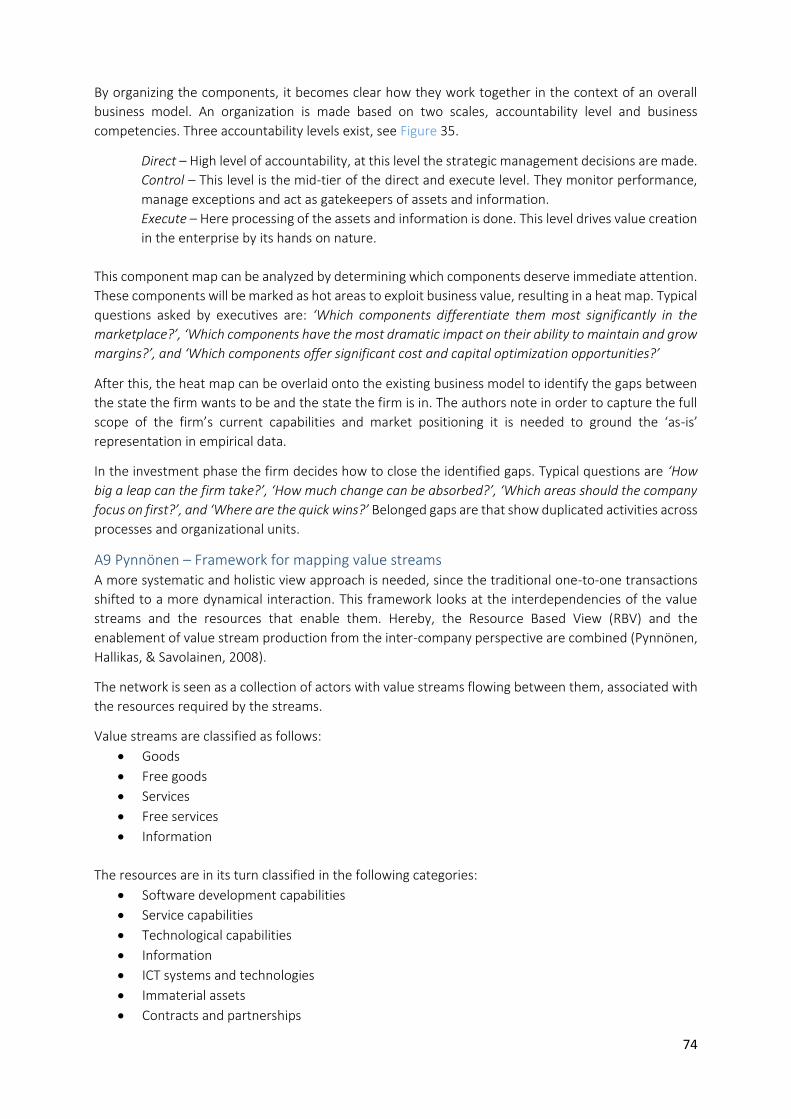
74
By organizing the components, it becomes clear how they work together in the context of an overall
business model. An organization is made based on two scales, accountability level and business
competencies. Three accountability levels exist, see Figure 35.
Direct – High level of accountability, at this level the strategic management decisions are made.
Control – This level is the mid-tier of the direct and execute level. They monitor performance,
manage exceptions and act as gatekeepers of assets and information.
Execute – Here processing of the assets and information is done. This level drives value creation
in the enterprise by its hands on nature.
This component map can be analyzed by determining which components deserve immediate attention.
These components will be marked as hot areas to exploit business value, resulting in a heat map. Typical
questions asked by executives are: ‘Which components differentiate them most significantly in the
marketplace?’, ‘Which components have the most dramatic impact on their ability to maintain and grow
margins?’, and ‘Which components offer significant cost and capital optimization opportunities?’
After this, the heat map can be overlaid onto the existing business model to identify the gaps between
the state the firm wants to be and the state the firm is in. The authors note in order to capture the full
scope of the firm’s current capabilities and market positioning it is needed to ground the ‘as-is’
representation in empirical data.
In the investment phase the firm decides how to close the identified gaps. Typical questions are ‘How
big a leap can the firm take?’, ‘How much change can be absorbed?’, ‘Which areas should the company
focus on first?’, and ‘Where are the quick wins?’ Belonged gaps are that show duplicated activities across
processes and organizational units.
A9 Pynnönen – Framework for mapping value streams A more systematic and holistic view approach is needed, since the traditional one-to-one transactions
shifted to a more dynamical interaction. This framework looks at the interdependencies of the value
streams and the resources that enable them. Hereby, the Resource Based View (RBV) and the
enablement of value stream production from the inter-company perspective are combined (Pynnönen,
Hallikas, & Savolainen, 2008).
The network is seen as a collection of actors with value streams flowing between them, associated with
the resources required by the streams.
Value streams are classified as follows:
Goods
Free goods
Services
Free services
Information
The resources are in its turn classified in the following categories:
Software development capabilities
Service capabilities
Technological capabilities
Information
ICT systems and technologies
Immaterial assets
Contracts and partnerships
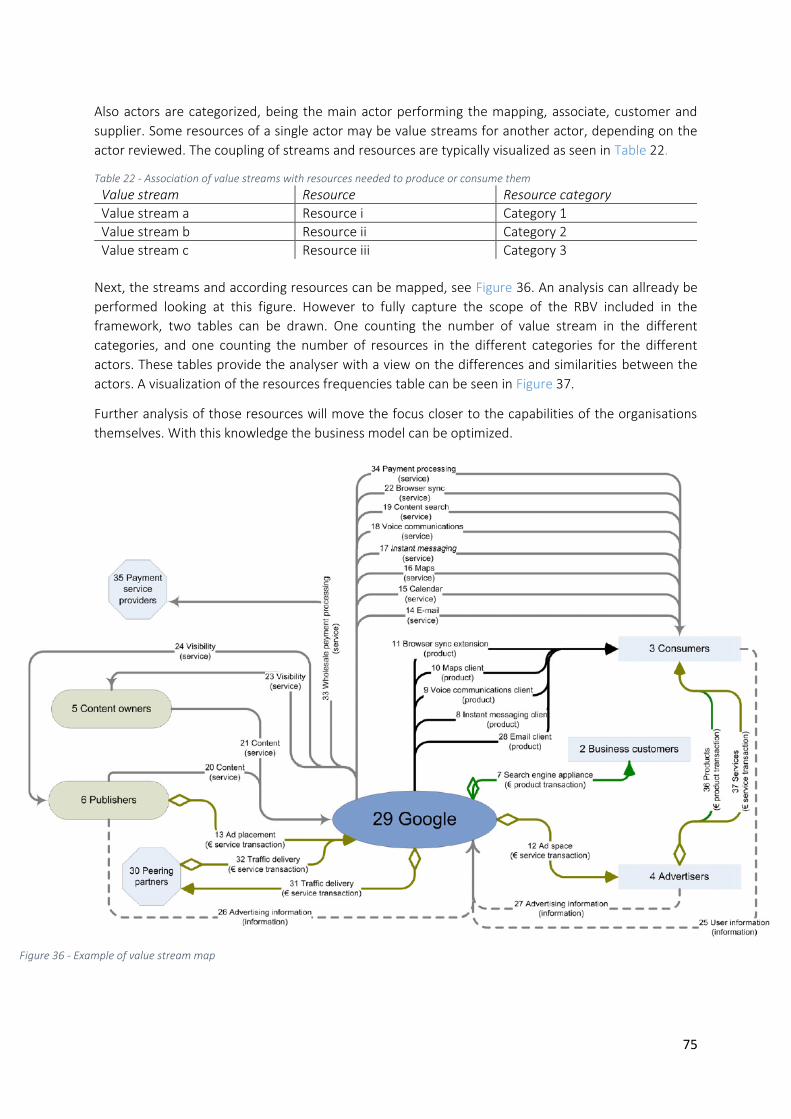
75
Figure 36 - Example of value stream map
Also actors are categorized, being the main actor performing the mapping, associate, customer and
supplier. Some resources of a single actor may be value streams for another actor, depending on the
actor reviewed. The coupling of streams and resources are typically visualized as seen in Table 22.
Table 22 - Association of value streams with resources needed to produce or consume them
Value stream Resource Resource category
Value stream a Resource i Category 1
Value stream b Resource ii Category 2
Value stream c Resource iii Category 3
Next, the streams and according resources can be mapped, see Figure 36. An analysis can allready be
performed looking at this figure. However to fully capture the scope of the RBV included in the
framework, two tables can be drawn. One counting the number of value stream in the different
categories, and one counting the number of resources in the different categories for the different
actors. These tables provide the analyser with a view on the differences and similarities between the
actors. A visualization of the resources frequencies table can be seen in Figure 37.
Further analysis of those resources will move the focus closer to the capabilities of the organisations
themselves. With this knowledge the business model can be optimized.
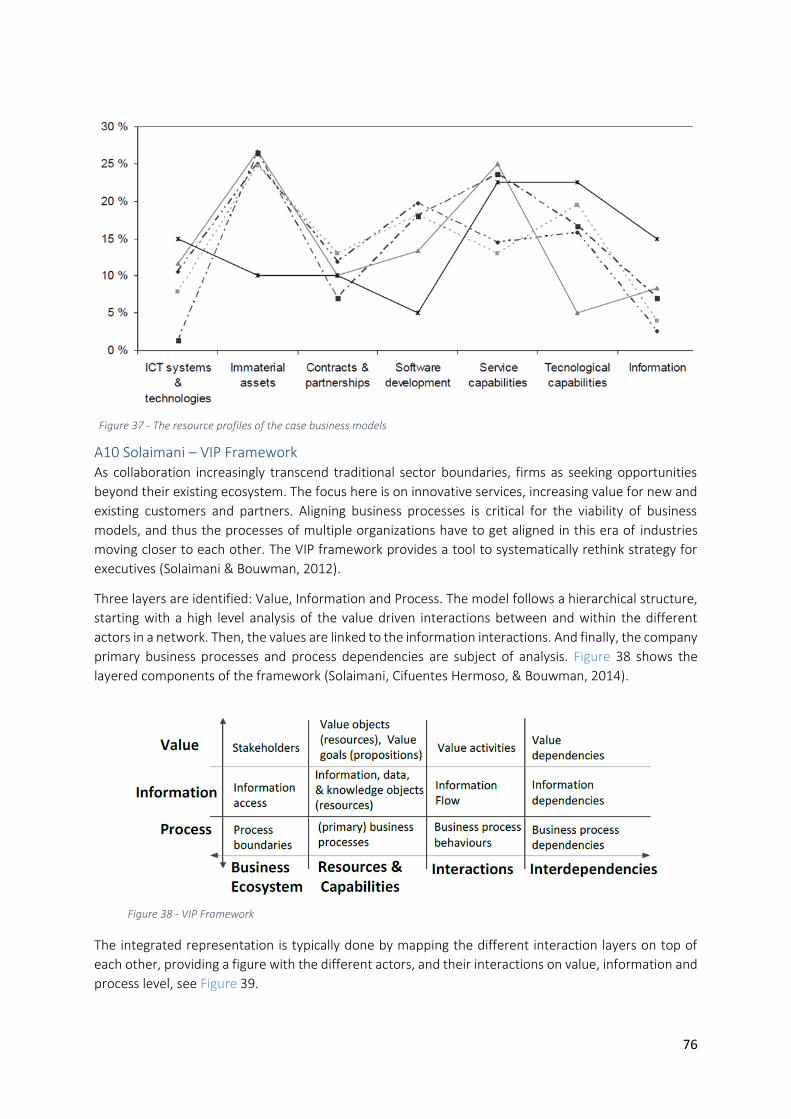
76
Figure 37 - The resource profiles of the case business models
Figure 38 - VIP Framework
A10 Solaimani – VIP Framework As collaboration increasingly transcend traditional sector boundaries, firms as seeking opportunities
beyond their existing ecosystem. The focus here is on innovative services, increasing value for new and
existing customers and partners. Aligning business processes is critical for the viability of business
models, and thus the processes of multiple organizations have to get aligned in this era of industries
moving closer to each other. The VIP framework provides a tool to systematically rethink strategy for
executives (Solaimani & Bouwman, 2012).
Three layers are identified: Value, Information and Process. The model follows a hierarchical structure,
starting with a high level analysis of the value driven interactions between and within the different
actors in a network. Then, the values are linked to the information interactions. And finally, the company
primary business processes and process dependencies are subject of analysis. Figure 38 shows the
layered components of the framework (Solaimani, Cifuentes Hermoso, & Bouwman, 2014).
The integrated representation is typically done by mapping the different interaction layers on top of
each other, providing a figure with the different actors, and their interactions on value, information and
process level, see Figure 39.
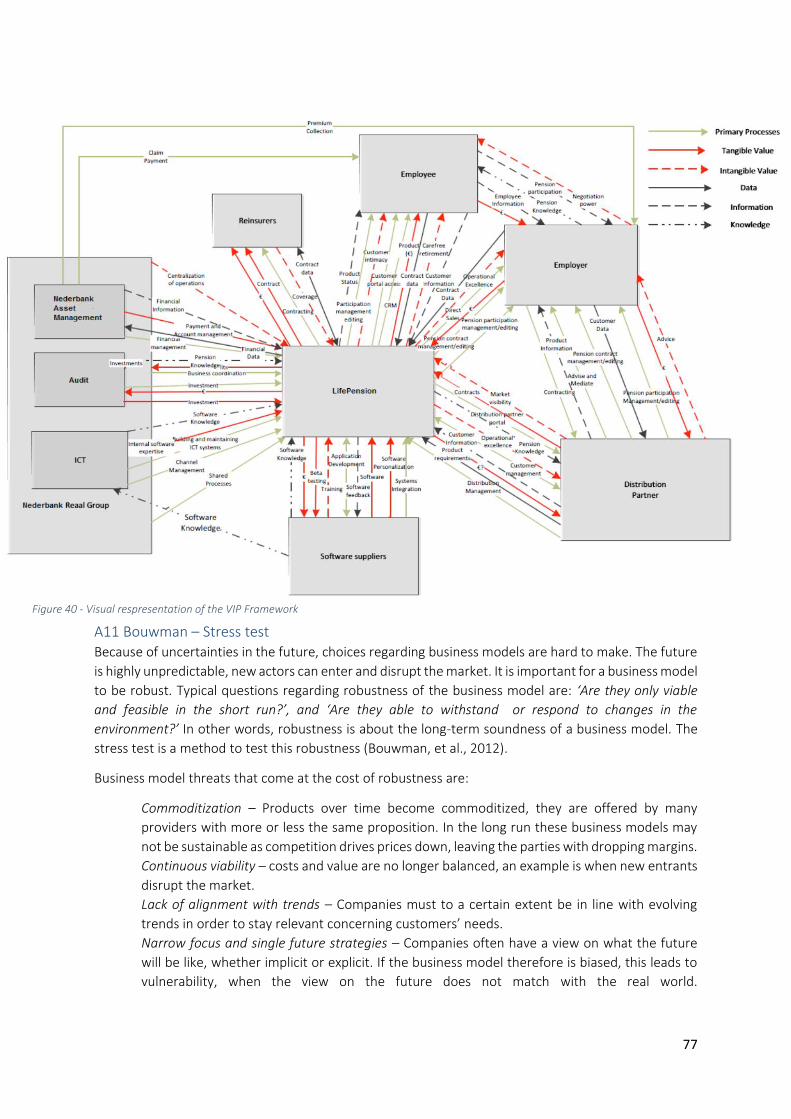
77
Figure 40 - Visual respresentation of the VIP Framework
A11 Bouwman – Stress test Because of uncertainties in the future, choices regarding business models are hard to make. The future
is highly unpredictable, new actors can enter and disrupt the market. It is important for a business model
to be robust. Typical questions regarding robustness of the business model are: ‘Are they only viable
and feasible in the short run?’, and ‘Are they able to withstand or respond to changes in the
environment?’ In other words, robustness is about the long-term soundness of a business model. The
stress test is a method to test this robustness (Bouwman, et al., 2012).
Business model threats that come at the cost of robustness are:
Commoditization – Products over time become commoditized, they are offered by many
providers with more or less the same proposition. In the long run these business models may
not be sustainable as competition drives prices down, leaving the parties with dropping margins.
Continuous viability – costs and value are no longer balanced, an example is when new entrants
disrupt the market.
Lack of alignment with trends – Companies must to a certain extent be in line with evolving
trends in order to stay relevant concerning customers’ needs.
Narrow focus and single future strategies – Companies often have a view on what the future
will be like, whether implicit or explicit. If the business model therefore is biased, this leads to
vulnerability, when the view on the future does not match with the real world.
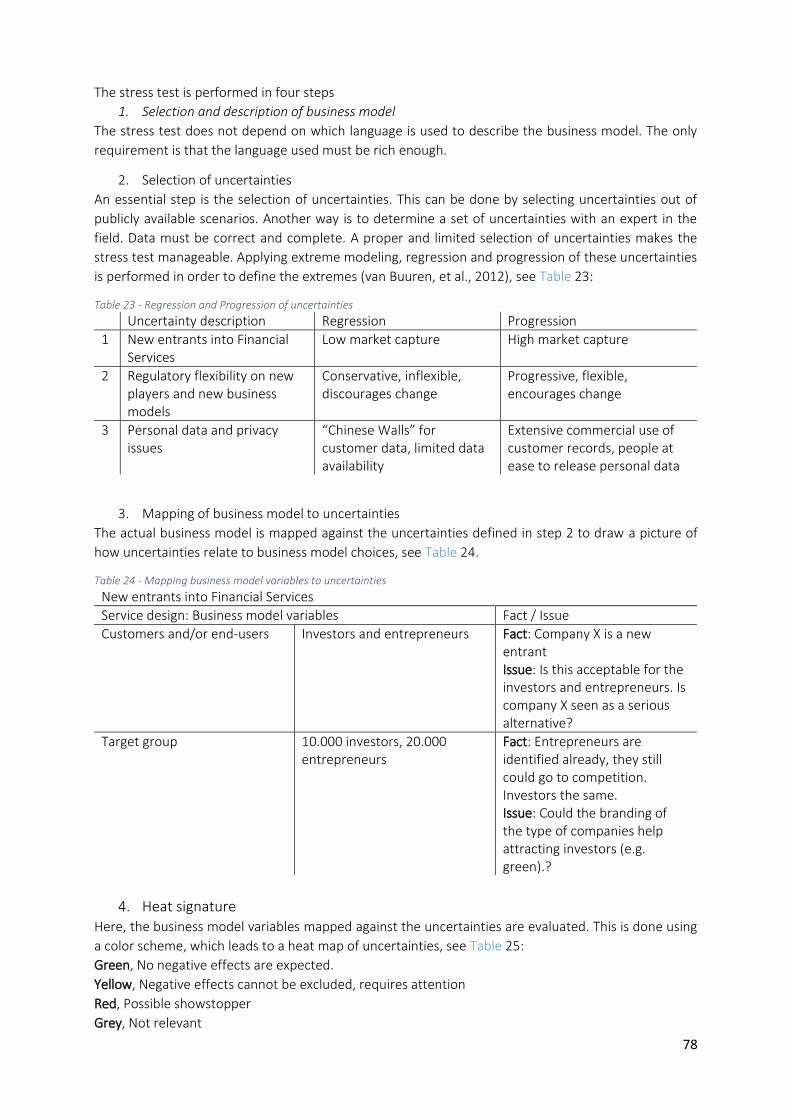
78
The stress test is performed in four steps
1. Selection and description of business model
The stress test does not depend on which language is used to describe the business model. The only
requirement is that the language used must be rich enough.
2. Selection of uncertainties
An essential step is the selection of uncertainties. This can be done by selecting uncertainties out of
publicly available scenarios. Another way is to determine a set of uncertainties with an expert in the
field. Data must be correct and complete. A proper and limited selection of uncertainties makes the
stress test manageable. Applying extreme modeling, regression and progression of these uncertainties
is performed in order to define the extremes (van Buuren, et al., 2012), see Table 23:
Table 23 - Regression and Progression of uncertainties
Uncertainty description Regression Progression
1 New entrants into Financial Services
Low market capture High market capture
2 Regulatory flexibility on new players and new business models
Conservative, inflexible, discourages change
Progressive, flexible, encourages change
3 Personal data and privacy issues
“Chinese Walls” for customer data, limited data availability
Extensive commercial use of customer records, people at ease to release personal data
3. Mapping of business model to uncertainties
The actual business model is mapped against the uncertainties defined in step 2 to draw a picture of
how uncertainties relate to business model choices, see Table 24.
Table 24 - Mapping business model variables to uncertainties
New entrants into Financial Services
Service design: Business model variables Fact / Issue
Customers and/or end-users Investors and entrepreneurs Fact: Company X is a new entrant Issue: Is this acceptable for the investors and entrepreneurs. Is company X seen as a serious alternative?
Target group 10.000 investors, 20.000 entrepreneurs
Fact: Entrepreneurs are identified already, they still could go to competition. Investors the same. Issue: Could the branding of the type of companies help attracting investors (e.g. green).?
4. Heat signature Here, the business model variables mapped against the uncertainties are evaluated. This is done using
a color scheme, which leads to a heat map of uncertainties, see Table 25:
Green, No negative effects are expected.
Yellow, Negative effects cannot be excluded, requires attention
Red, Possible showstopper
Grey, Not relevant
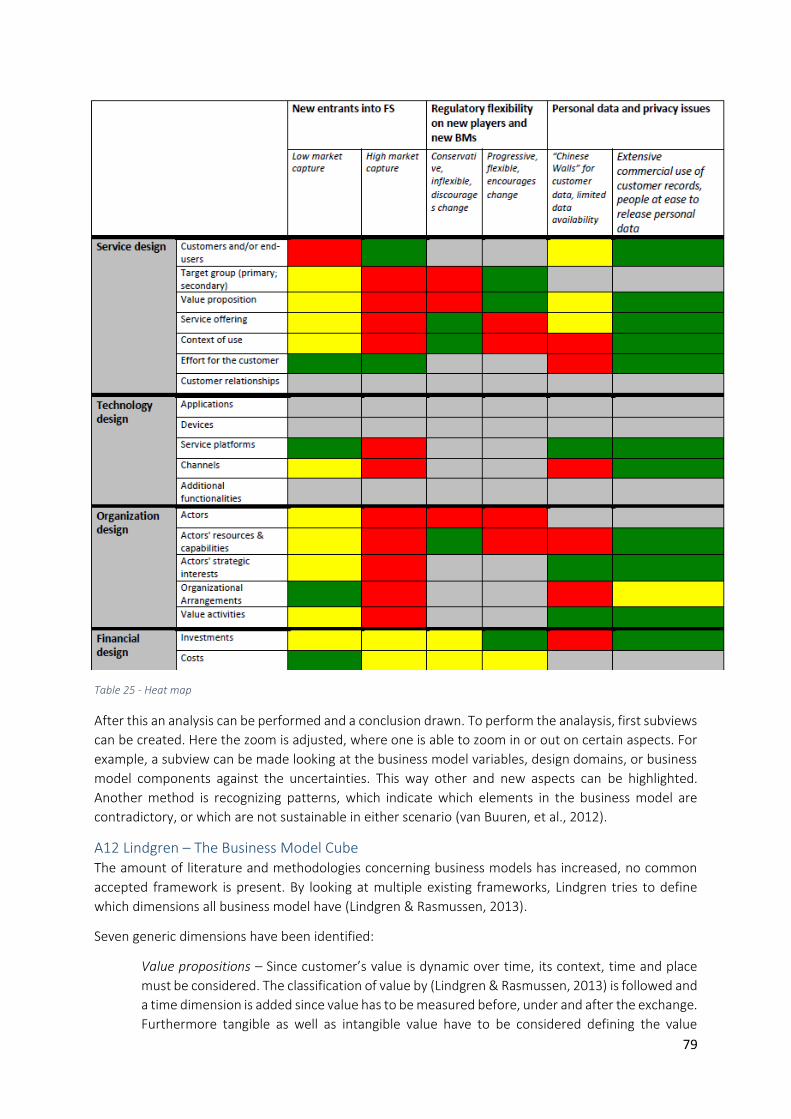
79
After this an analysis can be performed and a conclusion drawn. To perform the analaysis, first subviews
can be created. Here the zoom is adjusted, where one is able to zoom in or out on certain aspects. For
example, a subview can be made looking at the business model variables, design domains, or business
model components against the uncertainties. This way other and new aspects can be highlighted.
Another method is recognizing patterns, which indicate which elements in the business model are
contradictory, or which are not sustainable in either scenario (van Buuren, et al., 2012).
A12 Lindgren – The Business Model Cube The amount of literature and methodologies concerning business models has increased, no common
accepted framework is present. By looking at multiple existing frameworks, Lindgren tries to define
which dimensions all business model have (Lindgren & Rasmussen, 2013).
Seven generic dimensions have been identified:
Value propositions – Since customer’s value is dynamic over time, its context, time and place
must be considered. The classification of value by (Lindgren & Rasmussen, 2013) is followed and
a time dimension is added since value has to be measured before, under and after the exchange.
Furthermore tangible as well as intangible value have to be considered defining the value
Table 25 - Heat map
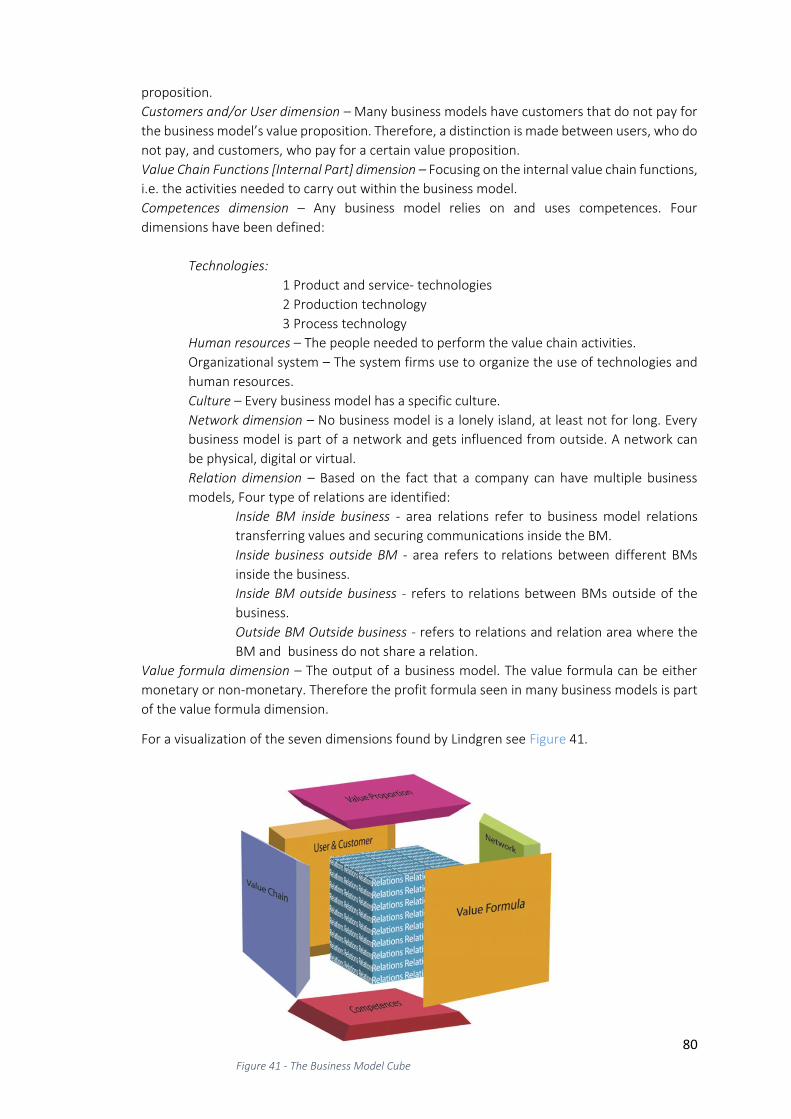
80 Figure 41 - The Business Model Cube
proposition.
Customers and/or User dimension – Many business models have customers that do not pay for
the business model’s value proposition. Therefore, a distinction is made between users, who do
not pay, and customers, who pay for a certain value proposition.
Value Chain Functions [Internal Part] dimension – Focusing on the internal value chain functions,
i.e. the activities needed to carry out within the business model.
Competences dimension – Any business model relies on and uses competences. Four
dimensions have been defined:
Technologies:
1 Product and service- technologies
2 Production technology
3 Process technology
Human resources – The people needed to perform the value chain activities.
Organizational system – The system firms use to organize the use of technologies and
human resources.
Culture – Every business model has a specific culture.
Network dimension – No business model is a lonely island, at least not for long. Every
business model is part of a network and gets influenced from outside. A network can
be physical, digital or virtual.
Relation dimension – Based on the fact that a company can have multiple business
models, Four type of relations are identified:
Inside BM inside business - area relations refer to business model relations
transferring values and securing communications inside the BM.
Inside business outside BM - area refers to relations between different BMs
inside the business.
Inside BM outside business - refers to relations between BMs outside of the
business.
Outside BM Outside business - refers to relations and relation area where the
BM and business do not share a relation.
Value formula dimension – The output of a business model. The value formula can be either
monetary or non-monetary. Therefore the profit formula seen in many business models is part
of the value formula dimension.
For a visualization of the seven dimensions found by Lindgren see Figure 41.
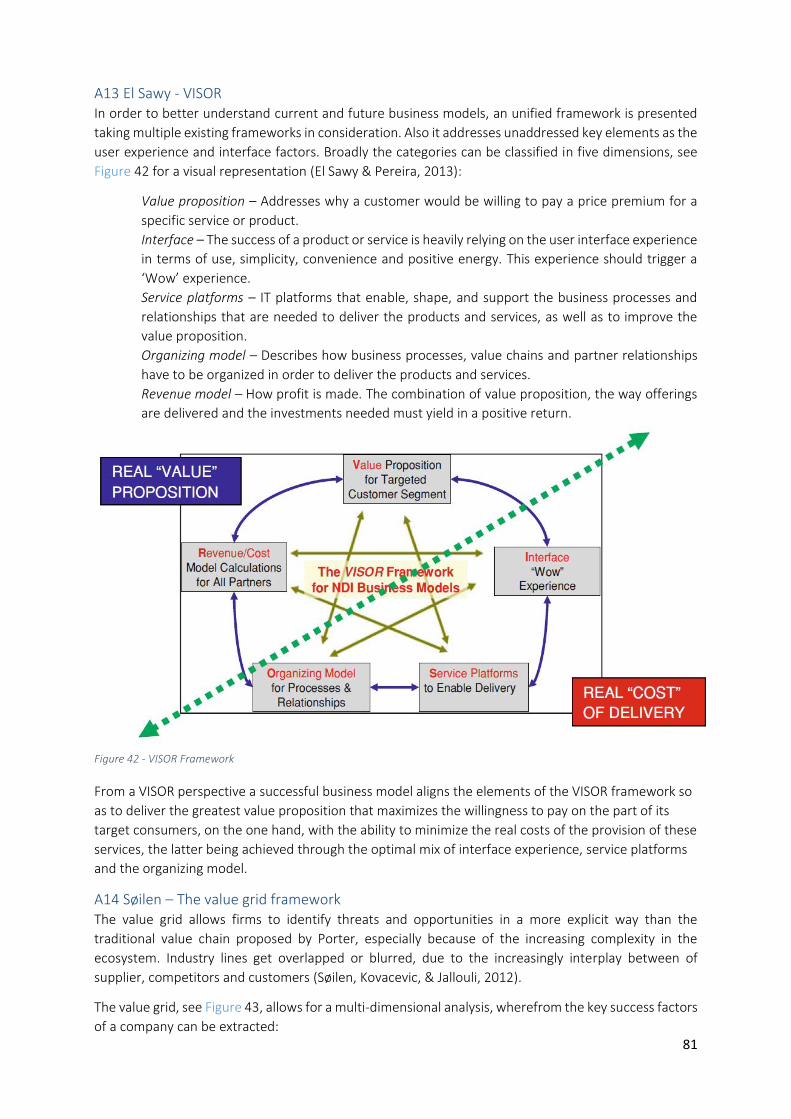
81
Figure 42 - VISOR Framework
A13 El Sawy - VISOR In order to better understand current and future business models, an unified framework is presented
taking multiple existing frameworks in consideration. Also it addresses unaddressed key elements as the
user experience and interface factors. Broadly the categories can be classified in five dimensions, see
Figure 42 for a visual representation (El Sawy & Pereira, 2013):
Value proposition – Addresses why a customer would be willing to pay a price premium for a
specific service or product.
Interface – The success of a product or service is heavily relying on the user interface experience
in terms of use, simplicity, convenience and positive energy. This experience should trigger a
‘Wow’ experience.
Service platforms – IT platforms that enable, shape, and support the business processes and
relationships that are needed to deliver the products and services, as well as to improve the
value proposition.
Organizing model – Describes how business processes, value chains and partner relationships
have to be organized in order to deliver the products and services.
Revenue model – How profit is made. The combination of value proposition, the way offerings
are delivered and the investments needed must yield in a positive return.
From a VISOR perspective a successful business model aligns the elements of the VISOR framework so
as to deliver the greatest value proposition that maximizes the willingness to pay on the part of its
target consumers, on the one hand, with the ability to minimize the real costs of the provision of these
services, the latter being achieved through the optimal mix of interface experience, service platforms
and the organizing model.
A14 Søilen – The value grid framework The value grid allows firms to identify threats and opportunities in a more explicit way than the
traditional value chain proposed by Porter, especially because of the increasing complexity in the
ecosystem. Industry lines get overlapped or blurred, due to the increasingly interplay between of
supplier, competitors and customers (Søilen, Kovacevic, & Jallouli, 2012).
The value grid, see Figure 43, allows for a multi-dimensional analysis, wherefrom the key success factors
of a company can be extracted:
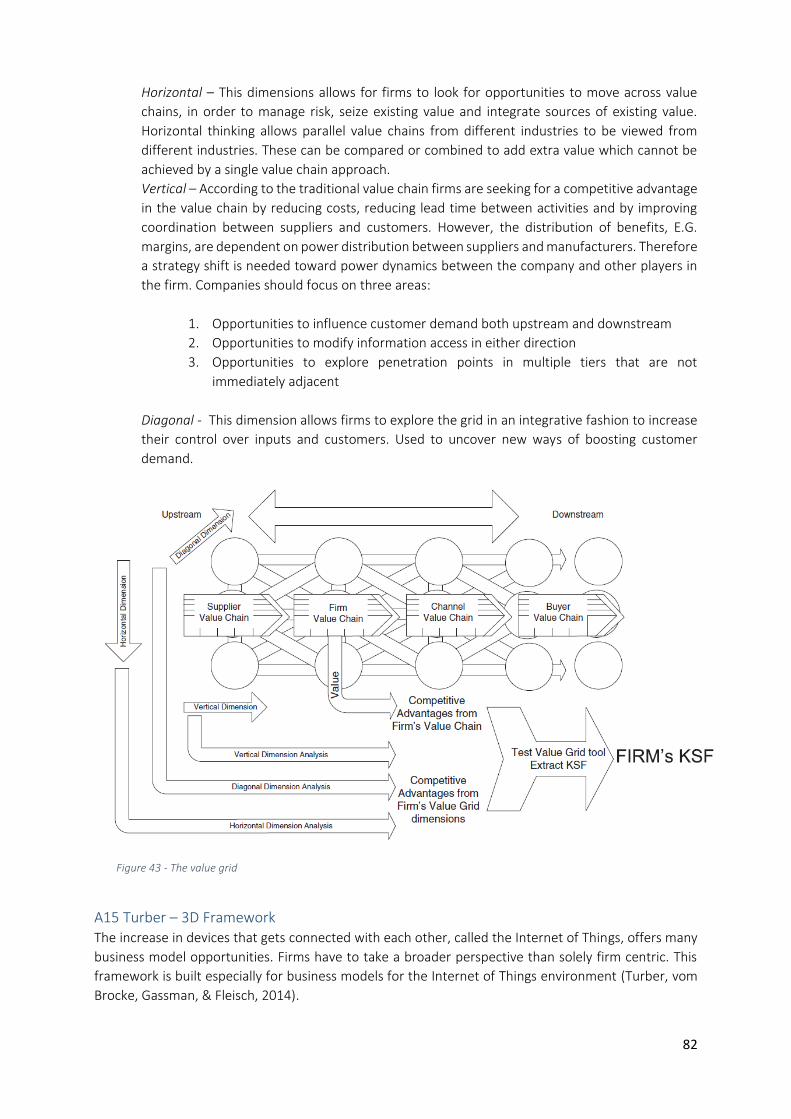
82
Figure 43 - The value grid
Horizontal – This dimensions allows for firms to look for opportunities to move across value
chains, in order to manage risk, seize existing value and integrate sources of existing value.
Horizontal thinking allows parallel value chains from different industries to be viewed from
different industries. These can be compared or combined to add extra value which cannot be
achieved by a single value chain approach.
Vertical – According to the traditional value chain firms are seeking for a competitive advantage
in the value chain by reducing costs, reducing lead time between activities and by improving
coordination between suppliers and customers. However, the distribution of benefits, E.G.
margins, are dependent on power distribution between suppliers and manufacturers. Therefore
a strategy shift is needed toward power dynamics between the company and other players in
the firm. Companies should focus on three areas:
1. Opportunities to influence customer demand both upstream and downstream
2. Opportunities to modify information access in either direction
3. Opportunities to explore penetration points in multiple tiers that are not
immediately adjacent
Diagonal - This dimension allows firms to explore the grid in an integrative fashion to increase
their control over inputs and customers. Used to uncover new ways of boosting customer
demand.
A15 Turber – 3D Framework The increase in devices that gets connected with each other, called the Internet of Things, offers many
business model opportunities. Firms have to take a broader perspective than solely firm centric. This
framework is built especially for business models for the Internet of Things environment (Turber, vom
Brocke, Gassman, & Fleisch, 2014).
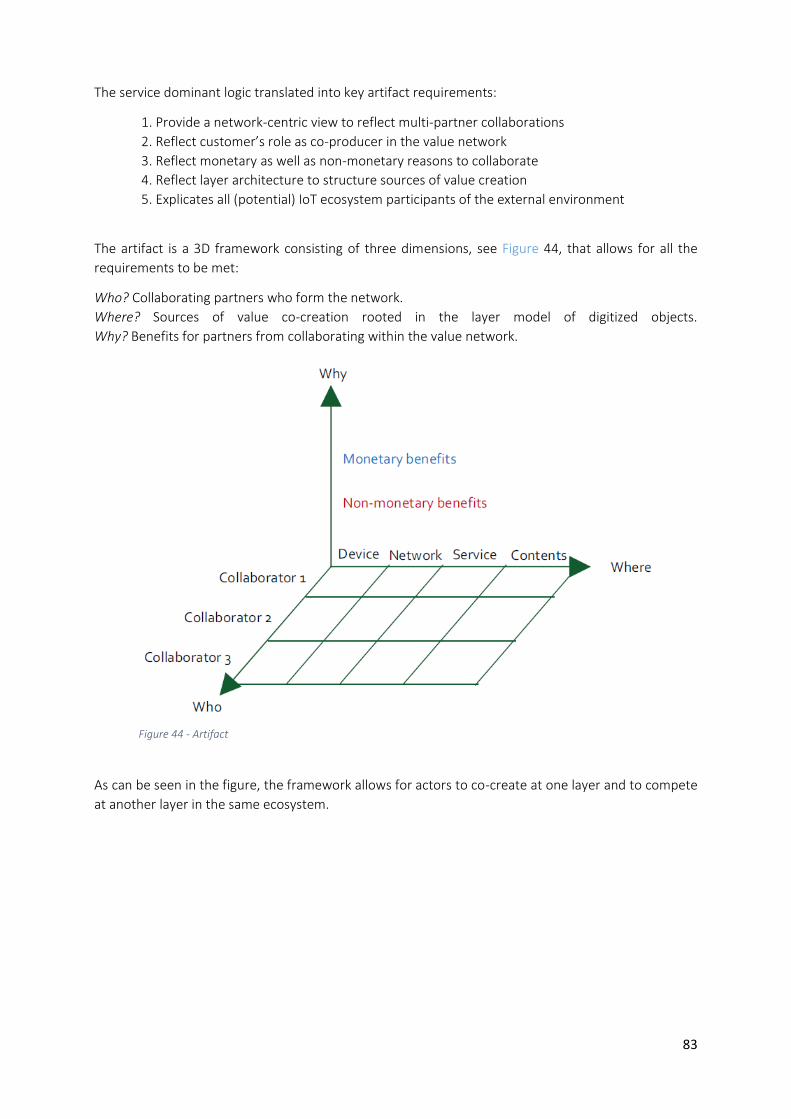
83
Figure 44 - Artifact
The service dominant logic translated into key artifact requirements:
1. Provide a network-centric view to reflect multi-partner collaborations
2. Reflect customer’s role as co-producer in the value network
3. Reflect monetary as well as non-monetary reasons to collaborate
4. Reflect layer architecture to structure sources of value creation
5. Explicates all (potential) IoT ecosystem participants of the external environment
The artifact is a 3D framework consisting of three dimensions, see Figure 44, that allows for all the
requirements to be met:
Who? Collaborating partners who form the network.
Where? Sources of value co-creation rooted in the layer model of digitized objects.
Why? Benefits for partners from collaborating within the value network.
As can be seen in the figure, the framework allows for actors to co-create at one layer and to compete
at another layer in the same ecosystem.
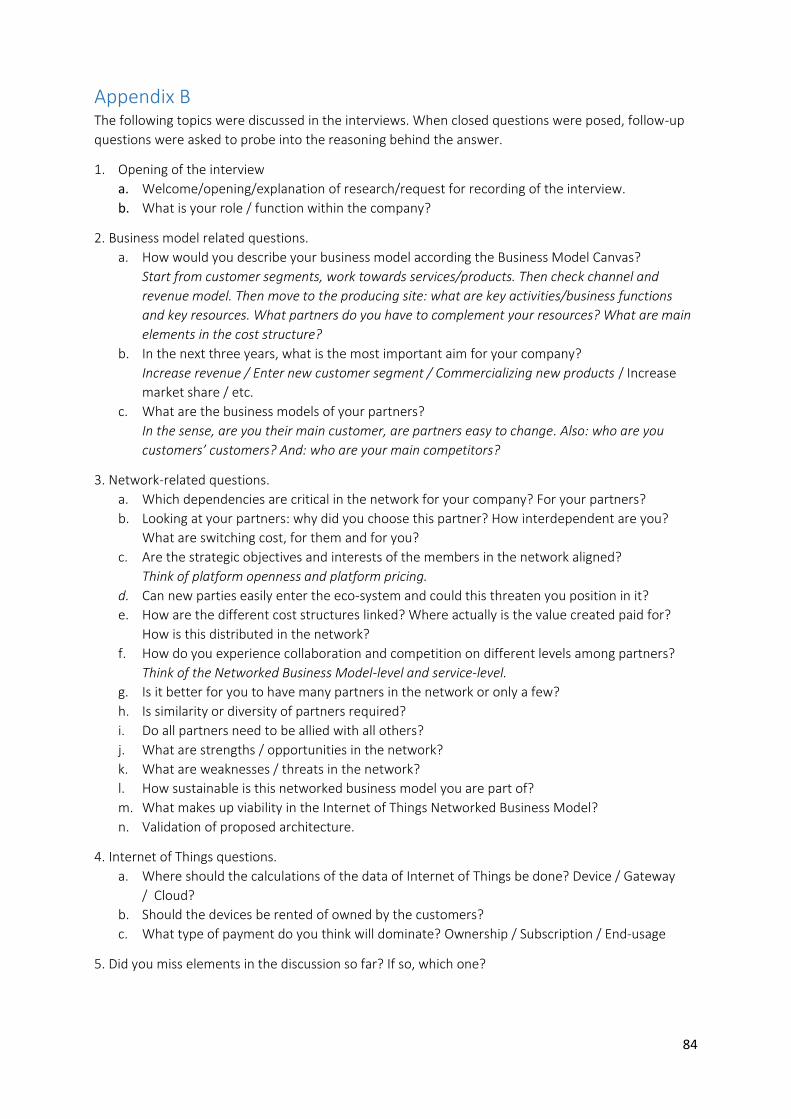
84
Appendix B The following topics were discussed in the interviews. When closed questions were posed, follow-up
questions were asked to probe into the reasoning behind the answer.
1. Opening of the interview
a. Welcome/opening/explanation of research/request for recording of the interview.
b. What is your role / function within the company?
2. Business model related questions.
a. How would you describe your business model according the Business Model Canvas?
Start from customer segments, work towards services/products. Then check channel and
revenue model. Then move to the producing site: what are key activities/business functions
and key resources. What partners do you have to complement your resources? What are main
elements in the cost structure?
b. In the next three years, what is the most important aim for your company?
Increase revenue / Enter new customer segment / Commercializing new products / Increase
market share / etc.
c. What are the business models of your partners?
In the sense, are you their main customer, are partners easy to change. Also: who are you
customers’ customers? And: who are your main competitors?
3. Network-related questions.
a. Which dependencies are critical in the network for your company? For your partners?
b. Looking at your partners: why did you choose this partner? How interdependent are you?
What are switching cost, for them and for you?
c. Are the strategic objectives and interests of the members in the network aligned?
Think of platform openness and platform pricing.
d. Can new parties easily enter the eco-system and could this threaten you position in it?
e. How are the different cost structures linked? Where actually is the value created paid for?
How is this distributed in the network?
f. How do you experience collaboration and competition on different levels among partners?
Think of the Networked Business Model-level and service-level.
g. Is it better for you to have many partners in the network or only a few?
h. Is similarity or diversity of partners required?
i. Do all partners need to be allied with all others?
j. What are strengths / opportunities in the network?
k. What are weaknesses / threats in the network?
l. How sustainable is this networked business model you are part of?
m. What makes up viability in the Internet of Things Networked Business Model?
n. Validation of proposed architecture.
4. Internet of Things questions.
a. Where should the calculations of the data of Internet of Things be done? Device / Gateway
/ Cloud?
b. Should the devices be rented of owned by the customers?
c. What type of payment do you think will dominate? Ownership / Subscription / End-usage
5. Did you miss elements in the discussion so far? If so, which one?