eindhoven university of technology master the … en mijn medebewoners van studentenhuis ‘hotel...
TRANSCRIPT

Eindhoven University of Technology
MASTER
The moderating role of consumers' need for uniqueness on context-dependent choice
'the high-quality-focus'
Oudenhooven, P.G.J.
Award date:2009
DisclaimerThis document contains a student thesis (bachelor's or master's), as authored by a student at Eindhoven University of Technology. Studenttheses are made available in the TU/e repository upon obtaining the required degree. The grade received is not published on the documentas presented in the repository. The required complexity or quality of research of student theses may vary by program, and the requiredminimum study period may vary in duration.
General rightsCopyright and moral rights for the publications made accessible in the public portal are retained by the authors and/or other copyright ownersand it is a condition of accessing publications that users recognise and abide by the legal requirements associated with these rights.
• Users may download and print one copy of any publication from the public portal for the purpose of private study or research. • You may not further distribute the material or use it for any profit-making activity or commercial gain
Take down policyIf you believe that this document breaches copyright please contact us providing details, and we will remove access to the work immediatelyand investigate your claim.
Download date: 19. May. 2018

The moderating role of consumers' need for uniqueness
on context-dependent choice:
‘The high-quality-focus’
P.G.J. Oudenhooven


Running head: CNFU AND CONTEXT EFFECTS
The moderating role of consumers' need for uniqueness on context-dependent choice:
‘The high-quality-focus’
P.G.J. Oudenhooven
s031935
Eindhoven University of Technology
School of Innovation Sciences
HTI group
Supervisors:
Dr. ir. Martijn C. Willemsen (1st supervisor)
Dr. Jaap R. C. Ham (2nd supervisor) 2009-11-16

Acknowledgements
With this master thesis, I complete both my empirical research and a fantastic period
at Eindhoven University of Technology. Therefore, I would like to thank some people for
their inspiration and support throughout my entire study, not just, because it is a custom to do
so, but because I sincerely mean it. As most of these people are Dutch, I prefer to express my
appreciation in Dutch.
In de eerste plaats bedank ik mijn eerste begeleider, dr. ir. Martijn Willemsen. De
uitzonderlijke begeleiding die je me hebt geboden is iets waar menig afstudeerder van
droomt. Je hebt me op voortreffelijke wijze geïnspireerd, gedoceerd en waar nodig
gecorrigeerd. Verder wil ik mijn tweede begeleider, dr. Jaap Ham, bedanken voor zijn
kritische en eerlijke blik op deze scriptie.
Zowel de materiële als immateriële steun van mijn ouders en de ouders van Tamara,
heeft er voor gezorgd dat ik deze opleiding überhaupt heb kunnen voltooien. Jacqueline,
Adry, Anita en Ad, dergelijke steun is niet zo vanzelfsprekend als door jullie vaak werd
gesuggereerd. Ik ben jullie dan ook zeer erkentelijk. Daarnaast hebben een aantal personen op
verschillende manieren pro Deo hun steentje bijgedragen: Jolien Peters, Lieke Janssen,
Berend van den Berge, Coen Oudenhooven, David van der Pol, Johan Datema, Koen
Crommentuijn en mijn medebewoners van studentenhuis ‘Hotel Saint-Tropez’, waarvan in
het bijzonder Bart Hofman en Iain Aitchison. Ik heb jullie hulp zeer gewaardeerd.
Tamara, mijn studie is ook voor jou een enorme investering geweest. Je steun
tijdens het onderzoek naar ‘voorkeuren’ en ‘beslissingen’ heeft de voorkeur voor jou alleen
maar versterkt (gelukkig hebben wij onze keuze al lang gemaakt).
Dit onderzoek heeft andermaal bewezen dat de beste dingen niet volledig op
individuele basis ontstaan, maar altijd in samenwerking met anderen.
Bedankt.
I

Abstract
Context effects influence many decisions we make in everyday life. In some cases,
modifying the context by adding new alternatives to an existing choice set changes our
preferences of the original options, even if the alternative seems irrelevant. For example
research on decision making and consumer behaviour showed that the compromise effect and
the attraction effect systematically violate most rational choice models (in both cases the
addition of a new alternative, increases shares of one of the original choice options).
Simonson and Nowlis (2000) have shown that the strength of the compromise effect
depends on the individual difference measure ‘need for uniqueness’ (NFU). The current paper
investigates how NFU moderates context-dependent choices (for as well the compromise
effect as the attraction effect). It is expected that people with high NFU have a strong
preference for quality over price (the high-quality-focus). This would particularly facilitate
choosing between equally attractive choice options, like with the compromise effect. The
existence of the high-quality-focus is tested by looking at the influence of NFU on two
different versions of the compromise effect and the attraction effect, and by studying the
information acquisition processes.
Most data supports the high-quality-focus into the right direction. Nevertheless, in
contrast to our hypotheses, there is not enough statistical evidence to confirm the existence of
it. The information acquisition data does not show significantly more attention to the ‘quality’
than to ‘price’ for people with high NFU. This questions the role of NFU as an important
moderator of context-dependent choice.
II

III
Index
Acknowledgements I
Abstract II
1. Introduction 1
2. Context effects 4
2.1 Compromise and attraction effect 4
2.2 Moderating variables 9
2.3 Need for uniqueness 10
2.4 Hypotheses 11
3. Method 18
3.1 Participants 18
3.2 Stimuli, design, and procedure 18
4. Results 21
Discussion 35
References 38
Appendix I: CNFU scale translation and validation 43
Appendix II: Translated CNFU-S survey 46
Appendix III: Pilots 48
Appendix IV: Online MouselabWEB experiment 50
Appendix V: Experimental design 54
1. Introduction
In an online shopping environment, marketers do not have the same marketing tools
at their disposal as in a physical shop. Internet shops lack the possibility to influence
consumers with the smell of fresh bread or the soft feel of a new blanket. Then again, the
internet does offer better control over what non-physical information people get and in which
configuration (context) it is offered. There are countless ways of describing products (list
properties, compare attributes, describe advantages and disadvantages or show consumer
reviews: Chen & Xie, 2008; Kleinmuntz & Schkade, 1993; Schkade & Kleinmuntz, 1994)
and altering the context (presenting products alone or in an array with other options, changing
the layout of the web shop or selecting defaults: Chang & Liu, 2008; Johnson, Bellman &
Lohse, 2002; Johnson & Goldstein, 2004; Samuelson & Zeckhauser, 1988). With the internet
increasingly becoming a market for consumer decisions, this context becomes more
important.
This research focuses in particular on two remarkable ways in which context
influences choices people make (context effects) and it explores the mediating role of the
individual variable ‘need for uniqueness’ (NFU; Snijder & Fromkin, 1977). These context
effects concern the influence of other available options (the compromise effect and the
attraction effect). Both the compromise and the attraction effect show that adjusting the
context by adding a new alternative to the existing choice set, enhances the popularity of one
of the original options (Simonson, 1989; Huber, Payne & Puto, 1982).
However, individuals differ strongly in how they are affected by these context
effects. Continuing research of Simonson and Nowlis (2000), this paper explores the
influence of NFU on the compromise and the attraction effect. That is, Simonson and Nowlis
(2000) demonstrate that people with high NFU show a relatively smaller compromise effect
than people with low NFU. However, the mechanisms causing these differences might not be
1

as proposed by Simonson and Nowlis (2000). They claim that people with high NFU use
unconventional reasons and therefore prefer both extreme options (the option with the lowest
quality and lowest price and the option with the highest quality and highest price) and not the
middle compromise option. This paper proposes that the difference in compromise effect
results from the fact that people with high NFU prefer quality to price (Tian, Bearden &
Hunter, 2001) and thus an asymmetrical choice distribution is expected (lowest shares for low
quality options, medium shares for the middle options and highest shares for the options with
the highest quality). This is what we label the ‘high-quality-focus’. Indeed, earlier research
(Oudenhooven & Willemsen, 2009) showed this choice pattern. By analysing two versions of
the compromise effect (promoting an option with relative low quality and promoting an
option with high quality) and two versions of the attraction effect (also promoting both the
high and the low quality options) the high-quality-focus is tested. Additionally, this paper also
looks at differences in information processing during decision making to gain additional
insights into how NFU influences context effects. We argue that people with high and low
NFU might show different search behaviour.
As companies are able to track click streams of people visiting their web shop, they
often experiment with presentation of options, to see which format provides the highest
revenues. With the increasing possibilities to personalise the web environment adapting it to
the individual visitor, this knowledge can be applied to adaptive web shops. With this
knowledge, one could personalise websites to meet the same goals among different types of
consumers.
Companies already use compromise and attraction effects for different reasons and
it is nowadays almost commonplace on the internet to offer specific information depending on
who visits the website. Visitor characteristics are measured by simply asking the visitor to fill
in some personal information, or by tracing information about the geographical location
associated to the IP-address.
2

To be able to specify choice options depending on the amount of need for
uniqueness it is necessary to ‘detect’ the need for uniqueness of the visitor. Therefore, in
addition, this paper examines potential differences in search behaviour between high NFU
and low NFU. This way it will be possible to measure the amount of NFU of the visitor and
act accordingly.
The goal of this research is to explore how differences in NFU moderate context
effects in consumer decision-making. Discovering boundary conditions by answering this
question will bring better understanding of human decision-making.
The next chapter outlines the theoretical context of this research. Compromise and
attraction effects, moderating variables and specifically the moderating variable ‘need for
uniqueness’ are important subjects leading to the hypotheses, describes in section 2.4. The
setup and the experimental design are discussed in chapter 3, followed by a summary of the
results and hypotheses testing (chapter 4). Finally, this thesis concludes with a discussion and
some final remarks.
3

2. Context effects
In the field of decision-making and consumer behaviour, a substantial amount of
research is dedicated to investigating the compromise effect, the attraction effect and
moderating variables influencing these context effects. To understand findings from
Simonson and Nowlis (2000) (the starting point of the present paper), it is important to first
understand the compromise effect. The ‘alternative explanation’ this paper offers for the
influence of NFU on the compromise effect, is tested by applying it to both the compromise
effect and the attraction effect. Therefore, this section outlines the theoretical framework
including the compromise effect, the attraction effect, moderating variables (in particular need
for uniqueness) and section 2.4 explains how different hypotheses evolved from it.
2.1 Compromise and attraction effect
Context effects show the influence of the decision context on peoples’ preferences
and on choices people make. The compromise and attraction effect (resp. Simonson, 1989;
Huber et al., 1982) are especially interesting, because these phenomena do not match most
rational choice models. ‘Independence of irrelevant alternatives’ (Luce, 1959) suggests that
the addition of an irrelevant alternative to an existing choice set should only take shares of
these options relative to their original shares. ‘Regularity’ (Luce, 1977) states that the addition
of an alternative to a choice set cannot increase the relative share of one of the original
options. The compromise and attraction effect systematically violate these principles: after the
addition of a new alternative to an existing choice set, both the attraction effect and the
compromise effect show an increase in shares of one of the original options and/or the ratio of
the original options changes.
Attraction and compromise effects are typically observed when the available choice
options imply a trade-off between different attributes. Figure 1 shows a simplified graph of
4

this principle. In the illustration the indifference curve1 (Edwards, 1954) represents a virtual
trade-off between attribute 1 and attribute 2, such that all options on the line are equally
attractive. When we look for instance at the attributes ‘price’ and ‘quality’, a decrease in price
is offset by a decrease in quality, keeping options A and B in theory equally attractive.
Figure 1. Simplified illustration of the compromise and attraction effect.
The compromise effect is observed when a choice set (A and B) is extended with an
extreme option (C1 or C2) on the same indifference curve. Theoretically, options A, B and C1
or C2 should be just as attractive. However, the location of option C1 or C2 on the indifference
curve makes one of the original options a compromise option (B when C1 is added and A
when C2 is added). Interestingly, when an option becomes a compromise option, it gains share
compared with the original two-options set (Simonson, 1989).
1 Towards the extremes, the indifference curve follows a hyperbolic shape and not a linear one like in
figure 1. This explains the name ‘indifference curve’. However, since we operate on a relatively small
section of the curve, a linear representation suffices.
5

The attraction effect is observed when decoy D1 or D2 is added to choice set AB.
This increases share of the relative superior alternative (B when decoy D1 is added and A
when D2 joins the set) (Huber et al., 1982). The decoy option is an option that no rational
decision maker ever chooses. Still this ‘irrelevant’ option could have a big influence on the
share of the superior alternative (the dominating option). To be inferior to the existing choice
options, decoys D1 or D2 should be placed within the shaded areas of Figure 1.
In essence, the compromise effect and the attraction effect show the same cause-
and-effect pattern: adding a third option to an existing choice set of two options, subsequently
increases the share of the adjacent option resolving the difficult trade-off. However, as Dhar
and Simonson (2003), Sheng, Parker and Nakamoto (2005) and Yoon and Simonson (2008)
discuss, it might not be legitimate to assume that the underlying mechanisms causing these
effects are the same. The attraction effect is considered a ‘perceptual’ effect; with the specific
configuration of an attraction choice set, the advantage of the target over the decoy is obvious.
Choosing from a ‘compromise choice set’ requires more complex cognitive processing. In
this situation, there is no alternative superior to another. People choosing the compromise
option explain their choice comparing it with both the extremes. Choosing involves reasoning
and comparing of all the options. Therefore, the compromise effect is considered a ‘cognitive’
effect (Sheng et al., 2005).
Figure 2 shows examples of real life choice options, placed in a compromise and an
attraction structure.
6

Figure 2. Real life examples of an attraction context (top panel) and compromise context (bottom panel).
The addition of a decoy D1 or D2 (attraction) makes the decision to choose the
adjacent option explainable for one of the two original options. This option is superior on at
least one of the attributes of the decoy: like the first image in Figure 2. Why would one
choose ‘Classico’ if for the same price one could get the (seemingly higher quality)
‘Delicato’? However, when we look at choice set ABC1 or ABC2 (compromise choice sets) it
7

is not that clear cut. There are no obvious superior options - as with the attraction effect -
since all three options are placed on the same indifference curve (second image Figure 2).
Theoretically, they are equally attractive.
There is no general agreement about what causes people to prefer the compromise
option in this difficult situation. Different explanations exist for the underlying mechanisms
causing the compromise effect (Huber & Puto, 1983; Simonson, 1989; Simonson & Tversky,
1992; Sheng et al., 2005). According to Simonson (1989) and Huber and Puto (1983) people
choose the compromise option because of a search for reasons and the need to be positively
evaluated by others. Later Simonson and Tversky (1992) introduced a more fundamental
explanation based on ‘loss aversion’, or as they call it ‘extremeness aversion’. To clarify this
well accepted explanation we look for instance at choice set ABC1. ‘Extremeness aversion’
states that options C1 and A have only minor advantages and disadvantages compared with
option B, but when we compare option A with C1, these advantages and disadvantages are
twice as big. Compromise option B does not have these big disadvantages relative to either of
the extremes and since disadvantages loom larger than advantages (loss-aversion), option B
seems the better choice.
These context effects are very robust. Kivetz, Netzer and Srinivasan (2004a &
2004b) even integrated these effects in new choice models, ignoring underlying cognitive
processes causing these context effects. Their mathematical models are based on the notion of
diminishing sensitivity (Meyer & Johnson, 1995) and prospect theory (Tversky & Kahneman,
1991). In search for better explanations and boundary conditions, a lot of research focused on
moderating variables that influence these context effects. The examination of moderating
variables undertaken in this thesis can add to a robust explanation of both the attraction and
compromise effects.
8

2.2 Moderating variables
In the past, the attraction effect got considerably more research attention than the
compromise effect. Working towards a better understanding of the mechanisms causing the
compromise effect, recent research has focused primarily on all sorts of moderating variables
that influence this context effect. Some existing research focused on the decision task itself
(e.g. Dhar, Nowlis & Sherman, 2000; Dhar & Simonson, 2003; Chang & Lui, 2008;
Simonson & Tversky, 1992). Others emphasise the influence of prior knowledge of the choice
options on the compromise effect and the choice processes (Bettman, Johnson & Payne, 1990;
Sheng et al., 2005) The more expertise/experience people have with a product category, the
better they interpret the describing attributes, particularly when choice sets have a
compromise structure (Sheng et al., 2005). This decreases the compromise effect and
therefore ‘expertise/experience’ is also taken into account during this research. Furthermore,
certain cultural values seem to have moderating influence on the compromise effect (Briley,
Morris & Simonson, 2000; Simonson, 1989).
In addition, several individual differences moderate the compromise effect
(Simonson & Nowlis, 2000; Mourali, Böckenholt & Laroche, 2007). Simonson and Nowlis
(2000), the base for this paper, were one of the first to investigate the individual difference
‘need for uniqueness’ and the influence on the compromise effect. They showed that people
with low NFU show a significantly larger compromise effect than people with high NFU.
Shafir, Simonson and Tversky (1993) illustrated that consciously considering reasons as a
base for choices increases the share of a compromise option. Simonson and Nowlis (2000)
argued that this conscious reasoning is an important part of the explanation for the influence
of NFU on the compromise effect. The current study explores the underlying processes of the
influence of NFU on the compromise effect, because explanations from Simonson and Nowlis
(2000) are incomplete (as argued in section 2.4). To explain this influence of NFU on the
compromise effect, it is important first to understand the concept of need for uniqueness.
9

2.3 Need for uniqueness
Like Simonson and Nowlis (2000), the moderating variable of interest in the current
thesis is ‘need for uniqueness’. Snijder and Fromkin (1977) proposed ‘need for uniqueness’
(NFU) as a term for being different or distinctive from the average social environment. Need
for uniqueness was used as a substitute for terms like ‘abnormality’ or ‘deviance’ that carry
negative connotations. Every individual strives for uniqueness to some extent, ranging from
being “like everybody else” to “being as different and distinct from others as possible”
(Ruvio, 2008, p. 445). Snijder and Fromkin developed a scale to measure the amount of
uniqueness, consisting of 31 items divided over three factors. The first factor measuring the
lack of concern about others’ evaluations of one’s ideas, factor two measures the desire to
diverge from existing rules and the third factor measures a person’s willingness to (publicly)
defend his or her beliefs. Since NFU is something that is best expressed by showing and using
consumer products (clothing, cars, watches, etc.; Belk, 1988), Tian et al. (2001) revised the
NFU scale into a measure of ‘consumer need for uniqueness’ (CNFU). Another reason for the
development of this new measure was the lack of empirical support from different consumer
investigations for the original NFU scale. The revised items formed a specific application of
the original NFU-items. Tian et al. (2001) defined CNFU as: “The trait of pursuing
differences relative to others though the acquisition, utilization, and disposition of consumer
goods for the purpose of developing and enhancing one’s self-image and social image” (p.
52). This measure consists of factors, comparable to the original: ‘creative choices’,
‘unpopular choices’ and ‘avoidance of similarity’. The CNFU-scale showed considerably
better validity and reliability and it gained good empirical support. The only disadvantage was
the lack of usability. The scale of 31 items was too ‘bulky’ to be incorporated in combined
surveys. Ruvio, Shoham and Brenčič (2008) developed a shortened version, named the
‘consumers’ need for uniqueness short-form’ (CNFU-S), preserving the original concept. The
CNFU-S scale consists of 12 items, 4 items per factor. The applicability increased, not only
because of the reduced amount of items, but also because this scale was tested in three
10

different countries. The present paper will use this measure, but because it is quite new, the
internal consistency is checked and a factor analyses will verify the factor structure.
Throughout this thesis, the scale is abbreviated as ‘CNFU’.
2.4 Hypotheses
Simonson and Nowlis (2000) illustrate that participants with high NFU show a
weaker compromise effect than people with low NFU. According to Simonson and Nowlis
people with low NFU want to be evaluated as making conventional or not novel choices.
People think of conventional reasons for choosing compromise options as for example “Both
price and features are important, so I’ll take the middle one,” or “The middle option combines
the two factors” (p. 55). Simonson and Nowlis claim that people with low NFU use these
reasons to justify their choices and people with high NFU use unconventional reasons
(anything but the reasons just mentioned) which causes them to avoid the compromise option.
Therefore, Simonson and Nowlis argue that people with high NFU prefer the extreme options
(e.g. option A and C from choice set ABC1 in Figure 1) but not the compromise option.
Simonson and Nowlis fail to show the actual choice data that led to their conclusions. They
only indicate differences in compromise effect and change in shares of the compromise
options, but they do not show the distribution of shares among the three choice options (A, B
and C). Their paper describes that the increase of shares of the compromise option (after the
addition of a third option to the choice set) is bigger for people with low NFU than for people
with high NFU. To be able to draw conclusions about the cause of this phenomenon, one has
to know the distribution of shares over the three options. The assumption that ‘people with
high NFU use unconventional reasons causing them to choose both extreme options’ cannot
be checked because Simonson and Nowlis only describe shares of the middle compromise
option; they do not show information about shares of the two extreme options.
Earlier research (Oudenhooven & Willemsen, 2009) reproduced part of the study of
Simonson and Nowlis (2000). The most important differences from the original study were
11

the use of a scale for consumers need for uniqueness (CNFU) instead of NFU and people first
had to match the choice options before choosing an option. This research resulted in the same
main conclusion as the one from Simonson and Nowlis. People with low CNFU indeed
showed a stronger compromise effect than people with high CNFU. However, choice
frequencies showed a rather interesting pattern. Low CNFU behaved as expected; low shares
for the extreme options and high shares for the middle compromise option. People with high
CNFU on the other hand, prefer the option with the highest price and best quality, followed
by the compromise option, and the option with the lowest price and quality was chosen the
least often. This directional preference differs from the suggestion of Simonson and Nowlis,
that high CNFU would prefer both extreme options.
A possible explanation for this asymmetrical distribution of high CNFU appeared
from literature review on individual differences and need for uniqueness (Snyder & Fromkin,
1977; Belk, 1988; Tian et al., 2001). This review indicates another, more obvious reason for
the observed difference in compromise effect, inherent to the application of choice options
described on the attributes ‘price’ and ‘quality’ (like Simonson and Nowlis do). People with
high NFU have the need to show their uniqueness to their social environment. These people
strive for reactions from others to confirm their uniqueness (even if reactions are negative).
Consumer products/services are pre-eminently suitable to serve this goal. The self-concept of
someone who strives to be different will be “sustained and buoyed if he believes the good he
has purchased is recognized publicly and classified in a manner that matches and supports his
self-concept” (Grubb & Grathwohl, 1967, p. 25). Others could observe possessions or the use
of possessions/services. In that sense, choosing and using the ‘right’ products can make all the
difference. When choice options are only defined by their ‘price’ and ‘quality’, then one of
these attributes (quality) could be observed by the social environment and the other attribute
(price) not. Combined with findings from Oudenhooven and Willemsen (2009), it is expected
that people with high CNFU have a predetermined preference for ‘quality’ to ‘price’ (the
‘high-quality-focus’), something people with low CNFU do not have. The notion of a high-
quality-focus differs fundamentally from the idea’s of Simonson and Nowlis (2000).
12

Especially the absence of an obvious preference like with a compromise choice set, resulting
in a difficult decision, would be the ideal situation in which the high-quality focus provides ‘a
way out’.
Based on the above, we expect that the high-quality-focus would result in different
shares for high CNFU and low CNFU in initial choice set AB. People with high CNFU would
select high quality option B (Figure 1) more than people with low CNFU. Simonson and
Nowlis (2000) do not predict specific differences in shares between option A and option B.
Since the AB choice is the base-rate for calculating the effect size of the context effects, it
might also be part of the explanation of differences in compromise effect, found by Simonson
and Nowlis (2000). Despite the drawbacks of self-report (Dobbs, Sloan & Karpinski, 2007;
Lilienfeld & Fowler, 2005) people might even be able to (directly) report how important they
find price versus quality. If so, a conscious consideration of the importance of price and
quality could give a direct indication in favour of the high-quality-focus. Therefore:
H1: People with high CNFU prefer ‘quality’ to ‘price’, relative to people with low
CNFU.
Unfortunately, the experimental designs of Simonson and Nowlis (2000) and
Oudenhooven and Willemsen (2009) do not allow for testing the existence of the high-
quality-focus. Both these experiments used a setup comparable with choice set ABC1 (Figure
1), in which choice set AB is extended with a high quality alternative, C1. With these designs,
the high-quality-focus influences the compromise effect the same way as predicted by
Simonson and Nowlis: Option C1 is one of the two extremes and it is the option with the
highest quality. According to both theories (Simonson and Nowlis and the high-quality-
focus), option C1 takes most of its share from compromise option B (option B is not an
extreme and it does not have the highest quality). Therefore, this paper extends these
experiments by also looking at the addition of low quality option C2. When the ‘added’ option
is an extreme with the lowest quality and price (C2 in choice set ABC2), the theories predict
13

different outcomes. For high CNFU participants, Simonson and Nowlis would in this
situation, again predict that mainly the compromise option (this time option A) loses share to
option C2. However, according to the high-quality-focus people with high CNFU would
initially prefer high quality option B, but the addition of low quality option C2 is no better
alternative. Thus, consistent with ‘independence of irrelevant alternatives’ (Luce, 1959), it is
expected that the relative share of options A and B is not affected and that option C2 only
takes proportional share. Then again, people with low CNFU would show a ‘normal’
compromise effect for both choice set ABC1 and ABC2. As Drolet, Simonson and Tversky
(2000) show, the compromise effect should be independent of the location of the choice set
on the indifference curve. The effective difference between choice set ABC1 and ABC2 is a
slight shift along the indifference curve. In general, choice set ABC2 enables to see if the
compromise effect is bounded to an absolute reference point. Testing these expectations will
be done at three levels. First, to verify the main result from Simonson and Nowlis (2000) the
average compromise effect from low CNFU and high CNFU is compared. Second, for low
CNFU and high CNFU the effect sizes of both ABC1 and ABC2 are evaluated. Finally, we
focus on the difference in distribution of shares among all choice options from the
compromise choice sets.
H2a: People with high CNFU show a smaller compromise effect than people with
low CNFU.
When comparing the separate effect sizes from choice set ABC1 and ABC2, no
significant differences are expected for people with low CNFU, but for people with high
CNFU the compromise effect will be smaller in choice set ABC1 than in choice set ABC2.
This comparison enables to test the explanation by Simonson and Nowlis (2000) with the
high-quality-focus explanation.
14
H2b: People with high CNFU show a smaller compromise effect after the addition
of a high quality alternative (ABC1), than after the addition of a low quality
alternative (ABC2).
Finally, we focus on shares of the different choice options independent of the AB
choices. This enables to, explicitly, test the explanations from Simonson and Nowlis versus
the high-quality focus. The high-quality-focus predicts a different origin for the dissimilarity
in compromise effect between high CNFU and low CNFU, than Simonson and Nowlis (2000)
do. One way to (statistically) test the different explanations, is by comparing the shares of the
low quality options with the high quality options. According to Simonson and Nowlis (2000)
the shares of high and low quality options for people with high CNFU do not differ (these
people prefer extreme options independent which of the two extremes). In contrast, the high-
quality-focus predicts an asymmetrical distribution. That is, bigger shares for the high quality
option than for the low quality option. Therefore hypothesis 2c states:
H2c: According to the high-quality-focus the relative difference in choice shares
between the high and low quality options of a compromise set is larger for
high CNFU than for low CNFU, in favour of the high quality alternative.
Exploration of different versions of an attraction effect in combination with high
and low CNFU provides an additional opportunity to analyse the existence of the high-
quality-focus. The attraction effect is a more robust context effect than the compromise effect,
thereby offering a better chance to demonstrate behaviour contrary to ‘independence of
irrelevant alternatives’. Like with the compromise effect, the attraction effect shows by
promoting option A or by promoting option B. The specific setup of D1 and D2 (Figure 1)
makes it possible to compare both results. Decoy D1 promotes high quality option B, whereby
the attraction effect and the high-quality-focus complement each other. In case of ABD2,
decoy D2 promotes low quality option A, causing opposing forces between the attraction
15

effect and the high-quality-focus, predicting different outcomes for high CNFU. It is known
that in general decoys increase shares of higher-quality targets more than they increase shares
of low-quality targets (Heath & Chatterjee, 1995), but additional to that difference, the current
paper also suggests differences in target shares depending on CNFU. When a choice set
promotes the option with low price and quality, people with high CNFU face the trade-off
between a ‘high-quality-focus’ and the ‘strength’ of the context effect.
H3: For people with high CNFU the attraction effect is reduced when a decoy
targets the low quality alternative.
A fourth way the high-quality-focus would show is by means of the decision
process. For this purpose, we collect information acquisition data using process tracing.
Choosing from a compromise choice set requires complex cognitive processing, ‘all choice
options are equally attractive’ (Yoon & Simonson, 2008). According to the theory of the
high-quality-focus, one way to avoid this effort is to use a shortcut. If people use the heuristic
of preferring ‘quality’ to ‘price’, then this would simplify their decision. It would decrease the
amount of attention (viewing time and frequency) for some of the information about the
choice options. When studying why people with high CNFU show a smaller compromise
effect, one has to focus on why people with high CNFU do not choose the compromise
option. Again, Simonson and Nowlis (2000) predict that the decision processes of high CNFU
people choosing any of the extreme options does not differ; since both groups would use the
same reasoning. However, the high-quality-focus predicts an interaction effect of CNFU and
the choice people make on the amount of attention for the describing information. The high-
quality-focus is an internalised shortcut/ a standard decision rule: one only has to find the
option with the best quality. A quick scan should therefore be enough to make a decision,
while in general choosing the compromise option requires comparing all options, a complex
and time consuming cognitive process. Consequently, an interaction effect between CNFU
and people choosing the low quality option versus people choosing the high quality option is
16

expected. Relatively large amount of attention is expected for people with high CNFU,
choosing the low quality alternative and less attention for those choosing the high quality
alternative. The opposite is expected for low CNFU.
H4: People with high CNFU, choosing the high quality option, pay less attention
to attribute information than those choosing the low quality option, relative to
people with low CNFU.
An important application of hypothesis 4 would be the possibility to check what
‘kind’ of person visits a web shop, based on his clicking behaviour. One could alter the virtual
shopping environment, adapting it to suit each particular visitor.
17

3. Method
3.1 Participants
147 Participants took part in the experiment (77 men and 70 women, age ranging
from 20 till 60). Of those, 145 were included in the analyses. Two participants were left out,
since they did not attend to all the information necessary to base a decision on, or because
they finished assignments unrealistically fast. The 145 participants were split into a group
with low CNFU (n=70) and a group with high CNHU (n=75), based on a median split at a
CNFU-value of 34 (participants with a CNFU-value of 33 are part of the group with low
CNFU and a value of 34 is add to the high CNFU group). The amount of CNFU was
measured with a Dutch version of the CNFU-S scale from Ruvio et al. (2008). Translation
and validation the CNFU-S scale (Cronbach’s α = 0,747) is explained in more detail in
appendix I & II. The experiment took about 10 minutes to complete, and participants were
rewarded €1,50.
3.2 Stimuli, design, and procedure
To construct suitable stimuli (choice options A, B, C1, C2, D1 and D2, for 5 different
product categories) several pilot studies were conducted (Appendix III). This resulted in the
product categories and choice options described in Table 1.
18

Choice options:
Product category: Attribute: A B C1 C2 D1 D2
TFT wide screen (product cat.1)
Price € 150,- € 183,- € 216,- € 117,- € 193,- € 160,- Size (inch) 22,0 24,0 26,0 20,0 23,4 21,4
Mobile internet (product cat.2)
Price (per month) € 31,- € 37,- € 43,- € 25,- € 39,- € 33,- Download speed (Mb/sec) 1,7 2,3 2,9 1,1 2,1 1,5
Projector (product cat.3)
Price € 950,- € 1070,- € 1190,- € 830,- € 1110,- € 990,- Image quality (1-10) 7,0 8,0 9,0 6,0 7,7 6,7
Folding bike (product cat.4)
Price € 152,- € 200,- € 248,- € 104,- € 217,- € 169,- Weight (kg) 12,0 9,0 6,0 15,0 10,1 13,1
Food processor (product cat.5)
Price € 210,- € 240,- € 270,- € 180,- € 250,- € 220,- Quality (1-10) 7,0 8,0 9,0 6,0 7,7 6,7
Table 1. Specified product categories and choice options.
The experiment consisted of nine tasks that were presented in an online web-
environment, designed with MouselabWEB (Willemsen & Johnson, 2008) (Appendix IV).
MouselabWEB enables to monitor information acquisition processes of the participants. It
indicates which information people use to make a decision, by registering how long people
pay attention to that information, how many times they attend to the information and it shows
the transitions between the different types of information. To get acquainted with a task
designed with MouselabWEB, participants were first presented with a practice task. This task
showed that the information about price and quality from the different choice options is
masked behind ‘boxes’. When participants move the cursor of the mouse over these boxes,
they ‘open’ and the information is displayed (see Figure 3). Only data from boxes, opened for
more that 150 milliseconds is used for the analyses. In less than 150 milliseconds one would
not be able to read the information. Screenshots of all pages of the experiment are presented
in appendix IV.
19

Figure 3. Screenshot of the practice task.
The setup of the next five decision tasks was the same as in the practice task. In five
different choice sets (AB, ABC1, ABC2, ABD1 and ABD2; Figure 1), divided over five
product categories (TFT wide screen, mobile internet for laptop, projector, folding bike and
food processor), participants were asked to choose their favourite option. That is, participants
made five choices, each in a different choice set, and for a different product category. Choice
set and product category were partially counterbalanced using a ‘Latin squares’ design with
twenty-five conditions for ‘between subject research’ (see Appendix V for a detailed
overview). Presentation order of the attributes and the options in the display was randomized.
The choice assignments were followed by two pages measuring the price-partworths
(P-partworths) and the quality-partworths (Q-partworths) of the three choice options. Each
participant got the product categories presented in the same order as in the choice
assignments. We did not analyse these partworths, as many subjects indicated in the comment
section that they did not understand the parthworth questions.
Next, participants were asked to report on a 5-point scale, the relative importance of
price versus quality of each product category. Experience/expertise with the product
categories was measured on a 5-point scale, ranging from ‘no experience at all’ to ‘very
experienced’.
20

4. Results
Since part of this paper has an explorative character, some findings are beyond the
expectations as described in section 2.4. Therefore, some results are explained with further
elaboration.
Testing hypothesis 1: People with high CNFU prefer ‘quality’ to ‘price’, relative to
people with low CNFU.
To verify hypothesis 1 three different tests are performed. First, the importance
measure for ‘price’ versus ‘quality’ is compared between low CNFU and high CNFU.
Second, we looked at differences between low CNFU and high CNFU in attention for the
attributes ‘price’ and ‘quality’ when choosing from compromise choice sets. Finally, shares of
choice set AB from low CNFU are compared with high CNFU.
With a mean importance for low CNFU of 3,24 (STD = 0,61) and for high CNFU of
3,31 (STD = 0,70) people with low and high CNFU both prefer ‘quality’ a bit more than
‘price’ (scale ranging from 1 till 5). However, repeated measures ANOVA revealed other
interesting results, best interpreted with a graphical display:
21
low CNFU high CNFU
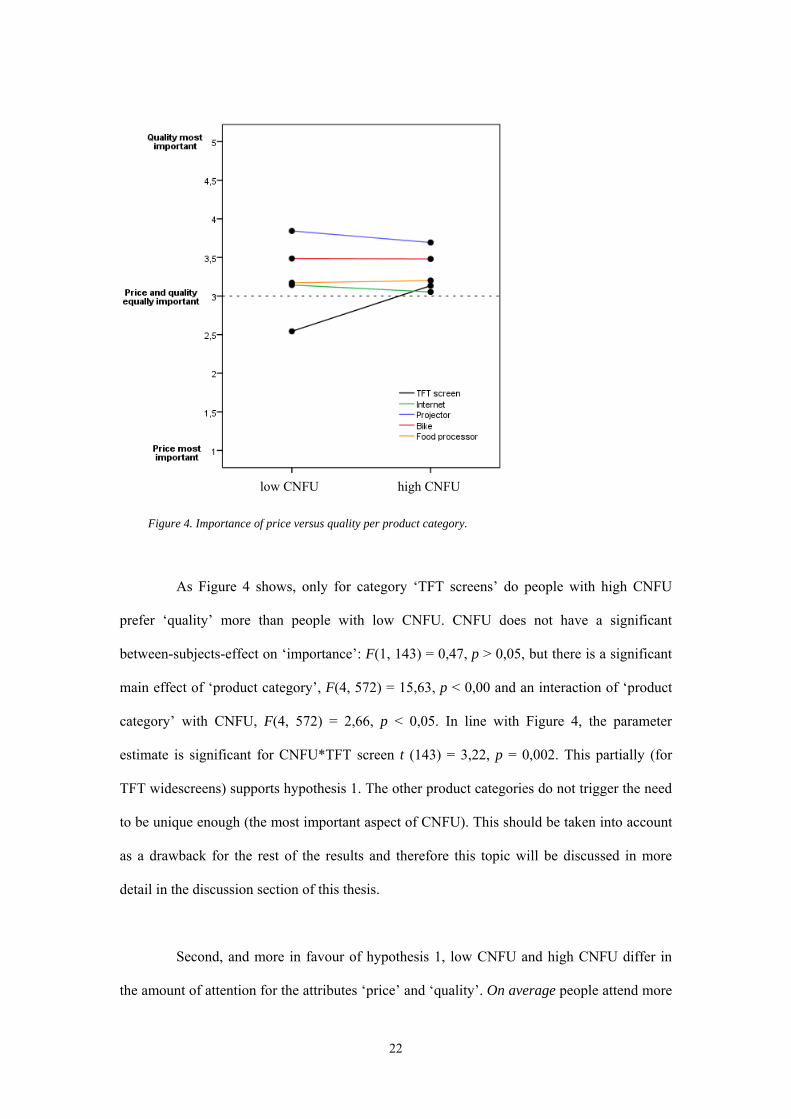
Figure 4. Importance of price versus quality per product category.
As Figure 4 shows, only for category ‘TFT screens’ do people with high CNFU
prefer ‘quality’ more than people with low CNFU. CNFU does not have a significant
between-subjects-effect on ‘importance’: F(1, 143) = 0,47, p > 0,05, but there is a significant
main effect of ‘product category’, F(4, 572) = 15,63, p < 0,00 and an interaction of ‘product
category’ with CNFU, F(4, 572) = 2,66, p < 0,05. In line with Figure 4, the parameter
estimate is significant for CNFU*TFT screen t (143) = 3,22, p = 0,002. This partially (for
TFT widescreens) supports hypothesis 1. The other product categories do not trigger the need
to be unique enough (the most important aspect of CNFU). This should be taken into account
as a drawback for the rest of the results and therefore this topic will be discussed in more
detail in the discussion section of this thesis.
Second, and more in favour of hypothesis 1, low CNFU and high CNFU differ in
the amount of attention for the attributes ‘price’ and ‘quality’. On average people attend more
22

to the attribute ‘price’ than ‘quality’. Nevertheless, the high-quality-focus predicts that for
people with high CNFU this difference would be reduced. Especially when people deal with a
compromise choice set, decision-making takes a lot of cognitive effort. It is expected that
those with high CNFU, avoid the effort by using the high-quality-focus as a shortcut.
Consequently, one compares the information about quality to detect the option with the
highest quality. To be able to test whether the interaction effect is significant, a repeated
measures ANOVA is applied with a 2*2*3 [2 choice sets (ABC1 and ABC2), 2 attributes
(price and quality), 3 options (low, medium and high quality/price)] within factor design. The
dependent variables are ‘time’2 and ‘frequency’ represent the ‘attention for the information’.
Combining the data from choice set ABC1 and ABC2, indeed shows the predicted interaction
effect (Figure 5). Unfortunately, for the dependent variable ‘time’ the small differences are
not significant and for ‘frequency’ they are only marginal significant. Results for the
interaction of attribute*CNFU are respectively Ftime (1, 136) = 1,017, p > 0,1 and Ffrequency (1,
136) = 3,485, p < 0,1.
2 One of the assumptions for this analysis is a normally distributed dependent variable. The variable
‘time’ is highly positively skewed (skewness ranging from 1,7 till 5,0) and therefore a log
transformation is applied: log_time = ln (time+500 ms). This new measure is normally distributed
(Shapiro-Wilk tests have significance values larger than 0,05) on all cells for both choice set ABC1 and
ABC2.
23

Average time Average frequency
low CNFU high CNFU
low CNFU high CNFU
Figure 5. Average time and frequency for boxes containing the attribute information ‘price’ and ‘quality’.
The third way to (indirectly) verify the high-quality focus is by looking at the
relative shares of choice set AB. The AB-distribution, forming the base rate for the effect size
calculations, should differ for high CNFU and low CNFU. The high-quality-focus states that
high CNFU people prefer high quality options more than low CNFU people do. Indeed,
people with high CNFU choose option B 60% of the times whereas people with low CNFU
choose option B 53% of the time (see Figure 6). A logistic regression shows however that this
difference is not significant. The non-significant residual chi-square statistic of χ2(1) = 0,752,
p = 0,386, indicates that the addition of CNFU does not increase the power of the model to
predict if people choose option A or option B.
All-in-all, the qualitative data seems to be in favour of hypothesis 1. However, the
tests do not show enough statistical support to confirm it.
To verify hypothesis 2a till 3 it is important to keep the experimental design as
shown in Figure 1 in mind. In choice sets ABC1 and ABD1 option B is the target option, but
ABC2 and ABD2 promote option A as the target. In addition, the options representing high
quality/high price and low quality/low price vary per choice set. In choice set ABC1 for
example, option A represents the option with the lowest quality and the lowest price. In
24

choice set ABC2 the low quality/ low price –option is option C1. In general, the choice options
are referred to relative to the other options in the choice set:
Low quality option = LQ
High quality option = HQ
Target option = T
Decoy option = D
Testing hypothesis 2a: People with high CNFU show a smaller compromise effect
than people with low CNFU.
In conformation of hypothesis 2a, frequency distributions of the data indicate a
replication of findings from Simonson and Nowlis (2000). Results from the choice sets are
visualised with Figure 6.
25

Choice set AB
low CNFU high CNFU
low quality high quality
choice
Figure 6. Shares of respectively choice sets AB, ABC1 and ABC2 .
For both compromise choice sets ABC1 and ABC2 the increase in share of the target
option seems larger for low CNFU than for high CNFU. To calculate the effect size we
employ a method by Mourali et al (2007). This method looks at changes in shares of the
target option (option B in choice set ABC1 and A in choice set ABC2) relative to the AB
choice.
low quality target high quality
choice
low quality target high quality
choice
Choice set ABC2 Choice set ABC1
low CNFU low CNFU high CNFU high CNFU
26

Based on Mourali et al. (2007):
( ) ( )( ) ( ) %100
others target;-nonothers target;
others target;targetnontarget; ×
+=−
PPPPC and
. ( ) ( )targetnontarget;targetnontarget;target −− −=Δ PPP C
Where effect size refers to the change in share of the target option relative
to the non-target option as a result of adding option C. For choice set ABC1
represents the increase in shares of option B, while for choice set ABC2 it represents the
increase in option A. Computations in Table 2 and 3 are based on the combined sample of all
five product categories.
targetPΔ
targetPΔ
Low CNFU High CNFU
Shares (%) Choice set ABC1 Choice set ABC2 Choice set ABC1 Choice set ABC2
P(LQ; HQ) 47,1 47,1 40,0 40,0 P(LQ; HQ) 52,9 52,9 60,0 60,0 P(LQ; T,HQ) 29,4 23,5 31,9 27,0 P(T; LQ,HQ) 39,7 39,7 33,3 29,7 P(HQ; LQ,T) 30,9 36,8 34,7 43,2 PC(target; non-target) 57,5 51,9 51,1 40,7
targetPΔ 4,7 4,8 -8,9 0,7
Average targetPΔ 4,8 -4,1 Table 2. Compromise effects for high and low CNFU.
Table 2 shows a smaller average effect size for low CNFU (average low CNFU =
4,8) than high CNFU (average high CNFU = -4,1). The negative effect sizes for choice set
ABC1 (‘ ’ and ‘Average ’), found for people with high CNFU, indicate a
decrease in share of option B relative to option A. These results confirm hypothesis 2a.
targetPΔ
targetPΔ
targetPΔtargetPΔ
27

Testing hypothesis 2b: People with high CNFU show a smaller compromise effect
after the addition of a high quality alternative (ABC1), than after the addition of a
low quality alternative (ABC2).
The fact that choice set ABC1 offers an alternative of even better quality than the
original AB set, caused people with high CNFU to ‘move’ from option B to option C1 (34,7%
of high CNFU selected option C1). As Table 2 shows, this decrease in relative shares of the
compromise option causes the negative effect size of targetPΔ = -8,9. Compared with a
compromise effect of 0,7 for choice set ABC2, this confirms hypothesis 2b. As expected
people with low CNFU show hardly any difference in effect size: targetPΔ ABC1 = 4,7 and
ABC2 = 4,8. The different choice sets hardly influence the effect size ( ) for low
CNFU, but do influence the effect size for high CNFU.
targetPΔ targetPΔ
Testing hypothesis 2c: According to the high-quality-focus the relative difference in
choice shares between the high and low quality options of a compromise set is
larger for high CNFU than for low CNFU, in favour of the high quality alternative.
A short recap: In general, people with low CNFU show larger compromise effects
than people with high CNFU. The fact that high CNFU does not show a compromise effect
with choice set ABC2 and a negative effect with choice set ABC1 was a first indication in
favour of the high-quality-focus. Especially because, unlike high CNFU, the effect size of
people with low CNFU do not differs between ABC1 and ABC2. Choice set ABC2 does not
offer a better alternative for high CNFU, causing these people to preserve the AB-ratio. This
results in only a tiny effect size of 0,7 (Table 2). For people with low CNFU the compromise
effect seems to remain steady between the two scenarios.
However, due to the experimental design, one should be careful interpreting the
effect sizes. Calculating the compromise effect can be done with a between subject design or
a within subject design, as long as one compares choices from the same product category. The
setup of this experiment is a combination of within subject design and between subject design
28

(mixed model/ Latin squares design). Participants chose from an AB-choice-set in one
product category, while choosing from an ABC-choice-set in another category3 (as outlined
in appendix V). Therefore, hypothesis 2c looks at shares of all separate choice options,
independent of the AB choice.
To test the presumption that high CNFU prefer the high quality option of a
compromise set, shares of the low and high quality options are compared (only looking at the
compromise choice sets and not the initial AB choice). Remember that for high CNFU,
Simonson and Nowlis (2000) expect equal shares for both extreme options, while the high-
quality-focus predicts larger shares for the high quality option. Hypothesis 2c compares the
ratio between those extreme options between people with low CNFU and people with high
CNFU. If shares of the middle compromise option are left out, then for choice set ABC1,
51,2% of low CNFU choose the high quality option relative to the ones choosing the low
quality option, while for high CNFU this is 52,1%. For choice set ABC2, 61,0% of low CNFU
chooses the high quality option and 61,5 % of high CNFU. These obvious similarities
between low CNFU and high CNFU choices reject hypothesis 2c.
Testing hypothesis 3: For people with high CNFU the attraction effect is reduced
when a decoy targets the low quality alternative.
The typical asymmetric distribution of an attraction choice set helps identifying the
existence of a high-quality-focus. It is expected that shares of the target relative to the non-
target differ between high and low CNFU for choice set ABD2, but not for ABD1. With decoy
D1 promoting the high quality option, the attraction effect and the high-quality-focus both
3 Because of this mixed design, we also performed a multilevel logistic analysis to test the significance
of the shifts in target choice, taking into account within subject observations. The multilevel model
directionally supported the main findings in Table 2, but confirmed that the differences in choice shares
were not significant.
29

favour the target. Option D2 promotes the low quality option causing for high CNFU
conflicting forces between the high quality non-target and the promoted target (section 2.4).
Before we test hypothesis 3, first an overview of the attraction choice sets. The
results of the attraction choice sets are reported in the same configuration as with the
compromise choice sets (Table 3). The effect sizes (average targetPΔ low CNFU = 14,0, average
high CNFU = 12,2) are calculated the same way as with the ‘compromise choice sets’.
The effect sizes ( , shares of options A and B relative to the base rate) do not differ
considerably between low CNFU and high CNFU. However, the rest of the outcomes from
the ‘attraction choice sets’ (choice set ABD1 and ABD2) reveal interesting results. The
attraction effect is considered a much stronger context effect, something that shows clearly
for choice set ABD1. When decoy D1 promotes the high quality/ high price -option B, low
CNFU and high CNFU both reveal a typical attraction effect, without considerable
differences between low CNFU and high CNFU (Figure 7).
targetPΔ
targetPΔ
Figure 7. Shares of respectively choice sets ABD1 and ABD2 .
Choice set ABD1 Choice set ABD2
low CNFU high CNFU
low CNFU high CNFU
low quality target decoy
choice
decoy target high quality
choice
30

Low CNFU High CNFU
Shares (%) Choice set ABD1 Choice set ABD2 Choice set ABD1 Choice set ABD2
P(LQ; HQ) 47,1 47,1 40,0 40,0 P(HQ; LQ) 52,9 52,9 60,0 60,0 P(LQ; HQ,D) 26,5 53,7 22,2 44,6 P(HQ; LQ,D) 73,5 44,8 77,8 51,4 P(D; LQ,HQ) 0,0 1,5 0,0 4,1 PD(target; non-target) 73,5 54,5 77,8 46,5
targetPΔ 20,6 7,4 17,8 6,5
Average targetPΔ 14,0 12,2 Table 3. Attraction effects for high and low CNFU.
Choice set ABD2, demonstrates different results for high and low CNFU. Now that
decoy D2 promotes low quality/ low price –option A, low CNFU shows the attraction effect as
expected, but people with high CNFU still prefer option B over option A, despite the fact that
decoy D2 promotes option A (PD(target; non-target) < 50%). Like compromise choice set ABC2,
it seems that regardless of the ‘strong’ decoy, most people with high CNFU still choose high
quality/ high price –option B (even though the attraction effect is a much stronger context
effect than the compromise effect).
To test hypothesis 3 one compares the relative shares of options A and B from
choice set ABD2. It is expected that these shares differ between low CNFU and high CNFU,
such that with high CNFU shares of the target are reduced. Like with hypothesis 2c these tests
are again independent of the AB choice. The differences in shares of the target option
(PD(target; non-target)) between high CNFU and low CNFU with choice set ABD2 are in line
with the predictions. 54,5% Of low CNFU choose the target option relative to the ones
choosing the non-target, while for high CNFU this is 46,5%. Significance of these differences
is tested with binary logistic regression. It appears that CNFU is no significant predictor for
‘choice’ in choice set ABD2: χ2ABD2(1)= 0,890, p= 0,220. Despite the fact that the data shows
an effect into the right direction, the effect is too small, thereby rejecting hypothesis 3.
31

Testing hypothesis 4: People with high CNFU, choosing the high quality option, pay
less attention to attribute information than those choosing the low quality option,
relative to people with low CNFU.
Hypothesis 4 focuses on the information acquisition process when choosing from a
compromise choice set. Simonson and Nowlis (2000) predict that people with high CNFU
pay equal amounts of attention to the extreme options (the non-compromise options).
However, according to the high-quality-focus people with high CNFU choosing the high
quality option used the high-quality-focus as a shortcut to resolve the difficult decision. This
would show by relatively less attention to the attribute information. People choosing the low
quality options would pay more attention (they do not use the shortcut) than people choosing
the high quality options of high CNFU relative to low CNFU. The expected interaction of
‘attention’ between CNFU and people choosing low quality alternatives versus people
choosing high quality alternatives (‘choice’) is tested for both choice set ABC1 and ABC2.
The variable ‘attention’ for choice information is again a combination of ‘time’ (average
duration one looks at the choice information) and ‘frequency’ (average amount of times one
views the choice information). Hypothesis 4 is tested with four separate analyses; comparing
‘time’ and ‘frequency’ between people choosing the low and those choosing the high quality
alternatives for both choice set ABC1 and ABC2.
To accomplish this we applied repeated measures ANOVA’s with a 2*3 [2
attributes (price and quality) and 3 options (low, medium and high quality/price)] within
subjects design. The between-subject factors included in the model are high vs. low CNFU
and people choosing the low quality option versus people choosing the high quality option.
Figure 8 and Figure 9 clarify the results with graphical representations for respectively time
and frequency. Figure 8 shows a decrease in ‘time’ for high CNFU towards the participants
that choose the high quality option. low CNFU seems to show the opposite:
32

Choice set ABC1 Choice set ABC2
low CNFU high CNFU
low CNFU high CNFU
People choosing LQ
People choosing HQ
People choosing LQ
People choosing HQ
Figure 8. Average duration the boxes are opened of respectively choice sets ABC1 and ABC2 .
First, the interactions for ‘time’, as illustrated by Figure 8, are tested. The repeated
measures ANOVA indicates that the interaction between CNFU and ‘choice’ is not
significant for choice set ABC1: Ftime (1, 85) = 1,336, p > 0,1. Results from choice set ABC2
are more in favour of hypothesis 4. The expected between-subjects interaction of
CNFU*choice: Ftime (1, 85) = 6,300, p < 0,05.
The non-significant result of the dependent variable ‘time’ for choice set ABC1
seems to be no different for the variable ‘frequency’. As the first image in Figure 9 illustrates,
there is no interaction effect of ‘frequency’ for choice set ABC1, CNFU*choice: Ffrequency (1,
85) = 0,076, p > 0,1. Despite the promising shape of the second image, for choice set ABC2
the interaction effect is not significant either: Ffrequency (1, 85) = 1,936, p > 0,1:
33

Choice set ABC1 Choice set ABC2
low CNFU high CNFU
low CNFU high CNFU
People choosing LQ
People choosing HQ
People choosing LQ
People choosing HQ
Figure 9. Average frequency the boxes are opened of respectively choice sets ABC1 and ABC2.
Summarised, most of the graphical representations seem to support hypothesis 4.
Unfortunately, only with choice set ABC2 the dependent variable ‘time’ is significantly
influenced by CNFU and the choices people make. This only partially confirms hypothesis 4.
In general, one has to conclude that the ‘high-quality-focus’ does not receive
substantial statistical support. If the focus/ heuristic exist at all, then the experimental setup
and the number of observations are not able to show it.
On the other hand, some general results can be obtained from the above. First, as
expected the attraction effect seems much stronger than the compromise effect. Second, the
results from Simonson and Nowlis (2000) are replicated, meaning that the average effect size
of the compromise effect (Average targetPΔ ) is smaller for high CNFU than for low CNFU. It
should be noted however, that the influence of CNFU on the compromise effect is only
marginal. Third, despite the fact that the attraction effect is such a robust and strong context
effect, people with high CNFU still favour the high quality option when the target is a low
price/ low quality-option.
34

Discussion
The main goal of this research was exploration of how CNFU moderates the context
effects in consumer decision-making. As a possible cause, literature on individual differences
and need for uniqueness (Snyder & Fromkin, 1977; Belk, 1988; Tian et al., 2001) and earlier
research on this topic (Oudenhooven & Willemsen, 2009) showed a predetermined preference
of ‘quality’ to ‘price’ of people with high CNFU (the high-quality-focus). With an online
experiment, we measured people’s preferences and information acquisition processes to be
able to test the existence of the high-quality focus.
Due to the explorative character of this paper, it accomplished to gain more insight
into the processes of choosing from compromise and attraction choice sets and moderating
variables influencing these choices. Unfortunately, results do not confirm the existence of the
‘high-quality-focus’. One could argue that this failure is due to certain properties in the
experimental design, like the selection of ‘unpopular’ product categories or the relatively
small amount of participants given the complex within subjects Latin square design.
When testing hypothesis 1 it became clear that of the five product categories, only
the TFT screens showed the expected pattern. That is, people with low CNFU were expected
to prefer ‘price’ to ‘quality’, relative to people with high CNFU. As a post hoc ‘explanation’
the high-quality-focus might only influence the decision of high CNFU when the product
category and quality attribute enable people to display their uniqueness. For that reason, we
take a closer look at the theory about ‘need for uniqueness’ and the expertise measure (the
knowledge people have about each product category). From the quality measures of the five
product categories, only the one from TFT screens is obviously visible (size of the screen).
Additionally, TFT screens are part of a general hype in the world of electronics. By the end of
2009 it is expected that 83% of the Dutch households has a TFT screen, causing record sales
this year (iMMovator, 2009). The ‘expertise’ measure illustrates this hype, since participants
are more familiar with TFT screens than with any of the other product categories. The
35
repeated measures ANOVA shows a main effect of product category: (F(4, 143) = 28,26, p <
0,000), with the largest measure of expertise for TFT screens (average expertise measure of
2,92 on a scale from 1 till 5 and STD = 1,32). One can conclude that the hype, causing this
product and its attributes to be well known, makes TFT widescreens perfect products to
display to the social environment. Therefore, the high-quality-focus might only influence this
product category.
Other drawbacks of this research are the amount of experimental conditions and the
mixed design. With five different product categories five choice sets (twenty-five conditions)
and one hundred forty-five participants, the power of the analyses is relatively low. Also, the
Latin-square design did not allow for perfect between subjects testing. Additionally, when
testing why people did NOT choose a compromise option, only those choosing the non-target
options were analysed. This reduction in the amount of participants decreased the power of
certain tests even more.
Despite these points of discussion, it is more reasonable to accept the absence of the
high-quality-focus for the simple reason that it did not receive enough statistical support. As
outlined in the introduction, there were enough theoretical and practical reasons to carry out
this research. Nevertheless, despite some disappointments with overall conclusions, the
phrase ‘also no result is some result’ provides some cold comfort.
Somewhat different from the general line of this paper, but still important to note,
are the overall differences in shares between choice set ABC1 and ABC2 and between ABD1
and ABD2. This adds limitations to research from Drolet et al. (2000). They claim that the
absolute location of a choice set in the ‘attribute space’ (eg. ABC1 versus ABC2) should not
affect the compromise effect (i.e. context effects are ‘relative’). This would mean that a
context effect is unaffected as long as the relative location of the choice options remains the
same (eg. choice set ABC, A’B’C’ or A”B”C”, Figure 10)
36

Figure 10. Location of a choice set in attribute space.
Unlike findings from Drolet et al. (2000), Heath and Chatterjee (1995) proved, for
the attraction effect, that the absolute location of a choice set does influences the effect size.
Comparison of the frequency distributions of choice sets ABD1 and ABD2 confirms Heath
and Chatterjee’s findings, but the experimental design of the current research also allowed for
testing the same claim for the compromise effect (comparison between ABC1 and ABC2).
Specifically, people with high CNFU show variation in compromise effect when the choice
set as a whole moves along the indifference curve. Apparently, people with low CNFU meet
the expectations from Drolet et al. (2000), while choices of people with high CNFU depend
on the absolute attribute values. This demonstrates the dependence on the absolute location
for the compromise effect as well.
Finally, the use of CNFU for adaptive websites is not very promising. This paper is
not able to show enough differences in search behaviour between low CNFU and high CNFU.
This makes automatic detection of CNFU difficult. In addition, choices people make do not
differ enough between people with low CNFU and people with high CNFU. Therefore,
adaptation of a website to the amount of CNFU of a visitor would probably be ineffective.
37

References
Assar, A. & Chakravarti, D. (1984). Attribute range knowledge: Effects on consumers'
evaluation of brand attribute information and search patterns in choice. In Belk, R.
W. (Ed.), Scientific Methods in Marketing, (pp. 62-67). Chicago: American
Marketing Association.
Belk, R. W. (1988). Possessions and the extended self. Journal of Consumer Research, 15(2),
139-168.
Bettman, J. R., Johnson, E. J., & Payne, J. W. (1990). A componential analysis of cognitive
effort in choice. Organizational Behavior and Human Decision Processes, 45, 111-
139.
Brily, D. A., Morris, M. W., & Simonson, I. (2000). Reasons as carriers of culture: Dynamic
versus dispositional models of cultural influence on decision making. Journal of
Consumer Research, 27, 157-178.
Brislin, R. W. (1970). Back-translation for cross-cultural research. Journal of Cross-Cultural
Psychology, 1(3), 185-216.
Chang, C. C., & Liu, H. H. (2008). Information format-option characteristics compatibility
and the compromise effect. Psychology & Marketing, 25(9), 881-900.
Chen, Y., & Xie, J. (2008). Online Consumer Review: Word-of-mouth as a new element of
marketing communication mix. Management Science, 54(3), 477-491.
Cortina, J. M. (1993) What is coefficient alpha? An examination of theory and applications.
Journal of Applied Psychology, 78, 98-104.
Dhar, R., Nowlis, S. M., & Sherman, S. J. (2000). Trying hard or hardly trying: An analyses
of context effects in choice. Journal of Consumer Psychology, 9(4), 189-200.
Dhar, R., & Simonson, I. (2003). The effect of forced choice on choice. Journal of Marketing
Research, 40, 146-160.
38

Dobbs, J. L., Sloan, D. M., & Karpinski, A. (2006). A psychometric investigation of two self-
report measures of emotional expressivity. Personality and Individual Differences,
43, 693-702.
Drolet, A., Simonson, I., & Tversky, A. (2000). Indifference curves that travel with the choice
set. Marketing Letters, 11(3), 199-209.
Edwards, W. (1954). The theory of decision making. Psychological Bulletin, 51, 380-417.
Grubb, E. L., & Grathwohl, H. L. (1967). Consumer self-concept, symbolism and market
behavior - theoretical approach. Journal of Marketing, 31, 22-27.
Huber, J., Payne, J. W., & Puto, C. P. (1982). Adding asymmetrically dominated alternatives:
Violations of regularity and the similarity hypothesis. Journal of Consumer
Research, 9, 90-98.
Huber, J., & Puto, C. P. (1983). Market boundaries and product choice: Illustrating attraction
and substitution effects. Journal of Consumer Research, 10, 31-43.
Heath, T. B., & Chatterjee, S. (1995). Asymmetric decoy effects on lower-quality versus
higher-quality brands: Meta-analytic and experimental evidence. Journal of
Consumer Research, 22, 268-284.
Johnson, E. J., Bellman, S., & Lohse, G. L. (2002). Defaults, framing and privacy: Why
opting in-opting out. Marketing Letters, 13(1), 5-15.
Johnson, E. J., Goldstein, D. G. (2004). Defaults and donation decisions. Transplantation
78(12), 1713-1716.
Kivetz, R., Netzer, O., & Srinivasan, V. (2004a). Alternative models for capturing the
compromise effect. Journal of Marketing Research, 41, 237-257.
Kivetz, R., Netzer, O., & Srinivasan, V. (2004b). Extending compromise effect models to
complex buying situations and other context effects. Journal of Marketing
Research, 41, 262-268.
Kleinmuntz, D. N., & Schkade, D. A. (1993). Information displays and decision processes.
Psychological Science, 4, 221-227.
Kline, P. (1999). The handbook of psychological testing (2nd edition). London: Routledge.
39

Lilienfeld, S. O., & Fowler, K. A. (2005). The self-report assessment of psychopathy:
Problems, pitfalls, and promises. In C. J. Patrick (Ed.), Handbook of psychopathy
(pp. 107-132). New York: Guilford.
Luce, R. D. (1959). Individual choice behavior. New York: Wiley.
Luce, R. D. (1977). The choice axiom after twenty years. Journal of Mathematical
Psychology, 15, 215-233.
Luce, M. F., Payne, J. W., & Bettman, J. R. (2000). Coping with unfavorable attribute values
in choice. Organizational Behavior en Human Decision Processes, 81(2), 274-299.
Mourali, M. Böckenholt, U., & Laroche, M. (2007). Compromise and attraction effects under
prevention and promotion motivations. Journal of Consumer Research, 34, 234-
247.
Meyer, R., Johnson, E. (1995). Empirical reneralizations in the modeling of consumer choice.
Marketing Science, 14(3), 180-189.
Oudenhooven, P. G. J., & Willemsen, M. C. (2009) Invloed van ‘need for uniqueness’ op het
compromiseffect: Zelfde vraagstelling, andere onderzoeksmethode. unpublished
manuscript, Eindhoven University of Technology.
Ruvio, A. (2008). Unique like everybody else? The dual role of consumers' need for
uniqueness. Psychology & Marketing, 25, 444-464.
Ruvio, A., Shoham, A., & Brenčič, M. M. (2008). Consumers’ need for uniqueness: Short-
form scale development and cross-cultural validation. Internationam Marketing
Review, 25, 33-53.
Samuelson, W., & Zeckhauser, R. (1988). Status quo bias in decision-making. Journal of Risk
and Uncertainty, 1, 7-59.
Schkade, D. A., & Kleinmuntz, D. N. (1994). Information displays and choice processes:
Differential effects of organization, form, and sequence. Organizational Behavior
and Human Decision Processes, 57, 319-337.
Shafir, E., Simonson, I., & Tversky, A. (1993). Reason-based choice. Cognition, 49, 11-36.
40

Sheng, S., Parker, A. M., & Nakamoto, K. (2005). Understanding the mechanism and
determinants of compromise effect. Psychology & Marketing, 22(7), 591-609.
Simonson, I. (1989). Choice based on reasons: The case of attraction and compromise effects.
Journal of Consumer Research, 16, 158-174.
Simonson, I., & Nowlis, S. M. (2000). The role of explanations and need for uniqueness in
consumer decision making: Unconventional choices based on reasons. Journal of
Consumer Research, 27, 49-68.
Simonson, I., & Tversky, A. (1992). Choice in context: Tradeoff contrast and extremeness
aversion. Journal of Marketing Research, 29, 281-295.
Snyder, C. R., & Fromkin, H. L. (1977). Abnormality as a positive characteristic: The
development and validation of a scale measuring need for uniqueness. Journal of
Abnormal Psychology, 86, 518-527.
Tian, K. T., Bearden, W. O., & Hunter, G. L. (2001). Consumers’ need for uniqueness: Scale
development and validation. Journal of Consumer Research, 28, 50-66.
Tversky, A., & Kahneman, D. (1991). Loss aversion in riskless choice: A reference-
dependent model The Quarterly Journal of Economics, 106(4), 1039-1061.
Willemsen, M. C., & Bragt van, B. (2006). Vlab: Virtual lab [online application]. From
<http://w3.vlab.nl/>
Willemsen, M. C., & Johnson, E. J. (2008). MouselabWEB: Monitoring information
acquisition processes on the web [online application]. From
<http://www.mouselabweb.org/>
Willemsen, M. C., & Keren, G. (2003). The meaning of indifference in choice behavior:
Asymmetries in adjustments embodied in matching. Organizational Behavior and
Human Decision Processes, 90, 342-359.
Yoon, S. O., & Simonson, I. (2000). Choice set configuration as a determinant of preference
attribution and strength. Journal of Consumer Research, 35, 324-336.
41

Internet source:
Stichting iMMovator: Cross Media Network. (2009). Retrieved September 18, 2009, from
<http://www.immovator.nl> and <http://www.immovator.nl/bijna-60-huishoudens-
met-digitale-televisie>
42

Appendix I: CNFU scale translation and validation
To create a reliable measure of need for uniqueness, the CNFU-S scale (Ruvio et al.,
2008) is translated and validated. Using ‘back-translation’ (Brislin, 1970), all 12 items from
the CNFU-S scale (Ruvio et al., 2008) were translated from English into Dutch. Five
colleagues translated, independently of each other, the items into Dutch and another group of
five converted these translations back into English again. The new CNFU-S survey only
included Dutch translations, of which the gist of the (back) translation was comparable to the
original. In two cases, parts of different translations were combined to create the best Dutch
translation.
To be able to test the reliability and the consistency of the Dutch version two
surveys were conducted. In an online internet survey, set up using Virtual Lab (Willemsen &
van Bragt, 2006), participants evaluated the items one-by-one. For each item participants
were asked to respond on a five-point Likert scale (strongly agree to strongly disagree). The
factor structure was checked with ‘principal component analyses’ and compared with the
factor structure of the original survey from Ruvio et al. (2008). The expected correlation
between the items allowed for ‘oblique rotation’, since the dimensions (‘creative choices’,
‘unpopular choices’ and ‘avoidance of similarity’) all refer to the same concept; ‘consumer
need for uniqueness’. Five months later the same participants again filled in the same survey
to see if the CNFU-S scale is robust enough to base long-term conclusions on. Different from
the first survey, wording of four items was reversed to avoid response bias. Participation was
rewarded with €0,40 per participant, per survey.
Two hundred and four participants (85 men and 119 women, age ranging from 19
till 46) responded to twelve items of the CNFU-S survey, on a five-point Likert scale.
Appendix II shows the Dutch version of the CNFU-S survey (at this stage items 1, 6, 7 and 9
were not yet phrased negatively). Principal component analysis with oblique rotation resulted
43

in the same three factors that Ruvio et al. (2008) found. Factor loadings ranged from 0,562 till
0,867 and the internal consistency (Cronbach’s α = 0,801) proved to be sufficient (Kline,
1999).
Five months later, a majority of the initial participants responded to an adapted
version of the CNFU-S survey, designed to test the robustness and consistency of the scale. In
total 174 people (90 men and 84 women, age ranging from 20 till 60) participated in the
second survey (120 participated in both surveys, for 54 this was the first time). These 120
participants were used to check the robustness of the scale. This time four of the items (items
1, 6, 7 and 9) were phrased negatively to check if participants read the instructions and gave
ample consideration to each item. Three of the four negatively phrased items formed an extra
factor, indicating that these minor changes did have some influence on the interpretation of
the items. Still factor loadings ranged from 0,507 till 0,887, with Cronbach’s α = 0,747.
Because one should be cautious interpreting only the internal consistencies (Cronbach’s α)
(Cortina, 1993), an adequate test-retest correlation increases reliability. Results from the first
CNFU-S survey show an average CNFU of 32,09 (on a scale from 12 to 60) with a standard
deviation of 6,48. The second survey resulted in an average CNFU of 33,35 with a standard
deviation of 5,77. The two surveys showed a significant test-retest relationship, r = 0,59, p <
0,001 (n = 120). Overall, these results show that the Dutch version of the CNFU-S scale is a
reliable and consistent measuring tool.
The 174 participants that filled in the second survey (average CNFU = 33,35,
standard deviation = 5,97) formed the sample from which participants for the main
experiment were recruited. The median of 34 served as the split value, dividing the sample in
high CNFU and low CNFU. As can be seen in Figure 10, the frequency distribution slightly
forms a bimodal shape, splitting low CNFU and high CNFU around a CNFU-value of about
33.
44

Median
Figure 10. Frequency distribution of total CNFU-scores. Figure 11. Q-Q plot of total CNFU-scores.
Despite the shape of the distribution, the Q-Q plot is acceptable (Figure 11) and the
test for normality (Shapiro-Wilk, n < 2000) proved adequate (W = 0,99, p = 0,205). That is,
the CNFU-data is normally distributed.
45

Appendix II: Translated CNFU-S survey
Participants were introduced with the following (Dutch) text:
Welkom!
Dit onderzoek bestaat uit 12 stellingen. We zijn geïnteresseerd in hoeverre elk van deze
stellingen bij jou persoonlijk past.
Het zou zo kunnen zijn dat dit onderzoek je bekend voorkomt. Toch zijn er verschillen met
een voorgaand onderzoek, dus lees de stellingen goed door.
Geef aan in hoeverre je het eens bent met elke stelling, waarbij je gebruik maakt van een
schaal waarbij 1 'helemaal oneens' betekent, 5 'helemaal eens' betekent, en 2, 3 en 4 zijn
beoordelingen daartussenin. Klik onder elke stelling een getal aan in de vakjes op de volgende
schaal:
1. Helemaal oneens
2. Oneens
3. Eens noch oneens
4. Eens
5. Helemaal eens
Er zijn geen ‘goede’ of ‘foute’ antwoorden, dus selecteer bij elke stelling het getal dat zo goed
mogelijk bij je past. Neem de tijd en denk goed na over elk antwoord.
Succes.
46

Translated and restructured questions:
1. Vaak combineer ik dingen op een zodanige manier, dat ik een uniek imago creëer dat
niet kan worden nagedaan.
2. Ik ben niet iemand die het leuk vind om origineel te zijn, door een interessantere
versie van standaard/doorsnee producten te zoeken. (negative phrased)
3. Ik ben actief bezig met het ontwikkelen van mijn unieke persoonlijkheid, door
speciale producten of merken te kopen.
4. Een oog hebben voor producten die interessant en ongebruikelijk zijn, helpt me in het
creëren van een onderscheidend imago.
5. Als het gaat om producten die ik koop en de situaties waarin ik ze gebruik, dan heb ik
ongewone gebruiken en regels.
6. Ik schend de ongeschreven regels van mijn sociale groep niet, als het gaat om wat ik
koop of bezit. (negative phrased)
7. Ik ben zelden tegen de ongeschreven regels van mijn sociale groep ingegaan, als het
gaat om wanneer en hoe bepaalde producten gebruikt zouden moeten worden.
(negative phrased)
8. Ik houd ervan om de heersende smaak van mensen die ik ken uit te dagen/ te
prikkelen, door het kopen van dingen die zij niet zouden accepteren.
9. Wanneer een product dat ik bezit populair wordt bij de rest van de bevolking, dan ga
ik het niet minder gebruiken. (negative phrased)
10. Ik probeer vaak producten of merken te vermijden waarvan ik weet dat een groot deel
van de bevolking ze koopt.
11. Ik heb voor mezelf de regel dat ik niet van producten of merken houd die door
iedereen gekocht worden.
12. Hoe gangbaarder een product of merk is onder de bevolking, des te minder
geïnteresseerd ik ben in het kopen ervan.
47

Appendix III: Pilots
The final experiment focused on compromise and attraction effects, the process by
which people construct their preferences and potential moderating variables. To find suitable
product categories for this experiment, a pen-and-paper pilot study tested several stimuli. A
category is ‘suitable’, when shares of different choice options show an indifferent
distribution, that is, shares are equally large. Compromise and attraction effects can only
occur as a way to resolve the difficult trade-off between equally attractive options.
Additionally, indeterminate distributions indicate that other factors influence the
attractiveness of choice options.
Participants for the pilot study were students from Eindhoven University of
Technology, recruited in different canteens on the university campus. Twenty participants
matched (Luce, Payne & Bettman, 2000; Willemsen & Keren, 2003) products in twelve
different product categories. Those products were described by their ‘price’ and a measure of
quality. Familiarity with the attribute ‘quality’ has a diminishing influence on the compromise
effect (Sheng et al.,2005). Therefore, for some product categories the attribute ‘quality’ was
represented with an abstract property (like ‘ease of use’/ ‘usability’) ranging from 1 to 10. In
general, the attributes matched the “range of typical attribute values offered in the
marketplace” (Assar & Chakravarti, 1984) to ensure a realistic experiment. Participants
matched two products/services within each category. To avoid bias from upwards versus
downwards matching (Willemsen & Keren, 2003) half the participants matched the prices of
the high quality options and the other half matched the prices of the low quality options.
Outcomes were averaged and for each category, an indifference curve was created. Next, per
product category, the two matched products were presented to another thirty students in the
form of two choice options. Participants were asked to indicate how much they preferred one
option to the other. Participants indicated their preferences by placing a cross on a line
48

between the two options (option A: relatively low quality and low price and option B:
relatively high quality and high price). A cross placed near A, indicated that option A was
preferred over B, vice versa and all options in between. After all pilots were filled in, the
answers were converted to values from 1 to 7. Frequency distributions of these values
determined whether a product category was ‘suitable’ or not.
The main goal of the pilot studies was the construction of the stimuli for the actual
experiment. The search for ‘suitable’ product categories resulted in five different categories:
TFT wide screens, contracts for mobile internet (for laptops), projectors, folding bikes and
food processors. For these categories, both choice options received about equal shares.
Stimuli construction:
Relative to the indifference curve of each product category, five choice options (A,
B, C1, C2, D1 and D2, in Figure 1) were created. It is important to note that the location of
decoys D1 and D2, relative to options A and B, combines range and frequency strategies
(Huber et al., 1982). These locations diminish the strength of the attraction effect, compared
with a range strategy (choice set ABX, Figure 1) or a frequency strategy (choice set ABY,
Figure 1), however, this is necessary to viably compare ABD1 and ABD2. A range strategy
would offer an alternative for the same price as option A, but with lower quality. Extending
the range promoting option B, would mean adding an alternative with the same quality as
option B, but for a higher price. The opposite would be the case with a frequency strategy.
Either a range or a frequency strategy would promote one option by comparing the quality,
but the other option by comparing the price (and vice versa). At the current locations of D1
and D2, both decoys promote an original options in the same way; the target options are
always superior on both attributes. Only this way one can compare results from choice set
ABD1 with choice set ABD2. The decoys are positioned on a line with transposed (negative)
slope compared to the indifference curve, starting from the target option. This resulted in the
product categories and choice options described in Table 1 (Section 3.2).
49

Appendix IV: Online MouselabWEB experiment
Example of an experiment of participants with modulus number 1 (Appendix V):
50

51

52

53

Appendix V: Experimental design
54
M
odul
us
nr.
Assi
gnm
ent 1
A
ssig
nmen
t 2
Assi
gnm
ent 3
A
ssig
nmen
t 4
Assi
gnm
ent 5
1 AB
pr
oduc
t cat
.1 (0
1.ph
p)
ABD
1 pr
oduc
t cat
.3 (0
3.ph
p)
ABC
2 pr
oduc
t cat
.4 (0
4.ph
p)
ABC
1 pr
oduc
t cat
.2 (0
2.ph
p)
ABD
2 pr
oduc
t cat
.5 (0
5.ph
p)
2
ABC
1 pr
oduc
t cat
.2 (0
2.ph
p)
ABD
2 pr
oduc
t cat
.5 (0
5.ph
p)
AB
prod
uct c
at.1
(01.
php)
AB
D1
prod
uct c
at.3
(03.
php)
AB
C2
prod
uct c
at.4
(04.
php)
3 AB
D1
prod
uct c
at.3
(03.
php)
AB
C2
prod
uct c
at.4
(04.
php)
AB
C1
prod
uct c
at.2
(02.
php)
AB
D2
prod
uct c
at.5
(05.
php)
AB
pr
oduc
t cat
.1 (0
1.ph
p)
4
ABC
2 pr
oduc
t cat
.4 (0
4.ph
p)
ABC
1 pr
oduc
t cat
.2 (0
2.ph
p)
ABD
2 pr
oduc
t cat
.5 (0
5.ph
p)
AB
prod
uct c
at.1
(01.
php)
AB
D1
prod
uct c
at.3
(03.
php)
5 AB
D2
prod
uct c
at.5
(05.
php)
AB
pr
oduc
t cat
.1 (0
1.ph
p)
ABD
1 pr
oduc
t cat
.3 (0
3.ph
p)
ABC
2 pr
oduc
t cat
.4 (0
4.ph
p)
ABC
1 pr
oduc
t cat
.2 (0
2.ph
p)
6
AB
C1
prod
uct c
at.1
(06.
php)
AB
D2
prod
uct c
at.4
(09.
php)
AB
pr
oduc
t cat
.5 (1
0.ph
p)
ABD
1 pr
oduc
t cat
.2 (0
7.ph
p)
ABC
2 pr
oduc
t cat
.3 (0
8.ph
p)
7
AB
D1
prod
uct c
at.2
(07.
php)
AB
C2
prod
uct c
at.3
(08.
php)
AB
C1
prod
uct c
at.1
(06.
php)
AB
D2
prod
uct c
at.4
(09.
php)
A
B
prod
uct c
at.5
(10.
php)
8 A
BC
2 pr
oduc
t cat
.3 (0
8.ph
p)
ABC
1 pr
oduc
t cat
.1 (0
6.ph
p)
ABD
2 pr
oduc
t cat
.4 (0
9.ph
p)
AB
prod
uct c
at.5
(10.
php)
AB
D1
prod
uct c
at.2
(07.
php)
9 A
BD
2 pr
oduc
t cat
.4 (0
9.ph
p)
AB
prod
uct c
at.5
(10.
php)
AB
D1
prod
uct c
at.2
(07.
php)
AB
C2
prod
uct c
at.3
(08.
php)
AB
C1
prod
uct c
at.1
(06.
php)
10
AB
prod
uct c
at.5
(10.
php)
AB
D1
prod
uct c
at.2
(07.
php)
AB
C2
prod
uct c
at.3
(08.
php)
AB
C1
prod
uct c
at.1
(06.
php)
AB
D2
prod
uct c
at.4
(09.
php)
11
ABD
1 pr
oduc
t cat
.1 (1
1.ph
p)
ABC
2 pr
oduc
t cat
.2 (1
2.ph
p)
ABC
1 pr
oduc
t cat
.5 (1
5.ph
p)
ABD
2 pr
oduc
t cat
.3 (1
3.ph
p)
AB
prod
uct c
at.4
(14.
php)
12
ABC
2 pr
oduc
t cat
.2 (1
2.ph
p)
ABC
1 pr
oduc
t cat
.5 (1
5.ph
p)
ABD
2 pr
oduc
t cat
.3 (1
3.ph
p)
AB
prod
uct c
at.4
(14.
php)
AB
D1
prod
uct c
at.1
(11.
php)
13
ABD
2 pr
oduc
t cat
.3 (1
3.ph
p)
AB
prod
uct c
at.4
(14.
php)
AB
D1
prod
uct c
at.1
(11.
php)
AB
C2
prod
uct c
at.2
(12.
php)
AB
C1
prod
uct c
at.5
(15.
php)
14
AB
prod
uct c
at.4
(14.
php)
AB
D1
prod
uct c
at.1
(11.
php)
AB
C2
prod
uct c
at.2
(12.
php)
AB
C1
prod
uct c
at.5
(15.
php)
AB
D2
prod
uct c
at.3
(13.
php)
15
ABC
1 pr
oduc
t cat
.5 (1
5.ph
p)
ABD
2 pr
oduc
t cat
.3 (1
3.ph
p)
AB
prod
uct c
at.4
(14.
php)
AB
D1
prod
uct c
at.1
(11.
php)
AB
C2
prod
uct c
at.2
(12.
php)
16
AB
C2
prod
uct c
at.1
(16.
php)
AB
C1
prod
uct c
at.4
(19.
php)
AB
D2
prod
uct c
at.2
(17.
php)
AB
pr
oduc
t cat
.3 (1
8.ph
p)
ABD
1 pr
oduc
t cat
.5 (2
0.ph
p)
17
A
BD
2 pr
oduc
t cat
.2 (1
7.ph
p)
AB
prod
uct c
at.3
(18.
php)
AB
D1
prod
uct c
at.5
(20.
php)
AB
C2
prod
uct c
at.1
(16.
php)
AB
C1
prod
uct c
at.4
(19.
php)
18
AB
prod
uct c
at.3
(18.
php)
AB
D1
prod
uct c
at.5
(20.
php)
AB
C2
prod
uct c
at.1
(16.
php)
AB
C1
prod
uct c
at.4
(19.
php)
AB
D2
prod
uct c
at.2
(17.
php)
19
AB
C1
prod
uct c
at.4
(19.
php)
AB
D2
prod
uct c
at.2
(17.
php)
AB
pr
oduc
t cat
.3 (1
8.ph
p)
ABD
1 pr
oduc
t cat
.5 (2
0.ph
p)
ABC
2 pr
oduc
t cat
.1 (1
6.ph
p)
20
A
BD
1 pr
oduc
t cat
.5 (2
0.ph
p)
ABC
2 pr
oduc
t cat
.1 (1
6.ph
p)
ABC
1 pr
oduc
t cat
.4 (1
9.ph
p)
ABD
2 pr
oduc
t cat
.2 (1
7.ph
p)
AB
pr
oduc
t cat
.3 (1
8.ph
p)
21
AB
D2
prod
uct c
at.1
(21.
php)
AB
pr
oduc
t cat
.2 (2
2.ph
p)
ABD
1 pr
oduc
t cat
.4 (2
4.ph
p)
ABC
2 pr
oduc
t cat
.5 (2
5.ph
p)
ABC
1 pr
oduc
t cat
.3 (2
3.ph
p)
22
AB
pr
oduc
t cat
.2 (2
2.ph
p)
ABD
1 pr
oduc
t cat
.4 (2
4.ph
p)
ABC
2 pr
oduc
t cat
.5 (2
5.ph
p)
ABC
1 pr
oduc
t cat
.3 (2
3.ph
p)
ABD
2 pr
oduc
t cat
.1 (2
1.ph
p)
23
AB
C1
prod
uct c
at.3
(23.
php)
AB
D2
prod
uct c
at.1
(21.
php)
AB
pr
oduc
t cat
.2 (2
2.ph
p)
ABD
1 pr
oduc
t cat
.4 (2
4.ph
p)
ABC
2 pr
oduc
t cat
.5 (2
5.ph
p)
24
AB
D1
prod
uct c
at.4
(24.
php)
AB
C2
prod
uct c
at.5
(25.
php)
AB
C1
prod
uct c
at.3
(23.
php)
AB
D2
prod
uct c
at.1
(21.
php)
pr
oduc
t cat
.2 (2
2.ph
p)
AB
25
AB
C2
prod
uct c
at.5
(25.
php)
AB
C1
prod
uct c
at.3
(23.
php)
AB
D2
prod
uct c
at.1
(21.
php)
AB
pr
oduc
t cat
.2 (2
2.ph
p)
prod
uct c
at.4
(24.
php)
AB
D1
Tim
e
Par
tial c
ount
erba
lanc
ed ‘L
atin
squa
res’
des
ign
with
25
cond
ition
s for
‘bet
wee
n su
bjec
t’ re
sear
ch