einteract™** hospital*transfers**...
TRANSCRIPT

6975 Creditview Road, Unit 4 Mississauga, ON Canada L5N 8E9 www.pointclickcare.com
eINTERACT™ Hospital Transfers User Guide
© 2013 PointClickCare All rights reserved. PointClickCare is a registered trademark. The material contained in this document may contain confidential and/or privileged information and is protected via
copyright. Duplication, redistribution or modification of the contents of this document is strictly forbidden without prior written consent from the author.
October, 2013
eINTERACT Hospital Transfers User Guide – October 2013
Page 2
Table of Contents
HOSPITAL TRANSFERS FUNCTIONALITY ................................................................................................... 3
ADMISSION LOG ..................................................................................................................................... 4
TRANSFER LOG ...................................................................................................................................... 10
TRENDS ................................................................................................................................................. 13
HOSPITAL RATES ................................................................................................................................... 18

eINTERACT Hospital Transfers User Guide – October 2013
Page 3
HOSPITAL TRANSFERS FUNCTIONALITY
The eINTERACT Hospital Transfers functionality (Hospital Transfers Portal) provides clinical and administrative staff access to hospital admission and transfer data and hospital readmission rates to support root cause analysis for hospital transfers. Facilities can compare their hospital readmission rates to national standards (where/when available).
The information contained in this area is based on information collected during admission and transfer census events. New fields are available on the census entry screen which collects additional data useful for hospital transfer root cause analysis.
The Hospital Transfers functionality tracks residents coming and going from the facility. In census entry, fields have been added specifically related to hospital transfers:
• Who ordered transfers? • What hospital resident was transferred to/from? • Reason for transfer • Outcome of transfer
The Hospital Transfers functionality is accessed through an icon on the Gold Bar. This icon will only appear after the Hospital Transfers functionality has been enabled for the facility and is then only available if the user has been granted proper security access. All configuration and training must be completed prior to enabling the Hospital Transfers functionality.

eINTERACT Hospital Transfers User Guide – October 2013
Page 4
To access the Hospital Transfers functionality, at the facility level, click on Hospital Transfers, which will open to the Admission Log. The Admission Log lists residents admitted to the facility from a hospital.
There are four filters in the blue bar below the tabs:
• Admission Log – Resident admitted to the facility from the hospital • Transfer Log – Residents transferred from the facility to the hospital • Trends – Graphs indicating hospitalization trends • Hospital Rates – Calculations concerning residents transferred out to the hospital
The “Set as My Default View” in the top right corner of the screen allows the user to set any of these filters as their default view. Click on the filters in the blue bar to display the page you wish to have set as default and click on “Set as My Default View”. This page will automatically open when Hospital Transfers is opened.
ADMISSION LOG The Admission Log allows the user to view all residents who are within 30 days of admission to the facility and residents that have had a discharge/transfer to a hospital within the first 30 days of admission. By default the Admission Log will display the last 30 days of admissions. This can be expanded utilizing the filters with + sign (change filters and then refresh by clicking the Refresh button). Clicking the Reset button will return the screen to the default settings.

eINTERACT Hospital Transfers User Guide – October 2013
Page 5
In the resident list there are icons next to some resident names:
• Yellow icon (hover over) –“Watch this resident. They are at risk of re-‐hospitalization within 30 days”. This does not mean they are clinically at risk for anything specific; just that they have been admitted from the hospital and have not yet reached the 30 day window. After 30 days if they aren’t transferred back to the hospital they are no longer considered at risk and the Yellow Icon will disappear.
• Red Icon (Hover over)– “This resident was transferred to hospital within 30 days of admission”. The transfer log will show a corresponding entry indicating that the resident was transferred to the hospital and that entry will also have the red icon beside it. Once the red icon is displayed in the Transfer Log, it will always remain next to the resident’s name.
In addition to the red and yellow triangle icons, you may also notice that some resident names are listed in italics.
This indicates that the hospital type that the resident was admitted to, such as a rehabilitation facility, is not included in the hospital rates calculation.
NOTE: In setup when a hospital is determined to not be included in the hospital rates, the corresponding census entry for this external facility will not be included in the hospital rates calculation. When this facility is checked, the entry in the Admission log will appear in italics indicating that this item is not included in the trends and hospital rates calculations.

eINTERACT Hospital Transfers User Guide – October 2013
Page 6
In this example the entry is not in italics – when the + sign is clicked next to the entry it is evident that the resident was admitted to an acute care hospital.
The mapping identifies the acute care hospital to be included in the rates and trends.
On the Admission Log across the top are displayed headings for each section of the log: Resident, Date of Admission, Admission Status, Admitted from and Primary Physician. In this heading, also, is an area of light blue shading with a small arrow indicating the sorting is specific to this column. If the arrow is pointing down the information is displayed with the oldest admissions on top (chronological order). Clicking the arrow will reverse the order of the information to display the newest admissions on top (reverse chronological order).
Column Name Description Resident The title of this column is based on the “Term used for Clients” in the Facility
(Admin -‐> Setup -‐> General Configuration) and will display “Last Name, First Name (Resident ID#)
Date of Admission This column displays the date of admission from the census event as MM/DD along with the day of the week on which the resident was admitted. In addition, the time of day of the admit will display based on the time in the census event and is based on the following:
• Morning – if the admit occurred from 07:00am to 11:59am • Afternoon – if the admit occurred from 12:00pm to 6:59pm (18:59) • Evening – if the admit occurred from 7:00pm (19:00) to 11:59pm (23:59) • Night – if the admit occurred from 12:00am (00:00) to 06:59am
Admission Status This column displays either Post-‐Acute or Chronic Long-‐Term based on the following based on the payer type in the census event:
• Post-‐Acute if the payer type is a PPS payer • Chronic Long-‐Term if the payer type is anything else. For Canadian clients,
the default will always be Chronic Long-‐Term. If a primary payer has not been entered, this column will be blank. This field can be edited here.
Admitted From This column displays the hospital selected in the “To/From Location” field in the census event. If a hospital has not been selected, this column will be blank. This field can be edited here. US Databases Only.
Primary Physician This column displays the resident’s Primary Physician as “Title First Name Last Name”
eINTERACT Hospital Transfers User Guide – October 2013
Page 7
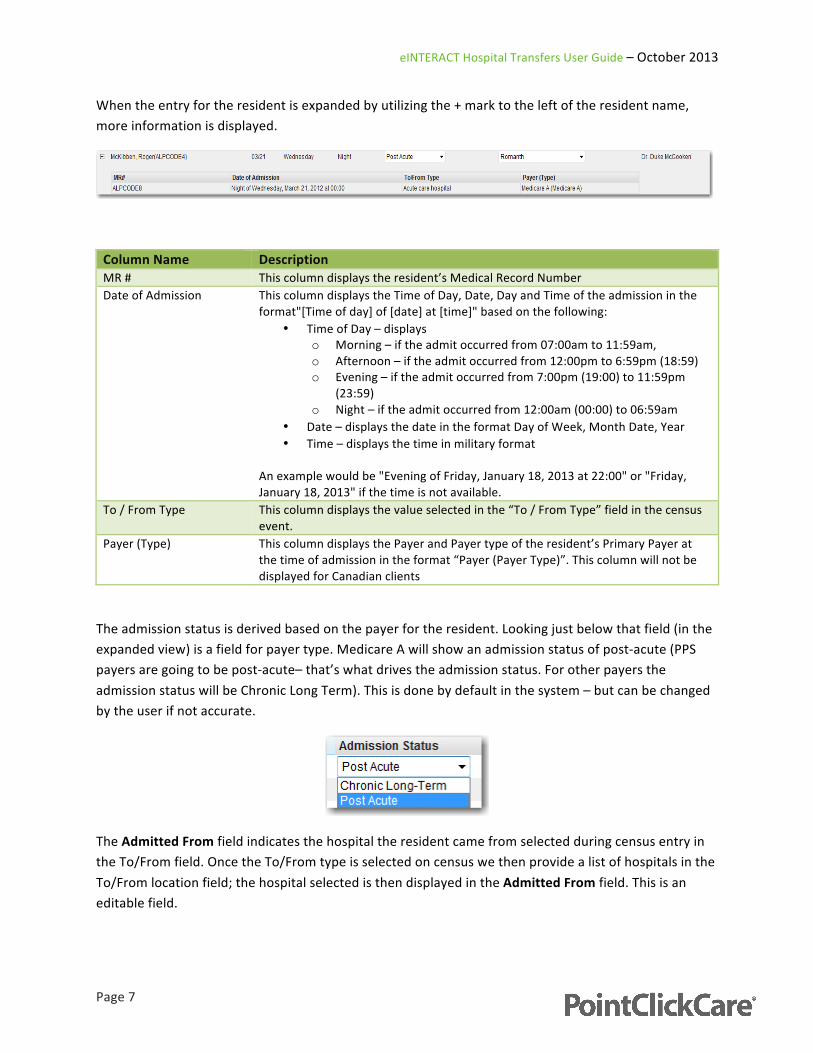
When the entry for the resident is expanded by utilizing the + mark to the left of the resident name, more information is displayed.
Column Name Description MR # This column displays the resident’s Medical Record Number Date of Admission This column displays the Time of Day, Date, Day and Time of the admission in the
format"[Time of day] of [date] at [time]" based on the following: • Time of Day – displays
o Morning – if the admit occurred from 07:00am to 11:59am, o Afternoon – if the admit occurred from 12:00pm to 6:59pm (18:59) o Evening – if the admit occurred from 7:00pm (19:00) to 11:59pm
(23:59) o Night – if the admit occurred from 12:00am (00:00) to 06:59am
• Date – displays the date in the format Day of Week, Month Date, Year • Time – displays the time in military format
An example would be "Evening of Friday, January 18, 2013 at 22:00" or "Friday, January 18, 2013" if the time is not available.
To / From Type This column displays the value selected in the “To / From Type” field in the census event.
Payer (Type) This column displays the Payer and Payer type of the resident’s Primary Payer at the time of admission in the format “Payer (Payer Type)”. This column will not be displayed for Canadian clients
The admission status is derived based on the payer for the resident. Looking just below that field (in the expanded view) is a field for payer type. Medicare A will show an admission status of post-‐acute (PPS payers are going to be post-‐acute– that’s what drives the admission status. For other payers the admission status will be Chronic Long Term). This is done by default in the system – but can be changed by the user if not accurate.
The Admitted From field indicates the hospital the resident came from selected during census entry in the To/From field. Once the To/From type is selected on census we then provide a list of hospitals in the To/From location field; the hospital selected is then displayed in the Admitted From field. This is an editable field.

eINTERACT Hospital Transfers User Guide – October 2013
Page 8
In the Admission log there are two editable fields. The ability to edit these fields is based on security roles assigned to the user.
It is evident that they are editable because there are drop down menus under each heading. The first is Admission Status and the second is Admitted From. By selecting an item in either drop down menu, there is the ability to change those two fields. The line will temporarily change to yellow to indicate the field has been edited.
Once you click out of the field, the yellow line is removed and the change is saved. Any changes to these fields will also be reflected in the census event, meaning the changes made in these fields will also change the census line for those fields. The Census Report in the Admin tab allows the ability to audit any changes made to these fields. The report will indicate any changes made and the person making those changes.

eINTERACT Hospital Transfers User Guide – October 2013
Page 9
The Admission Log can be converted to Excel format, saved and exported by clicking the EXPORT button on the top right corner of the screen. When the EXPORT button is clicked a pop-‐up is displayed giving the user the option to de-‐identify the residents in the report. (The report will contain admission information consistent with the filters selected.) Selecting the de-‐identify option allows users to export the admission log without displaying confidential resident information.
All pertinent information is still displayed in the report but fields containing resident information are masked as follows:
• Resident Name: No name • MR#: PCC Client ID • Facility: PCC facility ID • Physician: Physician #
If the De-‐Identify option is not selected then all information will display as shown on the Admission Log. Data is displayed in Excel format.
Data exported in the report is the same as columns displayed in the Admission log. The column“30 Day Message” corresponds with the red and yellow icons in the resident listing; the last column, “Included in Rates “corresponds with the entries in italics in the log.
eINTERACT Hospital Transfers User Guide – October 2013
Page 10
TRANSFER LOG The Transfer Log enables the user to view all resident transfers to the hospital within the specified filters. By default the Transfer Log includes the last 30 days of discharges/transfers. The user has the ability to filter records using the expandable “Display Filters” section.
• The Transfer Log includes one row for each census event, where the action code selected has an Action Type = Discharge or Leave, and the To/From Type is mapped to External Facility Type = Hospital, that falls within the specified filters.
• The columns included in the Transfer Log view are listed in the table below.
• Each row can be expanded to view additional details. The columns included in the expandable section are listed in the table below.
• Records may be sorted by the discharge/transfer date and time, with the earliest transfer at the top of the list. By clicking on the column header, the results will be sorted in the reverse order, either ascending or descending order.
• Discharges/transfers that are within 30 days of admission have a red icon in the left column.
When the user hovers over the icon the message "This resident was transferred to hospital within 30 days of admission" Is displayed.
• Transfers that will not be included in the hospital rates, based on the 'Include in Hospital Rates' flag on the To/From Type pick list item, are displayed in italics.
A legend is included in the Transfer Log below the "Hospital Transfers" header:
o “These items will not be included in the Hospital Rates"
• By default the Transfer Log includes the last 30 days of discharges/transfers. The user is able to filter the records using the expandable "Display Filters" section.
• There are editable fields in the Transfer Log that the user can edit directly from the log. o Admission Status o Transferred To o Ordered By o Reason o Planned o Outcome
The editable fields are the only fields in the view that are not read-‐only. Only users with edit access have the ability to edit these fields. Users who do not have 'edit' access to the 'Hospital Transfers' security role will see read-‐only fields.
The user is able to type directly into the editable fields. As the user updates a field it will temporarily display a yellow background to indicate that it has been changed.
o If the updated field does not fall within the specified filters, the record will still be displayed until the screen is refreshed.
The changes are saved automatically as soon as the user leaves the field. This will update the corresponding census event with the changes.
o When the update is being saved, the text "Saving" will display over the field.

eINTERACT Hospital Transfers User Guide – October 2013
Page 11
When changes to the transfer logs are saved, the edits are logged in the same audit trail as when the user edits the census event from the census tab.
o A new "Revised From" column has been added to the existing 'Census List' report, available via the "Print Census" button on the census screen which indicates whether the census event was last updated from the 'Hospital Transfers' or the 'Census Tab'.
o The existing 'Revised By' and 'Revision Date' columns, as well as the new 'Revised From' column, will be updated to reflect the update from the transfer log.
• There is an "Export" button in the "Transfer Log" header bar. "Export" will allow the user to open or save an Excel version of the Transfer Log. Only those records that fall within the specified filters will be included when the log is
exported. The user has the option to 'de-‐identify residents' when exporting the log. If this option
is selected, all personal identifying information is masked.
Column Name Description Resident The title of this column is based on the “Term used for Clients” in the Facility
(Admin -‐> Setup -‐> General Configuration) and will display “Last Name, First Name (Resident ID#)
Date of Transfer This column displays the date of transfer from the census event as MM/DD along with the day of the week on which the resident was transferred. In addition, the time of day of the transfer will display based on the time in the census event and is based on the following:
• Morning – if the transfer occurred from 07:00am to 11:59am • Afternoon – if the transfer occurred from 12:00pm to 6:59pm (18:59) • Evening – if the transfer occurred from 7:00pm (19:00) to 11:59pm (23:59) • Night – if the transfer occurred from 12:00am (00:00) to 06:59am
Purpose of Stay This column displays either Post-‐Acute or Chronic Long-‐Term based on the following based on the payer type in the census event:
• Post-‐Acute if the payer type is a PPS payer • Chronic Long-‐Term if the payer type is anything else. For Canadian clients,
the default will always be Chronic Long-‐Term. • For Stop Billing census events, the system will determine the value based
on the Payer of the previous census event If a primary payer has not been entered, this column will be blank. This field can be edited here.
Transferred To This column displays the hospital selected in the “To/From Location” field in the census event. If a hospital has not been selected, this column will be blank. This field can be edited here.
Ordered By This column displays the value selected in the “Ordered By” field as “Last Name, First Name”. If an individual has not been selected, this column will be blank. This field can be edited here.
Reason This column displays the value selected in the “Reason for Transfer” field. If a reason for transfer has not been selected, this column will be blank. This field can be edited here.
eINTERACT Hospital Transfers User Guide – October 2013
Page 12
Column Name Description Planned This column displays Yes or No based on the value of the “Planned / Unplanned”
radio buttons. If the transfer was planned, this column will display Yes. If the transfer was unplanned, this column will display No. If a planned or unplanned has not been selected, this column will be blank. This field can be edited here.
Outcome This column displays the value selected in the “Outcome of Transfer field. If an outcome has not been selected, this column will be blank. This field can be edited here.
There are four fields added to census in order to capture data for the transfers:
• Ordered by -‐ Name of physician ordering the transfer from the facility back to the hospital. So if there is a MD entered their name will be listed, however, this is not a mandatory field. In this field there is also an option for emergency transfer (not necessarily an MD decision).
• Reason – Why was resident transferred to hospital? System defined pick list – values cannot be added to the list. Field not mandatory.
• Planned -‐ Yes/No field. Was the transfer planned or did something happen to cause the resident to be transferred out? If the transfer was planned we don’t want to capture the information in trends and metrics since there is nothing the facility can do about a planned transfer.
• Outcome -‐ What happened when we sent them to the hospital? ER visit only, admitted observation, admitted inpatient, admitted status uncertain, other. Predefined list – not editable. This becomes important when we look at our metrics. This field drives a lot of the metrics.

eINTERACT Hospital Transfers User Guide – October 2013
Page 13
TRENDS Trends take the admissions and transfers and plot various trends so the user can identify patterns. The user has the ability to filter by Dates to display trends from a selected period of time. A maximum of one year’s data may display at one time. Current month will not be included in trends since only full 30 day periods are included in the calculations. Six Trends are included:
Admissions to Our Facility by Day of Week Admissions to Our Facility by Hospital (Top 5 Hospitals) Transfers from Our Facility by Time of Day Transfers from Our Facility by Doctor (Top 5 Doctors) Transfers from Our Facility by Outcome Transfers from Our Facility by Reason
• All Trends are displayed in both graph and table form • Both graphs and tables may be exported • Each trend is displayed in an expandable/collapsible section so the user can choose which trends
to view • The trends will only include admissions and unplanned transfers where the To/From Type
selected is mapped to an External Facility Type of Hospital with “Include in Hospital Rates” selected. There is an information icon at the top of the page next to the Hospital Transfers heading that displays this information.
Details included in all trends are found in the table below:
Column Name Description Admissions to Our Facility by Day of Week
This displays admissions by day of the week: Monday through Sunday. The day of the week is based on the date of admission. The percentage of admissions on each day is calculated as Total Number of Admission for Specific Day / Total Number of Admissions.
Admissions to Our Facility by Hospital (Top Five Hospitals)
This displays the top five hospitals with the most admissions, in order. This also displays “All Other Hospitals” as a sixth value and “Not Recorded” as a seventh value for instances where a hospital was not selected. The hospital is based on the “To / From Location” for each admission. The percentage of admissions for each hospital is calculated as Total Number of Admission for Specific Hospital / Total Number of Admissions for All Hospitals.
Transfers from Our Facility by Time of Day
This displays all transfers for the four “Times of Day” in the following order: Morning (7:00 am -‐ 11:59 am) Afternoon (12:00 pm -‐ 6:59 pm) Evening (7:00 pm -‐ 11:59 pm) Night (12:00 am -‐ 6:59 am)
The time of day is based on the time of the admission. The percentage of transfers for each time of day is calculated as Total Number of Transfers for a Specific Time of Day / Total Number of Transfers. This is not available for Canadian Clients.

eINTERACT Hospital Transfers User Guide – October 2013
Page 14
Column Name Description Transfers from Our Facility by Doctor (Top Five Doctors)
This displays the top five Doctors with the most transfers, in order. This also displays “All Other Doctors” as a sixth value, “Emergency Transfer” as a seventh value and “Not Recorded” as an eighth value for instances where a Doctor was not selected. The Doctor is based on the “Ordered By” for each transfer. The percentage of transfers for each Doctor is calculated as Total Number of Transfers for Specific Doctor / Total Number of Transfers for All Doctors.
Transfers from Our Facility by Outcome
This displays all outcomes of transfers, in the order of the “Outcome of Transfer” picklist. This also displays “Not Recorded” as an addition value for instances where an outcome was not selected. The outcome is based on the “Outcome of Transfer” for each transfer. The percentage of transfers for each outcome is calculated as Total Number of Transfers for Specific Outcome / Total Number of Transfers.
Transfers from Our Facility by Reason
This displays all reasons for transfers, in the order of the “Reason for Transfer” picklist. This also displays “Not Recorded” as an addition value for instances where a reason was not selected. The reason is based on the “Reason for Transfer” for each transfer. The percentage of transfers for each reason is calculated as Total Number of Transfers for Specific Reason / Total Number of Transfers.
Examples:
Number of admissions to the facility for each day of the week – percentage and plotted on graph.

eINTERACT Hospital Transfers User Guide – October 2013
Page 15
Same data but looking at the admitted from field: How many admissions from a particular hospital? Five most common hospitals listed by name – anything other falls under all other hospitals.
Items listed in transfer log, which are included in hospital rates. This trend is only looking at unplanned transfers. Time of day – morning/ afternoon /evening/ night (US only).

eINTERACT Hospital Transfers User Guide – October 2013
Page 16
Transfers from our facility by doctor: Five most common transferring physicians and emergency transfers:
Transfers from our facility by outcome:
eINTERACT Hospital Transfers User Guide – October 2013
Page 17
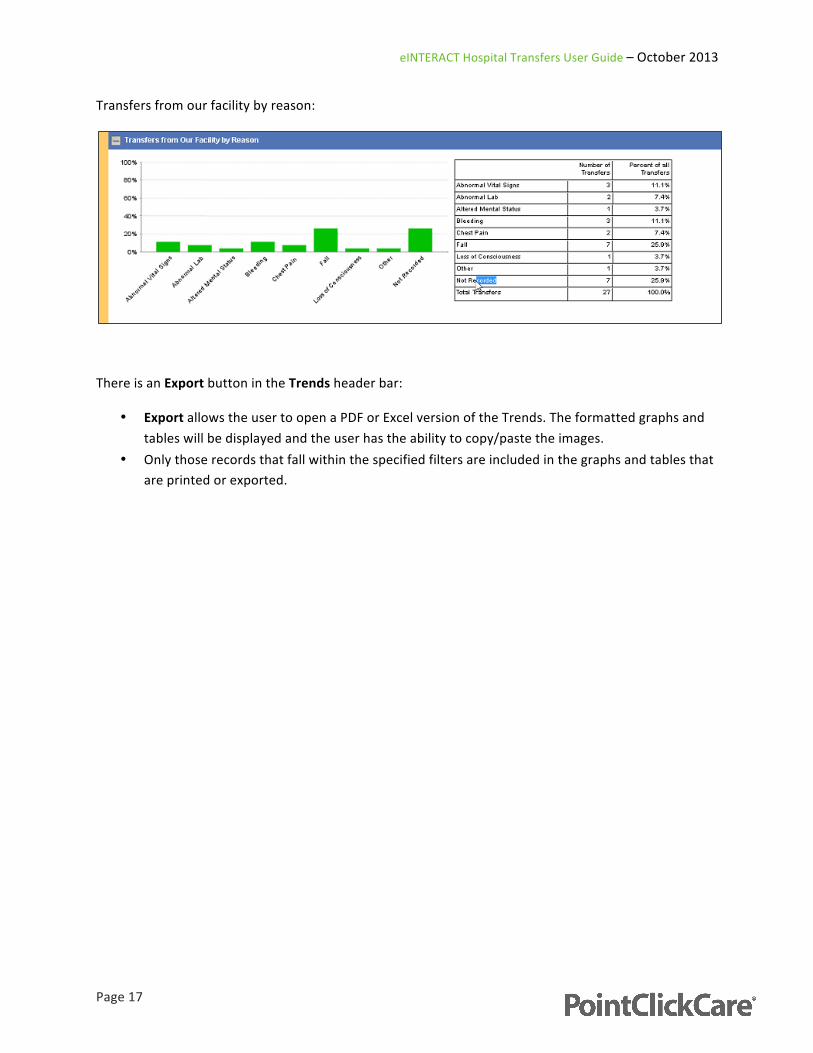
Transfers from our facility by reason:
There is an Export button in the Trends header bar:
• Export allows the user to open a PDF or Excel version of the Trends. The formatted graphs and tables will be displayed and the user has the ability to copy/paste the images.
• Only those records that fall within the specified filters are included in the graphs and tables that are printed or exported.
eINTERACT Hospital Transfers User Guide – October 2013
Page 18
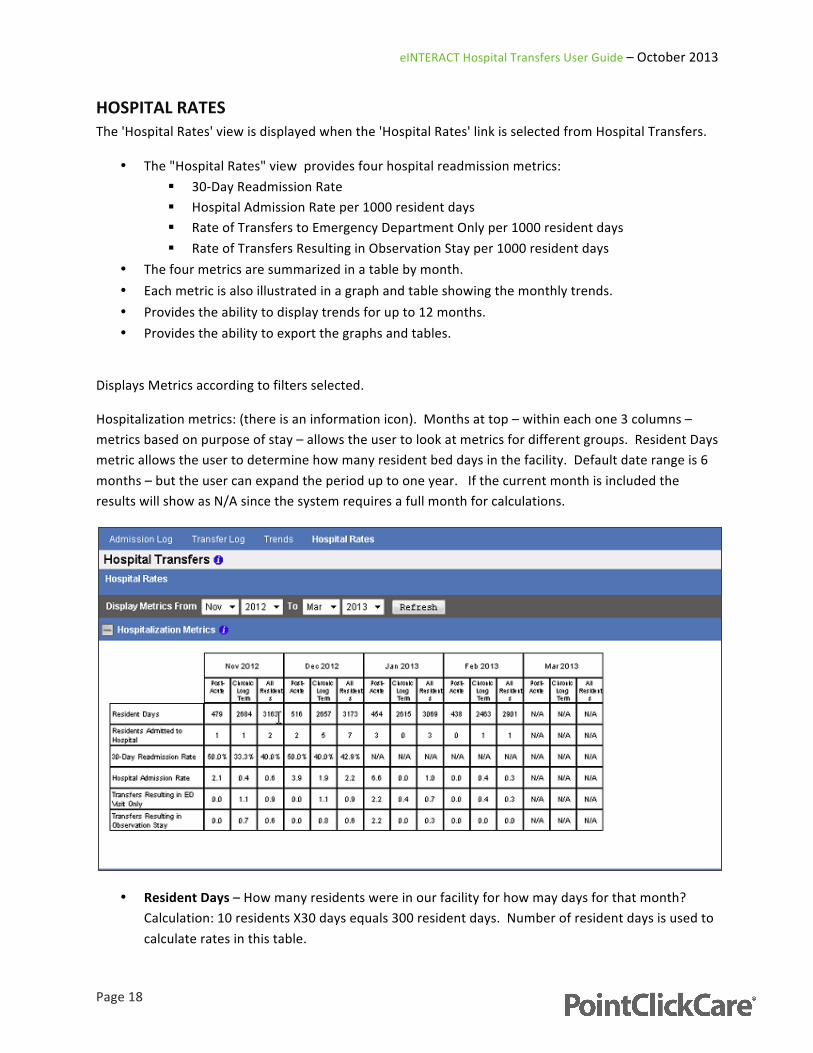
HOSPITAL RATES The 'Hospital Rates' view is displayed when the 'Hospital Rates' link is selected from Hospital Transfers.
• The "Hospital Rates" view provides four hospital readmission metrics: 30-‐Day Readmission Rate Hospital Admission Rate per 1000 resident days Rate of Transfers to Emergency Department Only per 1000 resident days Rate of Transfers Resulting in Observation Stay per 1000 resident days
• The four metrics are summarized in a table by month. • Each metric is also illustrated in a graph and table showing the monthly trends. • Provides the ability to display trends for up to 12 months. • Provides the ability to export the graphs and tables.
Displays Metrics according to filters selected.
Hospitalization metrics: (there is an information icon). Months at top – within each one 3 columns – metrics based on purpose of stay – allows the user to look at metrics for different groups. Resident Days metric allows the user to determine how many resident bed days in the facility. Default date range is 6 months – but the user can expand the period up to one year. If the current month is included the results will show as N/A since the system requires a full month for calculations.
• Resident Days – How many residents were in our facility for how may days for that month? Calculation: 10 residents X30 days equals 300 resident days. Number of resident days is used to calculate rates in this table.

eINTERACT Hospital Transfers User Guide – October 2013
Page 19
• Residents Admitted to the Hospital – Residents from transfer logs who were transferred to a hospital from the facility in the time period specified and the transfers were unplanned. This is also where we start looking at the outcome of transfer. For residents to be considered as admitted to a hospital, the outcome of transfer needs to be either admitted inpatient or admitted status uncertain.
• 30 day Readmission Rate -‐ Corresponds with the red triangle icons in the log. Residents who were admitted from a hospital in the month who were also transferred back to a hospital within 30 days of their admission. Anyone who meets those criteria will be shown in this field. CALCULATION: Percentage is derived from the Number of Residents transferred back to the hospital divided by the number of residents admitted from hospital to determine the 30 day readmission rate.

eINTERACT Hospital Transfers User Guide – October 2013
Page 20
• Hospital Admission Rate-‐ CALCULATION: Number of residents transferred to the hospital with a status of admitted or admitted status uncertain divide by number of resident days and then multiply by 1000. Information is displayed per 1000 resident days.
• Transfers Resulting in ED Visit Only-‐ Transfers from facility to hospital include in hospital rates – not planned. Outcome ED visit only
• Transfers Resulting in Observation stay: Same criteria but outcome is observation stay. Displayed per 1000 resident days.
NOTE: When columns contain N/A this indicates the data can’t be calculated because the 30 day readmission rate requires us to track a resident for a full 30 days after admission before obtaining metrics.
There is an Export button in the Hospital Rates header bar:
• Export allows the user to open a PDF or excel version of the metrics. The formatted graphs and tables are displayed and the user has the ability to copy/paste the images.
• Only those records that fall within the specified filters are included in the graphs and tables that are printed or exported.