eiuglobal commodity forecast (1)
TRANSCRIPT
Global economics
World commodity forecasts: industrial raw materials
January 2012
Economist Intelligence Unit 26 Red Lion Square London WC1R 4HQ United Kingdom

Economist Intelligence Unit
The Economist Intelligence Unit is a specialist publisher serving companies establishing and managing operations across national borders. For 60 years it has been a source of information on business developments, economic and political trends, government regulations and corporate practice worldwide.
The Economist Intelligence Unit delivers its information in four ways: through its digital portfolio, where the latest analysis is updated daily; through printed subscription products ranging from newsletters to annual reference works; through research reports; and by organising seminars and presentations. The firm is a member of The Economist Group.
London Economist Intelligence Unit 26 Red Lion Square London WC1R 4HQ United Kingdom Tel: (44.20) 7576 8000 Fax: (44.20) 7576 8500 E-mail: [email protected]
New York Economist Intelligence Unit The Economist Group 750 Third Avenue 5th Floor New York, NY 10017, US Tel: (1.212) 554 0600 Fax: (1.212) 586 0248 E-mail: [email protected]
Hong Kong Economist Intelligence Unit 60/F, Central Plaza 18 Harbour Road Wanchai Hong Kong Tel: (852) 2585 3888 Fax: (852) 2802 7638 E-mail: [email protected]
Geneva Economist Intelligence Unit Boulevard des Tranchées 16 1206 Geneva Switzerland Tel: (41) 22 566 2470 Fax: (41) 22 346 93 47 E-mail: [email protected]
This report can be accessed electronically as soon as it is published by visiting store.eiu.com or by contacting a local sales representative.
The whole report may be viewed in PDF format, or can be navigated section-by-section by using the HTML links. In addition, the full archive of previous reports can be accessed in HTML or PDF format, and our search engine can be used to find content of interest quickly. Our automatic alerting service will send a notification via e-mail when new reports become available.
Copyright © 2012 The Economist Intelligence Unit Limited. All rights reserved. Neither this publication nor any part of it may be reproduced, stored in a retrieval system, or transmitted in any form or by any means, electronic, mechanical, by photocopy, recording or otherwise, without the prior permission of The Economist Intelligence Unit Limited.
All information in this report is verified to the best of the author's and the publisher's ability. However, the Economist Intelligence Unit does not accept responsibility for any loss arising from reliance on it.
ISSN 1351-8976
Symbols for tables �0 or 0.0� means nil or negligible; �n/a� means not available; ��� means not applicable
Printed and distributed by IntypeLibra, Units 3/4, Elm Grove Industrial Estate, Wimbledon, SW19 4HE, UK

Contents 1
World commodity forecasts: industrial raw materials January 2012 www.eiu.com © The Economist Intelligence Unit Limited 2012
Contents
2 Economist Intelligence Unit commodity price index
5 Aluminium
13 Coal
22 Copper
31 Cotton
41 Crude oil
49 Gold
57 Lead
63 Natural gas
72 Natural rubber
78 Nickel
84 Steel
90 Tin
97 Wool
104 Zinc
111 Statistical appendix
Editors: Caroline Bain (editor); Danny Richards (consulting editor)
Editorial closing date: December 13th 2011
All queries: Tel: (44.20) 7576 8000 E-mail: [email protected]
Next report: To request the latest schedule, e-mail [email protected]

2 Economist Intelligence Unit commodity price index
World commodity forecasts: industrial raw materials January 2012 www.eiu.com © The Economist Intelligence Unit Limited 2012
Economist Intelligence Unit commodity price index
The prices of most commodities fell sharply in late September-early October 2011 amid a broader sell-off of more risky financial assets. Prices fell amid increasing concerns about a slowdown in the global economy in 2012 and uncertainty surrounding the eventual outcome of the ongoing sovereign debt crisis in the euro zone. Signs of somewhat slower growth in China, by far the largest single market for base metals, also unsettled commodity markets. Prices of a few commodities�particularly crude oil�regained some ground during October and November, but for the most part industrial raw material prices remained at these lower levels. Towards the end of November and in early December markets started to reflect optimism about the possibility of a comprehensive package of measures to support European sovereigns and the single currency being announced after a "make or break" summit of EU leaders in early December. Early indications are that the measures announced have failed to shore up market confidence, and by mid-December commodity prices were easing back.
Prices will continue to weaken in 2012 owing to slower consumption growth and, depending on the commodity, some improvement on the supply front. However, low global interest rates and a loss of confidence in sovereign creditworthiness, which is encouraging investors to seek return in real assets, will offer support to prices.
Our overall commodity price index rose by 24% in 2010, boosted by a surge in prices of over 45% for industrial raw materials (IRM). Continued investor interest in commodities in an environment of ultra-low interest rates and ample liquidity pushed the IRM index up sharply in the first half of 2011 (by around 42% year on year), but lower prices in the second half of the year are estimated to have pulled the annual average rise in the index down to 23%. This weaker momentum will carry through into 2012, when the WCF index is expected to fall by around 10%, before prices stabilise in 2013.
Gold (which is not included in the IRM index) is perhaps the one metal that is likely to benefit from the prevailing global economic uncertainty. Investor demand�both physical and speculative�is expected to continue to support prices in the short term, as investors seek a "safe haven" in an environment of low interest rates (and negative real interest rates), further quantitative easing (at least in Europe) and concerns about the stability of the global financial system. Central banks, which had been net sellers of gold for decades, turned net buyers in 2010, and this is expected to continue in 2012-13 as part of efforts to diversify reserve asset holdings away from an over-reliance on the US dollar. However, we expect investor interest in gold to start to decline in late 2012 owing to the prospect of some normalisation of monetary conditions moving into 2013 and somewhat stronger global growth, leading to a marked weakening of gold prices.
International demand for metals will be supported to some extent in the coming months by the recovery in manufacturing and by reconstruction work in Japan in the wake of last year's March earthquake and tsunami. However,
Disappointing supply outlooks will support some metals prices
Gold prices will start to slip in late 2012 as global growth prospects improve

Economist Intelligence Unit commodity price index 3
World commodity forecasts: industrial raw materials January 2012 www.eiu.com © The Economist Intelligence Unit Limited 2012
this will be counterbalanced by weak demand in the EU and the US and somewhat slower growth in China's consumption. Following the sharp drop in base metals prices in late September, we now expect the base metal index to rise by only 14% in 2011. Metals prices are expected to remain weak and to fall by 2.6% on an annual average basis in 2012, before starting to recover in 2013 in tandem with stronger economic growth. Even so, supply fundamentals in some base metal markets, particularly tin and copper, suggest that the markets will remain tight. Were consumption growth to surprise on the upside in 2012, then industrial raw material prices would move higher (particularly as copper has a heavy weighting in the IRM index).
We expect China to remain the primary source of demand growth during the forecast period, but in the next two years Chinese consumption growth will ease as a result of government measures to cool the property market, efforts to curb emissions and weaker external demand, which will lead to slower output growth. These negative trends will, however, be partially offset by the return of looser monetary conditions as inflationary pressures subside. In the medium to longer term metals prices will remain volatile, given that mine output can easily be hampered by inclement weather, energy shortages, transport bottlenecks, union activity or a difficult regulatory environment. However, robust growth in the developing world and ongoing urbanisation will limit the annual average drop in industrial raw materials prices in 2012-13 to barely 1%. There is a risk that prices could weaken more markedly if investors were to lose faith in the long-term prospect for commodity prices.
Price forecast summary (US$ index, 1990=100; % change year on year)
Index % 2009 2010 2011 2012 2013 2009 2010 2011 2012 2013WCF 154.0 190.6 242.8 216.3 207.6 -22.3 23.8 27.4 -10.9 -4.0IRM 132.7 192.9 236.9 212.9 215.1 -25.6 45.4 22.8 -10.1 1.0 Base metals 143.4 200.9 229.5 223.7 231.8 -28.5 40.1 14.2 -2.6 3.6 Fibres 86.0 122.3 175.5 128.3 115.8 -11.5 42.2 43.5 -26.9 -9.7 Rubber 209.9 379.9 522.2 427.4 430.8 -25.6 81.0 37.5 -18.2 0.8Crude oil 277.3 357.0 497.6 425.8 437.1 -36.7 28.7 39.4 -14.4 2.6
Note. WCF (World commodity forecasts) is an index of 21 hard and soft commodities. IRM (Industrial raw materials) is a price index of nine hard commodities. The metals sector has a weighting of 65.1% in the IRM index, fibres 27.4% and rubber 7.5%. IRM has
Source: Economist Intelligence Unit.
The price of Brent (dated Blend) dropped sharply in the wake of the broad commodities sell-off in late September, falling from a range of US$110-US$115/barrel in the middle of the month to well below US$105/barrel. Prices subsequently rallied in November, as the publication of a report by the International Atomic Energy Agency (IAEA) sparked renewed concerns about Iran's uranium enrichment programme. However, disappointment following the lacklustre EU summit in early December saw prices slipping back again. Uncertainty surrounding the extent of the global economic slowdown and the risk of a deterioration in the sovereign debt crisis in the euro zone will continue to weigh on the oil market in the first half of 2012.
Oil prices will be supported by non-OECD consumption

4 Economist Intelligence Unit commodity price index
World commodity forecasts: industrial raw materials January 2012 www.eiu.com © The Economist Intelligence Unit Limited 2012
We expect OECD oil consumption to decline steadily throughout the forecast period, reflecting heightened efforts at energy efficiency and conservation, the increased use of biofuels and subdued economic growth. In contrast, the ongoing trends of urbanisation and rising disposable incomes in the developing world, particularly China, will continue to prop up demand, thereby supporting prices. The supply picture, meanwhile, is set to improve, with additional output expected to come on stream in OPEC member states, particularly Iraq, and the gradual resumption of Libyan production.
Given that we now expect a return to a market surplus in 2012 and some building of stocks, we expect oil prices to move lower at an annual average of US$95/barrel. Somewhat stronger economic growth prospects in 2013 will lead to some recovery in prices, but the expected market surplus in that year will prevent a significant increase.
Economist Intelligence Unit commodity price index (1990=100)
2011 2012 2013 2014 1 Qtr 2 Qtr 3 Qtr 4 Qtr 1 Qtr 2 Qtr 3 Qtr 4 Qtr 1 Qtr 2 Qtr 3 Qtr 4 Qtr 1 QtrUS$ index WCF 259.8 255.5 239.0 217.1 219.9 217.6 213.1 214.6 212.7 210.7 204.8 202.1 203.9IRM 264.2 253.6 228.4 201.2 208.7 212.7 212.8 217.6 218.7 220.4 212.9 208.4 210.1 Base metals 247.4 240.7 229.4 200.7 213.2 221.9 224.1 235.5 236.4 238.4 228.8 223.7 227.7 Fibres 214.4 202.9 148.6 136.3 136.6 131.4 127.2 117.8 118.1 120.0 114.7 110.2 107.0 Rubber 589.8 548.8 509.4 440.8 431.0 428.1 425.2 425.2 430.1 429.1 431.0 433.0 431.0Crude oil 470.2 525.0 504.2 490.8 448.3 425.8 412.4 416.9 425.8 434.8 439.3 448.3 448.3
% change, year on year WCF 48.1 49.7 25.6 -3.8 -15.4 -14.8 -10.8 -1.2 -3.3 -3.2 -3.9 -5.8 -4.1IRM 44.6 39.7 24.5 -10.2 -21.0 -16.1 -6.9 8.2 4.8 3.6 0.0 -4.2 -3.9 Base metals 25.5 27.3 19.1 -10.8 -13.8 -7.8 -2.3 17.3 10.9 7.4 2.1 -5.0 -3.7 Fibres 103.2 83.2 29.5 -13.8 -36.3 -35.2 -14.4 -13.6 -13.5 -8.7 -9.9 -6.4 -9.4 Rubber 74.4 46.8 44.2 -3.0 -26.9 -22.0 -16.5 -3.6 -0.2 0.2 1.4 1.8 0.2 Crude oil 36.9 48.9 47.2 26.2 -4.7 -18.9 -18.2 -15.1 -5.0 2.1 6.5 7.5 5.3
Note. WCF (World commodity forecasts) is an index of 21 hard and soft commodities. IRM (Industrial raw materials) is a price index of nine hard commodities. The metals sector has a weighting of 65.1% in the IRM index, fibres 27.4% and rubber 7.5%. IRM has a weighting of 44.4% in the WCF index.
Source: Economist Intelligence Unit.
Economist Intelligence Unit commodity price index(US$ index; 1990=100)
Source: Economist Intelligence Unit.
0
50
100
150
200
250
300
0
100
200
300
400
500
600Oil; right scaleWCF; left scaleIRM; left scale
141312111009080706050403022001

Aluminium 5
World commodity forecasts: industrial raw materials January 2012 www.eiu.com © The Economist Intelligence Unit Limited 2012
Aluminium
The Economist Intelligence Unit estimates global aluminium consumption at 5.2% in 2011, a marked slowdown from 2010, when consumption expanded by 14.1%. Global primary aluminium consumption was up by 6% year on year in January-September 2011, according to the World Bureau of Metal Statistics (WBMS). China's apparent consumption was relatively modest during this nine-month period, rising by 7.8% year on year, partly offsetting the strong perform-ance in the EU (particularly in Germany, where consumption swelled by 11.3%). However, the EU is expected to struggle to maintain this pace in the final quarter, owing to the persistent economic turmoil that continues to undermine business confidence and investment. Despite weak global economic growth in 2012, our forecast of only a moderate slowdown in growth in global aluminium consumption, to 4.4%, is based on the assumption that supply chains, particularly in the automotive sector, will have recovered fully by the early part of the year (having been disrupted by the March 2011 earthquake in Japan and recent heavy flooding in Thailand). Global aluminium consumption growth will improve in 2013, to 4.8%, supported by demand in the developing world underpinned by increasing car ownership in countries such as China and India. Alongside its use in the construction, consumer goods and packaging sectors, the metal's lightweight properties also ensure that it will remain in considerable demand in terms of producing fuel-efficient cars and aircraft.
Consumption in Japan, which accounted for 5.1% of world aluminium con-sumption in 2010, is estimated to have shrunk in 2011 owing to the severe disruptions to the manufacturing supply chain and consumer sentiment as a result of the earthquake and nuclear disaster in March. Although supply chain disruptions appeared to have eased early in the second half of the year, industrial production fell by a revised 3.3% year on year in September and was also 3.3% lower than the previous month, the first monthly decline since March, suggesting that the recovery momentum had slowed. Supply-chain disruptions to the automotive sector stemming from severe floods in Thailand in October-November will have further hampered car production in Japan. Before the floods worsened, Toyota had claimed that its automotive output had returned to normal levels in September, aided by a temporary workforce that helped to make up for the post-earthquake decline in output. However, the Thai floods forced the firm to stop production at three Thai assembly plants (producing parts needed in Japan's manufacturing process) at the beginning of October. Global production for other Japanese carmakers, including Nissan and Mitsubishi Motors, was also affected, but by mid-November most carmakers, with the exception of Honda, had restarted operations. We expect Japan's aluminium consumption to drop by 8% in 2011 as a whole. A combination of base effects and higher demand stemming from the post-quake reconstruction phase will boost aluminium consumption, by 7.5% in 2012. Growth is forecast to slow to 3.5% in 2013 as the effect of the reconstruction-based recovery wanes and higher base effects kick in. However, the effect from the reconstruction effort may be more constrained, given the possibility that large amounts of aluminium scrap from the disaster could be recycled.
Demand
Thai floods dampen aluminium demand in Japan and further afield

6 Aluminium
World commodity forecasts: industrial raw materials January 2012 www.eiu.com © The Economist Intelligence Unit Limited 2012
US automotive production (and aluminium demand) in the fourth quarter of 2011 will also be constrained by disruption to supply chains as some materials are sourced from Thailand. Apparent aluminium consumption growth in the US had already averaged a lacklustre 3.4% in the first nine months of 2011, with this sluggish growth in part reflecting the fact that Japanese carmakers in the US had to cut production owing to the problem of sourcing parts from Japan earlier in the year. Subdued economic growth means that only a marginal improvement is likely in 2012-13�we expect that aluminium consumption will rise by an average of just 1% over the next two years, down from 2.2% in 2011. The risk is also on the downside, given the potential for further disruption in the euro zone to constrain growth in the US, with particularly negative conse-quences for the automotive sector.
Year-on-year growth in apparent consumption in the EU was robust in the first nine months of 2011 (standing at 8.9% year on year), fuelled by continued expansion in Germany's automotive sector. However, consumer and business confidence has been severely damaged by the further deterioration in the outlook for the euro zone, and we have revised down again slightly our estimate of aluminium consumption growth in 2011 to 7%. Our forecast for growth in 2012 stands at 0.5%, with consumption of aluminium constrained by weak regional GDP growth, moribund property markets, fiscal tightening and the end of the restocking cycle. We forecast that aluminium consumption growth will strengthen somewhat in 2013, to 1.5%, but the risk is on the downside given the potential for the sovereign debt crisis to deepen, depressing regional economic growth for longer.
We expect aluminium consumption growth in China, which accounts for around 40% of global demand, to slow to 6.7% in 2011, following an increase of 10.5% in 2010. Apparent consumption growth stood at 7.8% in the first nine months of 2011, in part owing to the high base period and also probably some inventory drawdown. We expect that growth during the final quarter of the year will have been held back by still-tight monetary policy, more restrained investment and relatively weak demand for new cars. Given the weak global economic outlook, which will restrict China's exports of manufactured pro-ducts, we expect aluminium consumption to continue to grow at a rate of around 6% a year in 2012-13. The expansion of the country's high-speed rail infrastructure will support consumption, although there are some doubts about the future of the project following the high-speed train crash in Zheijang province in eastern China in July. However, the current leadership appears determined to keep the economy on track before a leadership transition in 2012.
In Brazil, aluminium consumption rose by an estimated 11.7% in 2011, supported by the government's growth acceleration programme (PAC), which focuses on infrastructure development. Consumption was fuelled further by continued rapid growth in car ownership, the start of a construction boom ahead of the football World Cup in 2014 and the Olympic Games in 2016, and further expansionary fiscal policies (the latest of which was a cut in tax on petrol that was announced in late September). The country is having to rely increasingly on imports to satisfy its growing demand, owing in part to capacity constraints. Although demand for aluminium will be curbed somewhat by the fact that
Consumption growth in Brazil will stay strong, despite slowing GDP growth
EU consumption growth will slow amid economic weakness
China's demand will continue to drive global consumption growth
US demand will remain lacklustre

Aluminium 7
World commodity forecasts: industrial raw materials January 2012 www.eiu.com © The Economist Intelligence Unit Limited 2012
Brazil's economy has begun to slow, the authorities appear intent on easing policy, and the ongoing construction work in preparation for the World Cup and the Olympic Games will provide sufficient support, such that aluminium consumption growth will average more than 15% a year in 2012-13.
Under India's 12th five-year plan, which commences in April 2012, the govern-ment plans to invest heavily in the country's urbanisation and infrastructure development. This should support demand for aluminium during the five years of the plan, although the pace of growth in consumption may be relatively slow in the early part of this period. There will be large-scale investments to tackle energy shortages, which will involve the use of aluminium for power transmission lines, while the government's tax breaks for wind-farm projects and renewable energy sources will boost demand for aluminium for use in the production of wind turbines. According to the latest data from the WBMS, apparent consumption rose by 7.4% year on year in January-September 2011, but reflecting the slowdown in car production growth in recent months, we expect consumption growth of 6.8% for the year as a whole. Although we do not expect car production growth to return to the high of around 30% recorded in 2010, it will be fairly strong in the coming years, and we therefore expect aluminium consumption to expand by around 9% a year in 2012-13.
Primary aluminium: consumption ('000 tonnes unless otherwise indicated)
2009 2010 2011 2012 2013China 14,300 15,805 16,864 17,835 18,836EU 5,100 6,767 7,241 7,302 7,412
US 3,854 4,242 4,340 4,361 4,428Japan 1,523 2,025 1,863 2,003 2,073
India 1,458 1,475 1,575 1,714 1,868South Korea 1,038 1,255 1,306 1,350 1,420
Brazil 799 985 1,100 1,270 1,472Russia 750 685 689 702 741Canada 571 577 585 602 620
Others 5,371 5,846 6,150 6,423 6,792World total 34,764 39,661 41,713 43,562 45,662 % change -5.8 14.1 5.2 4.4 4.8
Sources: World Bureau of Metal Statistics (WBMS); Economist Intelligence Unit.
Global primary aluminium production growth is estimated to slow to 5% in 2011, following an expansion of 11.2% recorded in 2010, when independent Chinese smelters restarted idle capacity and large smelters in the Gulf Co-operation Council (GCC) came on stream. Although slowing, domestic demand growth in China is likely to have encouraged local producers to operate at high levels in 2011, leaving little room for the restart of production at idle smelters in North America or western Europe. High-cost aluminium producers are likely to cut back capacity if aluminium prices remain at their current lows�Aluminium Corp of China has stated that prices are now close to the costs of production. Meanwhile, environmental issues and energy constraints will also act to limit output growth both in China and globally. In the light of these restrictions, alongside the rising cost of bauxite, there will be an increased focus on boosting the use of recycled aluminium in place of refining new metal. Given all these
Supply
India's 12th five-year plan will spur demand for aluminium

8 Aluminium
World commodity forecasts: industrial raw materials January 2012 www.eiu.com © The Economist Intelligence Unit Limited 2012
trends, we forecast that global primary aluminium production will stand at 4.1% a year in 2012-13.
In 2010 China's output expanded by 25.6%, totalling 16.2m tonnes, equivalent to around 40% of global output. Restrictions on electricity usage and high energy costs hampered aluminium production in 2011, so that output growth is estimated at just 7%. Under its five-year plan, the government has committed to lowering energy usage by 16% in 2015 from 2010 levels. The expansion of the industry will also be constrained by regulation over the next few years: the government has instructed local authorities to stop approving the construction of new aluminium smelting capacity, as part of efforts to reduce growth in energy-intensive industries. Furthermore, the government is reportedly plan-ning to reduce export tax rebates for semi-finished aluminium products (the current level of this rebate for some producers is 13%). The appreciation of the renminbi is also eroding the competitiveness of China's aluminium exports.
Nevertheless, new capacity is being built. Alcoa (US) and the China Power Investment Corporation signed a Memorandum of Understanding in January 2011, agreeing to work together on US$7.5bn worth of clean aluminium and energy projects. In July the National Development and Reform Commission (NDRC), China's senior economic planner, also approved a 1m-tonne alumina project based in the north-western Shanxi province. Meanwhile, the Baiyun district intends to increase its aluminium capacity to 450,000 tonnes/year (t/y) during the 12th five-year plan. On balance, however, we forecast that pro-duction growth will slow to an annual average of 3.2% in 2012-13. (Data from China�s National Bureau of Statistics show that aluminium output was only up by 0.3% year on year in October.) Limited supplies of raw materials could also hamper output growth in the medium term, as reportedly Indonesia's government may limit exports for bauxite from 2014�Indonesia accounts for 80% of China's bauxite imports. Nevertheless, Chinalco's planned increase in bauxite production, alongside further mineral discoveries, are expected to ensure that China's domestic bauxite production should maintain a respectable rate of growth over the next two years.
In India, aluminium production growth is estimated to slow to 6.3% in 2011, from 8.9% in 2010, as environmental concerns remaining an obstacle to some of India's aluminium producers. However, as companies gear up to meet the expected increase in domestic demand, plans for new projects continue to be put forward. We therefore expect output growth to average 7.1% a year in 2012-13. Hindalco (India) has stated that it is commissioning a series of projects to boost aluminium smelting capacity to 1.8m t/y from 600,000 t/y currently, but has said that it is struggling to commission projects because of uncertainty regarding the country's regulatory environment. India's National Aluminium Company Limited (Nalco) still plans to build a 500,000-t/y aluminium smelter in Orissa, despite being refused approval for setting up the project in Jharsuguda on environmental grounds, with the company looking into alternative sites. However, it has not ruled out the possibility of locating the smelter outside Orissa.
The issue of energy conservation and efficiency continues to gain importance globally, not only in response to environmental concerns, but also because of
China's output will be constrained by shortages of energy and raw materials
India will increase supply to meet expanding demand
EC plans to increase emphasis on environmental impact of production

Aluminium 9
World commodity forecasts: industrial raw materials January 2012 www.eiu.com © The Economist Intelligence Unit Limited 2012
the high cost of energy and energy shortages in some countries. Conversely, although aluminium boasts environmentally friendly features because of its lightweight properties for cars, the production of the metal is hugely energy-intensive, accounting for around 50% of the aluminium industry's production costs. In September the European Commission (EC) launched its roadmap for a resource-efficient Europe, and this will result in a reassessment of the environmental impact of aluminium production. There have been calls for the assessment to consider not only the environmental damage from the production of a material, but also the environmental benefits stemming from the use of that material, including not only its use but also its capabilities for recycling. The EC's roadmap also calls for increased investment in recycling. Given that prevailing high energy prices are behind shutdowns and the holding back of new primary aluminium projects, it is unsurprising that the market for recycled aluminium is already gaining ground.
Production of aluminium in Latin America is estimated to remain weak in 2011, dropping by 3.5% (mainly owing to a sluggish performance in Brazil), following a contraction of 8.1% in 2010. We expect output to rise in 2012-13, by 1.7% a year, owing to a low base of comparison and continued economic growth in the region that encourages investment, but the risk to our forecast is on the downside. Brazil accounts for around 60% of production in the region, but the country has not increased capacity since 1985, and production capacity has now fallen to 1.5m t/y. Brazil's primary aluminium production was 1.07m tonnes in the first nine months of 2011, a decline of 7.1% year on year, according to the WBMS. Reportedly, aluminium companies want the government to abol-ish import duties because of the tight supply conditions in the domestic market. Although it has depreciated recently, the relatively strong Real makes importing aluminium more favourable, while hurting exporters. Nevertheless, a Norweg-ian firm, Norsk Hydro, has boosted its capacity in Brazil, increasing output at the Alunorte refinery, the world's largest refinery, to 6.3m tonnes this year.
Elsewhere in Latin America, Venezuelan output is being held back by insufficient investment in capacity, and the country has had to import large amounts of the metal. The building of the Serlaca aluminium rolling plant in Venezuela, which began in 2008, has come to a halt; the plant had been scheduled to start operations in 2013. Reportedly, this was because of financial issues.
Data from the WBMS suggest that Russia's aluminium output rose by only 1.2% year on year in January-September 2011. However, Rusal is reportedly making progress on projects for new smelters and modernisation of existing plants�the 600,000-t/y smelter at the Boguchanskoya energy and metals complex on the Angara river is expected to start producing aluminium by the end of the first quarter of 2013. Rusal also recently received loan approval to finance the construction of its 750,000-t/y Taishet smelter near Irkutsk in September; it aims to commence operations in 2013.
Nevertheless, in line with this apparent weak performance, and also reflecting the recent announcement by Rusal that it had cut its planned output increase to 1% for 2011 as a whole (from 2% previously), we estimate that supply increased by a mere 0.8% in 2011. However, we forecast that Russia's output will grow by
Capacity constrains could limit growth in production in Brazil
Output in Russia is expected to rise as new capacity comes on stream

10 Aluminium
World commodity forecasts: industrial raw materials January 2012 www.eiu.com © The Economist Intelligence Unit Limited 2012
just under 4% a year in 2012-13, as increased capital expenditure improves existing plants and new projects.
Production in the Middle East remains strong, and there are plans for major capacity expansion. Production capacity in the Gulf region was not directly affected by the unrest in parts of the Middle East and North Africa, and we expect output growth in the region to reach 8.2% in 2011, to around 3.5m tonnes, driven by rapid growth in Qatar. We forecast that aluminium production growth will rise in the next two years, with output reaching 4.1m tonnes in 2013 as new capacity comes on stream. Plans for new plants in the region continue to make progress. Although the Qatalum project in Qatar has faced delays, production capacity has reached 585,000 t/y (the target for the first phase of development), according to reports published at the end of September. Emal-Emirates Aluminium in Abu Dhabi (Dubai Aluminium and Mubadala Group) has completed its first phase of development, with a capacity of 750,000 tonnes, which will rise to close to 1.5m t/y on completion of the second phase, which is scheduled for end-2014. Financing for the second phase of the development has now been secured. Similarly, Ma'aden Bauxite and Alumina Company (a joint venture between Ma'aden and Alcoa) has signed funding contracts for the second phase of their joint-venture project in Saudi Arabia. The first phase, comprising an aluminium smelter (with a capacity of 740,000 t/y) and rolling mill, will begin operating in 2013, and the second, comprising a mine and refinery (with a capacity of 1.8m t/y), will come on stream in 2014.
We estimate strong growth in US production in 2011, following a year of flat growth in 2010 and a contraction of 35% in 2009. Growth will remain positive in 2012-13, with new capacity coming on stream. For example, Noranda Aluminium Holding has announced plans to expand production at its 263,000-t/y New Madrid plant by 6% in 2013. Canadian production fell by 2.2% in 2010, but output is expected to grow by 1.8% in 2011 and to expand by an annual average of over 5% in 2012-13, as more capacity comes on stream. Rio Tinto has invested more than US$1bn to expand and modernise its operations in Saquenay-Lac-Saint-Jean Quebec and its Kitimat smelter in British Colombia.
Primary aluminium: production ('000 tonnes unless otherwise indicated)
2009 2010 2011 2012 2013China 12,891 16,194 17,328 17,900 18,450
Russia 3,815 3,947 3,979 4,129 4,287Canada 3,030 2,963 3,017 3,205 3,349Middle East 2,745 3,188 3,449 3,750 4,100
EU 2,399 2,654 2,712 2,739 2,835Latin America 2,510 2,307 2,226 2,253 2,300
Australasia 2,214 2,272 2,317 2,401 2,461US 1,727 1,727 1,921 1,980 2,080Africa 1,690 1,742 1,822 1,910 2,005
India 1,479 1,610 1,711 1,823 1,965Others 2,699 2,766 2,940 3,050 3,177
World total 37,198 41,371 43,423 45,139 47,009 % change -6.2 11.2 5.0 4.0 4.1
Sources: WBMS; International Aluminium Institute (IAI); Economist Intelligence Unit.
North American production is expected to continue to grow
Growth in output in the Middle East will be rapid

Aluminium 11
World commodity forecasts: industrial raw materials January 2012 www.eiu.com © The Economist Intelligence Unit Limited 2012
Stocks of aluminium at the London Metal Exchange (LME) and the International Aluminium Institute (IAI) picked up in the first quarter of 2011, reaching nearly 6.2m tonnes at the end of March. Stocks then dipped to 6m tonnes at the end of June, edged up to 6.1m tonnes by end-August before dipping again to just under 6m tonnes by end-September. Excess stocks still weigh on the market. Indeed, we expect stocks to rise in 2012-13, albeit at a slower pace towards the latter part of the forecast period, as the market will be in oversupply. It is possible that stocks could be released if investors expect aluminium prices to fall or if rising interest rates increase the costs of financing the stocks, but there have been significant delays in accessing stocks owing to the concentration of holdings in LME-registered warehouses in Detroit. Although the market surplus is set to shrink over the next two years, the stock picture will remain healthy, with total reported market stocks providing more than 50 days' consumption. However, the market appears tighter than the stock picture suggests, owing to the fact that access to these warehoused stocks remains difficult.
Primary aluminium: supply and demand ('000 tonnes unless otherwise indicated)
2009 2010 2011 2012 2013Global production 37,198 41,371 43,423 45,139 47,009
Global consumption 34,764 39,661 41,713 43,562 45,662Balance 2,434 1,710 1,711 1,578 1,347Total reported market stocks 5,833 5,669 6,280 6,700 6,750Days' consumption 61 52 55 56 54
Sources: WBMS; Economist Intelligence Unit.
Prices for aluminium have remained on a general downward trend since May 2011. During the heavy sell-off in late September aluminium prices dropped below US$2,200/tonne for the first time in 12 months, and in October they averaged US$2,171/tonne before slipping below the US$2,000/tonne level in late November. The recent selling activity was a reflection of deepening fears of a slowdown in the US economy as well as uncertainty about the fate of the euro zone and the increasing fragility of economic growth within the region. Amid the current economic environment, aluminium prices are being influenced less by the traditional supply and demand factors than by investor sentiment.
Meanwhile, the delays at LME warehouses have created concerns about metal availability, which, coupled with uncertainties about the market environment and prices, have been deterring investors from purchasing forward contracts. We expect prices to average US$2,420/tonne in 2011, and we forecast that they will fall in 2012 to US$2,300/tonne in response to the gloomy economic outlook and easing energy prices. Certainly, the market for the metal is tight and prices have already dropped to what is deemed to be a breakeven point for many producers, which could prevent a sharper downturn in prices. In 2013 prices will edge upwards, reflecting an improvement in global demand and higher production costs, both in terms of energy and for raw materials (with bauxite being in tight supply).
Stocks and prices
Prices will hold up relatively well, despite market surpluses

12 Aluminium
World commodity forecasts: industrial raw materials January 2012 www.eiu.com © The Economist Intelligence Unit Limited 2012
Primary aluminium: stocks and prices 2010 2011 2012 2013 2014Stocksa 1 Qtr 5,769 6,142 6,350 6,740 6,6502 Qtr 5,612 5,960 6,489 6,800 -3 Qtr 5,641 5,978 6,648 6,720 -4 Qtr 5,669 6,280 6,700 6,750 - % change -2.8 10.8 6.7 0.7 -
Pricesb 1 Qtr 2,163 2,500 2,250 2,400 2,4002 Qtr 2,096 2,603 2,300 2,400 -3 Qtr 2,089 2,400 2,225 2,350 -4 Qtr 2,343 2,178 2,425 2,370 -Year 2,173 2,420 2,300 2,380 - % change 30.5 11.4 -5.0 3.5 -
a Total reported producer and LME stocks, end-period; '000 tonnes rounded. b LME cash price, US$/tonne.
Sources: London Metal Exchange (LME); Economist Intelligence Unit.
Primary aluminium: stocks and prices
Sources: London Metal Exchange; Economist Intelligence Unit.
0
1,000
2,000
3,000
4,000
5,000
6,000
7,000
8,000
0
500
1,000
1,500
2,000
2,500
3,000
3,500
4,000
Prices (US$/tonne); right scaleStocks ('000 tonnes); left scale
141312111009080706052004

Coal 13
World commodity forecasts: industrial raw materials January 2012 www.eiu.com © The Economist Intelligence Unit Limited 2012
Coal
Growth in global demand for coal is forecast to average 4.3% per year in 2012-13, down from an estimated 5.4% in 2011. Demand growth will ease in 2012 as the global economy slows, before picking up moderately in 2013. The Economist Intelligence Unit currently does not expect a sharper slowdown because, to date, the worsened outlook for the EU and the US has not had a substantial impact on our forecasts for China and India. Nevertheless, these economies are expected to slow, and the ongoing crisis in the euro zone means that risks are to the downside. China will continue to provide by far the largest spur to coal demand during the period (although efforts to curtail emissions are likely to have some impact). India will be another important driver of demand, as it continues to pursue its rural electrification plans. Demand in the EU is forecast to ease in 2012, owing to a sharp deterioration in economic performance in the euro zone. US consumption is also forecast to decline in 2012, owing to the increasing use of natural gas in electricity generation and as the economy slows in that year.
Developments in China, which accounted for around 46% of global coal consumption in 2010, will remain central to global coal demand in 2012-13. China relies on coal for more than 80% of its power generation. The country became a net importer of thermal coal in 2007, and the world�s second-largest importer (after Japan) in 2010, when it imported 90m tonnes of thermal coal. Consumption growth is estimated at 8% in 2011, as the Chinese economy continued to expand rapidly.
There are already signs of a slowing of economic activity in China. However, a recent decline in inflation has boosted expectations that the government will raise electricity tariffs to help the country�s power plants. These are struggling with very high coal prices, threatening renewed power shortages, and face a tightening of emission standards in January 2012. Higher electricity tariffs would support demand for coal, especially imports. Despite rapid growth in recent months, thermal coal imports were down by 12.7% year on year in January-October 2011, to 38m tonnes, partly owing to a steep fall in early 2011 on the back of high international prices.
We continue to expect a moderate easing of coal demand growth in 2012-13, in line with a cooling of the wider economy. Efforts to curtail emissions may also constrain coal consumption, but ongoing expansion in coal-fired power-generating capacity will mean that growth will still notch up an annual average rate of 6.3% in 2012-13.
In the US, coal consumption bounced back by 5% in 2010, after a sharp 11% fall in 2009. However, unfavourable base effects, only slight growth in electricity generation owing to subdued economic growth, and increased electricity gener-ation from natural gas, hydropower and other renewables mean that coal con-sumption is estimated to decline by 1.5% in 2011. The presence of relatively cheap, readily available and "cleaner" natural gas is leading to a shift away from coal-fired power generation, while coal consumption is likely to be constrained by efforts to curtail carbon emissions. With US economic growth forecast to slow sharply
Demand
Chinese coal demand growth will ease in tandem with economic growth
US consumption will decline

14 Coal
World commodity forecasts: industrial raw materials January 2012 www.eiu.com © The Economist Intelligence Unit Limited 2012
again in 2012, we expect electricity demand to be lower, and for coal consumption to decline by 3.5% in that year, followed by a stabilisation in 2013, as economic growth picks up and gas prices rise.
Data from the EU's statistical body, Eurostat, show that growth in coal con-sumption in the EU picked up sharply to 8.1% year in January-May 2011. Coal demand is expected to be boosted in 2011 by sharply higher gas prices.
Much of the growth in coal consumption is accounted for by Poland, the EU's second-largest coal consumer. Polish coal consumption rose by 15.5% year on year in January-June 2011. Surprisingly, Poland avoided a contraction in economic output during the global crisis in 2008-09, and has been one of the EU�s fastest-growing economies since then.
Consumption is also growing (albeit much more modestly) in Germany, the EU's largest consumer of coal�by 1.3% year on year in January-June 2011. Economic growth remained relatively strong in Germany in 2011. Moreover, despite Germany�s environmental credentials, its decision, in the wake of the Japanese nuclear crisis, to close eight of its 17 nuclear power stations (the remaining plants are to be closed by 2022) is likely to provide some support to coal consumption.
We expect growth in EU coal consumption to ease in the second half of 2011, in line with a slowdown in the EU economy. Nevertheless, growth is likely to have been relatively strong for the year as a whole, at a revised 5%. Economic performance in both Poland and Germany, as in the wider EU, is forecast to worsen considerably in 2012, when real GDP in the EU as a whole is forecast to contract slightly. We therefore expect coal demand to slip in 2012, before posting limited growth in 2013 as the European economy picks up. The subdued demand outlook will be further constrained by concerns about carbon emis-sions, with some countries turning to gas or renewables for new power-generation capacity.
Coal consumption in the robust Indian economy has grown rapidly in recent years, averaging 8.5% per year in 2006-10 according to Energy Information Administration (EIA) data, including growth of 10.8% in 2010. With a relatively closed economy, India should be fairly well protected from the global downturn. Coal consumption is therefore expected to continue to rise strongly, boosted by the long-term plan to raise thermal power-generation capacity in an effort to increase access to electricity in rural areas. In its five-year plan for the period 2012-17, the Indian government envisages that the rate of annual demand growth could stay at around 8%.
Problems with accessing sufficient domestic coal supplies to meet demand are likely to remain the main constraint on consumption; in October 2011 there were power outages (blamed on a shortage of coal) in a number of states and in the capital, New Delhi, leading to public protests in some areas. The Ministry of Coal estimates that there will be a production shortfall of 142m tonnes in fiscal year 2011/12 (April-March), and the country�s Planning Commission has cautioned that the gap could rise to as much as 200m tonnes by 2016/17. Coal imports have risen strongly�they were up by 51% year on year in April-October 2011�and private Indian companies and Coal India, the state-owned
The demand profile in the EU is weak
Indian consumption should be relatively protected from global woes

Coal 15
World commodity forecasts: industrial raw materials January 2012 www.eiu.com © The Economist Intelligence Unit Limited 2012
coal producer, are increasingly interested in acquiring coal assets overseas to fill the domestic supply gap. However, there is a technical limit to the share of imported coal that can be used by domestic power-plant boilers. Moreover, the failure of domestic electricity tariffs to keep pace with the high cost of imports is now reported to be limiting demand for the latter.
In Japan, coal consumption grew by 14% in 2010, as the wider economy bounced back from recession. The Japanese economy is expected to post a small contraction in 2011, owing to the devastating earthquake and tsunami in March, which also damaged several thermal power stations. Coal consumption is therefore estimated to decline in 2011. However, with these plants now coming back into operation, coal demand is likely to be boosted in the medium term by the impact of the nuclear crisis.
The contribution of nuclear power to electricity generation is now expected to fall over the next ten years, owing to public safety concerns. Partly for energy security reasons, coal is viewed as an important alternative to oil for electricity generation, and will continue to account for a substantial share of Japan's total energy supply well into the future, despite concerns about its damaging environmental impact. In a sign of renewed interest in coal, in June Japan's Itochu trading house agreed to pay US$1.5bn for a 20% stake in a new Colombian mining partnership with Drummond (US). After jumping in 2011, the share of coal in total electricity generation is forecast to remain significantly higher in 2012-13 than before the nuclear crisis. A bounce-back in Japanese economic activity in 2012 following the slowdown in 2011 should also support energy demand.
Elsewhere in Asia, which is expected to remain the fastest-growing of the main global regions in 2012-13, coal-fired generation features as a key element of economic development plans, despite the associated environmental concerns. This is the case, for example, in Indonesia, which is in the process of imple-menting an intensive programme of coal-fired power plant construction, as part of plans to electrify rural areas. PLN, the state electricity supplier, projects that its coal consumption could rise to 95m tonnes in 2015, up from 41m tonnes in 2010. In Vietnam, the state-run PetroVietnam has plans for five new coal-fired plants to become operational by 2015 and to build 90 by 2025, leading to a sharp rise in coal consumption, including imports. Even South Korea�the world�s third-largest importer of coal�is finding it a challenge to implement its "green growth" policy announced in 2008, and is likely to remain heavily reliant on coal-fuelled power stations.
Australian coal consumption is expected to grow in 2012-13, with the carbon tax due to be introduced in July 2012 unlikely to have a major impact over the forecast period. The tax will be introduced at A$23/tonne (around US$25/tonne), and will apply to 500 businesses with the highest emission levels, including power stations and coal mines. It will rise by 2.5% per year until it is replaced in 2015 by an emissions trading scheme. One of the aims of the new system is to encourage a switch in power generation away from coal towards natural gas and renewables.
Australian carbon tax will have a limited impact
Japanese demand for coal to benefit from nuclear troubles
Indonesia and Vietnam see coal as the way forward

16 Coal
World commodity forecasts: industrial raw materials January 2012 www.eiu.com © The Economist Intelligence Unit Limited 2012
Coal: consumption (m tonnes unless otherwise indicated)
2009 2010 2011 2012 2013China 3,152 3,387 3,658 3,896 4,130US 905 951 937 904 904
EU 719 718 754 746 750India 622 689 748 810 875Russia 202 206 209 213 219
Japan 165 188 186 193 198South Africa 181 183 188 193 199
Australia 136 109 111 113 116Turkey 93 100 105 109 114South Korea 103 114 121 128 136
World total 6,874 7,289 7,681 7,995 8,355 % change 3.2 6.0 5.4 4.1 4.5
Sources: Energy Information Administration (EIA); Economist Intelligence Unit.
Global coal production is estimated to have rebounded strongly in 2010, growing by 6.2%, as high prevailing prices and a recovery in consumption encouraged the growth in supply. China and Indonesia led the way in output growth in 2010, with increases of 9% and 19% respectively. We expect global output growth to remain at around this rate in 2011, despite a continued dis-appointing performance in India and some disruptions to supply in other key producers, owing to continued rapid growth in Chinese output. Production growth is forecast to ease to an annual average of 4.5% in 2012-13, in line with slower demand growth.
China has hiked coal output in recent years�by an average of 9% per year in 2007-10�although this has not been enough to keep pace with growing domestic demand. Output continued to grow robustly in 2011: coal production increased by 12.2% year on year in January-October 2011, according to the China Coal Transportation and Distribution Association, including 7.3% year-on-year growth in October.
A considerable amount of new capacity is expected to come on stream by the end of the forecast period, which should partly offset the loss of output from mines considered dangerous or environmentally damaging. There are ongoing efforts to improve safety standards, particularly at smaller mines (which account for around 30% of production). The process of mergers and acquisitions in the coal mining industry should lead to a marked reduction in the number of mines in China, but efficiency gains will support output growth. In 2010 China shut down 2,173 mines with a total capacity of 231m tonnes/year, and the 12th five-year plan for the coal industry, which is expected to be released soon, targets further consolidation of the mining sector in 2011-15.
The government is showing some signs of seeking to constrain coal output. This is partly owing to concerns that reserves are being used up too quickly, but also to environmental considerations. The country's 2011-15 five-year plan for the first time sets climate change targets and envisages a decline in coal's share in energy consumption. However, this will still see the addition of an extra 260 gw in coal-fired power generation (albeit with part of this being to help
Supply
Solid domestic demand will support China's output growth

Coal 17
World commodity forecasts: industrial raw materials January 2012 www.eiu.com © The Economist Intelligence Unit Limited 2012
compensate for the closure of older facilities, which will be replaced with lower-emission plants). Other factors could also limit supply, including safety concerns, depleting mines, particularly in eastern China, and infrastructure constraints, although plans are in place to improve rail and port transport in the coming years. On the whole, given the requirements of the still rapidly developing economy, China's production is expected to grow at a steady pace in 2012-13, albeit at a somewhat slower rate than in recent years as demand growth eases.
US production grew by just 1% in 2010, following a drop of around 8% in 2009, according to the EIA. We expect output to decline in 2011 as domestic con-sumption eases, partly because of the availability of cheap and plentiful natural gas. Even though US coal exports rose sharply in 2011, coal production fell by 0.1% year on year in January-October, according to EIA data. Such factors are expected to continue to constrain output in 2012-13. Given our forecast of slower US growth in 2012, we expect production to ease again in that year.
After growing rapidly in 2005-09, by an annual average of 6.5% according to EIA data, growth in coal production in India slowed sharply to 2.5% in 2010. According to the Indian authorities, output was down by 2.5% year on year in the first five months of the current fiscal year (April-August), and performance is estimated to have weakened further in September-October. State-owned Coal India (the largest coal producer in the world, accounting for over 85% of total Indian output) has blamed the production shortfall since 2009 mainly on delays in obtaining environmental clearances for more than 150 projects. In 2011 output was also hit by heavy rains and industrial action in October.
India has ambitious coal output targets in its five-year plan covering the period 2012-17, which foresees output rising by 7% annually to 770m tonnes by 2017 (although even this growth would see a rising import requirement). The govern-ment is finally moving on overcoming the regulatory obstacles to greater coal production. On the assumption that substantial progress on this is nevertheless likely to take time, we forecast only a moderate pick-up in annual production growth during our forecast period, to 5% by 2013.
In the early part of 2011 Australia's production was disrupted by severe flood-ing in Queensland, with the mines only slowly coming back into production over the course of the year. Growth in Australian production should pick up in 2012-13, assuming no further weather-related disruptions to supply. Output will be supported by the opening of new mines in New South Wales and Queensland. Progress is also being made in addressing infrastructure shortcomings with, for example, work on boosting coal export capacity at the Port of Newcastle in New South Wales making good progress. The country's carbon tax, which is due to come into effect in July 2012, has caused a great deal of controversy and given rise to dire warnings of the impact on the coal industry, but government projections envisage coal production more than doubling by 2050.
Ramped up Indonesian coal production has accounted for much of the growth in global coal supplies in recent years, encouraged by burgeoning demand from China and especially India, which is expected to supplant Japan in 2011 as
US production is forecast to fall
Australian production will benefit from new mine openings
Indonesian growth to continue despite unfavourable government policy
India's output is expected to continue to underperform

18 Coal
World commodity forecasts: industrial raw materials January 2012 www.eiu.com © The Economist Intelligence Unit Limited 2012
Indonesia's largest coal market. However, there is persistent uncertainty about the operating environment, particularly as the government is seeking to guarantee domestic supply to meet the country's growing power needs. The possible introduction in 2014 of a ban on exports of coal with an energy value of below 5,100 kilocalories/kg has emerged as a key concern for domestic producers. The government has also suggested that it might introduce a moratorium on new mining permits, in order to settle existing disputes over permits. These uncertainties, together with a growing environmental lobby and concern about deforestation, have clouded the investment environment at a time of rising domestic and external demand.
Nevertheless, although production was down by around 1% year on year in the first quarter of 2011 as a result of wet weather, the Indonesian association of coal miners, APBI, expects output to grow by up to 14% in 2011. Given expect-ations of robust domestic and external demand, output is forecast to grow by an average of 6% per year in 2012-13.
Output in Russia was hit hard by a serious accident in May 2010, which closed main coal mine belonging to Raspadskaya, the country's largest underground mine and coking coal producer. Output has been growing in year-on-year terms since April 2011 and has accelerated since then, supported by base effects. Output was up by 3.2% year on year in January-October 2011, including 10.5% year-on-year growth in October.
Russian output growth is expected to continue to recover in 2012-13, posting annual average growth of over 4% during the period, as Raspadskaya restores output. Russian coal output will also be supported in the coming years by external demand. Russia's long-term coal development plans envisage a diversification away from traditional Western export markets towards the fast-growing Asia-Pacific region. China is set to become an increasingly important export market.
Increased domestic consumption and a strategic shift away from gas towards coal in thermal power plants should also support coal output. The govern-ment's energy strategy to 2030 envisages substituting coal for gas in thermal power stations, raising coal's share in electricity generation to 34-36% by 2030 from 26% in 2008. Kemerovo region in western Siberia, which accounts for more than one-half of the country's total output, has announced investment plans totalling US$28bn in 2011-25, with 22 new coal mines to be launched, helping to raise the region's output by 41% by the end of the period, from 186m tonnes in 2010.
South Africa has seen only sluggish growth in coal output for a number of years. Coal production is reported to have grown by just 1.3% in 2010. The industry is facing a myriad of problems that will continue to constrain output. South Africa's state-owned Eskom�the largest electricity producer in Africa�has complained that a lack of new coal mine development in the country during the last several years has put pressure on its coal supplies. The rail network is also proving inadequate, having suffered years of underinvestment. Plans to increase the capacity of Transnet, the state-owned railroad operator, to
Russian output will continue to recover
South Africa's coal industry will disappoint amid myriad constraints

Coal 19
World commodity forecasts: industrial raw materials January 2012 www.eiu.com © The Economist Intelligence Unit Limited 2012
81m tonnes of coal for export by 2015, from 62m tonnes in fiscal year 2010/11 (April-March), look ambitious.
According to the latest data from Statistics South Africa, coal output was 0.2% lower year on year in January-September 2011, partly owing to strike action in July. We forecast annual average growth of just 1.3% in 2012-13.
In the EU, latest Eurostat data show coal production rebounding in 2011 after falling by 5.1% in 2009 and a further 1.7% in 2010. Output across the EU was up by 6.2% year on year in January-May 2011. Output in Germany, the EU�s largest coal producer, was up by 1.1% year on year in January-June. Growth was higher in Poland (the bloc�s second-largest producer), at 4.9% year on year in January-June. EU-wide output growth was driven higher by rapid (in some cases double-digit) year-on-year growth in Bulgaria, Romania, Greece, the Czech Republic and the UK. EU output growth is forecast to ease in 2012-13 on the back of weaker demand.
Coal output in Colombia�the world�s fourth-largest coal exporter�bounced back in the third quarter of 2011 after rains and flooding earlier in the year, and was up by 11% year on year in January-September, according to Ingeominas, the mining regulator. With rising Asian demand and the expansion of the Panama Canal opening up Asian markets to Colombian exports, companies investing in Colombia have ambitious output targets. Colombia's largest coal mine, Cerrejon, which is owned by BHP Billiton, Xstrata and Anglo American, aims to boost annual capacity from 32m tonnes to 40m tonnes in the short term, and eventually to 60m tonnes. Prodeco, the Colombian coal operation of Swiss-based Glencore International, plans to double annual output to 20.7m tonnes by 2015, while Drummond (US) plans to raise annual output to 35m tonnes in 2014, from 25m currently.
Coal: production (mine output; m tonnes unless otherwise indicated)
2009 2010 2011 2012 2012China 3,050 3,321 3,687 3,945 4,201
US 975 985 980 950 955India 555 569 557 574 603
Australia 399 407 415 432 447Russia 297 311 322 335 350Indonesia 302 359 398 426 447
South Africa 247 251 251 254 257Germany 185 184 185 186 186
Kazakhstan 102 111 115 119 124Colombia 73 75 82 86 91
World total 6,967 7,401 7,861 8,207 8,586 % change 2.3 6.2 6.2 4.4 4.6
Sources: EIA; Economist Intelligence Unit.
A strong rebound in production will have been more than adequate to meet the increase in demand in 2010. As a result, the market surplus is estimated to have risen to 112m tonnes, with a further rise to 180m tonnes in 2011 owing to continued strong output growth. Steady growth in production should enable the market to remain in surplus throughout 2012-13.
Stocks and prices
Leading producers in Colombia have ambitious output targets
The outlook for the EU is weaker owing to the poor economic forecast

20 Coal
World commodity forecasts: industrial raw materials January 2012 www.eiu.com © The Economist Intelligence Unit Limited 2012
Coal: supply and demand (m tonnes)
2009 2010 2011 2012 2013Production 6,967 7,401 7,861 8,207 8,586Consumption 6,874 7,289 7,681 7,995 8,355
Balance 93 112 180 211 231
Sources: EIA; Economist Intelligence Unit.
Thermal coal prices rose sharply in the first quarter of 2011, to an average of US$129/tonne (their highest level since the third quarter of 2008), owing to concerns about supply from Australia following severe flooding in Queensland and sustained strength in consumption. The early and severe start to winter in the northern hemisphere offered further support to prices, as did the prospect of reduced nuclear power in Japan and a switch to coal-fired electricity. Prices eased somewhat in the second quarter, to US$120/tonne, as coal participated in the sell-off in commodities in May. Despite the deteriorating global economic picture and falls in other commodity prices, coal prices held up, averaging US$120.6/tonne in the third quarter of 2011. However, prices have been gradually easing since early October, reaching around US$113/tonne in mid-November. Prices are expected to remain supported against any steep fall in the remainder of 2011 by still-robust consumption growth and the high price of alternative fuels�crude oil and liquefied natural gas (LNG) in the Pacific region. With signs already emerging that global economic growth is rapidly losing steam, in addition to a widening market surplus, prices are forecast to decline in 2012-13, but to remain high by historical standards.
Coal: prices 2010 2011 2012 2013 2014Pricesa 1 Qtr 95.19 128.99 110.00 100.00 110.002 Qtr 99.49 120.00 107.00 105.00 -3 Qtr 93.55 120.61 105.00 105.00 -4 Qtr 107.63 115.00 105.00 110.00 -Year 98.97 121.15 106.75 103.25 - % change 37.8 22.4 -11.89 -3.28 -
a Australian, thermal, Newcastle/Port Kembla, US$/metric tonne.
Sources: World Bank; Economist Intelligence Unit.
Coal prices are forecast to ease, but to remain high by historical standards

Coal 21
World commodity forecasts: industrial raw materials January 2012 www.eiu.com © The Economist Intelligence Unit Limited 2012
Coal: prices(Australian, thermal, Newcastle/Port Kembla, US$/m tonne)
Sources: World Bank; Economist Intelligence Unit.
0
20
40
60
80
100
120
140
160
180
141312111009080706052004

22 Copper
World commodity forecasts: industrial raw materials January 2012 www.eiu.com © The Economist Intelligence Unit Limited 2012
Copper
The Economist Intelligence Unit estimates that growth in global copper consumption in 2011 slowed to 2.8%, from 5.6% in 2010. In addition to weak demand in the EU and US, the main restraining factor for copper demand in 2011 was monetary tightening in China, reflected in a slowdown in growth in manufacturing activity and construction (particularly residential) as well as a lack of access to credit, which has seen copper fabricators struggle to finance working inventories. The improvement witnessed in apparent Chinese demand since early in the third quarter was not necessarily driven by real consumption but by restocking, the bulk of which is mainly being done by merchants, with fabricators still largely reliant on hand-to-mouth strategies until credit market conditions improve. Therefore, the steady drawdown of stocks on the London Metal Exchange (LME) in October-November was a case of merchants exploiting low prices and arbitrage opportunities to build inventories in anticipation of future demand from consumers rather than an improvement in real consumption.
World refined copper consumption is forecast to grow by 3.2% in 2012, as policy loosening in China leads to restocking at fabricators and underpins an acceleration in growth in that country, even though export-related demand will be subdued owing to weakness in the US and EU. We also expect a return to growth in India, South Korea and Taiwan in 2012. World consumption is expected to increase by 4.6% in 2013, as the US and EU recover, but China and emerging Asian markets will continue to be the main drivers of global copper demand growth.
China's copper buyers ran down their working inventories to low levels during 2010, and many manufacturers continued to destock or, at best, adopt hand-to-mouth strategies during much of 2011. (Most did not engage in the usual restocking activity that tends to characterise the peak demand period between March and June.) However, restocking finally began in late 2011 (reflected in an increase in imports), and it took a significant fall in prices to trigger it. The broad-based sell-off that affected many markets in early August and again in late September saw copper prices on the LME fall faster than those on the Shanghai Futures Exchange (SHFE), and the resulting price differential made importing copper into China viable. Chinese buying activity picked up accordingly, with premiums strengthening in Shanghai and Singapore and LME cancelled warrants and physical withdrawals at Asian warehouses increasing as metal was shipped into China.
Arbitrage activity became more sporadic in November compared with October and September, and premiums, although still elevated, came off their recent highs. This suggests that buying appetite has waned slightly, although activity is still fairly robust and imports for November and December are likely to have remained above the 250,000-tonne level. It is important to clarify the origins of the stronger import demand since the middle of the year. We believe that merchants exploiting price dips and arbitrage opportunities are the dominant buyers, not genuine consumers of physical metal. China's copper fabricators still do not have access to sufficient credit lines to finance significant restocking,
Demand
Bargain hunting has led to a surge inChinese imports

Copper 23
World commodity forecasts: industrial raw materials January 2012 www.eiu.com © The Economist Intelligence Unit Limited 2012
so much of the metal arriving is destined, at least in the first instance, for merchants' stockpiles and not necessarily for consumption.
Merchants are confident that consumers� inventories are low and will need replenishing at some point in the coming few months, even against a back-ground of concerns about the outlook for demand in overseas markets, such as the EU. Worries about the outlook for growth could result in Chinese monetary policy being loosened, which would provide a boost to downstream demand for refined copper in China, and merchants will get the increase in demand they are anticipating. We therefore maintain a fairly optimistic view of Chinese copper demand, despite the knock-on effect of economic slowdowns in the US and EU. Growth remains on track to meet our full-year estimate in 2011 of 5.5%, and we expect an acceleration to 6% in 2012 and 8% in 2013. Indeed, at this point, we believe that the risks to these forecasts are on the upside.
There is some concern in the copper market that a slowdown in European and US economic growth will act as a drag on China and other emerging-market economies with significant trade exposure to the West. However, the vast majority of China's copper demand is driven by the domestic economy. In any case, China's government has the motivation and the means to stimulate the domestic economy if external demand falls too sharply, and recent develop-ments suggest that it is indeed starting to tinker with its policy balance in some areas. We therefore believe that Chinese copper demand is fairly well insulated from a slowdown in the Western economies. In fact, it tends to be negatively correlated, with lower copper prices associated with a Western economic slow-down triggering a pick-up in Chinese apparent demand through price-related restocking. This was the case in 2009.
Despite the estimated contraction in Japan's economy in 2011, copper consumption is expected to have recorded positive growth following a relatively swift recovery by copper fabricators from the devastating earthquake and tsunami of March 11th. The latest World Bureau of Metal Statistics (WBMS) estimates show that growth was down in year-on-year terms by just 2.5% in the nine months to September. However, production of semi-fabricated copper products increased by 0.6% year on year over the same period (to 800,623 tonnes) and imports of semis rose by 44.4% to 30,813 tonnes. These data point to good demand from copper-consuming sectors during the second and third quarters and minimal disruptions from rolling power shortages in the summer. Overall, our forecast for refined copper consumption in 2011 remains at 1.07m tonnes, which is an increase of 1.2% from 2010. We continue to forecast an acceleration in growth in 2012-13 to an annual average of 2.5%, driven by reconstruction spending.
Elsewhere in Asia, refined copper consumption growth has been surprisingly weak this year, according to WBMS data. In the nine months to September, year-on-year declines were reported in India (down by 18.8%), South Korea (down by 9%) and Taiwan (down by 13.6%). We attribute this to the effects of consumer destocking in these countries. This means that we can expect some restocking to occur following the price falls in September, which should have improved year-on-year comparisons in the final few months of the year. We
Stronger growth will come from Japan owing to reconstruction spending
Low prices have ended consumer destocking in some parts of Asia
Chinese apparent demand is negatively correlated with Western demand
Chinese consumers will take their turn restocking in 2012 and 2013

24 Copper
World commodity forecasts: industrial raw materials January 2012 www.eiu.com © The Economist Intelligence Unit Limited 2012
forecast a return to growth in all three countries in 2012-13, as stocks return to more normal levels and as the economies stabilise.
The latest data from the WBMS suggest that copper consumption in the EU contracted by 0.6% year on year in the first nine months of 2011. This is down from positive growth of 1.4% in January-August. Copper consumption is being negatively affected by the slowdown in economic growth in the region and an escalation of concerns about the stability of the euro zone. Confidence has collapsed throughout the copper supply chain and downstream orders for copper products have shrivelled against a background of uncertainty and pessimism. Our expectations are still for refined copper consumption growth of just 0.8% in 2011, with a contraction of around 2% forecast for 2012, before a return to growth, albeit of only 1%, in 2013. The risks, particularly to our shorter-term view, are on the downside, but we are reluctant to make downgrades to our forecasts, not least because data from the International Copper Study Group (ICSG) still indicate that growth is positive and comments from a leading producer, Aurubis (Germany), point to underlying consumption being better than prevailing bearish economic sentiment suggests.
WBMS figures suggest that US copper consumption growth has turned negative, reportedly contracting by 1.6% in the nine months to September. This is in line with a fall in the production of semi-fabricated copper and brass products, of 1.1% year on year over the same period. We maintain our recently revised forecast for US refined copper consumption, of a contraction this year overall of 0.5% and growth in 2012 of 1%. However, the recovery will accelerate in 2013, and we forecast growth of 2% in consumption for that year.
Refined copper: consumption ('000 tonnes unless otherwise indicated)
2009 2010 2011 2012 2013China 7,086 7,419 7,827 8,297 8,960EU 3,090 3,432 3,459 3,390 3,424
US 1,637 1,751 1,742 1,760 1,795Japan 875 1,060 1,073 1,101 1,127
South Korea 933 856 805 843 869Latin America 517 666 699 727 756Taiwan 494 532 484 494 509
Others 3,510 3,450 3,623 3,731 3,843World total 18,142 19,166 19,712 20,343 21,283 % change 0.0 5.6 2.8 3.2 4.6
Sources: World Bureau of Metal Statistics (WBMS); Economist Intelligence Unit.
Global production of refined copper rose by 3.1% in 2010, held back by tightness in the global concentrate market owing to low ore grades at ageing mines and unplanned disruptions. The same constraints were still evident in 2011, and constrained global refined production growth. Reflecting an escalation of labour disputes affecting some of the world's largest copper mines in Chile, Indonesia and Peru, we now estimate growth in global copper mine production in 2011 to be flat at best, with output falling short of targets by around 1m tonnes. In an effort to protect themselves to some extent from the disruptions to concentrate supply, smelters and refineries have increased their reliance on
Supply
EU consumption is slowing and growth may already have turned negative
Consumption growth has turned negative in the US too

Copper 25
World commodity forecasts: industrial raw materials January 2012 www.eiu.com © The Economist Intelligence Unit Limited 2012
scrap as a raw material. However, low prices in recent months have seen scrap supplies dwindling as well. In 2012-13 new investments in primary capacity, particularly in China, will underpin further modest growth in global refined copper output, which is forecast to expand by an average of 3.5% a year, providing mine supply also recovers. However, the tendency for copper mines to be disrupted by labour issues, accidents, low ore grades and other factors means that the risk of disruptions in the copper supply chain will remain high. Nevertheless, we expect that growth will be achieved by a recovery to record-high prices and falling inventories in the refined market, incentivising higher rates of scrap collection and utilisation and encouraging smelters and refineries to maximise output and run down raw material inventories.
Data for Chinese production in October from the National Bureau of Statistics (NBS) showed that output of refined copper declined for the third consecutive month, to 469,000 tonnes, compared with a record high level of 518,000 tonnes in August. With the temporary improvement in availabililty in the spot copper concentrate market owing to the shutdowns of Japanese smelters following the earthquake and tsunami in March, treatment and refining charges (TC/RCs) earned by smelters for processing the material doubled to US$150/tonne and 15 US cents/lb, respectively. This encouraged Chinese smelters to maximise capacity utilisation in the wake of the Japanese disaster. However, Japanese smelters have been returning to normal operations in more recent months, and as a result spot TC/RCs have retreated in line with a renewed tightening of the spot concentrate market. They were last reported at around US$30-40/tonne and 3-4 US cents/lb in November, from US$50/tonne and 5 US cents/lb, respectively, in September and October. The correction back to lower levels has been accelerated somewhat by mine strikes in Chile, Indonesia and Peru, which have further reduced the availability of concentrate in the spot market. This is reflected by Chinese smelters reining in capacity utilisation again. Output growth is expected to continue moderating in the coming months.
Chinese refined copper production grew by an estimated 10.4% in 2011, down from 12.9% in 2010. In 2012-13 we forecast a further slowdown in growth, to 8% a year, as the raw material markets continue to tighten. In addition, the 12th five-year plan places greater emphasis on curbing excessive energy usage and cutting emissions. This will be manifested in 291,000 tonnes/year (t/y) of "outdated" capacity being closed by the government in 2011, and there is likely to be a further quota of closures for 2012.
Although we are not surprised to see a return to a tight global copper concen-trate market in the second half of 2011 and we forecast tightness will persist thereafter, raw material availability in China will benefit from rising domestic mine production and greater scrap usage. These factors will insulate China somewhat from the effects of concentrate shortages that are expected to constrain refined production in other parts of the world.
Chinese mine production rose by just over 20% in 2010, compared with flat growth at best outside China. Momentum in the Chinese copper mining sector was maintained in 2011, with the latest data showing output up by 12% year on year during the first nine months of 2011. In terms of scrap supply, data from the ICSG indicate that Chinese refined production from secondary sources
Tighter raw material markets and lower TC/RCs take a toll on Chinese smelters
China's concentrate production and smelters' scrap usage rates accelerate
Concentrate market tightness will continue to rein in Chinese output

26 Copper
World commodity forecasts: industrial raw materials January 2012 www.eiu.com © The Economist Intelligence Unit Limited 2012
increased by 32.9% year on year in 2010, to 1.73m tonnes, far in excess of growth from primary sources, which saw an increase of only 2.8%, to 2.81m tonnes. Growth rates were more balanced in 2011 because of temporary improvements in concentrate availability and changes to scrap import regulations that had caused bottlenecks.
Globally, scrap supply, rather than concentrate, became the primary driver of world refined copper production in 2010. ICSG data show that global secondary production grew by 18.3% year on year in 2010; primary production grew by just 1.8% over the same period. Data for 2011 show that secondary copper smelters recorded growth in output of 11.9% year on year in the first eight months, to 2.39m tonnes, compared with growth of 0.5% for primary smelters (10.35m tonnes). Copper production from secondary sources in August accounted for 19.9% of total copper production, up from a monthly average of 17.1% in 2010 and around 15% in 2006-09.
Ordinarily, we would expect this trend to continue, especially given the tight outlook for the global concentrate market, which should maintain the focus on scrap as a raw material. However, with copper prices having fallen sharply in late September in response to market concerns over a global economic slowdown, the outlook for scrap has become less clear. Lower manufacturing activity threatens to reduce scrap generation, while weaker copper prices tend to reduce the incentive for scrap collection. The secondary/primary ratio is likely to continue increasing, but at a slower pace than in the last 12-18 months.
Some of the strongest growth in copper supply in recent years has been seen in Zambia, where a major programme of reinvestment in the past decade is bearing fruit. Zambia is Africa's main copper producer; it is estimated to hold 16% of the world's known copper reserves and currently accounts for about 7% of global copper production. However, government data show that output growth was weak in 2011 owing to a week-long strike at the 65,000-t/y Chambishi mine in October as well as rising costs, particularly energy tariffs (from what is already a relatively high cost base). The government had been expecting output to hit 900,000 tonnes in 2011 to keep it on course for its target of 1m t/y from 2012, but this now looks unachievable. Further forward, the government has a next-phase goal to reach 1.6m t/y by 2016. Growth will be driven by major new investments, including those by First Quantum (Canada) and Vale (Brazil), but this target also feels overambitious.
Chile, the world's largest copper miner and supplier of concentrate to Asia's major smelting groups, continues to experience stagnant growth in production of the raw material. Chilean copper mine output rose by just 0.5% year on year in 2010, to 5.41m tonnes. Production remained weak in 2011, with a decline of 4.5% year on year (to 3.82m tonnes) in January-September. Output in the first half of 2011 was only down by 2.2%, with the deterioration in the second being the result of labour unrest, including a two-week strike at Escondida that may have cost around 37,500 tonnes in lost production, and strikes at Codelco operations that cost 23,000 tonnes of copper. We expected production to rebound in September, and official data have vindicated this optimism, showing a 2.2% month-on-month increase. Providing the industry can remain relatively disruption-free for the rest of the year, annual output may recover to
Growth in output can return in Chile in 2012 if miners can stay disruption-free
Zambian production is falling short
The pace of secondary growth is likely to moderate
Globally, secondary refined production is growing faster than primary
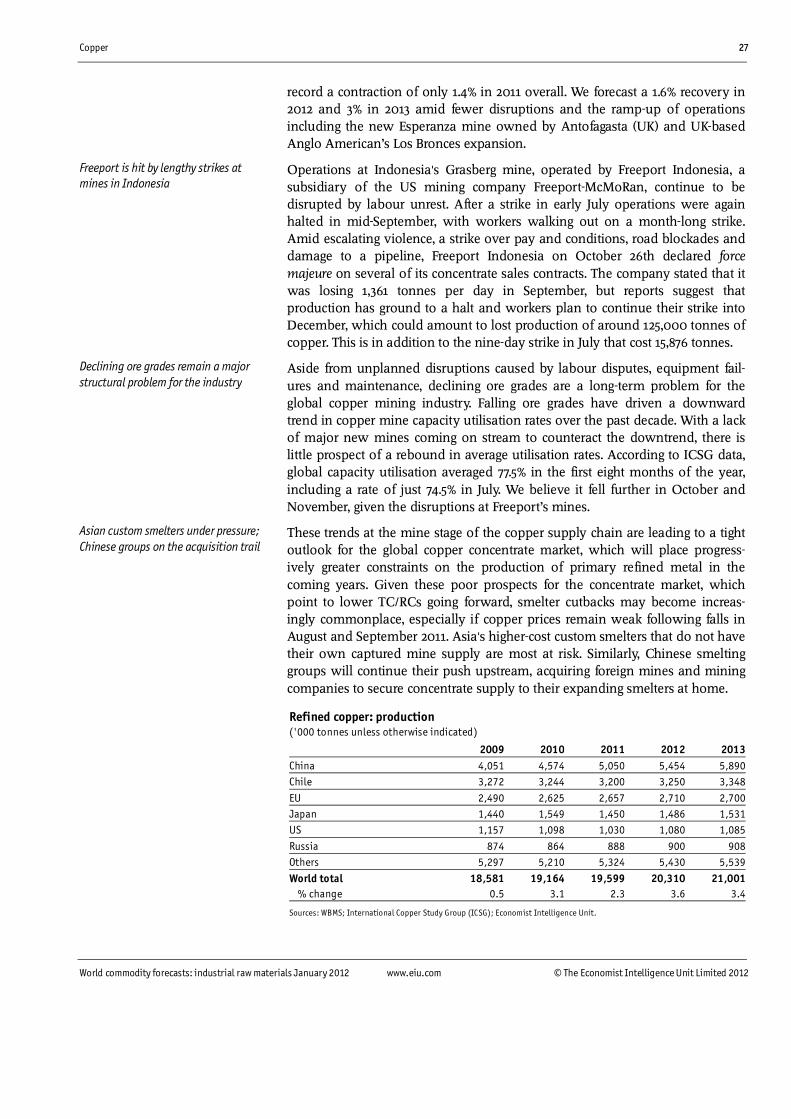
Copper 27
World commodity forecasts: industrial raw materials January 2012 www.eiu.com © The Economist Intelligence Unit Limited 2012
record a contraction of only 1.4% in 2011 overall. We forecast a 1.6% recovery in 2012 and 3% in 2013 amid fewer disruptions and the ramp-up of operations including the new Esperanza mine owned by Antofagasta (UK) and UK-based Anglo American�s Los Bronces expansion.
Operations at Indonesia's Grasberg mine, operated by Freeport Indonesia, a subsidiary of the US mining company Freeport-McMoRan, continue to be disrupted by labour unrest. After a strike in early July operations were again halted in mid-September, with workers walking out on a month-long strike. Amid escalating violence, a strike over pay and conditions, road blockades and damage to a pipeline, Freeport Indonesia on October 26th declared force majeure on several of its concentrate sales contracts. The company stated that it was losing 1,361 tonnes per day in September, but reports suggest that production has ground to a halt and workers plan to continue their strike into December, which could amount to lost production of around 125,000 tonnes of copper. This is in addition to the nine-day strike in July that cost 15,876 tonnes.
Aside from unplanned disruptions caused by labour disputes, equipment fail-ures and maintenance, declining ore grades are a long-term problem for the global copper mining industry. Falling ore grades have driven a downward trend in copper mine capacity utilisation rates over the past decade. With a lack of major new mines coming on stream to counteract the downtrend, there is little prospect of a rebound in average utilisation rates. According to ICSG data, global capacity utilisation averaged 77.5% in the first eight months of the year, including a rate of just 74.5% in July. We believe it fell further in October and November, given the disruptions at Freeport�s mines.
These trends at the mine stage of the copper supply chain are leading to a tight outlook for the global copper concentrate market, which will place progress-ively greater constraints on the production of primary refined metal in the coming years. Given these poor prospects for the concentrate market, which point to lower TC/RCs going forward, smelter cutbacks may become increas-ingly commonplace, especially if copper prices remain weak following falls in August and September 2011. Asia's higher-cost custom smelters that do not have their own captured mine supply are most at risk. Similarly, Chinese smelting groups will continue their push upstream, acquiring foreign mines and mining companies to secure concentrate supply to their expanding smelters at home.
Refined copper: production ('000 tonnes unless otherwise indicated)
2009 2010 2011 2012 2013China 4,051 4,574 5,050 5,454 5,890Chile 3,272 3,244 3,200 3,250 3,348
EU 2,490 2,625 2,657 2,710 2,700Japan 1,440 1,549 1,450 1,486 1,531US 1,157 1,098 1,030 1,080 1,085
Russia 874 864 888 900 908Others 5,297 5,210 5,324 5,430 5,539
World total 18,581 19,164 19,599 20,310 21,001 % change 0.5 3.1 2.3 3.6 3.4
Sources: WBMS; International Copper Study Group (ICSG); Economist Intelligence Unit.
Declining ore grades remain a major structural problem for the industry
Freeport is hit by lengthy strikes at mines in Indonesia
Asian custom smelters under pressure; Chinese groups on the acquisition trail

28 Copper
World commodity forecasts: industrial raw materials January 2012 www.eiu.com © The Economist Intelligence Unit Limited 2012
We continue to envisage a tight copper market in the coming years, with supply falling short of overall demand. Even though the demand outlook has been dampened by slowing economic growth, supply will still fall short. We expect the global refined market to record an annual deficit of 114,000 tonnes this year and one of 32,000 tonnes in 2012. However, we forecast that the deficit will rise again in 2013 as demand recovers. Total reported stocks will therefore continue on the downward trend that started in 2009, when it was 3.1 weeks of world consumption. We forecast that stocks at the end of 2012 will stand at the equivalent of just over two weeks' consumption, before falling to just 1.3 weeks' at the end of 2013. This would be a critically tight market, and this outlook provides a bullish fundamental backdrop that should underpin a recovery in prices in 2012.
Refined copper: Western stocks ('000 tonnes unless otherwise indicated)
2009 2010 2011 2012 2013Producers 258 278 240 250 240Consumers 123 109 80 100 115
Merchants 27 21 20 20 20Exchanges 688 569 523 461 174Total 1,096 977 863 831 549Change in stocks 279 -119 -114 -32 -282Weeks' consumption 3.1 2.7 2.3 2.1 1.3
Note. Material in transit is excluded.
Sources: WBMS; Economist Intelligence Unit.
Copper prices plummeted to a low of around 307 US cents/lb in October, when the market consolidated and attempted to find a floor following the dramatic sell-offs in early August and late September. The selling in late September was aggressive and broad-based across many markets, reflecting fears of a slow-down in the US economy and uncertainty about the fate of the euro zone and the increasing fragility of economic growth within the region. There are also concerns about China, but we believe a soft landing is being negotiated. The market has now in effect priced in recessionary demand conditions in both the US and the euro zone. In the coming months appetite among investors for taking on risk and appetite among consumers to restock will remain low, and caution will prevail. As a result, we do not expect prices to be able to recover significantly until confidence in the global economic outlook returns, which is unlikely in the first half of 2012. In the meantime, there may be more opportunistic, arbitrage-related buying from Chinese merchants, which will provide some support to prices, but overall the bias to the downside that has prevailed most of this year is likely to continue.
Prices will recover some ground in 2012, however, and our annual price forecast for that year averages out slightly higher than in 2011, at 405 US cents/lb. We then expect a 5.6% increase in the following year, as tighter fundamentals underpin a forecast of 427.5 US cents/lb in 2013. We expect volatility to persist, at least until clarity emerges on a workable rescue plan for the euro zone that will placate nervous markets. This should herald the beginning of the next
Stocks and prices
We expect prices to resume a sustainable upward trend in 2012

Copper 29
World commodity forecasts: industrial raw materials January 2012 www.eiu.com © The Economist Intelligence Unit Limited 2012
upward trend in copper prices once the broad concerns sapping risk appetite have subsided and the copper market's tight fundamentals reassert themselves.
Refined copper: supply and demand ('000 tonnes)
2009 2010 2011 2012 2013Production 18,581 19,164 19,599 20,310 21,001
Consumption 18,142 19,166 19,712 20,343 21,283Balance 439 -2 -114 -32 -282
Sources: WBMS; Economist Intelligence Unit.
In December 2010 the first exchange-traded funds (ETFs) backed by physical holdings of base metals were launched by ETF Securities. Two US finance companies, JP Morgan and Blackrock, are also planning separate physical copper ETFs to rival ETF Securities' products (although there has been no news for some time on their progress through the US regulatory procedure), and South Korea's Public Procurement Service (PPS) is also planning a physical copper ETF, which would be an interesting distraction from its main remit of the state strategic stockpiler.
Growing investor demand for commodities has been a prominent trend in recent years, and the launch of physically backed ETFs may in time facilitate even greater inflows of investment money into the copper market. They may also tighten the physical availability of metal by locking up stock that would otherwise be available to consumers. So far, however, appetite for the physical ETFs has been subdued.
Refined copper: stocks and prices 2010 2011 2012 2013 2014Stocksa 1 Qtr 1,240 1,086 880 810 5602 Qtr 1,180 1,030 840 760 -3 Qtr 1,050 990 850 650 -4 Qtr 976 863 831 549 - % change -10.9 -11.6 -3.7 -33.9 -Pricesb 1 Qtr 338.5 437.8 380.0 440.0 410.02 Qtr 319.4 414.5 400.0 450.0 -3 Qtr 328.5 410.0 410.0 420.0 -4 Qtr 391.8 352.0 430.0 400.0 -Year 344.5 403.6 405.0 427.5 - % change 47.5 17.1 0.4 5.6 -
a Total reported Western commercial stocks; end-period; '000 tonnes rounded. b LME cash price; US cents/lb.
Sources: London Metal Exchange (LME); Economist Intelligence Unit.
South Korea plans a copper ETF, despite no interest in existing products

30 Copper
World commodity forecasts: industrial raw materials January 2012 www.eiu.com © The Economist Intelligence Unit Limited 2012
Copper: stocks and prices
Sources: London Metal Exchange; Economist Intelligence Unit.
0
200
400
600
800
1,000
1,200
1,400
1,600
1,800
2,000
0
50
100
150
200
250
300
350
400
450
500
LME cash price (US cents/lb); right scaleWestern stocks ('000 tonnes); left scale
141312111009080706052004

Cotton 31
World commodity forecasts: industrial raw materials January 2012 www.eiu.com © The Economist Intelligence Unit Limited 2012
Cotton
The Economist Intelligence Unit has made a downward revision to its forecast of world cotton consumption in 2011/12 (August-July) to 24.37m tonnes, representing a year-on-year rise of 1.1%. Following the recent rapid fall in the prices of raw cotton and cotton yarn, consumption of both is being adversely affected by a lack of demand further down the textile-processing chain, notably fabrics (both woven and knitted), particularly in China. Consumption growth will also be constrained by sluggish global economic growth, while the shift towards man-made fibres continues. The movement towards blended yarns is most prominent in China, which has excess capacity of both polyester staple fibre (virgin and recycled) and polyester textile filament yarn. In India, a similar but less pronounced trend is occurring, although unlike China the country is a net exporter of cotton rather than a net importer. However, the continuing fall in cotton prices could boost world cotton consumption to 25.05m tonnes in 2012/13 and 25.6m tonnes in 2013/14.
According to China's Ministry of Industry and Information Technology, yarn and cotton fabric output rose in volume by 11.3% year on year to almost 21m tonnes and by 13.3% to 44.9bn metres year on year respectively in January-September 2011. However, cotton's share in the manufacturing of textiles and clothing in China is declining, while the operating rates in many spinning mills have fallen. Capacity utilisation rates are between 70% and 80%. Production costs have been driven up by the higher cost of borrowing and higher wages. China's Keqiao Textile Index, which measures prices, profitability and the level of orders in China's textiles sector, fell from a peak of 113.63 recorded in March 2011 to below 107.9 in mid-November. On the trade front, imports of raw cotton in August-October 2011 totalled 712,000 tonnes, a rise of 32.6% compared with the same period in 2010. However, imports of cotton yarn, having peaked at 786,000 tonnes in 2010, fell in the first nine months of 2011 to 549,000 tonnes, down by 17.3% year on year. For the textiles sector as a whole, exports continue to rise. In January-September 2011 the value of textile and clothing exports totalled US$186.1bn, 24.3% higher than in the same period in 2010, although the entire expansion was accounted for by man-made fibres. As a result, cotton consumption is forecast to total 9.7m tonnes in 2011/12, unchanged from 2010/11.
At the Canton Fair (the largest trade fair in China, held twice a year) in November 2011, the textiles and apparel sector attracted over 2,250 participants and the turnover of US$282m was higher than in 2010, although this was characterised by shorter-term orders. Other positive developments include the support provided by the Henan provincial government to the textiles sector, resulting in a rise in the number of enterprises from 784 in 2005 to 1,453 in 2011, as well as a cotton requirement well in excess of cotton production in the province. In addition, Weiqiao Textile Company, the country's largest textile manufacturer, noted that denim production in January-June 2011 totalled some 50m linear metres, 8.7% higher than in the year-earlier period, while net profits were maintained. In addition, the recent fall in cotton prices, coupled with higher domestic production, should boost China's cotton consumption by 2.6%
Demand
Lower global prices will provide support to consumption in China

32 Cotton
World commodity forecasts: industrial raw materials January 2012 www.eiu.com © The Economist Intelligence Unit Limited 2012
to 9.95m tonnes in 2012/13 and by a further 2.5% to 10.2m tonnes in 2013/14. However, according to the Ministry of Industry, while the sector remains an important pillar of the economy, cost advantages are being eroded, and it will be necessary to increase competitiveness by upgrading technology.
In India, the government has almost doubled its financial provision to Rs19.7bn (US$438m) for the Technology Upgradation Fund Scheme (TUFS) for fiscal year 2011/12 (April-March). The new scheme, which includes technical textiles (textiles with a function rather than for decorative purposes) and weaving, provides capital subsidies for new looms, indicating a change in the priorities of the scheme towards downstream processing. However, the volatility of cotton prices has resulted in a substantial decline in both export and domestic demand in the early part of fiscal year 2011/12. With high-priced stock levels, some mills have reduced output by up to one-third by working fewer shifts. In addition, the switch to polyester staple has been maintained, while mills in the south, in particular in Andhra Pradesh, Tamil Nadu and Kerala, have suffered severe power shortages owing to a lack of coal being supplied from the Telangana region.
The government has announced that there will be no export cap on raw cotton in 2011/12. This is in addition to raising the cap on exports of cotton yarn to 845,000 tonnes, an increase of 17.4% on the 2010/11 cap. As a result of the lack of export demand, the duty entitlement passbook (DEPB) scheme, essentially a drawback scheme, was reintroduced on August 4th 2011 on both raw cotton and cotton yarn exports. Furthermore, the reintroduction has been made retroactive to October 2010 for raw cotton and to April 2011 for cotton and cotton-blended yarn. Although the DEPB scheme may again be withdrawn, it would almost certainly be replaced by an alternative subsidy scheme. Indeed, the Ministry of Textiles has been requested to prepare a restructuring pro-gramme for the entire textiles sector, which includes the TUFS scheme, working capital assistance and export subsidies. Furthermore, another export promotion scheme has been announced by the minister of commerce. Finally, the govern-ment has permitted duty-free imports of apparel products from Bangladesh in an attempt to encourage exports of yarn from India to Bangladesh, to the chagrin of domestic garment producers. Cotton consumption in India is therefore forecast to rise by 2.3% to 4.45m tonnes in 2011/12, followed by further rises to 4.55m tonnes in 2012/13 and 4.6m tonnes in 2013/14.
In Pakistan, cotton consumption is forecast to amount to 2.2m tonnes in 2011/12, unchanged from 2010/11, owing to sluggish domestic demand as a result of the flooding in September 2011 and the expected drop in local production. There are, however, indications that economic conditions are beginning to improve, with somewhat looser monetary policy conditions, and signs that the electricity supply is becoming more reliable around the textile manufacturing centre of Faisalabad. On the trade front, there are also grounds for some optimism. Cotton yarn exports in September 2011 totalled 45,400 tonnes, 15.9% higher than a year earlier, and cotton fabric exports rose marginally to 169m sq metres. However, ready-made garment exports fell by 7.3% to 27m pieces, while knitwear exports fell by 13% to 108m pieces. Assuming that Pakistan retains its export competitiveness and is granted its generalised system of preferences plus
Consumption in South Asia is expected to rise during the forecast period

Cotton 33
World commodity forecasts: industrial raw materials January 2012 www.eiu.com © The Economist Intelligence Unit Limited 2012
status by the European authorities, cotton consumption is forecast to pick up over the next two years, to 2.3m tonnes in 2012/13 and as much as 2.35m tonnes in 2013/14.
In Bangladesh, where domestic cotton production is small, total imports of cotton fell by almost 30% in January-September 2011 to 381,000 tonnes. In September 2011 imports of cotton amounted to 31,000 tonnes, a decline of almost 50% compared with the same month in 2010. One reason is the change in EU origin rules, as Bangladeshi apparel exporters now qualify for duty-free access, even if the garments contain imported yarn and fabric. As a result, cotton consumption is forecast to total 780,000 tonnes in 2011/12, down from 800,000 tonnes in 2010/11. The government's decision to almost double the monthly minimum wage for its garment workers, from US$23 to US$43, has been absorbed and should not constrain further investment in spinning capacity and looms for the manufacture of denim. Indeed, following delays some new mills are now being connected to the national gas supply. Consequently, consumption is still forecast to rise steadily throughout the forecast period.
In Thailand, imports in January-September 2011 totalled 262,000 tonnes, 9% lower than in the same period in 2010, with the US and Australia accounting for 50% and 17% respectively of the total. With the minimum wage in the Thai capital, Bangkok, and neighbouring provinces set to rise in April 2012 by 40% to Bt300 (around US$10) per day, production costs will rise. Moreover, floods in October-November 2011 damaged many factories. As a consequence, consumption will fall by 2.8% to 350,000 tonnes in 2011/12, in line with sluggish consumer demand in general and slow export demand in particular, before rising to 360,000 tonnes in both 2012/13 and 2013/14. Consumption in Vietnam is forecast to rise by 2.9% to 350,000 tonnes in 2011/12, owing to higher exports. Growth in demand is expected to accelerate to 5.7% in 2012/13, aided by investment by Kyung Bang in spinning capacity of 6,000 tonnes/year in the province of Binh Duong, before decelerating to 2.7% in 2013/14 as a result of rising labour costs.
In Indonesia, although raw cotton imports fell by 8% year on year in January-July 2011 to 348,700 tonnes, lower cotton prices and additional export demand are expected to lead to a rise in consumption in 2011/12. Imports are likely to rise, not least from the US, which supplied 162,700 tonnes or 47% of the total in January-July 2011, 83% higher than in the year-earlier period. Consumption could reach 420,000 tonnes in 2011/12, followed by further rises to 440,000 tonnes in 2012/13 and 450,000 tonnes in 2013/14.
In Turkey, cotton consumption is forecast to total 1.13m tonnes in 2011/12, 2.7% higher than in 2010/11. Spinners are again purchasing raw cotton, as prices have stabilised and as replacement costs should be lower as a result of the good domestic harvest. The implementation of safeguard measures on imports of certain categories of textiles and clothing, mainly from China and Bangladesh, the depreciation of the lira against both the euro and the US dollar and the investment in 600,000 additional spindles in 2011 should boost consumption in both 2012/13 and 2013/14 to 1.15m tonnes and 1.2m tonnes respectively. In contrast, consumption in the EU is expected to continue to decline, to 200,000
Consumption in Thailand will be hit by floods and higher wages
Investment in spindles will boostTurkey's demand

34 Cotton
World commodity forecasts: industrial raw materials January 2012 www.eiu.com © The Economist Intelligence Unit Limited 2012
tonnes in 2011/12 from 210,000 tonnes in 2010/11, and to stabilise at around this level in 2012/13 and 2013/14.
While the contraction of Russia's textiles sector is set to continue, owing to a lack of investment, competition from cheap imports and high production costs, raw cotton imports in the first two months of 2011/12 rose by 85% year on year to 23,600 tonnes, with Uzbekistan accounting for 85% of the total. It is believed that some of the increase is to replenish state reserves, as cotton yarn output in the same period fell by 36% to 11,800 tonnes, while cotton fabric output fell by 20% to 202m sq metres. Russian consumption is therefore forecast to fall by 10% to 110,000 tonnes in 2012/13, and is unlikely to exceed 100,000 tonnes by 2013/14.
In Uzbekistan, logistical problems still remain for both domestic consumers and importers, with about 300,000 tonnes of cotton in terminals, gins or in transit to warehouses and yet to be sold. However, further investment in and modernisation of the textiles sector, including the Indorama Kokand Textile joint venture in Fergana province, which by 2013 should process 18,000 tonnes of cotton annually, coupled with high stock levels, could raise cotton con-sumption by 12.5% to 270,000 tonnes in 2011/12 as mills come on stream. Slower rates of growth in consumption are forecast in 2012/13 and 2013/14 at 7.4% and 3.4% respectively.
In the US, total imports of textiles and apparel in the first nine months of 2011 reached 41bn sq metre equivalents, 1.9% lower than in the year-earlier period. Cotton textile and apparel imports fell over the same period by 11.2% to 14.9bn sq metre equivalents. Despite modest investment in spinning capacity, a lack of domestic demand is expected to result in consumption falling to 820,000 tonnes in 2011/12, although some recovery to 830,000 tonnes is forecast by 2013/14.
Consumption in Brazil, the world's fifth-largest cotton consumer, fell in 2010/11 owing to weaker domestic demand, which led to mills cutting working hours. While consumption is expected to remain unchanged in 2011/12, we forecast rises to 1m tonnes in 2012/13 and 1.05m tonnes in 2013/14, owing in part to catering for the large influx of tourists for the 2014 football World Cup.
Cotton: consumptiona (m tonnes unless otherwise indicated)
2009/10 2010/11 2011/12 2012/13 2013/14China 10.15 9.70 9.70 9.95 10.20
India 4.35 4.35 4.45 4.55 4.60Pakistan 2.50 2.20 2.20 2.30 2.35
Turkey 1.30 1.10 1.13 1.15 1.20Brazil 0.98 0.95 0.95 1.00 1.05
Bangladesh 0.82 0.80 0.80 0.82 0.85US 0.74 0.85 0.82 0.83 0.83Indonesia 0.48 0.40 0.42 0.44 0.45
Thailand 0.40 0.36 0.35 0.36 0.36
Russia's textiles sector is in long-term decline
US consumption will fall in 2011/12, followed by some recovery

Cotton 35
World commodity forecasts: industrial raw materials January 2012 www.eiu.com © The Economist Intelligence Unit Limited 2012
Cotton: consumptiona (m tonnes unless otherwise indicated)
2009/10 2010/11 2011/12 2012/13 2013/14Vietnam 0.32 0.34 0.35 0.37 0.38Uzbekistan 0.25 0.24 0.27 0.29 0.30
EU 0.25 0.21 0.20 0.20 0.20Others 2.66 2.60 2.73 2.79 2.83Total 25.20 24.10 24.37 25.05 25.60 % change 8.9 -4.4 1.1 2.8 2.2
a Years ending July 31st.
Sources: International Cotton Advisory Committee (ICAC); Economist Intelligence Unit.
We forecast that world cotton production in 2011/12 (August-July) will total 26.9m tonnes, a 10% year-on-year increase. Higher cotton prices vis-à-vis com-peting crops (for example, soybeans) resulted in increases in planted areas in the northern hemisphere, notably the US and Pakistan, although drought in the US and flooding in Pakistan will preclude any total gain in output in the former and limit growth in the latter. In China, despite some switching to grain production in the traditional cotton-producing province of Xinjiang, output is nevertheless set to rise. Similarly, in India good growing conditions, coupled with higher plantings of genetically modified (GM) cotton seed, should boost output. High, albeit declining, prices in 2011 will have lead to higher plantings in the southern hemisphere, notably Brazil and Australia. Although continuing to fall from their current record levels, prices will remain sufficiently high to support a further rise in world output of 3.2% in 2012/13, notwithstanding high maize prices and a possible hectarage cap in Xinjiang. In 2013/14 a more modest rise in world output of 0.7% to 27.95m tonnes is forecast, owing to expected lower prices and rising stock levels.
In the northern hemisphere, which accounts for some 85% of global cotton production, the focus is now on harvesting the 2011/12 crop. In China, according to the Ministry of Agriculture, during the current five-year plan (2011-15) the state cotton area is set at 5.33m ha, 10% higher than in 2010/11, with output in excess of 7m tonnes. According to the latest information from the China Cotton Association, the area planted to cotton in 2011/12 was 5.37m ha, 4.5% higher than in the previous season. Yields are expected to rise considerably, possibly by as much as 13%, owing to good harvesting conditions. At the beginning of November over 70% of the crop was harvested, with some 37% being sold. The Production and Construction Corps (PCC) is continuing to develop mechanical harvesting, which will account for 45% of its cotton area in Xinjiang. Increased mechanisation will alleviate worries over contract migrant labour for cotton picking, with labour costs having risen from Rmb1.4/kg in 2010/11 (around 20 US cents/kg) to Rmb2/kg in 2011/12. For cotton-growing provinces, the present forecasts for output in 2011/12 include Xinjiang 3.5m tonnes (47.8% of the total), Shandong 840,000 tonnes (11.5%), Hebei 640,000 tonnes (8.7%), Hubei 580,000 tonnes (7.9%), Anhui 380,000 tonnes (5.2%) and Hunan 320,000 tonnes (4.4%).
Overall, we expect Chinese cotton output to increase by 16.1% to 7.2m tonnes in 2011/12. The government is continuing to invest in agricultural projects, with cotton being a main beneficiary, although planting costs have risen in terms of
Supply
China's output will continue to expand in the forecast period

36 Cotton
World commodity forecasts: industrial raw materials January 2012 www.eiu.com © The Economist Intelligence Unit Limited 2012
land rental, inputs and labour. As a result, China's cotton output is expected to rise by 4.2% to 7.5m tonnes in 2012/13, followed by further similar growth to 7.7m tonnes in 2013/14. These forecasts are supported by the government's decision to invest Rmb120bn (US$17bn) in Xinjiang's transport infrastructure over the next five years, the continuing development in the utilisation of high-yielding cotton varieties to produce good-quality lint, and further mechanisation used by the Xinjiang PCC.
In India, planting of the 2011/12 crop is complete in the cotton-growing states. In the northern zone, the area planted to cotton has risen by 25% to 1.7m ha, with the area sown in Rajasthan rising by over 55% to 525,000 ha. In the central zone, the planted area has increased by 7.5% to 7.75m ha. This zone includes the two largest cotton-growing states of Maharashtra and Gujarat, which registered rises of 4.1% and 12.1% respectively. A record 11.8m ha has been planted, 6% more than in the previous season, of which some 92% is GM cotton. Growing conditions throughout the country have been good, and in the northern and central zones substantial quantities of seed cotton are arriving at gins. Despite concern that adverse weather conditions in the northern zone may reduce yields, we expect growth of over 10% in 2011/12, before growth slows to below 1% by 2013/14, as almost all of the crop will then be GM cotton and yields will at best only be maintained at prevailing levels.
In Pakistan, high cotton prices led to an increase in the area sown in 2011/12. The target of 3.15m ha, set by the Cotton Development Commission, has been exceeded, with some 2.55m ha being planted in the Punjab and 670,000 ha in the Sind. Moreover, new seed varieties (including transgenic seeds) and greater use of fertilisers could increase yields. However, again the country has been afflicted by widespread flooding, particularly in the Sind, which resulted in the loss of many lives and severe damage to homes and infrastructure. The recent dry weather has enabled some plant recovery, particularly in the Punjab, where a larger crop will partially offset losses in the Sind. Harvesting and ginning are continuing despite shortages of electricity in rural areas. We still expect production in 2011/12 to rise by 20% to 2.1m tonnes, and assuming normal weather conditions, output could rise further to 2.25m tonnes in 2012/13 and be maintained in 2013/14.
Harvesting in the US is well under way, and by mid-November 40% of the crop had been sent for ginning (this figure was substantially higher in the Memphis territory). Weather conditions for harvesting in the past few weeks across much of the cotton belt have generally been favourable, although as a result of earlier drought (particularly in the high plains of Texas, Oklahoma, Kansas and New Mexico) far less cotton was planted in these areas. According to the fourth estimate of the US Department of Agriculture (USDA), the intended area planted to cotton in 2011/12 rose by one-third to 14.7m acres, but adverse weather conditions earlier in the year meant that only 9.85m acres were left for harvesting. By mid-November almost the entire crop had been harvested in the Memphis territory, 80% in the South East and 70% in both the Far West and the South West. For the country as a whole, the forecast for cotton production in 2011/12 is just 3.55m tonnes, representing a year-on-year fall of 9.9%. With prices
India's output will soon be almost all GM cotton
Pakistan's crop has been adversely affected by flooding
Harvest in the US has been hit by adverse weather

Cotton 37
World commodity forecasts: industrial raw materials January 2012 www.eiu.com © The Economist Intelligence Unit Limited 2012
remaining historically high, and assuming normal weather conditions, output could rise by 7% to 3.8m tonnes in 2012/13 and remain at that level in 2013/14.
In Brazil, and particularly in the provinces of Bahia, Goias, Minas Gerais and Mato Grosso do Sul, harvesting of the 2010/11 crop is complete, and ginning is expected to have been completed by the end of November. Although high prices resulted in a record planted area of 1.3m ha, yields were variable and we expect output to have risen by 70% to 1.95m tonnes. In Australia, high cotton prices resulted in some 625,000 ha planted in 2010/11, with output more than doubling to a record high of 900,000 tonnes. In 2011/12 production in Brazil may fall back slightly to 1.9m tonnes, as an increasing amount of land may be used for other crops, notably soybeans, and as a result of an absence of significant rainfall across the country, particularly in Mato Grosso. In Australia, output could rise to 1.15m tonnes, assuming average weather and relatively firm prices. Indeed, a record 600,000 ha is forecast to be sown, with a 7% rise in irrigated planting more than counterbalancing an 11% fall in dry-land planting. Planting of the 2012/13 crop will be complete by the end of November and, at present, there is plentiful moisture. As neither country is constrained by a lack of agricultural land, it is possible that production in both 2012/13 and 2013/14 could reach 1.95m tonnes in Brazil and 1.2m tonnes in Australia.
In Uzbekistan, cotton output is forecast at 900,000 tonnes in 2011/12, un-changed from the previous season. While higher cotton prices led to a slight increase in the hectarage planted, growth was constrained by the relative isol-ation of farmers from their markets. Virtually all the crop has been harvested, aided by clement weather conditions notably in Andizhan and Surkhandar. Unfortunately, it is apparent that a lack of water has reduced yields. The same problem has affected Turkmenistan, where the forecast for 2011/12 is 310,000 tonnes, a decline of 18.5% year on year, although the hectarage was maintained. Again, harvesting is complete, and gins are operating at almost full capacity. By contrast, in Tajikistan seed cotton yields rose from 17 centner/ha in 2010/11 to 20 centner/ha in 2011/12, which, given an increase in the area planted, could result in an outturn of 110,000 tonnes in 2011/12, a rise of 25% year on year. Elsewhere, the production forecasts are Kazakhstan 80,000 tonnes (up by one-third), the Kyrgyz Republic 28,000 tonnes (up by 40%) and Azerbaijan 20,000 tonnes (up by 43%). Assuming price levels are maintained, further small rises in output are expected across Central Asia in both 2012/13 and 2013/14.
In Burkina Faso, West Africa's largest cotton producer, output in recent years has been well below the government's target owing to poor rains and farmers using fertilisers on their food crops instead of cotton crops because of low farmgate prices. Some rises in output in 2011/12 are forecast for the rest of the Sahel region, as current higher prices should help to recapitalise some of the cotton firms in the region and ensure the timely provision of inputs. As a result, output in the Franc Zone as a whole in 2011/12 is now forecast at 640,000 tonnes, 28% higher than in 2010/11. In 2012/13 and 2013/14 output in the Franc Zone is forecast at 650,000 tonnes.
After bumper crops in 20110/11, output in Brazil and Australia will stabilise
African output is on a rising trend, particularly in the Sahel
In Central Asia, steady growth in cotton output is expected

38 Cotton
World commodity forecasts: industrial raw materials January 2012 www.eiu.com © The Economist Intelligence Unit Limited 2012
Cotton: productiona (m tonnes unless otherwise indicated)
2009/10 2010/11 2011/12 2012/13 2013/14China 6.85 6.20 7.20 7.50 7.70India 5.02 5.53 6.10 6.10 6.15
US 2.65 3.94 3.55 3.80 3.80Pakistan 2.03 1.75 2.10 2.25 2.25Brazil 1.15 1.95 1.90 1.95 1.95
Uzbekistan 0.85 0.90 0.90 1.00 1.00Australia 0.39 0.90 1.15 1.20 1.20
Franc Zone 0.46 0.50 0.64 0.65 0.65Others 2.60 2.78 3.36 3.30 3.25Total 22.00 24.45 26.90 27.75 27.95 % change -5.7 11.1 10.0 3.2 0.7
a Years ending July 31st.
Sources: ICAC; Economist Intelligence Unit.
With world cotton supply slightly exceeding demand, stocks rose marginally in 2010/11, and at the end of the season (July 31st 2011) totalled an estimated 8.9m tonnes, 4.7% higher than a year earlier. Of this total, just under 2m tonnes of commercial and industrial stocks were held in China. Commercial stocks held by traders accounted for about one-half of the total, with industrial stocks in mills making up the remainder. As the global market returns to surplus in 2011/12, boosted by higher production levels, world closing stocks will pick up, rising to 11.4m tonnes by the end of 2011/12. At prevailing price levels, it is likely that supply will continue to exceed demand in 2012/13 and 2013/14, with the result that world cotton stocks could reach 16.5m tonnes by the end of 2013/14. However, although about four months' consumption available in stock is sufficient, the fact that over 20% is held in China and that the volume of cotton reserves held by the state is unknown could keep cotton supply relatively tight and prices high.
Commercial inventories in China totalled 834,000 tonnes at the end of July 2011, according to the China Cotton Association, 14.9% lower than in the previous month. State stocks in China are also believed to be relatively low, given that the government has introduced a scheme to boost cotton reserves by purchasing some of the 2011/12 crop if the relevant price indicator falls below Rmb19,800/tonne (140 US cents/lb) for five consecutive days, while at the same time attempting to stabilise the market and to ensure that the interests of farmers are protected. The scheme entered into force in September 2011 and will remain in place until March 2012 in virtually all cotton-growing provinces. By mid-November the government had purchased 585,800 tonnes of domestic cotton, of which over 70% was from Xinjiang. Some trade sources suggest that the government has also purchased some imported cotton, although quantities are unknown.
Stocks and prices
Commercial inventories in China continue to fall

Cotton 39
World commodity forecasts: industrial raw materials January 2012 www.eiu.com © The Economist Intelligence Unit Limited 2012
Cotton: supply and demanda (m tonnes unless otherwise indicated)
2009/10 2010/11 2011/12 2012/13 2013/14Production 22.0 24.5 26.9 27.8 28.0Consumption 25.2 24.1 24.4 25.1 25.6
Balance -3.2 0.3 2.5 2.7 2.4Stocksb 8.5 8.9 11.4 14.1 16.5 % change -27.4 4.7 28.1 23.7 17.0
a Years ending July 31st. b World closing stocks.
Sources: ICAC; Economist Intelligence Unit.
In addition to strong demand throughout much of 2010/11, speculation has been a significant contributing factor to the recent dramatic volatility in cotton prices. In May prices dropped sharply, with the Cotlook A index falling over a matter of weeks from around 220 US cents/lb to 167 US cents/lb on May 26th. Prices continued to fall in June, dropping to 158 US cents/lb, before a lack of quotations prevented the index from being updated temporarily. By mid-November the Cotlook A index for immediate delivery was 108 US cents/lb, and prices are expected to fall further in 2011/12. However, the gap between the actual price and the futures price has now returned to a traditional spread. Indeed, the US futures market in mid-November 2011 was predicting little change at 103 US cents/lb by the end of the year. Owing to the record highs reached during the early part of the year, we expect cotton prices to average 153.7 US cents/lb in 2011, an increase of almost 47% compared with 2010 average prices. However, prices will drop by 34% in 2012 and will continue to ease to below 90 US cents/lb during 2013, reflecting higher cotton production in both 2011/12 and 2012/13 and the more long-term switch to man-made fibres.
Cotton: prices (Cotlook A index; US cents/lb unless otherwise indicated)
2010 2011 2012 2013 20141 Qtr 81.1 207.3 106.0 93.0 85.02 Qtr 90.4 183.1 102.0 96.0
3 Qtr 97.5 115.5 101.0 90.04 Qtr 150.1 109.0 96.0 87.0
Year 104.8 153.7 101.3 91.5 % change 66.7 46.7 -34.1 -9.6
Sources: ICAC; Economist Intelligence Unit.
Prices will continue on a downward trend after soaring in early 2011

40 Cotton
World commodity forecasts: industrial raw materials January 2012 www.eiu.com © The Economist Intelligence Unit Limited 2012
Cotton: prices(Cotlook A index; US cents/lb)
Sources: International Cotton Advisory Committtee; Economist Intelligence Unit.
40
60
80
100
120
140
160
180
200
220
141312111009080706052004

Crude oil 41
World commodity forecasts: industrial raw materials January 2012 www.eiu.com © The Economist Intelligence Unit Limited 2012
Crude oil
The Economist Intelligence Unit estimates that global oil consumption grew by just 1.3% in 2011, reflecting recent data releases which show a slowdown in consumption growth in the second half of the year, particularly in the US and China. Although growth remained strong in developing countries, the pace was markedly slower than in 2010, particularly in China and, to a lesser extent, the Middle East. Consumption in the US and EU is estimated to have contracted in 2011, and we expect this to continue in 2012, reflecting weak economic growth in the US and a contraction in euro zone GDP, as well as efforts at conservation. The long-term decline in Japan's consumption has been temporarily arrested by the devastation caused by the March 2011 earthquake and the increased use of oil-powered generators, but we expect a renewed contraction by 2013. We forecast that growth in global consumption will remain modest in 2012, at 1.6%, held back by a somewhat slower economic expansion in China and India. Oil consumption will start to pick up in 2013 in tandem with stronger global growth, but consumption will still contract slightly in the OECD as a result of efficiency gains and conservation.
The pace of the slowdown in US oil consumption gained momentum during the third quarter of 2011, with particular weakness in petrol (gasoline) consumption, naphtha and heating oil. Weekly releases in October and November suggest that gasoline consumption continued to contract, while mild weather continued to dampen heating oil demand, pointing to a further contraction in oil consumption in the fourth quarter. We expect petrol consumption to remain relatively subdued in 2012, reflecting continued high unemployment, the weak property market and high levels of consumer indebtedness, as well as a more general slowdown in economic growth. The possibility of a further round of quantitative easing in the US has increased, and this in turn may lead us to revise up our forecast of real GDP growth in 2012. However, its impact on oil consumption is less clear, since it could lead to upward pressure on already high oil prices and further curtail demand. We expect a smaller contraction in consumption in 2013, but ongoing efforts to encourage fuel efficiency and reduce dependence on fossil fuels will prevent consumption returning to positive growth. An additional factor constraining oil consumption will be the emergence of plentiful and relatively cheap domestic gas.
According to the International Energy Agency (IEA), oil product consumption in the EU fell by 2.2% year on year in September 2011, with particular weakness in demand for petrol and heating oil. For the most part, European temperatures were above average in the fourth quarter, suggesting that consumption will be markedly lower in year-on-year terms (the fourth quarter of 2010 was particularly cold). There are also signs that consumers are seeking to save, with some of the weakness in petrol consumption the result of a greater use of cheaper (in most European countries) diesel oil. Assuming normal winter weather conditions, we expect consumption to continue to contract in 2012-13, partly because of weak economic growth and fiscal austerity in many countries, but also because of efficiency gains.
Demand
European consumers are switching to cheaper alternatives
US oil consumption is expected to contract throughout the forecast period

42 Crude oil
World commodity forecasts: industrial raw materials January 2012 www.eiu.com © The Economist Intelligence Unit Limited 2012
It is estimated that consumption in the OECD Pacific region (60% of which is accounted for by Japan) grew by 1.2% in 2011. Before the devastating earthquake and tsunami in Japan in March we had forecast a renewed contraction in Japan's consumption in 2011, but we now expect an increase. Sharply lower nuclear power generation led to some usage of oil for power generation. In 2012 consumption will be further supported by reconstruction�which will be energy-intensive�but oil demand may ease back sharply if nuclear output starts to come back on stream. (The outlook for nuclear power generation in Japan is still uncertain.) In the medium to long term liquefied natural gas (LNG) may be the preferred option (because of its cleaner properties and its affordability, at least relative to oil), but oil will provide a more fungible and flexible fuel option in the short term. Japan's oil consumption will be largely flat in 2012, before contracting slightly in 2013.
Although monthly data have been volatile, there was a clear deceleration in the growth of China's consumption during the first three quarters of 2011, down from a rise of 10.4% year on year in the first quarter to just 4.5% in the third quarter and just 1% in October (albeit from a high base in the fourth quarter of 2010). There are clear signs that economic growth and industrial activity is moderating. However, there were indications of stocks being drawn down in the third quarter, and persistent problems with power generation could lead to additional oil consumption during the 2011-12 winter. Reflecting the slowdown in consumption in the second half of 2011, we now expect consumption growth to average 6.3% in 2011, easing back to 5.8% in 2012 and 6% in 2013 on a somewhat weaker economic growth outlook. Although there are signs that the government will relax monetary policy in 2012, this will only partially help to offset the negative impact on the Chinese economy of weak US growth and the expected contraction in euro zone GDP. Furthermore, the government will be intensifying efforts to improve conservation and efficiency (in order to meet targets in its five-year plan). Given slower consumption growth elsewhere, China�which already accounts for over one-half of non-OECD consumption�will continue to increase its market share in 2012-13.
In the rest of Asia, solid economic growth in 2011 is estimated to have led to growth in overall consumption of 2.7%, slightly lower than the 3% growth recorded in 2010. Consumption growth picked up in India in September, after a weak August, partly because the country is experiencing a shortfall in coal production that has led to some switching to oil-fired power generation. Given that we anticipate somewhat weaker economic growth in India in 2012-13, we expect only modest growth in oil consumption. We forecast growth in oil consumption in the rest of Asia (excluding China and OECD Asia) at an average annual rate of around 3.3% in 2012-13.
In the Middle East, oil consumption is expected to pick up in 2012-13, growing by an annual average rate of 4.5%, fuelled by strong regional growth and expansionary fiscal policies. Our estimate of consumption in 2011 is a relatively low 2.3%; the civil unrest in the region, particularly in the first half of the year, had negative economic consequences (for example, in Egypt, Syria and Tunisia). This has more than offset the additional consumption in Saudi Arabia resulting from direct crude burn in power stations. In 2012-13 the persistence of extensive
Retail price subsidies and stronger growth will boost Middle East demand
China's oil consumption growth will moderate, but remain strong
OECD Pacific demand will be supported by Japan's additional consumption

Crude oil 43
World commodity forecasts: industrial raw materials January 2012 www.eiu.com © The Economist Intelligence Unit Limited 2012
retail fuel subsidies across the region will support consumption growth, as will recovering economic growth, although new gas supplies coming on stream will lead to a lower direct crude burn in Saudi Arabia. In Iran, where the retail prices of petrol and gasoil were raised by 300% and 800% respectively in December 2010, consumption is estimated to have fallen in 2011, although the impact was partly offset by the government's cash handouts designed to soften the blow of higher prices. Supply constraints could be an additional factor depressing Iran's consumption, given that sanctions are preventing the country from importing refined products. As a result, the government is leading a campaign to improve the country's self-sufficiency.
While regional economic growth was relatively strong in Latin America in 2011, rising inflationary pressures necessitated some monetary tightening (although this started to be reversed in the fourth quarter). We estimate that consumption growth slowed to 3.2% in 2011. Brazil's consumption of petrol started to grow strongly in the second half of 2011, following the government's decision to reduce the mandated ethanol content of the gasoline blend from 25% to 20% (owing to high sugar prices and a disappointing Brazilian sugar crop), but this is likely to be a temporary measure, and its impact will be largely offset by some-what weaker economic growth in 2012. (Ethanol has typically accounted for around 50% of transport fuel in Brazil.) We expect regional oil consumption to grow by an annual average of 3.1% in 2012-13.
Total oil consumption data for countries and regions fail to capture changes in consumer behaviour towards different types of oil. Despite overall weakness in US oil consumption in 2011, for example, diesel demand appears to have grown, although not by enough to offset the fall in petrol consumption. This was probably a reflection of the state of the US economy, whereby industrial activity has been growing, but consumers continue to feel the pain of high retail oil prices and high unemployment and household debts. Even in Europe, where overall oil consumption was depressed, diesel demand remained fairly stable. In the emerging world diesel demand growth has been particularly strong, fuelled by the continued expansion of (particularly internal) freight activity�road, rail and marine�and some usage in the power generation sector. (Both China and India rely on coal for power generation, but coal prices have been relatively high, and India has suffered from lacklustre domestic coal production.) Refinery outages (Asia) and lack of refinery feedstock (Europe, owing to the loss of Libyan crude) and low inventory led to particular tightness in the diesel market. Government policy has played an important role in the popularity of diesel; in Europe, diesel consumption has been encouraged through tax incentives, while in India diesel prices are markedly lower than petrol prices, as diesel is used more in commercial and industrial activity. With many of these trends expected to continue in 2012, it looks as though, within the product basket, diesel will remain the fuel of choice.
Slower economic growth will constrain oil demand growth in Latin America
It's all about middle distillates
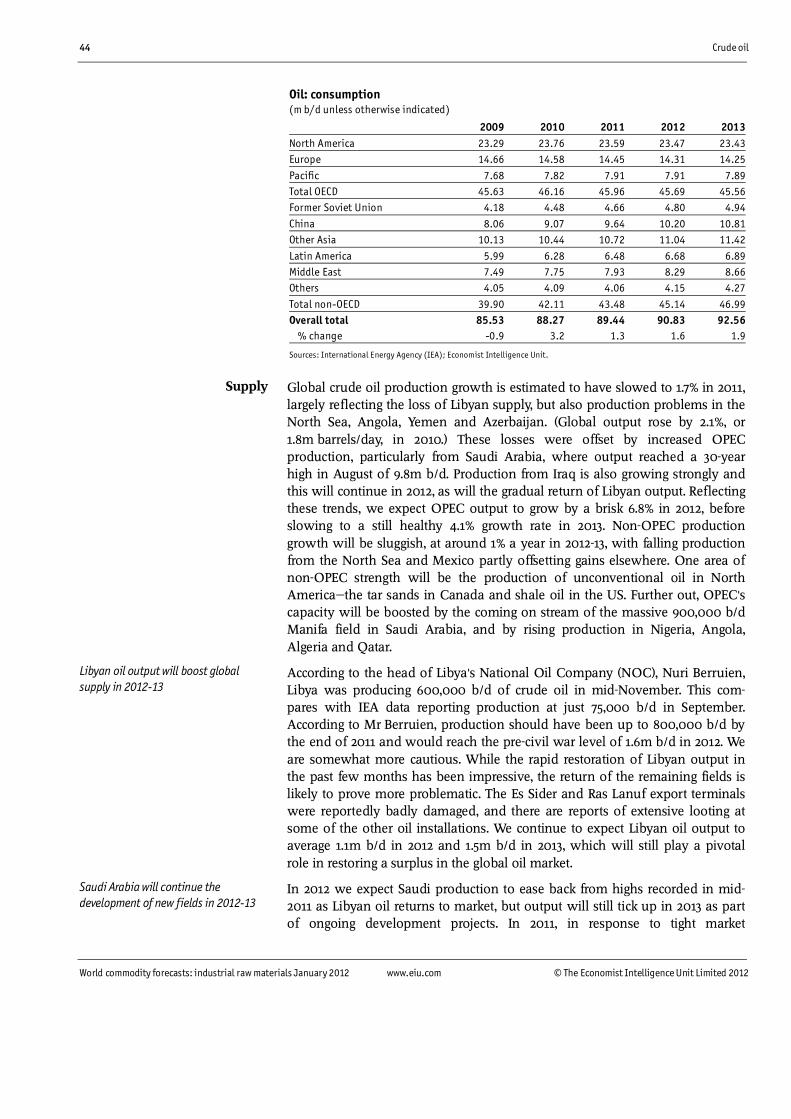
44 Crude oil
World commodity forecasts: industrial raw materials January 2012 www.eiu.com © The Economist Intelligence Unit Limited 2012
Oil: consumption (m b/d unless otherwise indicated)
2009 2010 2011 2012 2013North America 23.29 23.76 23.59 23.47 23.43Europe 14.66 14.58 14.45 14.31 14.25
Pacific 7.68 7.82 7.91 7.91 7.89Total OECD 45.63 46.16 45.96 45.69 45.56Former Soviet Union 4.18 4.48 4.66 4.80 4.94
China 8.06 9.07 9.64 10.20 10.81Other Asia 10.13 10.44 10.72 11.04 11.42
Latin America 5.99 6.28 6.48 6.68 6.89Middle East 7.49 7.75 7.93 8.29 8.66Others 4.05 4.09 4.06 4.15 4.27
Total non-OECD 39.90 42.11 43.48 45.14 46.99Overall total 85.53 88.27 89.44 90.83 92.56 % change -0.9 3.2 1.3 1.6 1.9
Sources: International Energy Agency (IEA); Economist Intelligence Unit.
Global crude oil production growth is estimated to have slowed to 1.7% in 2011, largely reflecting the loss of Libyan supply, but also production problems in the North Sea, Angola, Yemen and Azerbaijan. (Global output rose by 2.1%, or 1.8m barrels/day, in 2010.) These losses were offset by increased OPEC production, particularly from Saudi Arabia, where output reached a 30-year high in August of 9.8m b/d. Production from Iraq is also growing strongly and this will continue in 2012, as will the gradual return of Libyan output. Reflecting these trends, we expect OPEC output to grow by a brisk 6.8% in 2012, before slowing to a still healthy 4.1% growth rate in 2013. Non-OPEC production growth will be sluggish, at around 1% a year in 2012-13, with falling production from the North Sea and Mexico partly offsetting gains elsewhere. One area of non-OPEC strength will be the production of unconventional oil in North America�the tar sands in Canada and shale oil in the US. Further out, OPEC's capacity will be boosted by the coming on stream of the massive 900,000 b/d Manifa field in Saudi Arabia, and by rising production in Nigeria, Angola, Algeria and Qatar.
According to the head of Libya's National Oil Company (NOC), Nuri Berruien, Libya was producing 600,000 b/d of crude oil in mid-November. This com-pares with IEA data reporting production at just 75,000 b/d in September. According to Mr Berruien, production should have been up to 800,000 b/d by the end of 2011 and would reach the pre-civil war level of 1.6m b/d in 2012. We are somewhat more cautious. While the rapid restoration of Libyan output in the past few months has been impressive, the return of the remaining fields is likely to prove more problematic. The Es Sider and Ras Lanuf export terminals were reportedly badly damaged, and there are reports of extensive looting at some of the other oil installations. We continue to expect Libyan oil output to average 1.1m b/d in 2012 and 1.5m b/d in 2013, which will still play a pivotal role in restoring a surplus in the global oil market.
In 2012 we expect Saudi production to ease back from highs recorded in mid-2011 as Libyan oil returns to market, but output will still tick up in 2013 as part of ongoing development projects. In 2011, in response to tight market
Supply
Saudi Arabia will continue the development of new fields in 2012-13
Libyan oil output will boost global supply in 2012-13

Crude oil 45
World commodity forecasts: industrial raw materials January 2012 www.eiu.com © The Economist Intelligence Unit Limited 2012
conditions, the national oil company Saudi Aramco fast-tracked the development of the Manifa and Dammam oilfields. The more advanced is the offshore Manifa field. Under its latest plans output will start at 500,000 b/d in mid-2013 and will be raised to full capacity of 900,000 b/d two years later. Next on Aramco's list is the Dammam field; the firm is considering revisiting a 2008 plan to open up the mothballed onshore acreage. The field is estimated to hold 500m barrels, and the plan is to produce 100,000 b/d of Arabian Heavy crude. The Dammam field is Saudi Arabia's oldest and has not been in production for nearly 30 years. Other OPEC members�namely Nigeria, Angola, Qatar and the UAE�also have the potential to increase output in the forecast period.
The Iraqi government has a long-term target to raise oil production to 12m b/d, up from just 2.36m b/d in 2010, largely through a series of development con-tracts awarded to international oil companies (IOCs). Despite the continued absence of a federal hydrocarbons law, IOCs have been keen to enter the Iraqi oil sector. We expect steady increases in Iraq's output to about 3.25m b/d in 2012 and 3.56m b/d in 2013. However, in recent months progress in lifting output has been hindered by security issues; in September 2011 there were attacks on Iraq�s northern export pipeline to Turkey, followed in October by bombing along Iraq�s southern export pipeline and bombing at the southern Rumaila oilfield. We expect further small-scale attacks to hamper production growth in 2012-13, but they will not prevent steady progress. The country's export infrastructure is also curbing export potential. However, on January 1st 2012 the first of Iraq�s four new single-point moorings, off the coast of Basra, is expected to become operational, adding an additional 900,000 b/d in export capacity. The remaining three are expected to be finished by early 2014.
Although we expect political unrest in the Middle East and North Africa region to persist, we do not expect conflict in other major oil producers elsewhere in the region on the scale witnessed in Libya in 2011. However, there are other geopolitical flashpoints that could lead to price spikes. Tensions between the West and Iran over its nuclear programme remain and hit the headlines again in November 2011 with the publication of a report by the International Atomic Energy Agency (IAEA). While the IAEA stopped short of saying that Iran was working towards producing nuclear weapons, it did say that prior to 2003 there was evidence pointing to a weapons programme. Oil prices rose in response to the report on fears that there could be retaliatory action by Israel (or, less likely, by the US). Any attack on Iran (not our central scenario) could lead not only to lower supply from the world's third-largest exporter, but could also jeopardise supply from the Gulf producers if Iran were to retaliate by blocking the Strait of Hormuz.
There are other regional risks: specific security or political problems could re-emerge in Iraq and the domestic turmoil in Syria also poses the risk of spillover, with Lebanon and several of its other neighbours (including Israel and Jordan) potentially vulnerable. Furthermore, political stability is by no means ensured in Libya, as the new political forces jostle for power. There are also risks of disruption to Sudanese oil supply, including tribal hostilities in South Sudan,
There will be strong output growth in Iraq, but delays will occur
Geopolitical risk is ever present in the oil market

46 Crude oil
World commodity forecasts: industrial raw materials January 2012 www.eiu.com © The Economist Intelligence Unit Limited 2012
further tensions between the North and South and the risk that the North could�if only temporarily�block the pipeline carrying oil from South Sudan.
Outside of the Middle East, Nigeria's oil industry continues to suffer from outbreaks of civil unrest. The Europe-based multinational Royal Dutch Shell was forced to announce force majeure on its exports of Forcados oil in October 2011 after rebels sabotaged a pipeline (it was subsequently lifted in November). Although oil installations are likely to remain a target of civil unrest, Nigeria's output in 2012-13 is expected to rise steadily, largely owing to the coming on stream of increasing amounts of offshore oil production.
The next OPEC meeting in mid-December is unlikely to lead to any change in the group's policy. Indeed, it will probably be more of a damage-limitation exercise after the disastrous meeting in June 2011, when member states failed to reach a consensus. Prevailing high oil prices will mean that discussing pro-duction targets will be less controversial; Saudi Arabia and the other Gulf Co-operation Council (GCC) countries may announce some reduction in output given the steady increases in Libyan supply. However, OPEC members generally are unlikely to support output cuts, given high prevailing prices and their higher budgetary needs. An OPEC-co-ordinated cut in production is only likely if prices fall steeply. At the meeting, concerns are likely to be expressed about the potential for demand growth in 2012, given the increasingly bleak economic outlook in the euro zone and, to a lesser extent, the US, but generally officials are expected to say that the market is currently comfortably supplied.
Non-OPEC production growth is expected to slow in the next two years, to an average annual rate of 0.9%. Russia's output, which is estimated to have grown by 2.6% in 2010, surprised on the upside in 2011 as new capacity came on stream, particularly at the TNK-BP greenfields. However, growth in output will slow in 2012-13, reflecting financing and regulatory issues. Brazil will continue to increase output, but there are reports that its mature oilfields are declining more rapidly than envisaged, and this will curtail the overall growth in production in 2012-13. Canada's output will increase, mainly from the Alberta tar sands, and additional output is expected in Colombia. US production, particularly of unconventional crudes, has also been growing, and this is expected to continue. Recent high prices have been encouraging investment in non-OECD countries.
Output in the North Sea (including UK and Norwegian fields), which is in terminal decline owing to maturing fields and a lack of new fields set to come on stream, is expected to continue to contract in 2012-13. Output from Mexico is also expected to fall over the forecast period as a result of maturing fields and the lack of new investment. Large increases in non-OPEC supply, primarily from China, Brazil and possibly Kazakhstan (output from the massive offshore Kashagan oilfield continues to suffer from severe delays) are not expected until 2013-14 at the earliest.
Growth in non-OPEC supply is expected to be relatively sluggish
OPEC members are to meet again in December

Crude oil 47
World commodity forecasts: industrial raw materials January 2012 www.eiu.com © The Economist Intelligence Unit Limited 2012
Oil: production (m b/d unless otherwise indicated)
2009 2010 2011 2012 2013OPEC crude 29.19 29.47 29.89 31.91 33.29OPEC NGLs 4.85 5.34 5.88 6.30 6.49
Total OPEC 34.04 34.81 35.77 38.21 39.78 % change -7.1 2.3 2.8 6.8 4.1OECD 18.80 18.86 18.90 19.13 19.09
Latin America 3.87 4.07 4.24 4.39 4.56Asia 7.55 7.80 7.72 7.75 7.80
Others 19.29 19.76 20.08 20.30 20.55Total non-OPEC 49.51 50.49 50.94 51.57 52.00 % change 4.4 2.0 0.9 1.2 0.8
Processing gains 2.25 2.30 2.35 2.37 2.40Overall total 85.80 87.59 89.07 92.15 94.18 % change -0.6 2.1 1.7 3.5 2.2
Sources: IEA; Economist Intelligence Unit.
OECD industry stocks in September 2011 remained below the five-year average, and early indications are that stocks fell again in October. However, preliminary data for November and early December suggest some building of stocks, at least in the US. OECD stocks are expected to start to build in 2012 given the weak demand outlook and improved supply picture, barring unforeseen supply shocks. Although both demand and supply will recover somewhat in 2013, stocks will continue to accumulate.
Oil: supply and demand (m b/d unless otherwise indicated)
2009 2010 2011 2012 2013Productiona 85.80 87.59 89.07 92.15 94.18
Consumption 85.53 88.27 89.44 90.83 92.56Balance 0.27 -0.67 -0.37 1.32 1.62Stocksb 2,641 2,666 2,580 2,624 2,711
Stocks to consumption ratioc 8.25 8.23 8.00 8.18 8.48
a Including processing gains. b Total OECD stocks, m barrels. c Number of weeks' consumption on hand.
Sources: IEA; Economist Intelligence Unit.
Oil (dated Brent Blend) prices will remain volatile in the coming quarters, reflecting uncertainties surrounding both demand and supply. The price of Brent fell sharply late in September 2011�to under US$105/barrel�amid a broad sell-off in commodities markets. However, prices rose back towards US$115/b in early November in response to renewed concerns about tensions between Iran and the West. Prices subsequently fell again over the course of November amid the deepening sovereign debt crisis in the euro zone. Uncertainty surrounding the extent of the global economic slowdown will weigh on the oil market over the next six months, although if euro zone leaders were to come up with a rescue package that would allay market fears, oil prices could be stronger than we envisage going into 2012. Assuming that there is no further deterioration in regional security in the Middle East, we expect a return to a market surplus in 2012 and some building of stocks. However, loose global monetary conditions
Stocks and prices
Prices are expected to weaken in 2012 but to start to recover in 2013

48 Crude oil
World commodity forecasts: industrial raw materials January 2012 www.eiu.com © The Economist Intelligence Unit Limited 2012
and steady, if unexciting, demand growth in the emerging world will support prices. We expect prices to average US$95/b in 2012. Improved economic growth prospects in 2013 will lead to some recovery in prices, but the expected market surplus in that year will prevent a significant increase.
Oil: prices (US$/barrel unless otherwise indicated)
2010 2011 2012 2013 2014Brenta 1 Qtr 76.65 104.90 100.00 95.00 100.002 Qtr 78.67 117.12 95.00 97.00 -3 Qtr 76.41 112.47 92.00 98.00 -4 Qtr 86.80 109.50 93.00 100.00 -Year 79.63 111.00 95.00 97.50 - % change 28.73 39.39 -14.41 2.63 -West Texas Intermediate (WTI)a 1 Qtr 78.63 93.93 90.00 93.10 100.002 Qtr 77.86 102.51 87.40 95.06 -3 Qtr 76.01 89.71 87.40 96.04 -4 Qtr 85.10 96.00 90.21 98.00 -Year 79.40 95.54 88.75 95.55 - % change 28.71 20.33 -7.10 7.66 -IEA importsb 1 Qtr 76.04 104.06 99.20 94.24 96.222 Qtr 78.04 116.19 94.24 96.22 -3 Qtr 75.80 111.57 91.26 97.22 -4 Qtr 86.10 108.62 92.26 99.20 -Year 78.99 110.11 94.24 96.72 - % change 28.73 39.39 -14.41 2.63 -
a Spot price (US$/b). b Weighted average cif cost of IEA imports.
Sources: IMF; IEA; Economist Intelligence Unit.
Oil: prices(dated Brent Blend; US$/b)
Sources: IMF, International Financial Statistics; Economist Intelligence Unit.
0
20
40
60
80
100
120
140
141312111009080706052004

Gold 49
World commodity forecasts: industrial raw materials January 2012 www.eiu.com © The Economist Intelligence Unit Limited 2012
Gold
The Economist Intelligence Unit has revised down again its estimate of gold consumption growth in 2011 to 6.2% (from 6.6% previously), following the release of third-quarter demand estimates by the World Gold Council (WGC), which show a marked contraction in jewellery demand in India and weak industrial demand. After wobbling in the wake of the more general commodities sell-off in late September, investment inflows picked up later in the fourth quarter and are estimated to have grown by 18% in the year as a whole. With economic uncertainty and low global interest rates expected to continue into 2012, we forecast that gold consumption will rise again, by around 4.3%. However, as investors start to factor in monetary tightening in the developed world and seek to lock in profits, we expect weaker demand in the second half of 2012 and a fall in consumption, led by a contraction in investment demand, in 2013.
Global jewellery demand is estimated to have grown at an annual average rate of 2.6% in 2011. Jewellery demand held up in the first half of the year, but a 26% year-on-year drop in India's consumption in the third quarter depressed overall consumption and offset the steady gains in Chinese buying. High and volatile prevailing prices were undoubtedly a key factor in the weakness of Indian demand in the third quarter and also deterred jewellery consumption in other parts of the world, particularly in Europe, the US and the Middle East. Furthermore, there was a marked movement towards lower-carat gold jewellery. It seems that price was a particularly important factor in the downturn in Middle Eastern consumption recorded in the first half of 2011, either because of weak local currencies (Egypt) or currency pegs to the US dollar (the Gulf Co-operation Council), which meant that consumers felt the full impact of the rise in US dollar terms. Weakness in the rupee in the third quarter was also a factor in depressing Indian consumption at that time.
However, jewellery consumption in China and Hong Kong remained strong in the third quarter, growing by 13% and 28% respectively. China overtook India to become the world's largest gold jewellery market with a 28% market share. Higher carat (24) gold was in particularly strong demand in China, suggesting that much of the buying was for investment rather than just decorative purposes. The big increase in jewellery buying in Hong Kong was driven by tourists from mainland China who were attracted by lower taxes in Hong Kong.
We expect that jewellery demand will have picked up in India in the fourth quarter, partly for seasonal reasons, but also because of somewhat weaker prices. However, the persistent weakness of the rupee would have offset the positive impact of the fall in the international price. We have revised down our estimate of growth in jewellery consumption in India in 2011 to just 2%, with the risk on the downside. The prospects for 2012 are somewhat brighter, helped by a good monsoon, which will support rural incomes (farmers traditionally account for two-thirds of India's gold consumption), and some pent-up demand. The prospects for economic growth have deteriorated slightly in India, but we still expect gold jewellery consumption to grow at an average annual
High prices deterred some jewellery buyers in 2011
Demand
Jewellery demand will have picked up in the fourth quarter

50 Gold
World commodity forecasts: industrial raw materials January 2012 www.eiu.com © The Economist Intelligence Unit Limited 2012
rate of 7.5% in 2012-13. Consumption will be supported in 2013 by somewhat lower prices and the return of more traditional buyers.
We expect persistently strong growth in jewellery consumption�albeit at a slower pace�in China to support an increase in global jewellery demand of 5.8% in 2012. In 2013 lower prices will encourage consumption for decorative purposes, but this will be partly offset by lower investment-related jewellery demand. We therefore expect growth in consumption to slow to 5%, despite lower prices in that year.
Investment demand in the form of bars and coins was also being driven by China in 2011; China's consumption was up by 24% year on year in the third quarter. While Chinese consumers were concerned about high inflation and were buying gold as a hedge, gold was also seen as a safer bet than the local stock exchange or the inflated property market. With real deposit rates in China still in negative territory, Chinese investors are attracted by the possibility of a return on gold. Many of these trends are expected to persist in 2012-13, and although we expect a modest slowdown in China's economy, gold investment and consumption will be coming from a low base, and we therefore expect persistent growth in both jewellery and investment demand. The surge in gold demand also reflects the population's rising purchasing power and the deregulation of the domestic gold market.
In the medium term the People�s Bank of China (PBC, the central bank) is increasing its gold holdings, which totalled just 1,054 tonnes of gold (or 1.7% of total reserves) at end-October 2011, compared with 8,134 tonnes (and 75.5% of reserves) held by the US. Given the growth in consumption from both the official and the household sector, we expect Chinese gold imports to surge over the next decade.
Global consumption of gold for industrial purposes remained flat in the third quarter, having recorded only minimal demand growth in the first half of 2011. High prices were probably constraining consumption. Consumption in the dental sector contracted again in the third quarter by 9% in year-on-year terms, as gold continues to price itself out of this market. Demand from the electronics sector slowed in the third quarter to year-on-year growth of 1%, compared with growth of 4% in the second quarter. The deteriorating global economic outlook, particularly in the developed world, will constrain usage by the electronics sector in 2012-13 to an annual average of just over 1% (previously 3%). Efforts will be made to switch away from gold in applications to cheaper alternatives, but anecdotal reports suggest this is not always successful (outside of the dental sector). In the medium term gold is expected to retain its industrial role; it is being used in a number of new technologies, particularly as an active catalyst in controlling emissions and in solar cells.
Net retail investment (including ETFs) rose by 33% year on year in the third quarter of 2011, following a 37% drop in the second quarter, according to the WGC. Inflows into ETFs continued to recover after a weak start to the year, reaching 77.6 tonnes, and the market started to attract buyers from India and Japan as well as the more traditional Western markets. Early signs are that inflows continued to grow in October and November, with the lower gold price
Slower OECD economic growth will curb consumption of electronics
Net retail investment will falter in 2013
China's demand is expected to remain strong

Gold 51
World commodity forecasts: industrial raw materials January 2012 www.eiu.com © The Economist Intelligence Unit Limited 2012
perhaps acting as an incentive. We expect inflows into ETFs to remain strong in 2012 before falling sharply in 2013, as investors take profits and global interest rates start to rise.
Consumption of gold bars and coins remained strong in the third quarter of 2011, growing by 29% year on year, up from 9% growth in the second quarter. Buying was particularly strong in Europe, but China, Vietnam and Turkey also recorded strong growth. The picture is somewhat different in the US, where sales have been weak, perhaps because gold holdings are taxed very highly at 28%, compared with 18% on equities.)
Reflecting the strong start to the year�at least outside of the US�we expect growth of 18% in net retail investment in 2011 as a whole. We expect investor demand to remain positive in 2012 before a sharp fall in 2013, as investors judge that gold prices have peaked and that better returns will be available elsewhere.
Gold: consumption (tonnes unless otherwise indicated)
2009 2010 2011 2012 2013Industrial & dental 410 466 468 471 480
Jewellery consumption 1,814 2,017 2,069 2,189 2,298 India 442 746 761 821 879 China 352 400 454 490 510 US 150 129 118 112 107 Turkey 75 74 76 78 81 Saudi Arabia 78 73 64 63 66 Russia 60 68 73 74 77 UAE 68 53 52 53 56 Indonesia 41 33 31 31 32 Italy 41 35 30 28 27 Japan 22 19 15 14 14Net retail investmenta 778 1,149 1,356 1,396 1,257
ETFs 617 338 321 337 270Total 3,619 3,970 4,214 4,394 4,304 % change -8.7 9.7 6.2 4.3 -2.0
a Gold bars and coins; does not include exchange-traded funds (ETFs) or other investment flows.
Sources: World Gold Council (WGC); Gold Fields Mineral Services (GFMS); Economist Intelligence Unit.
Total gold supply rose by just 1.7% in 2010, as a lower level of scrap-gold recycling and net buying by central banks partly offset mine output growth of 3.8%. Data for the first nine months of 2011 from the World Bureau of Metal Statistics (WBMS) show growth in mine production of just 2.5% year on year. Despite high prices and new, albeit smaller, gold producers coming on stream, we expect output in the remainder of 2011 to have decelerated slightly owing to disruptions, particularly in Indonesia. Mine production is expected to continue to grow in 2012-13, at an annual average rate of just under 3%, incentivised by the persistence of historically high prices. New mines are coming on stream in Africa and Latin America, and this will help to offset the long-term decline in some traditional suppliers such as South Africa. Recycled gold supply fell in nominal terms in 2011 and will remain largely unchanged in 2012, but it will still be strong by historical standards, as global economic uncertainty persists and prices stay at elevated levels. We expect recycled gold supply to surge in
Supply

52 Gold
World commodity forecasts: industrial raw materials January 2012 www.eiu.com © The Economist Intelligence Unit Limited 2012
2013, as prices start to fall and sentiment sours in the market. The official sector is forecast to remain a net buyer of gold throughout the forecast period, as central banks will continue to diversify their reserve holdings. A small amount of producer hedging is also expected in 2011-13, as producers become concerned about the risk of a collapse in gold prices. The net effect of these trends is that global supply are estimated to have contracted slightly in 2011, but will rise strongly in both 2012 and 2013.
China, the world's largest gold producer, increased output by 8.6% in 2010, but production growth was lower in the first nine months of 2011 at 4% year on year according to the WBMS, and at 4.3% year on year according to official local sources. We expect production to continue growing, averaging 3.5% per year in 2012-13, but output will be negatively affected by the government's ongoing clampdown on safety and environmental regulations in the mining sector.
During the forecast period a large increase in gold production is expected in Mongolia, which has seen stagnation or contraction in mining output in recent years. (Gold output was down by nearly 8.4% in the first nine months of 2011.) The massive Oyu Tolgoi copper and gold mine, managed by Rio Tinto (UK) and Ivanhoe Mines (Canada), is now expected to start production in August 2012, a year earlier than previously expected.
South Africa's gold production is expected to continue to fall during the forecast period at an annual average rate of 2%, owing to ageing mines and the diminishing profitability of operations. According to Statistics South Africa, the national statistical agency, gold mine output was down by 9% year on year in September 2011. However, the August-September figures were affected by mine workers' strike action, and we expect the annual decline in output to be closer to 5%. (WBMS recorded output falling by 3.7% in the first nine months of the year.)
After slipping in 2010, Canada's production started to recover in 2011, growing by 6.8% year on year in the first nine months of the year. We expect output to have grown by 6.5% over the year as a whole, but slowing thereafter to annual average growth of 2.5% in 2012-13. In the US there was a 3.7% year-on-year rise in 2010, following the start-up of new mines and higher than expected grades at Barrick's Cortez Hills mine. However, after lacklustre growth in 2011 US production is expected to stagnate in 2012-13, as this one-off boost to output falls out of the calculation.
Gold mine output in Australia surged in 2010 by 16.6%�reversing its long-term decline�boosted by high grades of ore at Newmont's Boddington mine. However, the pace of growth has slowed sharply since the beginning of 2011, partly owing to some flood damage in the early part of the year, and we estimate that output will have grown by 3%. A strong rebound is expected in 2012-13, with annual average growth of 5%, as new mines come on stream and assuming no further weather-related disruptions to supply.
Output of gold in Russia�the world's fifth-largest producer�faltered in 2010, but the start-up of new mines and the opening of a new refining plant in Krasnoyarsk will drive a healthy rise in annual average production of 3.5% in 2012-13. According to preliminary data from the Union of Russian Gold Producers, mine output was up by 5.1% year on year in the first ten months of
China's mine output will continue to grow in 2012-13, but at a slower rate
Australian output growth will slow in 2011, but Russian output will pick up
Of the traditional producers, the outlook is better in North America

Gold 53
World commodity forecasts: industrial raw materials January 2012 www.eiu.com © The Economist Intelligence Unit Limited 2012
2011, partly owing to increased supply from the Blagodatnoye and Malomir operations as well as Polyus Gold's Olimpiada mine in Krasnoyarsk. Although only a small producer, output in Kazakhstan has been growing particularly rapidly. After a 29.5% increase in output in 2010 to 13.3m tonnes, the state statistical agency announced that output rose by 34.9% in the first nine months of 2011 to 12.5m tonnes, boosted by increased output from Altyntau Kokshetau.
In Indonesia, production fell by 9.8% in 2010, according to the WBMS, owing to a sharp drop in output at the Grasberg mine, where ore grades fell as a result of mine sequencing. Ore grades have remained a concern, and output at the Grasberg mine was also affected by labour unrest in early July 2011. About 90% of workers subsequently walked out on a month-long strike in mid-September, and in mid-October it was announced that all production at the mine would cease owing to attacks and suspected sabotage. In early December miners said that the strike would continue until December 15th at least. The WBMS reports that production was down by 16.2% in the first nine months of the year. To reflect the length of the strike, we have revised down again our estimate of 2011 production to a contraction of 18% (from 12% previously), and risks are on the downside. Several new smaller mines are expected to have ramped up production in the fourth quarter, but this will not be sufficient to offset the loss of output from Grasberg. Production should recover strongly in 2012, growing by 12%, before normalising in 2013 with growth of 3%.
Latin America's leading producer, Peru, has experienced problems with its largest gold mine, Yanacocha, which reduced national output by 10.8% in 2010. The downward trend continued in 2011�production was down by nearly 5% in January-July�as a result of lower ore grades at Yanacocha, a three-day strike at the Oropampa mine in May, and falling investment owing to local community objections. However, there were signs of a recovery with the release of August data, and in January-September output grew by 0.5% year on year. We estimate that output grew by 1% in 2011. Peru is set to ramp up production over the forecast period. The country has total proven gold reserves of 2,000 tonnes, and a number of large new projects are scheduled to come on stream in the next five years, including the Tantahuatay project, which received permits to start production in August 2011. Output should start to recover in 2012, growing by 3.8%, with further growth of 4% in 2013. The new government in Peru is reportedly working on a long-term framework for the mining sector with the aim of restoring confidence among potential investors in the sector.
Gold mine production is on the rise across Sub-Saharan Africa, particularly from smaller mines that have been made commercially viable by the recent strength in prices. In Burkina Faso, production started at the Essakane gold mine in July 2010, adding to the other five mines in the country. In late August 2011 the country's Ministry of Mines announced that it expected gold output to rise by just over 10% to 27 tonnes in 2011, with the Essakane mine alone producing around 13 tonnes. In Ghana, Africa's second-largest producer, production growth slipped in the first nine months of 2011 by 2.5% year on year, and we now forecast growth at an annual average rate of just 1% in 2012-13. Production in Côte d'Ivoire, however, soared by 158% in the first nine months of 2011, driven by output from the Tongon mine, which opened in late 2010.
Peru's mining sector has huge potential, but obstacles remain
Smaller African producers are starting to raise output significantly
The Grasberg mine in Indonesia has been temporarily closed

54 Gold
World commodity forecasts: industrial raw materials January 2012 www.eiu.com © The Economist Intelligence Unit Limited 2012
According to the WGC, recycling of gold fell by 2.9% in 2010, mainly owing to a drop in scrap supply in India and China, where gold demand was strong. Scrap supply continued to fall in the first half of 2011, dropping by 7% year on year. However, recycling picked up once again in the third quarter, rising by 13% year on year, although given the high price available, the level of activity was probably still relatively subdued. Recycling was particularly strong in the US and in southern Europe (perhaps distressed-selling), but it is likely that people elsewhere were anticipating further price rises. We expect the volume of scrap supply to be flat in 2012 before a surge in 2013, as holders of gold seek to sell their gold owing to fears that the price could fall sharply.
Since the second quarter of 2009 central banks have been net buyers of gold�the first time this has happened since 1988�indicating their reluctance to sell gold reserves at a time of economic uncertainty and record prices, as well as their desire to diversify their reserve asset portfolios away from foreign exchange (and the US dollar in particular). Net central bank purchases in 2010 stood at 76 tonnes. Central banks remained net buyers in 2011, purchasing 148.4 tonnes in the third quarter of the year, with particularly strong buying by Russia, Bolivia and Thailand. (The Russian central bank is buying local production.) The official sector is set to remain a net buyer of gold in 2012-13, as it continues with efforts to diversify its asset portfolios at a time of ongoing economic uncertainty.
The potential for dehedging is now almost exhausted�the global hedge book was estimated at just 125 tonnes at end-2010. However, there was a small amount of hedging activity in the first nine months of 2011, and we expect hedging of small amounts to continue in 2012-13, as producers start to fear a sharp downward correction in gold prices.
Gold: production (tonnes unless otherwise indicated)
2009 2010 2011 2012 2013Mine supply 2,478 2,572 2,618 2,705 2,775 China 314 341 353 367 378 Australia 223 260 268 281 295 US 223 231 232 232 232 South Africa 206 191 182 178 175 Russia 205 201 213 222 229 Peru 184 164 166 172 179 Indonesia 141 127 104 116 120 Ghana 91 92 91 92 93 Canada 97 91 97 100 102 Uzbekistan 73 73 74 74 74 Mexico 56 70 70 73 76 Brazil 57 61 76 80 84
Official sector sales 34 -76 -270 -125 -64Old gold scrap 1,695 1,646 1,580 1,580 1,817Net producer hedging -236 -103 12 30 45
Total 3,970 4,039 3,940 4,189 4,573 % change 13.9 1.7 -2.4 6.3 9.1
Sources: WGC; World Bureau of Metal Statistics; Economist Intelligence Unit.
Recycling will pick up once the price is perceived to have peaked
Net central bank buying is expected to continue in 2012-13
Hedging is expected to return in a limited way in 2012-13

Gold 55
World commodity forecasts: industrial raw materials January 2012 www.eiu.com © The Economist Intelligence Unit Limited 2012
Global demand rebounded strongly in 2010, driven by a resurgence in jewellery demand and strong investor appetite, but ongoing rises in mining output and scrap supply kept the market in surplus. Given persistently strong investor demand, the market is expected to have fallen into deficit in 2011 and to remain in deficit in 2012. Weaker investor demand will enable the market to return to surplus in 2013.
Gold: supply and demand (tonnes)
2009 2010 2011 2012 2013Supply 3,970 4,039 3,940 4,189 4,573Demand 3,619 3,970 4,214 4,394 4,304
Balance 351 69 -274 -204 269Official sector gold holdings 29,693 29,769 30,039 30,164 30,228
Sources: WGC; GFMS; Economist Intelligence Unit.
We expect investor demand, particularly in Asia, to continue to support prices moving into 2012, given persistently low (or more often negative) real interest rates and economic uncertainty. Furthermore, the recent fall in prices could be seen as a "buying opportunity". Prices are expected to average US$1,730/troy oz in the fourth quarter of 2011. Economic uncertainty will continue to support prices at just over US$1,800/troy oz in 2012, but prices are expected to slip in the second half of the year, as investors start to lock in profits. By 2013 tighter global monetary conditions and profit-taking will lead to a more marked fall in gold prices.
Notwithstanding bouts of extreme volatility, gold prices rose steadily in the first eight months of 2011, from around US$1,400/troy oz at the end of 2010 to around US$1,815/troy oz at the end of August, which was a particularly volatile month. Prices fell sharply in late September amid the wider movement down in commodity prices and ended the month at US$1,620/troy oz. Prices started to recover cautiously during October and reached nearly US$1,750/troy oz by end-November amid deepening concerns about the future of the euro zone. Given the heightened concerns and the move by the Swiss National Bank (SNB, the central bank) to take the heat out of another "safe-haven" asset, the Swiss franc, it was perhaps somewhat surprising that gold did not perform more strongly. It appears likely that renewed recognition of gold as an essentially risky commodity�as evidenced by its recent volatility and the fact that unlike currencies it does not have a central authority that can take steps to support its value�undermined investor confidence. Selling to cover losses on other instruments and higher trading margins probably also contributed to the decline in the gold price.
There remains a substantial risk of another collapse in gold prices before 2013. Should fears of a double-dip global recession be realised, investors could be forced to sell off their gold positions en masse to offset losses, driving down prices. Conversely, should the global recovery gather pace more quickly than anticipated, investors may decide that gold prices have peaked and seek to take profits to invest them elsewhere, triggering a collapse in prices. However, perhaps the greater risk at the time of writing is for a surge in gold prices. Gold
Stocks and prices
The outcome of the euro zone crisis will determine prices
Gold prices will remain volatile

56 Gold
World commodity forecasts: industrial raw materials January 2012 www.eiu.com © The Economist Intelligence Unit Limited 2012
would be a natural beneficiary of further uncertainty surrounding the future of the euro as a currency
Gold: pricesa 2010 2011 2012 2013 20141 Qtr 1,109 1,384 1,825 1,600 1,0002 Qtr 1,196 1,507 1,850 1,400 -
3 Qtr 1,227 1,700 1,795 1,200 -4 Qtr 1,368 1,730 1,750 1,050 -
Year 1,225 1,580 1,805 1,313 - % change 25.9 29.0 14.2 -27.3 -
a US$/troy oz, London Bullion Market Association (LBMA) PM Fix.
Sources: LBMA; Economist Intelligence Unit.
Gold: prices(LBMA, PM Fix; US$/troy oz)
Sources: London Bullion Market Association; Economist Intelligence Unit.
0
200
400
600
800
1,000
1,200
1,400
1,600
1,800
2,000
141312111009080706052004

Lead 57
World commodity forecasts: industrial raw materials January 2012 www.eiu.com © The Economist Intelligence Unit Limited 2012
Lead
Globally, growth in lead consumption rebounded sharply in 2010, by 7.1% to 9.64m tonnes, reflecting both a restocking phase and a rise in lead use by the automotive sector. Lead has a far weaker correlation to the economic cycle than the other base metals, so should remain somewhat immune to a downturn. This is evident in the high growth rate for consumption estimated by the International Lead and Zinc Study Group (ILZSG) of 7.5% year on year in January-September. Most of the other base metals recorded a significant slowdown in the rate of demand growth in 2011 compared with 2010. The Economist Intelligence Unit estimates growth of 6.7% in 2011, and we expect demand to remain robust at around 4-5% in 2012 and 2013, supported by emerging-market demand. Refined lead consumption in the developed world will slow markedly over the next two years following 2010's cyclical recovery and as a result of the ongoing relocation of battery manufacturing to low-cost producing regions. Conversely, emerging-market lead demand in general should remain firm, reflecting both higher battery and vehicle output.
Although a crackdown on heavy-polluting battery plants in China was a major focus of the lead market in 2011 and briefly appeared to undermine demand growth as 83% of 1,930 battery makers and recyclers inspected during the programme were ordered to shut down, lead usage levels actually remained strongly positive in year-on-year terms. We believe that this was because of a number of factors. First, it is likely that a number of shutdowns were only temporary; many plants may have been allowed to restart quickly with a minimum of disruption. Second, the permanent closures, which most probably affected the smallest and oldest plants, would have freed up raw materials to allow unaffected plants (larger, modern facilities) to operate at higher capacity utilisation rates. Third, battery makers may have increased production ahead of the inspections, aiming to build up stocks to tide them over in anticipation of disruptions.
The worst of the disruptions have passed and China�s battery industry is getting back to normal, as plants have been ramping up operations and rebuilding inventories since mid-2011. We therefore predict growth of around 8% in 2012-13. The ILZSG estimates that demand in China, which accounted for 44% of global consumption in 2010, increased by 11.8% year on year in the first nine months of 2011, to 3.32m tonnes. Indeed, September saw the strongest demand of the year to date, with 406,500 tonnes consumed during the month, versus a monthly average prior to that of 364,063 tonnes. Our own calculations of apparent consumption in October (based on production, net trade and reported stock changes) suggest a 1.6% month-on-month increase from September�s high level. In addition, early indications for November�based on Shanghai Futures Exchange (SHFE) stocks�suggest yet another strong month. This puts refined lead consumption in China on course to reach our estimate for growth of nearly 14% in 2011.
Following the March 11th earthquake and tsunami disaster in Japan, there was an increase in demand for lead for batteries used as back-up power for emergency services and utilities. However, the sharp drop in vehicle output
Demand
Japanese demand has recovered well and will rebound further in 2012
Double-digit growth in China's demand in 2011 despite clampdowns
China's consumption growth will moderate in 2012

58 Lead
World commodity forecasts: industrial raw materials January 2012 www.eiu.com © The Economist Intelligence Unit Limited 2012
in Japan in April-May curtailed demand for lead in the original equipment (OE) automotive battery market. However, consumption has since recovered strongly in line with the rebound seen in the automotive sector. According to the ILZSG, Japan consumed 18,900 tonnes of lead in July and 18,500 tonnes in August and September, making the third quarter the strongest of the year so far. Cumulative consumption in the January-September period this year was 157,000 tonnes, virtually unchanged from the 159,000 tonnes consumed during the same period in 2010. Overall, we expect consumption to remain fairly flat in 2011, before rebounding in 2012, albeit largely owing to the base effect of such a weak first half this year.
In the longer term, we expect that the entrenched downtrend in Japanese lead consumption will resume, as the relocation of battery manufacture to lower labour-cost regions continues. Thus, although we expect positive growth in 2013, we forecast an expansion of just 1% compared with nearly 4% in 2012.
A similar scenario applies to the battery manufacturing sector in other Asian countries, with the ILZSG reporting flat growth in South Korean refined lead consumption in the nine months to September 2011. However, Taiwan and India posted strongly positive growth at 60% and 10.7% year on year respectively. Over the longer term, the key drivers of lead demand within the Asian region will remain China, and to a lesser extent India.
The EU registered a strong rebound in refined lead demand in 2010, growing by 8.4% to 1.56m tonnes. However, this rebound primarily reflected the low base in 2009, and demand conditions eased in late 2010 following the winding-down of vehicle scrappage schemes. According to the European Automobile Manufacturers' Association, passenger vehicle registrations fell by 5.5% in 2010 to 13.4m units, and fell by a further 1.2% year on year in January-October 2011, reducing demand for original equipment (OE) batteries. Underlying conditions within the sector remain weak and are unlikely to improve in the short term, given the lingering uncertainties and austerity measures denting demand in many parts of the region. According to ILZSG data, refined lead demand expanded by just 1.1% in the nine months to September 2011, slipping from a growth rate of 2.4% over the January-August period. For the full year, we expect consumption in the EU to be largely unchanged from a year earlier, with the risks remaining on the downside. In 2012 and 2013 we expect production to remain flat at best, as austerity continues and battery manufacture is increasingly taking place in the emerging economies.
In the US, demand for OE batteries improved in 2010, as the automotive sector recovered from the exceptionally low level of sales and production in 2009. This strength spilled over into 2011, with demand for OE batteries up by 2% year on year in the eight months to August, at 10.3m units, and demand for replacement batteries up by 3%, at 69.6m units. However, ILZSG data show that refined lead consumption expanded by 10.4% over the January-September period, with the higher growth rate probably reflecting restocking. However, we expect the final quarter of 2011 to be weak, and a return to more typical growth rates of 0-2% in 2012-13, down from 3.4% in 2010.
India supports China as a pillar of Asian growth
EU demand growth looks no better than flat, with the risks to the downside
US growth has been stronger than expected, but is likely to slow

Lead 59
World commodity forecasts: industrial raw materials January 2012 www.eiu.com © The Economist Intelligence Unit Limited 2012
Refined lead: consumptiona ('000 tonnes unless otherwise indicated)
2009 2010 2011 2012 2013China 3,925 4,213 4,794 5,178 5,592EU 1,440 1,561 1,560 1,550 1,566
US 1,397 1,445 1,530 1,540 1,560South Korea 328 385 380 382 390India 297 312 330 350 371
Japan 189 224 223 232 234Mexico 157 188 162 170 179
Taiwan 102 75 110 90 95Others 1,162 1,236 1,200 1,220 1,257World total 8,997 9,639 10,289 10,712 11,244 % change -0.6 7.1 6.7 4.1 5.0
a Consumption of primary and secondary metal, excluding remelt.
Sources: International Lead and Zinc Study Group (ILZSG); Economist Intelligence Unit.
In 2010 global refined lead output increased by 6.5% to just below 9.6m tonnes, according to the ILZSG. Growth was driven almost entirely by China, where production of domestic lead concentrate was also sharply higher. China accounted for 48.4% of global lead mine supply and 44.2% of refined metal production in 2010. Chinese refined lead output in 2011 does not appear to have been overly affected by the government's high-profile attempts to limit power supplies to energy-intensive users (including the lead industry), but the government has engaged in a crackdown on smelters (mainly recycling plants) for not meeting environmental standards. This resulted in a contraction in secondary output in 2011 following an expansion of 8.9% in 2010, although growth in primary output has remained strongly positive. Our current estimate for growth in China's refined output in 2011 is 10.7%, but the risks are to the upside, as there is still sufficient smelting capacity in China to allow a significant increase in refined output, providing concentrate remains readily available. Outside China, although mine output rose strongly, by around 10% in 2011, on the back of new capacity ramp-ups, such robust growth is not expected to be maintained. We therefore forecast a slight moderation in the pace of global refined lead output growth, from 6.2% in 2011, to around 4.5% a year in 2012-13.
According to Antaike, China's state-owned research organisation, about 400,000 tonnes/year (t/y) of smelting capacity was added in 2010. There is the potential for at least as much new capacity to have been added in 2011, as some projects were put on hold last year. Four new smelters, each with a capacity of 100,000 t/y, are being commissioned, including Chenzhou Jingui Silver Group, Chenzhou Yuteng Chemical Manufacturers, Guiyang Yixxing Smelting and Hunan Huaxin Nonferrous. There is brownfield expansion, with Minshan Nonferrous planning to boost capacity from the current 60,000 t/y to an eventual 210,000 t/y, while Chihong Zinc has announced plans to construct a 60,000-t/y lead smelter, although no start-up date has been decided.
Supply
New Chinese smelting capacity additions far outweigh closures

60 Lead
World commodity forecasts: industrial raw materials January 2012 www.eiu.com © The Economist Intelligence Unit Limited 2012
In general, new capacity built to modern specifications and capable of operating at high environmental standards is replacing outdated capacity which the government is targeting for closure. However, capacity additions far outweigh capacity closures.
Ample smelting capacity and improved concentrate supply allowed for a 13.5% year-on-year increase in refined output in the first ten months of 2011, according to data from the National Bureau of Statistics (NBS). This is despite reports suggesting that the industry only operated at an average capacity utilisation rate of around 56% in the year to October. The low average reflects the impact of inspections and enforced shutdowns that started in March as part of the government's latest environmental clampdown. Along with battery manufact-urers, lead recyclers were targeted, and the effects of the inspections on them are clear from the breakdown of production data published by the China Nonferrous Metal Industry Association (CNIA). It shows that secondary lead production during the nine months to September contracted by 0.2%, to 1.014m tonnes. Growth was running at a double-digit pace in the year-earlier period.
This means that total lead production in China is being driven by the primary smelting sector, supported by ample concentrate availability. China's concen-trate output rose by 20.7% year on year in the first nine months of 2011, to 1.616m tonnes. However, domestic smelters have been more reluctant to purchase foreign concentrate, given the uncertainties created by the government inspections and shutdowns affecting parts of the Chinese lead industry this year. As a result, concentrate imports fell in year-on-year terms by 6.2% in the nine months to September amid reports of backlogs in ports in Peru and elsewhere. However, following the steep price falls in September and the end of the inspection disruptions, the balance between domestic versus foreign concentrate feeding the Chinese primary lead smelting industry has changed. Many small, marginal domestic mines have begun to close owing to the low prices, and stocks of foreign concentrate have begun being mobilised and shipped to China. Lead concentrate imports averaged 139,700 tonnes/month in August-October, compared with 87,620 tonnes/month during the preceding three months.
Concentrate production outside China increased by 2.3% in 2010, with data from the ILSZG showing that growth remained weak in 2011, at around 1%. Many mining companies outside China are unable to lift production signifi-cantly, owing to a combination of capacity constraints, a lack of investment in new lead-rich orebodies and environmental concerns. Mexico, India, Russia, Macedonia and Ireland were the main drivers of positive growth in lead mine supply in 2011.
Overall, capacity constraints will limit future growth in non-Chinese refined lead production, as will the ongoing tightness in the concentrate market outside China, which will only intensify when major mines such as Brunswick in Canada and Century in Australia wind down and close over the next three years as their reserves are exhausted. In the US, refined output is on a gradual long-term declining trend, which we expect to continue in the next few years. In the EU, we expect growth to remain flat. India should be a rare significant source of non-Chinese growth over the forecast period, driven by the ramp-up
Capacity constraints outside China undermine global growth prospects
Non-Chinese growth prospects are dominated by India
China's growth has been driven by primary producers
Despite low utilisation rates, China's refined output growth will be strong

Lead 61
World commodity forecasts: industrial raw materials January 2012 www.eiu.com © The Economist Intelligence Unit Limited 2012
of Hindustan Zinc�s 100,000-t/y smelter at Dariba, which was commissioned during the second quarter of 2011. The plant should raise Indian production by around 30% once operating at full capacity.
Refined lead: productiona ('000 tonnes unless otherwise indicated)
2009 2010 2011 2012 2013China 3,773 4,199 4,650 4,998 5,447
EU 1,515 1,580 1,630 1,650 1,634US 1,214 1,256 1,270 1,275 1,262
Japan 248 267 245 265 270South Korea 297 321 320 320 323Canada 259 273 280 285 282
Australia 246 210 252 265 278Mexico 228 256 265 272 280
Others 1,209 1,210 1,255 1,275 1,320World total 8,989 9,572 10,167 10,604 11,096 % change -0.8 6.5 6.2 4.3 4.6
a Primary and secondary refined output, excluding remelt.
Sources: ILZSG; Economist Intelligence Unit.
Our estimate of the global market deficit in 2011 stands at 122,000 tonnes, and we forecast a deficit of 108,000 tonnes in 2012 and one of 147,000 tonnes in 2013. The recurring themes are improving demand and constrained supply, with China the principal driving force of both sides of the supply-demand balance equation. In a 10m-11m t/y market, however, these deficit and surplus figures are negligible, which means that the market will be effectively balanced. Despite the inventory gain seen over the past 18 months on the London Metal Exchange (LME), the increase has been relatively small from a historical stand-point. As a result, the inventory consumption ratio, which is still below three weeks, is lower than that seen for most of the base metals complex. Moreover, much of the metal moved onto the LME has come from other stockpiles held by consumers, producers or merchants outside the LME system, so it just represents metal being relocated to a more visible domain. The underlying inventory position in lead is still very tight, and this has attracted some investment activity to the market, which has been reflected in the strong but volatile price performance of the metal for much of 2011. We expect this trend to continue, with an upward bias returning once concerns over the fiscal and macroeconomic outlook start to subside.
Refined lead: supply and demand ('000 tonnes unless otherwise indicated)
2009 2010 2011 2012 2013Global production 8,989 9,572 10,167 10,604 11,096
Global consumption 8,997 9,639 10,289 10,712 11,244US stockpile disposals 0 0 0 0 0
Balance -8 -67 -122 -108 -147Stocks 447 600 478 370 223Weeks' consumptiona 2.6 3.2 2.4 1.8 1.0
a Number of weeks' forward demand.
Sources: ILZSG; Economist Intelligence Unit.
Stocks and prices

62 Lead
World commodity forecasts: industrial raw materials January 2012 www.eiu.com © The Economist Intelligence Unit Limited 2012
The underlying fundamentals, which are reasonably positive for lead, have had little bearing on prices in recent months, and we believe that this trend will continue. The whole base metals sector experienced severe falls in August and September amid turmoil in the global capital markets. Prices have remained highly volatile, reflecting swings in investor sentiment and appetite for risk assets. Ongoing anxiety about the fallout from the euro zone debt crisis is the main factor driving the selling pressure. The daily lows extended to 81.1 US cents/lb on October 20th, from a high for the year of 133.3 US cents/lb in April, but prices have largely been consolidating with a gentle upward bias in November, and as such we have kept our fourth-quarter estimate at 93 US cents/lb. Our annual estimate for 2011 is 109.6 US cents/lb, and our forecast for 2012 is just under 105 US cents/lb, a 4.4% year-on-year fall. However, our 2013 forecast remains higher, at 109 US cents/lb, owing to expectations of an improving macroeconomic backdrop and critically low stock levels that year, which should attract consumer restocking and investor interest.
Refined lead: stocks and prices 2010 2011 2012 2013 2014Stocksa 1 Qtr 418 509 610 570 5152 Qtr 432 567 625 550 -3 Qtr 439 650 590 500 -4 Qtr 447 600 562 476 - % change 17.0 34.2 -6.3 -15.3 -Pricesb 1 Qtr 100.7 118.2 98.0 104.0 111.02 Qtr 88.2 115.7 101.0 108.0 -3 Qtr 92.2 111.5 108.0 114.0 -4 Qtr 108.4 93.0 112.0 110.0 -Year 97.3 109.6 104.8 109.0 - % change 24.7 12.6 -4.4 4.1 -
a Total reported commercial (LME, producer, consumer, merchant) stocks at end-period; '000 tonnes. b LME cash price, US cents/lb.
Sources: World Bureau of Metal Statistics (WBMS); London Metal Exchange (LME); Economist Intelligence Unit.
Lead: stocks and prices
Sources: World Bureau Metal Statistics; London Metal Exchange; Economist Intelligence Unit.
0
100
200
300
400
500
600
700
800
0
20
40
60
80
100
120
140
160
LME cash price (US cents/lb); right scaleStocks (000 tonnes); left scale
141312111009080706052004
Prices have consolidated and a recovery is expected in 2012

Natural gas 63
World commodity forecasts: industrial raw materials January 2012 www.eiu.com © The Economist Intelligence Unit Limited 2012
Natural gas
The Economist Intelligence Unit has revised down its estimate of gas consumption in 2011 to 4.1% (4.6% previously), constrained by the weak economic performance of OECD countries and a contraction in consumption in western Europe. Demand for natural gas will strengthen again in 2012-13, growing at an annual average rate of 5.4% as a result of efforts to reduce carbon dioxide (CO2) emissions and strong demand for liquefied natural gas (LNG) from Asia. Growth in global gas demand is expected to be particularly strong in non-OECD countries, notably in Asia, the Middle East and, to a lesser extent, Latin America. However, OECD gas demand is also set to increase, driven by rising LNG demand from Japan and US demand for its domestic shale gas, particularly for power generation. Also, the share of nuclear and coal in power generation is likely to fall owing to environmental concerns in OECD countries. We expect LNG to be the major source of consumption growth in Asia, and to a lesser extent in Europe.
Natural gas consumption by the power-generation and industrial sectors will drive consumption growth in the US during 2012-13. Gas consumption is estimated to grow by 2.8% in 2011 and a further increase to growth of 3.3% is forecast in 2012 as the negative impact of only sluggish economic growth will be more than offset by a switch, particularly by residential and commercial consumers, away from more expensive fossil fuels to cheap domestic gas. By 2013 we expect gas consumption to grow more strongly at an average rate of 3.6%, reflecting stronger industrial activity and some substitution by industrial users of coal for gas. Total gas consumption in the first eight months to August 2011 grew by 2.1%, while demand from the electric power sector rose by 2.4%, according to the Energy Information Administration (EIA).
Consumption of natural gas in Russia rebounded strongly in 2010 in line with recovering economic growth and exceptionally cold weather. Consumption is likely to expand moderately over the forecast period (2012-13), averaging annual growth of 3.2%, as it will be constrained by further rises in domestic gas tariffs and an increase in domestic energy efficiency.
In Europe, gas consumption is estimated to decline by 2.5% (a contraction of 1.2% previously) in 2011, following growth of 7.5% in 2010. Gas consumption was markedly lower in the first eight months of 2011 compared with the year-earlier period, according to the International Energy Agency (IEA), owing to weak economic activity and mild weather. UK consumption was down by 13.5% year on year in August, while consumption in Germany and France were 10.7% and 13.4% lower respectively. The mild start to winter in much of northern Europe suggests that consumption will continue to contract in year-on-year terms during the remainder of 2011.
We expect European gas consumption growth in 2012 to be a relatively weak at 1.3%, reflecting the contraction in euro zone growth in that year, before an acceleration in 2013 to growth of 2.9%. Government efforts to reduce CO2 emissions and natural gas use for electricity generation in favour of nuclear power will fuel the somewhat higher growth. In November 2011, as part of an
Demand
Natural gas consumption will grow steadily in the US and Russia
European gas consumption will be curbed by weak economic activity

64 Natural gas
World commodity forecasts: industrial raw materials January 2012 www.eiu.com © The Economist Intelligence Unit Limited 2012
electoral pact, the French socialist and green parties announced that they would aim to reduce France's dependence on nuclear energy for its electricity from 75% to 50% by 2025. Were this to happen, France's demand for natural gas would grow particularly strongly. However, there is a downside risk to our consumption forecast. If Europe enters a deeper recession, industrial and commercial activity would be lower, reducing the region's power needs. Furthermore, consumption of coal might be preferred over gas since it is cheaper (at least in Europe). Spain, for example, is estimated to have imported 10m tonnes of thermal coal in 2011. Also, there could be less LNG available for Europe, as cargoes are being diverted to Asia, which will lead to increased tightness and higher prices in the regional gas market, which will, in turn, curb consumption.
Japan's gas consumption rose by 9.6% year on year in the first eight months of this year, according to the IEA, and Japan�s imports of LNG were up by 17.9% year on year in October according to the Ministry of Finance. Tokyo Electric Power has announced that it will buy spot LNG to meet the surging demand in the winter months, while Chubu Electric Power has said that it plans to purchase 13m tonnes of LNG in fiscal year 2011/12 (April-March). We expect strong growth in consumption to be maintained in 2012-13 at an annual average rate of 6.7%, supported by the need to replace lost nuclear power.
Domestic gas demand in Asia will remain strong in the forecast period, as south-east Asian countries and Bangladesh are also becoming importers. The Philippine Ministry of Energy is in talks with North American and Australian suppliers to start importing LNG in the next four years, while Petronas (Malaysia) has signed an agreement with Qatargas, which will supply 1.5m tonnes of LNG annually for 20 years with effect from 2013. Indonesia has started to allow companies to import LNG to help meet surging energy needs (Indonesia and Malaysia are both LNG producers).
Moreover, LNG consumption in China, South Korea and India is expected to continue to grow at double-digit rates in 2012-13. South Korea's total gas consumption grew by 10.4% year on year in the first eight months of 2011, according to the latest monthly natural gas survey by the IEA, while China's natural gas imports were 11bn cu metres in October, up by 21.3% year on year, according to the National Development and Reform Commission (NDRC).
To meet this growing demand, total regasification capacity in the Asia-Pacific region is expanding at a fast pace. China is building six new LNG terminals and is increasing its inlet capacity to meet burgeoning demand. Total capacity of receiving terminals in China is expected to reach over 50bn cu metres by 2013. India, Pakistan, Singapore, Bangladesh, Vietnam, Thailand, the Philippines, Malaysia and Indonesia are also adding to their LNG import capacities through new terminals. India's LNG import capacity is expected to reach 47.5m tonnes/year (t/y) in 2015-16, a threefold jump from current levels. Its Kochi LNG receiving and re-gasification terminal with 2.5m tonnes annual capacity will be commissioned in the first quarter of 2012, while Dabhol LNG terminal is also scheduled to come online during 2012. Strong economic activity and increasing efforts to reduce CO2 emissions, along with government efforts to
LNG consumption is growing strongly in Japan
Asian gas demand is set to grow strongly in 2012-13

Natural gas 65
World commodity forecasts: industrial raw materials January 2012 www.eiu.com © The Economist Intelligence Unit Limited 2012
switch to cheaper energy sources and the decline in nuclear power capacity in Japan, will lead to intense regional competition for LNG supplies to the region.
Consumption of LNG in Latin America is rising sharply. Brazil, which only began importing LNG in late 2008, consumed 4.75bn cu metres in 2010. It is increasingly sourcing cargoes from Trinidad and Tobago (which have become available because of lower US import demand), and cargoes from the US itself. Meanwhile, Argentina is expected to import 66 LNG cargoes in 2011, a threefold increase compared with 2010. Enersa, the Argentinian utility company, has opened a tender to supply the country�s two LNG terminals�the plan is to import 80 LNG cargoes in 2012. Argentina plans to build two more LNG receiving terminals as the decline in the country�s oil and gas reserves continues and it becomes increasingly reliant on energy imports.
Turkmenistan has agreed to supply China with up to 40bn cu metres of natural gas annually through the West-to-East natural-gas pipeline. The pipeline is estimated to boost the proportion of natural gas in China's energy mix by 1-2%, cutting the use of 76.8m tonnes of coal. Turkmenistan exported 1.3bn cu metres pipeline gas to China in September, up 263% year on year. In addition, a gas pipeline between Kazakhstan and China, with an annual capacity of 10bn cu metres, is expected to be operational by the end of 2012. Kazakhstan is expected to produce 40.5bn cu metres of gas, and the country's total gas exports are expected to reach 21.6bn cu metres in 2011. Uzbekistan has also recently promised to double its gas exports to China to 25bn cu metres/year.
In the Middle East, consumption growth is expected to accelerate to an average annual rate of 6.3% in 2012-13, with particularly robust demand growth in the Gulf Co-operation Council (GCC) countries. Consumption of natural gas rose strongly in Saudi Arabia (7%) and Kuwait (18.8%) in 2010, according to BP. Kuwait's electric power generation is largely gas-fired, and it has been importing natural gas from Qatar, Yemen and Oman. Iran remains the largest consumer in the region, accounting for nearly 38% of regional consumption in 2010, and gas will account for an increasing share of its domestic energy needs in 2012-13, as well as for reinjection into ageing oil-bearing structures. However, its long-term plans to use gas in the development of a petrochemicals industry and to export directly to markets in Europe and Asia will be delayed indefinitely owing to the country's political isolation. Saudi Arabia will also grow in importance as a regional gas consumer, with consumption forecast to rise to just over 100bn cu metres in 2013. Israel is planning to import about 1.5bn cu metres of LNG to replace the lost supply from Egypt�s East Mediterranean Gas pipeline following explosions in November. The East Mediterranean Gas pipeline had been supplying 40% of Israel�s natural gas needs.
Middle East consumption of gas will increase in 2012-13
China is increasing pipeline imports from Central Asia
LNG consumption in Latin America is also growing strongly
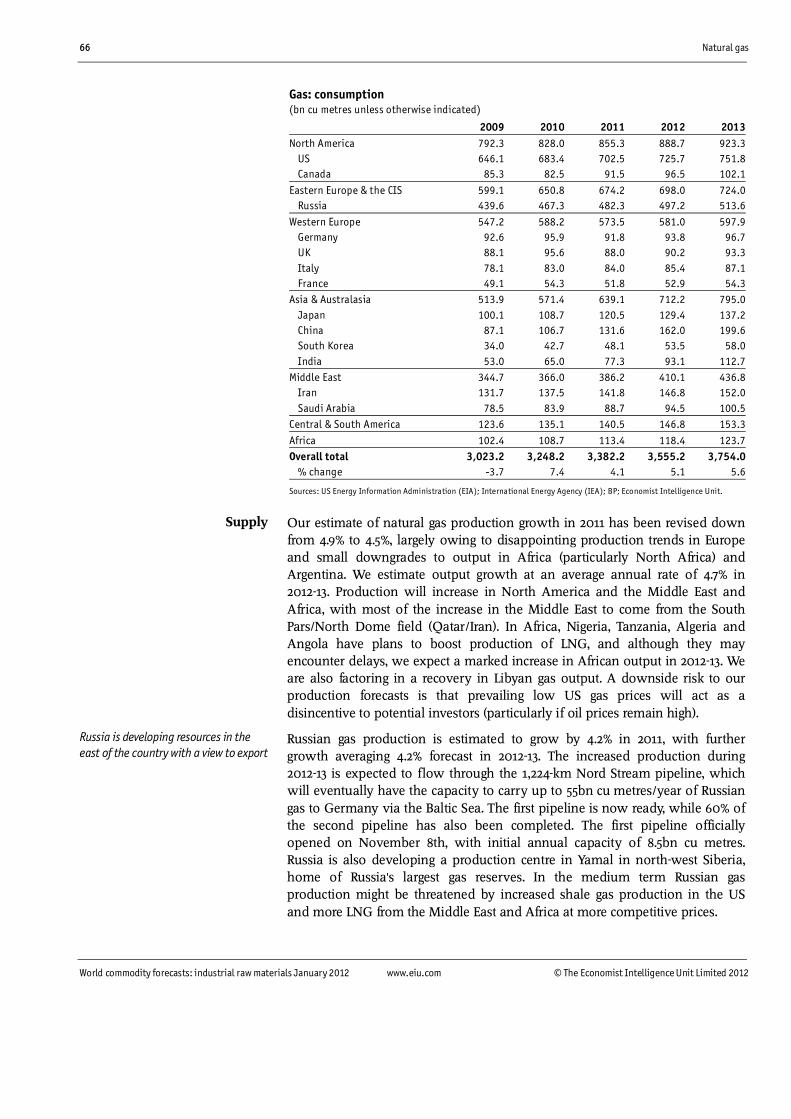
66 Natural gas
World commodity forecasts: industrial raw materials January 2012 www.eiu.com © The Economist Intelligence Unit Limited 2012
Gas: consumption (bn cu metres unless otherwise indicated)
2009 2010 2011 2012 2013North America 792.3 828.0 855.3 888.7 923.3 US 646.1 683.4 702.5 725.7 751.8 Canada 85.3 82.5 91.5 96.5 102.1
Eastern Europe & the CIS 599.1 650.8 674.2 698.0 724.0 Russia 439.6 467.3 482.3 497.2 513.6
Western Europe 547.2 588.2 573.5 581.0 597.9 Germany 92.6 95.9 91.8 93.8 96.7 UK 88.1 95.6 88.0 90.2 93.3 Italy 78.1 83.0 84.0 85.4 87.1 France 49.1 54.3 51.8 52.9 54.3Asia & Australasia 513.9 571.4 639.1 712.2 795.0 Japan 100.1 108.7 120.5 129.4 137.2 China 87.1 106.7 131.6 162.0 199.6 South Korea 34.0 42.7 48.1 53.5 58.0 India 53.0 65.0 77.3 93.1 112.7Middle East 344.7 366.0 386.2 410.1 436.8 Iran 131.7 137.5 141.8 146.8 152.0 Saudi Arabia 78.5 83.9 88.7 94.5 100.5Central & South America 123.6 135.1 140.5 146.8 153.3
Africa 102.4 108.7 113.4 118.4 123.7Overall total 3,023.2 3,248.2 3,382.2 3,555.2 3,754.0 % change -3.7 7.4 4.1 5.1 5.6
Sources: US Energy Information Administration (EIA); International Energy Agency (IEA); BP; Economist Intelligence Unit.
Our estimate of natural gas production growth in 2011 has been revised down from 4.9% to 4.5%, largely owing to disappointing production trends in Europe and small downgrades to output in Africa (particularly North Africa) and Argentina. We estimate output growth at an average annual rate of 4.7% in 2012-13. Production will increase in North America and the Middle East and Africa, with most of the increase in the Middle East to come from the South Pars/North Dome field (Qatar/Iran). In Africa, Nigeria, Tanzania, Algeria and Angola have plans to boost production of LNG, and although they may encounter delays, we expect a marked increase in African output in 2012-13. We are also factoring in a recovery in Libyan gas output. A downside risk to our production forecasts is that prevailing low US gas prices will act as a disincentive to potential investors (particularly if oil prices remain high).
Russian gas production is estimated to grow by 4.2% in 2011, with further growth averaging 4.2% forecast in 2012-13. The increased production during 2012-13 is expected to flow through the 1,224-km Nord Stream pipeline, which will eventually have the capacity to carry up to 55bn cu metres/year of Russian gas to Germany via the Baltic Sea. The first pipeline is now ready, while 60% of the second pipeline has also been completed. The first pipeline officially opened on November 8th, with initial annual capacity of 8.5bn cu metres. Russia is also developing a production centre in Yamal in north-west Siberia, home of Russia's largest gas reserves. In the medium term Russian gas production might be threatened by increased shale gas production in the US and more LNG from the Middle East and Africa at more competitive prices.
Supply
Russia is developing resources in the east of the country with a view to export

Natural gas 67
World commodity forecasts: industrial raw materials January 2012 www.eiu.com © The Economist Intelligence Unit Limited 2012
In an effort to remain competitive and to diversify its gas exports away from Europe, Russia is seeking new partnerships and developing new projects. The state-run Eastern Gas Programme is seeking to develop the gas industry in Eastern Russia with a view to supplying the domestic market, but also potentially leading to exports to Asia. Gazprom has commissioned the Sakhalin, Khabarovsk and Vladivostok gas transmission system to supply the Esatern region and the first start-up complex of the pipeline was launched in early September, with an annual capacity of 6bn cu metres. KoGAS (South Korea) is currently in talks with Gazprom to buy LNG from a plant in Vladivostok. Also, Russia is interested in supplying gas to South Korea through a pipeline that would transit North Korea. Meanwhile, the feasibility study to build the South Stream gas pipeline from Russia to Europe is completed, and the project has been deemed economically and technologically viable.
Dry natural gas production in the US grew by 6.7% year on year in the first eight months of 2011, according to the EIA. The majority of the production growth came from higher onshore production in the lower 48 states. We expect production growth to slow from 6.7% in 2011 to an annual average rate of 5.7% in 2012-13. Increased production in the US is leading to lower imports, down 25.4% year on year in the first eight months of the year, and the EIA estimates that net imports will have declined by 6.7% in 2011. Indeed, US total exports rose by 43.55%, while exports of LNG increased by 89.8% year on year in the first eight months of the year, albeit from a low base. The bulk of the US's LNG exports went to Japan, India and South Korea while exports to Spain, Brazil, and Mexico also rose sharply.
There is a risk that low US gas prices, coupled with weak economic activity, the possible removal of some federal tax incentives and increasing environmental concerns about unconventional gas extraction techniques, could act as a disincentive for producers and might constrain production in the longer term. The EIA lowered its outlook for gas production in 2012 as a result of these factors. Natural gas drilling rigs accounted for around 80% of total rigs in 2009, before declining to about 60% in 2010 and further, to 43%, in mid-November 2011. Total rig counts had declined by 5.2% year on year by November 11th. That said, rising domestic demand (especially in the power sector) and rising exports will act as longer-term incentives. There have been five LNG export applications so far to the Department of Energy, and Cheniere Energy (US) and the Spanish utility, Natural Gas Fenosa, have recently signed a 20-year LNG supply and purchase agreement in which Natural Gas Fenosa agreed to buy 3.5m tonnes of LNG a year starting in 2016. Furthermore, Asian companies are starting to invest in drilling activities in North America, aiming to gain experience in shale gas exploration as well as to secure LNG to export back to their countries. These investors provide relief for cash-strapped companies, which should ensure continuity of production.
Canada's natural gas production started to recover in 2011 after two consecutive years of decline; production in the first eight months of the year was up by 1.6%, according to the IEA, and is expected to accelerate. Natural gas currently accounts for 30% of Canadian energy use, but its share is growing strongly. We expect production to increase, fuelled by growing domestic usage (gross
In the longer term, US production will be supported by higher exports
US shale gas production will continue to grow
Canada's output will be encouraged by the potential for exports to Asia

68 Natural gas
World commodity forecasts: industrial raw materials January 2012 www.eiu.com © The Economist Intelligence Unit Limited 2012
consumption rose by 10.7% in the first eight months of 2011, according to the IEA) and the mounting thirst for LNG in Asia, which will encourage investment. Encana, Canada's largest gas producer, and Apache Corp (US) are planning to build a LNG terminal in Kitimat, British Colombia, to capitalise on growing LNG demand in Asia, and the National Energy Board recently approved an application by the two companies that will allow them to export 10m tonnes/year (t/y) of gas for 20 years. Asian investors, including PetroChina, Mitsubishi (Japan) and KoGas (South Korea), are already expressing interest in export terminals. According to Baker Hughes, a US oilfields services company, gas rig counts have been growing steadily since falling to a low of 59 in early June. By November 11th there were 179 natural gas rigs, up by 9.2% year on year.
The long-term decline in west European production of natural gas was reversed in 2010, led by increased production in the Netherlands and Norway. However, output in the first eight months of 2011 contracted, with year-on-year falls of 23.1% in the UK, 4.8% in Germany and 6.3% in Norway. Some of this was the result of maintenance, and we expect output to have recovered some lost ground in the second half of the year, but overall output will still have contracted by 4.5%. We expect European production to rise by an annual average of just 0.6% in 2012-13.
There is growing interest in developing unconventional gas resources in Europe to offset the decline in conventional gas production. Technically recoverable shale gas resources are estimated at 18trn cu metres in Europe, while Poland alone has 5.3trn cu metres, according to the EIA. Poland depends heavily on Russian gas and is taking several initiatives to reduce this reliance; it has so far granted 100 unconventional gas exploration licences. Marathon Oil, a US company, has announced that it will start shale gas exploration in Poland in mid-November. Although gas production during January-August 2011 increased by 4.3% in Poland, the country is still a small producer in the region.
The UK, Spain and France also have the potential to develop shale gas production. According to the EIA, the UK has 560bn cu metres of recoverable gas, while Spain recently announced a 185bn cu metres shale gas find in the Basque region. Although shale gas exploration activities across Europe are on the rise, the region's shale gas production will be constrained by environmental concerns, particularly regarding the extraction technology, and the relatively high cost of extraction. France has already banned the controversial "fracking" extraction process.
Azerbaijan, Georgia, Romania and Hungary signed a protocol in February 2011 as part of the implementation of the AGRI (Azerbaijan, Georgia, Romania Interconnector) project, a pipeline that will ship Azeri gas to Europe's domestic pipeline network, by-passing Russia. Recently, Turkmenistan has also shown an interest in supplying Europe through the interconnector. Also, Serbia has declared its interest to join the interconnector in order to diversify its supplies. Furthermore, construction is well under way on the South European Gas Ring (Turkey-Greece-Italy pipeline), which will have an annual capacity of 13bn cu metres and connect Caspian and Middle Eastern gas resources to EU markets.
European gas production will stagnate in 2012-13
Shale gas will not offset declining European production
The Caspian region will be feeding Europe's gas demand

Natural gas 69
World commodity forecasts: industrial raw materials January 2012 www.eiu.com © The Economist Intelligence Unit Limited 2012
Azerbaijan has recently agreed to supply Turkey with up to 6bn cu metres of Caspian gas by 2017 and to permit the transport of another 10bn cu metres through Turkey to Europe. Azerbaijan and Turkey have recently started to work on the Trans-Anatolian pipeline project with planned capacity of 16-17bn cu metres. Meanwhile, Azerbaijan is in the process of making a decision on whether to supply Nabucco, the Trans-Adriatic pipeline (TAP) or the Turkey-Greece-Italy interconnector from its Shah Deniz II field. The consortium which manages the Shah Deniz II field in Azerbaijan is considering whether to build its own pipeline or to support one of the existing pipeline proposals.
Global LNG production expanded strongly in 2010, with the largest single LNG producer, Qatar, responsible for the bulk of new supply; Qatari total gas production rose by 30.7% in 2010. We estimate that output increased again by nearly 30% in 2011 and expect further increases averaging nearly 9% in 2012-13. In February 2011 Qatargas reached its long-term target of LNG capacity of 77m t/y.
Several new LNG exporters, which will offer alternative sources to Qatar, are emerging. Sakhalin (Russia), Tangguh (Indonesia) and Yemen LNG came on line in 2010. Angola's first LNG liquefaction facility with an annual capacity of 5.2m t/y is expected to come on line in February 2012, while Australia is planning to increase its liquefaction capacity from 20m t/y in 2010 to 92.1m t/y by 2015. Australia is also developing coal-seam gas to LNG plants, including Gladstone LNG plant, Queensland Curtis LNG and Asia Pacific LNG plants. Meanwhile, ExxonMobil's LNG joint venture in Papua New Guinea is set to produce 6.6m t/y from 2014.
Other new producers include Saudi Arabia and Peru, whose Camisea plant became the first liquefaction facility in South America in May 2010. Also, Iraq and Israel might emerge as gas exporters in the longer term. However, a large part of non-Qatari supplies will not reach the market for at least another four years; Australia's Gorgon project is not due to come on stream until 2014-15, when its 15m t/y of output will double the country's LNG exports.
Gas: production (bn cu metres unless otherwise indicated)
2009 2010 2011 2012 2013North America 803.1 826.4 871.1 910.3 955.6 US 593.4 621.9 663.5 700.0 740.6 Canada 159.5 152.4 155.4 158.8 163.7Eastern Europe & the CIS 731.1 811.5 844.8 882.8 925.2 Russia 583.6 651.3 678.8 706.6 737.7Western Europe 297.8 305.2 291.5 293.4 295.2 Norway 103.5 106.4 102.6 105.5 108.6 Netherlands 78.9 85.2 85.8 86.8 88.0 UK 59.1 56.3 50.1 49.1 48.6Asia & Australasia 434.4 467.6 489.5 515.5 544.3 China 82.9 94.4 100.1 106.6 113.6 Indonesia 72.4 82.8 88.3 92.7 97.4 Malaysia 58.6 60.8 61.0 61.2 61.7 Australia 47.2 50.3 53.7 57.3 61.3
Strong growth in Qatari LNG supply is set to continue
New LNG producers are starting to come on stream

70 Natural gas
World commodity forecasts: industrial raw materials January 2012 www.eiu.com © The Economist Intelligence Unit Limited 2012
Gas: production (bn cu metres unless otherwise indicated)
2009 2010 2011 2012 2013Middle East 406.2 460.4 504.2 530.4 559.0 Iran 131.2 138.5 140.6 141.6 144.0 Qatar 89.3 116.7 151.2 165.2 179.2 Saudi Arabia 78.5 83.9 88.4 93.5 99.5Africa 202.3 212.2 219.0 230.4 242.6 Algeria 81.4 85.1 86.4 86.8 87.3Central & South America 140.1 148.7 156.2 167.3 180.3Overall total 3,014.9 3,232.1 3,376.2 3,530.0 3,702.2 % change -3.1 7.2 4.5 4.6 4.9
Sources: IEA; EIA; BP; Economist Intelligence Unit.
Stock levels declined sharply in 2010 owing to strong global demand for gas, particularly in Asia. We expect the overall market to have remained in deficit during 2011, although this figure masks big regional differences. The US is experiencing higher than average natural gas inventories�working natural gas in storage was 1.09bn cu metres on November 11th, 0.4% higher than a year earlier. However, lower natural gas directed rig counts and growing domestic consumption of cheap gas will put pressure on inventories and support prices during 2012.
Gas: supply and demand (bn cu metres)
2009 2010 2011 2012 2013Production 3,015 3,232 3,376 3,530 3,702
Consumption 3,023 3,248 3,382 3,555 3,754Balance -8 -16 -6 -25 -52
Sources: IEA; EIA; BP; Economist Intelligence Unit.
US natural gas (Henry Hub) prices are less vulnerable to global events because the US is less dependent on imports of gas. Henry Hub prices weakened in the third quarter and again in November, mainly owing to abundant supply and growing inventories as a result of unusually mild winter weather. We expect prices to be marginally lower on an annual average basis this year than in 2010. However, prices are still forecast to rise in 2012-13 as a result of slower production growth and strong consumption, in North America and in Asia which is expected to trigger US exports, while still-high oil prices will shift consumption towards natural gas. Moreover, the US administration has proposed to cut several tax incentives granted to oil and gas producers to reduce the budget deficit. If this is approved, gas prices might revive more strongly.
Currently, the European spot market offers more competitive prices than oil-price-indexed long-term contracts, prompting customers to exercise their "take or pay" options and limit contracted volumes of gas. However, pulling LNG from Europe to meet Asia's demand could put upward pressure on European spot gas prices. Offsetting this will be somewhat lower prices for gas sold through oil-indexed contracts if, as we expect, oil prices move lower. On balance, we forecast that European import prices will average US$10.45/mBtu in 2012-13.
Stocks and prices
The differential between European spot and contract prices could narrow

Natural gas 71
World commodity forecasts: industrial raw materials January 2012 www.eiu.com © The Economist Intelligence Unit Limited 2012
We expect the price of LNG to soar to an average of US$14.68/mBtu this year. Prices will edge higher in 2012, mainly owing to the rise in Asian demand and falling indigenous European production. Also, there is a move towards buying spot LNG rather than engaging in long-term contracts, which tends to increase price volatility. However, as new LNG comes on stream, prices will slip back from 2013, although they will remain at historically high levels.
Natural gas: prices (US$/m Btu; averages)
2010 2011 2012 2013 2014Henry Hub 1 Qtr 5.15 4.18 4.30 5.35 5.802 Qtr 4.32 4.37 4.45 5.20 -3 Qtr 4.28 4.12 4.65 5.15 -4 Qtr 3.80 4.00 5.10 5.75 -Year 4.39 4.17 4.63 5.36 - % change 11.1 -5.0 11.0 15.95 -Europe 1 Qtr 8.84 9.45 10.70 10.67 10.732 Qtr 7.51 10.31 10.45 9.90 -3 Qtr 8.26 10.88 10.65 9.80 -4 Qtr 8.54 11.00 10.75 10.70 -Year 8.29 10.41 10.64 10.27 - % change -4.9 25.6 2.2 -3.48 -
Japan LNGa 1 Qtr 10.32 11.99 16.70 15.80 15.782 Qtr 10.95 13.71 16.00 15.81 -3 Qtr 11.22 16.37 15.50 15.83 -4 Qtr 10.91 16.65 15.70 16.00 -Year 10.85 14.68 15.98 15.86 - % change 21.40 35.32 8.82 -0.72 -
a Liquefied natural gas (LNG).
Sources: World Bank; Economist Intelligence Unit.
Natural gas: prices
Sources: World Bank; Economist Intelligence Unit.
0.0
2.0
4.0
6.0
8.0
10.0
12.0
14.0
16.0
18.0
20.0Average natural gas LNG Japan
European average import border price excl the UKHenry Hub, US
141312111009080706052004
(US$/mBtu)
72 Natural rubber
World commodity forecasts: industrial raw materials January 2012 www.eiu.com © The Economist Intelligence Unit Limited 2012
Natural rubber
Problems in the euro zone are severely undermining the global economy, and will constrain growth in global demand for natural rubber (NR) in 2012. The Economist Intelligence Unit expects global NR consumption to grow by just 2.8% in 2012. Although this is an acceleration compared with estimated growth of 2.1% in 2011, it is only a modest upturn, and is almost entirely attributable to the recovery in Japan. The natural disaster that hit Japan in March 2011 caused considerable disruption to global automotive production (the main source of global rubber demand). Although Japan is returning to normality, a vigorous recovery in global automotive demand has been ruled out by the general slowdown in economic growth in Western markets. In addition, severe flooding in Thailand since October has not only caused major disruption to carmakers in that country, a leading exporter in Asia, but also at automotive manufacturing plants in Japan and in North America, owing to a shortage of parts produced in Thailand. The risks to the outlook are firmly to the downside; if the economic outlook were to deteriorate further, automotive demand would be particularly hard hit. In 2013 we expect only marginally stronger growth in global NR consumption, of 3.3%, based on our central forecast of a general improvement in the global economy.
In China, which is by far the world's largest consumer of NR, real GDP growth is forecast to slow to an annual average of 8.4% in 2012-13, down from 9.1% in 2011. But importantly for rubber sales, growth in vehicle sales slowed sharply in 2011, having soared by more than 30% in 2010. The slowdown in 2011 was primarily attributable to disruption to supply chains caused by the Japanese disaster that resulted in a fall in vehicle production in China in the following few months, and there has not yet been a strong recovery. Even in 2012 and 2013, vehicle sales growth is likely to remain relatively subdued, at just 5.4% and 8.8%, respectively. With the continued substitution of NR with synthetic rubber (SR)�reflecting high NR prices�and the weaker performance of the economy and the automotive sector, we estimate that NR consumption growth in China eased to 3.5% in 2011, compared with growth of 7.7% in 2010. We expect demand growth to accelerate to an average of around 4% a year in 2012-13, but there is a risk that the pace of growth will be slower during the forecast period�concerns persist over the potential for major disruption in China's overheating economy, with a bursting of a bubble in the property sector the most likely trigger.
India's economy has been growing almost as rapidly as China's, and real GDP growth of around 8% annually is expected to continue in 2012-13. In 2010 NR accounted for 70% of total elastomer usage�even more than in China. However, substitution is also eroding demand (NR accounted for 74% of rubber consumption in 2009). Growth in NR consumption in 2010 was a relatively weak 4.3%, despite a rise in overall rubber demand by almost 10%. Consumption growth remained relatively subdued in 2011, with growth in automotive manufacturing slowing sharply during the year. Year-on-year growth in automotive production slowed to 7.8% in the third quarter, from 20% in the second and 23.4% in the first. Although we do not expect car production growth
Demand
NR demand growth in China and India will be relatively lacklustre

Natural rubber 73
World commodity forecasts: industrial raw materials January 2012 www.eiu.com © The Economist Intelligence Unit Limited 2012
to return to the high of around 30% recorded in 2010, it will be fairly strong in the coming years, but NR consumption growth will remain at around 4.2% a year in 2012-13.
The disaster in Japan in March 2011 had a significant impact on the country's economic activity. As well as causing massive damage to the north-eastern coast, the crisis left firms facing shortages of electricity and disrupted transport and supply chains. Vehicle production in Japan was down by almost 60% year on year in April. Most of the overseas facilities of Japanese automotive companies saw output fall because of a back-up in the supply chain of crucial components. Domestic demand was also weak, with motor vehicle sales plummeting by 46% year on year in April. Recovery in the following months was slow. In October vehicle production was above its February level, but it seems unlikely that factories will run above capacity for a period to make up for the lost production earlier in the year, as car exporters are feeling the pressure of weak global demand and a strong yen. Production in the fourth quarter was also held back by supply-chain problems created by the flooding in Thailand. We estimate that Japan's NR consumption contracted by 4% in 2011. Given that Japan is the world's fourth-largest consumer of NR, this weighed heavily on global demand. In 2012 we expect a rebound in Japan's demand, with consumption growing by 3%, but there will be no sustained period of accelerating growth, with demand set to rise by only 1.8% in 2013.
Outside of Japan, developing Asia was the region most severely affected by the supply-chain disruption caused by the earthquake and tsunami disaster. For example, in Thailand automotive production fell by 50% month on month in April. The recovery in Thai production was more vigorous than in Japan, with vehicle production up by 28% year on year in September, but the flooding has again severely curtailed production�it was down by 62% year on year in October. We therefore expect rubber demand in Asia (excluding Japan, China and India) to have risen by just 0.9% in 2011. There will be a reasonable recovery in 2012, with an expansion of 3.2%, and continued demand for cars in developing Asia will support rubber demand growth of 4.1% in 2013.
Growth in EU demand for NR is estimated to have slowed to just 2% in 2011, and we forecast that demand will in effect stall in 2012, as the euro zone slips back into recession. Usage will not return to its pre-global recession level during the forecast period, despite an improvement in demand in 2013. There is also a serious risk that escalation of the sovereign debt crisis will severely undermine the euro zone economy. Despite high NR prices, there was an increase in the proportion of EU rubber demand met with NR consumption in 2010, to 33%. If NR prices remain relatively high, however, it is likely that NR's share will fall in 2012-13.
Growth in North American demand for rubber slowed in 2011 from the rapid rate seen in 2010, as pent-up demand had largely been fulfilled, but it appears to have held up better than in the euro zone. US car production in November was up by 29% year on year, while vehicle sales were up by almost 9% in October. But the economic recovery is stuttering. Despite reasonable US GDP growth in the third quarter, the euro zone crisis is weighing on stockmarkets
Car production and NR demand is severely hampered by floods in Thailand
Demand in the EU and US will be constrained by weak economic activity

74 Natural rubber
World commodity forecasts: industrial raw materials January 2012 www.eiu.com © The Economist Intelligence Unit Limited 2012
and economic confidence. We still expect North American NR demand to rise by an average of only 1.2% a year in 2012-13.
Natural rubber: consumption ('000 tonnes unless otherwise indicated)
2009 2010 2011 2012 2013China 3,384 3,646 3,772 3,920 4,080
India 905 944 985 1,025 1,069Japan 636 750 720 742 755Other Asiaa 2,045 2,201 2,220 2,290 2,384
EU 831 1,132 1,154 1,155 1,177Other Europeb 176 225 232 236 242
North Americac 790 1,071 1,092 1,103 1,118Latin America 485 613 628 642 657Africa 93 101 109 116 124
Worldd 9,325 10,777 11,002 11,309 11,687 % change -8.3 15.6 2.1 2.8 3.3
a Including Australia. b Including the former Soviet Union. c Canada and the US. d Totals do not add, owing to rounding.
Sources: International Rubber Study Group (IRSG); Economist Intelligence Unit.
Assuming there is no major weather disruption in the leading producer countries, Thailand, Indonesia and Malaysia, we expect an increase in NR production of 5.1% a year on average in 2012-13, up from an estimated 4.8% in 2011. Governments in these leading producer countries are eager to support this growth, given that current prices for NR are historically high (despite recent declines) and that there are robust prospects for future demand growth in emerging Asia. It will take time, however, for investment to pay off: newly planted rubber trees take seven years before they become productive. Some rubber producers may delay the replacement of aged trees in a bid to maximise short-term production and take advantage of high prevailing prices. NR supply growth will eliminate the global shortfall in 2012.
The main impetus behind global NR production growth in recent years has come from Indonesia. Indonesia's NR production grew by 12.1% in 2010, as it was hit less severely than other South-east Asian countries by adverse weather associated with La Niña, a global weather pattern that causes unseasonal weather conditions. However, unseasonable rains did hit Indonesian rubber producers in 2011, although production is still estimated to have grown by 7.1%, and we expect it to expand by an average of 6.7% a year in 2012-13.
Thailand, the world's largest producer of NR, has been hit by severe flooding since October, but rubber plantations are concentrated in the south of the country, away from the flooding in the northern and central provinces. The Association of Natural Rubber Producing Countries reported in early November that the flooding had not had a significant effect on production, which it still expected to have increased in 2011. We estimate output growth of 3% in 2011, and forecast that growth will average 4.6% a year in 2012-13.
In India, the world's fourth-largest NR producer, good monsoon rains in rubber-growing areas resulted in production rising by an estimated 4.6% in 2011. We expect growth of 4.5% a year on average in 2012-13. Medium-term prospects for
Supply
Good monsoon rains support output in India
Output growth in Indonesia will be reasonably strong
Production in Thailand has not been affected by the floods

Natural rubber 75
World commodity forecasts: industrial raw materials January 2012 www.eiu.com © The Economist Intelligence Unit Limited 2012
Indian rubber production are promising. According to the Indian Rubber Board, 14,000 ha of rubber trees, which were planted seven years ago, are now becoming productive. The government is also committed to expansion of the country's rubber-producing capacity. The Indian Rubber Board is investing around Rs1.7bn (US$37.8m) in expanding rubber cultivation during the government's 11th Five-Year Plan (2007-12). By the end of the 12th Plan it hopes to bring an additional 60,000 ha under cultivation.
After falling by over 20% in 2009, production in Malaysia recovered at a reasonable rate in 2010, but the level of production remains well below that of 2008 owing to a combination of adverse weather and labour shortages (tapping is generally less remunerative than industrial employment, and rubber farming is more labour-intensive than palm oil cultivation). These problems continued to affect production in 2011, although Statistics Malaysia reported strong production growth in January-September. We estimate growth of 7.6% in 2011 and forecast robust rates of annual expansion in 2012-13, averaging nearly 6% a year. However, the production level will remain well below its previous peak in 2006. In the longer term, the Malaysian government is planning to support production in Sabah and Sarawak, on Borneo, in a bid to regain the country�s status as the world�s largest producer of natural rubber, according to Jacob Dungau Sagan, the deputy minister of international trade and industry.
China is only the sixth-largest producer of natural rubber in the world, but the rapid growth of domestic consumption is encouraging investment in the sector. We expect production to expand by an average of 4.4% a year in 2012-13.
Production in Vietnam is forecast to rise by 3.9% a year in 2012-13. As in many other countries, high prevailing rubber prices are encouraging the planting of more trees (although the seven-year gap between planting and production means that there will be no sudden sharp increase in supply). Government policy is, however, constraining growth. In early 2011 the government issued a request that farmers stop making way for the planting of rubber trees by destroying other crops, such as tea, maize and cassava. The opportunity for profit, combined with competition for land with other crops, has led the Vietnam Rubber Group to invest in rubber plantations across the border in Cambodia. It expects to have cultivated 50,000 ha of rubber plantings in Cambodia by the end of 2011.
Rubber production in Côte d'Ivoire was undermined by the political crisis that engulfed the country in early 2011, and growth in 2012 could still be affected by a shortage of available labour, since many workers fled rubber-producing areas during the post-election violence. However, we expect production to rise by an average of 3.5% a year in 2012-13, assuming that there are no further political eruptions. The medium-term growth prospects are promising. The government is aiming to renew 300,000 ha of existing plantations and plant another 300,000 ha by 2018. However, government policy could also work against growth in rubber production: a minimum price for cocoa was recently introduced in an effort to reduce the number of farmers who are switching from the production of cocoa to rubber because of its relatively high price.
Malaysia aims to regain its status as the world's largest producer
Vietnam's rubber output continues to rise
Production in Côte d'Ivoire could still be affected by labour shortages

76 Natural rubber
World commodity forecasts: industrial raw materials January 2012 www.eiu.com © The Economist Intelligence Unit Limited 2012
Natural rubber: production ('000 tonnes unless otherwise indicated)
2009 2010 2011 2012 2013Thailand 3,164 3,252 3,350 3,513 3,664Indonesia 2,440 2,736 2,930 3,135 3,336
Malaysia 856 939 1,010 1,068 1,132India 820 851 890 928 972Vietnam 724 755 780 810 841
China 644 665 690 720 752Côte d'Ivoire 203 227 235 243 252
Brazil 129 132 136 140 144Others 722 844 875 905 937Worlda 9,702 10,401 10,896 11,462 12,030 % change -4.2 7.2 4.8 5.2 5.0
a Rounded to nearest 10,000 tonnes.
Sources: IRSG; Economist Intelligence Unit.
Global stocks of NR fell in 2010 as demand outstripped weather-constrained supply, with an estimated global deficit of 376,000 tonnes. The market remained in deficit in 2011, but the shortfall is estimated to have narrowed as the Japanese natural disaster and weak global economy hurt demand growth. In 2012 we expect the market to return to a surplus. Global sufficiency fell to an estimated 7.4 weeks in 2010, and we expect it to have fallen further, to 6.7 weeks, in 2011, but there will be improvements in 2012 reflecting sluggish consumption growth. On the assumption that weather conditions remain benign, improvements in supply in 2013 will contribute to a continued recovery in stocks in that year.
Natural rubber: supply and demand ('000 tonnes unless otherwise indicated)
2009 2010 2011 2012 2013Supplya 9,702 10,401 10,896 11,462 12,030
Demand 9,325 10,777 11,002 11,309 11,687Balance 377 -376 -106 153 343Stocksb 1,902 1,526 1,420 1,573 1,916Weeks' consumption 10.6 7.4 6.7 7.2 8.5
a Includes International Natural Rubber Organisation (INRO) stockpile disposals after 1999. b Global closing stocks; year-end.
Sources: IRSG; Economist Intelligence Unit.
After soaring in the first quarter of 2011, rubber prices subsequently declined, but on an annual average basis are estimated to rise by 27% for the year as a whole, with SMR20 spot prices in Kuala Lumpur averaging M$13,484/tonne (around US$4,600/tonne). Spot prices fell particularly sharply after the earthquake and tsunami disaster in Japan in March�a decline that mirrored a more general fall in commodity prices, as investors became more risk averse. Prices have also been under pressure owing to general concerns about the crisis in the euro zone and the poor outlook for the global economy. More recently, prices have been hit by the flooding in Thailand, which has disrupted automotive production, while leaving rubber-producing areas largely un-scathed. In early November the price stood at just over M$10,000/tonne, down
Stocks and prices
NR prices are set to fall sharply in 2012 as the market balance improves

Natural rubber 77
World commodity forecasts: industrial raw materials January 2012 www.eiu.com © The Economist Intelligence Unit Limited 2012
from almost M$13,000/tonne at the start of October. The deteriorating economic performance in developed markets, which will weigh on demand, combined with healthy growth in NR production, will continue to constrain prices over the coming years. On an annual average basis, prices will drop by 27% in 2012, before stabilising in 2013. In New York, RSS1 will follow a similar trajectory. There is an upside risk to our forecast created by potential price-fixing moves by the International Tripartite Rubber Council, which compromises Thailand, Malaysia and Indonesia. In a meeting in mid-November it decided against intervening (by cutting exports, delaying tapping and hoarding stocks), but it urged its members to refrain from panic selling and future intervention to support prices is possible.
Natural rubber: stocks and prices 2010 2011 2012 2013 2014Stocksa 1 Qtr 1,781 1,350 1,400 1,650 1,8802 Qtr 1,416 1,300 1,380 1,680 -3 Qtr 1,523 1,250 1,350 1,750 -4 Qtr 1,526 1,420 1,573 1,916 - % change -19.8 -7.0 10.8 21.8 -
Prices New Yorkb 1 Qtr 3,452 6,021 3,860 3,765 3,9102 Qtr 3,815 5,602 3,780 3,800 -3 Qtr 3,605 5,200 3,745 3,840 -4 Qtr 4,640 4,260 3,745 3,900 -Year 3,878 5,271 3,783 3,826 - % change 80.7 35.9 -28.2 1.2 -Kuala Lumpurc 1 Qtr 10,142 15,607 10,000 9,750 10,1202 Qtr 9,659 13,928 9,800 9,850 -3 Qtr 9,657 13,400 9,700 9,950 -4 Qtr 13,000 11,000 9,700 10,100 -Year 10,615 13,484 9,800 9,913 - % change 67.0 27.0 -27.3 1.1 -
a '000 tonnes. b RSS1 spot prices, US$/tonne. c SMR20 spot prices, M$/tonne.
Sources: IRSG; Economist Intelligence Unit.
Natural rubber: stocks and prices
Sources: International Rubber Study Group; Economist Intelligence Unit.
0
500
1,000
1,500
2,000
2,500
3,000
3,500
0
1,000
2,000
3,000
4,000
5,000
6,000
7,000
RSS1 spot prices (US$/tonne); right scaleStocks ('000 tonnes); left scale
141312111009080706052004

78 Nickel
World commodity forecasts: industrial raw materials January 2012 www.eiu.com © The Economist Intelligence Unit Limited 2012
Nickel
Strong growth in Chinese nickel consumption helped to prop up global demand in 2011, offsetting slow growth in the rest of the world. The Economist Intelligence Unit now estimates that global nickel consumption in 2011 was 11.5% higher than in 2010 (up from 7.4% previously). The pace of growth in the second half of the year slowed in the rest of the world outside China, as the restocking cycle ended and investment stagnated owing to economic uncertainty. Japan is recovering from the destruction caused by the earthquake and tsunami in March, but the subsequent disruption to industrial activity will have limited total consumption in Japan in 2011 to around 174,000 tonnes. As post-tsunami rebuilding gains momentum, a strong pick-up in demand for nickel in Japan is expected in 2012. Slower growth in China, as export demand weakens amid the slowdown in the OECD, will have the effect of setting a limit on world consumption in 2012, to an annual average increase of 2.4%. Large additions to world stainless steel capacity made in 2011 will continue into 2012. As new mills raise output to design capacity, the stainless steel market is expected to be in surplus in 2012; a round of production cuts and capacity closures seems likely to slow the growth in demand for nickel in 2013.
In the first quarter of 2011 Chinese nickel consumption averaged 45,500 tonnes per month, little more than in 2010, but there was a rapid increase during the second quarter that continued into the third quarter. China's consumption was running more than 43% higher in the first three quarters of 2011 than in the same period in 2010. However, this may have reflected the large tonnage of nickel in concentrate imported in 2011, much of it for conversion into nickel pig iron (NPI or NiCrFe), rather than the quantity of nickel actually consumed during the period. Much of this ore remained in stock, as the fall in nickel prices made many NiCrFe units unprofitable. Consumption of nickel did increase, however, with Chinese output of austenitic stainless steel much higher than expected.
In China, the government's programme to close up to 3m tonnes/year (t/y) of what it classifies as "backward" stainless steel capacity has not been enough to cancel out the increase in output from new capacity. Chinese steelmakers justify their rapid expansion and low-cost exports of austenitic alloys by explaining that they are exploiting the cost advantage of their use of NiCrFe. The proportion used by steelmakers was high while nickel prices were strong. Purpose-built capacity increased, but output was cut as nickel prices fell in the second half of the year. China's drive for higher-quality products may limit the use of NiCrFe in the longer run as well, as this will set a requirement for higher-grade input.
Nickel consumption in 2013 and beyond will also depend on whether the expansion in China's stainless steel capacity continues. There are grounds for arguing that after recent very rapid expansions, which have led steelmakers to export surplus stocks at barely profitable prices, future investment will be directed towards improving quality and product ranges, rather than increasing output. The large apparent increase in 2011, which reflected an estimate of higher NiCrFe usage, cannot be repeated in 2012, although there may be a
Demand
China's use of nickel pig iron will drop as higher-grade input demand rises

Nickel 79
World commodity forecasts: industrial raw materials January 2012 www.eiu.com © The Economist Intelligence Unit Limited 2012
(proportionately) small rise. Our price projections reduce the expected cost advantage of using NiCrFe by 2013, and this is likely to lower China's exports of austenitic stainless steel, and hence lower steel output and nickel consumption.
Nickel consumption in Belgium and Sweden in January-September 2011 was well above levels in the year-earlier period (55.2% and 9.4% higher respectively), but in the far bigger market of Germany consumption was 5% below the year-earlier level. Taking the view that its losses in recent years are likely to continue owing to changes in world supply, ThyssenKrupp�which owns the largest stainless steel units in both Germany and Italy and has investments elsewhere�plans full or partial closure of some units. It is also splitting its stainless steel business from its main steelmaking and steel manufacturing operations. Fiscal and monetary tightening in the EU induced a marked economic slowdown in 2011, and on current indications the worst effects are still to come. At best, these policies will halt growth; at worst, they will depress nickel consumption again, although probably not to the depths seen in 2008-09. Nickel demand is unlikely to increase before 2013.
US nickel consumption growth was strong in early 2011, but from the middle of the second quarter US demand slackened amid economic uncertainty and weak business confidence. This was a repeat of the pattern of 2010, when consumption tailed off in the second half of the year. Reflecting this, we estimate that growth stood at 10.3% in 2011 as a whole. A new steelworks opened by ThyssenKrupp in the US accounts for much of the increase, so although US demand will have remained high, this pace is not likely to be sustained into 2012 and beyond. US nickel consumption had fallen even before the financial crisis, but the fall was the result of improved competitiveness in US higher-value manufacturing; a return to the high levels of demand seen up to 2006 is possible.
Asian nickel consumption rose by only 8% in 2010, but the picture is obscured by Chinese use of NiCrFe. In a burst of expansion in the first nine months of 2011 China's nickel-using industries increased consumption by almost 174,000 tonnes compared with the year-earlier period. The scale of this apparent increase reflects a larger estimate of the use of nickel in NiCrFe, but also a large increase in the nickel content of low-grade ore stocks, much of which still has to be processed, let alone consumed. We have therefore taken only a proportion of this apparent increase into account in estimating consumption in 2011. The combined increases in Japan, Taiwan and South Korea added an estimated 46,000 tonnes to regional consumption during 2010. Demand in South Korea rose rapidly in the early months of 2011, but consumption subsequently weakened, and we estimate a full-year contraction of 2%. Consumption is expected to reach 110,000 tonnes in 2012, as new steel capacity approaches design-level output. Growth is likely to slow after 2013, when the new capacity will be fully operational.
The earthquake and tsunami in Japan in March initially held back consumption (although nickel usage had already been lower in the first quarter of 2011 in year-on-year terms). Japan's consumption recovered in the second half of 2011, and there will be modest growth in 2012 and 2013. In Taiwan, consumption was markedly lower in the first half of 2011, and in January-September it was
Consumption growth in the EU will be constrained by regional economic woes
Expansion in high-value manufacturing in the US is boosting nickel demand
Asian consumption will continue to rise

80 Nickel
World commodity forecasts: industrial raw materials January 2012 www.eiu.com © The Economist Intelligence Unit Limited 2012
one-third lower than in the same period of 2010. This was probably the result of excessive stainless steel output in China. However, the modernisation and expansion of stainless steel capacity in Taiwan will build consumption towards earlier levels in 2012-13.
A high proportion of China's stainless steel users work with lower-grade nickel or nickel-free ferritic grades; only one-half of the estimated 10.5m tonnes of stainless steel produced in China in 2010 consisted of austenitic grades. Baosteel in Shanghai, which has China's largest stainless steel capacity, has developed a high-purity, high-performance ferritic alloy that can replace high nickel steel in some applications. Nevertheless, China's stainless steel-consuming industries are increasing their use of grades with higher nickel content, but domestic capacity for producing these falls short of demand. Higher-grade stainless steel is imported, mainly from Japan, Taiwan and South Korea. Chinese steelmakers are already increasing their output of austenitic grades as they turn more of their attention to export markets.
Refined nickel: consumption ('000 tonnes nickel content unless otherwise indicated)
2009 2010 2011 2012 2013China 541 561 700 705 710
EU 239 346 350 350 352Japan 148 177 176 178 180
US 91 119 131 137 140South Korea 93 101 99 110 112Taiwan 64 73 50 65 70
Others 129 134 179 180 185World total 1,305 1,511 1,685 1,725 1,749 % change 1.0 15.8 11.5 2.4 1.4
Sources: International Nickel Study Group (INSG); Economist Intelligence Unit.
Global refined nickel production rose by nearly 14% in 2010 to reach 1.51m tonnes, driven by a surge in production in China, Japan and the EU. In the early months of 2011 disruptions to output at the refining stage held output down to a level equivalent with consumption. In the first nine months production in Australia was 3.8% lower year on year, mainly because of disruptions at the Kwinana refinery in Western Australia operated by BHP Billiton (UK/Australia). These production losses were more than offset by increases elsewhere, including in China, where output of NiCrFe rose, and in Canada, where production increased after labour disputes ended following the conclusion by Vale (Brazil) of a new labour contract with its workers. In January-September 2011 the nickel content of output in China was estimated at 144,500 tonnes higher than in the year-earlier period, while Canada added nearly 37,000 tonnes to refined output. As a result, we expect global output to have risen by 12.8% in 2011, reaching 1.7m tonnes. Growth in supply will slow in 2012, as expanded capacity reaches design levels. There will, however, be an increase in EU production; for technical and commercial reasons output in Finland and France was running lower in 2011 than in 2010, and dock strikes in Greece towards the end of 2011 disrupted ferronickel production; these declines are expected to be made good in 2012. More capacity around the world is due to enter production in 2013, but producers have shown a readiness to pace
Supply

Nickel 81
World commodity forecasts: industrial raw materials January 2012 www.eiu.com © The Economist Intelligence Unit Limited 2012
projects in line with developments in demand and prices. In view of our expectations for demand, we forecast still weak output growth in 2013.
The resumption of growth in stainless steel output in 2010 after steady declines in 2007-09 increased the proportion of nickel consumed as ferronickel, and this in turn stimulated investment in new capacity or the modernisation of existing capacity. Work at BHP Billiton's Cerro Matoso operation in Colombia reduced supply in 2011, as it involved suspending production for nine months while a new furnace was installed. The two units just started in Brazil (Onça Puma and Barro Alto) are ferronickel plants. Production will reach design levels in 2012; in 2011 they contributed up to 30,000 tonnes of nickel content. Taguang Taung, a Chinese joint-venture ferronickel plant in Myanmar (Burma) with reserves of 30m tonnes of high-grade nickel ore containing some 700,000 tonnes of nickel also recently commenced production.
In response to the sustained high level of nickel prices, world mine production is expected to stay strong�it grew by an estimated 12.5% in 2010 to 1.59m tonnes (of contained nickel). In the Dominican Republic, Switzerland-based Xstrata has reopened Falconbridge Dominicana, which has been producing just over 1,000 tonnes/month of Ni content since the second quarter of 2011. It will, however, continue to operate with only one of its ferronickel furnaces in 2012. In New Caledonia, the Goro nickel project of Brazil's Vale has finally started production. Meanwhile, Société le Nickel, a subsidiary of Eramet, a French group, has expanded operations at Doniambo, adding around 4,000 tonnes to its output. Xstrata is also active in New Caledonia; its project at Koniambo will have an annual capacity of 60,000 tonnes and is expected to begin production in mid-2012. Following Vale's agreement with its Sudbury workforce, we expect it to ramp up its Canadian production, with its reopened mines and works estimated to have produced 131,000 tonnes in 2011. Production at Vale's Voisey's Bay mine, also in Canada, has resumed after the conclusion of a new five-year labour agreement, but it may be affected by further labour disputes, and it will be some time before the mine returns to full production.
First Quantum Minerals, the new Canadian owners, are restarting operations at the Ravensthorpe unit in Western Australia, with production expected to come on stream this year. Prospects for the Ramu mine in Papua New Guinea (a project much delayed by disputes over land ownership and revenue) have also improved recently. A ruling by the National Court in Madang in July last year cleared the way for production to begin at the nickel-cobalt mine; the Chinese-owned mine, which is expected to produce 31,150 tonnes a year of nickel, had been under a year-long injunction related to the deep-sea tailing placement system. Production is now set to commence in 2012.
The exact supply-demand position in 2012-13 will depend on how much NiCrFe is produced for Chinese steelmakers. Furnaces suspended in late 2010, partly in a government drive to reduce China's carbon dioxide (CO2) emissions and partly for commercial reasons, reopened as the cash price of nickel recovered. The government has sought to extend closure orders on some works because of their high emissions, but NiCrFe output could still account for as much as 30% of Chinese steelmakers' primary nickel supply. In 2010 the production of NiCrFe material reached 160,000 tonnes, and up to 240,000 tonnes may have
There are signs of increased investment in new capacity
China has the capacity to increase NiCrFe output significantly
Mine production growth will gain momentum

82 Nickel
World commodity forecasts: industrial raw materials January 2012 www.eiu.com © The Economist Intelligence Unit Limited 2012
been possible in 2011. Capacity continues to be added. Moreover, under-used iron-producing blast furnaces can be converted quickly to NiCrFe production. New units are also more cost-efficient. However, allowance must be made for the discounting of these nickel units in relation to primary nickel (there are extra costs in handling the added bulk and waste of low nickel content feedstock, and some adjustments are needed at the steel melting stage).
Refined nickel: production ('000 tonnes nickel content unless otherwise indicated)
2009 2010 2011 2012 2013China 247 386 559 498 508Former Soviet Union 262 260 260 269 275
Japan 144 166 160 175 180Australia 131 102 101 111 115Canada 117 105 150 160 165
EU 81 106 122 115 115Norway 89 92 91 91 93
Others 257 292 260 310 303World total 1,327 1,511 1,704 1,730 1,754 % change -1.9 13.9 12.8 1.5 1.4
Sources: INSG; Economist Intelligence Unit.
There was some rebuilding of nickel stocks in the fourth quarter of 2010, and by the end of the year stocks stood at 143,200 tonnes. Stocks were run down in the first half of 2011, owing to some profit-taking by investors. The market has not moved as strongly into surplus as expected; stocks have declined, and falling prices have deterred profit-taking by speculative fund managers. The level at the end of 2011 is estimated to have been just below 100,000 tonnes. Rising output running ahead of demand in 2012 will be reflected in stocks rising during the year. The surplus in 2013 is expected to be modest, but it will add further to stocks.
Refined nickel: supply and demand ('000 tonnes nickel content unless otherwise indicated)
2009 2010 2011 2012 2013Global production 1,327 1,511 1,704 1,730 1,754
Global consumption 1,305 1,511 1,685 1,725 1,749Balance 22 0 19 5 5Stocks (reported & estimated; year-end) 164 143 98 123 128Weeks' consumption 6.5 4.9 3.0 3.7 3.8
Sources: INSG; Economist Intelligence Unit.
Nickel prices, along with those for the rest of the base metals sector, have remained on a general downward trend in recent months. The tightness in the physical market for nickel helped to keep the cash price high in 2010. London Metal Exchange (LME) prices then reached a peak in mid-February 2011 of around US$13.2/lb, as physical demand remained strong, while short covering by investors and fund buying (as the US dollar weakened) also helped to prop up prices. However, there was a large correction in early May, followed by sharp falls in early June and September, with prices dropping to a low of around US$8.40/lb at the end of the month, as concerns intensified over the
Stocks and prices
Prices will remain on a downward trend in 2012-13

Nickel 83
World commodity forecasts: industrial raw materials January 2012 www.eiu.com © The Economist Intelligence Unit Limited 2012
future of the euro zone and the global economic outlook. We estimate that prices fell below US$9/lb on average in the fourth quarter, owing to the low starting point and as a small surplus emerged. We expect a seasonal recovery early in 2012, but average prices will be on a downward trend, potentially dropping by as much as 19% over 2012 as a whole. The prospect of the surplus increasing as output from new projects rises towards design levels will further depress prices in 2013, but our expectations of a closer balance from late 2013 imply price gains in early 2014.
Refined nickel: stocks and prices 2010 2011 2012 2013 2014Stocksa 1 Qtr 163.5 130.3 100.0 123.0 125.02 Qtr 151.8 113.2 110.0 125.0 -3 Qtr 128.7 103.4 120.0 130.0 -4 Qtr 143.2 98.0 123.0 128.0 - % change -12.4 -31.6 25.5 4.1 -Pricesb 1 Qtr 9.05 12.19 8.37 8.58 9.432 Qtr 10.24 11.02 8.50 8.58 -3 Qtr 9.62 10.01 8.22 8.50 -4 Qtr 10.71 8.26 8.55 9.00 -Year 9.91 10.37 8.41 8.67 - % change 55.78 4.68 -18.91 3.07 -
a Total reported commercial stocks; end-period; '000 tonnes. b LME cash price; US$/lb.
Sources: London Metal Exchange (LME); INSG; Economist Intelligence Unit.
Nickel: stocks and prices
Sources: International Nickel Study Group; London Metal Exchange; Economist Intelligence Unit.
0
40
80
120
160
200
0.0
5.0
10.0
15.0
20.0
25.0
LME cash price (US cents/lb); right scaleStocks ('000 tonnes); left scale
141312111009080706052004

84 Steel
World commodity forecasts: industrial raw materials January 2012 www.eiu.com © The Economist Intelligence Unit Limited 2012
Steel
The Economist Intelligence Unit estimates a slowdown in global steel con-sumption growth from 14.9% in 2010 to 7.1% in 2011. Growth is forecast to decelerate again in 2012 to just 4.5%, based on the prospect of weaker steel demand growth in China, minimal growth in the OECD and low spending on investment goods, which drive steel demand. Euro zone GDP is now forecast to contract slightly in 2012, with growth in the US expected to reach only 1.3%. Growth in Chinese steel consumption is estimated at 9.5% in 2011, up from 7.1% in 2010. This assumes some weakness in the final quarter of 2011. Chinese GDP growth is forecast to slow in 2012 to 8.2%, but steel consumption will be more affected as the slowest sectors of the economy are likely to be construction, infrastructure and capital investment, which account for around two-thirds of Chinese consumption. We therefore forecast that Chinese steel consumption growth will slow to 5% in 2012.
We have left our forecasts for growth in the rest of the world unchanged and continue to expect global growth excluding China to moderate in 2011, to 5.3%, following a sharp rebound in 2010. Although we expect strong infrastructure development in some emerging markets in 2012, flat consumption in Europe and limited growth in North America will see global growth excluding China at just 4% in 2012. We expect global crude steel consumption growth to pick up in 2013 to 5.4%, as economic growth in mature economies starts to recover and growth in emerging markets remains strong.
In China, consumption grew by 9.1% year on year in the first quarter of 2011 and by 9.9% in the second quarter. Apparent consumption grew by 12.1% in the third quarter, but underlying consumption slowed sharply. Owing to monetary policy tightening and restrictions on construction investment, actual steel demand was much weaker. The disparity between apparent and real con-sumption led to a significant increase in inventory. This in turn led to a sharp decline in prices in September and October, which resulted in sharp cutbacks to production. We therefore estimate that apparent consumption grew by just 1.6% year on year in the fourth quarter of 2011, as the industry destocked.
Up to 70% of Chinese steel demand is driven by expenditure on investment and construction, and steel consumption would therefore be severely affected if the property market were to crash or even to slow markedly. On the upside, there has been some investment in social housing, which is supporting consumption. Moreover, there is now a likelihood that the authorities will loosen monetary policy into 2012, reflecting falling inflation and growing concerns about the potential for an excessive slowdown in economic growth. However, we do not expect the same degree of stimulus-led infrastructure investment as in 2009. A small pick-up in economic growth in 2013 will lead to somewhat higher growth in steel consumption in that year.
We expect the construction market in mature economies (the EU and the US) to remain depressed for an extended period, with US residential construction expenditure still 50% below its 2006 peak and showing little sign of improve-ment, while non-residential expenditure is now 40% below its 2008 peak. US
Demand
China's consumption growth will slow in 2012-13
OECD steel consumption will be constrained by weak property markets

Steel 85
World commodity forecasts: industrial raw materials January 2012 www.eiu.com © The Economist Intelligence Unit Limited 2012
construction expenditure in the public sector will also be hit by rising deficits at the state and federal level. We expect total expenditure to begin to turn up throughout the second half of 2012 and in 2013.
In the EU, we forecast that construction expenditure in some markets such as Spain or Ireland will not return to peak demand over the next few years. Furthermore, the wider overall EU construction market has stabilised at lower levels; according to Eurostat's seasonally adjusted construction production index, construction activity was down by 1.4% year on year in January-September 2011. EU manufacturing activity was more robust in the first half, growing by 5.5% year on year, which drove regional steel consumption higher. Industrial production continued to move higher at a slower pace in the third quarter, but forward-looking indicators, such as the German manufacturing purchasing managers� index, which moved below 50 in October, suggest a fourth-quarter reduction in output. Even as the EU economy stagnates in 2012 and remains weak in 2013, we do not expect a dramatic reduction in apparent consumption. Unlike in 2008, there was no significant excess inventory in the supply chain in late 2011.
Emerging-market demand growth will be stronger than OECD demand over the forecast period; including China, we expect that overall consumption in emerg-ing economies will be almost 40% higher in 2012 compared with 2007. Latin American consumption, for example, is expected to grow at an annual average rate of 8% in 2012-13, as the region reinvests high-commodity revenue into infrastructure, particularly in Brazil ahead of the football World Cup in 2014 and the Olympic Games in 2016.
In India, growth is also expected to grow at near double-digit rates in 2012-13. Steel consumption per head, which is less than 50 kg, should rise as the government is committed to improving the country's infrastructure, while steel-intensive manufacturing in the automotive sector will also provide support.
We continue to forecast that consumption in the Middle East will also record robust growth, at an average annual rate of 8% in 2012-13, owing to strong demand in the Gulf Co-operation Council (GCC) member states. High levels of government expenditure will boost demand from the property and infra-structure sectors, while ongoing programmes to expand oil and gas production (a significant source of steel demand) will continue. One-half of the US$185bn supplemental budget announced by Saudi Arabia in February 2011, for example, will be spent on residential housing, and this is on top of the 7.5% increase in government expenditure on construction announced for 2011.
Crude steel: equivalent consumption (m tonnes unless otherwise indicated)
2009 2010 2011 2012 2013China 558.6 598.4 655.3 688.0 724.5
Other Asia 245.2 294.2 303.1 318.2 338.9EU 129.4 168.2 178.3 180.1 185.5
North Americaa 90.7 116.1 125.4 127.9 131.7Commonwealth of Independent
States (CIS) 41.5 46.5 49.7 52.7 55.1Middle East 40.2 48.6 54.0 58.3 63.0
Emerging-market steel consumption will remain strong
Consumption growth in the GCC will be robust

86 Steel
World commodity forecasts: industrial raw materials January 2012 www.eiu.com © The Economist Intelligence Unit Limited 2012
Crude steel: equivalent consumption (m tonnes unless otherwise indicated)
2009 2010 2011 2012 2013Latin America 46.0 50.1 53.1 57.4 62.0Other Europe 27.2 31.3 35.0 35.7 38.2
Africa 33.5 38.5 37.4 39.6 42.8Australia & New Zealand 6.9 8.6 8.9 9.1 9.2World total 1,219.2 1,400.7 1,500.2 1,567.1 1,650.9 % change -6.2 14.9 7.1 4.5 5.4
a US, Canada and Mexico.
Sources: World Steel Association (WSA); Economist Intelligence Unit.
Global steel production rebounded by 16.1% in 2010, according to our estimates based on data from the World Steel Association (WSA). This strong growth was driven by further rises in output in China, the world's largest producer, and a strong rebound in OECD production. Chinese production grew by 9.4% year on year in the first half of 2011. Owing to a slight slowdown in the second half, we expect output growth in China of 8% for 2011 as a whole. Output in the world excluding China is estimated to have grown by 5.3% in 2011. Slower Chinese output growth in 2012, along with destocking in mature countries, will offset continued growth in the smaller emerging markets of Latin America, India, Africa and the Middle East. As a result, we forecast that overall global production will rise by 4.1% in 2012. Improved economic growth in 2013 should lead to an increase in demand and consequently supply, and we forecast output growth of 5.1%.
Third-quarter 2011 production levels were up by 9.5% year on year, with China leading the way with growth of 10.7%, compared with 5.8% in the rest of the world. Production levels were subsequently curbed in Europe, as ArcelorMittal shut down several blast furnaces in Belgium, Spain, Luxembourg, France, Germany and Poland, and other producers trimmed utilisation rates. North American production rates are also likely to have eased back, although there has been no major idling of furnaces. Chinese daily output of crude steel fell by 6.7% month on month in October, and, based on a number of furnace idlings and maintenance closures, we expect that output in November will also have fallen by 5-10% month on month.
Prices for iron ore on a delivered China basis hit US$200/tonne for Indian 63.5% Fe fines in February 2011, above the previous peak of US$190/tonne in mid-April 2010. Until October they traded in a relatively narrow band of US$165-185/tonne. However, falling demand from Chinese buyers (which account for over 60% of seaborne iron ore sales), as they cut steel production in October and November, resulted in a sharp drop in prices in October. Prices troughed in early November at US$125/tonne, but had bounced back by mid-month to around US$155/tonne on a return of Chinese buying for first-quarter delivery.
Rising supply was a factor in the price fall, as Brazilian suppliers such as Vale redirected cargoes originally intended for European buyers, while the major Australian producers (BHP Billiton and Rio Tinto) have been operating at full capacity. Supplies have been complemented by the arrival of new capacity over
Supply
Iron ore prices have come down sharply
Production started to slow in the fourth quarter of 2011

Steel 87
World commodity forecasts: industrial raw materials January 2012 www.eiu.com © The Economist Intelligence Unit Limited 2012
the year. Post-monsoon Indian supply also returned in October. In the short term, we do not expect cutbacks in supply as prices remain well above operating costs.
As forecast, Chinese mills returned to buying for first-quarter needs before the end of 2011. A further upside risk to prices is that there are often weather-related supply disruptions in the first quarter. As such, we expect prices to return to US$150-175/tonne in the first half of 2012. Nevertheless, with China's demand growth slowing and rising supply a factor, we expect average iron ore prices to moderate in the second half of 2012 and into 2013. Although there will be delays to new capacity, large new mines from Sino Iron and Fortescue in Australia, for example, are expected to come on stream in early 2012.
Crude steel: production (m tonnes unless otherwise indicated)
2009 2010 2011 2012 2013China 567.9 628.5 678.8 712.7 748.4Other Asia 231.3 272.9 285.2 299.5 320.4
EU 137.5 173.2 183.6 186.3 191.0North Americaa 80.8 111.0 121.0 125.8 128.9Commonwealth of Independent
States (CIS) 97.4 108.1 113.5 111.2 115.7
Latin America 39.0 45.6 50.2 54.7 60.2Other Europe 28.6 33.0 37.9 39.5 41.0Africa 14.9 17.0 16.5 19.0 21.0
Middle East 16.9 19.2 20.5 21.3 23.2Australia & New Zealand 6.0 8.1 7.7 7.4 7.5
World total 1,220.3 1,416.6 1,514.9 1,577.4 1,657.4 % change -8.2 16.1 6.9 4.1 5.1
a US, Canada and Mexico.
Sources: WSA, Economist Intelligence Unit.
Premium hard coking coal spot prices rose in mid-February to US$350/tonne fob, as numerous companies declared force majeure following the flooding in Queensland, Australia, which supplies up to 60% of global hard coking coal. Prices moderated from March, dropping back to around US$300-320/tonne fob, and remained at this level in the second quarter. Meanwhile, there has been some supply response from other producers, notably in the US, where exports were stepped up, but also in China, as buyers shifted to domestic sources rather than imports. Prices moderated slightly for third-quarter deliveries, with Anglo American (UK/South Africa) agreeing US$315/tonne fob for shipment to ArcelorMittal in Europe. Reflecting some pricing weakness since then, fourth-quarter contract prices have dropped to US$285/tonne fob, and spot prices are now down to US$250/tonne fob.
We expect prices to drift down further in the short term, but any supply disruptions from the weather in early 2012 would push them back over US$300/tonne fob. Without weather disruptions, we forecast that prices will drop closer to US$200/tonne in 2012 owing to rising supply availability as a result of new mines. As an example, in September 2011 Vale shipped the first coal from its new mines in Mozambique as it develops a whole new basin.
Coking coal prices will ease as supply recovers

88 Steel
World commodity forecasts: industrial raw materials January 2012 www.eiu.com © The Economist Intelligence Unit Limited 2012
The shredded ferrous scrap price peaked at more than US$500/tonne cif Turkey in mid-January 2011, but had fallen back to US$450/tonne cif Turkey by early February, and until October it traded in that relatively narrow band (US$450-500/tonne). As iron ore and coal prices dropped, the shredded ferrous scrap price moved below the bottom end of that price band, and traded at US$400-450/tonne during October and November.
Finished steel inventory remains at healthy levels in most regional markets. In North America, inventories stabilised in the third quarter at a level which we do not consider to be excessive. Inventories in China began to rise in the third quarter as demand slowed, while production remained elevated. Subsequent cutbacks in output should have addressed this issue and brought them back to more typical levels by the end of 2011. EU inventories rose in the first half of 2011 on the back of accelerating imports and higher domestic output, but this was from low levels. Nevertheless, elevated inventories allowed consumers to avoid purchasing in the third quarter, which put downward pressure on prices. However, as output was cut, we expect demand and supply to be have been back in balance by late in the fourth quarter, and inventories will need to be replenished in early 2012. One area where inventories are higher than necessary is in Asia, where weak Japanese and South Korean demand led to rising exports, and the supply chain is well stocked.
Crude steel: supply and demand ('000 tonnes)
2009 2010 2011 2012 2013Production 1,220 1,417 1,515 1,577 1,657
Consumption 1,219 1,401 1,500 1,567 1,651Balance 1.1 15.9 14.7 10.4 6.4
Sources: WSA; Economist Intelligence Unit.
Despite the fourth-quarter weakness, we estimate annual average prices in 2011 of US$752/tonne, an increase of 16.3% on 2010, when prices soared by 32.2% to US$647/tonne. However, with consumption growth weakening in 2012, partic-ularly in China, we expect prices to fall back to an average of US$656/tonne, although there will be a modest recovery in the first quarter followed by a downturn in the second half of the year. Steel prices in 2010-11 were pushed up by the relative strength of raw material pricing. In 2012-13 we believe that the industry will remain vulnerable to oversupply, but low profit margins and supplier discipline should keep the market in approximate balance at utilisation rates of around 80-85%, and pricing will remain relatively range-bound above raw materials. Sharply lower raw material prices will lead to a fall in steel prices in the second half of 2013.
In the US, there was some recovery in HR coil prices in September to US$700/short ton (US$770/tonne), but prices drifted back to around US$640/ton in October and November. From mid-November, however, mills began to push for higher prices. While unsuccessful in the near term, we expect them to be able to push through higher prices by early in 2012. In the EU, HR coil prices dropped to �500-520/tonne (US$690-720/tonne) in October, and
Stocks and prices
Scrap prices typically follow the trend in coking coal and iron ore prices
Prices drop amid weak demand and falling raw material costs

Steel 89
World commodity forecasts: industrial raw materials January 2012 www.eiu.com © The Economist Intelligence Unit Limited 2012
despite a weak currency and aggressive output cuts, they dropped even further to around �460-480/tonne in November, but we believe that this is the bottom.
Prices in Asia are now the lowest, with Chinese prices dropping to US$650/tonne fob in October and as low as US$600/tonne in early November, as mills passed on the falls in raw material prices and South Korean and other regional mills were forced to reduce prices to compete. Mills in the Commonwealth of Independent States (CIS), with their low-cost position owing to ownership of raw materials, were offering to export steel at a price of below US$600/tonne fob in November.
Steel: prices 2010 2011 2012 2013 2014Pricesa 1 Qtr 597 813 693 630 5482 Qtr 700 792 700 640 -3 Qtr 660 737 607 550 -4 Qtr 630 667 625 527 -Year 647 752 656 587 - % change 32.2 16.3 -12.7 -10.6 -
a US$/tonne, fob EU export, HR coil.
Source: Economist Intelligence Unit.
Steel: prices(US$/tonne, fob EU export HR coil)
Sources: World Steel Association; Economist Intelligence Unit.
300
400
500
600
700
800
900
1,000
1,100
1,200
141312111009080706052004

90 Tin
World commodity forecasts: industrial raw materials January 2012 www.eiu.com © The Economist Intelligence Unit Limited 2012
Tin
The Economist Intelligence Unit estimates that global tin consumption increased by 2.3% to 366,500 tonnes in 2011, from 358,200 tonnes in 2010 (following some revisions to historical data), with the main contribution coming from China. While this marks a sharp slowdown from the double-digit growth recorded in 2010, when the world economy was rebounding from recession, it is still stronger than the annual average of only 1.3% over the last economic cycle (2001-09). Currently we are forecasting much the same rate of growth in global tin consumption in 2012, before a modest acceleration to growth of 3.2% in 2013, which would lift consumption to consecutive new records. However, the outlook is unusually uncertain, with a number of substantial hazards hanging over the world economy, most notably the risk of a break-up of the euro zone and/or a banking crisis in Europe. Even if such a major economic shock can be avoided, fragile consumer confidence, weak income growth and high unemployment in the US and Europe could undermine spending on electronics, and consequently demand for solder alloys, the making of which is the main market for tin.
Global semiconductor billings were running at record levels throughout most of 2011, but latest data releases show that growth slowed towards the end of the year. As a proxy for electronics manufacturing, these data give a guide to tin demand in solder alloys, which accounts for about 54% of total tin use, according to the International Tin Research Institute (ITRI). In the first ten months of 2011 global semiconductor billings rose by 2% year on year to US$251bn, driven by the Asia-Pacific and Americas regions. However, billings started to fall in the second half of the year, with weakness in Europe particularly pronounced. Global semiconductor billings fell by 4% year on year in October, while billings in Europe fell by 16%.
Similarly, global output of tinmill products, which reached record levels in the first half of 2011, began to dip during the second half of the year. From January to October global output of tinmill products was 2% above the corresponding period of 2010, but fell year on year in both September and October. Tinplate (sheet steel electrolytically coated with a thin layer of tin and used in packaging) accounts for the majority of tinmill output and is the second-largest consumer of tin, accounting for 17% of total tin use, according to the ITRI.
In China, the world's largest tin market, recent data releases also suggest slower growth. For example, production of major home appliances (air conditioners, freezers, refrigerators and washing machines) increased by 9% year on year in October, which was well below the 25% year-on-year gain in the first ten months of the year, according to data from the National Bureau of Statistics. Similarly, output of key consumer electronic goods (mobile-phone handsets, personal computers and television sets) increased by 20% year on year in October, which was below the 23% year-on-year gain recorded in the first ten months of 2011 as a whole.
Meanwhile, China's output of tinmill products rose by over 11% year on year to 6.1m tonnes in the first ten months of 2011, as new capacity ramped up to
Demand
Global tin demand was strong but started to fade late in 2011
China's tin demand growth has also been slowing recently

Tin 91
World commodity forecasts: industrial raw materials January 2012 www.eiu.com © The Economist Intelligence Unit Limited 2012
meet demand from packaging manufacturers. However, the rate of increase has slowed from stronger year-on-year gains seen earlier in the year.
In Japan, Asia's second-largest tin market, we estimate that tin demand declined in 2011, following disruption to electronics manufacturing supply chains caused by the earthquake and tsunami that struck in March, from which the country has not yet fully recovered. Consumption also suffered from the knock-on impact of lower output in Thailand following severe flooding in October-November. Japanese semiconductor billings in the first ten months of 2011 were 7% lower in year-on-year terms, according to World Semiconductor Trade Statistics (WSTS). Output of tinmill products also fell, dropping by 4% year on year during the same ten-month period. The decline in Japan's tin demand is reflected in lower imports of refined metal, which supply the majority of the market. (Japan produces less than 1,000 tonnes/year of tin in a domestic market of about 30,000 tonnes.) In the January to September period Japan's tin imports were down 24% year on year, although we anticipate that the shortfall narrowed to some extent in the fourth quarter of 2011.
Tin demand in Europe and the US, the second- and fourth-largest markets respectively, increased in the first half of 2011. However, growth had already started to slow in the second quarter, and it appears that tin demand dipped in the third quarter. In Europe, semiconductor billings increased in the first half of 2011, but fell by 3% year on year in the third quarter. Similarly, the region's main tinplate-producing countries raised output in the first half of the year, but production fell year on year in the third quarter after leading producers, including ArcelorMittal, announced temporary reductions in operating rates in response to changing demand conditions.
In the Americas, semiconductor billings, which were up by over 10% year on year in the first half of 2011, fell by 4% year on year in the third quarter. US output of tin mill products was weak throughout the year and fell by almost 15% in year-on-year terms in the first nine months of the year. At the same time, demand for tin chemicals is reported to have been under pressure in both regions owing to weakness in the construction sector.
The slowdown in tin demand was well signalled by falling readings from leading economic indicators that began in the second quarter. The latest set of Purchasing Managers Indices (PMIs) for November again registered declines in most major economies, slipping below the 50-point level to mark the threshold between expansion and contraction of manufacturing output, suggesting that tin demand continued to slow through to the end of 2011 and into early 2012. China's PMI registered 49 points, its lowest reading for almost three years, although the government now appears to be easing economic policy, which should stimulate progressively stronger growth through the first half of 2012.
Cookson Group (UK), the world's leading producer of solder alloys, in its latest management statement and market update announced to investors in early November that the outlook remained positive for 2012. The company had previously said that it was expecting slightly higher than mid-single digit
Japan's recent decline in tin demand is reflected in falling imports
EU and US tin demand growth started to dip in the second half of 2011
Tin demand will be driven by solder sales and tinplate production

92 Tin
World commodity forecasts: industrial raw materials January 2012 www.eiu.com © The Economist Intelligence Unit Limited 2012
percentage growth in global electronics equipment production, led by flat-screen televisions, personal computers, e-readers and automotive electronics. Its view is similar to that of WSTS, which is forecasting growth in the global semi-conductor market of 3% in 2012, followed by 6% growth in 2013.
Global tinplate production is also set to rise. In China, a number of new tinplate lines are scheduled to come on stream, and Japan-based Nippon Steel and JFE Steel, two of the world's leading tinplate producers, are progressing separate expansion projects to meet demand from food, beverage and industrial packaging manufacturers in Asia. Nippon Steel is adding 8% to its tinplating capacity in Japan, equal to about 150,000 tonnes/year (t/y). It is also expanding capacity at its Indonesian tinplating subsidiary by 30,000 t/y from 2012, as well as setting up a new joint venture with China's Wuhan Steel to build a new 200,000-t/y tinplate line in Hubei province to start in mid-2013. Nippon Steel already has one tinplate joint venture in China and forecasts that the country's total tinplate demand will increase to 3.3m-3.7m tonnes by 2015, from less than 3m tonnes in 2009.
Refined tin: consumption ('000 tonnes unless otherwise indicated)
2009 2010 2011 2012 2013China 132.4 149.2 156.0 160.5 168.0EU 49.9 56.9 58.5 59.0 60.0US 26.9 30.0 30.5 30.5 31.0
Japan 23.0 32.5 30.5 31.5 32.0South Korea 15.2 17.4 18.0 18.0 18.5
Taiwan 8.8 11.1 12.0 11.5 11.5Brazil 5.1 8.0 6.0 6.0 6.0Russia 2.4 2.5 2.5 2.5 3.0
Others 44.1 50.6 52.5 55.5 57.0World total 307.8 358.2 366.5 375.0 387.0 % change -13.0 16.4 2.3 2.3 3.2
Sources: World Bureau of Metal Statistics (WBMS); Economist Intelligence Unit.
Tin supply had been catching up with consumption through the first half of 2011, after lagging owing to operating problems in Indonesia related to inclement weather, onshore resource depletion and more rigorous enforcement of local mining regulations in 2010. However, Indonesian production is thought to have fallen again in the final months of 2011 in response to the steep drop in tin prices, limiting growth in global tin mine and metal production to 1.7% and 2.6%, respectively, in 2011. Subject to a recovery in tin prices, stronger growth in refined tin production is forecast for 2012 (4.9%) and 2013 (5.2%), driven by a rebound in output from Indonesia and rising output in South America.
In China, the world's largest tin producing country, data for January to October show that refined tin production rose by 11% year on year to about 134,300 tonnes, and we expect total output to have reached 164,000 tonnes in 2011, which would be about 12,500 tonnes above its previous record in 2007. In Indonesia, the second-largest tin-producing country, Ministry of Trade data show a 4% year-on-year increase in tin surveyed for export (including metal
Supply
Refined tin production rose in China but Indonesian output fell in 2011

Tin 93
World commodity forecasts: industrial raw materials January 2012 www.eiu.com © The Economist Intelligence Unit Limited 2012
intended for re-refining) from January to October, to 78,664 tonnes. However, October's survey showed that the tonnage submitted for export was down 38% year on year to 5,422 tonnes, which was the second-lowest monthly total recorded since the height of the economic downturn in December 2008 and followed a fall of 24% year on year in tin surveyed for export in September.
The fall in Indonesian tin exports reflects the sharp drop in tin prices since early August and the subsequent announcement in late September that exports would be restricted in order to support prices. This follows a precedent established during the 2008-09 recession, when the governor of Bangka-Belitung, Indonesia's main tin-producing province, and private smelters called for and secured a suspension of production and exports from late October to the end of 2008. The latest announcement is more significant, since it is also backed by the two major integrated tin producers, state-controlled Timah and Koba Tin.
Indonesia's tin exports were not completely at a standstill in November 2011. Smelters continued shipping some metal to meet contractual commitments to consumers and traders. Nonetheless, the private smelters that account for over half of the country's metal output, including tin shipped for re-refining and branding elsewhere, held sales back from the market, which is thought to have prompted cuts in production. As a result, Indonesian tin mine and metal output is expected to have fallen in 2011, with mine production down by 4% to 91,500 tonnes, and refined metal production 2% lower at 56,000 tonnes.
Refined tin production is forecast to continue to rise in China and to recover in Indonesia in 2012-13. In China, secondary tin production is rising rapidly as the pool of materials available for recycling from past consumption of electronic goods increases, and we expect the country's total tin output to reach new records of 165,000 tonnes in 2012 and 167,000 tonnes in 2013. Yunnan Tin, the world's largest producer, is also planning to expand output from its Laochang tin field near Gejiu in Yunnan province, with the first two phases of a potential three-stage expansion coming on stream in 2013-14.
In Indonesia, we expect the temporary curbs on output and exports to be reversed with a recovery in prices in 2012. Meanwhile, Timah is upgrading and expanding its fleet of offshore dredges, which will increase its mining capacity by about 3,500 t/y of tin-in-concentrate as the investment programme, started in mid-2011, continues to be rolled out through 2012. Rising mine supply should feed through to rising refined tin production, and Indonesian output is expected to reach 60,000 tonnes (excluding metal for re-refining elsewhere) in 2012 and 2013.
China and Indonesia account for much of our forecast increase in global tin supply in 2012-13. Most of the balance will be from planned mine expansions in South America, although the main contributions from these projects will not start to come on stream until 2013. In Argentina, Silver Standard Resources, after some delays, should start recovering tin from its polymetallic Pirquitas mine in 2012 and to ramp up to output of 2,500 t/y of tin-in-concentrate over the following one to two years. Bolivia's Huanuni mine, which produced about 10,000 tonnes of tin-in-concentrate in 2010, is proceeding with plans to roughly
Both Indonesia and China will increase output in 2012-13
New tin mines will not make a major contribution to output until after 2012

94 Tin
World commodity forecasts: industrial raw materials January 2012 www.eiu.com © The Economist Intelligence Unit Limited 2012
double capacity after recently awarding a contract for the construction of a new processing plant, which should feed through to rising production of refined tin over the next two to three years. In Brazil, Minsur's Pitinga mine, which produced little more than 2,000 tonnes in 2010, is investing in a new ore-processing plant that should lift output towards 10,000-t/y in the medium term.
Australia has several tin mine projects in the planning stage, which could add significantly to future output. There are also a number of projects planned in other countries, such as Syrymbet Mining's 6,000-t/y project in Kazakhstan; Kasbah Resources' Achmmach project in Morocco (5,600 t/y); Western United Mines' plans to restart the South Crofty tin mine in the UK (2,200 t/y); and Gippsland's Abu Dhabbab tin-tantalum project in Egypt (1,500 t/y tin contained). However, the main contribution from these projects will only come towards the middle of the decade (and consequently beyond the time horizon of our current forecast). Nonetheless, this should not distract attention from the fact that new tin mine supply is in prospect.
Tin: production 2009 2010 2011 2012 2013Mine output ('000 tonnes tin contained) China 128.0 129.6 146.4 147.1 148.4Indonesia 94.9 95.7 91.5 100.0 100.0Peru 37.5 33.8 30.0 33.5 33.5Bolivia 19.6 20.2 20.5 20.5 21.5Brazil 10.4 7.4 9.0 11.5 14.0Others 34.8 34.0 28.6 32.1 42.6World total 325.2 320.7 326.0 344.7 360.0 % change 2.4 -1.4 1.7 5.7 4.4Refined production ('000 tonnes) China 134.5 149.4 164.0 165.0 167.0Indonesia 64.5 57.1 56.0 60.0 60.0Malaysia 36.4 38.7 39.5 40.5 43.0South Americaa 57.3 58.0 53.5 62.5 70.0Others 35.7 41.8 41.0 43.5 51.0World total 328.4 345.0 354.0 371.5 391.0 % change -2.4 5.1 2.6 4.9 5.2
a Bolivia, Brazil, Peru and Mexico.
Source: Economist Intelligence Unit.
London Metal Exchange (LME) tin stocks rose during the first eight months of 2011, reaching a peak of over 23,000 tonnes in mid-August, encouraged by frequent backwardations in forward prices and the availability of standard-grade tin in physical markets, including Chinese metal exported in late 2010 and early 2011. However, with the market in deficit and Indonesian output falling as prices dropped, LME stocks started to fall and ended November over 11,000 tonnes below their recent peak. This follows a sharp spike in stock cancellations (metal marked for withdrawal from warehouses), and at the end of November stock cancellations still amounted to over 13% of the remaining metal within LME warehouses. We think that much of this metal is on its way to China, although withdrawals are likely to decline in line with the slowdown in demand growth in China. The ratio of total reported stocks to
Stocks and prices

Tin 95
World commodity forecasts: industrial raw materials January 2012 www.eiu.com © The Economist Intelligence Unit Limited 2012
consumption is estimated to have fallen to only 3.3 weeks at the end of 2011 and is expected to fall further to 2.7 weeks at the end of 2012, before starting to rise once more as the market returns to surplus in 2013.
The US Defense Logistics Agency (DLA) could resume sales of small volumes of tin. The DLA's market committee has put forward proposals for metal sales in 2012-13, including 804 tonnes of tin in 2013. However, we are not including sales from the DLA in our forecasts at this stage. DLA tin stockpile sales were stopped in August 2008 pending a strategy review. The total tonnage of tin remaining in the DLA's stockpile is 4,020 tonnes.
Refined tin: supply and demand ('000 tonnes unless otherwise indicated)
2009 2010 2011 2012 2013Global refined production 328.4 345.0 354.0 371.5 391.0
DLAa deliveries 0.1 - - - -Global refined consumption 307.8 358.2 366.5 375.0 387.0
Balance 20.7 -13.2 -12.5 -3.5 4.0Stocksb 46.1 35.7 23.2 19.7 23.7 Weeks' consumption 7.8 5.2 3.3 2.7 3.2
a Defense Logistics Agency. b Total reported market stocks.
Sources: WBMS; industry sources; Economist Intelligence Unit.
Tin prices rallied to new record highs (in nominal terms) in the first four months of 2011, with the LME cash price reaching a new all-time record of over US$15/lb on April 11th, although the late stages of the rally appeared to owe more to financial momentum than to any further tightness in the tin market balance. Prices have since been on a downward trend (barring a brief relief rally in July), touching 11-month lows of less than US$10.50/lb in late August, before sinking further towards US$9/lb in early December in a broad-based commodities market sell-off driven by concerns about the world economic outlook. However, with the tin market recording another deficit in 2011�its fifth in six years six years�on an annual average basis, prices are estimated to have soared by 28.7% to reach a new record of almost US$12/lb We do not think that supply can rise sufficiently to close the market deficit before 2013. As a result, we expect tin prices to rise further still, reaching another new record average of US$12.1/lb in 2012. From 2013 we expect progressively more supply to come on stream, leading to a drop in prices in that year.
Refined tin: stocks and prices 2010 2011 2012 2013 2014Stocksa 1 Qtr 43.4 37.6 22.3 20.7 25.82 Qtr 36.5 41.8 21.4 21.7 -3 Qtr 31.4 40.3 20.5 22.7 -4 Qtr 35.7 23.2 19.7 23.7 - % change -22.7 -35.1 -15.1 20.4 -
Constrained supply will support prices in 2012

96 Tin
World commodity forecasts: industrial raw materials January 2012 www.eiu.com © The Economist Intelligence Unit Limited 2012
Refined tin: stocks and prices 2010 2011 2012 2013 2014Pricesb 1 Qtr 7.82 13.59 11.00 12.20 10.802 Qtr 8.09 13.02 12.20 11.40 -3 Qtr 9.32 11.23 12.50 11.00 -4 Qtr 11.79 9.80 12.80 10.80 -Year 9.26 11.91 12.13 11.35 - % change 50.2 28.7 1.81 -6.39 -
a Total reported commercial closing stocks; '000 tonnes. b LME cash settlement price; US$/lb.
Sources: London Metal Exchange (LME); Economist Intelligence Unit.
Tin: stocks and prices
Sources: London Metal Exchange; Economist Intelligence Unit.
0.0
10.0
20.0
30.0
40.0
50.0
60.0
70.0
0.0
2.0
4.0
6.0
8.0
10.0
12.0
14.0
Prices (US$/lb); right scaleStocks ('000 tonnes); left scale
141312111009080706052004

Wool 97
World commodity forecasts: industrial raw materials January 2012 www.eiu.com © The Economist Intelligence Unit Limited 2012
Wool
World wool consumption in 2011/12 (July-June) is forecast at 1.055m tonnes clean basis, a decline of 0.9% on 2010/11, as lower demand in the EU more than offsets increased consumption in China. More generally, high (albeit declining) prices will constrain demand growth, as will weak, if any, economic growth in many of the main wool apparel-consuming countries. In both 2012/13 and 2013/14 little change in global consumption is forecast, with growth in China and India being offset by weaker demand in the EU.
China accounts for nearly 40% of global wool consumption, with 25% of global installed long staple spindles and 20% of wool looms. Moreover, China's wool-processing industry has continued to invest and upgrade machinery, as indicated by the fact that global shipments of long staple spindles (which are only used in wool spinning), mainly to China, have been rising strongly. In 2011/12 wool consumption is forecast to rise to 406,000 tonnes, 1% higher than in the previous season, supported by robust retail sales, particularly in the coastal regions. Retail clothing sales from 100 department stores in January-September 2011 rose in volume by 5.4% year on year, compared with growth of 12.3% in January-September 2010.
Exports of wool clothing from China in January-August 2011 rose in volume (notably knitwear, which was up by 19%), while other end-uses fared less well, with woven apparel exports down by 3%. Australia's wool exports to China in the first two months of 2011/12 totalled some 20,000 tonnes clean basis, 9% lower than in the year-earlier period. China accounted for 70% of all wool exports from Australia, followed by India with 8%. However, the quantities of wool offered at auction were unusually low. Since then, buyers for China have been dominant at subsequent sales. Owing to some further growth in domestic apparel demand, China's wool consumption is forecast to rise by 1.5% in 2012/13 to 412,000 tonnes, and by a further 1.2% to 417,000 tonnes in 2013/14.
In the EU, wool consumption will continue to fall in 2011/12, dropping by 6.5% to 159,000 tonnes. The long-term trend in declining consumption will be accelerated by the expected downturn in regional growth, and by fiscal auster-ity in the UK and the euro zone. Australia's wool exports to Italy amounted to only 1,800 tonnes clean basis in July-August 2011, while exports to all the other 26 EU member states barely reached 1,400 tonnes clean basis. New Zealand's wool exports to the EU totalled 34,300 tonnes clean basis in 2010/11, 7.3% lower than in 2009/10, and provisional figures for the first two months of 2011/12 suggest a decline of more than 5% compared with the year-earlier period.
Weak consumer demand throughout the EU, coupled with a relatively warm start to the 2011/12 winter season, continues to cause concern over volume sales, particularly of woven worsted apparel (notably women's skirts and men's suits). One indicator is that exports of wool-woven garments from China to the EU in the first eight months of 2011 fell in volume by 7% year on year, although exports of wool knitwear, which is generally much cheaper, rose by 22% towards 20m pieces. This weakness will be exacerbated by some retailers raising the price of men's suits by at least 5% in the 2011 autumn/winter season.
Demand
Chinese demand will rise owing in part to domestic apparel demand
Weak consumer demand in the EU will lead to falling wool consumption

98 Wool
World commodity forecasts: industrial raw materials January 2012 www.eiu.com © The Economist Intelligence Unit Limited 2012
The Economist Intelligence Unit forecasts that EU wool consumption will continue to decline, although at a more modest rate of 1.9% a year, over the next two seasons.
In India, wool consumption in 2011/12 is forecast to total 82,000 tonnes, unchanged from the previous season. Demand in 2010/11 was fairly weak�imports of wool from New Zealand fell by 33.4% year on year to 7,900 tonnes. However, exports of wool carpets and apparel from India will be supported as the duty entitlement passbook (DEPB) scheme, which is due to expire shortly, is expected to be replaced by a new scheme that also provides rebates for exporters. In this context, the Ministry of Commerce has instructed the Ministry of Textiles to prepare a restructuring programme for the entire textiles sector, including the Technology Upgradation Fund Scheme (TUFS), working capital assistance and export subsidies. Another export promotion scheme was announced in parallel. Although some consumption growth is forecast, the increases will be only moderate, reflecting competition with China, and the likelihood that demand for household textiles (in particular carpets) in many developed regions is likely to be deferred as real incomes fall. Consumption in India is forecast to rise by 2.4% to 84,000 tonnes in 2012/13, followed by further growth of 1.2% to 85,000 tonnes in 2013/14.
In Turkey, manufacturers have benefited from close proximity to EU markets. This, together with low stocks in early-stage wool textile processing (carding, combing, top making and spinning), should ensure that wool consumption is maintained at 46,000 tonnes in 2011/12. Although EU demand will be weak, the government's approval of safeguard measures on imports of textiles and apparel will keep wool consumption levels unchanged. The additional rates of duty are up to 20% on items such as wool fabrics and up to 30% on apparel, including wool suits and knitwear. This may compensate partially for the fact that there is now a significant price advantage of acrylic vis-à-vis wool. Although the price of wool declined by 14.2% between June and November 2011, the acrylic tow price fell by 22.7% to �2.05/kg (US$2.76/kg). In addition, the price of acrylonitrile, the main raw material used in the manufacture of acrylic fibre, amounted to �1,980/tonne (US$2,670/tonne) in November 2011, 3.6% lower than in the previous month. Furthermore, it should be noted that the price of apparel wool is already 2.8 times higher than that of acrylic tow. Given the uncertainty of EU consumer demand, which has dampened confidence in the sector, wool usage in Turkey is forecast to remain unchanged, at 46,000 tonnes in both 2012/13 and 2013/14.
In Russia, wool consumption in 2011/12 is forecast to fall to 15,000 tonnes owing to the low productivity of the domestic textiles sector, which is restraining expansion. Consumption is forecast to remain flat in 2012/13 and to fall slightly in 2013/14. In Uzbekistan, the growth in demand for knitted apparel for both the domestic market and for export has faltered, the latter reflecting weak demand in the EU, with the result that wool consumption will fall to 14,000 tonnes in 2011/12 and remain at this level in the following two seasons. However, one source of optimism has been the signing in mid-October 2011 of a free-trade agreement among many of the nations comprising the Commonwealth of Independent States (CIS), namely Russia, Armenia, Belarus,
India's exports of woollen goods will benefit from tax rebates for exporters
Growth in Turkey's wool exports will be constrained by weakness in the EU
Consumption in Russia will remain flat in 2012/13 and 2013/14

Wool 99
World commodity forecasts: industrial raw materials January 2012 www.eiu.com © The Economist Intelligence Unit Limited 2012
Kazakhstan, the Kyrgyz Republic, Moldova, Tajikistan and Ukraine. Furthermore, Azerbaijan, Turkmenistan and Uzbekistan may join by the end of this year. This could provide some support for growth of the domestic textile industries, and thus reduce imports of manufactured textile products.
Japan and the US are no longer primary wool consumers, although both countries are significant retail consumers. Wool yarn output in the US in January-August 2011 rose by 10.2% year on year to 6,900 tonnes, although wool fabric output fell by 4.2% to 20.2m sq metres. In Japan, raw wool consumption is forecast to remain unchanged at around 10,000 tonnes in both 2011/12 and 2012/13, before falling to 9,000 tonnes in 2013/14. In the US, total imports of wool textiles and apparel in January-September 2011 reached 246m sq metre equivalents, 1.6% higher than in the year-earlier period, although the figure for September 2011, at 55m sq metre equivalents, was 6.7% lower than in the same month in 2010, reflecting a lack of consumer confidence. As a result, wool consumption is forecast to be maintained at 8,000 tonnes/year, primarily as a result of the Kissell Amendment to the Berry Amendment, which extends the requirement of the Department of Defence to give preference in procurement to domestically produced goods, including textiles and fabrics, to textile and apparel products purchased by the US Department of Homeland Security's Transportation Security Administration. Indeed, the bulk of domestic consumption is for military use, particularly uniforms.
Wool: consumptiona ('000 tonnes unless otherwise indicated)
2009/10 2010/11 2011/12 2012/13 2013/14China 397 402 406 412 417
EU 180 170 159 156 153India 82 82 82 84 85
Turkey 45 46 46 46 46Russia 17 16 15 15 14Uzbekistan 16 16 14 14 13
Japan 10 10 10 10 9US 8 8 8 8 8
Others 315 315 315 310 310Total 1,070 1,065 1,055 1,055 1,055 % change -3.2 -0.5 -0.9 0.0 0.0
a Years ending June 30th.
Sources: International Wool Trade Organisation (IWTO); Economist Intelligence Unit.
The long-term declining trend in world wool production appears to have been reversed, and in 2011/12 (July-June) we forecast that global production will rise by 0.3% to 1.065m tonnes, reflecting relatively high and stable wool prices and improved pasture conditions in Australia and across the southern hemisphere. The prospects for growth in the next two years look good: the Australian Bureau of Agricultural and Resource Economics (ABARE) expects Australia's sheep numbers to rise over the next few years, despite an expected increase in slaughterings in 2011/12. As a result, world wool production is forecast to rise by 0.5% in 2012/13. There will be a further rise in output in 2013/14, to 1.075m tonnes, on the assumption of continued favourable pasture conditions in Australia.
Supply
Mills are closing in Japan, while the US market is dominated by the military

100 Wool
World commodity forecasts: industrial raw materials January 2012 www.eiu.com © The Economist Intelligence Unit Limited 2012
In August the Australian Wool Production Forecasting Committee (AWPFC) revised up its estimate of wool production in the 2010/11 season to 246,000 tonnes, just 1.2% lower than in 2009/10, mainly on the basis of the excellent seasonal weather conditions throughout eastern Australia, which raised the clip per head by 2.9% to 4.63 kg. ABARE's September forecast indicates that sheep numbers will rise as a result of high wool prices, from 70m head in 2010/11 to 71m head in 2011/12 and 73m head by 2015/16. This upward trend is confirmed by the AWPFC, which suggests that sheep numbers in 2011/12 will rise by 4% to 70.8m head, with the growth in New South Wales and Victoria, in particular, outweighing the decline in Western Australia. However, the number of sheep shorn may rise more slowly as a result of higher returns on meat production. As a consequence, any rise in wool production will be less than usual since there will be fewer merinos, which produce fine wools, and more crossbreeds, which produce coarser wools, have a lower fleece weight and are used primarily for producing meat. This is reflected in the fact that production of superfine wool in 2010/11 fell by 16% year on year and accounted for 17% of the total clip, while production of medium wool rose by 8% and accounted for 20% of the total. However, this trend may be mitigated by generally favourable pasture conditions, including full farm reservoirs.
Information from the Australian Wool Testing Authority (AWTA) also suggests higher production. Data for the first four months of 2011/12 (July-October) show that the volume of wool tested rose by 3.7% year on year. Another positive sign was that, despite a rise in the vegetable matter content in the wool tested in the first four months of 2011/12 to 2.6% of the fleece weight, yields were up by 2%. Furthermore, favourable seasonal conditions have resulted in increased quant-ities of hay and silage being harvested. As a result, we expect wool output to rise by 2.8% year on year to 253,000 tonnes in 2011/12, followed by further rises as farmers continue to rebuild flocks across the country, to 262,000 tonnes in 2012/13 and 270,000 tonnes in 2013/14. However, with prices easing, it should be noted that the pass-in rate (the number of offered but unsold bales as a percentage of sold bales) rose to 16% in mid-November, much higher than the rate of 9.4% recorded in mid-September, justifying easing prices.
In China, increasing domestic demand for sheepmeat has reduced the sheep population, and the government has regulated sheep numbers in certain areas in order to protect land from pasture. In fact, recent evidence suggests that the decline in sheep numbers is moderating significantly, with the national flock at the beginning of 2011 amounting to 128m head, only 0.4% below the year-earlier figure. As a result, wool production in 2011/12 is forecast to fall by 0.6% to 158,000 tonnes. Provincial governments will continue to provide financial incentives to domestic wool producers in a bid to curb the increasing quantities of wool imports. However, the impact of these incentives (in terms of encouraging shearing) is likely to be offset by the continuing rise in domestic demand for sheepmeat, particularly from the middle classes in coastal provinces. In addition, in some regions agricultural land, which contains natural resources such as coal, gas and oil, is being redeveloped, with the result that wool is no longer the main income for farmers. Another important issue is that the clip per head is falling, owing to land degradation in the two main wool-growing provinces of Xinjiang and Inner Mongolia.
Farmers will be offered incentives in China in a bid to limit wool imports
Australian output will rise, supported by increasing sheep numbers

Wool 101
World commodity forecasts: industrial raw materials January 2012 www.eiu.com © The Economist Intelligence Unit Limited 2012
On balance, although we expect the sheep population to be relatively stable in the coming years, lower yields will continue to reduce wool output to 153,000 tonnes in 2012/13. However, although a decline in wool output will occur in the short term, the 12th five-year plan (2011-15) places great emphasis on the wool textile industry with respect to eco-sustainability, improved pollution control, and advanced spinning and dyeing technologies. This suggests that wool output will continue to be encouraged to ensure that the sector remains strong. As a result, we forecast that wool output will be maintained at 150,000 tonnes in 2013/14.
Wool production in New Zealand, the world's third-largest producer, is forecast to fall by 1.5% in 2011/12 to 134,000 tonnes. However, the long-term decline in the sheep population has been reversed, aided by relatively good returns to farmers, and we now estimate a rise of 0.7% to 32.6m head in 2011. Output could rise to 135,000 tonnes in the following two seasons, as relatively high wool prices discourage farmers from increasing sheep slaughterings, despite growing demand for sheepmeat. Indeed, gross farm revenue from wool in 2010/11 rose by 43% from the 100-year low registered in 2009/10. Furthermore, the free-trade agreement with China has aided exports. The tariff quota, which allowed for 27,563 tonnes of clean wool to be imported into China in 2011, will rise by 5% per year, with the result that by 2017 the tariff quota will amount to almost 37,000 tonnes.
In South Africa, wool production in 2011/12 is forecast to fall by 6.7% year on year to 28,000 tonnes as a result of the outbreak of Rift Valley Fever (RVF), foot-and-mouth disease and predators, notably jackals. However, both diseases have been controlled and China, an important export market, has lifted the ban on imports of wool from South Africa. Given the expected rise in exports and high prices, wool production in South Africa could reach 30,000 tonnes by 2013/14.
In Argentina, according to the Federación Lanera Argentina, a further decline in output to 28,000 tonnes is forecast in 2011/12 as a result of competition for land for food crops, in particular soybean, and lower sheep numbers partly as a result of sheep deaths from the fall of volcanic ash from the Puyehue volcano in Chile. A modest rise in sheep numbers to 12.6m head should ensure, at worst, little change in production at 28,000 tonnes in both 2012/13 and 2013/14. Wool output in Uruguay, having fallen by 3.6% in 2010/11, as the 11% reduction in sheep numbers was almost counterbalanced by higher fleece weights, is expected to fall further as farmers favour other agricultural enterprises, notably beef and dairy cattle. Wool production in 2011/12 is now forecast to fall by 3.7% year on year to 26,000 tonnes. We expect output to be maintained at this level in 2012/13, although rising fleece weights could raise output in 2013/14.
In Russia, wool production in 2011/12 is expected to reach nearly 25,500 tonnes, just marginally higher than in the previous season and in line with broadly flat consumption growth. Wool production in Kazakhstan is forecast to be maintained, at 22,000 tonnes, as a result of higher local prices than in the recent past. In 2012/13 and 2013/14 wool production levels in both countries are expected to remain relatively stable, as there are constraints on increasing production further, including severe winter weather and nomadic existence,
High prices discourage farmers from sheep slaughterings in New Zealand
In other parts of the southern hemisphere, output will rise in 2012/13
Output will remain relatively flat in Russia and Kazakhstan

102 Wool
World commodity forecasts: industrial raw materials January 2012 www.eiu.com © The Economist Intelligence Unit Limited 2012
although some small growth could occur in Russia as sheep numbers in 2011 rose by 1% to 19.8m head.
In the UK, although domestic wool prices have risen, the declining profitability of sheep farming is likely to result in little change in production in 2011/12, at 26,000 tonnes. We expect production to remain broadly stable over the next two seasons, as growers respond to rising lamb prices. Although the campaign for wool may improve awareness, it will have only a small impact on output, which is forecast at 27,000 tonnes in 2013/14.
Wool: productiona ('000 tonnes unless otherwise indicated)b
2009/10 2010/11 2011/12 2012/13 2013/14Australia 249 246 253 262 270
China 167 159 158 153 150New Zealand 145 136 134 135 135India 36 36 36 36 36
South Africa 30 30 28 29 30UK 29 26 26 26 27
Argentina 29 29 28 28 28Uruguay 28 27 26 26 27
Russia 25 25 25 26 26Kazakhstan 21 22 22 22 22Others 326 326 329 327 324
Total 1,085 1,062 1,065 1,070 1,075 % change -1.4 -2.1 0.3 0.5 0.5
a Years ending June 30th. b Clean equivalent.
Sources: IWTO; Economist Intelligence Unit.
World wool demand was slightly higher than supply in 2010/11, resulting in a small decline in raw wool stocks, which remain low by historical standards, particularly of certain wool qualities. However, the confidence felt by some wool producers in view of increasing returns is not reciprocated by consumers, as export-led demand falters. As a result, stocks could rise to 67,000 tonnes by the end of 2011/12. With wool supply being largely inelastic, unless demand recovers by 2013/14, wool stocks could rise further in excess of 100,000 tonnes, although higher slaughterings may partially offset any increase.
Wool: supply and demanda ('000 tonnes)
2009/10 2010/11 2011/12 2012/13 2013/14Production 1,085 1,062 1,065 1,070 1,075
Consumption 1,070 1,065 1,055 1,055 1,055Balance 15 -3 10 15 20Stocksb 60 57 67 82 102
a Years ending June 30th. b World closing stocks.
Sources: IWTO; Economist Intelligence Unit.
Apparel wool prices rose by almost 55% between mid-August 2010 and mid-June 2011, to a record 1,420 Australian cents/kg (1,429 US cents/kg) clean basis. Prices have since fallen by around 16%, partly owing to concerns, especially
Stocks and prices
Output in the UK will be maintained
Prices will fall as consumption falters and production improves

Wool 103
World commodity forecasts: industrial raw materials January 2012 www.eiu.com © The Economist Intelligence Unit Limited 2012
from exporters in China and India, over the subdued demand for high-value apparel items in the EU, the US and Japan in the 2011/12 autumn-winter season because of slow economic growth. Despite the recent moderation in prices, on an annual average basis in 2011 prices will still be up by 39.7%. As production improves and consumption falters, we forecast that prices will continue to fall, recording an annual average drop of 12.8% in 2012 and 11.9% in 2013. The ABARE forecast for wool prices in 2011/12, as measured by the Eastern Market Indicator, is 1,200 Australian cents/kg (1,207 US cents/kg) clean basis, marginally below our figure of 1,214 Australian cents/kg (1,221 US cents/kg) clean basis. Given the recent sharp fall in cotton prices, some switch away from wool is possible, but any change will be marginal, since for many end-uses cotton and wool do not compete. Carpet wool prices will be relatively stable in the medium term because most New Zealand sheep are crossbreeds, and the production of wool is currently less profitable than the sale of sheepmeat.
Wool: prices 2010 2011 2012 2013 2014Apparel woolsa 1 Qtr 927 1,264 1,220 1,030 9202 Qtr 896 1,386 1,160 1,000 -3 Qtr 872 1,287 1,110 970 -4 Qtr 974 1,190 980 940 -Year 917 1,282 1,118 985 - % change 14.1 39.7 -12.8 -11.9 -Carpet woolsb 1 Qtr 518 539 505 505 4902 Qtr 513 550 507 500 -3 Qtr 507 527 503 500 -4 Qtr 523 507 500 495 -Year 515 531 504 500 - % change 3.0 3.0 -5.1 -0.7 -
a Eastern Market Indicator, Australian cents/kg clean basis. b New Zealand Market Indicator, New Zealand cents/kg clean basis.
Sources: IWTO; Economist Intelligence Unit.
Wool: prices(Eastern Market Indicator; apparel wool prices; Australian cents/kg clean basis)
Sources: International Wool Trade Organisation; Economist Intelligence Unit.
600
700
800
900
1,000
1,100
1,200
1,300
1,400
1,500
141312111009080706052004

104 Zinc
World commodity forecasts: industrial raw materials January 2012 www.eiu.com © The Economist Intelligence Unit Limited 2012
Zinc
The momentum behind growth in global apparent consumption of refined zinc has slowed sharply. Although growth has continued in China and Europe, it slowed from the double-digit pace recorded in 2010 to low single digits in 2011, while US and Japanese demand contracted slightly. Part of the slowdown in growth in 2011 to just 3% was the result of the high base of comparison in 2010 (when growth rebounded to 16.3%), which was exaggerated by consumer restocking, whereas destocking was a feature of most of 2011, especially in China. However, lower prices since the sell-off in September appear to have triggered some Chinese bargain hunting, which has made the apparent demand-side fundamentals of the global refined zinc market appear stronger in recent months. However, the Economist Intelligence Unit believes that the driver has been speculative restocking, not real end-usage, as the signals from the galvanised steel sector are not encouraging owing to ongoing steps to pre-vent the steel-intensive construction sector from overheating. The outlook for China�s export markets is deteriorating too, adding another layer of concern to the shorter-term outlook for demand in the world�s top zinc-consuming economy. We forecast global zinc consumption growth of 3.3% in 2012, as the impact of fiscal tightening in the mature economies takes effect. In 2013 we forecast a modest recovery in global refined zinc consumption, with growth rising to 4.9%.
Data for 2011 suggest that there was broad-based support for underlying zinc demand in China, albeit at a far slower rate than in 2010. The key factor behind China's zinc demand is the level of galvanised steel output, which was up by 11% year on year in the first half of 2011 (and reached a record high in the second quarter of 31.1m tonnes). Furthermore, with higher capacity utilisation rates at steel mills, indications are that another new record was achieved in the third quarter, of around 31.2m tonnes. The government's affordable housing construction targets are a major driving force.
However, despite double-digit growth in zinc's main end-use market in 2011, apparent consumption of refined zinc increased by a negligible 9,000 tonnes in the nine months to September compared with the same period in 2010, reaching 3.93m tonnes. This suggests that zinc consumers have been destocking, perhaps owing to concerns about growth in some of the underlying markets for galvanised steel�domestic automotive output and sales, for example, have been rising by only 3-4% year on year. There is also uncertainty about the sus-tainability of the growth in real estate, a key sector for zinc demand, with restrictions on property purchases becoming increasingly widespread across China. Another factor that would have encouraged zinc consumers to run down their working inventories during the first three quarters of 2011 was tightness in the credit markets, as the government had restricted bank lending.
China's zinc consumption in 2011 as a whole was boosted by a bout of restocking and opportunistic buying in the latter part of the year in response to the sharp drop in prices that occurred in September. There were a number of indicators suggesting a marked pick-up in Chinese buying during October and November. The Shanghai Futures Exchange (SHFE) forward price curve plunged
Demand
Robust internal demand drove China's galvanised steel output in 2011
Consumer destocking dominated the Chinese zinc market for most of 2011
Speculative restocking boosts apparent demand in the final quarter of 2011

Zinc 105
World commodity forecasts: industrial raw materials January 2012 www.eiu.com © The Economist Intelligence Unit Limited 2012
into backwardation, the benchmark third-month price moved to its largest premium in two years above the London Metal Exchange (LME) price in October, SHFE stocks have fallen by an average of nearly 5,000 tonnes a week since August, and LME stocks in Asian warehouses have been drawn down steadily too. The stock trends are the most notable indicator of a change in the market dynamics since the end of the summer, as, prior to that, they had been on a relentless, multi-year upward trend on both the LME and SHFE.
However, these trends seem to be at odds with the deteriorating fundamentals in China�s galvanised steel market. It suggests that zinc consumers are not re-stocking, rather it is merchants who have been active, exploiting price weakness and arbitrage opportunities to rebuild stocks that will feed downstream demand at some point in the future. This pattern has also been recorded in other base metals. Therefore, although this is not real consumption by end users, it is nevertheless boosting apparent consumption, which we estimate to rise by 4.5% in 2011.
The general underlying weakness in the galvanised steel and zinc markets, however, means that zinc consumption growth in China will remain modest in 2012, and we peg growth at around 4.5%. However, the main economic indicators for China's economy are still robust, and we expect a recovery in consumption growth to at least 6% in 2013.
Data from the International Lead and Zinc Study Group (ILZSG) suggest that EU consumption growth remained positive in 2011. In January-September growth stood at an estimated 2.2% (compared with growth in January-August of 4.5%). Given the increasingly uncertain outlook in a number of economies, the weakness in the automotive industry, and austerity measures choking off economic growth across the region, we expect zinc consumption growth to continue slowing into 2012. We estimate EU zinc consumption growth of just 1.5% in 2011 as a whole, with flat consumption in 2012 aided by some destocking. The risks to these forecasts are to the downside. However, we expect a modest pick-up of 2% in 2013 as economic activity recovers.
US zinc consumption growth was weak in 2011 and will remain so in 2012. This reflects a combination of cyclical issues and the structural decline that has seen consumption weaken over the past five years, as manufacturing activity is increasingly relocated to lower-cost areas.
The US automotive sector recovered strongly during 2010, to the benefit of the continuous galvanising sector. This strength spilled over into the first quarter of 2011, but dissipated in the second quarter, with shipments of galvanised steel falling away too. Shipments remained weak during the summer months, with the industry emerging from the seasonal slow period only to find that the broader outlook for the economy had deteriorated. Batch galvanisers, which are more driven by the non-residential sector, and particularly the infrastructure sector, are faring even less well. Reports from the brass market with its fairly broad industrial base are providing some support, while the die-casting sector continues to lag behind most industrial sectors. Against this backdrop, the prospects for zinc consumption are poor. The ILZSG already reports a contraction in consumption in the nine months to September 2011 of 5.9% year
Austerity is choking off growth in the EU
US consumption is contracting, and risks are on the downside

106 Zinc
World commodity forecasts: industrial raw materials January 2012 www.eiu.com © The Economist Intelligence Unit Limited 2012
on year, and we retain our estimate of a 3.9% contraction in the year as a whole. Reflecting still-weak economic growth, we forecast practically stagnant con-sumption in 2012 before a mild recovery in 2013.
In Japan, which accounts for around 4% of the global zinc market, consumption was hit by the disruption to industrial production, including the automotive sector, caused by the major earthquake and tsunami in March. Initial estimates from the ILZSG suggested an 8% year-on-year decline in the year to April. The ILZSG's latest estimate put the contraction in the year to September at 2.8% year on year. Although there has been some disruption in the automotive sector resulting from a shortage of parts because of floods in Thailand in October-November, we continue to estimate flat growth for the year as a whole. Assuming the reconstruction phase is in full swing in 2012, we expect zinc consumption in Japan to rebound strongly and to grow by 6-7%, followed by 3% in 2013.
Refined zinc: consumption ('000 tonnes unless otherwise indicated)
2009 2010 2011 2012 2013China 4,659 5,358 5,600 5,850 6,220
EU 1,570 2,160 2,192 2,195 2,240US 912 926 890 898 924Japan 433 516 515 549 565
South Korea 465 554 550 561 589India 497 525 560 595 637
Brazil 194 241 265 280 297Taiwan 189 232 235 250 258
Others 1,926 2,103 2,190 2,250 2,350World total 10,845 12,615 12,997 13,428 14,079 % change -6.2 16.3 3.0 3.3 4.9
Sources: International Lead and Zinc Study Group (ILZSG); Economist Intelligence Unit.
The recovery in global demand in 2010 was met by a strong rebound in refined zinc production of 14%, as concentrate availability and prices improved. However, the capacity restarts and ramp-ups primarily responsible for the surge have been completed, so growth rates moderated in 2011. We expect annual growth in global refined output to ease to 2.6% in 2011 before averaging 3.9% in 2012-13, with most facilities operating back at close to capacity. However, growth in refined output could be slower if lower prices following the sell-off in September force a response from marginal producers as margins come under pressure. Some Chinese mines and smelters started to reduce production during October. We previously trimmed our short-term expectations for Chinese production accordingly, but we may need to make a further downward revision if prices fall sharply again. Overall, however, China is still expected to remain the key driver behind future growth in both mine and refined production, as this is where the bulk of new capacity additions are located. The other key feature on the supply side of the zinc market is the capacity constraint outside China, with the notable exception of India, where output has been boosted by the latest in a series of new capacity additions by Hindustan Zinc.
Supply
Japanese demand will rebound in 2012

Zinc 107
World commodity forecasts: industrial raw materials January 2012 www.eiu.com © The Economist Intelligence Unit Limited 2012
Chinese refined zinc consumption rebounded strongly in month-on-month terms in September, up by 11.6% to 452,724 tonnes, and jumped again in October to 474,000 tonnes, which was the highest level in a year. This has boosted year-on-year comparisons, and cumulative output for the full ten-month period to October was 3.5%. However, this still contrasts starkly with the double-digit growth rates usually recorded in China, like the 20.5% rise in 2010. Our view of China's slow rate of growth for much of 2011 was that it would prove to be temporary, with the normal seasonal pick-up in the fourth quarter making up the lost ground. However, Chinese smelters are some of the highest-cost operations in the industry and some marginal producers are reported to have started to shut down. Smelters in some provinces, such as Yunnan and Sichuan, have cut capacity by up to 20% since the start of October. We therefore estimate a slowdown in growth of Chinese refined zinc production to 3.2% in 2011. We forecast a marked improvement in 2012, when growth will accelerate to 8.8%, but a tighter concentrate market will cause growth to moderate to 3-4% in 2013.
In Europe, the expansion in output in recent years is beginning to slow. In total, EU refined zinc production increased by 24% year on year in 2010, as capacity that had been closed in response to the 2008-09 downturn was restarted. Growth slowed steadily in 2011�according to the ILZSG's estimates it stood at 2.6% in the nine months to September, with the region's smelters largely operating at or close to full capacity. For the year as a whole, EU output is estimated to slow to less than 1%, and we forecast that it will remain broadly flat in 2012 and 2013, as no new capacity is expected to come on stream.
In the other major zinc smelting centres outside China and India performances were mixed in 2011. Canadian and Japanese production was down, offsetting gains in the US, Mexico, Peru and Australia, while South Korean and Brazilian production was flat. Elsewhere, there are plans to build two new smelters in Bolivia each capable of processing 100,000 tonnes/year (t/y) of concentrate, but these are unlikely to be operational until 2014 at the earliest.
Global mine production rose strongly for much of 2011 after the seasonal low in February. June saw the highest monthly total ever recorded, at 1.135m tonnes of contained zinc. Production in August and September came in around 1.1m tonnes and took growth for the first three quarters of the year to 4.7% year on year. However, in response to lower prices since the sell-off in September, there have reports of many small, marginal Chinese mines bringing their winter shutdowns forward. Elsewhere, increased output in India, Finland, Russia, the US and Mexico this year has more than offset lower production in Canada, Australia and Peru.
We expect the strong growth trend in mine supply to resume in March 2012, after the seasonal shutdown period in China has passed and prices have improved. However, the lack of additional non-Chinese smelting capacity under construction means that the new mine supply is largely destined to end up in China, driving smelter expansions there. The scheduled closure of some large mines, most notably Xstrata's Brunswick mine in Canada, has been delayed, and Century in Australia is not slated to close until the middle of this decade. In the meantime, more mines under development will come on stream,
Chinese production will strengthen in 2012
Global mine production surged in 2011, but may have peaked
Outside China and India, capacity is limited and production growth is flat
Growth will continue in non-Chinese mine supply as new projects start
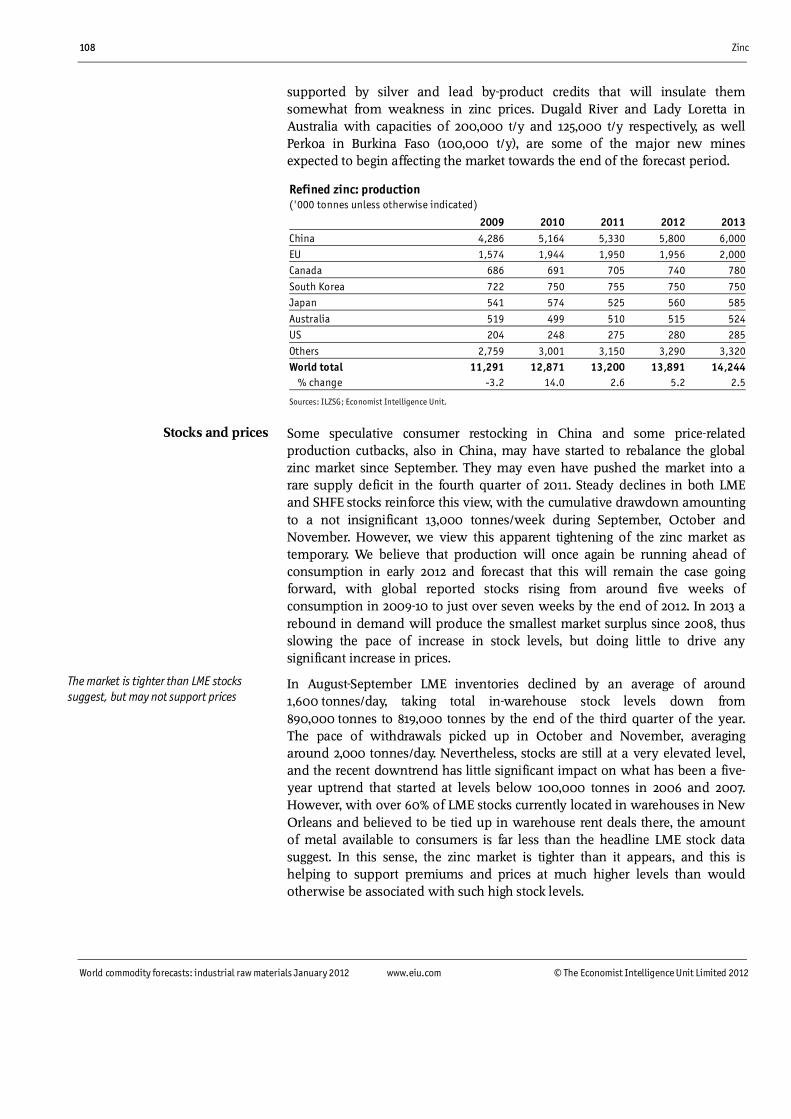
108 Zinc
World commodity forecasts: industrial raw materials January 2012 www.eiu.com © The Economist Intelligence Unit Limited 2012
supported by silver and lead by-product credits that will insulate them somewhat from weakness in zinc prices. Dugald River and Lady Loretta in Australia with capacities of 200,000 t/y and 125,000 t/y respectively, as well Perkoa in Burkina Faso (100,000 t/y), are some of the major new mines expected to begin affecting the market towards the end of the forecast period.
Refined zinc: production ('000 tonnes unless otherwise indicated)
2009 2010 2011 2012 2013China 4,286 5,164 5,330 5,800 6,000EU 1,574 1,944 1,950 1,956 2,000Canada 686 691 705 740 780
South Korea 722 750 755 750 750Japan 541 574 525 560 585
Australia 519 499 510 515 524US 204 248 275 280 285
Others 2,759 3,001 3,150 3,290 3,320World total 11,291 12,871 13,200 13,891 14,244 % change -3.2 14.0 2.6 5.2 2.5
Sources: ILZSG; Economist Intelligence Unit.
Some speculative consumer restocking in China and some price-related production cutbacks, also in China, may have started to rebalance the global zinc market since September. They may even have pushed the market into a rare supply deficit in the fourth quarter of 2011. Steady declines in both LME and SHFE stocks reinforce this view, with the cumulative drawdown amounting to a not insignificant 13,000 tonnes/week during September, October and November. However, we view this apparent tightening of the zinc market as temporary. We believe that production will once again be running ahead of consumption in early 2012 and forecast that this will remain the case going forward, with global reported stocks rising from around five weeks of consumption in 2009-10 to just over seven weeks by the end of 2012. In 2013 a rebound in demand will produce the smallest market surplus since 2008, thus slowing the pace of increase in stock levels, but doing little to drive any significant increase in prices.
In August-September LME inventories declined by an average of around 1,600 tonnes/day, taking total in-warehouse stock levels down from 890,000 tonnes to 819,000 tonnes by the end of the third quarter of the year. The pace of withdrawals picked up in October and November, averaging around 2,000 tonnes/day. Nevertheless, stocks are still at a very elevated level, and the recent downtrend has little significant impact on what has been a five-year uptrend that started at levels below 100,000 tonnes in 2006 and 2007. However, with over 60% of LME stocks currently located in warehouses in New Orleans and believed to be tied up in warehouse rent deals there, the amount of metal available to consumers is far less than the headline LME stock data suggest. In this sense, the zinc market is tighter than it appears, and this is helping to support premiums and prices at much higher levels than would otherwise be associated with such high stock levels.
Stocks and prices
The market is tighter than LME stocks suggest, but may not support prices

Zinc 109
World commodity forecasts: industrial raw materials January 2012 www.eiu.com © The Economist Intelligence Unit Limited 2012
As long as the three key criteria for rent deals persist�ample availability, low interest rates and a steady contango in the futures market�metal will remain tied up and out of reach of consumers. If prices are defined by availability of stocks, not absolute stock levels, then zinc's situation means prices can still perform relatively strongly, even with such a large stockpile overhanging the market. However, in the current environment it is uncertainty about the global fiscal and macroeconomic outlook that will be the primary price setter, not stock levels.
Slab zinc: Western supply and demand ('000 tonnes unless otherwise indicated)
2009 2010 2011 2012 2013Production 11,291 12,871 13,200 13,891 14,244
Consumption 10,845 12,615 12,997 13,428 14,079US stockpile disposals 0 0 0 0 0Balance 446 256 203 463 165Stocks 992 1,248 1,451 1,914 2,079 Weeks' consumptiona 4.8 5.1 5.8 7.4 7.7
a Number of weeks' forward demand on hand; calculated on basis of year-end stocks/(annual consumption/52).
Sources: ILZSG; Economist Intelligence Unit.
Volatility has characterised the zinc market for the past year, and this is ex-pected to continue. As with the other base metals, the market remains vulner-able to swings in sentiment regarding macroeconomic and fiscal issues, partic-ularly signs of slowing US economic growth, the path of the sovereign debt crisis in Europe, changes to China's monetary policy, and to a lesser degree the post-earthquake recovery in the Japanese economy. The late-September sell-off comprehensively broke the bottom of the 95-115 US cents/lb range that had held for the previous 12 months. The LME daily official zinc cash price plunged to a low of under 85 US cents/lb and fell again in October to 79.4 US cents/lb, its lowest level since July 2010. Although prices are likely to recover some of this lost ground, we expect prices to average just 99 US cents/lb in 2011. We believe that 2012 will be a year of consolidation, with increasing stocks leading to some price weakness. However, with the pace of growth in stocks slowing in 2013, some upward pressure on prices will start to return, and we forecast a nearly 7% increase in the annual average price for that year, to 97.5 US cents/lb.
Slab zinc: stocks and prices 2010 2011 2012 2013 2014Stocksa 1 Qtr 975 1,375 1,600 1,980 2,0502 Qtr 1,054 1,490 1,700 1,875 -3 Qtr 1,025 1,550 1,800 1,950 -4 Qtr 1,248 1,451 1,914 2,079 - % change 25.8 16.3 31.9 8.6 -
Recovery in prices in 2012 will be timid amid global economic uncertainty

110 Zinc
World commodity forecasts: industrial raw materials January 2012 www.eiu.com © The Economist Intelligence Unit Limited 2012
Slab zinc: stocks and prices 2010 2011 2012 2013 2014Pricesb 1 Qtr 103.9 108.6 90.0 95.0 102.02 Qtr 91.0 102.0 88.0 97.0 -3 Qtr 91.8 100.9 92.0 98.0 -4 Qtr 105.0 84.0 95.0 100.0 -Year 97.9 98.9 91.3 97.5 - % change 30.5 1.0 -7.7 6.8
a Total reported commercial (LME, producer, consumer, merchant) stocks at end-period; '000 tonnes. b LME cash price; US cents/lb.
Sources: World Bureau of Metal Statistics (WBMS); London Metal Exchange (LME); Economist Intelligence Unit.
Zinc: stocks and prices
Sources: International Lead and Zinc Study Group; Economist Intelligence Unit.
0
400
800
1,200
1,600
2,000
2,400
0
40
80
120
160
200
240
LME cash price (US cents/lb); right scaleStocks ('000 tonnes); left scale
141312111009080706052004

Statistical appendix 111
World commodity forecasts: industrial raw materials January 2012 www.eiu.com © The Economist Intelligence Unit Limited 2012
Statistical appendix Economist Intelligence Unit commodity price index (1990=100)
2011 2012 2013 2014 1 Qtr 2 Qtr 3 Qtr 4 Qtr 1 Qtr 2 Qtr 3 Qtr 4 Qtr 1 Qtr 2 Qtr 3 Qtr 4 Qtr 1 QtrUS$ index WCF 259.8 255.5 239.0 217.1 219.9 217.6 213.1 214.6 212.7 210.7 204.8 202.1 203.9IRM 264.2 253.6 228.4 201.2 208.7 212.7 212.8 217.6 218.7 220.4 212.9 208.4 210.1 Base metals 247.4 240.7 229.4 200.7 213.2 221.9 224.1 235.5 236.4 238.4 228.8 223.7 227.7 Fibres 214.4 202.9 148.6 136.3 136.6 131.4 127.2 117.8 118.1 120.0 114.7 110.2 107.0 Rubber 589.8 548.8 509.4 440.8 431.0 428.1 425.2 425.2 430.1 429.1 431.0 433.0 431.0 Crude oil 470.2 525.0 504.2 490.8 448.3 425.8 412.4 416.9 425.8 434.8 439.3 448.3 448.3% change, year on year WCF 48.1 49.7 25.6 -3.8 -15.4 -14.8 -10.8 -1.2 -3.3 -3.2 -3.9 -5.8 -4.1IRM 44.6 39.7 24.5 -10.2 -21.0 -16.1 -6.9 8.2 4.8 3.6 0.0 -4.2 -3.9 Base metals 25.5 27.3 19.1 -10.8 -13.8 -7.8 -2.3 17.3 10.9 7.4 2.1 -5.0 -3.7 Fibres 103.2 83.2 29.5 -13.8 -36.3 -35.2 -14.4 -13.6 -13.5 -8.7 -9.9 -6.4 -9.4 Rubber 74.4 46.8 44.2 -3.0 -26.9 -22.0 -16.5 -3.6 -0.2 0.2 1.4 1.8 0.2 Crude oil 36.9 48.9 47.2 26.2 -4.7 -18.9 -18.2 -15.1 -5.0 2.1 6.5 7.5 5.3% change, quarter on quarter WCF 15.1 -1.7 -6.4 -9.2 1.3 -1.0 -2.0 0.7 -0.9 -0.9 -2.8 -1.3 0.9IRM 18.0 -4.0 -9.9 -11.9 3.7 1.9 0.0 2.3 0.5 0.8 -3.4 -2.1 0.8 Base metals 10.0 -2.7 -4.7 -12.5 6.2 4.1 1.0 5.1 0.4 0.9 -4.0 -2.2 1.8 Fibres 35.5 -5.4 -26.7 -8.3 0.2 -3.8 -3.2 -7.4 0.3 1.6 -4.5 -3.9 -2.9 Rubber 29.8 -7.0 -7.2 -13.5 -2.2 -0.7 -0.7 0.0 1.2 -0.2 0.5 0.5 -0.5 Crude oil 20.9 11.7 -4.0 -2.6 -8.7 -5.0 -3.2 1.1 2.2 2.1 1.0 2.0 0.0Sterling index WCF 290.2 278.2 264.3 253.4 265.0 265.7 254.5 251.7 259.3 259.6 248.5 242.0 225.4IRM 295.1 276.2 252.6 234.9 251.5 259.8 254.0 255.3 266.5 271.5 258.3 249.7 232.2 Base metals 276.3 262.1 253.7 234.3 257.0 271.1 267.6 276.3 288.1 293.7 277.6 267.9 251.8 Fibres 239.5 220.9 164.3 159.1 164.6 160.5 151.9 138.2 143.9 147.9 139.1 132.0 118.3 Rubber 658.8 597.7 563.4 514.5 519.6 522.8 507.7 498.7 524.1 528.6 523.0 518.6 476.5 Crude oil 525.2 571.8 557.6 572.9 540.3 520.1 492.4 489.0 519.0 535.6 533.0 536.9 495.6
% change, year on year WCF 45.1 36.7 21.1 -0.3 -8.7 -4.5 -3.7 -0.7 -2.2 -2.3 -2.4 -3.8 -13.0IRM 41.7 27.5 20.0 -6.9 -14.8 -5.9 0.6 8.7 5.9 4.5 1.7 -2.2 -12.9 Base metals 22.9 16.2 14.8 -7.5 -7.0 3.4 5.5 17.9 12.1 8.4 3.8 -3.0 -12.6 Fibres 99.1 67.3 24.9 -10.7 -31.3 -27.4 -7.6 -13.1 -12.6 -7.9 -8.4 -4.4 -17.8 Rubber 70.9 34.1 39.1 0.5 -21.1 -12.5 -9.9 -3.1 0.9 1.1 3.0 4.0 -9.1 Crude oil 34.1 35.9 41.9 30.8 2.9 -9.0 -11.7 -14.6 -3.9 3.0 8.2 9.8 -4.5% change, quarter on quarter WCF 14.1 -4.1 -5.0 -4.1 4.6 0.3 -4.2 -1.1 3.0 0.1 -4.3 -2.6 -6.9IRM 17.0 -6.4 -8.5 -7.0 7.1 3.3 -2.2 0.5 4.4 1.9 -4.9 -3.3 -7.0 Base metals 9.1 -5.1 -3.2 -7.7 9.7 5.5 -1.3 3.3 4.3 1.9 -5.5 -3.5 -6.0 Fibres 34.5 -7.7 -25.6 -3.2 3.5 -2.5 -5.3 -9.0 4.2 2.7 -5.9 -5.1 -10.4 Rubber 28.7 -9.3 -5.7 -8.7 1.0 0.6 -2.9 -1.8 5.1 0.8 -1.1 -0.8 -8.1 Crude oil 19.9 8.9 -2.5 2.7 -5.7 -3.7 -5.3 -0.7 6.1 3.2 -0.5 0.7 -7.7
Note. WCF (World commodity forecasts) is an index of 21 hard and soft commodities. IRM (Industrial raw materials) is a price index of nine hard commodities. The metals sector has a weighting of 65.1% in the IRM index, fibres 27.4% and rubber 7.5%. IRM has
Source: Economist Intelligence Unit.