e.k.a. advanced physics laboratory
TRANSCRIPT

E.K.A. ADVANCED PHYSICS LABORATORY
PHYSICS 3081, 4051
VACUUM AND MASS SPECTROMETRY
1 Introduction
1.1 References
1. O’Hanlon, A User’s Guide to Vacuum Technology, John Wiley & Sons, 1989. Read thedescriptions of the operation principles of each of the pumps and vacuum gauges used inthe experiment. For a review of the mass spectrometer (Residual Gas Analyzer), read Ch.8, especially pages 122-125 and 128-132. Read Ch. 9 on interpretation of RGA data; seeappendix E for cracking fraction tables.
2. C. Rolfs and W. Rodney, Cauldrons in the Cosmos, University of Chicago Press, 1988.See fig. 9.8 on p. 460 and the related text for discussion of the origin of the nine stableisotopes of Xe, the abundance of which are measured in the experiment.
3. SRS 200 Residual Gas Analyzer Operating Manual and Programming Reference: https://www.thinksrs.com/downloads/pdfs/manuals/RGAm.pdf.
4. Pfeiffer Diaphragm Membrane Vacuum Pump MVP 015-4 Operating Instructions: https://www.idealvac.com/files/ManualsII/Pfeiffer_MVP_015-4_Operating_Instructions.
pdf.
5. Varian Turbo-V 81-T Instruction Manual: http://ridl.cfd.rit.edu/products/manuals/Varian/other/TV%2081-T.pdf.
6. Agilent Turbo-V 81-AG Rack Controller User Manual: https://www.agilent.com/cs/
library/usermanuals/public/Turbo-V%2081-AG%20Rack%20Controller.pdf.
7. Pfeiffer Vacuum PKR 360 Compact FullRange R© Gauge Operating Instructions: https:
//www.ajvs.com/library/Pfeiffer_Vacuum_PKR_361_IKR_361.pdf.
8. Pfeiffer Vacuum TPG 361, TPG 362, SingleGauge, DualGauge, Single- and Dual-ChannelMeasurement and Control Unit for ActiveLine Transmitter Operating Instructions: https://www.idealvac.com/files/brochures/TPG-361a.pdf.
1.2 Exercises
1. Calculate the density (i.e. number per cubic meter) of molecules at pressures of: a) 1atmosphere; b) 1 Torr; c) 1 mTorr; d) 10−6 Torr; e) 10−10 Torr (typical pressure inside aparticle accelerator storage ring).
1

2. Calculate the mean free path between collisions for the above pressure (an importantparameter for the design of a storage ring).
3. Calculate the number of molecules colliding on the wall per unit time for the abovepressures.
4. If all the molecules that hit the wall stick to the wall, how long does it take to build upa monolayer of gas molecules? (A monolayer of molecules is made of about 1015 moleculesper centimeter square.) This is the reason why modern surface studies require ultra highvacuum.
1.3 Further Reading
Xenon: The isotope-rich gift from the stars
Xenon is a noble gas. Like its more familiar brethren helium and neon, xenon does notactively engage in chemical reactions, although it can be coaxed into forming oxides andfluorides under the right conditions. It is also rather rare, existing in the earths atmosphereat parts-per-million (ppm) levels. Xenon is extracted from atmospheric gas via condensation.A large container of air is very gradually cooled to low temperatures; as the condensationtemperature of each component gas is reached, it will condense on the sides and bottom ofthe container where it can be separated out.
Xenon (Z=54) is also notable for having one of the largest numbers of abundant stableisotopes of any element. There are nine stable isotopes, at least five of which are reasonablyabundant in naturally occurring xenon, ranging in atomic mass from 124 to 136 (you mayneed to expand the m/q scale of the scan and the display; those menus can be accessed byright-clicking on the display). Each of these isotopes will be visible as a separate peak inyour mass spectrum.
Finally, we may ask where xenon comes from. The Big Bang produced only the lightestelements: hydrogen (Z=1), helium (Z=2) and a bit of lithium (Z=3). All heavier elementshave been produced inside stars. Elements up to Z=26 (iron) can be produced exothermi-cally by colliding lighter nuclei together, powering stars such as the Sun. But above iron,fusion processes become endothermic and thus cannot be a source of energy production instellar cores; the very heaviest elements, such as uranium and plutonium, in fact releaseenergy when they break down into smaller components by alpha decay or by fission. Thuseven the most massive stars, capable of producing enormous temperatures and pressures attheir centers, cannot fuse heavy elements in the same way that they fuse light elements. Infact, because of this limitation, the most massive stars die in supernova explosions when theircores run out of usable energy sources. But in supernovae, gravitational energy released bythe stars core collapse can be harnessed to activate these endothermic heavy-element fusionreactions, creating all the heavy elements in the Universe. The supernova then ejects thismaterial into space, where it coalesces into new stars and planets, enriched with silver, gold,lead, xenon and a wealth of other heavy elements.
Argon: Link to the Earths past
Argon (Z=18) is also a noble gas. It also does not participate readily in chemical reactions.
2

All the other noble gases, even the cosmically abundant helium, are rather rare on earth,and one would expect the same of argon.
But argon is the exception. Unlike helium, neon, krypton and xenon, argon is abundantin the earths atmosphere. Although it only comprises 1% of atmospheric gas, that is ordersof magnitude more than all the others put together. Further, while argon has three stableisotopes, well over 99% of the earths argon is of one isotope: 40Ar. (The abundances of theother argon isotopes are actually reasonably in line with the abundances of the other noblegases; 40Ar is the singular exception.)
Why is there so much 40Ar, and so little of any of the noble gas isotopes? It turnsout that 40Ar is continually produced in the earths crust by the reverse-beta decay of 40K.Potassium is one of the most abundant elements in the earths crust, and 40K is one of themost abundant radioactive isotopes on earth, with a lifetime of slightly over 1 billion years.(40K decay, and that of other natural radioisotopes, are the dominant source of geothermalenergy as well.)
This is extremely useful. Because 40Ar, like all the other noble gas isotopes, should beextraordinarily rare on earth, the radioactive decay of 40K is by far the dominant source ofatmospheric 40Ar. And, since it is a gas, a molten rock will expel any preexisting 40Ar beforeit cools. Thus, by measuring the ratio of 40K/40Ar in a rock you can determine how many40K lifetimes have elapsed since the rock solidified. Since the lifetime of 40K is over 1 billionyears, the history that can be obtained by potassium-argon dating stretches all the way backto the earths formation.
2 Operation Procedures
2.1 Overview
CAUTION: Read the instructions and equipment manuals carefully and follow the oper-ating procedures. Vacuum pumps are delicate instruments. Failure to follow the procedurescan result in damage to the pumps or to the mass spectrometer system.
The vacuum system in the EKA lab consists of three different vacuum pumps, a massspectrometer/residual gas analyzer, three vacuum gauges and ten valves of different types.Figure 1 shows the diagram of the vacuum system in this experiment. Figure 2 shows aphoto of the vacuum system with different equipments illustrated. Pay close attention tothe NOTES that follow, for they contain important safety information.
A diaphragm pump, located on the table that holds the vacuum system, is capable ofpumping the system from atmospheric pressure down to sub-Torr level. The two othervacuum pumps (turbomolecular and ion pumps) are high vacuum pumps, which can beoperated only when the pressure is already lowered by the diaphragm pump. In addition,when operating, the turbomolecular pump MUST be backed by the diaphragm pump (thebacking process will be described in Section 2.2). A diffusion pump, which is located belowthe table and is not connected to the vacuum system, is another type of high vacuum pump.The high vacuum pumps can pump down the system to ∼ 10−6 Torr and are typical of thosewidely used in laboratories to achieve high vacuum (below 10−6 Torr) and ultrahigh vacuum(below 10−9 Torr). There are many references available which describe each type of pump;
3

Figure 1: Diagram of the Vacuum System.
we will not describe them in detail here.NOTE: Even though it is there, we do not use the diffusion pump and the
ion pump in this experiment. We will only use the diaphragm pump and turbomolecularpump. Do not open the valve on top of the ion pump (V-2 in Figure 1) during the experiment,or else air will leak into the vacuum system, ruining your data and potentially damagingthe equipment. (This may be done to return the vacuum system to higher pressure betweentrials if all appropriate precautions are taken.)
NOTE: In order to use the turbomolecular pump, two conditions must bemet. (1) The system must first have been been rough pumped using the di-aphragm pump. (2) The backing valve between the turbomolecular pump andthe diaphragm pump (V-5 in Figure 1) must be open. This creates two levels of vac-uum: a high vacuum above the top of the turbo pump, and a rough vacuum connecting thebottom of the turbo pump to the diaphragm pump (which itself pumps out to atmosphere).Failure to properly rough the system and back the turbo pump can cause the turbo pump toburn out.
Three pressure gauges are used in this system to measure the pressure. A thermocouplegauge, which is located on one of the vacuum line ports between V-6 and V-7 and is connectedto the diaphragm pump via V-6, can measure pressure down to the mTorr range. A compactFullRange R© pressure gauge is used to measure a pressure range from 10−9 mbar to 1 bar.A compact cold cathode gauge, located between the turbo pump and V-5, is not used forpressure measurements in this experiment. The operation of both types of gauges, as withthe pumps, can be found in any reference on vacuum technology.
The quadrupole mass spectrometer/residual gas analyzer can determine the mass/chargeratios of the molecules in the vacuum system. Electrons are generated by a hot filament viathermionic emission. These electrons are accelerated in an applied electric field, producinga beam that ionizes (and potentially cracks) gas molecules. A varying electric field is used
4
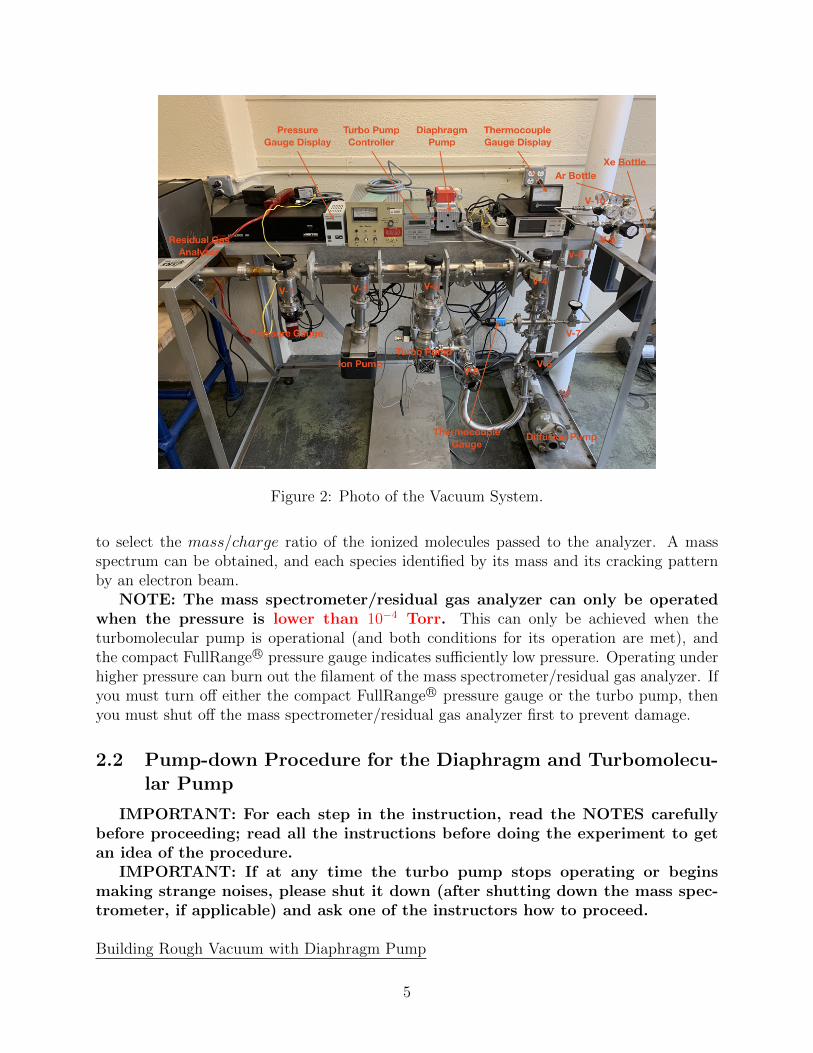
Figure 2: Photo of the Vacuum System.
to select the mass/charge ratio of the ionized molecules passed to the analyzer. A massspectrum can be obtained, and each species identified by its mass and its cracking patternby an electron beam.
NOTE: The mass spectrometer/residual gas analyzer can only be operatedwhen the pressure is lower than 10−4 Torr. This can only be achieved when theturbomolecular pump is operational (and both conditions for its operation are met), andthe compact FullRange R© pressure gauge indicates sufficiently low pressure. Operating underhigher pressure can burn out the filament of the mass spectrometer/residual gas analyzer. Ifyou must turn off either the compact FullRange R© pressure gauge or the turbo pump, thenyou must shut off the mass spectrometer/residual gas analyzer first to prevent damage.
2.2 Pump-down Procedure for the Diaphragm and Turbomolecu-lar Pump
IMPORTANT: For each step in the instruction, read the NOTES carefullybefore proceeding; read all the instructions before doing the experiment to getan idea of the procedure.
IMPORTANT: If at any time the turbo pump stops operating or beginsmaking strange noises, please shut it down (after shutting down the mass spec-trometer, if applicable) and ask one of the instructors how to proceed.
Building Rough Vacuum with Diaphragm Pump
5

NOTE: You must rough pump the vacuum system every time you come in tothe laboratory.
NOTE: This procedure to rough pump the vacuum system is not valid whenbringing the ion pump in operation. For that case, follow the procedures de-scribed in Section 2.4.
1. Make sure all other pumps and the residual gas analyzer are off. If appli-cable, open V-1, V-3, V-4, V-5, V-6, V-8, close V-2, V-7, V-9, V-10. CAUTION:Do not put too much torque on the valve handles if they reach either the openor closed end. Turn on the compact FullRange R© pressure gauge and display. Youwill use the display to take and output pressure data for analysis. Read the pressure gaugedisplay manual if you need help.
2. Turn on the diaphragm pump, which will start pumping down the vacuum sys-tem. Make sure that the pressure reading from the compact FullRange R© pressure gauge isdecreasing.
3. Use the pressure gauge display to take data of pressure as a function of time and outputit to a USB flash drive. The data will be used to demonstrate the exponential approach tothe ultimate pressure attainable with the diaphragm pump (see Section 3.2).
4. If you need to repeat the roughing process: make sure all other pumps and the residualgas analyzer are off, stop the diaphragm pump and repeat the above procedures.
NOTE: The system must be re-roughed if you leave the system for an ex-tended period without any pump running.
Building High Vacuum with Turbo Pump
1. To prepare the turbo pump for operation, the pressure in the line connected to theexhaust of the turbo pump must be decreased. This is accomplished by pumping this lineusing the diaphragm pump shown in the above procedures.
2. After the compact FullRange R© pressure gauge reads lower than 1 Torr,close V-3 and turn on the turbomolecular pump from its controller by pressingthe Start/Stop button. Wait for the turbo pump to reach its desired rotation frequency.You can check the rotation frequency by pressing the Measures button on the turbo pumpcontroller. The space between the turbo pump and the valve on top of the turbo pump (V-3)will then be of high vacuum. Monitor the reading of the compact FullRange R© pressure gauge,which now reads the pressure in the long vacuum channel pumped only by the diaphragmpump. The reading should decrease steadily.
3. If the turbo pump does not reach its desired rotation frequency or begins makingstrange noises, it could mean there is a problem with the pump. Shut down the pump andfind an instructor.
4. Close V-4, open the valve on top of the turbo pump (V-3) to connect theturbo pump to the vacuum chamber. High vacuum will start being built. The pressure ofthe system should eventually approach 10−4 Torr and below. When the pressure is < 10−4
Torr, the mass spectrometer/residual gas analyzer can be turned on (see Section 2.5).5. If you need to repeat the process of building the high vacuum from the rough vacuum
with the running diaphragm pump: make sure the mass spectrometer/residual gas analyzeris off, close V-3, open V-4, check that V-6 is open, wait for the pressure to stabilize and
6

repeat the above procedures.NOTE: Never turn off the diaphragm pump or let the system up to atmo-
sphere while the turbo pump is working.
2.3 Procedure for Shutting down the Turbo Pump
1. If applicable, turn off the mass spectrometer/residual gas analyzer. It couldbe broken if left to operate under higher pressures.
2. Check that the valve on top of the ion pump (V-2) is closed. The ion pump must beturned off before turning off any other pump or when letting gas into the system.
3. Close the valve on top of the turbo pump (V-3). If you need rough vacuumin the long vacuum channel, open V-4, check that V-6 is open.
4. Turn off the turbo pump by pressing the Start/Stop button on the turbopump controller.
5. The diaphragm pump can be turned off if all other pumps and the residualgas analyzer are off.
2.4 Procedure for Turning on/off the Ion Pump (Optional)
Turning on the Ion Pump
CAUTION: The ion pump uses high voltage, up to 6000 volts. Do not dis-connect or touch any of the cables while the pump is on.
CAUTION: Follow the procedure step-by-step, without leaving significanttime intervals between successive steps.
CAUTION: The ion pump must not be turned on until the pressure is lowerthan 10−4 Torr. This pressure is achieved using the turbo pump. However, when theion pump is initially connected to the vacuum chamber, the vacuum may be spoiled due toair contained within the ion pump. Keeping these facts in mind, you can understand thedetailed procedure that follows:
1. Make sure the ion pump is off.2. Turn off the mass spectrometer if it is on. It must be protected if a pressure
higher than safe for the instrument is created when opening the valve on top of the ion pump(V-2).
3. Close the valve on top of the turbo pump (V-3). You can leave the turbo pumpon, but must operate quickly. Open the valve on top of the ion pump (V-2). Whenopening the valve on top of the ion pump (V-2) and releasing any air contained within, thepressure may exceed even the limit bearable by the turbo pump. If the compact FullRange R©
pressure gauge reads higher than 1 Torr after opening V-2, rough pumping of the vacuumsystem using the diaphragm pump is necessary. Use steps 4 and 5 for rough pumping of thevacuum system. Skip the two steps if it is not necessary.
4. Close V-5. Open V-4 and check that V-6 is open. Wait until the pressure inthe compact FullRange R© pressure gauge reads lower than 1 Torr. This will take a little time.
5. Open V-5. Check that the turbo pump is on. If it is turned off at step 3, turnit on again from its controller by pressing the Start/Stop button. Wait for the turbo pump
7

to reach its desired rotation frequency. You can check the rotation frequency by pressing theMeasures button on the turbo pump controller. Close V-4.
6. Make sure the pressure in the compact FullRange R© pressure gauge readslower than 1 Torr. Open the valve on top of the turbo pump (V-3). This willconnect the turbo pump to the vacuum chamber.
7. Wait until the compact FullRange R© pressure gauge reads lower than 10−4
Torr.8. Put the start/protect switch on the ion pump controller to the start posi-
tion.9. Turn on the ion pump.10. Turn the knob on the ion pump controller to pressure, and the pressure
inside the ion pump can be read.11. Put the switch start/protect to protect position.12. Turn on the mass spectrometer/residual gas analyzer. Measurements of the
residual gas can be taken.NOTE: The ion pump can operate by itself without backing by mechanical
pump. However, make sure the valve on top of the ion pump (V-2) is closedwhen shutting down other pumps or letting any gas into the system.
Shutting down the Ion Pump
The ion pump can be left on all the time. Once operating, it does not need to be turnedoff. However, in cases when the pump has to be shut down:
1. Close the valve on top of the ion pump (V-2).2. Turn off the ion pump.
2.5 Procedure for Taking the Background Measurement beforeIntroducing the Xenon/Argon Gas
If you have followed the procedures in Section 2.2 for building rough and high vacuumwith V-8 open, you can jump to step 8 to take the background measurement. If V-8 hasbeen closed and the long vacuum channel has been pumped below 1 Torr and if you need topump the lines from V-8 up to V-9 and V-10 or the two bottle valves, use steps 1 to 7.
1. Make sure that the mass spectrometer/residual gas analyzer is off to preventpotential damage in operation under higher pressures.
2. Make sure that the valves on top of the high vacuum pumps (V-2, V-3)are closed. If they are not closed, close first the valve on top of the ion pump (V-2), thenthe valve on top of the turbo pump (V-3). If the turbo pump is on, you do not need to turnit off. The ion pump can be shut down, if applicable.
3. Make sure that the two bottle valves, V-9 and V-10 are closed.4. Close V-5 and open V-7 and check that V-6 is open. The diaphragm pump
will start pumping the lines from V-8 up to V-9 and V-10.5. Usually it is not necessary to pump the lines between V-9 and the Xe bottle and
between V-10 and the Ar bottle, but in case you need to do so, open V-9 and V-10, turn
8

both regulator pressure adjusting knobs clockwise slowly to connect the high pressure endsto the low pressure ends.
6. Wait for a few minutes and open V-5. If the turbo pump is off, turn on theturbo pump from its controller by pressing the Start/Stop button. Wait for theturbo pump to reach its desired rotation frequency. You can check the rotation frequencyby pressing the Measures button on the turbo pump controller.
7. Close V-7. Open the valve on top of the turbo pump (V-3). Open V-8slowly.
8. Wait until the compact FullRange R© pressure gauge reads lower than 10−4 Torr. If ap-plicable, turn both regulator pressure adjusting knobs counterclockwise slowly to disconnectthe low pressure ends from the high pressure ends and close V-9 and V-10. Close V-8 andwait for the pressure to stabilize at a value lower than 10−4 Torr. Turn on themass spectrometer/residual gas analyzer and take a measurement of the residualgas. Read the residual gas analyzer manual if you need help.
2.6 Procedure for Introducing Xenon/Argon Gas
NOTE: There is an arrow on the regulator pressure adjusting knob indicatingthe direction in which you need to rotate the knob in order to increase theregulator outlet pressure. This is the opposite of the common direction.
NOTE: You should inject one type of gas at a time. The procedures forinjecting the Xe gas are shown below. You should be able to figure out the onesfor injecting the Ar gas yourself since they are very similar.
If you have followed the procedures in Section 2.5 for taking the background measurementbefore introducing the Xe/Ar gas, you can jump to step 2 to inject Xe/Ar gas into the vacuumchamber and take a measurement of the residual gas. If not, start from step 1.
1. Make sure that the mass spectrometer/residual gas analyzer is off. Check that V-1,V-3, V-5 and V-6 are open and V-2, V-4, V-7, V-8, V-9 and V-10 are closed. Make sure thathigh vacuum has been reached in the vacuum chamber by the running turbo pump backed bythe diaphragm pump. Check that the lines from V-8 up to V-9 and V-10 has been pumped.Make sure no gas flows through the regulator by turning the regulator pressure adjustingknob counterclockwise until it turns freely. NOTE: do not overturn the knob, as whenit reaches the end of the course it stops completely. The regulator pressure adjustingknob has an adjusting spring. When the spring is uncompressed and the knob turns freely,the gas flow is completely stopped.
2. Open slightly the valve right on top of the compressed Xe gas bottle. Askan instructor to show you this.
3. Turn the regulator pressure adjusting knob as to finely increase the outletpressure. The pressure indicated by the outlet gauge of the regulator must be just a fewpsi (the needle indicator should jump across approximately one division). Closethe valve right on top of the compressed Xe gas bottle.
4. Open and close V-9 quickly. Xe gas will fill up to V-8. It is possible that thepressure measured by the compact FullRange R© pressure gauge increases slightly.
5. When the compact FullRange R© pressure gauge reads lower than 10−4 Torr,open very slightly V-8. Wait for the pressure to stabilize at a value lower than
9

10−4 Torr. Turn on the mass spectrometer/residual gas analyzer and take ameasurement of the residual gas. Read the residual gas analyzer manual if you needhelp.
6. When the measurement of the residual gas is finished, turn off the massspectrometer/residual gas analyzer. Close V-8. Turn the regulator pressureadjusting knob counterclockwise to completely stop the flow of gas.
7. If you need to switch to injecting the other type of gas, use steps 1 to 7 in Section 2.5to pump the lines from V-8 up to V-9 and V-10 and follow the procedures for injecting theAr gas.
3 Data Taking and Analysis
3.1 Overview
1. For the diaphragm pump and the turbo pump, measure the pressure as a function oftime and plot it to demonstrate the exponential approach to the ultimate pressure attainablefrom each pump.
2. Determine the components of the residual gas for the turbo pump. How does it differfrom the composition of air? Is it possible to see any of the minor isotopes of carbon oroxygen (i.e. 13C or 18O) or do other molecules of the same molecular weight obscure them?
3. Introduce a small amount of xenon gas into the vacuum system and measure theabundance of the nine stable Xe isotopes using the mass spectrometer/residual gas analyzer.CAUTION: Ask one of the instructors to work with you when you introducethe Xe gas into the vacuum system. Introducing too much Xe might damage the massspectrometer/residual gas analyzer. Measure at the masses of the known stable isotopesand at several masses where no contribution from Xe is expected; this will give you anothercheck on background. To keep the pressure within the range appropriate for the mass spec-trometer/residual gas analyzer, it is necessary to keep the turbo pump on while introducingthe gas. The total pressure may change during the course of the measurement and this willof course introduce an error in the relative abundance measurements. Think about howto compensate for this. Take five measurements of the isotopic abundance, some of whichshould be at widely varying total pressure; one background measurement should be takenbefore introducing the Xe for each measurement.
3.2 Determining Exponential Approach to Base Pressure
You will do this twice. First, you can use the compact FullRange R© pressure gauge tomeasure the pressure change over time with the running diaphragm pump only. Second, youcan use the compact FullRange R© pressure gauge to measure the pressure change over timewith the running turbo pump backed by the diaphragm pump. See Section 2.2 for specificprocedures to build vacuum.
The residual pressure as a function of time decreases exponentially from an initial pressuretoward a long-time baseline, or residual pressure Pr:
P (t) = P0e−kt + Pr (1)
10

where P (t = 0) = P0 +Pr is the initial pressure and k is the rate at which gas is pumpedout.
You do not need to worry about starting your count at exactly t = 0. The exponentialfunction is self-similar: no matter what moment you call t = 0, you will always see the sameexponential function with the same k; different starting times are accommodated by a changein the coefficient P0 (i.e. the initial pressure). (For this reason an ensemble of radioactiveatoms with characteristic lifetime T will, on average, survive for a time T from when youstart observing them, no matter how long they were sitting there before you started counting.The only cost of delaying your measurement is that fewer atoms would be left.)
Note that this is an overly simplistic model, though. In reality, atmospheric gas has manycomponents which are pumped out at their own characteristic rates (H2O, for example, isnotoriously slow to pump), so a better function to use may be of the form:
P (t) = P0e−k0t + P1e
−k1t + Pr (2)
which would allow for two components. The need for such a function is usually apparentbecause of a fast front end at early times which does not fit well to a single exponential.You should make sure to select initial guesses for k0 and k1 which are well separated fromone another in order to prevent the two k′s from converging and playing off of one other andgiving a pathological fit. (For this reason, simultaneously fitting more than two exponentialsis usually asking for trouble.)
Another alternative: It can be shown that a sum of multiple exponentials with differentks can be represented as a stretched exponential:
P (t) = P0e−(kt)β + Pr (3)
where 0 < β < 1 is the exponent of the exponent. The stretched exponential is a gen-eralization of the familiar cases β = 1 (simple exponential) and β = 2 (Gaussian). Butbeware that this function becomes increasingly pathological as β → 0. In addition, whilethe stretched exponential is an extremely good phenomenological fit function with wide ap-plicability, it is often difficult to extract meaningful physical information, so you may fit yourdata beautifully but be unable to make any physically useful statements.
3.3 Performing Residual Gas Analysis of Atmospheric Gas
Once you have finished the procedures in Section 2.2 and the vacuum chamber pressurehas reached lower than 10−4 Torr, you are ready to turn on the mass spectrometer/residualgas analyzer and collect data using the SRS RGA Windows software on the computer.
The software is rather straightforward, although the instructors can help you in case oftrouble. Most menus can be accessed from the top menu bar, or by right-clicking on thedisplay.
On the x axis is plotted the mass/charge ratio of the observed molecules. On the y axisis the abundance of molecules at that specific mass/charge ratio. Different species are seenas Gaussian-shaped peaks in the mass spectrum.
If you mouse over an individual peak, the computer will give a list of suggested species atthat mass/charge ratio. The software is intended for a wide range of research and industrial
11

applications, so the list of suggestions is much broader than what we will encounter. Althoughthe program may suggest species such as toluene, methane, freon, carbon monoxide, andother nasty substances, the only molecules we will see are those present in abundance in theearths atmosphere and those substances that we introduce into the system; the two chiefexamples of the latter are the xenon and argon gases we will introduce into the system inthe last part of the experiment, and various types of oil used in the vacuum system. Thevarious pump oils generally have m/q in the 40s through 70s, and some of the more commontypes are indicated in the list of suggestions.
Also, since some species are pumped out more easily than others, there is no reason toexpect that the composition of residual gas will be identical to that of atmospheric gas.Certain gases, such as O2 and N2, for example, are pumped out relatively efficiently, whereasH2O is very difficult to pump and will be over-represented in your spectrum.
The species are ionized, and possibly dissociated, by the mass spectrometers electric field.Therefore, it is reasonable to see radicals such as H+ and OH– produced by the breakup ofH2O, as well as doubly ionized species such as N2
++ at half the expected m/q ratio.If the peaks are not centered on integer values of m/q, the spectrometer needs to be
calibrated in the software. Ask an instructor to help with this.Additionally, you may be able to see less common isotopes of some common elements,
such as 13C or 17O. If so, it may be possible to estimate the isotopic ratio by comparingthe height of the two peaks. Since they are very close, they will almost certainly overlap(the smaller peak will appear as a shoulder to the larger peak). Thus, in order to accuratelyextract the intensities, youll need to fit each peak to a Gaussian curve:
y(x) = Ae−(x−x0)
2
2σ2 (4)
where A is the intensity, σ is the width (which should be the same for nearby peaks),and x0 is the center of the peak (which may or may not correspond to an integer dependingon the accuracy of calibration). Overlapping peaks should be simultaneously fit to a sum oftwo or more Gaussians in order to get the best estimates of abundances.
Saving Data with the Mass Spectrometer Program
It is possible to save your spectra in an ASCII text format, so that you may analyze themlater with a program of your choice. To do so, select Save Data under the File menu. Thereare several options for saving your data in various formats, so we suggest that you checkyour saved data files before clearing the screen to ensure that they have saved satisfactorily.
3.4 Measurements of Introduced Xenon and Argon Gas
In the final part of the experiment, you will introduce xenon and argon gases which arenot appreciably present in the atmosphere. Both are interesting for various reasons. SeeSection 1.3 for some interesting materials on xenon and argon. In order to see the effects ofthese two gases, you will make a background measurement before introducing the gas, anda measurement after introducing the gas. The detailed procedures for introducing the gasare given in Section 2.6.
12

Your main goal will be to determine the abundances of each of the principal isotopes ofeach gas. Since xenon will likely yield more useful data, we suggest that you try it first.
Since in many cases the m/q peaks will overlap, you will need to fit Gaussian curves toeach peak in order to reliably extract the relative abundances. Keep in mind that the foreach peak in that region should be approximately the same, so if you fit one clear peak, youcan use the same value of σ for the rest, even if they are not clearly separable. Also keepin mind that if one clear peak has a non-integer center (say, displaced by +0.27 from theclosest integer), then the other peaks will be displaced by approximately the same amountas well; this means you only have to fit the amplitude (one free parameter) in such cases.
Once you determine the relative abundances of the visible xenon isotopes, you shouldcompare your values to the accepted values for atmospheric xenon.
Once you have done xenon, next try argon, although because of the dominance of 40Ar,you may not have much luck.
13