el niño effects in the palmyra atoll region: … · el nin˜o effects in the palmyra atoll region:...
TRANSCRIPT
El Nino effects in the Palmyra Atoll region: oceanographicchanges and bigeye tuna (Thunnus obesus) catch ratevariability
EVAN A. HOWELL1* ANDDONALD R. KOBAYASHI1,2
1Ecosystems and Oceanography Division, Pacific Islands FisheriesScience Center, NMFS, NOAA, 2570 Dole Street, Honolulu,
HI 96822, USA2Department of Environmental Sciences, University ofTechnology, Sydney, Broadway, NSW, Australia
ABSTRACT
A generalized additive model (GAM) was constructedto separate and quantify the effects of fishery-based(operational) and oceanographic parameters on thebigeye tuna (Thunnus obesus) catch rates at PalmyraAtoll in the central Tropical Pacific. Bigeye catch, thenumber of hooks per set, and set location from 4884longline sets spanning January 1994 to December 2003were used with a temporally corresponding El Nino-Southern Oscillation (ENSO) indicator built from seasurface height (SSH) data. Observations of environ-mental data combined with the results from the GAMindicated that there is an increase in bigeye catch ratescorresponding to an increase in eastward advectionduring the winter months of El Nino events. A sea-sonal pattern with higher bigeye catch rates fromDecember to April and a spatial pattern with higherrates to the northeast and northwest of the atoll wereobserved during this study period. It is hypothesizedthat the combination of the eastward advection of thewarm pool coupled with vertical changes in tempera-ture during the winter months of El Nino events in-creases the availability of bigeye tuna in this region.This increase in availability may be due to a change inexploitable population size, location, or both.
Key words: bigeye tuna, El Nino, empiricalorthogonal function, fishery oceanography,generalized additive model, Palmyra Atoll
INTRODUCTION
Palmyra Atoll, in the central Tropical Pacific, isroughly 960 nautical miles south of Honolulu, Hawaii.This region is situated close to the convergence areabetween the warm, less saline western waters (warmpool) and the cold, more saline eastern water (coldtongue) with climate dominated by El Nino-SouthernOscillation (ENSO) events. The Hawaiian longlinefishery operates mainly in the central Pacific Oceantargeting swordfish (Xiphias gladius), bigeye tuna(Thunnus obesus), and yellowfin tuna (Thunnus alba-cares) and since 1998 much effort has been directed atthe area around Palmyra Atoll. The species composi-tion of the catch in this region is dominated by yel-lowfin tuna and higher market value bigeye tuna (Itoand Machado, 1999), with observed large interannualvariability of both species. The appearance of ENSOresults in large-scale oceanographic fluctuations with ashift of the convergence zone to the east of PalmyraAtoll during El Nino (warm) and to the west during LaNina (cold) events (Picaut et al., 1996). The effect ofENSO-induced oceanographic fluctuations on themigration of tuna throughout the Pacific has been welldocumented (Lehodey et al., 1997, 1998; Polovinaet al., 2001), with skipjack tunas in the equatorialareas following the east–west movement of the warm-pool/cold-tongue convergence zone, yet the import-ance of ENSO on bigeye tuna is not well documentedfor this region.
Generalized additive models (GAMs) are a relat-ively new analytical technique (Hastie and Tibshirani,1990) and have been utilized in previous fisherystudies involving fish surveys (Swartzman et al., 1992),catch rates (catch per set) (Walsh and Kleiber,2001; Walsh et al., 2002), and catch-per-unit-effort(CPUE) (Bigelow et al., 1999). We use a GAM toquantify and describe the effects of fisheries opera-tional and oceanographic variables on bigeye catchrates in the Palmyra Atoll area from 1994 to 2003.A descriptive model of bigeye tuna catch in thePalmyra Atoll region would help in understandingthe effects of El Nino on the regional oceanographyand their relationship to longline fishery dynamics in
*Correspondence. e-mail: [email protected]
Received 19 January 2005
Revised version accepted 17 August 2005
FISHERIES OCEANOGRAPHY Fish. Oceanogr. 15:6, 477–489, 2006
� 2006 Blackwell Publishing Ltd. doi:10.1111/j.1365-2419.2005.00397.x 477

this apparently productive but remote and dynamicarea.
DATA AND METHODS
Longline fishery data
Hawaii-based longline fishing activity from January1994 through September 2003 was examined using thefederally mandated longline logbook data provided bythe Fishery Monitoring and Economics Program(FMEP) of the National Marine Fisheries Service(NMFS), and Pacific Islands Fisheries Science Center(PIFSC). Logbook data were parsed to provide recordsof longline fishing sets within the Palmyra Atoll re-gion (158–167�W, 4–9�N) (Fig. 1). A total of 4884longline sets were deployed in the Palmyra region from1994 through 2003. Previous work to assess the accu-racy of bigeye catch data in the federal logbooksreported that approximately 90% of longline sets hadan error of ±2 fish reported when compared to thefederally mandated longline observer data set (r2 ¼0.941; Walsh, 2000). Correlations were also high forset month (r2 ¼ 0.954), the number of hooks (r2 ¼0.91), latitude (r2 ¼ 0.997), and longitude (r2 ¼0.989; Walsh, NMFS, Hawaii, personal communica-tion). Nominal CPUE was plotted to show the tem-poral variability in catch rates without the effect ofany change in the number of hooks per set. We cal-culated the nominal CPUE for each set by
CPUE ¼ ðkþ dÞn
; ð1Þ
where k is the number of kept bigeye tuna per set, d thenumber of discarded bigeye tuna per set, and n is thehooks per set. The fishery-dependent predictor varia-bles used in the model were all taken as the corres-ponding value for each particular set. Historically, asuite of longline predictors including the date of set,latitude, longitude, number of hooks, set time, andnumber of light sticks per hook (Bigelow et al., 1999;Walsh et al., 2002) have been used to build a des-criptive model. Attempting to use all of the availableinformation in addition to our environmental datawould result in a model susceptible to correlationeffects and overparameterization, in addition todecreasing the model’s predictive power. To avoidthese problems and to keep the model as parsimoniousas possible, certain fishery-based predictors were
discarded. The number of light sticks is a usefulparameter in most studies, yet 98.5% of our study setsreported zero light sticks. The time the gear was set(set time) was not used because 89.5% of the sets wereinitiated in the limited time window between 0600and 0900 (i.e., daytime sets). The model also foundthese two predictors to be unimportant. Four fishery-dependent predictor variables were used in the model.Set month corresponded to the month of the haulingof the gear, set number of hooks was the number ofhooks deployed per set, and the set latitude and lon-gitude values were the average value of the setting andthe hauling of the gear.
Environmental predictor data
Sea surface height (SSH) data were mapped at aglobal 0.3� by 0.3� resolution with orbit errorreduction provided by the Ssalto program of theCentre National d’etudes Spatiales, France. Thisaltimetry product is a weekly average of the measuredalong-track sea-level profiles mapped to a mercatorprojection. The average of these along-track profilesfrom 1993 to 1998 was used to create a mean profilethat was then subtracted from the mapped product toobtain the sea-level anomalies. For the time periodOctober 1992 to July 2002 data from the TOPEX/POSEIDON altimeter were used. After July 2002JASON-1 was put into operation along the sameorbit as TOPEX/POSEIDON, and from this dateforward its data were used in the study. To computethe geostrophic currents, the 1994 NODC WorldOcean Atlas Levitus long-term mean 1000-mdynamic height data set was added to the SSHanomaly files to create an ‘absolute’ SSH. The east–west (x) and north–south (y) gradients, dz
dx and dzdy,
were derived from this height (z) and subsequentlyused to calculate the east–west (u) and north–south(v) components of the geostrophic current, as des-cribed by Polovina et al. (1999).
Subsurface temperature data used in this study werecollected by ATLAS buoys within the TropicalAtmosphere-Ocean (TAO) program. TAO subsurfacetemperature data were measured by thermistors atconstant depths moored to buoys at specific locationsin the equatorial Pacific. Data were delivered at a rateof 1–10 samples per minute and averaged to a dailyvalue. The depth of the 20�C isotherm is calculatedfrom temperature profiles using linear interpolation ofdepth versus temperature.
Figure 1. (a) The total number of hooks set in the Hawaii-based longline fishery from 1994 to 2003. (b) Total hooks set in thePalmyra region from 1994 to 2003. In both figures data were resampled to 1� · 1� grid points and cells with less than three totalsets were deleted to maintain confidentiality.
478 E.A. Howell and D.R. Kobayashi
� 2006 Blackwell Publishing Ltd, Fish. Oceanogr., 15:6, 477–489.

El Nino and bigeye tuna at Palmyra Atoll 479
� 2006 Blackwell Publishing Ltd, Fish. Oceanogr., 15:6, 477–489.

Empirical orthogonal function analysis
Empirical orthogonal function (EOF) analysis wasperformed to construct an indicator of ENSO activityin the equatorial region on the SSH data set from 1994to 2003. This technique has been previously describedin detail (Polovina and Howell, 2005), and a shor-tened form is included here for descriptive purposes.The time series of monthly SSH was detrended andstandardized by removing the average monthly signaland subtracting the long-term mean. Land values wereremoved to create the final detrended matrix F(x,t),which was then decomposed using the form
Fðx; tÞ ¼XN
i¼1
aiðtÞ/iðxÞ; ð2Þ
where ai(t) are the principal components (PCs)(temporal expansion coefficients) of the spatial com-ponents /i(x) (Wilson and Adamec, 2001). Thisanalysis results in N statistical modes, each with avector of PC expansion coefficients ai and a corres-ponding spatial component map /i. Each of thesemaps represents a standing oscillation, and theexpansion coefficients represent how this patternoscillates through time. These modes are orthogonaland by definition uncorrelated with each other. EOFanalysis is a purely statistical technique and there is noreason for the basis functions to be associated withphysical forcings, yet the first modes often correspondto underlying processes (Uddstrom and Oien, 1999).
Generalized additive models
A GAM is a generalized linear model (GLM) in whichthe linear predictor is given by a user-specified sum ofsmooth functions of the covariates plus a conventionalparametric component of the linear predictor (Wood,2000). GAMs are useful when the predictor variableshave non-linear effects upon the response variable. Forexample, longline catch rates have been shown to bestrongly influenced by many different biological,environmental, and operational characteristics, oftenwith highly non-linear effects (e.g., Bigelow et al.,1999; Walsh and Kleiber, 2001; Walsh et al., 2002).Some variables relate to catchability (e.g., gear per-formance), while others may relate to availability (e.g.,fish abundance/seasonality). These effects are consid-ered additive, and the GAM can be used to predictbigeye catch rates given a set of predictor variables fora particular set of longline fishing gear.
GAMs were constructed in the R programmingenvironment using the gam function of the mgcvpackage (Wood, 2000). Model building was donemanually to avoid problems that can arise in auto-
mated selection procedures (Harrell, 2001). TheGAMs were fit in the form
gðuiÞ ¼ b0 þ s1ðx1iÞ þ s2ðx2iÞ þ � � � snðxniÞ; ð3Þ
where g is the link function, ui the expected value ofthe dependent variable (here bigeye catch per set), b0
is a constant, and each sn is a smooth function ofcovariate xn. Catch rates follow a continuous distri-bution so we chose Gaussian as the family, which isassociated with an identity link function. The catchrate data were log transformed to keep variance con-stant. To account for zero catch-rate values, a value of1 was added to all sets before the log transformation. Anormal probability plot of the cumulative distributionof the residuals indicates that our assumption of aGaussian distribution was appropriate. The smoothfunctions were penalized thin plate splines, whichallow for ease in model selection from the generalizedcross-validation (GCV) score (analogous to the Aka-ike information criterion), which is defined as
GCV ¼ nD
ðn� dfÞ2; ð4Þ
where n is the number of samples, D the deviance, anddf is the effective degrees of freedom of the model. Thefinal model using the five predictors described previ-ously was of the form
E½logeðBigeyeþ 1Þ� ¼ b0 þ sðMonthÞ þ sðNumhooksÞþ sðEOFÞ þ sðLon, LatÞ; ð5Þ
where the four fishery dependent predictors were aspreviously described and EOF referring to the PC timeseries of the empirical orthogonal analysis on SSH. Allpredictors were modeled as continuous variables. Thedependence on spatial location was modeled as abivariate function of longitude and latitude ratherthan summing the univariate effects of these twovariables, as suggested by Wood and Augustin (2002).
RESULTS
Fishery variability
Minimal longline effort took place in the PalmyraAtoll area before 1998, followed by an increase in theamount of hooks set from 1998 to 2003 (Fig. 2). Thepercentage of hooks in the entire Hawaii-based long-line fishery set in the Palmyra region each year fol-lowed a similar trend (Fig. 2). An average of 1.6% ofthe total hooks set was in this area before 1998, 10.0%in 1998, and an average of 7.4% from 1999 to 2002.Less than 1% of the total effort was in the Palmyraregion in 2003. Most trips and corresponding sets
480 E.A. Howell and D.R. Kobayashi
� 2006 Blackwell Publishing Ltd, Fish. Oceanogr., 15:6, 477–489.

occur in the first half of the year, with an exception in2000–01 where over 50% of the effort was in the thirdquarter (Fig. 2). In all years less than 15% of thefourth quarter effort occurs in this region. Spatially,historical effort from 1994 to 2003 was broad acrossthe area with a high concentration of effort to thenorth, east, and northeast of the atoll (Fig. 1b).
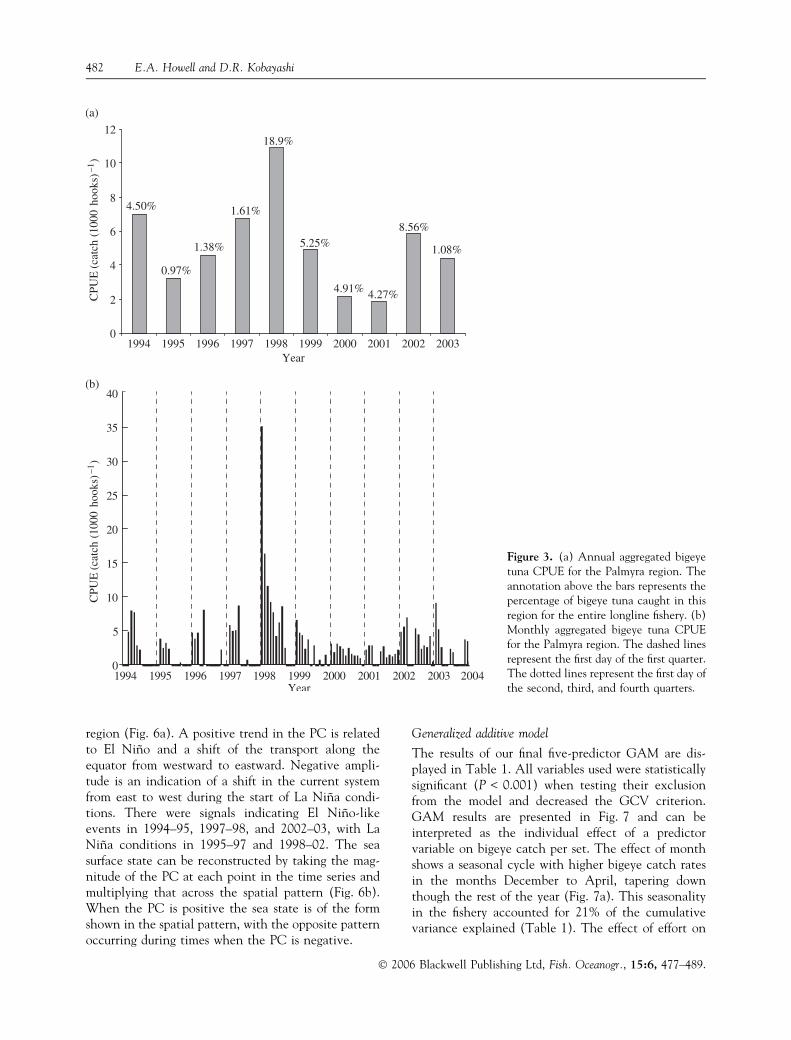
The annual CPUE values for bigeye tuna in thePalmyra region are shown in Fig. 3a. Values weremoderate prior to 1998, high in 1998 (18.9% of allbigeye caught in the fishery), declined from 1999 to2001, and were at moderate levels during 2002 and2003. A time series of the monthly CPUE values isplotted to assess the seasonal variability (Fig. 3b).Moderate CPUE values were found for the first twoquarters (January–June) in all years, with a slight de-cline in 1999–01. CPUE values remained highthroughout the first three quarters (January–Septem-ber) of 1998 but were moderate in 2002. The highestbigeye CPUE values for the region were found in thefirst quarters of 1998 and 2003, years of strong andmoderate El Nino conditions, respectively.
Environmental variability
The area around the Palmyra region is heavilyaffected by ENSO events on varying interannualscales. Time-series diagrams of the depths of the20�C isotherm (here used as a proxy for thermoclinedepth), interpolated from individual TAO buoys oneach of the four corners of the Palmyra region, areshown in Fig. 4. The depth of this feature at 8�N,170�W was between 90 and 160 m and was slightly
shallower during the 1994–95 and 2002–03 El Ninoevents. A slight decrease was observed during the LaNina period from 1998 to 2002 following the largesignal jump from the 1997 to 1998 El Nino. Thedepth of the 20�C isotherm appeared to have moreinterannual variability at 8�N, 155�W, with depthsranging from 60 to 160 m. Signal increases wereobserved during the three El Nino events during thestudy, with a larger signal increase (shoaling of theisotherm) in the 1997–98 El Nino than the 1994–95and 2002–03 events. The 20�C isotherm at 5�N,170�W was on average deeper than at both northernlocations, with depths ranging from 110 to 220 m.There was more intra-annual variability at thislocation which masked any El Nino effects otherthan the slight increase observed during 1997–98.The isotherm at 5�N, 155�W was slightly shallowerthan at 5�N, 170�W, with depths ranging from 80 to220 m. Intra-annual variability again dominated thesignal with slight shoaling of the isotherm duringthe 1997–98 El Nino event. These data show thatthe isotherm across the Palmyra region had a verticalgradient from west (deeper) to east (shallower) andfrom south (deeper) to north (shallower). During ElNino events the vertical gradient increased from 5 to8�N with an overall rise of up to 70 m at 8�N during1997–98. This spatial gradient and its effect on thedistribution of bigeye catch during the 1997–98 ElNino are shown in Fig. 5. Satellite imagery of SSHand calculated geostrophic currents show the highgradients between 5 and 8�N during this time period.Strong eastward flow is observed at 6�N duringJanuary, 1998 (Fig. 5a) with two large cold core eddyfeatures centered between 8 and 10�N which cor-responded to a shoaling of the thermocline capturedin the 20�C isotherm time series at 8�N. Through thenext 5-month period (Fig. 5b–f) the reversal ofthe current system is evident, with an inversion ofthe SSH gradients and a movement of the bigeyecatch locations to the west. As the current reversed awarm core eddy feature developed (Fig. 5d) whichappeared to constrain the bigeye catch to this regionnorth of Palmyra Atoll. This feature moved slightlyeast in May 1998 (Fig. 5e), and by June 1998 thereversal to westward flow from La Nina conditionswas complete with minimal bigeye catch in this re-gion.
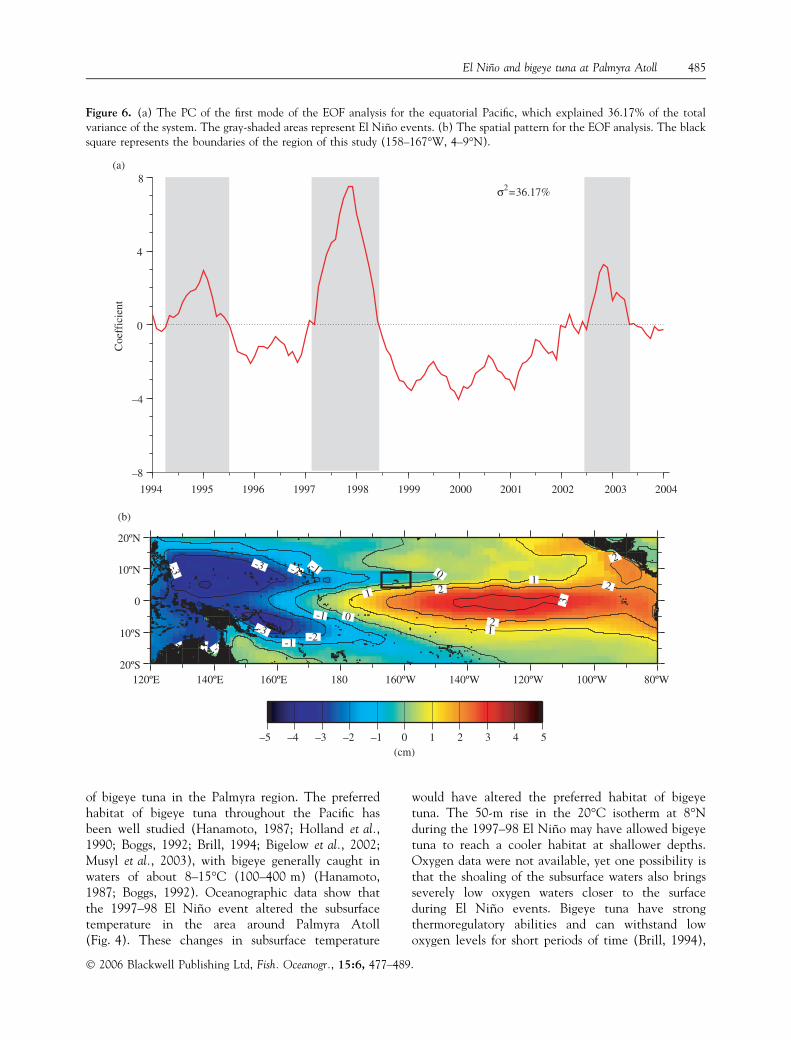
EOF analysis of the monthly SSH shows the scopeand changes in SSH over the entire equatorial regionthrough time. The first mode of our EOF analysisdescribed 36.7% of the variance in the system. ENSOevents are marked by changes in the amplitude of thePC of the first mode of the SSH EOF for the equatorial
Figure 2. Annual effort for the Palmyra region by quarter.The annotation above the bars represents the percentage ofeffort set in this region for the entire longline fishery.
El Nino and bigeye tuna at Palmyra Atoll 481
� 2006 Blackwell Publishing Ltd, Fish. Oceanogr., 15:6, 477–489.
region (Fig. 6a). A positive trend in the PC is relatedto El Nino and a shift of the transport along theequator from westward to eastward. Negative ampli-tude is an indication of a shift in the current systemfrom east to west during the start of La Nina condi-tions. There were signals indicating El Nino-likeevents in 1994–95, 1997–98, and 2002–03, with LaNina conditions in 1995–97 and 1998–02. The seasurface state can be reconstructed by taking the mag-nitude of the PC at each point in the time series andmultiplying that across the spatial pattern (Fig. 6b).When the PC is positive the sea state is of the formshown in the spatial pattern, with the opposite patternoccurring during times when the PC is negative.
Generalized additive model
The results of our final five-predictor GAM are dis-played in Table 1. All variables used were statisticallysignificant (P < 0.001) when testing their exclusionfrom the model and decreased the GCV criterion.GAM results are presented in Fig. 7 and can beinterpreted as the individual effect of a predictorvariable on bigeye catch per set. The effect of monthshows a seasonal cycle with higher bigeye catch ratesin the months December to April, tapering downthough the rest of the year (Fig. 7a). This seasonalityin the fishery accounted for 21% of the cumulativevariance explained (Table 1). The effect of effort on
Figure 3. (a) Annual aggregated bigeyetuna CPUE for the Palmyra region. Theannotation above the bars represents thepercentage of bigeye tuna caught in thisregion for the entire longline fishery. (b)Monthly aggregated bigeye tuna CPUEfor the Palmyra region. The dashed linesrepresent the first day of the first quarter.The dotted lines represent the first day ofthe second, third, and fourth quarters.
482 E.A. Howell and D.R. Kobayashi
� 2006 Blackwell Publishing Ltd, Fish. Oceanogr., 15:6, 477–489.

catch rates increases linearly for sets with less than2000 hooks (7b), with a decrease in the slope in setsabove this. There is a slight increase in the effect onsets with more than 3000 hooks but this is at theextremes of our data set, indicated by the large spreadin our confidence intervals. This effect had less influ-ence on the catch rates as reflected by the small in-crease in explained cumulative deviance and a smalldecrease in the residuals (Table 1). The effect of ElNino events on catch rates was captured in our EOFindicator variable, where large positive values reflectstrong El Nino conditions in the study region andcorrespond to the highest effect on bigeye catch rates(Fig. 7c). This variable increased the explainedcumulative deviance by 10% and resulted in a majorreduction in the residuals (Table 1). The results fromthe modeled longitude–latitude interaction term(Fig. 7d) show the pattern of the spatial effect. Higheffects on catch rates were found to the northeast,
northwest, and south of the atoll, with the northeastarea corresponding to the area of highest historicaleffort. A low effect on catch rates was observed in thearea immediately surrounding the atoll and zonallyfrom 7 to 9�N. The results of the model fits can be seenin Fig. 8a. The correlation between each observedvalue and GAM prediction was r2 ¼ 0.35 (N ¼ 4844)when computed on a set-by-set basis. For ease ofinterpretation, observed and GAM-derived sets werefolded into monthly values. After this averaging,temporal patterns in the model’s ability to fit becameapparent while the correlation between the two datasets increased (r2 ¼ 0.78, Fig. 8a). A Q–Q plot ofthese monthly observed versus the monthly modelpredicted catch rates shows non-normality in the dataextremes (Fig. 8b). The model overestimates sets witheither no or low bigeye catch reported, while under-estimating sets with higher than average (l ¼ 9.84)bigeye caught per set.
Figure 4. Time series of the depth of the 20�C isotherm measured by the TAO array for (a) 8�N, 170�W; (b) 8�N, 155�W; 5�N,170�W; 5�N, 155�W. The solid line in each graph represents a 2 month moving average.
El Nino and bigeye tuna at Palmyra Atoll 483
� 2006 Blackwell Publishing Ltd, Fish. Oceanogr., 15:6, 477–489.

DISCUSSION
Results from the GAM show that the El Nino eventsare statistically important in generating high catch
rates for the Hawaii-based longline fishery. Themechanism for this is more difficult to uncover, as ElNino effects may drive a vertical shift, a horizontalshift, or some combination of both in the distribution
Figure 5. SSH with geostrophic currents (vectors) for (a) January 1998; (b) February 1998; (c) March 1998; (d) April 1998; (e)May 1998; (f) June 1998. The black lines indicate the contour lines of the SSH with Levitus climatology added. The blackcircles represent the summation of bigeye catch per set in 1� · 1� cells. To maintain confidentiality cells with less than threetotal sets were removed. The black star represents Palmyra Atoll.
484 E.A. Howell and D.R. Kobayashi
� 2006 Blackwell Publishing Ltd, Fish. Oceanogr., 15:6, 477–489.
of bigeye tuna in the Palmyra region. The preferredhabitat of bigeye tuna throughout the Pacific hasbeen well studied (Hanamoto, 1987; Holland et al.,1990; Boggs, 1992; Brill, 1994; Bigelow et al., 2002;Musyl et al., 2003), with bigeye generally caught inwaters of about 8–15�C (100–400 m) (Hanamoto,1987; Boggs, 1992). Oceanographic data show thatthe 1997–98 El Nino event altered the subsurfacetemperature in the area around Palmyra Atoll(Fig. 4). These changes in subsurface temperature
would have altered the preferred habitat of bigeyetuna. The 50-m rise in the 20�C isotherm at 8�Nduring the 1997–98 El Nino may have allowed bigeyetuna to reach a cooler habitat at shallower depths.Oxygen data were not available, yet one possibility isthat the shoaling of the subsurface waters also bringsseverely low oxygen waters closer to the surfaceduring El Nino events. Bigeye tuna have strongthermoregulatory abilities and can withstand lowoxygen levels for short periods of time (Brill, 1994),
Figure 6. (a) The PC of the first mode of the EOF analysis for the equatorial Pacific, which explained 36.17% of the totalvariance of the system. The gray-shaded areas represent El Nino events. (b) The spatial pattern for the EOF analysis. The blacksquare represents the boundaries of the region of this study (158–167�W, 4–9�N).
El Nino and bigeye tuna at Palmyra Atoll 485
� 2006 Blackwell Publishing Ltd, Fish. Oceanogr., 15:6, 477–489.

allowing a greater vertical range of habitat whereother species may be limited by depth. The mecha-nisms that alter the subsurface environment may alsoaffect the longline gear. A strong SSH gradient waspresent in the Palmyra region during the 1997–98 ElNino as seen in our EOF analysis. This gradientrepresented an increase in the geostrophic
(subsurface) flow that may increase shoaling oflongline sets, effectively placing the gear at shallowerdepths. Longline fisherman generally set their gear ina consistent configuration in this area, so environ-mental forcing on the gear may be important. Eco-logical factors such as predator avoidance may also beimportant during these times.
Table 1. Analysis of deviance of a fivevariable GAM of bigeye tuna catch rates(catch per set). DGCV represents thechange in the GCV score.Predictor variable df DGCV DResiduals P values
Cumulativedevianceexplained
Set month 5.63 0.865 3665.698 <2.22 · 10)16 21.40%Set number of hooks 5.81 )0.011 )32.793 4.49 · 10)13 22.60%EOF 8.32 )0.104 )273.041 <2.22 · 10)16 32.30%(Lon, Lat) 25.52 )0.038 )109.596 <2.22 · 10)16 36.40%
Figure 7. The GAM-derived effect on bigeye tuna catch per set of (a): set month; (b): the number of hooks per set; (c): the PCtime series of the EOF analysis on SSH; (d): the bivariate spatial (longitude–latitude) term. The color underlay represents the1� · 1� grid of the historical effort.
486 E.A. Howell and D.R. Kobayashi
� 2006 Blackwell Publishing Ltd, Fish. Oceanogr., 15:6, 477–489.

Horizontal shifts in distribution or habitat may alsoexplain enhanced catch rates during El Nino events. Areversal in the overall transport of the surface layerand subsurface layer below the thermocline at theequator was also observed during this El Nino event(Johnson and McPhaden, 2000). Transport was east-ward for both layers from the boreal spring throughboreal fall 1997, reversing westward in boreal spring1998 until boreal fall 1998. A preferred habitat basedon temperature or forage may then be advected eastwith this horizontal shift in transport. Tagging studiesof skipjack tuna showed west to east movement duringthe 1991–92 El Nino event (Lehodey et al., 1997).
These results were also observed by modeling themovement of skipjack forage during El Nino events(Lehodey et al., 1998). Although, skipjack tuna aregenerally caught in depth ranges less than 100 m(Boggs, 1992) they may be used here to illustrate themechanism for lateral migration of bigeye tuna in ElNino events. A consolidation of prey assemblages inthis region from strong currents and eddy activity mayincrease the residence time of bigeye in this region.
One inherent problem in the longline logbook datais the absence of basic biological information such asfish length, weight, or sex. This makes it difficult todecipher the exact mechanisms for this increase inbigeye catch rates during El Nino events. Size orweight distribution data could provide insight as to thecomposition of age structure, separating the adultbigeye from new recruits in the area. While the log-book data lacks such information, there are othersources of size information such as the longline vesselobserver program and auction/dealer reports. How-ever, for the year of interest (1998) there was <5%observer coverage in the Palmyra region, with too fewfish measured for meaningful comparisons. Auction/dealer reports contain aggregated landing summariesfrom a particular trip, and fish from individual sets arenot tracked in the data; hence, auction/dealer reportsare of limited use in mapping size distributions overtime and space. Current observer coverage is 20–40%,and we eagerly look forward to examining bigeye sizestructure with the next El Nino event.
There may also be an increase in catch rates due togreater efficiency of the vessels since 1994. Effortincreased substantially in 1998 as vessels began totarget tuna species instead of swordfish, resulting incompletely different gear assemblages and placement.Experience and enhanced knowledge of the fishinggrounds over time would also result in a rise in effi-ciency, yet this may be offset by strong El Nino eventswhich would form anomalous environmental condi-tions and alter gear placement.
The area around Palmyra Atoll represents a smallpart of the Hawaii Longline Fishery yet accounts for alarge percentage of the bigeye caught in this fishery.The importance of catch variability for this reason isclear, but the placement of this study in a larger frameis somewhat difficult. If we use CPUE values as a proxyfor abundance, then the large increase during 1998would be indicative of a larger population structureacross the equatorial band. Conversely, if the increasein CPUE did not correspond to an overall increase inpopulation, this would result in an increase of theremoval of bigeye from the system. If the bigeyepopulation in this region is composed of new recruits
Figure 8. (a) The monthly aggregated correlations betweenthe GAM-predicted bigeye catch per set and the logbook-observed bigeye values. (b) A quantile–quantile plot of themonthly aggregated observed bigeye and model predictedbigeye catch per set. The black line represents a 1 : 1 line ofequivalence.
El Nino and bigeye tuna at Palmyra Atoll 487
� 2006 Blackwell Publishing Ltd, Fish. Oceanogr., 15:6, 477–489.

from the western waters then this would result in adecrease in available recruits to the equatorial system.
Our final model is based on one temporal, oneinteractive spatial, and one environmental parameterto facilitate analysis of term importance. Preliminaryruns incorporated a lunar index based on the moonphase when the fishing gear was set, but this variablewas found to be statistically unimportant (P ¼ 0.22)and did not significantly improve the model fits. Thebottom depth at the fishing gear location was alsoincorporated into preliminary runs but was also dis-carded for insignificance (P ¼ 0.24). The longline setmonth predictor showed the seasonal effect on bigeyecatch rates throughout the year with higher catch ratesfrom December through April. The dependence onspatial location was modeled as a bivariate function oflongitude and latitude. This provides a two-dimen-sional representation of the areas of highest effect onbigeye catch rates which is preferred over modelingthe spatial effect as two additive univariate functionsto avoid potential loss of information. The spatial ef-fect shows that the areas northeast and northwest ofPalmyra Atoll had the highest effect on catch rates.Both of these areas were centered between 6 and 8�N,an area of high eddy variability and current reversals.This supports the hypothesis that it is more a zonaleffect than a meridional one as the reversal in currentsduring El Nino events is during December–April inthat latitudinal band.
Work by Holland et al. (1990) illustrated theeffects that fish aggregating devices (FADs) had onbigeye tuna. Extrapolating this idea further, the areaaround Palmyra Atoll can be considered as a largeseamount. This feature may attract the migratingbigeye tuna and form an advantageous forage areaduring the times of enhanced flow and currentreversal. The spatial effect also locates an area of highcatch to the south of Palmyra Atoll. The increasingvalues directly to the south lie over an area of lowhistorical effort and may be an artifact of small samplesize. The model breaks apart the fishery-dependent,temporal, and environmental effects to assess the im-pacts of each predictor, and explains 36% of thecumulative deviance. Intra and interannual variabilitywere the most important predictors in the model,which resulted in the inability to fit sets with very lowor very high catch values. The model predicted setswith little or no catch, which occurred during an ElNino or early in the year as higher values, resulting inthe deviations from the 1 : 1 line of equivalence seenin the Q–Q plot of the monthly data. Conversely, themodel has difficulty with sets of very high catchregardless of time or space. Attempts to tune the
model to fit these higher sets resulted in a largerdeviation in the lower or zero catch sets. Additionalenvironmental parameters such as the mean eastwardvelocity with 3- and 6-month lags were modeled, butresulted in a marginal increase in cumulative devianceexplained while increasing the residuals for lowercatch sets. This data set spanned two moderates andone strong El Nino event. Additional collection dur-ing future El Nino events with enhanced data inclu-ding size and sex will further allow us to understandthe variability in bigeye catch rates of this small,productive region of the Pacific.
In conclusion, observations from environmentaldata combined with the results from a GAM indicatethat El Nino events have a positive influence on thecatch rates of bigeye tuna around the Palmyra Atoll. ElNino triggers an eastward expansion of the warm poolwaters along the equator, with a shoaling of thethermocline north of 5�N. This eastward advectionand resulting reversal in flow, coupled with verticalchanges in habitat, appears to increase the availabilityof bigeye tuna to the longline fishery.
ACKNOWLEDGEMENTS
The authors wish to thank William Walsh, WalterMachado, and Jerry Wetherall for reading andcommenting on early drafts of this manuscript andJudith Kendig of the editorial staff of the PacificIslands Fisheries Science Center (PIFSC) for help inpreparation of this manuscript. We also wish tothank Marti McCracken for statistical consultationand her help in finalizing the GAM experimentaldesign. The authors also wish to thank Peter Ward,Ian Perry, and an anonymous reviewer for theirhelpful comments. Jeffrey Polovina also made helpfulcontributions towards the final manuscript. Altimetrydata used in this study were produced by the Ssaltoprogram and obtained from Collecte LocalizationSatellites (CLS) center under the auspices of theCentre National d’etudes Spatiales of France(CNSF). TAO buoy data were produced by theTAO project at the Pacific Marine EnvironmentalLaboratory (PMEL). The Hawaii Longline Logbookdata were provided by the Fisheries Monitoring andSocio-economics Division at the Pacific IslandsFisheries Science Center.
REFERENCES
Bigelow, K.A., Boggs, C.H. and He, X. (1999) Environmentaleffects on swordfish and blue shark catch rates in the USNorth Pacific longline fishery. Fish. Oceanogr. 3:178–198.
488 E.A. Howell and D.R. Kobayashi
� 2006 Blackwell Publishing Ltd, Fish. Oceanogr., 15:6, 477–489.

Bigelow, K.A., Hampton, J. and Miyabe, N. (2002) Appli-cation of a habitat-based model to estimate effect-ive longline fishing effort and relative abundance ofPacific bigeye tuna (Thunnus obesus). Fish. Oceanogr.11:143–155.
Boggs, C.H. (1992) Depth, capture time, and hooked longevityof longline-caught pelagic fish: Timing bites of fish withchips. U.S. Fish. Bull. 90:642–658.
Brill, R.W. (1994) A Review of temperature and oxygen toler-ance studies of tunas pertinent to fisheries oceanography,movement models and stock assessments. Fish. Oceanogr.3:204–216.
Hanamoto, E. (1987) Effect of oceanographic environment onbigeye tuna distribution. Bull. Jap. Soc. Sci. Fish Oceanogr.51:203–216.
Harrell, F.E. (2001) Regression Modeling Strategies with Applica-tions to Linear Models, Logistic Regression, and Survival. NewYork: Springer-Verlag, p. 545.
Hastie, T.J. and Tibshirani, R.J. (1990) Generalized AdditiveModels. London: Chapman & Hall, p. 335.
Holland, K.N., Brill, R.W. and Chang, R.K.C. (1990) Hor-izontal and vertical movements of yellowfin and bigeye tunaassociated with fish aggregating devices. U.S. Fish. Bull.88:493–507.
Ito, R.Y. and Machado, W.A. (1999) Annual report of theHawaii-based longline fishery for 1998. NMFS/SWFSCAdministrative Report No. H-99-06, p. 62.
Johnson, G.C. and McPhaden, M.J. (2000) Upper equatorialPacific Ocean current and salinity variability during the1996-1998 El Nino-La Nina cycle. J. Geophys. Res.105:1037–1053.
Lehodey, P., Bertignac, M., Hampton, J., Lewis, A. and Picaut, J.(1997) El Nino Southern Oscillation and tuna in the west-ern pacific. Nature 389:715–718.
Lehodey, P., Andre, J.M., Bertignac, M. et al. (1998) Predictingskipjack tuna forage distributions in the equatorial Pacificusing a coupled dynamical bio-geochemical model. Fish.Oceanogr. 7:317–325.
Musyl, M.K., Brill, R.W., Boggs, C.H., Curran, D.S., Kazama,T.K. and Seki, M.P. (2003) Vertical movements of bigeyetuna (Thunnus obesus) associated with islands, buoys, andseamounts near the main Hawaiian Islands from archivaldata. Fish. Oceanogr. 12:152–169.
Picaut, J., Ioualalen, M., Menkes, C., Delcroix, T. and McPha-den, M.J. (1996) Mechanism of the zonal displacements ofthe Pacific warm pool: implications for ENSO. Science274:1486–1489.
Polovina, J.J., Kleiber, P. and Kobayashi, D. (1999) Applicationof TOPEX/POSEIDON satellite altimetry to simulatetransport dynamics of larvae of the spiny lobster (Panulirusmarginatus), in the northwestern Hawaiian Islands, 1993–96.U.S. Fish. Bull. 97:132–143.
Polovina, J.J., Howell, E.A., Kobayashi, D.R. and Seki, M.P.(2001) The transition zone chlorophyll front, a dynamicglobal feature defining migration and forage habitat formarine resources. Prog. Oceanogr. 49:469–483.
Polovina, J.J. and Howell, E.A. (2005) Ecosystem indicatorsderived from satellite remotely sensed oceanographic data forthe North Pacific. ICES J. Mar. Sci. 62:319–327.
Swartzman, G., Huang, C. and Kaluzny, S. (1992) Spatial ana-lysis of Bering Sea groundfish survey data using generalizedadditive models. Can. J. Fish. Aquat. Sci. 49:1366–1378.
Uddstrom, M.J. and Oien, N.A. (1999) On the use of high-resolution satellite data to describe the spatial and temporalvariability of sea surface temperatures in the New Zealandarea. J. Geophys. Res. 104:20729–20751.
Walsh, W.A. (2000) Comparisons of fish catches reported byfishery observers and in logbooks of Hawaii-based commer-cial longline vessels. NMFS/SWFSC Administrative ReportNo. H -00-07, p. 45.
Walsh, W.A. and Kleiber, P. (2001) Generalized additive modeland regression tree analyses of blue shark (Prionace glauca)catch rates by the Hawaii-based commercial longline fishery.Fish. Res. 53:115–131.
Walsh, W.A., Kleiber, P. and McCracken, M. (2002) Com-parison of logbook reports of incidental blue shark catchrates by Hawaii-based longline vessels to fishery observerdata by application of a generalized additive model. Fish.Res. 58:79–94.
Wilson, C. and Adamec, D. (2001) Correlations between sur-face chlorophyll and sea surface height in the tropical Pacificduring the 1997–1999 El Nino-Southern Oscillation event.J. Geophys. Res. 106:31175–31188.
Wood, S.N. (2000) Modelling and smoothing parameter esti-mation with multiple quadratic penalties. J. R. Stat. Soc.Bull. 62:413–428.
Wood, S.N. and Augustin, N.H. (2002) GAMs with integratedmodel selection using penalized regression splines andapplications to environmental modelling. Ecol. Model.157:157–177.
El Nino and bigeye tuna at Palmyra Atoll 489
� 2006 Blackwell Publishing Ltd, Fish. Oceanogr., 15:6, 477–489.