elaeis guineensis jacq.): a possible panorama for high...
TRANSCRIPT

Mineral nutrition and its genetic signature in oil palm
(Elaeis guineensis Jacq.): a possible panorama for high
yielding materials at low fertiliser cost1
J.Ch. Jacquemard2, J. Ollivier
3, Erwanda
4, Edyana Suryana
3
and Pepep Permadi3
ABSTRACT
Significant differences in the mineral nutrition have been demonstrated between progenies
and the main categories at PT Socfindo (Jacquemard et al, 2002). A new set of investigations
has been conducted based on a larger genetic background. It includes 489 progenies
observed in 25 genetic trials planted at Aek Loba Timur Project and 63 commercial blocs
covering around 3500 hectares dispatched through all the PT Socfindo estates.
The leaf contents in the major elements constitute an important genetic signature that allows
the characterization and the individualization of the nutritional level of each ALT project
families according their genetic background.
The observations achieved on the commercial blocs confirm the signature of ALT project
derived commercial categories. Some large groups show very distinct characteristics in their
nutrient levels such as:
Low nitrogen – low potassium
Low nitrogen – high potassium
High nitrogen – low potassium
In addition, some high yielding families express a specific behavior linking calcium to their
chlorine absorption, then limiting the potassium absorption. The relation-ship between all
these elements is discussed.
Providing of high yielding planting material more frugal in fertilizer input is discussed. This
possible panorama offered to research and oil palm sector is an added value on the way of
sustainable palm oil.
Key words:
Elaeis guineensis, mineral nutrition, genetic background, fertilization
Corresponding author: [email protected]
1 Paper presented at IOPC 2010 “Transforming Oil Palm Industry”. 1 – 3 June 2010, Jogja Expo Center,
Yogyakarta - Indonesia 2 PT Socfindo Medan / UR Oil Palm Breeding – Cirad Bios, PO Box 1254 – Medan 20001 – Sumatera Utara –
Indonesia 3 UR Performance of tree-crop-based systems – Cirad Persyst, TA B-34/02, Avenue Agropolis 34398
Montpellier Cedex 5 – France 4 PT Socfindo Medan – PO Box 1254 – Medan 20001 – Sumatera Utara – Indonesia

INTRODUCTION
Many factors may affect the oil palm leaf nutrient concentration and by the way, critical
levels. An abundant literature is available for a large majority of them (Corley and Tinker,
2003). The soil and the age appear to be the most important. The effect of the soil is generally
proven in all oil palm cultivation areas for all major and minor elements (Foster and
Prabowo, 1996, Ollagnier et al, 1987). In other hand, the age is known to depress the leaf
mineral contents. It is the case for nitrogen, phosphorus, potassium and magnesium (Hartley,
1988; Caliman et al, 1994).
The effect of the planting material has been investigated in several field experiments
(Jacquemard et al, 2002). In 3 progeny trials planted at Aek Kwasan I Project (PT Socfindo),
testing duras from LM404D selfed, LM404D x DA10D and DA115D selfed origins crossed
by teneras and pisiferas from LM2T selfed, significant differences in the mineral leaf
contents was proven for nitrogen, phosphorus, potassium and magnesium. From these trials
and from an experiment carried out in nursery on (DA5D x DA3D) II x La Mé materials,
significant differences between individual progenies were detected for the same elements.
In the experiments ALCP61 and ALCP62 (N3P3K3 subdivided for Mg), carried out with two
different planting materials: (DA5D x DA3D) x LM2T selfed and (DA5D x DA3D) x
LM311P, different critical level has been demonstrated for the potassium and suspected for
the phosphorus (Jacquemard et al, 2002).
This paper would report new set of investigations based on larger genetic background
including commercial planting materials. New results from ALCP61 and ALCP62 allowing
possible way to produce planting materials combining high productivity and low fertiliser
rate are submitted.
EXPERIMENTS
MATERIALS
The studied planting material comes from three PT Socfindo sources:
Aek Loba Timur Project
ALCP61 and ALCP 62
Commercial planting material
Planted from 1995 to 2000, the Aek Loba Timur Project (ALT Project) includes 489
progenies planted in 25 progeny trials (Jacquemard et al, 2001). These progenies could be
aggregated according their ancestor families: for the A Group, 18 families are identified and
24 families for the B Group (Table 1). The comparison in continuity between the trials is
allowed through a special network of repeated progenies (Table 2). In addition, the CIRAD
standard crosses (LM2T x DA10D and LM2T x DA115D) were planted in 1997 and 2000.
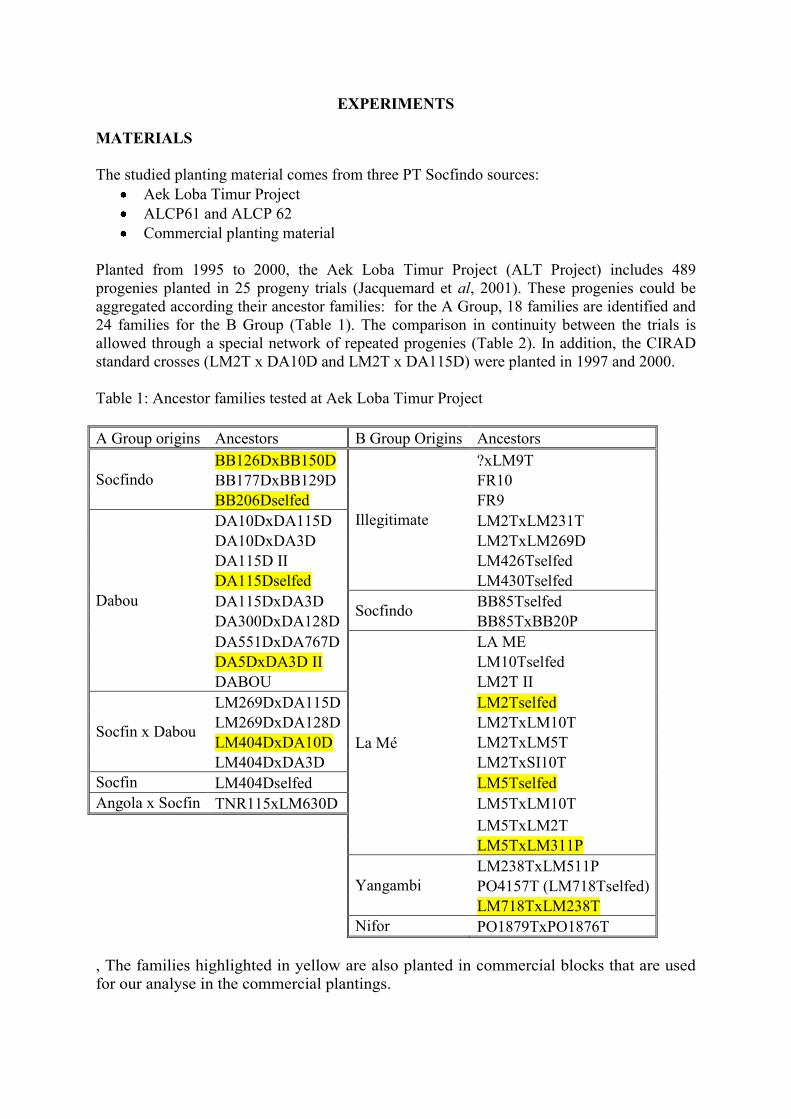
Table 1: Ancestor families tested at Aek Loba Timur Project
A Group origins Ancestors B Group Origins Ancestors
Socfindo
BB126DxBB150D
Illegitimate
?xLM9T
BB177DxBB129D FR10
BB206Dselfed FR9
Dabou
DA10DxDA115D LM2TxLM231T
DA10DxDA3D LM2TxLM269D
DA115D II LM426Tselfed
DA115Dselfed LM430Tselfed
DA115DxDA3D Socfindo
BB85Tselfed
DA300DxDA128D BB85TxBB20P
DA551DxDA767D
La Mé
LA ME
DA5DxDA3D II LM10Tselfed
DABOU LM2T II
Socfin x Dabou
LM269DxDA115D LM2Tselfed
LM269DxDA128D LM2TxLM10T
LM404DxDA10D LM2TxLM5T
LM404DxDA3D LM2TxSI10T
Socfin LM404Dselfed LM5Tselfed
Angola x Socfin TNR115xLM630D LM5TxLM10T
LM5TxLM2T
LM5TxLM311P
Yangambi
LM238TxLM511P
PO4157T (LM718Tselfed)
LM718TxLM238T
Nifor PO1879TxPO1876T
, The families highlighted in yellow are also planted in commercial blocks that are used
for our analyse in the commercial plantings.

Table 2: Network of repeated progenies
1995 1997 1998 1999 2000
1995 3 7 0 0 4
1997 7 21 8 2 6
1998 0 8 6 6 5
1999 0 2 6 4 2
2000 4 6 5 2 2
ALCP61 and ALCP62, set up side by side at the Aek Loba plantation (North Sumatra), with
two types of planting materials, study the effect of four fertilisers on the mineral nutrition and
the production (Jacquemard et al, 2002). The purpose is to deduce the most appropriate
fertiliser schedules.
The first trial (ALCP 61) is planted with (DA5D x DA3D) x LM2T selfed material, the
second (ALCP 62) with (DA5D x DA3D) x LM311P material. LM311P is a pisifera of LM6,
an illegitimate progeny of LM2T. The trial was set up on palms planted in 1989.
The design comprises 3 factors N, P and K studied on 3 levels. N, P and K applications are in
a ratio of 0, 1 and 3. The subdivision for magnesium was launched in 1997 (Table 3).
Table 3: Factors studied (kg / palm / year)
Level 0 Level 1 Level 2
Urea 0.0 1.0 3.0
Rock Phosphate 0.0 0.5 1.5
KCl 1.0 2.0 4.0
Dolomite CP 61 0.5 1.0
Dolomite CP 62 0.0 0.5
At the same time as the genetic trials were established, numerous categories reproducing
some of listed families (Table 1) were distributed across nine PT Socfindo oil palm
estates in the North Sumatra and Aceh provinces. Unfortunately, all the ancestor families
tested at the ALT project have not been planted in commercial blocs, which allow a
comparison for some of them only.
METHODS
The nutritional status data are specifically obtained by the leaf content analyses. The CIRAD
standard method of collection and analyse has been used (Ochs and Ollivin, 1977). The
samples have been taken from the leaf 17 and analysed at the CIRAD laboratory. The
analysed elements are nitrogen, phosphorus, potassium, calcium, magnesium, chlorine and
boron.
On the ALT project, the samples per progeny were taken every two years from 3 years old.
To date, a complete set of data is available for 3, 5 and 7- years -old. The standard
fertilisation tables were used for all ALT project trials from N0 to N3 applications. The detail
of these fertilizer tables is given in annexe 1 for each year of planting. After that age, the
fertilisation is monitored trial per trial through their nutritional status. The data were

corrected from possible environmental and fertilisation effects through the network of
repeated progenies (see Table 2 above).
The statistical analyses done to evaluate ancestor effects have been carried out with XLSTAT
®. The Pearson model of Factorial Analyse in main components has been selected.
On the commercial blocks, the annual sampling is carried out, as it serves as a steering
tool for the recommendation of manure, and in the same manner, the annual analyses are
also carried out on the experiments in order to monitor the effects of treatments on the palm
nutrition.
The commercial fertilisation policy adopts a fixed fertilisation from N0 to N5. The same
standard fertilisation table used for ALT project has been also used for all the commercial
blocks. The data for 3- years -old coming from 63 commercial blocks planted in 9 different
estates have been used or this study.

RESULTS
MINERAL NUTRITION IN AEK LOBA TIMUR GENETIC BLOC
Mineral nutrition at 3 years old
Table 4 gives the general mean, the standard errors and the values exceeding deviation
passing this standard error.
Table 4: General Mean and standard error at 3 years old
Nitrogen Phosphorus Potassium Calcium Magnesium Mean 2.943 0.167 0.904 1.149 0.230 STDev 0.086 0.004 0.121 0.149 0.034 m-s 2.858 0.163 0.782 0.999 0.196 m+s 3.029 0.172 1.025 1.298 0.265
Tables 5 and 6 summarize the A group families results at 3- years -old at the ALT project and
in commercial blocs. Different colours underline the average position of the families in their
group:
Above m + s: Dark green
From m + s to m: Pale green
From m to m – s: Pale yellow
Below m – s: Yellow
Table 5: 3- years -old values for the A Group origins at the ALT project
Sub-Group A origin N P K Ca Mg
AN x Socfin (TNR115xLM630D)I 3.054 0.166 1.021 1.069 0.191
Socfindo BB126DxBB150D 2.877 0.173 1.166 0.910 0.207
Socfindo BB177DxBB129D 2.892 0.167 1.062 0.986 0.190
Socfindo BB206Dselfed 2.862 0.169 1.101 0.966 0.205
Dabou (DA5DxDA3D)selfed 2.966 0.169 0.855 1.177 0.257
Dabou DA 10 D 2.964 0.169 0.989 1.125 0.194
Dabou DA10DxDA3D 2.983 0.167 0.892 1.100 0.217
Dabou DA10DxDA115D 2.957 0.167 0.865 1.228 0.236
Dabou DA 115 D 3.035 0.168 0.789 1.342 0.242
Dabou DA115D II 2.901 0.165 0.866 1.333 0.215
Dabou DA115Dselfed 2.994 0.168 0.813 1.276 0.238
Dabou DA115DxDA3D 3.002 0.167 0.773 1.240 0.233
Socfin x Dabou LM269DxDA115D 2.950 0.169 0.850 1.257 0.212
Socfin x Dabou LM269DxDA128D 2.919 0.166 0.900 1.070 0.270
Dabou DA300DxDA128D 2.891 0.168 0.888 1.097 0.221
Dabou DA551DxDA767D 2.918 0.163 0.757 1.244 0.277
Socfin LM404Dselfed 2.869 0.166 0.916 1.097 0.233
Socfin x Dabou LM404DxDA10D 2.929 0.165 0.914 1.125 0.215
Socfin x Dabou LM404DxDA3D 2.937 0.169 0.925 1.072 0.203

Table 6: 3- years -old values for the A group Ancestor families in the commercial blocks
Sub-Group A origin N P K Ca Mg
Dabou DA115D x (DA5D x DA3D) 2.83 0.178 1.12 0.880 0.265
Dabou DA115Dselfed 2.88 0.174 0.98 0.847 0.305
Dabou DA5D x DA3D 2.89 0.176 1.02 0.808 0.291
Socfin x Dabou (DA5D x DA3D) x (LM404DxDA10D) 2.89 0.174 0.99 0.823 0.281
Socfin x Dabou LM404D x (DA5D x DA3D) 2.81 0.178 0.97 1.045 0.250
Socfin x Dabou LM404D x DA10D 2.87 0.175 1.03 0.915 0.285
Socfin x Socfin LM404D x LM270D 2.91 0.190 1.09 0.765 0.345
Socfindo BB126DxBB150D 2.84 0.182 1.10 0.890 0.275
Socfindo BB206Dselfed 3.02 0.186 1.06 0.981 0.276
General Mean 2.88 0.179 1.04 0.884 0.286
Standard Deviation 0.06 0.006 0.06 0.087 0.027
The ancestor families that are not represented in the ALT project are highlighted in blue –
green. Tables 7 and 8 summarize the B group families results at 3- years -old in the ALT
project and in the commercial blocs.
Table 7: 3- years -old values for B Group origins in the ALT project
Sub Group B origin N P K Ca Mg
LM LM 2 T 2.992 0.168 0.909 1.212 0.213
LM LM2Tselfed 2.967 0.166 0.888 1.176 0.212
LM (LM2T)II 2.999 0.170 0.893 1.135 0.215
LM LM2TxLM10T 3.025 0.169 0.854 1.181 0.219
LM LM2TxLM5T 2.986 0.167 0.900 1.176 0.215
LM LM5TxLM2T 2.866 0.167 0.928 1.122 0.207
LM LM5Tselfed 2.929 0.166 0.799 1.255 0.234
LM LM5TxLM311P 2.915 0.164 0.845 1.227 0.265
LM LM5TxLM10T 2.953 0.168 0.833 1.155 0.225
LM LM10Tselfed 2.988 0.167 0.840 1.250 0.229
LM x SI (LM2TxSI10T)I 2.965 0.172 0.970 1.065 0.224
SOCFINDO BB85Tselfed 2.902 0.174 1.161 0.900 0.227
SOCFINDO BB85TxBB20P 2.860 0.172 1.215 0.864 0.201
YA LM238TxLM511P 2.912 0.166 0.904 1.069 0.259
YA LM718TxLM238T 2.893 0.171 1.044 0.980 0.241
YA PO 4157 T 2.788 0.164 0.956 1.055 0.198
NIFOR PO1879TxPO1876T 2.861 0.170 1.191 0.947 0.193
Other PO 3660 P 2.778 0.153 0.935 1.057 0.287
Other BB 106 T 2.687 0.163 1.075 0.894 0.163
Other FR10 2.851 0.163 0.739 1.348 0.257
Other ?xLM9T 2.876 0.166 0.839 1.074 0.232
Other FR9 2.891 0.165 0.836 1.302 0.259
Other LM426Tselfed 2.944 0.168 0.950 1.219 0.231
Other LM2TxLM231T 3.044 0.175 0.817 1.250 0.309

Table 8: 3- years -old values for commercial planting material
Sub-Group B origin N P K Ca Mg
La Mé LM2T selfed 2.88 0.175 1.00 0.848 0.285
La Mé LM5T selfed 2.91 0.179 0.99 0.841 0.286
La Mé LM5T x LM311P 3.01 0.176 0.88 0.940 0.295
Yangambi LM718T selfed 3.02 0.186 1.06 0.981 0.276
Yangambi LM718T x LM238T 2.88 0.187 1.09 0.807 0.322
General Mean 2.94 0.181 1.01 0.883 0.293
Standard Deviation 0.064 0.006 0.082 0.073 0.018
LM718T selfed is not represented in ALT project series. This selfing is just represented in the
project by the only PO4157T. This palm cannot be considered as representative of the selfing.
Mineral nutrition at 5 to 7- years -old
Tables 9 to 11 deliver equivalent information for 5 to 7- years -old results.
Table 9: General means and standard error at 5 to 7- years –old in ALT project
Nitrogen Phosphorus Potassium Calcium Magnesium Chlorine Boron
Mean 2.731 0.164 0.984 0.890 0.182 0.691 15.0
STDev 0.085 0.004 0.105 0.098 0.028 0.058 1.592
m-s 2.645 0.160 0.879 0.792 0.155 0.633 13.435
m+s 2.816 0.168 1.089 0.988 0.210 0.748 16.619
Table 10: 5 to 7- years -old value for the A Group origins in ALT project
Sub-Group A origin N P K Ca Mg Cl B
AN x Socfin (TNR115xLM630D)I 2.813 0.163 1.008 0.881 0.161 0.748 14.053
Socfindo BB126DxBB150D 2.633 0.166 1.146 0.739 0.171 0.693 13.225
Socfindo BB177DxBB129D 2.668 0.162 1.105 0.794 0.151 0.672 12.398
Socfindo BB206Dselfed 2.660 0.165 1.165 0.782 0.160 0.706 12.916
Dabou (DA5DxDA3D)selfed 2.744 0.165 1.008 0.910 0.194 0.683 15.483
Dabou DA 10 D 2.776 0.163 1.074 0.858 0.162 0.697 14.4
Dabou DA10DxDA3D 2.765 0.163 0.951 0.906 0.168 0.640 14.708
Dabou DA10DxDA115D 2.745 0.162 0.950 0.936 0.182 0.682 15.623
Dabou DA 115 D 2.828 0.163 0.915 1.019 0.195 0.742 16.6
Dabou DA115D II 2.748 0.160 0.973 0.918 0.171 0.728 15.392
Dabou DA115Dselfed 2.800 0.164 0.883 0.983 0.195 0.719 16.487
Dabou DA115DxDA3D 2.711 0.161 0.867 0.979 0.172 0.662 15.754
Socfin x Dabou LM269DxDA115D 2.751 0.164 0.951 0.921 0.180 0.670 15.921
Socfin x Dabou LM269DxDA128D 2.648 0.161 0.942 0.903 0.207 0.618 15.540
Dabou DA300DxDA128D 2.690 0.164 0.989 0.858 0.189 0.730 15.178
Dabou DA551DxDA767D 2.737 0.157 0.714 1.032 0.260 0.672 17.248
Socfin LM404Dselfed 2.685 0.166 0.950 0.902 0.186 0.672 15.157
Socfin x Dabou LM404DxDA10D 2.754 0.166 0.970 0.912 0.181 0.683 15.825
Socfin x Dabou LM404DxDA3D 2.752 0.168 0.967 0.879 0.164 0.674 14.662
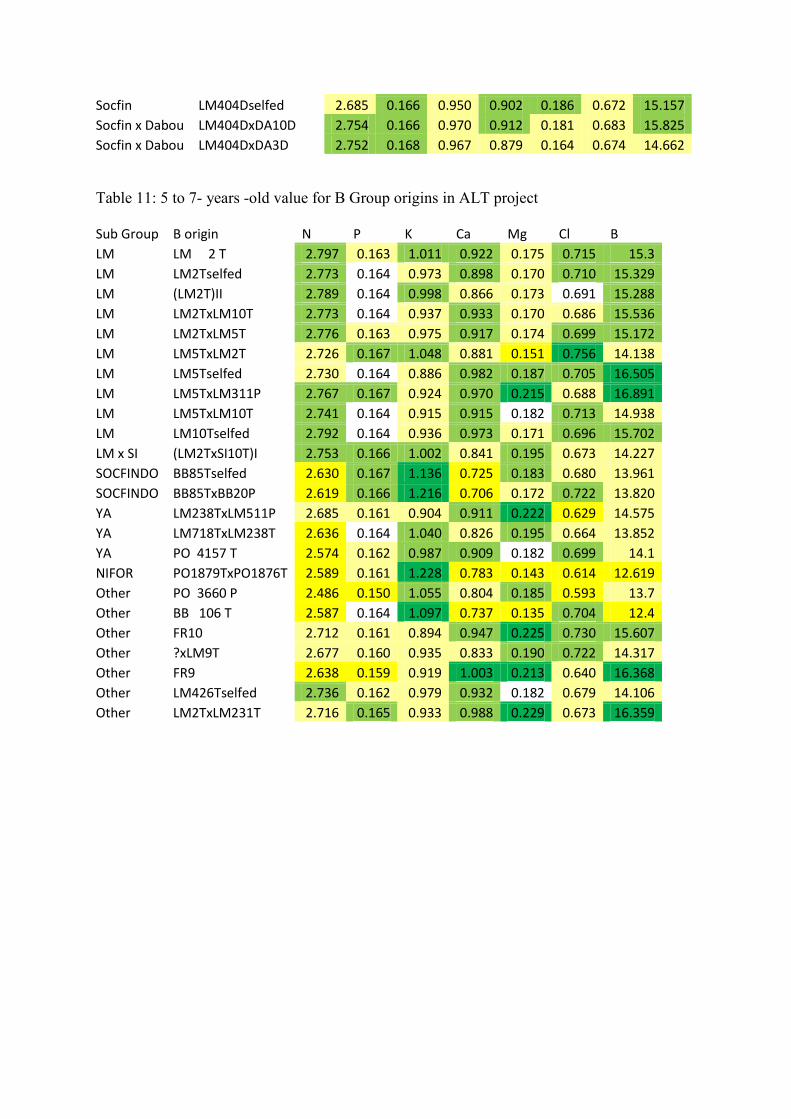
Table 11: 5 to 7- years -old value for B Group origins in ALT project
Sub Group B origin N P K Ca Mg Cl B
LM LM 2 T 2.797 0.163 1.011 0.922 0.175 0.715 15.3
LM LM2Tselfed 2.773 0.164 0.973 0.898 0.170 0.710 15.329
LM (LM2T)II 2.789 0.164 0.998 0.866 0.173 0.691 15.288
LM LM2TxLM10T 2.773 0.164 0.937 0.933 0.170 0.686 15.536
LM LM2TxLM5T 2.776 0.163 0.975 0.917 0.174 0.699 15.172
LM LM5TxLM2T 2.726 0.167 1.048 0.881 0.151 0.756 14.138
LM LM5Tselfed 2.730 0.164 0.886 0.982 0.187 0.705 16.505
LM LM5TxLM311P 2.767 0.167 0.924 0.970 0.215 0.688 16.891
LM LM5TxLM10T 2.741 0.164 0.915 0.915 0.182 0.713 14.938
LM LM10Tselfed 2.792 0.164 0.936 0.973 0.171 0.696 15.702
LM x SI (LM2TxSI10T)I 2.753 0.166 1.002 0.841 0.195 0.673 14.227
SOCFINDO BB85Tselfed 2.630 0.167 1.136 0.725 0.183 0.680 13.961
SOCFINDO BB85TxBB20P 2.619 0.166 1.216 0.706 0.172 0.722 13.820
YA LM238TxLM511P 2.685 0.161 0.904 0.911 0.222 0.629 14.575
YA LM718TxLM238T 2.636 0.164 1.040 0.826 0.195 0.664 13.852
YA PO 4157 T 2.574 0.162 0.987 0.909 0.182 0.699 14.1
NIFOR PO1879TxPO1876T 2.589 0.161 1.228 0.783 0.143 0.614 12.619
Other PO 3660 P 2.486 0.150 1.055 0.804 0.185 0.593 13.7
Other BB 106 T 2.587 0.164 1.097 0.737 0.135 0.704 12.4
Other FR10 2.712 0.161 0.894 0.947 0.225 0.730 15.607
Other ?xLM9T 2.677 0.160 0.935 0.833 0.190 0.722 14.317
Other FR9 2.638 0.159 0.919 1.003 0.213 0.640 16.368
Other LM426Tselfed 2.736 0.162 0.979 0.932 0.182 0.679 14.106
Other LM2TxLM231T 2.716 0.165 0.933 0.988 0.229 0.673 16.359

DISCUSSION
MINERAL NUTRITION
As explained above, all the progenies planted in the ALT project received a fixed
fertilisation. The possible environmental fluctuations as the soils fertility and the few
differences in the fertilizer tables are stabilized through the corrections done with the
repeated progenies. In this discussion, we do not include the illegitimate origins detected in B
group.
In the commercial blocks, the nutrient content general means for both the group origins appear
higher for the phosphorus, the potassium and the magnesium, even or lower in nitrogen
but very lower in calcium compared to ALT project. It is to be noted that the ALT project is
established on very calcic soils, which can explain the observed differences.
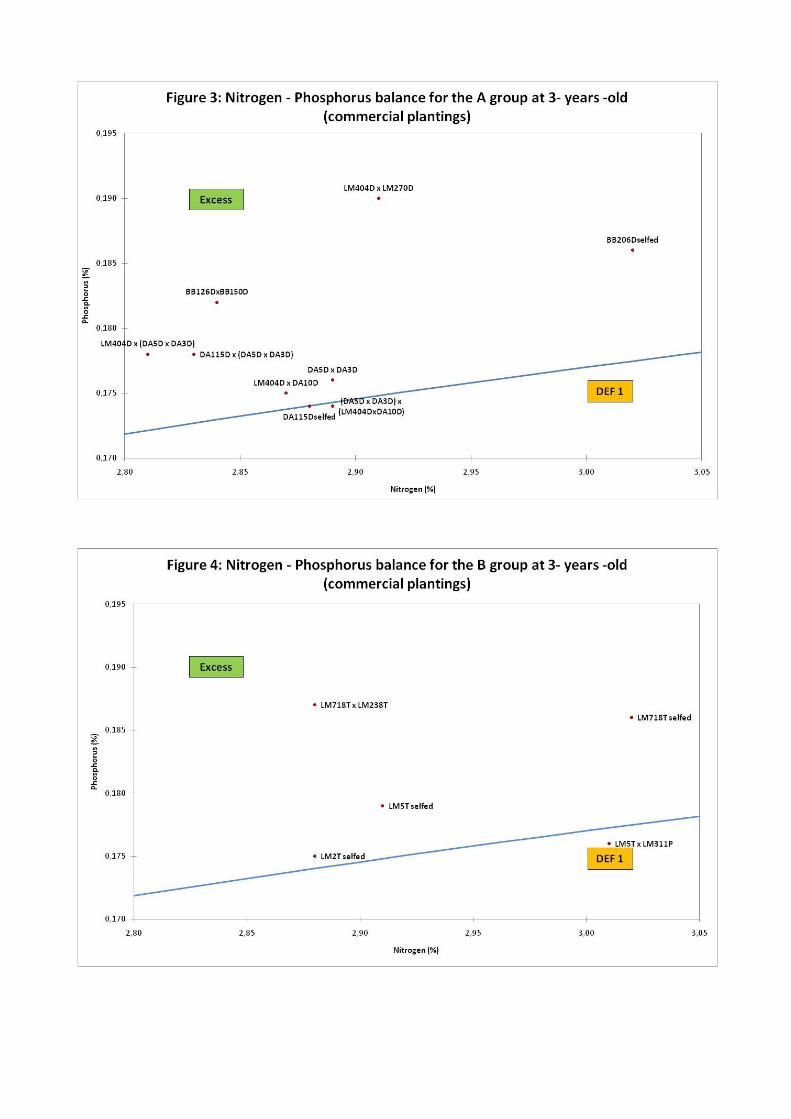
At 3- years -old, there is any A or B group origin showing excess in the phosphorus nutrition
at the ALT project following the nitrogen – phosphorus balance commonly accepted
(Tampubolon et al, 1990). Some of them present a strong phosphorus deficiency (Figures 1
and 2, next page):
For A Group origins: all DA115D origins except LM269D x DA115D, LM404D x DA10D,
DA551D x DA767D and TNR115 x LM630D.
For B Group origins: nearly all La Mé group is borderline of Deficiency 2 level. Two
Yangambi origins are very low: PO4157T (from LM718T selfed) and LM238T x LM511P.
BB85T selfed is borderline of an excess of phosphorus leaf content.
Because of their better nutritional level in phosphorus, the situation is different in the
commercial blocks. The N/P equilibrium is quite well balanced for the both groups of
origins (Fig 2 and 3). Many of them even show a phosphorus excess. However, it is
observed that the rank classifying the origins show similarities. For instance, in the A
group, BB206D self and BB126D x BB150D are amongst the highest, and DA115D or
LM404D x DA10D amongst the lowest (Fig 2) which is also observed in the ALT project on
Fig 1.
Same similarities in the B group, where LM718T x LM238T is recorded in a better position
compared to LM2T and LM5T x LM311P on Fig 4 are also ranked in the same order on
Fig 2.
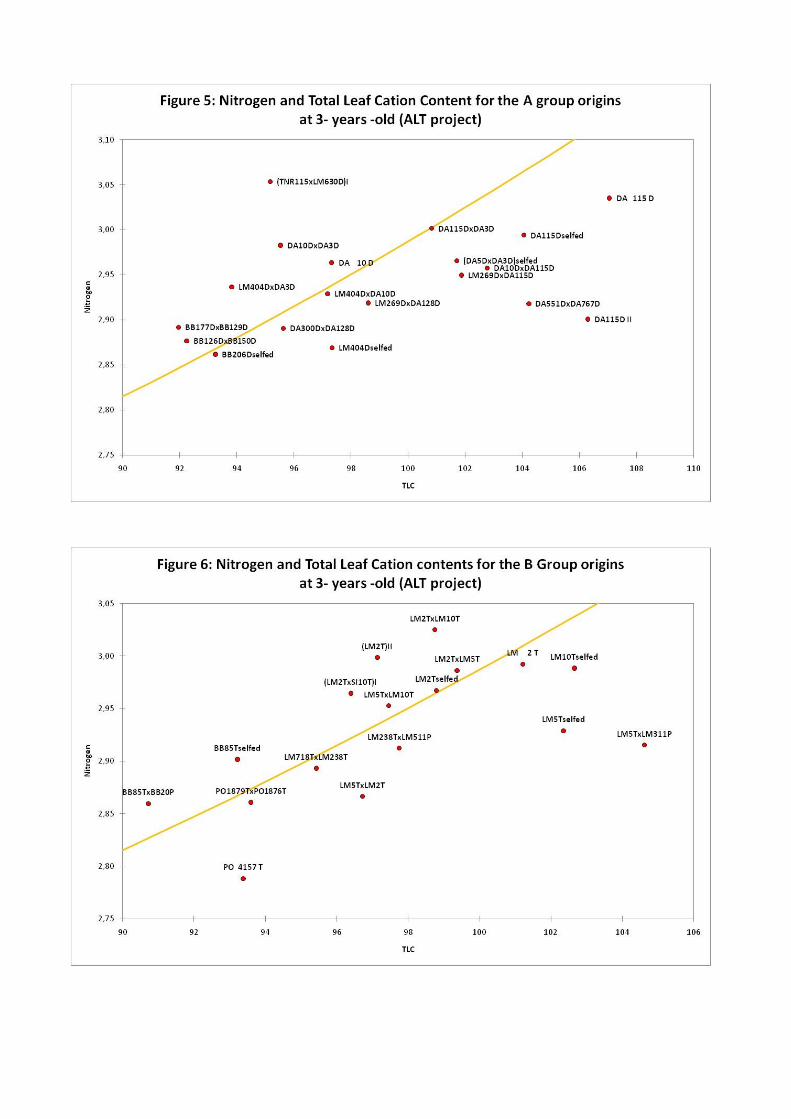
The Total Leaf Cation content and the nitrogen balance (Figures 5 and 6), is explored
according the relationship proposed by Foster (2003). Many A Group origins are in a
borderline situation. Note that TNR115 x LM630D presents an excessive high nitrogen leaf
content and many families based on DA115D are under the optimum N. However, this last
figure does not appear clearly in commercial blocs (Figure 7). The same observation could be
delivered for the B Group origins: many out of them are in a borderline position except for
LM5T Selfed and LM5T x LM311P (Figure 6). In commercial estates, LM5T x LM311P is
in opposite position (Figure 8).
The calcium and the magnesium cation balance display a particular disequilibrium in general
(detailed data in annexe). The Magnesium balance is generally recorded below 21%. It
seems very specific to the Aek Loba Estate environment, when compared to the commercial

blocs where Mg/TLC is currently always above 21% as shown in annex. Some origins
present a notable excess in calcium (balance above 60%): that is concerning all the DA115D
based origins from the A group and LM5T selfed or LM10T selfed for the B group. It
appears that the family behavior could be specific to the location as noticed again, when
the ALT project values are compared to the results from the commercial blocs.
At 5 to 7- years -old (Figures 9 and 10), the nitrogen – phosphorus balance appears improved
in the ALT project. But for the both groups of origin, some families are still in Deficiency 2.
For the A Group, are concerned DA115D itself, DA115D II, DA10D x DA115D, DA10D
itself, DA551D x DA767D and TNR115 x LM630D. From the B group, LM2T itself and
LM238T x LM511P present this strong phosphorus deficiency. BB85T selfed and BB85T x
BB20P show correct nitrogen – phosphorus nutrition.
Concerning the nitrogen – Total Leaf Cation balance, the equilibriums seem slightly
improved particularly for DA115D derived origins (Figure 11) in the A group origins.
TNR115 x LM630D is still presenting an excess in nitrogen. In the B group origin (Figure
12), the families appear organized within two separate areas: the origins belonging to
Yangambi or related families characterized by a relatively too low nitrogen content compared
to their Total Leaf Cation in one hand. In other hand, LM2T and LM10T deriving origins
show higher nitrogen than expected. Specific mention should be done for LM5T selfed and
LM5T x LM311P that are presenting lower nitrogen contents than expected.
The calcium balance is decreasing for the A group origins from 56,7% to 52,9%; but in
favour of the potassium balance only that grow from 23,6 to 29,5%. The magnesium balance
is still miserable. The same figure is recorded in similar evolution for the B group origins.


MINERAL NUTRITION X GENOTYPE INTERACTION
In our comments on mineral nutrition, it appears obviously that some origins from both
groups are presenting some “permanent” characteristics. Table 12 showing correlation for
mineral leaf content at 3 years old and at 5 – 7 years old is confirming this fact.
Table 12: Correlation between Year 3 and adult stage
A Group B Group
Nitrogen 0,81 0,82
Phosphorus 0,64 0,74
Potassium 0,89 0,95
Calcium 0,87 0,94
Magnesium 0,88 0,84
.
This very highly significant relationship (r > ***) allows to study population structures in
both the groups. For that matter, the following variables that seem the most characteristic are
used:
Nitrogen (%), K/TLC (%), Ca/TLC (%), Mg/TLC (%) and Chlorine (%)
Chlorine is available only for 5 – 7 years old data.
For the A group of origins, all the families are studied at 3 and 5 to 7- years -old. For the B
group origins, only the legitimate families are analyzed.
Analyse of the A Group origin population
Table 13 summarises the correlations between the variables and the axis at 3- years -old. F1 x
F2 system covers 86.9% of observed variability.
Table 13: Correlations between variables and
axis
F1 F2 F3
Nitrogen 0,697 -0,425 0,578
MG/TLC 0,146 0,952 0,269
CA/TLC 0,945 -0,126 -0,303
K/TLC -0,942 -0,293 0,166
At that age, it is interesting to notice that Ca/TLC and nitrogen vectors are very close together
(Figure 13). Two populations could be easily isolated: DA115D and all its derived families
(high Ca/TLC and nitrogen; low potassium) in blue circle and in opposite Socfindo originated
families (High potassium; low Ca/TLC and nitrogen) in dashed orange circle. Three other
families present interesting position: TNR115 x LM630D (very low Mg/TLC), and LM269D
x DA128D and DA551D x DA767D in opposite (very high Mg/TLC).
Table 14 summarises correlations between variables and axis at 5 to 7- years -old. F1 x F2
system covers 83.1% of observed variability.


Table 14: Correlation between variables and axis at 5 -
7 years old
F1 F2 F3 F4
Nitrogen -0.627 0.707 -0.157 0.287
MG/TLC -0.599 -0.592 0.521 0.141
CA/TLC -0.938 0.107 -0.266 -0.196
K/TLC 0.977 0.191 -0.039 0.083
Chlorine 0.003 0.820 0.555 -0.139
Introduction of the chlorine as new variable is reversing the direction of the other vectors
(Figure 14). DA115D and its selfings are stably isolated (blue circle). The other DA115D
based families are joining a larger Deli group in the centre of the graph. Socfindo Deli
families are also fixed together along F2 positive extremity (orange dashed circle).
TNR115 x LM630D (very low Mg/TLC) maintains its position as LM269D x DA128D and
DA551D x DA767D (very high Mg/TLC).
The case of DA115D and its selfing derivates versus Socfindo deli families is interesting to
analyze: in fact, for DA115D, the nitrogen, the calcium and the chlorine are high and the
potassium is low. But the potassium nutrient is delivered by a Potassium Chlorine
application. It is possible to imagine that this genotype could absorb easily the chlorine cation
which pulls the calcium with it. In reverse, Socfindo Deli families do not absorb too much the
chlorine, then the calcium, allowing the potassium to enter massively in the leaflets.
Looking at the Socfindo commercial planting materials, it is possible to isolate three groups
that may need specific nutritional management:
K-N+Ca+: DA115D
K+N-Ca-: BB206D, BB126DxBB150D and BB177DxBB129D
Medium: DA5DxDA3D, DA10DxDA115D, DA115DxDA3D,
DA300DxDA128D, LM404Dselfed, LM404DxDA10D and LM404DxDA3D
DA10DxDA115D and DA115DxDA3D should be considered as K-N+Ca+ at immature
stage. In other hand, 3 families are very far from previous groups: TNR115 x LM630D at F1
positive extremity, LM269D x DA128D at F1 negative extremity and DA551D x DA767D in
external part of negative F1-F2 quarter.
Analyse of the B Group origin population
Table 15 summarises the correlations between the variables and the axis at 3- years -old. F1 x
F2 system covers 86.6% of observed variability.
At 3- years -old, the nitrogen and Ca/TLC vectors are very narrow as for the A group origins.
The position of the different families is well regrouped for La Mé origins and not that for
other ones. But, in average, it is possible to say that the La Mé origins belong to the positive
F1 axe (N+Ca+) and the Yangambi / Nifor / Kuala Krapuh origins to the negative F1 axe (N-
Ca-). It seems that the LM2T derived families are more Mg- and the LM5T derived families
are more Mg+.


Table 15: Correlation between variables and axis at 3 years old
F1 F2 F3
Nitrogen 0.770 0.080 0.633
MG/TLC -0.130 0.991 -0.030
CA/TLC 0.961 -0.122 -0.250
K/TLC -0.944 -0.195 0.266
At 5 to 7- years -old, the introduction of the chlorine as variable is precising this behaviour
(Figure 16). The La Mé group is Cl+Ca+ and the Yangambi / Nifor / Kuala Krapuh origins
are Cl-Ca-. It seems that some La Mé sub-groups, particularly LM2T and relatives, is
functioning as DA115D and derived origins. Four groups of nutrition could be easily
identified:
Nifor / Kuala Krapuh families (orange circle): K+N-Ca-Cl-
Yangambi families (dashed orange circle): K+ N-Ca-Cl-Mg+
LM2T and deriving origins (blue circle): K-N+Ca+Cl+
LM5T and deriving families (dashed blue circle): K-N+Ca+Cl+Mg+
In addition, LM10T and derived families are intermediate between LM2T and LM5T

MINERAL NUTRITION AND CROP
The results from two specific trials (ALCP 61 and ALCP 62) are analyzed as explained
previously. These two trials are the base of our knowledge to prove that mineral content
critical level in the leaf could differ from one type of planting material to another
(Jacquemard et al, 2002). These two experiments differ only by B Group pedigree: pollens
used for ALCP 61 materials come from LM2T selfing and those for ALCP 62 come from
LM311P itself. LM311P is deriving from LM2T by open pollination.
Despite these very narrow B group ancestors, the nutrient levels are quite contrasted (Table
16):
Table 16: Average mineral contents and crop for ALCP 61 and ALCP 62
Leaf N Leaf P Leaf K Leaf Ca Leaf Mg Leaf Cl
(DA5D x DA3D)
x LM2T selfed AL61 2,551 0,156 0,987 0,856 0,154 0,630
(DA5D x DA3D)
x LM311P AL62 2,490 0,148 0,851 0,819 0,215 0,716
Rachis P
Rachis
K
(DA5D x DA3D)
x LM2T selfed AL61 0,076 2,34
(DA5D x DA3D)
x LM311P AL62 0,061 2,14
TLC K/TLC
Mg/
TLC Ca/TLC
(DA5D x DA3D)
x LM2T selfed AL61 80,6 31,4 15,7 52,9
(DA5D x DA3D)
x LM311P AL62 80,3 27,2 22,0 50,8
NB/p/yr FFB / kg palm AWB kg CPO/ t / ha
(DA5D x DA3D)
x LM2T selfed AL61 12,4 208,2 17,0 6,84
(DA5D x DA3D)
x LM311P AL62 10,1 191,4 19,2 6,42
LM311P is inducing much lower contents in leaf for nitrogen, phosphorus and potassium and
higher level in magnesium and chlorine. In term of production, ALCP 61 is characterized by
a larger number of smaller bunches per year.
Table 17 summarizes all the main statistical effects on the rachis or leaf mineral contents and
the production data. The rachis and the leaf mineral contents are concerning 2008 campaign.
Bunch number (BN), FFB (kg / tree), Average Bunch Weight (ABW; kg) and CPO (t / ha)
are concerning 2006 / 2007 campaign that is the last recorded campaign. Significant
differences are highlighted in bold and very significant in italic bold underlined police. The
phosphorus application is depressing potassium contents in the leaf (ALCP 61 and ALCP 62)
and in the rachis (ALCP 62). It increases the phosphorus contents in the leaf and in the rachis
in both the experiments. It increases the crop (FFB, ABW and CPO) in ALCP 62.
The nitrogen application is increasing the nitrogen (ALCP 61 & 62) and the potassium leaf
contents (ALCP 61). It is depressing the magnesium leaf contents in ALCP61.

The potassium application increases the potassium contents in leaf and rachis, but it depresses
the magnesium leaf contents in ALCP 61 only.
Last, but not least, the magnesium application is increasing the magnesium leaf contents in
ALCP 61 and crop (BN, FFB and CPO) in ALCP 62.
Table 17: rachis and leaf content, and production data main effects
Trial Effect Niv Rachis P
08 Rachis K
08 Leaf N
08 Leaf P
08 Leaf K
08 Leaf
Mg 08 BN
06_07 FFB
06_07 ABW 06_07
CPO 06_07
ALCP
061
Niv_P
0 0.060 2.62 2.547 0.151 1.041 0.147 12.0 200.7 16.9 6.64
1 0.073 2.28 2.557 0.156 0.976 0.155 12.5 208.3 16.7 6.80
2 0.096 2.11 2.551 0.160 0.942 0.161 12.6 215.5 17.3 7.09
Niv_N
0 0.083 2.38 2.494 0.154 0.941 0.161 12.5 210.4 17.0 6.96
1 0.074 2.22 2.571 0.156 0.982 0.155 12.4 206.5 16.9 6.80
2 0.072 2.41 2.590 0.156 1.037 0.147 12.3 207.6 16.9 6.76
Niv_K
0 0.071 1.64 2.579 0.157 0.894 0.178 12.2 207.4 17.2 7.01
1 0.079 2.17 2.540 0.156 0.965 0.155 12.5 212.0 17.0 6.86
2 0.079 3.20 2.534 0.154 1.100 0.130 12.4 205.1 16.7 6.66
Niv_Mg 1 0.079 2.37 2.529 0.155 1.001 0.134 12.3 205.9 16.9 6.76
2 0.074 2.30 2.574 0.157 0.972 0.175 12.4 210.4 17.1 6.92
ALCP
062
Niv_P
0 0.053 2.45 2.485 0.142 0.876 0.216 9.4 173.0 18.6 5.84
1 0.060 2.12 2.473 0.147 0.851 0.215 10.3 194.4 19.0 6.48
2 0.069 1.85 2.514 0.154 0.828 0.213 10.6 207.0 19.9 6.93
Niv_N
0 0.066 2.21 2.419 0.145 0.822 0.222 10.3 191.0 18.6 6.41
1 0.059 2.00 2.523 0.150 0.857 0.213 10.6 205.2 19.7 6.82
2 0.057 2.21 2.530 0.147 0.876 0.210 9.3 178.2 19.2 6.02
Niv_K
0 0.058 1.78 2.498 0.147 0.836 0.229 9.8 185.4 19.2 6.34
1 0.067 2.11 2.507 0.151 0.840 0.213 10.6 202.6 19.3 6.79
2 0.058 2.52 2.467 0.145 0.878 0.202 9.9 186.3 19.0 6.13
Niv_Mg 0 0.061 2.15 2.491 0.147 0.858 0.211 9.8 185.0 19.2 6.24
1 0.061 2.13 2.490 0.148 0.845 0.218 10.4 197.9 19.2 6.60
A regression analysis done according Foster method gives the following trend for both the
trials:
(DA5D x DA3D) x LM2T selfed (Table 18):
In such planting material, very high yield is obtained without fertiliser and optimum crop is
reached with the maximum rates of fertilizers (nearly 8 tons CPO/ha/year but 7.3 tons is
reached with only 0.5kg of Kieserite).
Table 18: Multiple regression on ALCP 61 results
Treatments CPO / ha / yr
N P K Mg
0 0 0 1 7.34
0 0 0 2 7.50
2 2 0 2 7.86
2 2 2 2 7.96

(DA5D x DA3D) x LM311P (Table 19):
The results appear more contrasted with ALCP 62. The yield is lower without fertilizer, but
response to the phosphorus application is vigorous (1.4 tons CPO/ha/year). A highest rate of
phosphorus fertilization gives optimum yield (7.68 tons CPO/ha/year), but increasing the
nitrogen and / or the potassium uptake is depressing strongly the yield by more than 1 tons
CPO/ha.
Table 19: Multiple regression on ALCP 62 results
Treatments CPO / ha / yr
N P K Mg
0 0 0 0 6.23
0 0 1 0 6.56
0 0 1 1 (6.83)
0 1 1 0 6.93
0 1 1 1 7.21
1 1 1 1 7.57
1 2 1 1 7.68
1 2 2 1 6.61
2 2 2 1 6.12
Finally, the (DA5D x DA3D) x LM2T selfed material could reach nearly 8 tons CPO/ha, the
corresponding total fertilizer rate is attaining 8.5 kg. The optimum potential of (DA5D x
DA3D) x LM311P reaches 7.7 tons CPO/ha, but corresponding total fertilizer rate is only 4
kg per tree, saving particularly 2 kg in Urea and Potassium Chlorine. However, LM311P
appears to be hungrier for P than LM2T and 1.5 kg RP does not appear sufficient to fulfil
LM311P phosphorus requirements. Adding more N or K does not improve the yield as P is
the most limiting factor which will need to be corrected before any effect of N or K can be
seen.
LM311P as ancestor has been regularly cited in association with LM5T for its particular
behavior in the mineral nutrition. The results presented above, should be confirmed with
more experiments. But they are clear food for thought that some material could better use
specific nutrient than others, and there is a very wide scope of investigation to adapt specific
material to specific natural resources.
CONCLUSION
According this short study, it appears that in PT Socfindo germplasm, the Deli group ancestor
families and the African ancestor families could be gather together within specific groups
corresponding to their relative leaf nutrient contents: particularly families deriving from
DA115D, BB206D from A group, LM5T, LM311P and Yangambi sources from B group
display very specific characteristics.
According the comparison between the Aek Loba Timur project and the commercial
plantings, some families such as DA115D or BB206D, for example, could have different
nutritional behavior according the calcium context.
The interesting relationship between nitrogen and Total Leaf Cation proposed by Foster on
DAMI materials should be studied more deeply on more compact materials like Deli x La Mé
ones.
After proving the genetic influence on the critical levels, new analyses realised on two
fertiliser trials at Aek Loba give food for thought that the fertilisation management should be
apprehended in taking into account the origin of the material and this might be even more
important in the future if cloning material is used.
In that matter, PT Socfindo and CIRAD are implementing a specific set of experiments
studying the mineral nutrition – genotype interaction focusing on the nitrogen and the
potassium nutrition, and the fertilisation by using ancestors that have a contrasted behavior as
shown in this paper.
ACKOWLEDGEMENTS
The work described in this paper was carried out under a scientific collaboration agreement
between Centre de Coopération Internationale en Recherche Agronomique pour le
Développement (CIRAD) and PT Socfin Indonesia (Socfindo). Special thanks are provided to
Dr Foster and Dr Flori (Cirad) for their advice and support for presented statistical analyses.
The authors wish to thank the management of Socfindo and CIRAD for permission to publish
these results.

REFERENCES
CALIMAN J.P., DANIEL C. and TAILLIEZ B. (1994). Oil Palm mineral nutrition.
Plantations, recherche, développement, 1 (3): 36-54.
CORLEY R.H.V. and P.B. TINKER (2003). The Oil Palm (Fourth Edition) – Blackwell
Science Editor – London. 562 p.
FOSTER H.L. (2003). Assessment of Oil Palm Fertilizer Requirements in “Oil Palm –
Management for large and sustainable yields” FAIRHURST T. And HÄRDTLER R.
Editors; PPI / PPIC – Singapore. 382 p.
FOSTER H.L. and PRABOWO N.E. (1996). Variation in the potassium fertiliser
requirements of oil palm in North Sumatra. 1996 PORIM International Oil Palm Congress
on “Competitiveness for the 21st century”, 23-28 September 1996, Kuala Lumpur,
Malaysia.
HARTLEY C.W.S., 1988. The Oil Palm. Longman, London, UK. (3rd
ed.) 761 p.
JACQUEMARD J.C., EDYANA SURYANA and ASMADY (2000). Aek Loba Timur
project: a new step for the oil palm (Elaeis guineensis Jacq.) improvement at PT Socfindo.
2001 PIPOC on “Cutting-Edge Technologies for Sustained Competitiveness”, 20 – 22
August 2001, Kuala Lumpur, Malaysia.
JACQUEMARD J.C., TAILLIEZ B., DADANG K., OUVRIER M and ASMADY (2002).
Oil palm (Elaeis guineensis Jacq.) nutrition: Planting material effect. 2002 International Oil
Palm Conference and Exhibition, 8 – 12 July 2002, Bali, Indonesia
OLLAGNIER M., DANIEL C., FALLAVIER P. and OCHS R. (1987). The influence of
climate and soil on potassium critical level in oil palm leaf analysis. Oléagineux, 42 (12):
435-447.
OCHS R. and OLLIVIN J. (1977). Leaf analysis for the control of nutrition in oil palm
plantation – taking of leaf samples. Oléagineux, 32 (5): 211 – 216
TAMPUBOLON F.H., DANIEL C. And OCHS R. (1990). Oil palm responses to nitrogen
and phosphate fertiliser in Sumatra. Oléagineux, 45: 475 - 486

Annex 1
Fertilisation tables for the Aek Loba Timur Project at immature stage
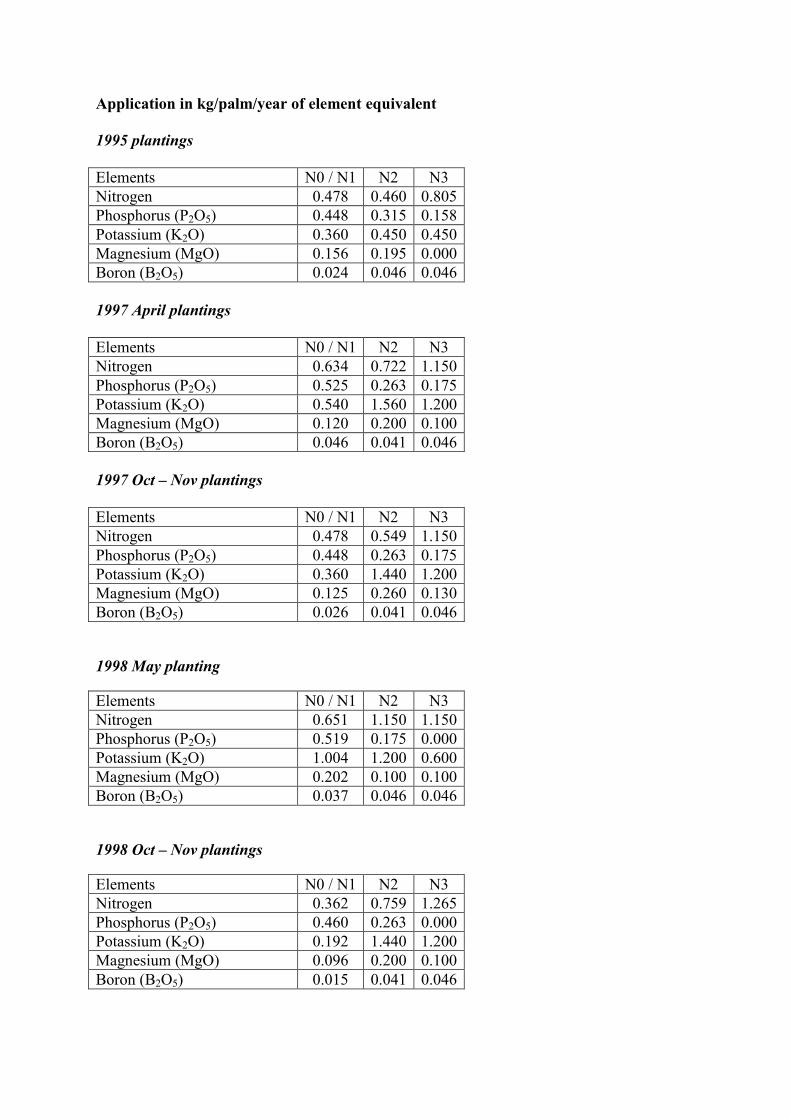
Application in kg/palm/year of element equivalent
1995 plantings
Elements N0 / N1 N2 N3
Nitrogen 0.478 0.460 0.805
Phosphorus (P2O5) 0.448 0.315 0.158
Potassium (K2O) 0.360 0.450 0.450
Magnesium (MgO) 0.156 0.195 0.000
Boron (B2O5) 0.024 0.046 0.046
1997 April plantings
Elements N0 / N1 N2 N3
Nitrogen 0.634 0.722 1.150
Phosphorus (P2O5) 0.525 0.263 0.175
Potassium (K2O) 0.540 1.560 1.200
Magnesium (MgO) 0.120 0.200 0.100
Boron (B2O5) 0.046 0.041 0.046
1997 Oct – Nov plantings
Elements N0 / N1 N2 N3
Nitrogen 0.478 0.549 1.150
Phosphorus (P2O5) 0.448 0.263 0.175
Potassium (K2O) 0.360 1.440 1.200
Magnesium (MgO) 0.125 0.260 0.130
Boron (B2O5) 0.026 0.041 0.046
1998 May planting
Elements N0 / N1 N2 N3
Nitrogen 0.651 1.150 1.150
Phosphorus (P2O5) 0.519 0.175 0.000
Potassium (K2O) 1.004 1.200 0.600
Magnesium (MgO) 0.202 0.100 0.100
Boron (B2O5) 0.037 0.046 0.046
1998 Oct – Nov plantings
Elements N0 / N1 N2 N3
Nitrogen 0.362 0.759 1.265
Phosphorus (P2O5) 0.460 0.263 0.000
Potassium (K2O) 0.192 1.440 1.200
Magnesium (MgO) 0.096 0.200 0.100
Boron (B2O5) 0.015 0.041 0.046

1999 March – April plantings
Elements N0 / N1 N2 N3
Nitrogen 0.251 1.035 1.380
Phosphorus (P2O5) 0.286 0.263 0.350
Potassium (K2O) 0.617 1.440 1.320
Magnesium (MgO) 0.137 0.200 0.300
Boron (B2O5) 0.041 0.046
2000 April – May plantings
Elements N0 / N1 N2 N3
Nitrogen 0.268 1.196 1.288
Phosphorus (P2O5) 0.263 0.300 0.300
Potassium (K2O) 0.065 1.080 1.320
Magnesium (MgO) 0.043 0.180 0.300
Boron (B2O5) 0.008 0.076 0.103

Annex 2
Leaf Cation balance data
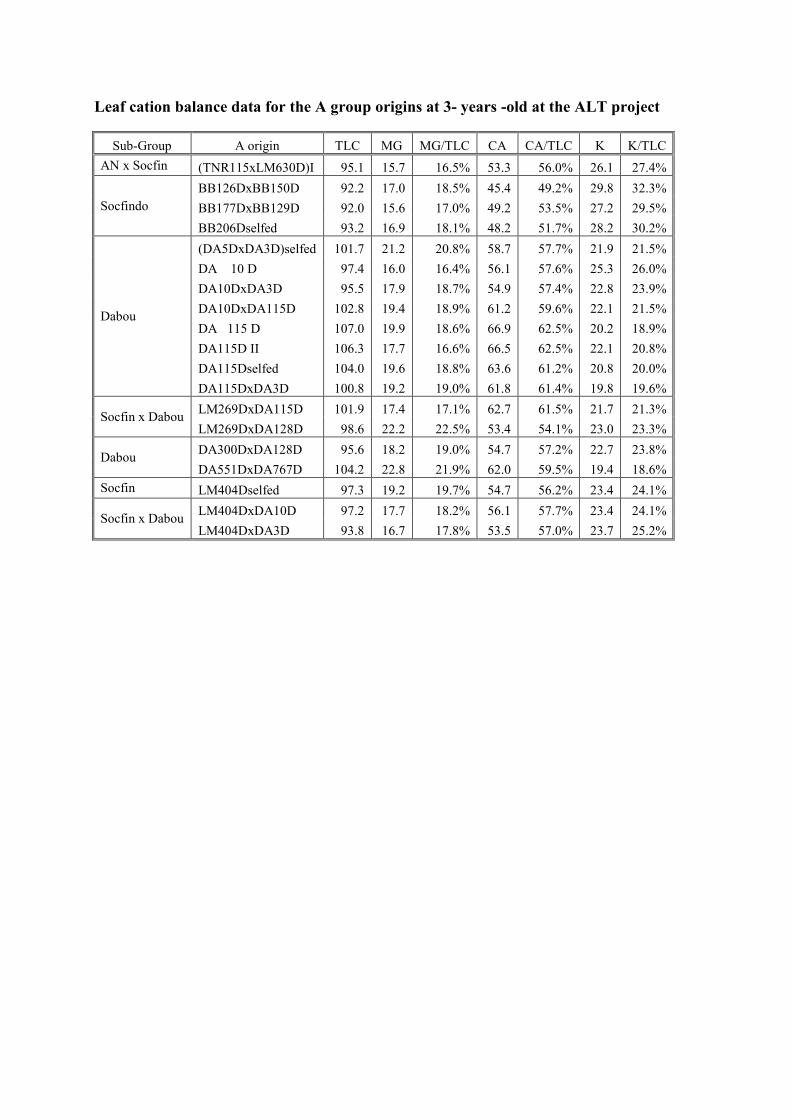
Leaf cation balance data for the A group origins at 3- years -old at the ALT project
Sub-Group A origin TLC MG MG/TLC CA CA/TLC K K/TLC
AN x Socfin (TNR115xLM630D)I 95.1 15.7 16.5% 53.3 56.0% 26.1 27.4%
Socfindo
BB126DxBB150D 92.2 17.0 18.5% 45.4 49.2% 29.8 32.3%
BB177DxBB129D 92.0 15.6 17.0% 49.2 53.5% 27.2 29.5%
BB206Dselfed 93.2 16.9 18.1% 48.2 51.7% 28.2 30.2%
Dabou
(DA5DxDA3D)selfed 101.7 21.2 20.8% 58.7 57.7% 21.9 21.5%
DA 10 D 97.4 16.0 16.4% 56.1 57.6% 25.3 26.0%
DA10DxDA3D 95.5 17.9 18.7% 54.9 57.4% 22.8 23.9%
DA10DxDA115D 102.8 19.4 18.9% 61.2 59.6% 22.1 21.5%
DA 115 D 107.0 19.9 18.6% 66.9 62.5% 20.2 18.9%
DA115D II 106.3 17.7 16.6% 66.5 62.5% 22.1 20.8%
DA115Dselfed 104.0 19.6 18.8% 63.6 61.2% 20.8 20.0%
DA115DxDA3D 100.8 19.2 19.0% 61.8 61.4% 19.8 19.6%
Socfin x Dabou LM269DxDA115D 101.9 17.4 17.1% 62.7 61.5% 21.7 21.3%
LM269DxDA128D 98.6 22.2 22.5% 53.4 54.1% 23.0 23.3%
Dabou DA300DxDA128D 95.6 18.2 19.0% 54.7 57.2% 22.7 23.8%
DA551DxDA767D 104.2 22.8 21.9% 62.0 59.5% 19.4 18.6%
Socfin LM404Dselfed 97.3 19.2 19.7% 54.7 56.2% 23.4 24.1%
Socfin x Dabou LM404DxDA10D 97.2 17.7 18.2% 56.1 57.7% 23.4 24.1%
LM404DxDA3D 93.8 16.7 17.8% 53.5 57.0% 23.7 25.2%

Leaf cation balance data for the A group origins at 5 to 7- years -old at the ALT project
Sub-Group A origin TLC MG
MG/TL
C CA
CA/TL
C K
K/TL
C
AN x Socfin (TNR115xLM630D)I 83.0 13.3 16.0% 43.9 53.0% 25.8 31.1%
Socfindo
BB126DxBB150D 80.2 14.1 17.5% 36.9 45.9% 29.3 36.5%
BB177DxBB129D 80.3 12.4 15.5% 39.6 49.3% 28.3 35.2%
BB206Dselfed 82.0 13.2 16.1% 39.0 47.6% 29.8 36.4%
Dabou
(DA5DxDA3D)selfed 87.1 16.0 18.3% 45.4 52.1% 25.8 29.6%
DA 10 D 83.6 13.3 16.0% 42.8 51.2% 27.5 32.9%
DA10DxDA3D 83.3 13.8 16.6% 45.2 54.2% 24.3 29.2%
DA10DxDA115D 86.0 15.0 17.4% 46.7 54.3% 24.3 28.3%
DA 115 D 90.3 16.0 17.8% 50.8 56.3% 23.4 25.9%
DA115D II 84.7 14.1 16.6% 45.8 54.0% 24.9 29.4%
DA115Dselfed 87.7 16.0 18.3% 49.0 55.9% 22.6 25.8%
DA115DxDA3D 85.2 14.2 16.6% 48.8 57.3% 22.2 26.0%
Socfin x Dabou
LM269DxDA115D 85.1 14.8 17.4% 45.9 54.0% 24.3 28.6%
LM269DxDA128D 86.2 17.0 19.8% 45.0 52.3% 24.1 28.0%
Dabou DA300DxDA128D 83.6 15.6 18.6% 42.8 51.2% 25.3 30.2%
DA551DxDA767D 91.1 21.4 23.5% 51.5 56.5% 18.3 20.0%
Socfin LM404Dselfed 84.6 15.3 18.1% 45.0 53.2% 24.3 28.7%
Socfin x Dabou
LM404DxDA10D 85.2 14.9 17.5% 45.5 53.4% 24.8 29.1%
LM404DxDA3D 82.1 13.5 16.4% 43.8 53.4% 24.7 30.1%
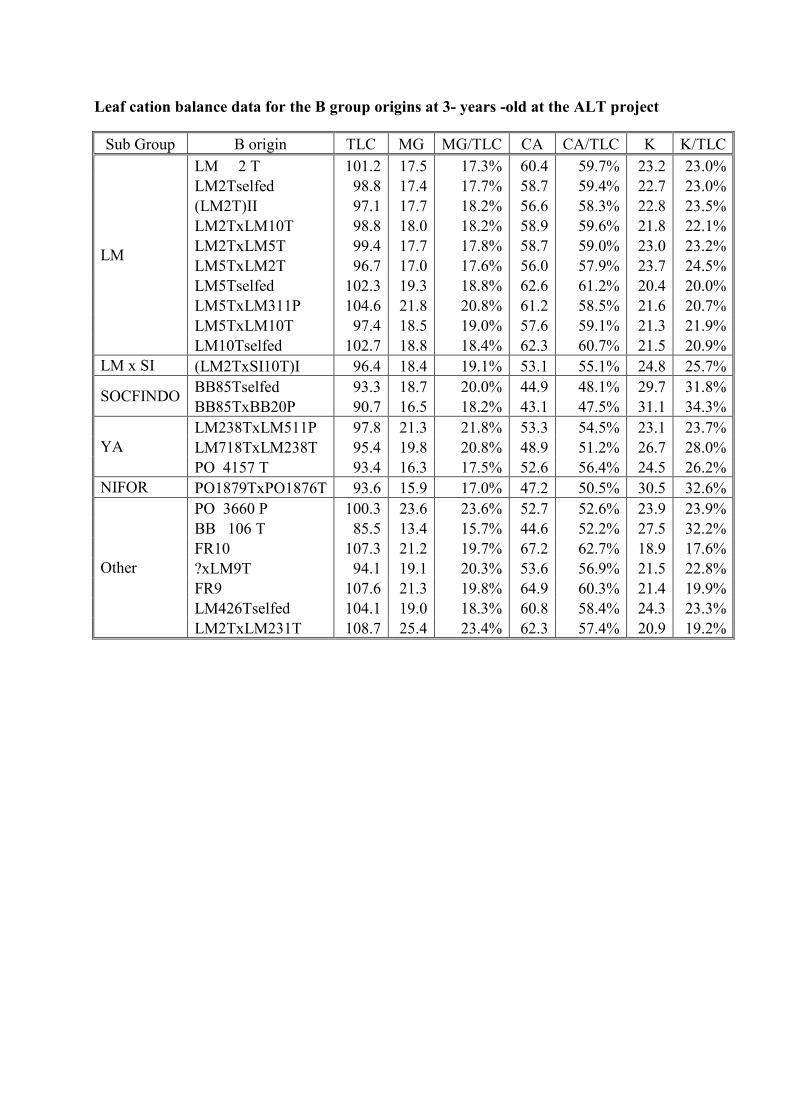
Leaf cation balance data for the B group origins at 3- years -old at the ALT project
Sub Group B origin TLC MG MG/TLC CA CA/TLC K K/TLC
LM
LM 2 T 101.2 17.5 17.3% 60.4 59.7% 23.2 23.0%
LM2Tselfed 98.8 17.4 17.7% 58.7 59.4% 22.7 23.0%
(LM2T)II 97.1 17.7 18.2% 56.6 58.3% 22.8 23.5%
LM2TxLM10T 98.8 18.0 18.2% 58.9 59.6% 21.8 22.1%
LM2TxLM5T 99.4 17.7 17.8% 58.7 59.0% 23.0 23.2%
LM5TxLM2T 96.7 17.0 17.6% 56.0 57.9% 23.7 24.5%
LM5Tselfed 102.3 19.3 18.8% 62.6 61.2% 20.4 20.0%
LM5TxLM311P 104.6 21.8 20.8% 61.2 58.5% 21.6 20.7%
LM5TxLM10T 97.4 18.5 19.0% 57.6 59.1% 21.3 21.9%
LM10Tselfed 102.7 18.8 18.4% 62.3 60.7% 21.5 20.9%
LM x SI (LM2TxSI10T)I 96.4 18.4 19.1% 53.1 55.1% 24.8 25.7%
SOCFINDO BB85Tselfed 93.3 18.7 20.0% 44.9 48.1% 29.7 31.8%
BB85TxBB20P 90.7 16.5 18.2% 43.1 47.5% 31.1 34.3%
YA
LM238TxLM511P 97.8 21.3 21.8% 53.3 54.5% 23.1 23.7%
LM718TxLM238T 95.4 19.8 20.8% 48.9 51.2% 26.7 28.0%
PO 4157 T 93.4 16.3 17.5% 52.6 56.4% 24.5 26.2%
NIFOR PO1879TxPO1876T 93.6 15.9 17.0% 47.2 50.5% 30.5 32.6%
Other
PO 3660 P 100.3 23.6 23.6% 52.7 52.6% 23.9 23.9%
BB 106 T 85.5 13.4 15.7% 44.6 52.2% 27.5 32.2%
FR10 107.3 21.2 19.7% 67.2 62.7% 18.9 17.6%
?xLM9T 94.1 19.1 20.3% 53.6 56.9% 21.5 22.8%
FR9 107.6 21.3 19.8% 64.9 60.3% 21.4 19.9%
LM426Tselfed 104.1 19.0 18.3% 60.8 58.4% 24.3 23.3%
LM2TxLM231T 108.7 25.4 23.4% 62.3 57.4% 20.9 19.2%

Leaf cation balance data for the B group origins at 5 to 7- years -old at the ALT project
Sub Group B origin TLC MG MG/TLC CA CA/TLC K K/TLC
LM
LM 2 T 86.2 14.4 16.7% 46.0 53.3% 25.9 30.0%
LM2Tselfed 83.7 14.0 16.7% 44.8 53.5% 24.9 29.7%
(LM2T)II 83.0 14.2 17.2% 43.2 52.1% 25.5 30.8%
LM2TxLM10T 84.5 14.0 16.6% 46.5 55.1% 24.0 28.4%
LM2TxLM5T 85.0 14.3 16.8% 45.7 53.8% 24.9 29.3%
LM5TxLM2T 83.2 12.4 14.9% 43.9 52.8% 26.8 32.2%
LM5Tselfed 87.0 15.4 17.7% 49.0 56.3% 22.7 26.0%
LM5TxLM311P 89.7 17.7 19.7% 48.4 53.9% 23.6 26.3%
LM5TxLM10T 84.0 15.0 17.8% 45.6 54.3% 23.4 27.9%
LM10Tselfed 86.5 14.1 16.3% 48.5 56.1% 23.9 27.7%
LM x SI (LM2TxSI10T)I 83.6 16.0 19.2% 41.9 50.2% 25.6 30.6%
SOCFINDO BB85Tselfed 80.3 15.1 18.8% 36.2 45.0% 29.1 36.2%
BB85TxBB20P 80.5 14.2 17.6% 35.2 43.8% 31.1 38.6%
YA
LM238TxLM511P 86.8 18.3 21.0% 45.4 52.3% 23.1 26.6%
LM718TxLM238T 83.8 16.0 19.1% 41.2 49.1% 26.6 31.7%
PO 4157 T 85.6 15.0 17.5% 45.3 53.0% 25.2 29.5%
NIFOR PO1879TxPO1876T 82.2 11.8 14.3% 39.1 47.5% 31.4 38.2%
Other
PO 3660 P 82.3 15.2 18.5% 40.1 48.7% 27.0 32.8%
BB 106 T 75.9 11.1 14.6% 36.8 48.4% 28.1 37.0%
FR10 88.6 18.5 20.9% 47.2 53.3% 22.9 25.8%
?xLM9T 81.1 15.6 19.3% 41.5 51.2% 23.9 29.5%
FR9 91.1 17.5 19.3% 50.0 54.9% 23.5 25.8%
LM426Tselfed 86.5 15.0 17.3% 46.5 53.7% 25.0 28.9%
LM2TxLM231T 92.0 18.8 20.5% 49.3 53.6% 23.9 25.9%

Leaf Cation balance data for the A group families in the commercial plantings at 3-
years -old
Sub-group A origin TLC K/TLC Ca/TLC Mg/TLC
SOCFINDO BB126D x BB150D 95.2 29.6 46.6 23.8
BB206D selfed 98.6 27.5 49.6 23.0
DABOU
DA115D selfed 92.4 27.1 45.7 27.2
DA115D x (DA5DxDA3D) 94.4 30.5 46.4 23.2
DA5D x DA3D 90.3 28.9 44.5 26.6
SOCFIN x DABOU
(DA5D x DA3D) x (LM404D x DA10D) 89.6 28.4 45.6 25.9
LM404D x (DA5DxDA3D) 97.6 25.5 53.4 21.1
LM404D x DA10D 95.4 27.7 47.8 24.6
LM404D x LM270D 94.4 29.4 40.5 30.1
Leaf Cation balance data for the B group families in the commercial plantings at 3-
years -old
Sub-group A origin TLC K/TLC Ca/TLC Mg/TLC
La Mé
LM2Tself 91.4 28.1 46.2 25.7
LM5Tself 90.8 28.0 45.8 26.1
LM5TxLM311P 93.6 24.0 50.1 25.9
Yangambi LM718Tself 98.6 27.5 49.6 23.0
LM718TxLM238T 94.7 29.5 42.6 28.0