elasticity of some mantle crystal herbert b.a., …
TRANSCRIPT

ELASTICITY OF SOME MANTLE
CRYSTAL STRUCTURES
by
HERBERT FAN WANG
B.A., University of Wisconsin
(1966)
A.M., Harvard University
(1968)
SUBMITTED IN
PARTIAL FULFILLMENT
OF THE REQUIREMENTS FOR THE
DEGREE OF DOCTOR OF PHILOSOPHY
at the
MASSACHUSETTS INSTITUTE OF
TECHNOLOGY
September, 1971
Signature of
Department
Author.. ......
of Earth and Planetary iences, August 23, 1971
Certified by ...................
Thesis Supervisor
Accepted by. ...........................
Chairman, Departmental Committee on Graduate Students
a ES

-t 2
Elasticity of Some Mantle Crystal Structures
by Herbert Fan Wang
Submi-tted to the Department of Earth and Planetary Sciences inAugust, 1971 in partial fulfillment of the requirements forthe degree of Doctor of Philosophy.
Abstract
The elasticity of high-pressure mantle phases may becharacterized by crystal chemically similar compounds. Ana-logue compounds available as single crystals yield the mostreliable elastic constant data. The single-crystal elasticconstants of pleonaste and hercynite spinel, rutile-structuregermanium dioxide, and spessartite-almandine garnet are stud-ied, in most cases as a function of pressure and temperature.High-pressure phases of olivine, silica, and pyroxene occur inthe spinel, rutile, and garnet structures, respectively.'
The pressure derivative of the shear mode (C11 - C12)/2is slightly negative for pleonaste. Small shear moduli pres-sure derivatives are characteristic of the spinel structureand imply a low kinetic barrier to phase transformations anddiffusion. The pleonaste and hercynite elastic constant datadetermine the compressional and shear velocities as a functionof mean atomic weight for the spinel phase of olivine. Thecompressional velocity data indicate an increase in mean atom-ic weight in the transition zone while the shear velocity dataindicate no increase.
The bulk modulus pressure derivative, 3K/3P, of rutile-structure germanium dioxide is about 6.2. It is likely thataK/DP of stishovite is between 6 and 7. The seismic parameter4 of stishovite is not well-determined at present and its usein a molar averaging scheme to deduce the iron and siliconcontent of the lower mantle contains inconsistencies. Thereis no strong evidence for enrichment of either component inthe lower mantle.
The elastic constant pressure derivatives of spessartite-almandine garnet are similar to almandine-pyrope. The elasticvelocities of garnet-transformed pyroxenes may be estimatedfrom an inverse proportionality relation between the seismicparameter @ and mean atomic weight M. The velocity changeover the pyroxene -+ garnet transformation is then 20% for com-pressional waves and 10% for shear waves.
Thesis Supervisor: Gene Simmons
Title: Professor of Geophysics

3
Acknowledgments
There would have been no thesis without the single-crys-
tal samples. The pleonaste and hercynite were given to me by
Dr. Glen Slack of the General Electric Research and Development
Center. The GeO 2 crystal was given to me by Capt. John Goodrum
and C. Dugger of the Air Force Cambridge Research Laboratories.
Several people contributed to the experimental work. Dr. A.
Reid of the NASA Manned Spacecraft Center did the microprobe
analyses of the pleonaste and garnet samples. P. McFarlin mea-
sured the lattice parameter of the pleonaste sample. J. Kalnajs-
and E. Farrell of the MIT Crystal Physics Laboratory taught me
how to determine precision hydrostatic densities and how to
orient my crystals. Dr. E. Papadakis used his equipment at
Panametrics, Inc. to measure the elastic constants of the ex-
tremely small hercynite sample. A.W. England and D.H. Chung
showed me how to-use the ultrasonic equipment. D. Silversmith
helped me understand some of the subtleties of the equipment
via telephone conversations. My advisor, Gene Simmons, gave
encouragement and advice from the beginning of the study through
the preparation of the manuscript. I had many discussions with
D. Weidner and T. Todd. C. Sande and R. Fitterman did typing
and organizational work. I thank my wife, Rosemary, for her
patience and understanding over the last couple of years.
The experimental costs of my study were absorbed by
NASA Contract NAS9-8102. Money is not without value.

4
Table of Contents
Page
Abstract 2
Acknowledgments 3
I. Introduction 7
A. Statement of thesis problem 7
B. Background literature 8
References 9
II. Elastic constants of pleonaste and hercynite spinel 10
A. Sample descriptions 10
B. Experimental method and results 13
C. Comparison with other experimental and
theoretical work 17
D. Lattice modes, crystal stability, and
phase transformations 23
E. Diffusion kinetics 32
F. Iron substitution and the Jahn-Teller effect 34
G. Iron substitution, velocity-density
relations, and the transition zone 36References 42
Tables 52
Figure captions 62
Figure's 65
III. Elastic constants of rutile-structure GeO2 77
A. GeO 2 phase diagram and thermochemical data 80
B. Sample description 81

Page
C. Experimental method and results 82
D. Comparison with other work 86
E. Phase transformation and diffusion kinetics 95
F. FeO and SiO2 in the lower mantle 100
References 105
Tables 111
Figure captions 119
Figures 120
IV. Elastic constants of spessartite-almandine garnet 127
A. Sample description 129
B. Experimental method and results 131
C. Comparison with other garnets 133
D. Garnec's role in the mantle 143
References 147
Tables 150
Figure captions 160
Figures 161
V. Summary 165
A. Spinel 165
B. Rutile 166
C. Garnet 166
Appendix A: Experimental procedure 168
A. X-ray orientation and polishing 168
B. Transducers and bonding 170
C. Ultrasonic equipment 172
D. Ambiguities in the measurements 174
E. Reduction of raw data 184

Page
F. Pressure system 186
G. Temperature system 187
H. Density determination 188
References 189
Table 191
Figure captions 193
Figures 196
Appendix B: Least squares fits to pressure data 206
Tables 207
Biographical note 211

Introduction
I. Introduction.
Laboratory ultrasonic experiments on oxides and silicates
provide basic data for the interpretation of seismic velocity
profiles in the earth's mantle. The mineral phases hypothe-
sized to be stable in the transition zone and lower mantle
-are usually not available in quantities sufficient for elas-
ticity experiments. Ultrasonic measurements on compounds
which are crystal structure analogues to high pressure mineral
phases then become important.
A. Statement of thesis problem.
I studied the single-crystal elastic constants of pleo-
naste spinel and hercynite spinel (Chapter II), rutile-struc-
ture germanium dioxide (Chapter III), and spessartite-alman-
dine garnet (Chapter IV). Ringwood [1970] reviewed the
depths where these structures are expected. The major phases
of the upper mantle are olivine and pyroxene. Between 300 and
450 km depth pyroxene transforms into the garnet structure and
olivine transforms into the spinel structure. At 650 km
olivine and pyroxene are expected to further transform,
possibly into an isochemical mixture of oxides. The stable
form of Sio2 at this depth would be stishovite which has the
rutile structure. If Sio 2 wvere chemically combined with
other oxides, the silicon.would probably also be in 6-fold
coordination like in stishovite.

Introduction
The new elastic constant data lead to a consideration
of aspects of the following questions: Are negative values
of the pressure derivatives of some shear constants related
to phase transformation or diffusion kinetics? Is there
evidence for iron or silicon enrichment in the lower mantle?
Do density - mean atomic weight - velocity relations fit the
data for spinel,-rutile, and garnet structure compounds? Can
the velocities of high-pressure mantle phases be estimated?
B. Background literature.
Two comprehensive review papers [Birch, 1952; Ringwood,
1970] provide the basic background for understanding my
thesis study. Birch [1952] reviewed the application of solid
state physics to the elasticity and constitution of the earth's
interior. He concluded that phase transitions to close-packed
oxides such as periclase, rutile, spinel, or corundum were
required to explain the elasticity of the 400 to 1000 km
depth region of the mantle. Direct confirmation of.the impor-
tance of phase transitions was made from high pressure and
high temperature phase studies on silicates and their crystal
chemical an.alogues [reviewed by Ringwood, 1970]. Other useful
review papers on the constitution of the earth's mantle are
Clark and Ringwood [1964], Ringwood [1966], and D.L. Anderson
et al. [1971].

9
Introduction
References
Anderson, D.L., C. Sammis, and T. Jordan, Composition and
evolution of the mantle and core, Science, 171, 1103-1112,
1971.
Birch, F., Elasticity and constitution of the earth's-interior,
J. Geophys. Res., 57, 227-286, 1952.
Clark, S.P., Jr., and A.E. Ringwood, Density distribution and
constitution of the mantle, Rev. Geophys., 2, 35-28, 1964.
Ringwood, A.E., Mineralogy of the mantle, in Advances in
Earth Science, edited by P.M. Hurley, pp. 357-399, MIT Press,
Cambridge, 1966.
rRingwood, A.E., Phase transformations and the constitution of
the mantle, Phys. Earth Planet. Interiors, 3, 109-155, 1970.

10 1
Spinel
II. Elastic constants of pleonaste and hercynite spinel.
Pleonaste and hercynite are iron-bearing spinels [see
Deer et al., 1962, Vol. 5, p.62] whose elastic properties
are of interest for two reasons: (1) Iron-bearing spinel is
present as a minor phase in the upper mantle and (2) Iron-
bearing spinel serves as an analogue to the spinel phase of
olivine. This chapter emphasizes the analogue aspect, par-
ticularly in considering the shear behavior of pleonaste as
a function of pressure and the effect of iron substitution in
the spinel structure.
A. Sample descriptions.
1. Pleonaste.
The natural pleonaste sample was obtained from Dr. Glen
Slack of the General Electric Company. Its location of origin
was Queensland, Australia and its surface had a stream-worn
appearance before cutting. The pleonaste was black and
opaque because of the iron content. The polished faces gave
mirror-like reflections and no flaws were visible under 3X
magnification.
The microprobe analysis shown in Table II.1 was done
by A. Reid of the NASA Manned Spacecraft Center. The weight
percentages have been recalculated into the molecular for-
mula Mg0 .75Fe0 .36 Al1.9004, assuming an ideal four oxygens
and neglecting the minor elements. If the titanium is Ti 4+,
then the iron is all Fe + since the total charge balance is

11
Spinel
satisfied almost exactly [see also Slack, 1962, p.43 01 .
The pleonaste spinel is essentially MgAl2O4 with 25% of the
2+ 3+ 2+Mg and 5% of the Al replaced by Fe
The hydrostatically determined density of the pleonaste
was 3.817 g/cm 3 [for a description of the method see Smakula
and Sils, 1955]. A density of 3.836 g/cm 3 was calculated
from the molecular weight based on the microprobe analysis0
of Table II.1 and a lattice parameter of 8.1225 A. An
average value of 3.826 g/cm 3 was used in the determination
of the elastic constants.
A mean atomic weight-of 21.9 was calculated directly
from the formula
M = ( /m ))~1 (Eqn. II.1)
where x. = wt. % of oxide
and m. = mean atomic weight of oxide.
On the other hand M = 21.6 from the approximate chemical
formula. There is an excess of cations compared to the num-
ber expected for 4 oxygens (E cations = 3.03 versus ideal
E = 3.00).
After X-ray orientation the pleonaste sample appeared
as sketched in Fig. II.l. Its weight was 1.234 g, the [100]-
path length was 4.933 mm, and the [1101-path length was
6.645 mm.

Spinel
2. Hercynite, FeAl2 04
The hercynite sample was also obtained from Dr. Glen
Slack of General Electric. The synthetically grown FeAl 204
is actually sample R75 described in Slack [1964]. FeAl 204
is basically a normal spinel (Fe2+ in tetrahedral sites) but
Slack found indications for 15% Fe2+ in octahedral sites
since annealing at 1200*C introduced some disorder.
The FeAl 204 sample came as a rectangular bar about
4 x 4 x 10 mm with all sides {l00}-faces. The end face of
the bar was X-ray oriented and the bar was cut in half. The
end {l00}-faces of one-half of the bar were then polished
;flat and parallel. A pair of 45* cuts were then made on the
remaining half of the bar to obtain {110}-faces. The cuts
are shown in Fig. 11.2. The [1001-path length was 4.104 mm
and the [1101-path length was just 1.763 mm.
An X-ray density of 4.280 g/cm 3 was calculated from a0
lattice parameter of 8.140 A [Slack, 1964]. The mean atomic
weight M = 24.8.

Spinel
B. Experimental method and results.
1. Pleonaste.
The elastic constants of the pleonaste spinel were
measured to 5 kb at room temperature (20 *C) by the pulse-
echo-overlap technique [Papadakis, 1967; Chung et al., 1969].
The pleonaste was oriented to 1/20 with a Laue back-reflection
camera in the [110] and [1001-directions. The two sets of
faces were optically polished flat and parallel to 10~4 in/in
by the A.D. Jones Optical Works of Burlington, Mass.
For compressional wave modes, the travel time was only
slightly longer than one microsecond and there was a little
difficulty in damping one echo before the next arrived. Also
since the {110} and {100}-faces were mutually perpendicular
and since there were over fifty echoes in a pulse train,
guided-wave mode.effects existed, particularly for compres-
sional waves in the [110]-direction at 20 MHz. The measure-
ments in this direction were done at 30 MHz by driving the
third overtone of a 10 MHz transducer. The guided-wave effect
was reduced enough to select a pair of early, unmodulated
echoes. Papadakis [1969] discussed the precautions.to be
taken in the pulse-echo-overlap method when guided-wave
effects are present.

14
Spinel
On the basis of pressure runs for modes (Table 11.2 and
Fig. 11.3) yielding C i, C = 1/2 (C11 - C1 2 C 4 4 , and
C L= 1/2 (C + C + 2C 44), the C.. are considered to be
accurate to 0.5% and the 3C../DP accurate to 5%. Temperature1J
runs to 100 *C were made for the two shear constants C44
and Cs. No compressional wave temperature runs were success-
ful due to the short path lengths and bonding difficulties.
The 3C. ./DT are considered to be accurate to 10%.lJ
The raw frequency versus pressure data were fitted by a
least squares linear relation from which the derivative of
the "effective elastic constant" [Thurston, 1965a] was ob-
,tained either by computing the elastic constant C.. at
different pressures and finding the slope, or by differen-
tiating the expression
C.. = 4 p 12 f2 (Eqn. 11.2)13
where p = density
1 = path length
f = reciprocal round trip travel time
with respect to pressure and evaluating it at P = 0. The
adiabatic rather than isothermal bulk modulus was used in
calculating 3C. ./aP since the difference does not effect the
result within the stated 5% accuracy. Temperature derivatives
were obtained by the slope method.

15
Spinel
The results of the single crystal measurements are.
tabulated in Table 11.3 and calculated aggregate properties
are tabulated in Table II.4. The DS. ./DP were calculated1J
from the matrix relation
= - S a S (Eqn. 11.3)
[see, for example, Finkbeiner, 1960, Theorem 10.8, p.203].
For the cubic case the DS. ./aP may be obtained from direct
differentiation of formulas for S.. in terms of the C... For
lower symmetries the matrix multiplication method becomes most
convenient [see also Thurston, 1965b]. The alternative would
-lbe to compute S., = C.. as a function of pressure and to
obtain 3S../3P by finding the slope. Explicit expressionsLJ
become quite messy because of the triple matrix product, and
in fact the expressions for the orthorhombic case given by
Kumazawa and Anderson [1969] are not even dimensionally
correct.
The calculated averages are based on the schemes of
Voigt [1928], Reuss [1929], Hashin and Shtrikman [1962a,
1962b], and Krbner [1967]. The larger.of the Hashin-Shtrikman
bounds has been called Hashin and the smaller Shtrikman. The
calculated averages for the derivatives are to be considered
simply as the derivatives of the zero pressure formulas
[see Chung, 1967 for "Voigt" and "Reuss" applications to
cubic, hexagonal, trigonal, and tetragonal symmetries] and not4*
NOMMUNW-

Spinel
an extension of these averaging methods to third order
elastic constants [Barsch, 1968; Hamilton and Parrott, 1968].
No bounds for these derivative averages are implied [for a
discussion see Knopoff and Shapiro, 1969].
2. Hercynite, FeAl2 04
Because of the extremely small size of the FeAl 204
sample combined with relatively high velocities, the rf-
pulse-echo-overlap method of the previous section could not be
used. The rf-pulse had a nominal 0.5 ysec width but in prac-
tice it was difficult to resolve echoes separated by less than
1.0 psec. For the longitudinal mode in the [100]-direction,
echoes were separated by about 0.4 ysec.
The velocity measurements were made by E. Papadakis of
Panametrics, Inc., Waltham, Mass. by a digital-pulse-echo-
overlap method using an assembly containing a highly damped
20 MHz ceramic transducer and-fused quartz delay line. The
digital pulse width was 25 nsec, which was equivalent to one-
half the transducer resonance width. Echoes every 0.4 ypsec
were then clearly resolved and overlapped (Fig. II.4). Mea-
surements were made for all modes shown in Table'II.2. The
[1101-direction measurements were more reliable since some
phasing effects occurred in- the [100]-direction. Cross checks
were good to 1% and the C.. are considered to be accurate to1]
1%. The single crystal and calculated aggregate values for
FeAl 204 are given in Table 11.5.

17
Spinel
C. Comparison with other experimental and theoretical- work.
Current experimental and theoretical interest exists for
the elastic constants of spinel structure compounds, and par-
ticularly for various stoichiometries of MgO:xAl 203 spinels
(Table 11.6). Because stoichiometric spinels (x = 1.0) are
more difficult to grow, only room condition values for the
elastic constants [Lewis, 1966] are presently available. How-
ever, during the preparation of this chapter O'Connell and
Graham [1971] published an abstract on the elastic constants
of stoichiometric spinel to 800 *K and 8 kb. Another paper
on the pressure dependence of the elastic constants of stoi-
chiometric spinel is in preparation by Chang and Barsch
[Chang, personal communication].
Theoretical work on the elasticity of MgAl20 includes
a Born model calculation for the pressure dependence of the
elastic constants [Sammis, 1970] and an 11-parameter rigid
ion model calculation for both acoustic and optic frequency
modes as a function of pressure [Striefler and Barsch, 1971
(abstract)]. Also an oxygen framework model [Leibfried,
1955; O.L. Anderson, 1965; Gieske and Barsch, 1968] may be
considered for spinels.

18
Spinel
1. Effect of stoichiometry.
The elastic constants of the stoichiometric MgO:1.OAl2 03
are 5 to 10% lower than those with excess alumina xAl 203
(2.6 < x < 3.5). The elastic constants of the non-stoichio-
metric spinels agree to 1%.
Suppose the differences between the elastic const-ants of
the stoichiometric and non-stoichiometric spinels are due only
to the difference in density. That is, apply a law of corres-
ponding states [0.L. Anderson, 1966] and consider MgO:2.6Al 203
(p = 3.62 g/cm 3 ) to be MgO:1.0A1 203 (p = 3.58 g/cm 3 ) compressed
20.2 kb. Decompressing the MgO:2.6Al203 to p = 3.58 g/cm 3
gives the following values for the elastic constants compared
to those for stoichiometric MgO:1.0Al2 0 Schreiber's [1967]
values for the pressure derivatives of the elastic constants
of MgO:2.6Al203 are used.
"Decompressed" MgO:l.OAl2 03
MgO:2.6Al2 03
K = 1.935 Mb K = 1.950 Mb
CS = 0.716 Mb C = 0.630 Mb
C4 4 = 1.559 Mb C44 = 1.530 Mb
where K = bulk modulus
and CS = 1/2 (C CC11 12

19
Spinel
The bulk modulus K has been slightly over corrected and the
shear moduli C and C44 have been more significantly under-
corrected. In other words an excess alumina spinel cannot be
regarded as a compressed stoichiometric one, particularly for
the shear moduli.
The excess Al 203 structure results in additional cation
vacancies in order to maintain charge neutrality within the
nearly perfect cubic close packed arrangement of the oxygen
anions (Fig. 11.5). Jagodzinski and Saalfeld [1958] deter-
mined the deviation from a cubic close packed oxygen lattice
for natural and synthetic spinels of various MgO:Al 203 ratios
(Table 11.7). The distortion of the cubic close packed
oxygen lattice becomes smaller with increasing excess Al20 3'
Thus on a crystallographic structure basis the non-stoichio-
metric spinel is expected to be weaker in bulk modulus be-
cause of more cation vacancies, yet stronger in shear be-
cause there is less distortion of the oxygen framework than
a law of corresponding states with stoichiometric spinel would
indicate.
2. Born model.
The last line of Table 11.6 shows the results of a Born
model lattice calculation for the pressure dependence of the
elastic constants made by Sammis [1970] who used the method of
homogeneous static deformations due to Fuchs [1936]. The

20
Spinel
elastic energy density was written as the sum of the electro-
static energy and the repulsive energy. The repulsive term
between nearest neighbors was of the form Xexp(-r/p) where
X and p were parameters determined from the bulk modulus and
lattice parameter (note that p is not the density here).
Sammis claimed consistency was found in determining the four
repulsive parameters for the Mg - 0 and Al - 0 interactions
from the bulk moduli and lattice parameters of MgO, Al203 '
and MgAl204. Two additional adjustable parameters were the
shear moduli Madelung constants arising from the electrostatic
forces present in a shear static deformation. Their values
were chosen to fit the zero pressure moduli.
One feature of Sammis' calculation was that at some
pressure greater than 400 kb, DC44/DP became negative while
evidently DCS/DP remained positive since no mention was
made of it. Since DCS/BP is negative for pleonaste while
DC44/0P is about 0.8 for both pleonaste and MgO:2.6Al203, it
seems more likely that at high pressure 3C S/3P will be nega-
tive for MgAl 204 rather than 3C44/3P. Note in Table 11.6
that the theoretical 3CS/3P is greater than 3C44/3P, while
the inequality is just the other way around for both
MgO:2.6A1203 and pleonaste. DCs/3P will become negative for
MgAl204 when P ~ 150 kb on the assumption it becomes negative
when MgAl 204 is compressed to the density of pleonaste.

Spinel
3. Oxygen framework model.
Another theoretical approach is to calculate the elastic
properties on the assumption that they are determined by the
cubic close packed framework of oxygen anions [O.L. Anderson,
1965]. The theory [Leibfried, 1955] predicts ratios C. ./KIJ
and (C . /3P)/(9K/3P). The oxygen framework scheme was
applied to Al203 and MgO by Gieske and Barsch [1968], to
Mg2SiO4 (olivine) by Graham and Barsch [1969], and to ortho-
pyroxene by Frisillo and Barsch [1971].
For the cubic close packing of spinel define A = 3/2,
A = 3/4, and A = 3/4, where the A.. have the same matrix12 44 1
properties as the cubic symmetry elastic constants C...
Then C.. = K A.. and 3C. ./3P = (DK/3P) A... First the effec-
tive elastic constant derivatives must be converted into
thermodynamic elastic constant derivatives [Thurston, 1965a].
The predicted and measured values are shown in Table 11.8.
As in the previous comparisons on Al203, MgO, and Mg2SiO,
the predicted zero pressure ratios are fairly good for
pleonaste (±10%) and excellent for MgO:2.6Al203 (±4%).
The agreement of the predicted pressure derivatives corresponds
except for a 50% deviation in (C 4 4/3P)/ (K/3P). The lack of
agreement can be attributed to many-body forces and the in-
fluence of the cations [Gieske and Barsch, 1968].

22
Spinel
4. Critique of theoretical models.
Though the Born type or oxygen framework lattice calcula-
tions based on nearest neighbor interactions yield zeroth
order and qualitative results, predictions for pressure deri-
vatives are unreliable. At present, too little is known
about solving the full quantum mechanical problem of complex
oxides (or "simple" oxides such as MgO [La and Barsch, 1968]).
The differences between the experimental and theoretical
results indicate the difficulty. Semi-empirical factors to
simulate such phenomena as many-body and exchange forces lead
to results for which there are no theoretical means of dis-
tinguishing between right and wrong results. The reader is
also referred to a recent paper by Leigh et al. [1971]. The
paper concluded that experimental lattice frequency deter-
minations are never sufficient to determine the atomic
force constants uniquely.

23
Spinel
D. Lattice modes, crystal stability, and phase transformations.
Shock wave studies on MgAl 204 imply that it has undergone
a transition by 700 kb to a phase 2 to 9% denser than an iso-
chemical mixture of MgO and Al203 [D.L. Anderson and Kanamori,
1968; Ahrens et al., 1969; and Davies and D.L. Anderson, 1971].
The high pressure phase has been interpreted as MgAl204 going
into a CaFe 204 or related structure where the Mg + becomes
8-coordinated [Reid and Ringwood, 1969, p.206]. Static com-
pression of FeAl 204 at 120 kb and 1000 *C [Ringwood and Reid,
1969] yielded FeO and Al2 0 Therefore, pleonaste which is
intermediate between these end members in composition can also
be expected to undergo some type of spinel + post-spinel tran-
sition. In this section the nature of the spinel -+ post-spinel
transition will be interpreted from the available information:
thermochemical data, elastic stability criteria, and shock and
static experiments.
1. Elastic stability criteria.
First the implications of the negative value for the
pressure derivative 3CS/9P = -0.05 of pleonaste will be dis-
cussed in terms of the crystal's shear stability. .With in-
creasing pressure the shear modulus decreases so that the
crystal becomes weaker to a CS-type shear (E = -c22; all
other strains equal zero). If the shear modulus C were to
decrease to a negative value, then the lattice is unstable

24
Spinel
since (C11 - C1 2) < 0. Discussions of lattice stability and
particularly shear stability in terms of the Born criteria
[ (C1 1 + 2C1 2) < 0, (C11 - C1 2 ) < 0, or C4 4 < 0 ] have been
the subject of some recent papers [Thomsen, 1971; O.L. Anderson
and Demarest, 1971). Using his fourth-order anharmonic theory
and O'Connell's [1970] MgO:2.6Al203 data, Thomsen concluded
that none of the Born criteria will be met before megabar
pressures. The magnitude of the negative 3CS/3P in pleo-
naste is not large enough to bring CS to zero until megabar
pressures, unless 3CS/3P becomes increasingly negative with
pressure. However, the possibility exists that lattice vibra-
tional modes other than those in the long wavelength and
non-dispersive elastic region become negative.
2. A case study: rubidium iodide.
Rubidium iodide transforms from the sodium chloride to
cesium chloride structure at a pressure of about 4 kb at
300 *K [see, for example, Pistorius, 1965]. The transition
is reviewed since it is instructive on the role of lattice
modes [Musgrave, 1970, p.274].
Buerger [1948] suggested from crystallographic'considera-
tions a C44-type shear along the [111-direction as the
mechanism for the sodium chloride to cesium chloride transi-
tion (Fig. 11.6). Daniels and Smith [1963] noted that though

25
Spinel
a negative 3C4 4/3P was measured for RbI at room pressure,
its magnitude was such as to decrease the initial value of C4 4
by only 10% at the observed transition pressure. They
suggested, however, that a transverse acoustic (TA) mode
frequency in the [100]-direction became negative and was the
mechanism of instability. This TA mode would be in the dis-
persive region of the spectrum and hence not observable in
the 10 MHz region of elastic measurements. They schematically
pictured the Brillouin zone-boundary frequency dropping off
more rapidly with pressure than the low frequency acoustic
mode (Fig. 11.7).
Hardy and Karo [1965] agreed with this conclusion on the
basis of a lattice dynamical calculation which took into
account next-nearest neighbors and non-central forces.
Saunderson [1966] performed a neutron scattering experiment
on RbI that actually measured these zone-boundary modes as a
function of pressure. The decrease with pressure, however,
was still too small to bring the zone-boundary modes to zero
at the transition pressure.
3. Lattice modes, metastability, and activation energy.
In interpreting the neutron scattering experiment
Saunderson [1966] pointed out that the mode instability
theory imposed the stringent condition that at the transi-
tion pressure the sodium chloride phase of rubidium iodide

26
Spinel
could not exist even metastably. If the mode was not actually
unstable but had a near zero positive value, the implication
would be that a low activation energy was required for the
transition.
Musgrave [1970, p.27 4] summarized the situation in the
following way: "If phase A effects a transition to phase B,
then phase A must in some way have been able to sample condi-
tion B in order to 'decide' in terms of a free-energy cri-
terion. Consequently, where kinematic paths prove easily
identifiable in terms of lattice modes, the possibility that
the instability of these modes may provide the path to the
new structure has been suggested." The sampling of the new
phase should be regarded on a statistical basis. Thermal
fluctuations of the lattice near a pressure transition en-
able the formation of an "embryo" of the new phase [see, for
example, Smoluchowski, 1948 on the embryo concept].
If a lattice mode is actually unstable, the resistance
to formation of the new phase is zero. If a lattice mode is
stable but weak, the resistance to formation of the new phase
is also weak but the old phase may still exist metastably.
Thus, a zero shear constant is a sufficient but not.necessary
condition for a phase transition.

27
Spinel
4. Shock-wave experiments.
The occurrence of an unstable lattice mode in the
microsecond time scale of a shock-wave experiment implies
that an instantaneous phase transition will take place, i.e.,
the transition cannot be overdriven beyond the mode-failure
pressure [Barsch, 1965; Roy, 1969]. Roy suggested that in
high bond strength materials (such as the alkali halides and
oxides) one should look for the correlation of breaks in the
shock-wave Hugoniot and predicted mode failures. One might
also look for the correlation of limited metastable persis-
tence and weak modes before any mode failure is expected to
occur,
Plotted in Figs. 11.8 and 11.9 are the pressure-density
Hugoniots for MgAl204 (ceramic) and Fe304 which have been
taken from Birch's [1966] compilation and D.L. Anderson and
Kanamori's [1968] figures. Recall that magnetite has the
inverse spinel structure and exhibits negative pressure co-
efficients for both shear moduli [England, 1970]. In both
figures the spinel structure has gone completely into a new
high-pressure phase by pressures of 700 kb. The situation is
ambiguous at lower pressures and subject to different inter-
pretations. However, the suggestion is that the 200 to 600 kb
data represent a mixed-phase region for the MgAl204. The
number of data points seems sufficient to say that the

28
Spinel
Hugoniot is linear between 200 and 500 kb with a possible
negative curvature leading into an inflection at 600 kb.
The linear relation between pressure and density means a
linear relation between bulk modulus and density which is
not consistent with the expected equation of state for
MgAl204 .
From thermochemical data the pressure at which MgAl204
would break down to its component oxides may be calculated
through the relation P = -AG /AV [Ringwood, 1966]. AG0 is
the free energy of the reaction at zero pressure and AV is
the molar volume change of the reaction. Approximately,
1400*CAG 0 is 8.4 kcal/mole [Rosdn and Muan, 1966] and AV is
-3 cm3/mole to give P = 120 kb. Ringwood and Reid [1969] did
not observe any disproportionation of MgAl204 at 120 kb and
1000 *C but the nature of the calculation does not allow
detailed comparison. Several possibilities exist to fill the
gap between the static experiments at 120 kb and the shock-
wave experiments beginning at 200 kb. For example, the
MgAl 204 might partially disproportionate and then begin to
transform to a denser state. Or the MgAl2O4 might remain
metastably and then begin to transform directly to the denser
high-pressure state in the mixed-phase region.

29
Spinel
Inferences about the nature of the spinel -+ post-spinel
transition may now be drawn in terms of the previous dis-
cussion on lattice modes, metastability, and activation
energy. By a pressure of 200 kb the shear modulus C will
have increased a few percent for MgAl 24 and it will have
decreased a few percent for pleonaste. In either case
considering the compression involved, there is evidence of
a weak CS-mode so that in the microsecond duration of the
shock wave the activation energy is sufficiently low for
transformation to begin. On this microsecond time scale the
mixed-phase 200 to 700 kb region represents a metastable
range. At 702 kb either the superpressure is sufficient to
cause complete transformation, or indeed a lattice mode has
gone to zero at this pressure.
The effect of iron substitution is to reduce the value
of the elastic constant C5 and apparently also to reduce the
value of 3CS/3P. FeAl204 may-be expected to have a weaker
C -mode than MgAl 204. Perhaps Ringwood and Reid's [1969]
observed disproportionation of FeAl2O4 compared with no
reaction in MgAl204 at 120 kb and 1000 *C is explained by the
FeAl2O4 being more readily able to tunnel (via the C S-mode)
under the kinetic barrier required for unmixing.
Now consider the shock-wave data on olivines as compiled
by Ahrens and Petersen [1969] in Fig. II.10. The 200 to

30
Spinel
780 kb region is one of mixed phase. It is generally agreed
that the olivine is in a post-spinel phase above 780 kb and
that nowhere is there a clear indication of the presence of
just the spinel phase. Note the similarity of the Hugoniots
in Fig. II.10 for olivine and Fig. 11.8 for MgAl204. The
200 to 700 kb region of both Hugoniots is interpreted as
being one of mixed phase. For olivine the possibility exists
that the mixed-phase region contains some spinel just as the
possibility exists for MgAl 204 that the mixed-phase region
contains a mixture of MgO and Al2 03
From the pressure derivatives of the elastic constants
of olivine [Graham and Barsch, 1969; Kumazawa and Anderson,
1969], Thomsen [1971] tentatively concluded that there will
be no failure of the elastic stability criteria. Without a
weak mode path for the transformation, the activation energy
barrier is sufficiently high that the olivine form remains
metastably for a range of superpressures. With the overshoot
in pressure the spinel field is also overdriven. The ex-
pected shear mode weakness for the spinel form of olivine
implies that the spinel phase will tend not to remain meta-
stably above its transition pressure. Thus the high olivine
spinel barrier and the low spinel -+ post-spinel barrier com-
bine to prevent the observation of the spinel phase in a

31
Spinel
shock-wave experiment. The combination high/low barriers
are observed as the large mixed-phase region. Other factors
such as the non-hydrostatic nature of shock waves also have
a large influence on whether or not a transformation will
take place, but the above story seems to be consistent with
the ultrasonic data.

32
Spinel
E. Diffusion kinetics.
Stresses in a descending lithospheric slab depend on the
creep behavior of the material in the transition zone. For
high temperatures (> 1/2 the melting temperature) the creep
rate is determined by the diffusion coefficient of the slowest
moving atomic species in the material [see, for example,
Weertman, 1970, p.146]. Keyes [1963] has proposed an elastic
strain-energy model for diffusion.
K -* = aP 1 (Eqn. II.4)
where G* = activation energy for diffusion
V = activation volume for diffusion = DG*/3P
K = bulk modulus
y = shear modulus
Eqn. II.4 is plotted in Fig. II.11 for several values of K/y.
The model gives the result that for small or negative values
of the shear modulus pressure derivative, the diffusion rate
increases with pressure (V* < 0). Such behavior is not in-
tuitive. The strain-energy model is a semi-empirical theory
which considers the activation energy.for diffusion as work
done against the elastic forces. The model does a fair job
of explaining existing diffusion data.

33
Spinel
Other diffusion theories might give a conflicting result.
Weertman [1970] advocates the theory where the diffusion
coefficient
D = D exp(-gT m/T) (Eqn. 11.5)
is an implicit function of pressure through the melting
temperature T m(P). D and g are constants and T is' the tem-
perature. The activation volume in this theory is negative
only if dT m(P)/dP < 0 and there is no clear correlation
between the signs of dTm(P)/dP and By/DP [Keyes, 1963].
No conflict occurs for rutile-GeO2 (next chapter). dT m(P)/dP
does not seem to be available for MgAl2O4 to check.
A negative activation volume for the spinel structure
implies a decrease in viscosity with depth in the transition
region of the mantle rather than the increase usually cal-
culated [Gordon, 1965; Weertman, 1970]. Postglacial uplift
calculations do not resolve the viscosity profile within the
transition zone. The calculations show a slightly lower
viscosity for the lower mantle (below 1000 km) than for the
transition zone [Cathles, 1971].
If the.viscosity in the transition zone is constant or
decreasing, a mechanism other than increasing strength is
needed to explain the compressional axis parallel to the
lithospheric slab for deep focus earthquakes [Isacks and
Molnar, 1971]. For example, the density of the slab might
remain lighter than the surrounding mantle. 4

34
Spinel
F. Iron substitution and the Jahn-Teller effect.
The ground state spin configuration of Fe + 3d ) in a
tetrahedral site is degenerate. The Jahn-Teller effect is the
distortion of the site which lowers the energy. The degener-
acy is removed by the splitting of the t2 and e orbital
groups.
The soft mode C = 1/2 (C - C l) in ulv-spinel,
Fe2 TiO 4, was attributed to the Jahn-Teller effect for tetra-
hedral Fe + by Ishikawa and Syono [1971) and Syono et al.
[1971]. Syono [personal communication, 1971] suggested that
the "acoustic" Jahn-Teller effect should also be present in
pleonaste and.FeAl2 04 . Previously, the elastic properties
3+ 3+ 3+of the Jahn-Teller ions Mn and Ni in YIG:Mn and
Al2 0 3:Ni + were studied by Gyorgy et al. [1966] and Sturge
et al. [1967], respectively.
Syono et al. [1971] found values of C = 1.39
C = 1.12, and C44 = 0.396 Mb for Fe 2TiOg. Fe 2TiO is an
2+ ..inverse spinel in which one-half of the Fe ions are in
tetrahedral sites and one-half are in octahedral sites. The
measured values for CS = 0.132 Mb and C44 =0.396 Mb are
smaller than other spinels by a factor of five (Table 11.6).
Such a drastic reduction in C and C4 4 is not the case for
FeAl2 04 which has the same molar concentration of tetrahedral

Spinel
Fe2+ as Fe2TiO . Rather there is only a gradual decrease in
C and C4 4 with increasing iron substitution. Since the de-
crease in C11 is smaller than the decrease in C , C1 2 in-
creases and so does -the bulk modulus K.
Thus there is a gradual softening of the C -mode with
increasing iron content which may be due to a Jahn-Teller
effect. However, with 100% iron substitution in the MgAl 204 -
FeAl204 system, the reduction is about 35% and not a factor
of five as found in Fe2TiO. The great reduction in the
elastic constants of Fe2TiO 4 is not due solely to the
presence of Jahn-Teller Fe2+ ions in the tetrahedral site.
Perhaps magnetoelastic coupling between the Jahn-Teller dis-
tortion and the long-range magnetic ordering in Fe2TiO 4
[Ishikawa and Syono, 1971] is responsible for the difference.
FeAl204 shows no signs of magnetic ordering down to 11 *K
[and probably 1.9 *K, Slack, 1964] while Fe2TiO4 becomes
weakly ferromagnetic below 142 *K. The low temperature
dependence of the elastic constants of FeAl 204 will.be needed
to resolve the theoretical discussion since the effect is
enhanced as l/T [Gyorgy et al., 1966; Syono~et al., 1971].

36
Spinel
G. Iron substitution, velocity-density relations, and the
transition zone.
A variety of velocity-density relations [for a critical
review see Simmons and England, 1969] have appeared since
Birch [1961] proposed his linear relation
V = a(R) + bp (Eqn. 11.6)p
where V = compressional wave velocity
p = density
= mean atomic weight
a(M), b = constants
.Birch used his velocity-density relation in the mantle's
transition zone to test density models for consistency [1961],
to examine the question of a change in iron content [1961],
and to construct density models [1964]. The necessary
parameters to know were dV /dM , (3V /Dp) , and (3p/M)
where y represents a constant phase and Ay is the change of
density arising from a phase transition. Birch [1961] used
values: dV /dM = -0.36 , (V /3P) - 3.31 , and (y/M) =
0.13.* These values were also applied to the question of
iron content in the transition zone by D.L. Anderson [1968,
p.92] and Press [1970, p.18].
*All numbers given in this section are based on units where
V or V is in km/sec, p is in g/cm 3 , and R is in g/mole/atom.p s

37
Spinel
The new data in the MgAl2O4 - FeAl204 system allow
redetermination of the parameters
dV /dM = (3V /3p(3p/3R) + pVp/3R) (Eqn. 11.7)
p pMand (OV P/3p) for use in considering the olivine -+ spinel
transition which is one of the major phase changes in the
300 to 1000 km region. Also the data determine the corres-
ponding parameters dV /dM and (3Vs/3p)- for shear wave
velocities.
1. Velocity-density relation for spinels.
First the MgAl204 - FeAl 204 system will be tested in a
velocity-density relation proposed for spinel structure
compounds [Liebermann, 1970].
V = 15.66 - 1.59 p (Eqn. II.8a)p
V = 9.88 - 1.'17 p (Eqn. II.8b)
V and V are in km/sec and p is in g/cm 3. The heavy lines inp s
Fig. 11.12 represent Eqns. 11.8. The newly measured values
for V and V on pleonaste and hercyni'te fall 5 to 10% belowp .
the predicted values. The slope of the light line connecting
MgAl2Ogto FeAl 0 for V is the same as Liebermann's. How-gl2O4 2 4 p
ever, the slope of the light line connecting MgAl 2O4 to
FeAl2 0 for Vs is steeper than Liebermann's, and in fact is
the same as the slope of both V lines.

38
Spinel
It appears as if Vp and Vs might be linear with composi-
tion in the MgAl204 - FeAl204 system. The MgAl2O4 - FeAl2 04
system would be expected to serve as a better elastic analogue
to the spinel phase-of the Mg2SiO 4 - Fe2SiO 4 system than the
assortment of spinels used in Liebermann's relation. The
densities, mean atomic weights, and molar volumes of
(Mg1_ Fex)Al204 and (MglzFez )2SiO 4 where z = x/2 are
compared in Table 11.9. Note that 100% Fe substitution for
Mg in MgAl204 is equivalent to about 50% Fe substitution for
Mg in Mg2SiO For example, 100% Fe substitution in MgAl204
increases M by 4.5 which is exactly one-half the increase in
M for 100% Fe substitution in spinel -Mg2SiOg. The densities
for (Mg 1 Fe )Al204 and spinel-(Mgl-zFez) 2Si0 4 were cal-
culated from a linear volume versus comoosition relation..
The molar volumes for spinel-Mg2SiO4 and spinel-Fe 2 Sio 4
were taken from Ringwood and Major [1970].
Assume that V and V are linear with composition in thep s
(Mgl xFex)Al 204 and (Mgl-zFez)2SiO 4 systems and that the
elastic properties in the two systems are exactly similar
for z = x/2. Then
V = 9.73 - 1.03 x (Eqn. II.9a)p
V = 5.49 --1.03 x (Eqn. II.9b)
where V and V are in km/sec and 0 < x < 1. Uncertaintiesp s
are about 3%.

39
Spinel
2. Redetermination of Birch's parameters.
The parameters dV /d , (3V /3p) , and (3p/3M)p p M~j y~~~
will now be considered in turn.
a. The value of dV p/d is -1.03/4.5 = -0.23 based on the
MgAl 2O4 - FeAl204 data (Eqns. 11.9). Birch's value for
dV /dR was -0.36. For reference, dV /dM is -0.23- based onp 5
the MgAl204 - FeAl204 data. Recall that Vp and V5 are in
km/sec, p is in g/cm 3 , and M is in g/mole/atom.
b. For consideration of the olivine -+ spinel transition, it
seems proper to consider the value of (V p/ap)f to be
Vspinel - yolivinep p
(3V /3p}ff - (Eqn. II.10)p Mspinel olivine
p - p
where the superscripts "spinel" and "olivine" refer to the
respective phases of Mg2SiOg. The Hill averages for olivine-
Mg2SiO 4 (Graham and Barsch, 1969; Kumazawa and Anderson, 1969]
are used to obtain (V /Dp)- = 3.45 and for reference
(3Vs/3p)F = 1.41 . Birch's value for (V /3p)f was 3.31.
Neither (V /lap)- nor (3Vs/3p)q calculated over the
transition by Eqn. II.10 is consistent with that calculated
from the pressure or temperature derivatives of olivine-
Mg2SiO4 or MgO:2.6Al203 IC. Wang, 1970, p.32 65;, ngland,
1970, p.95].

40
Spinel
c. The parameter (3p/3M) for different Mg/Fe solid
solution series is given below.
System
Olivine-(MglzFez 2 SiO4
Spinel- (MglzFez 2SiO4
(Mg1 xFex) A1204
(a3p/3m-)
0.130
0.143
0.156
3. Transition zone.
a. To indicate the vagaries that remain on the question of
iron content change in the transition zone, I will rework
Birch's 11961] example where he used Jeffreys' 1939 seismic
velocities and Bullen's Model A. I use the values
(ap/3f) = 0.14 , V= 3.45 , dV /dM = -0.23
which were determined in the previous section. The equations
to be solved are [Birch, 1961, p.30 8]:
Adiabatic
compression
Phase
change
Iron content
change
= 2.32
= 0.95
= 1.14
= 0.33
+ 3.45 Ay -
Ay +
The solution is AR = 1.4 and Ay = 0.43 g/cm 3. Birch
obtained AM = 1.0 and Ay = 0.48 g/cm 3.
Seismic
change
AVp
0.23 AM
0.14 AM

Spinel
However, if shear velocity values are used, the equations
become:
AV = 1.33 = 0.46 + 1.41 Ay - 0.23 AM
Ap = 0.95 = 0.33 + Ay + 0.14 AM
The solution is AM = 0 and Ay = 0.62 g/cm3 . Thus the Vp
solution indicates some iron increase while the V solutionS
indicates that phase changes account for the entire density
increase.
b. Some recent seismic shear velocity profiles have either
a constant velocity gradient [Ibrahim and Nuttli, 1967] or a
negative velocity gradient [D.L. Anderson and Julian, 1969]
between 500 and 650 km. The small positive and slightly
negative pressure derivatives of Vs for MgO:2.6Al 203 and
pleonaste, respectively, suggest that the seismically deter-
mined Vs versus depth are indi.cative of the spinel structure.
The smaller value of Vs /3P obtained on pleonaste com-
pared to MgO:2.6Al 203 suggests this reduction in V s/3P
may generally be true for iron substitution. When more con-
fidence is gained in seismic shear wave gradients as well as
in laboratory data on the effects of iron substitution,
changes in the FeO/(FeO + MgO) ratio in the transition zone
may be estimated. An observed decrease in the slope of the
shear wave gradient might mean an increase in the FeO/
(FeO + MgO) ratio.

Spinel
References
Ahrens, T.J., and C.F. Petersen, Shock wave data and the
study of the earth, in The Application of Modern Physics
to the Earth and Planetary Interiors, edited by S.K. Runcorn,
pp. 449-461, Wiley-Interscience, London, 1969.
Ahrens, T.J., D.L. Anderson, and A.E. Ringwood, Equations
of state and crystal structures of high-pressure phases
of shocked silicates and oxides, Rev. Geophys., 7, 667-
707, 1969.
Anderson, D.L., Chemical inhomogeneity of the mantle, Earth
Planet. Sci. Letters, 5, 89-94, 1968.
'Anderson, D.L., and B. Julian, Shear velocities and elastic
parameters of the mantle, J. Geophys. Res., 74, 3281-
3286, 1969.
Anderson, D.L., and H. Kanamori, Shock-wave equations of
state for rocks and minerals, J. Geophys. Res., 73,
6477-6502, 1968.
Anderson, O.L., Determination and some uses of isotropic
elastic constants of polycrystalline aggregates using
single-crystal data, in Physical Acou'stics, Vol. III - Part B
edited by W.P. Mason, pp. 43-95, Academic Press, New York,
1965.
Anderson, O.L., A proposed law of corresponding states for
oxide compounds, J. Geophys. Res., 71, 4963-4971, 1966.

43
Spinel
Anderson, O.L., and H.H. Demarest, Jr., Elastic constants of
the central force model for cubic structures: polycrystalline
aggregates and instabilities, J. Geophys. Res., 76, 1349-1369,
1971.
Barsch, G.R., Material instability of initially stressed
crystals (abstract), Bull. Am. Phys. Soc., II, 10, 452, 1965.
Barsch, G.R., Relation between third-order elastic constants
of single crystals and polycrystals, J. Appl. Phys., 39,
3780-3793, 1968.
Birch, F., Composition of the earth's mantle, Geophys. J.,
4, 295-311, 1961.
Birch, F., Deisity and composition of mantle and core, J.
Geophys. Res., 69, 4377-4388, 1964.
Birch, F., Compressibility: elastic constants, in Handbook
of Physical Constants -- Revised Edition, edited by S.P.
Clark, Jr., pp. 97-173, Geological Society of America Memoir
97, New York, 1966.
Brugger, K., Pure modes for elastic waves in crystals, J.
Appl. Phys., 36, 759-768, 1965.
Buerger, M.J., Crystallographic aspects of phase transforma-
tions, in Phase Transformations in Solids, edited by R.
Smoluchowski, J.E. Mayer, and W.A. Weyl, pp. 183-211, John
Wiley and Sons, New York, 1951.
Burns, R.G., Mineralogical Applications of Crystal Field
Theory, 224 pp., Cambridge University Press, London, 1970.

44
Spinel
Cathles, L.M., III, Lower mantle viscosity inferred from
postglacial adjustment of the ocean basins and Canada (ab-
stract), Trans. Am. Geophys. Union, 52, 353, 1971.
Chung, D.H., First pressure derivatives of polycrystalline
elastic moduli: their relation to single-crystal acoustic
data and thermodynamic relations, J. Ap. Phys., 38,
5104-5113, 1967.
Chung, D.H., D.J. Silversmith, and B.B. Chick, A modified
ultrasonic pulse-echo-overlap method for determining sound
velocities and attenuation of solids, Rev. Sci. Inst., 40,
718-720, 1969.
Daniels, W.B., and C.S. Smith, The pressure variation of the
elastic constants of crystals, in The Physics and Chemistry
of High Pressures, pp. 50-63, Society of Chemical Industry,
London, and Gordon and Breach, New York, 1963.
Davies, G.F., and D.L. Anderson, Revised shock-wave equations
of state for high-pressure phases of rocks and minerals,
J. Geophys. Res., 76, 2617-2627, 1971.
Deer, W.A., R.A. Howie, and J. Zussman, Rock-forming Minerals,
Vol. 5, Non-silicates, 371 pp. Longmans, London, 1962.
England, A.W., Equations of state of oxides and silicates
and new data on the elastic properties of spinel, magnetite,
and cadmium oxide, Ph.D. thesis, Massachusetts Institute of
Technology, Cambridge, 1970.

45
Spinel
Finkbeiner, D.T., II, Introduction to Matrices and Linear
Transformations, 246 pp., W.H. Freeman and Company, San
Francisco, 1960.
Frisillo, A.L., and G.R. Barsch, The pressure dependence of
the elastic coefficients of orthopyroxene (abstract), Trans.
Am. Geophys. Union, 52, 359, 1971.
Fuchs, K., A quantum mechanical calculation of the elastic
constants of monovalent metals, Proc. Roy. Soc. (London),
A153, 622-639, 1936.
Fyfe, W.S., Geochemistry of Solids, 199 pp., McGraw-Hill,
New York, 1964.
Gieske, J.H., and G.R. Barsch, Pressure dependence of the
elastic constants of single crystalline aluminum oxide,
Phys. Status Solidi, 29, 121-131, 1968.
Gordon, R.B., Diffusion creep in the earth's mantle, J. Geo-
phys. Res., 70,. 2413-2418, 1965.
Graham, E.K., Jr., and G.R. Barsch, Elastic constants of
single-crystal forsterite as a function of temperature and
pressure, J. Geophys. Res., 74, 5949-5960, 1969.
Gyorgy, E.M., R.C. LeCraw, and M.D. Sturge, Influence of
Jahn-Teller ions on the acoustic and magnetic properties of
YTIG, J. Appl. Phys., 37, 1303-1309, 1966.
Hamilton, R.A.H., and J.E. Parrott, The third-order elastic
constants of quasi-isotropic materials, J. Phys. C (Proc.
Phys. Soc.), Ser. 2, Vol. 1, 829-834, 1968.

46
Spinel
Hardy, J.R., and A.M. Karo, Lattice dynamics of rubidium
iodide in relation to the NaCl-CsCl phase transition, in
Lattice Dynamics, edited by R.F. Wallis, pp. 195-201,
Pergamon Press, Oxford, 1965.
Hashin, Z., and S. Shtrikman, On some variational principles
in anisotropic and nonhomogeneous elasticity, J. Mech. Phys.
Solids, 10, 335-342, 1962a.
Hashin, Z., and S. Shtrikman, A variational approach to the
theory of the elastic behavior of polycrystals, J. Mech. Phys.
Solids, 10, 343-352, 1962b.
Ibrahim, A.K., and O.W. Nuttli, Travel-time curves and upper-
mantle structure from long-period S waves, Bull. Seismol.
Soc. Am., 57, 1063-1092, 1967.
Isacks, B., and P. Molnar, Distribution of stresses in the
descending lithosphere from a global survey of focal-mechanism
solutions of mantle earthquakes, Rev. Geophys. Space Ps 9,
103-174, 1971.
Ishikawa, Y., and Y. Syono, Giant magnetostriction due to
Jahn-Teller distortion in Fe2TiOg, Phys. Rev. Letters, 26,
1335-1338, 1971.
Jagodzinski, H., and H. Saalfeld, Kationenverteilung und
Strukturbeziehungen in Mg-Al-Spinellen, Z. Krist., 110,
197-218, 1958.

Spinel
Keyes, R.W., Continuum models of the effect of pressure on
activated processes, in Solids Under Pressure, edited by
W. Paul and D.M. Warschauer, pp. 71-99, McGraw - Hill, New
York, 1963.
Knopoff, L., and J.N. Shapiro, Comments on the inter-relation-
ships between Grineisen's parameter and shock and isothermal
equations of state, J. Geophys. Res., 74, 1439-1450, 1969.
Kroner, E., Elastic moduli of perfectly disordered composite
materials, J. Mech. Phys. Solids, 15, 319-329, 1967.
Kumazawa, M., and O.L. Anderson, Elastic moduli, pressure
derivatives, and temperature derivatives of single-crystal
olivine and single-crystal forsterite, J. Geophys. Res.,
74, 5961-5972, 1969.
La, S.Y., and G.R. Barsch, Pressure derivatives of second-
order elastic constants of MgO, Phys. Rev., 172, 957-966,
1968.
Leibfried, G., Gittertheorie der mechanischen und thermischen
Eigenschaften der Kristalle, in Encyclopedia of Physics,
VII, Part 1, edited by S. FlUgge, pp. 104-324, Springer-
Verlag, Berlin, 1955.
Leigh, R.S., B. Szigeti, and V.K. Tewary, Force constants and
lattice frequencies, Proc. Roy. Soc. (London), A320, 505-
526, 1971.
Lewis, M.F., Elastic constants of magnesium aluminate spinel,
J. Acoust. Soc. Am., 40, 728-729, 1966.

48
Spinel
Liebermann, R.C., Velocity-density systematics for the olivine
and spinel phases of Mg 2 Si04 - Fe2Si04, J. Geophys. Res., 75,
4029-4034, 1970.
Musgrave, M.J.P., Crystal Acoustics, 288 pp., Holden-Day,
San Francisco, 1970.
O'Connell, R.J., Equation of state of spinel to 10 kbar and
800*K (abstract), Trans. Am. Geophys. Union, 51, 419, 1970.
O'Connell, R.J., and E.K. Graham, Equation of state of
stoichiometric spinel to 10 kbar and 800*K (abstract), Trans.
Am. Geophys. Union, 52, 359, 1971.
Papadakis, E.P., Ultrasonic phase velocity by the pulse-
echo-overlap method incorporating diffraction phase cor-
rections, J. Acoust. Soc. Am., 42, 1045-1051, 1967.
Papadakis, E.P., Effect of multimode guided-wave propagation
on ultrasonic phase velocity measurements: problem and
remedy, J. Acoust. Soc. Am., 45, 1547-1555, 1969.
Pistorius, C.W.F.T., Polymorphic transitions of the alkali
bromides and iodides at high pressures to 200*C, J. Phys.
Chem. Solids, 26, 1003-1011, 1965.
Press, F., Earth models consistent with geophysical data,
Phys. Earth Planet. Interiors, 3, 3-22, 1970.
Reid, A.F., and A.E. Ringwood, Newly observed high pressure
transformations in Mn 304, CaAl 204, and ZrSiO4 , Earth Planet.
Sci. Letters, 6, 205-208, 1969.

49
Spinel
Reuss, A., Berechnung der Fliessgrenze von Mischkristallen
auf Grund der Plastizit~tsbedingung fur Einkristalle,
Z. Angew. Math. Mech., 9, 49-58, 1929.
Ringwood, A.E., Mineralogy of the mantle, in Advances in Earth
Science, edited by P.M. Hurley, pp. 357-399, MIT Press,
Cambridge, 1966.
Ringwood, A.E., and A. Major, The system Mg2SiOg - Fe 2SiO
at high pressures and temperatures, Phys. Earth Planet.
Interiors, 3, 89-108, 1970.
Ringwood, A.E., and A.F. Reid, High pressure transformations
of spinels (I), Earth Planet Sci. Letters, 5, 245-250, 1969.
Rosen, E., and A. Muan, Stability of MgAl204 at 1400 *C
as derived from equilibrium measurements in CoAl 204 -
MgAl204 solid solutions, J. Am. Ceram. Soc., 49, 107-108,
1966.
Roy, R., Neglected role of metastability in high pressure
research, in Reactivity of Solids, edited by J.W. Mitchell,
R.C. DeVries, R.W. Rob.erts, and P. Cannon, pp. 777-788,
Wiley-Interscience, New York, 1969.
Sammis, C.G., The pressure dependence of the elastic constants
of cubic crystals in the NaCl and spinel structures from
a lattice model, Geophys. J., 19, 285-297, 1970.
Saunderson, D.H., Pressure dependence of the TA [100] zone-
boundary phonon frequency in rubidium iodide, Phys. Rev.
Letters, 17, 530-533, 1966.

50
Spinel
Schreiber, E., Elastic moduli of single-crystal spinel at
25 *C and to 2 kbar, J. A Phys., 38, 2508-2511, 1967.
Simmons, G., and A.W. England, Universal equations of state
for oxides and silicates, P Earth Planet. Interiors,
2, 69-76, 1969.
Slack, G.A., Thermal conductivity of MgO, Al203, MgAl 204,
and Fe304 crystals from 3* to 300 *K, Phys. Rev., 126, 427-
441, 1962.
Slack, G.A., FeAl02 - MgAl204: Growth and some thermal,
optical, and magnetic properties of mixed single crystals,
Phys. Rev., 134, A1268-A1280, 1964.
Smakula, A., and V. Sils, Precision density determination
of large single crystals by hydrostatic weighing, Phys. Rev.,
99, 1744-1746, 1955.
Smoluchowski, R., Nucleation theory, in Phase Transformations
in Solids, edited by R. Smoluchowski, J.E. Mayer, and W.A.
Weyl, pp. 149-182, John Wiley and Sons, New York, 1951.
Striefler, M.E., and G.R. Barsch, Pressure dependence of
elastic constants and infrared optical frequencies of
spinel (abstract), Trans. Am. Geophys. Union., 52, 359, 1971.
Sturge, M.D., J.T. Krause, E.M. Gyorgy, R.C. LeCraw, and
F.R. Merritt, Acoustic behavior of the Jahn-Teller ion
.3+Ni in Al203 ' Phys. Rev., 155, 218-224, 1967.

Spinel
Syono, Y., Y. Fukai, and Y. Ishikawa,
properties of Fe2TiOg, J. Phys. Soc.
Anomalous elastic
Japan, 31, 1971, in
press.
Thomsen, L., Elastic shear moduli and crystal stability at high
P and T, J. Geophys. Res., 76, 1342-1348, 1971.
Thurston, R.N., Effective elastic coefficients for wave
propagation in crystals under stress, J. Acoust. Soc. Am.,
37, 348-356, 1965a. Erratum, J. Acoust. Soc. Am., 37,
1147, 1965a.
Thurston, R.N., Ultrasonic data and the thermodynamics of
solids, Proc. IEEE, 53, 1320-1336, 1965b.
Verma, R.K., Elasticity of some high-density crystals, J.
Geophys. Res., 65, 757-766, 1960.
Voigt, W., Lehrbuch der Krystallphysik, 962 pp., B.G. Teubner,
Leipzig, 1928.
Wang, C., Density and constitution of the mantle, J. Geophys.
Res., 75, 3264-3284, 1970.
Weertman, J., The creep strength of the earth's mantle,
Rev. Geophys. Space Phys., 8, 145-168, 1970.

Table 11.1
Pleonaste microprobe analysis* (wt. %).
Approximate chemical formula: (Mg0 .75Fe0. 36 )Al1. 900 4 .
Wt. %oxide
0.1
0.5
SiO2
TiO2
AlO20Al203
Cr203
63.8
0.3
17.2FeO
MnO
MgO
0.1
19.9
101.9
* Microprobe analysis by A. Reid of the NASAManned Spacecraft Center, Houston, Texas.
p, g/cm3
0
a0 , A.
M, g/mole/atom
3.826
8.1225
21.8

Table 11.2
Elastic constants determined from differentpropagation modes shown
in Fig. II.3 for a cubic crystal.
Propagationdirection
a or [100]
a or [100]
y or [110]
y or [110]
y or [110]
Pathlength
(mm)
4.933
4.933
6.645
6.645
6.645
Vibrationdirection
Vibrationmode
[100]
Any
[110]
[110]
[001]
Elasticconstant
Cl 1
C4 4
CL
CS
C4 4
where CL
C5
= 1/2
= 1/2
(C1 1 + C1 2 + 2C 4 4 )
(C11 - C1 2)
Also L = longitudinal
T = transverse

Table 11.3
Pleonaste single crystal elastic constants.
(Based on density p = 3.826 g/cm 3)
11 12 44
C.. (Mb) 2.695 1.633 1.4351J
aC. ./3P 4.85 4.95 0.75
S (Mb ) 0.684 -0.258 0.697
as. ./P (Mb-2) -0.079 -0.168 -0.3641J
Shear mode temperature derivatives:
aCS/@T = +0.067 kb/*K and @C44 = -0.080 kb/*K
where C5 = 1/2 (C 11 C1 2)
Based on thermal expansion a = 22 x 10-6 / *C used also by
Schreiber [1967].

Table 11.4
Pleonaste calculated aggregate elastic constants.(Based on density p = 3.826 g/cm 3 )
Zero pressure aggregate constants
E a K Vs VP
Voigt 2.729 1.073 0.271 1.987 0.503 5.297 9.452
Hashin 2.546 0.990 0.286 1.987 0.503 5.086 9.296
Kr6ner 2.509 0.973 0.290 1.987 0.503 5.042 9.265
Shtrikman 2.448 0.946 0.295 1.987 0.503 4.972 9.214
Reuss 2.240 0.854 0.312 1.987 0.503 4.724 9.038
Aggregate pressure derivatives
E/DP Dp/3P a/DP K/DP 3/PV /3P V p /P
"Voigt"
"Hashin"
"Kro~ner"
"Shtrikman"
"Reuss"
1.96
1.64
1.55
1.37
0.94
0.43
0.34
0.31
0.24
0.11
4.02
3.90
3.90
3.93
3.86
4.92
4.92
4.92
4.92
4.92
-1,25
-1.25
-1.25
-1.25
-1.25
-0.27
-0.41
-0.47
-0.61
-0.89
5.21
5.21
5.18
5.11
5.04
(continued)

Table] I.4
Pleonaste calculated aggregate elastic constants.
(Based on density p = 3.826 g/cm 3.)
(continued)
Elastic constant units
Symbol Unit Pressure derivativeunit (3/3P)
E, Young's modulus
p, Shear modulus
a, Poisson's ratio
K, Bulk modulus
6, Compressibility
Vs, Shear velocity
V , Compressional velocity
Mb
Mb
None
Mb
Mb~
km/sec
km/sec
None
None
10~ 4/kb
None
Mb- 2
(km/sec)/Mb
(km/sec)/Mb

Table 11.5
Elastic constants of FeAl2 04.
Single crystal constants
11 12 44
C (Mb) 2.660 1.825 1.335
S . (Mb-1 ) 0.851 -0.346 0.749
Calculated aggregate constants
E y a K V Vs p(Mb) (Mb) (Mb) (Mb~ 1 ) (km/sec ) (km/sec )
Voigt
Hashin
Kr6ner
Shtrikman
Reuss
2.518
2.305
2.253
2.163
1.916
0.968
0.875
0.853
0.814
0.711
0.300
0.317
0.322
0.329
0.348
2.103
2.103
2.103
2.103
2.103
0.475
0.475
0.475
0.475
0.475
4.756
4.521
4.463
4.361
4.074
8.905
8.740
8.701
8.631
8.442

Table 11.6
Elastic constants of various spinels.
Elastic constants
Spinel P M K C C C C C V V* Ref.s L 11 12 44 p s
MgO:3.5Al203 3.630 20.4 2.026 0.734 3.857 3.005 1.537 1.585 9.939 5.676 (1)
MgO:3.OAl203 3.624 20.4 2.026 0.723 3.847 2.990 1.544 1.580 9.929 5.658 (2)
MgO:2.6Al20 3 3.619 20.4 2.020 0.724 3.838 2.986 1.537 1.576 9.926 5.660 (3)
MgO:1.OA1203 3.581 20.3 1.950 0.630 3.690 2.790 1.530 1.530 9.727 5.489 (4)
Pleonaste 3.826 21.8 1.987 0.531 3.599 2.695 1.633 1.435 9.265 5.042 (5)
FeAl2 0 4.280 24.8 2.103 0.418 3.588 2.660 1.825 1.335 8.701 4.463 (5)
Fe 2TiO 4.836 31.9. 1.210 0.135 1.651 1.390 1.120 0.396 5.681 2.332 (6)
Fe3 04 5.163 33.1 1.596 0.810 2.819 2.676 1.056 0.953 7.349 4.162 (2)
Elastic constant pressure derivatives (3/3P)
MgO:3.0A1203 3.624 20.4 4.59 0.57 5.67 5.35 4.21 0.89 5.34 0.46 (2)
MgO:2.6A 2 03 3.619 20.4 4.23 0.50 5.25 4.90 3.90 0.85 4.74 0.32 (3)
Pleonaste 3.826 21.8 4.92 -0.05 5.65 4.85 4.95 0.75 5.18 -0.47 (5)
Theoretical 3.581 20.3 3.20 1.30 4.00 4.90 2.30 0.34 3.96 1.13 (7)MgO:1. 0A1
2 0 3
*Kr6ner average
References Symbol Unit Pressure derivative(3/aP) unit
1. Verma, 1960
2. England, 1970
3. Schreiber, 1967
4. Lewis, 1966
5. 'Present study
6. Syono et al., 1971
7. Sammis, 1970
C , elastic stiffnesses
K, bulk modulus
Vp, compressional velocity
Vs shear velocity
p, density
M, mean atomic weight
CS = 1/2 (C11 - C1 2 )
Mb
Mb
km/sec
km/sec
g/cm3
g/mole/atom
None
None
(km/sec)/Mb
(km/sec)/Mb
Not used
Not used
CL = 1/2 (C1 1 + C1 2 + 2C 4 4 )

59
Table 11.7
Deviation from oxygen cubic close packing for various
spinel stoichiometries [Jagodzinski and Saalfeld, 1958].
Define A = u - 0.375, where u establishes the oxygen
location. For perfect cubic close packing u = 0.375.
Spinel A U
NaturalMgO:1. 0A1203 0.012 0.387
SyntheticMgO:1. 0A12 0 3 0.011 0.386
MgO:2.0Al203 0.008 0.383
0.006 0.381MgO:3.5Al023

Table '11.8
Comparison of oxygen framework results with
experimental values for pleonaste and MgO:2.6A1203 '
The 3C. ./3P are thermodynamic elastic constant derivatives.J
Pleonaste MgO:2.6A12O3 0 Theoreticalratio
C. ./K C. ./K A..3j (3K/DP) 3 - (9K/3P) 1
ij = 11 1.36 1.30 1.48 1.51 1.50
ij = 12 0.82 0.86 0.76 0.75 0.75
ij = 44 0.72 0.41 0.78 0.50 0.75
(C thermo
DP )
3C 12 thermo
P t3C 44thermo
3P )
(c C effective3C )
3C 12 effective
DP(C 44 effective
P
C+ 1 + 11
3K
- 1 + C1 2
3K
C+ 1 + 3K

Table 11.9
Comparisons between (Mg1 xFex)Al20 4 and (Mgl-zFez) 2 SiO4 .
(Mg1 _Fex)Al 2 0 4 (Mgl-zFez) 2Si0 4
x p M V z = x/2 p M V
0.00
0.25
0.50
0.75
1.00
3.58
3.76
3.93
4.11
4.28
20.3
21.4
22.6
23.7
24.8
Symbol
p, density
39.7
40.0
40.2
40.4
40.6
0.00
0.12
0.25
0.38
0.50
3.56
3.73
3.89
4.06
4.22
20.1
21.2
22.4
23.5
24.6
39.6
39.9
40.2
40.5
40.8
-Unit
g/cm3
M, mean atomic weight
V, molar volume
g/mole/atom
cm 3/mole

62
Spinel
Figure Captions
Fig. II.l. Sketch of pleonaste sample.
Fig. 11.2. Sketch of hercynite sample.
Fig. 11.3. Pure mode directions in cubic crystals. .The
elastic constants determined are shown in Table 11.2
[after Brugger, 1965].
Fig. II.4. (a) Echo train in hercynite for a compressional
wave in the [ll0]-direction. The first echo on the left is
the reflection from the interface between the quartz buffer
rod and the sample. Later echoes that have made round trips
in the sample are inverted in phase with respect to the
reflection from the end of the buffer rod. The time scale
is 0.2 psec/cm. (b) Overlap of two echoes. The overlap
frequency is 2.60 MHz for a sample path length of 1.763 mm.
Fig. 11.5. Spinel structure [after Fyfe, 1964, p.106]. The
unit cell contains 32 oxygens in cubic closest packing with
cations in (a) 16 of the 32 octahedral sites and (b) 8 of
the 64 tetrahedral sites. For the general formula, AB204 ,
the spinel is termed normal when the A ions occupy the
tetrahedral sites and the B ions occupy the octahedral sites.
When the A ions and 1/2 the B ions occupy the tetrahedral
sites, the spinel is termed inverse.

63
Spinel
Fig. 11.6. C44-type crystallographic shear mechanism for the
NaCl + CsCl structure transformation [after Buerger, 1948,
p. 204].
Fig. 11.7. Schematic representation of transverse acoustic
(TA) mode dispersion curve under pressure. The horizontal
line represents a cutoff frequency at low temperatures. The
LA curve represents the longitudinal acoustic mode dispersion
curve. V is the frequency, K is the wavevector,.and a is the
lattice parameter [figure after Daniels and Smith, 1963].
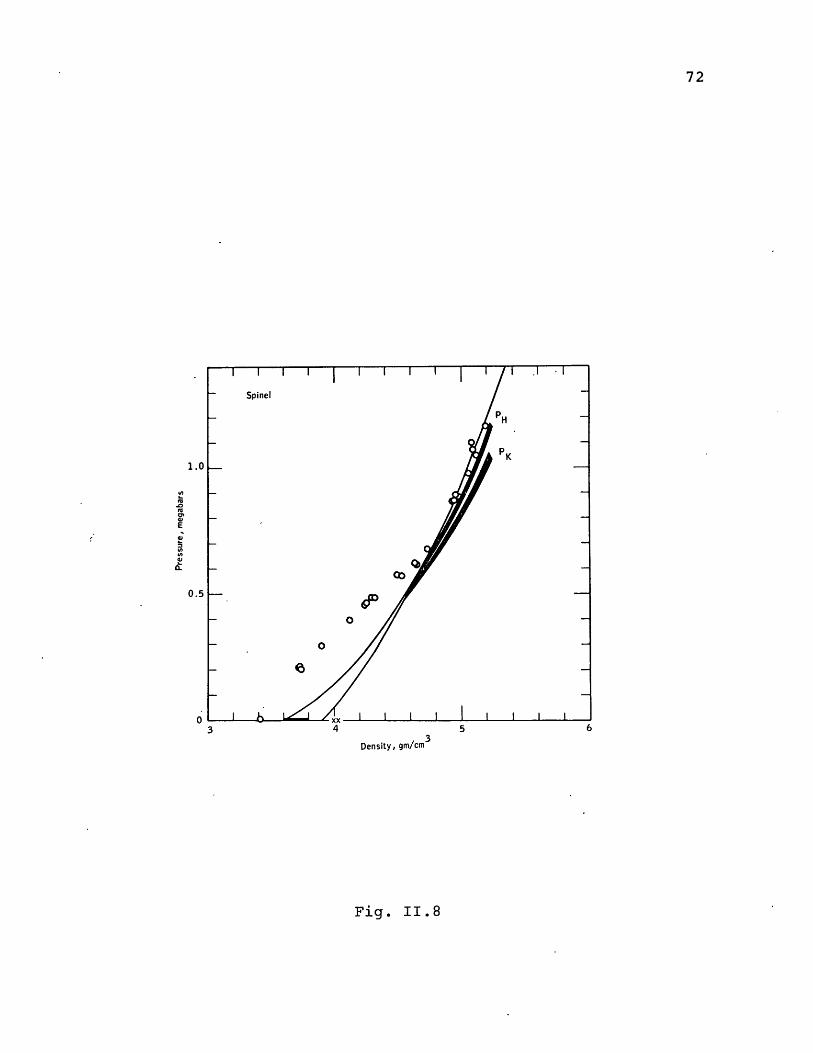
Fig. 11.8. Pressure-density Hugoniots for spinel. Two fits
to the high-pressure data are shown for two assumed starting
densities. The range of metastable Hugoniots PH corresponds
to the range of assumed zero-pressure densities indicated by
the heavy bar above the zero-pressure axis. PK is the 0*K
isotherm. The crosses represent the zero-pressure densities
found by D.L. Anderson and Kanamori [1968, p. 6489] from
whom the figure was taken. The 200 to 600 kb data is con-
sidered to be a region of mixed phase.
Fig. 11.9. Pressure-density Hugoniots for magnetite. The
symbols are as in Fig. 11.8. Again the figure is from
D.L. Anderson and Kanamori [1968, p. 6489]. The 200 to
600 kb data is considered to be a region of mixed phase.

64
Spinel
Fig. II.10. Pressure-volume Hugoniots for various olivines
[after Ahrens and Petersen, 1969]. The 200 to 700 kb data
is considered to be a region of mixed phase.
Fig. II.11. Keyes' [1963] strain-energy model for diffusion
under pressure. V* is the activation volume, G* is the
activation energy, K is the bulk modulus, and p is the shear
modulus.
Fig. 11.12. Velocity-density relations for spinels.

65
1001
Fig. 11.1

Fig. 11.2
11101
5mm

Fig. 11.3

(a)
(b)
Fig. II.4

0AlMg
11.5Fig.

/13

v m
l 1aO a
Fig. 11.7
Density, gm/cm
Fig. 11.8

1 .0pK
0
E
0.5 -.
00
0
5 6 7 8
Density, gm/cm3
Fig. 11.9

x Olivine, Twin sisters Mt., Wash.+ 0 Present data
x McQueen, Marsh, and FritzForsterite ceramic
+ + McQueen and MarshNorth Carolina olivine
o0ughes and McQueen
+ Olivinite&Rock I Trunin et al.
Ax IvRock Il
X
X
X
XX
XLD 0
- x* Forsterite-- -
Hugoniot elastic limits
020 022 024 026 028 030 032
Specific volume (cm 'g.
Fig. 11.10
1200
1000
800
600
4001
2001
0'018

75
K-4
-- 6 K=36p
K-- 4 -2
2
I 2 3
-2 ap
KdF '
F 1P
Fig. II. 11
G*
-2
KV*
G*

76
VP
Mg A1204
Pleor
Vs
MgAI 2 04
MgO: 2.6 A1203
oste
FeAI 20 4
Fe.S 104
Mn Fe2 04Fe3 04
NiFe204
Mg 0: 2.6 Al203
Pleonaste
FeAl O.2 4
Mn Fe204
* Fe3 0 4
NiFe 2 04
Density , g /cm
Fig. 11.12
91-
8 1-
E
C~)0
5--
41--
3 1-

77
Rutile-GeO2
III. Elastic constants of rutile-structure GeO 2 '
Germanium dioxide (germania) and germanate compounds
have been used in geochemistry as a means of studying high
pressure structures-of silica and silicates [see reviews by0
Ringwood, 1966, 1970].* The germanium ion (radius = 0.40 A)0
is somewhat larger than the silicon ion (radius = 0.26 A)
when both are in tetrahedral coordination [radii from Shan-
non and Prewitt, 1969]. The germanate crystal isostructural
to a silicate crystal is expected to go into a high pressure
modification at a pressure below that of the silicate (see
Table III.1 [after Ringwood, 1970]), because the oxygen
framework will collapse around the germanium ion relatively
sooner than around the silicon ion [Bernal, 1936]. The
chemical similarity has been exploited by geochemists to es-
timate phase boundaries of the corresponding silicate through
extrapolation in systems such as Mg2 GeO4 - Mg2SiO 4 {Dachille
and Roy, 1960], Ni 2 GeO4 - MgSiO4 [Ringwood and Seabrook, 1962],
and presently Mn2 GeO4 - Mg2SiO4 [Ringwood, 1970, p. 116].
The Mg2Ge04 - Mg2SiOg and Ni 2GeO - Mg2SiO4 systems gave
early estimates of the olivine-spinel phase boundary which
* I have thought that this similarity between germanates andsilicates could be exploited in the following examinationquestion: "Describe the evolution and present state of theearth if the abundances of germanium and silicon werereversed."

78
Rutile-GeO2
has recently been determined directly [Ringwood and Major,
1970]. The Mn2GeO 4 - Mg2SiO4 system is in early stages of
study to estimate the boundary of the spinel -+ post-spinel
(strontium plumbate) transition [Ringwood, 1970].
Even though some of these high-pressure silicate phases
are being synthesized, they are recovered in milligram pro-
portions. Present ultrasonic techniques require close to
one gram of material for polycrystalline samples. Single
crystals are out of the question (unless General Electric
becomes interested). So the germanium analogue technique
may also be used to understand the elasticity of high-pressure
silicate phases.
I add that though grams of stishovite are recoverable
from Meteor Crater, phase studies [Holm et al., 1967] show
that stishovite spontaneously transforms to a glass indis-
tinguishable from ordinary SiO2 glass at 800 *K in 15 to 20
minutes. Sample synthesis by hot-pressing might lead to an
undesired finished product.
Quite recently some elastic property work on germanate
compounds was reported by Soga [1969, 1971] and Mizutani
[1970]. Soga measured the pressure dependence of the elas-
tic moduli on germania glass and he measured the room condi-
tion values on a series of nearly dense polycrystalline
samples of quartz-structure GeO 2 , rutile-structure GeO 2, and

79
Rutile-GeO2
olivine-structure Mg2GeO4. Mizutani (1970] reported in
abstract form shear velocity measurements on very thin sam-
ples of Mn2GeO4 (olivine, spinel, and strontium plumbate
structures) and MnGeO 3 (ilmenite structure).
In this chapter I report the pressure and temperature
dependence of the single crystal elastic constants of rutile-
structure (Fig. III.1) GeO 2. This form of GeO2 is isostruc-
tural to stishovite [Stishov and Popova, 1961), the 6-coor-
dinated polymorph of SiO Similar measurements for the
elastic constants as a function of pressure and temperature
have been made for rutile (TiO2 ) by Manghnani [1969]. Since
silica constitutes 33 to 50 mole percent of the transition
zone and lower mantle, information gained from analogue
studies will be important.

Rutile-GeO2
A. GeO 2 phase diagram and thermochemical data.
Germanium dioxide can exist at room conditions in either
the low-quartz or rutile structure [for an early comprehen-
sive paper, see Laubengayer and Morton, 1932]. The densities
of the two polymorphs are shown in Table 111.2. The cation/
anion ratio is right on the boundary between 4:2 and 6:3
coordination. At room conditions the rutile form of GeO 2 is
the thermodynamically stable phase. At zero pressure the
rutile-GeO2 transforms to quartz-GeO2 at 1002 *C. The quartz
form is quite stable at room conditions, however. In fact
when one buys GeO 2 one obtains the quartz phase. It is made
at high temperatures from the ignition of GeCl4 and maintains
this metastable state. Thus the quartz-GeO2 + rutile-GeO2
transformation is quite sluggish in the absence of catalysts.
A hydrothermally determined phase diagram is shown in Fig.
111.2 [Hill and Chang, 1968].
The thermochemical data for germania is fairly complete
(Table 111.2). I have included the values for the analogous
but metastable transition SiO 2 (quartz) -* SiO 2 (stishovite)
[Holm et al., 1967].

81
Rutile-GeO2
B. Sample description.
The synthetically grown rutile-GeO 2 sample was obtained
from Capt. John Goodrum and C. Dugger of the Air Force Cam-
bridge Research Laboratories, Bedford, Mass. The sample was
slightly less than 1 cm3 in size and weighed 4.94 g. It was
transparent and yellow. A sketch of the sample as grown is
shown in Fig. III.3a. The four vertical sides were {110}-
faces and the pyramid top pointed in the C-axis direction.
The crystal was grown by a top-seeding method in an Na2 0
flux [Goodrum, 1970, 1971]. The only noticeable internal
flaw was some small bubbles near the seed. Comparison of
the X-ray density (6.2857 g/cm 3) and hydrostatic weighing
density (6.2718 g/cm 3) showed less than 0.2% deviation and
the bubbles were ignored. An average density of 6.279 g/cm 3
was used in the determination of the elastic constants. The
only other flaw was that the initial {ll0}-faces showed ap-
parent dislocation etch pits in reflected light. This caused
some difficulty in the optical polishing of these faces until
enough of the surface was ground away to remove the pits.
The {ll0}-faces as grown were within 1/2* of the true orien-
tation. Since the symmetry of Laue back-reflection photo-
graphs does not distinguish between {100} and {l10}-faces for
tetragonal symmetry, the distinction was made by means of a
diffraction scan. When compared against the powder pattern,
the scan showed missing {l00}-peaks which confirmed the
{l10}-orientation.

82
Rutile-GeO2
C. Experimental method and results.
In order to obtain a complete set of six elastic con--
stants with reasonable cross checks, four sets of parallel
faces were required. The normals to the four sets of faces
are shown in Fig. III.4. Polarization directions for shear
modes are also indicated and each mode is labelled. The
exact combination of elastic constants determined for each
mode is indicated in Table 111.3.
1. Sample cutting procedure.
The four sets of parallel faces were obtained from the
.single sample described in the previous section. Initially
one pair of {l10}-faces was polished and pressure and temper-
ature runs were made. Since the two shear modes were non-
degenerate, three independent elastic constant combinations
were determined. Then the pyramid was cut off and the set of
{001}-faces polished. The pressure and temperature dependence
of C33 and C44 were obtained from this direction. Note that
C44 had previously been determined from the [110]-direction.
At this point it was necessary to lose the {llQ}-faces. Name-
ly, in order to obtain {lO}-faces, cuts had to be made at a
45* angle to the {ll0}-face. Though the {l10}-faces were not
completely destroyed, a perpendicular path connecting them
was lost. With the {l00}-faces the crystal looked as in

83
Rutile-GeO2
Fig. III.3b. The pressure and temperature dependence of C1 ,
C66, and C44 were obtained from the [100]-direction. At this
point five of the six elastic constants had been determined.
Only C1 3 remained. It could be obtained from a set of
{l01}-faces, i.e., a cut had to be made at 450 to both the
{100} and {001}-faces. The {001}-face was oriented so that
the spots representing the mirror planes pointed in the [100]-
direction. Then swinging the goniometer 450 in the horizon-
tal plane and making a pair of vertical saw cuts yielded the
{l01}-faces(Fig. III.3c). The [001]-path direction was now
lost. However, the [100]-path direction remains and in theory
all six elastic constants may still be determined from just
the [100] and [1011-directions. Table 111.3 summarizes the
final path lengths in the different directions. All the
pairs of faces were optically polished flat and parallel to
10~4 in/in by the A.D. Jones Optical Works, Burlington, Mass.

84
Rutile-GeO2
2. Ultrasonic measurements.
The elastic constants of rutile-GeO2 were measured to
5 kb at room temperature (20 *C) and to 100 *C at zero pres-
sure by the pulse-echo-overlap technique [Papadakis, 1967;
Chung et al., 1969]. The measurements were mostly made at
20 MHz with coaxially plated X-cut and AC-cut quartz trans-
ducers. Some measurements were made at 30 MHz by driving the
third harmonic of a 10 MHz transducer to reduce the beam
spreading and guided-wave mode effects. A total of 22 pres-
sure runs and 20 temperature runs were made. A summary of
the average values for each mode is shown in Table III.4.
.The cross checks for the room condition elastic constants
are all good to better than 0.2%. The values shown for C44
are the average of runs in different directions. Mode cross
checks for the pressure derivatives show agreement within 5%
and mode cross checks for the temperature derivatives show
agreement within 10%. The pr6ssure and temperature deriva-
tives are considered accurate to 5% and 10%, respectively.
Since the different modes listed in Table III.4 over-
determine the six independent elastic constants, an arith-
metic average weighted by the number of runs was used in some
cases. C33, C44 , and C6 6 were taken simply as their value
in Table III.4. C and C12 were determined from the three
modes C11 , Cs, and CL1. Finally C1 3 was determined from the
difference 1/2 (CL2 - C ) and from the values for C1 , C3 3,-'2 T 2

85
Rutile-GeO2
and C4 4. Since 1/2 (CL2 - C )2= 1/4 [(C11 - C13 )2 +
4 (C13 + C4 4 )2]:/2, the magnitude of (C 1 3 + C44 ) was deter-
mined but not its sign. The two choices for C1 3 were
C1 3 = 1.874 Mb or C = -5.104 Mb. The proper choice was
C1 3 = 1.874 Mb in order to satisfy the inequality C 11C33
C 3 . The inequality comes from the requirement that the
strain energy density be positive definite, i.e.,
6 6E E C. ... > 0.
i=1 j= 1 1 1 3
A theorem of linear algebra [see, for example, Hausner, 1965,
p.127] says the energy density will be positive definite if
all the determinants
C Cl ClC C2 11 12 13
C 1 , C2 C11 C1 3 ,.'.I C C C12 11 13 C13 C33
are greater than zero. The'inequality C C > Cl follows
after some algebra. The resulting final values for the
single crystal elastic constants, their pressure derivatives,
and their termperature derivatives are tabulated in Table
111.5. In addition the linear compressibilities and the
volume compressibility are tabulated. Calculated aggregate
properties are tabulated in Table 111.6.

86
Rutile-GeO2
D. Comparison with other work.
In this section the present results will be compared with
the polycrystalline rutile-GeO2 values of Soga [1971], the
single crystal TiO 2'values of Manghnani [1969], the stisho-
vite shock-wave reductions of Ahrens et al. [1970], and the
stishovite isothermal compression measurements of Bassett and
Barnett 11970]. -Soga's values for the bulk modulus and com-
pressional wave velocity of rutile-GeO2 appear to be 20% and
7% too low, respectively. The pressure derivative of the
bulk modulus, DK/DP, for rutile-GeO2 is about 10% lower than
for TiO 2. The values are close enough that it is probable
3K/DP for stishovite is between 6 and 7.
1. Comparison with polycrystalline rutile-GeO2 '
Soga studied the elastic properties of polycrystalline
quartz-GeO2, rutile-GeO 2, and olivine-Mg2GeO4 . He synthesized
four rutile-GeO2 polycrystalline samples of different poro-
sity, the densest of which was 96% theoretical density. He
then estimated the following values for the compressional
wave velocity V and the shear wave velocity V . The corres-p .s
ponding values for the bulk modulus K and seismic parameter
D are also given.
Polycrys- Vp = 7.90 km/sec Vs = 4.85 km/sec
talline
values K = 1.950 Mb + = 31.0 km2 /sec 2

87
Rutile-GeO2
The values for K and V fall considerably outside the cal-
culated Voigt and Reuss bounds shown in Table II.6. The
Hill averages for the single crystal rutileGeO2 measurements
are shown below.
Hill V = 8.55 km/sec Vs = 4.90 km/sec
averages K = 2.576 Mb D = 41.0 km2 /sec 2
The cause of the discrepancies is in Soga's value for Vp
His Table 1 is plotted in Fig. 111.5. Perhaps the type of
porosity present in the sample reduced the compressional
wave velocity but not the shear wave velocity.
2. Comparison with single crystal rutile-TiO2 '
a.. Both GeO2 and TiO2 exhibit a negative value for the
pressure derivative of the shear modulus CS = 1/2 (C 11 - C1 2).
b. Both compounds show marked anisotropy. The ratio of
linear compressibilities parallel and perpendicular to the
C-axis are 0.449 for TiO and 0.369 for GeO2 2
c. The "Hill" averages for the bulk modulus pressure deriva-
tives are (3K/3P)TiO2 = 6.76 and (3K/3P)GeO2 = 6.16. Al-
though the value is about 10% lower for GeO 2 than for TiO 2 '
it is still relatively higher than those for other oxides and
silicates.

88
Rutile-GeO2
d. The "Hill" averages for the shear modulus pressure deriva-
tives are (p/DP)TiO2 = 0.78 and (i/DP)GeO2 = 1.22. Note
that the individual "Voigt" and "Reuss" values are far apart.
For TiO2 the "Voigt"'and "Reuss" values for Dp/DP are 1.88
and -0.34, respectively. For GeO 2 the "Voigt" and "Reuss"
values for 3p/3P are 1.78 and 0.67, respectively. The shear
modulus pressure derivative for GeO 2 is apparently larger
than for TiO 2 '
e. The "Hill" averages for the bulk modulus temperature
derivatives are (DK/T)TiO = -0.41 kb/*K and (K/@T)G2T 2 GeO 2
-0.36 kb/*K. As for K/3P, the value of DK/DT is about
10% lower (in magnitude) for GeO 2 than for TiO 2, but it is
still relatively higher (in magnitude) than those for other
oxides and silicates.
3. Comparison with stishovite -(shock-wave and isothermal
compression measurements).
Stishovite is the rutile modification of SiO2. Its
bulk modulus has been determined from shock-wave [Wackerle,
1962; McQueen et al., 1963; D.L. Anderson and Kanamori, 1968;
Ahrens et al., 1970; Davies and D.L. Anderson, 1971) and iso-
thermal compression measurements [Ida et al., 1967; Liu et al.,
1969; Bassett and Barnett, 1970]. In some cases a value for

Rutile-GeO2
the pressure derivative of the bulk modulus is quoted. The
more recent (1970 - 1971) determinations will be considered
in this section.
a. Shock-wave measurements.
Ahrens et al. [1970] fitted the raw high pressure
(> 400 kb) Hugoniot points of quartz to a third-order Birch-
Murnaghan equation. The Hugoniot was reduced to a room-
condition stishovite adiabat, where the adiabat was also
given a Birch-Murnaghan form. The initial volume of quartz,
the initial volume of stishovite, and the internal energy of
the quartz + stishovite transformation were assumed to be
known (Table 111.3). The volume dependence V/VO of the
thermodynamic Grineisen ratio, y = aKs/CPPO , was given theAform y = y0 (V/V ) . a is the thermal expansion, Ks is the
adiabatic bulk modulus, C, is the specific heat at constant
pressure, p0 is the initial density, and A is an adjustable
parameter. The preferred solution of Ahrens et al. [1970]
was
y= 1.58 A= 6 -
C/
6K0/3T = -0.50 kb/*K.(3K/3P)P=0 = 6. 86

90
Rutile-GeO2
The distinction between adiabatic and isothermal values
is not indicated since the differences are more than ade-
quately covered by uncertainties. Previously, Ahrens et al.
[1969] obtained K0 =.3.6 Mb and DK/DP = 3 by using the
Dugdale-MacDonald relation for the volume dependence of y
along the Hugoniot. The 1970 reduction yielding aK/3P = 6.86
seems appropriate in keeping with similar values found
ultrasonically for TiO2 and rutile-GeO2 '
b. Grineisen's ratio.
Gruneisen's ratio y is an important parameter in the
reduction of shock-wave data. It is generally regarded to be
only a function of volume and not explicitly a function of
temperature. There is evidence that the room condition y
(1.5 ± 0.3) for stishovite determined from thermodynamic
data is much higher than the high temperature y (0.8 to 0.9)
determined from the pressure offsets of fused quartz and por-
ous quartz (Coconino sandstone) Hugoniots [Ahrens et al., 1970].
Because both Grineisen's ratio and pressure derivatives
of elastic constants are a measure of the anharmonicity of
lattice vibrations, various relationsh.ips exist between them.
Acoustic Griineisen parameters associated with shear and longi-
tudinal modes may be defined by [Schuele and Smith, 1964]:
s = 1/3 + KT (31n Vs / 3P)T (Eqn. III.1)
p = 1/3 + K (3ln V / 9P)p T p T
(Eqn. III.2)

Rutile-GeO2
The definitions are for the case of an isotropic solid.
If Hill averages are used, Eqns. III.1 and 111.2 may also
be applied to single crystal elastic constants.
For high temperatures when all modes are excited
yHT (yp + 2y s)/3 (Eqn. 111.3)
since there exist twice as many shear modes as longitudinal
modes. The low temperature (where the specific heat associ-
ated with each mode is inversely proportional to the velocity
cubed) value is given by
-3 -3V y + 2V y
p p s s
T = . (Eqn. III.4)
V + 2V 3p s
For reference purposes, the various y's for GeO2 are
given below:
ys = 0.87 Yp = 2.02
yLT = 0.97 YHT = 1.25
Ythermo = 1.16 Yelastic = 1.06
The room cohdition thermodynamic Ythermo = =K/C p = 1.16
based on a = 13.6 x 10⁻⁶ /K [Rao et al., 1968] and C=
12 cal/mole*K [Counsell and Marin, 19671. Since the

92
Rutile-GeO 2
Debye temperature for GeO2 calculated from V and Vs is
773 *K, THT and YLT may be averaged to obtain yelastic
1.06 for room conditions (300 *K). The value compares
favorably with ythermo but is lower. Manghnani found that
for TiO 2 ' Yelastic = 0.88 while ythermo = 1.28.
c. Static compression measurements.
Bassett and Barnett [1970] measured the change in X-ray
lattice parameter of stishovite to 85 kb at 25 *C in a tetra-
hedral press. NaCl mixed with the stishovite was used to
calibrate the pressure. The compressibilities parallel to
the a-axis and c-axis are given below when linear fits were
made to the lattice parameter versus pressure data.
-l Aa - 0.138 Mb 1a a AP
0
-1 Ac - 0.057 Mb~1
c c AP
The ratio c /a is equal to 0.41 which is intermediate
between the ratios found for TiO and rutile-GeO2. The vol-2 2*
ume compressibility V is 0.333 Mb which gives a bulk
modulus K = 3.0 Mb. However, if the volume versus pressure
data were fit by the Birch-Murnaghan equation, K = 2.76 Mb
for DK/3P = 4 and K = 2.69 Mb for 3K/3P = 6. The different
values suggest that a 10% uncertainty may be placed on -the
value for the bulk modulus.

Rutile-GeO2
d. Discussion.
A value of (3K/9P)P=0 between 6 and 7 should be used in
reductions of shock-wave or isothermal compression data for
stishovite which involve that parameter. The similar DK/DP
values for TiO 2 and rutile-GeO 2 make such a requirement
reasonable and seem to rule out the possibility that the high
3K/3P for TiO 2 is due to some peculiarity of the electronic
4+. 6.structure. In fact the Ti ion is 3p in its outermost shell
4+ 6 4+and is exactly isoelectronic to Si which is 2p . Ge is
3d 0 and hence might be considered more likely to show any
electronic structure bonding differences. Recall, however,
that the silicon atom and the germanium atom are isoelectronic,
and that in oxides they show more crystal chemical similarities
because their ionic radii are closer. Thus TiO2 and rutile-
GeO 2 together indicate that stishovite will have a value of
3K/3P between 6 and 7 because of their similar crystal
structures.
e. Some suggestions.
Much effort has gone into the shock-wave work on quartz.
Some of the assumptions used in the reduction of the data may
perhaps be checked by performing shock-wave experiments on
polycrystalline GeO 2, both in the quartz and rutile structures.
The synthesis of such samples to a density between 90 and 95%
theoretical density should provide no special difficulty. Such
synthesis has been done by Soga [1971].

94
Rutile-GeO2
The thermochemical data for both the quartz and rutile
structures are fairly complete. Reliable single crystal
elastic constants, their pressure derivatives, and their
temperature derivatives for rutile-GeO2 have been presented.
Single crystal data for quartz-GeO2 may also be expected to
be available in the future. Single crystal quartz-GeO 2
samples of limited size have been grown already [Roy and
White, 1967; Finch and Clark, 1968; Theokritoff, 1970]. A
1 cm3 size sample would be sufficient for an ultrasonic study.
Complete sets of elastic constants for both structures along
with shock-wave measurements would be an opportunity to study
the lattice d-7namics over this geophysically interesting
phase transition.

95 1
Rutile-GeO2
E. Phase transformation and diffusion kinetics.
The kinetics of the quartz-GeO2 - rutile-GeO2 transfor-
mation as a function of pressure (10 to 30 kb) and temperature
(380 to 600 *C) were studied by Zeto and Roy [1969]. The
transformation is of the metastable-to-stable type with a
large volume decrease (50%) and thus is of the type one might
associate with a -phase transformation source for deep focus
earthquakes [Evison, 1963; Randall, 1964; Holstrom, 1968].
The experimentally determined rate curves are shown in
Fig. 111.6. Zeto and Roy in their discussion of the rate
curves divided the transformation kinetics into three stages.
rStage 1. The initial growth of the rutile phase was relative-
ly rapid and was increased by both pressure and temperature.
This stage was interpreted as the nucleation of rutile growth
sites over the surfaces of individual grains.
Stage 2. After the formation -of nuclei on grain surfaces, the
growth of the nuclei took place preferentially over ,further
nucleation. This mechanism represented the rate curve up to
the "knee."
Stage 3. Beyond the knee of the curve the rate behavior was
somewhat unusual. The interpretation was that inhibition of
the growth of the rutile phase occurred due to the formation
of a product layer of the phase surrounding the individual
grains.

96
Rutile-GeO2
Zeto and Roy continued their discussion by writing the
rate of transformation in the general form:
a = 1 - exp(-btn) (Eqn. 111.5)
where a = volume fraction transformed
t = time
b, n = constants
The portion of the rate curves before the knee yielded
n = 0.5. A value of n = 0.5 had been suggested for diffusion
controlled growth. An empirical activation energy of 29 ± 9
kcal/mole and an activation volume between -15 and -25 cm3!
mole were obtained for the transformation before the knee.
The negative activation volume meant that the activation
energy decreased as a function of pressure, i.e., the rate
constants increased as a function of pressure. Since diffu-
sion rate constants normally are decreased by pressure, a
diffusion mechanism for the transformation became questionable.
Zeto and Roy did not rule out the possibility since they
indicated that pressure might have reduced the particle size
and hence increased the transformation rate.

97
Rutile-GeO2
a. Keyes' strain energy model.
In terms of Keyes' [1963] strain energy model presented
in the previous chapter, the diffusion rate constant might
actually be expected- to increase a little with pressure.
Keyes' relation is
V*= - - 1] (Eqn. 111.6)
where V* = activation volume for diffusion
G* = activation energy for diffusion
K = bulk modulus
y = shear modulus.
Prom Soga's values of V = 4.1 km/sec and V = 2.55 km/sec for
quartz-GeO2, the bulk modulus K is 0.348 Mb and the shear
modulus p is 0.278 Mb so that K/p = 1.25. The ratio K/p is
0.82 for a-quartz [based on Hill averages for K and p from the
single crystal values of McSkimin et al., 1965]. a-quartz is
apparently the only oxide known for which the bulk modulus is
smaller than the shear modulus. Soga's quartz-GeO 2 does not
show such behavior. Single crystal elastic constants to con-
firm the K/p ratio for quartz-GeO 2 would be desirable.
Since the pressure derivative Dp/3P for quartz-GeO2 is
not available, a value of 0..5 is estimated from the quartz-SiO 2
data [McSkimin et al., 1965]. Then the factor in brackets in
Eqn. 111.6 is negative and so is V*.

98
Rutile-GeO2
b. Empirical melting temperature relationship.
Now consider the empirical diffusion relationship
advocated by Weertman [1970].
D = D exp(-gT m/T) (Eqn. 111.7)
where D = diffusion coefficient
D = constant
g = constant
T = melting temperature as function
of pressure
T = temperature
The general relationship for the diffusion coefficient under
pressure is given by
D = D exp(-G*/kT) exp (-PV*/kT)0I
(Eqn. 111.8)
where G* = activation energy for diffusion
V*= activation volume for diffusion
k = Boltzmann's constant.
For small pressures T T + (dT /dP)YP ,.where Tm=m mm m t mo
melting temperature at P = 0. Then near P = 0 the constant g
of Eqn. 111.7 should satisfy both g = G*/kTmo and
g = V*/(k(dTm/dP) 0) [Weertman, 1970]. If the two expressions
for g are assumed to be equal, then

99
Rutile-GeO2
V* = G* (dTm/dP)o / T . (Eqn. 111.9)
A value of (dT m/dP) = -0.5 *C/bar is obtained from the
GeO 2 phase diagram (Fig. 111.2). Then V* is negative.
Quantitative agreement between Eqn. 111.6 and 111.9 is lack-
ing (V*/G* ~ -1.0 Mb~1 and V*/G* ~ -0.5 kb~1 , respectively)
but the signs do agree.
C. Summary.
The negative sign of the experimentally determined
activation volume for the quartz-GeO2 + rutile-GeO trans-2 2
formation is predicted by Keyes' strain energy model for
diffusion and the empirical melting temperature relation
favored by Weertman. For quartz-GeO2 there does not seem to
be a conflict between the two theories. Since the theories
predict an increase in diffusion rate with pressure, it may
not be necessary to suppose a particle size effect in order
to have the quartz -+ rutile transformation kinetics be
controlled by a diffusion process.
NOMMUNUMMA-

100
Rutile-GeO2
F. FeO and SiO2 in the lower mantle.
The composition of the lower mantle was inferred from
seismic data and ultrasonic, shock wave, isothermal compres-
sion, petrologic, crystal chemical, and high-pressure/high-
temperature phase equilibria studies by Ringwood [1970] and
D.L. Anderson [1970]. Ringwood concluded that the mineral
assemblage was denser than an isochemical mixture of oxides
due to phase transitions and that no change in chemical
composition was required. D.L. Anderson concluded that the
lower mantle was richer in FeO and SiO2 than in the upper
mantle.
In my opinion the discussion of the lower mantle given
by Ringwood [1970] was well-reasoned and consistent with the
available data. The reader is referred to his paper for the
details. The methods by which D.L. Anderson reached his con-
clusions on the composition of the lower mantle will be cri-
tically reviewed in this section.
1. D.L. Anderson's three methods for estimating the composi-
tion of the lower mantle.
Method 1. Since the lower mantle (1000 to 2900 km) is basi-
cally homogeneous and adiabatic, the third-order Birch-
Murnaghan equation and its density derivative may be least
squares fit to different density and seismic velocity models.

101
Rutile-GeO2
The final parameters determined are a room condition density
p0 and seismic parameter 40. The mean atomic weight M (i.e.,
iron content) is determined from the seismic equation of
state [D.L. Anderson, 1967].
Method 2. The assumption is made that the room condition
molar volumes and seismic parameters of the high-pressure
phases of olivine, pyroxene, and garnet are molar sums and
molar averages of the constituent oxides, respectively. Then
the p0 and 0 found for the lower mantle determine molar per-
centages of the oxides MgO, FeO, and SiO 2 (stishovite).
Method 3. A direct comparison is made between the lower
mantle's pressure versus density curve and that of shocked
dunites of different FeO/(FeO + MgO) ratios.
2. Discussion.-
Methods 1 and 3 marginally favored the case for iron-
enrichment. The uncertainties in the seismic equation of
state were duly noted [D.L. Anderson and Jordan, 1970].
Ringwood [1970] discussed the shock-wave evidence with the
conclusion that iron-enrichment was possible but not required.
My discussion then concentrates on Method 2 -- the molar
averaging scheme.

102
Rutile-GeO2
a. Assumption of an isochemical mixture of oxides.
Note immediately that an isochemical mixture of oxides
has been assumed since the molar volumes of the high-pressure
phases of olivine, pyroxene, and garnet are considered to be
the molar sum of the oxides. The lower mantle density re-
ferred to room conditions is generally conceded to be greater
than an isochemical mixture of oxides of upper mantle composi-
tion. Is the greater density due to phase transitions and/or
iron enrichment? Assuming an isochemical mixture of oxides
begs the question in favor of iron enrichment since phase
transformations to a denser state are precluded. (Previously,
D.L. Anderson [1968] also made the assumption of an isochemi-
cal mixture of oxides. In that paper (p. 94) he explicitly
stated that his conclusions involved only the region between
the top of the mantle and 800 km depth and that he did not
rule out the possibility of further phase changes below 800 km.
In D.L. Anderson and Jordan [1970], however, their discussion
dealt only with the lower mantle at depths greater than
1000 km.)
b. Uncertainties in 4(SiO 2).
Anderson and Jordan [1970] apparently used a value
4(SiO 2 ) = 85 km2/sec 2 while Anderson et al. [1971] used
P(SiO 2 ) = 70 km2/sec 2 . One wonders, of course, what the
effect is of the change in values. The change is summarized
in Fig. 111.7. In Fig. 111.7 the dashed lines represent the

103
Rutile-GeO2
original figure from Anderson and Jordan [1970] while the
solid lines represent the revision to @(SiO2) = 70 km2/sec2,
The garnet line has not been reproduced for simplicity.
In the figure's original form the lower mantle p0 and 0
solutions fell between the dashed "pyroxene" and "olivine"
lines. The molar averaging scheme gave a composition (in
mole percent):
Model .200204 0.38 MgO + 0.16 FeO + 0.46 SiO2(82% "pyroxene")
Birch 2 0.49 MgO + 0.12 FeO + 0.39 SiO 2
(43% "pyroxene")
By way of comparison Ringwood's pyrolite [Ringwood, 1966] is:
-Pyrolite 0.54 MgO + 0.06 FeO + 0.40 SiO 2
(50% "pyroxene")
However, in its revised form, the lower mantle solutions no
longer fall between the "pyroxene" and "olivine" lines.
But now the triangle determined by the points SiO 2 '
Mg2SiO4 , and (Mg0 .5Fe 0 .5)2SiO 4 is almost the same as that in
Fig. 4 of Anderson et al. [1971]. They evidently used this
triangle in the sense of a petrologic composition indicator.
For example, a perpendicular is dropped to the p-axis from
the point representing Model 200204. The point at which the
perpendicular to the p-axis intersects the Mg2SiO4 -

104
Rutile-GeO2
(Mg0.5 Fe0 )2SiO4 base side determines the MgO/FeO ratio.
The (MgO + FeO)/SiO 2 ratio is determined by the ratio of
lengths along the vertical between c(SiO 2) and the "olivine"
line with Model 200204 as the dividing point. The triangle
of Fig. 111.7 gives a 100% "pyroxene" component (Mg0 .7Fe0 .3)SiO 3
with 15% excess silica. D.L. Anderson et al. [1971] found
a 100% "pyroxene" component (Mg0.6 4Fe0.36 )SiO3 .
c. Summary.
Consistency of the petrologic triangle interpolation
scheme with the molar averaging scheme is lacking when the
same U(SiO 2) is used in both cases. All the lower mantle
solutions fall above the revised "pyroxene" and "olivine"
lines (Fig. 111.7). Presumably, no one will consider the
revised figure to be an argument for a lower mantle richer
in silica than "pyroxene."

105
Rutile-GeO2
References
Ahrens, T.J., D.L. Anderson, and A.E. Ringwood, Equations of
state and crystal structures of high-pressure phases of
shocked silicates and oxides, Rev. Geophys., 7, 667-707, 1969.
Ahrens, T.J., T. Takahashi, and G. Davies, A proposed equation
of state of stishovite, J. Geophys. Res., 75, 310-316, 1970.
Anderson, D.L., A seismic equation of state, Geophys. J., 13,
9-30, 1967.
Anderson, D.L., Chemical inhomogeneity of the mantle, Earth
Planet. Sci. Letters, 5, 89-94, 1968.
Anderson, D.L., Petrology of the mantle, in Special Paper No.
'3, edited by B.A. Morgan, pp. 85-93, Mineralogical Society
of America, Washington, D.C., 1970.
Anderson, D.L., and T. Jordan, The composition of the lower
mantle, Phys. Earth Planet. Interiors, 3, 23-35, 1970.
Anderson, D.L., and H. Kanamori, Shock-wave equations of state
for rocks and minerals, J. Geophys. Res., 73, 6477-6502, 1968.
Anderson, D.L., C. Sammis, and T. Jordan, Composition and
evolution of the mantle and core, Science, 171, 1103-1112,
1971.
Bassett, W.A., and J.D. Barnett, Isothermal compression of
stishovite and coesite up to 85 kilobars at room temperature
by X-ray diffraction, Phys. Earth Planet. Interiors, 3,
54-60, 1970.
Bernal, J.D., Discussion, Observatory, 59, 268, 1936.

106
Rutile-GeO2
Chung, D.H., D.J. Silversmith, and B.B. Chick, A modified
ultrasonic pulse-echo-overlap method for determining sound
velocities and attenuation of solids, Rev. Sci. Inst., 40,
718-720, 1969.
Counsell, J.F., and J.F. Martin, The entropy of tetragonal
germanium dioxide, J. Chem. Soc. (A), 560-561, 1967.
Dachille, F., and R. Roy, High pressure studies of the system
Mg2GeO4 - Mg2SiO4 with special reference to the olivine-
spinel transition, Am. J. Sci., 258, 225-246, 1960.
Davies, G.F., and D.L. Anderson, Revised shock-wave equations
of state for high-pressure phases of rocks and minerals,
J. Geophys. Res., 76, 2617-2627, 1971.
Evison, F.F., Earthquakes and faults, Bull. Seismol. Soc. Am.,
53, 873-891, 1963.
Finch, C.B., and G.W. Clark, Flux growth and characterization
of hexagonal germanium dioxide single crystals, Am. Mineral.,
53, 1394-1398, 1968.
Fyfe, W.S., Geochemistry of Solids, 199 pp., McGraw-Hill, New
York, 1964.
Goodrum, J.W., Top-seeded flux growth of tetragonal GeO 2 '
J. Crystal Growth, 7, 254-256, 1970.
Goodrum, J.W., Growth and characterization of tetragonal
(rutile) GeO 2 crystals, Phys. Sci. Res. Pap. No. 449, 25 pp.,
Air Force Cambridge Research Laboratories, Bedford, Mass.,
1971.

107
Rutile-GeO2
Hausner, M., A Vector Space Approach to Geometry, 397 pp.,
Prentice-Hall, Englewood Cliffs, N.J., 1965.
Hill, V.G., and L.L.Y. Chang, Hydrothermal investigation of
GeO 2 , Am. Mineral., 53, 1744-1748, 1968.
Holm, J.L., O.J. Kleppa, and E.F. Westrum, Jr., Thermodynamics
of polymorphic transformations in silica. Thermal properties
from 5 to 1070*K and pressure-temperature stability fields
for coesite and stishovite, Geochim. Cosmochim. Acta, 31,
2289-2307, 1967.
Holstrom, G.B., Elastic radiation from a propagating phase
boundary, Phys. Earth Planet. Interiors, 1, 181-195, 1968.
Ida, Y., Y. Syono, and S. Akimoto, Effect of pressure on the
lattice parameters of stishovite, Earth Planet. Sci. Letters,
3, 216-218, 1967.
Keyes, R.W., Continuum models of the effect of pressure on
activated processes, in Solids under Pressure, edited by W.
Paul and D.M. Warschauer, pp. 71-99, McGraw-Hill, New York,
1963.
Laubengayer, A.W., and D.S. Morton, Germanium. XXXIX. The
polymorphism of germanium dioxide, J. Am. Chem. Soc., 54,
2303-2320, 1932.
Liu, L.G., T. Takahashi, and W.A. Bassett, Compression of
stishovite and magnesian ilmenite at 250C, Trans. Am. Geophys.
Union, 50, 312, 1969.

108
Rutile-GeO2
Manghnani, M.H., Elastic constants of single-crystal rutile
under pressure to 7.5 kilobars, J. Geophys. Res., 74, 4317-
4328, 1969.
McQueen, R.G., J.N. Fritz, and S.P. Marsh, On the equation of
state of stishovite, J. Geophys. Res., 68, 2319-2322, 1963.
McSkimin, H.J., P. Andreatch, Jr., and R.N. Thurston, Elastic
moduli of quartz versus hydrostatic pressure at 25* and
-195.8*C, J. Appl. Phys., 36, 1624-1632, 1965.
Mizutani, H., Shear wave velocities of mantle minerals and
their geophysical implications, paper presented at the
International Symposium on Mechanical Properties and Processes
in the Mantle, Flagstaff, Arizona, 24 June - 3 July 1970.
Papadakis, E.P., Ultrasonic phase velocity by the pulse-echo-
overlap method incorporating diffraction phase corrections,
J. Acoust. Soc. Am., 42, 1045-1951, 1967.
Randall, M.J., Seismic energy generated by a sudden volume
change, Bull. Seismol. Soc. Am., 54, 1291-1298, 1964.
Rao, K.V.K., S.V.N. Naidu, and L. Iyengar, Thermal expansion
of rutile-type GeO 2 by the X-ray method, J. Am. Ceram. Soc.,
51, 467-468, 1968.
Rayne, J.A., and B.S. Chandrasekhar, Elastic constants of 8
tin from 4.2*K to 300*K, Phys. Rev., 120, 1658-1663, 1960.
Ringwood, A.E., Mineralogy of the mantle, in Advances in
Earth Scienceedited by P.M. Hurley, pp. 357-399, MIT Press,
Cambridge, 1966.

- I
109
Rutile-GeO2
Ringwood, A.E., Phase transformations and the constitution of
the mantle, Phys. Earth Planet. Interiors, 3, 109-155, 1970.
Ringwood, A.E., and A. Major, The system Mg2SiO 4 - Fe2Si04 at
high pressures and temperatures, P Earth Planet. Interiors,
3, 89-108, 1970.
Ringwood, A.E., and M. Seabrook, Olivine-spinel equilibria at
high pressure in the system Ni2GeO4 - Mg2SiO4 , J. Geophys.
Res., 67, 1975-1985, 1962.
Roy, R., and W.B. White, High temperature solution (flux) and
high pressure solution (hydrothermal) crystal growth, J.
Crystal Growth, 3,4, 33-42, 1968.
Schuele, D.E., and C.S. Smith, Low temperature thermal expan-
sion of RbI, J. Phys. Chem. Solids, 25, 801-814, 1964.
Shannon, R.D., and C.T. Prewitt, Effective ionic radii in
oxides and fluorides, Acta Cryst., B25, 925-946, 1969.
Soga, N., Pressure derivatives of the elastic constants of
vitreous germania at 25*, -78.5*, and -195.8*C, J. Appl.
Phys., 40, 3382-3385, 1969.
Soga, N., Sound velocity of some germanate compounds and its
relation to the law of corresponding states, J. Geophys. Res.,
76, 3983-3989, 1971.
Stishov, S.M., and S.V. Popova, New dense polymorphic modifi-
cation of silica, Geokhimiya, English Transl., no. 10, 837-
839, 1961.

110
Rutile-GeO2
Theokritoff, S., Hetero-epitaxial growth of large crystals of
a metastable phase: germania [quartz], M.S. thesis, The
Pennsylvania State University, University Park, 1970.
Wackerle, J., Shock-wave compression of quartz, J. A Phys.,
33, 922-937, 1962.
Weertman, J., The creep strength of the earth's mantle, Rev.
Geophys. Space Phys., 8, 145-168, 1970.
Zeto, R.J., and R. Roy, Kinetics of the GeO 2 (quartz) -* GeO 2
(rutile) transformation at pressure to 30 kbar, in Reactivity
of Solids, edited by J.W. Mitchell, R.C. DeVries, R.W. Roberts,
and P. Cannon, pp. 803-815, Wiley-Interscience, New York,
1969.

Table III.1
Comparison of some isostructural germanates and silicates.
[after Ringwood's Table 1, 1970]
Structure Germanate Stability Silicate Stabilityconditions conditions
P = 0
T < 1007 *CSio
2
P > 100 kb
T = 1000 *C
P = 0 P > 15 kb
Ca3 Al2 Ge3012 T ' 1000 3C Ca3Al2S 3012 T = 800-1000
P= 0 P > 18 kbNi 2 GeO4 T= 650 *C Ni2 SiO4 T = 650 *C
P= 0 P > 38 kbFe 2 GeO4 T= 600 *C Fe2 SiO T = 600 *C
P= 0 P > 110 kb(Mg0 .8Fe 0 .2)2Ge04
(Mg0 .8Fe0 , 22 SiO 4T = 800 *C
GeO2
Rutile
Garnet
Spinel
Spinel
SpinelT = 800 *C

Table 111.2
Densities and thermochemical data for germania and silica.
GeO (qtz) GeO2(rut) SiO, (qtz) SiO (stish)
Density (g/cm ) 4.28 6.28 2.65 4.28
Molecular wt. 104.6 104.6 60.1 60.1
Vol. (cm 3/mole) 24.44 16.66 22.70 14.04
GeO 2 (qtz--rut) SiO 2 (qtz+stish)
(AH) 298 (kcal/mole)
(AS) 298 (cal/mole*K)
(AV)29 8 (cm 3/mole)
-4. 85± 0.7
-3.5 ±0.6
-8.0
11.8±0.3
-3.24
-8.7
Qtz = Quartz
Rut = Rutile
Stish = Stishovite

113
Table 111.3
Elastic constants determined from different
propagation modes shown in Fig. III.4.
Propagation Path Vibration Vibrationdirection length direction mode
(mm)
[110] 9.5225 [110] L
[110] 9.5225 [110] T
[110] 9.5225 [001] T
[001] 6.7686 [001] L
[001] 6.7686 Any T
[100] 6.8669 [100] L
[100] 6.8669 [010] T
[100] 6.8669 [001] T
[101] 4.9878 [101] L
[101] 4.9878 [010] T
[101] 4.9878 [101] T
Elasticconstant
CL1
C5
C4 4
C3 3
C 4 4
C1 1
C6 6
C4 4
CL2
CT1
CT2
where C =
C =
CL =
CT =
CT2
1/2 (C1 1 + C1 2
1/2 (C1 1 - C1 2
A + B
1/2 (C 44+ C 66
= A - B
A = 1/4 (C 1 1 + C 3 3 + 2C4 4 )
B = 1/4 [(C 1 1 - C3 3 )2 + 4 (C13 + C )2 1/2
Also L = longitudinal, T = transverse
+ 2C 6 6)

114
Table 111.4
Average values for C.., 3C,./@P, and 3C../@T for different1J 1J 1J
modes. Since the values for C44 as determined from different
modes showed no systematic error, the values below are
arithmetic averages of all runs for it.
Elastic Velocity C.. aC../3P @C ./3Tconstant from 1J 1)designation C.. - pv2
(see Table 1'111.3) (km/sec) (Mb) (kb/K)
C 11 7.328 3.372 6.50 -0.40
C33 9.770 5.994 6.63 -0.38
C 5.072 1.615 1.78 -0.15
C66 6.415 2.584 4.10 -0.38
C 3.445 0.745 -0.69 +0.02
CLi 9.109 5.210 11.62 -0.90
CL2 8.949 5.029 7.16
CT 5.784 2.100 ---- -----
C T2 4.554 1.302 1.55 -0.11
-indicates that a pressure or
run was not made.
temperature

115
Table 111.5
Rutile-GeO 2 single crystal elastic constants.
(Based on density p = 6.279 g/cm 3 )
11 12 13 33 44 66
C.. 3.372 1.882 1.874 5.994 1.615 2.5841)
S.. 0.458 -0.213 -0.077 0.215 0.619 0.387lJ
C. ./@P 6.65 8.05 4.10 6.63 1.78 4.10iJ
S../aP -0.01 -0.64 0.12 -0.21 -0.68 -0.611]
3C../aT -0.42 -0.46 -0.23 -0.38 -0.15 -0.381J
las. ./3T 0.11 0.29 -0.08 0.13 0.58 0.571JJ
as _S@-- -S- sax ax
3C. ./3T are based on the following thermal expansion values
[Rao et al., 1968]:
aa = linear thermal expansion parallel to a-axis
= 6.3 x 10- 6/C
ac = linear thermal expansion parallel to c-axis
= 2.1 x 10- 6/C
(continued)

116
Table 111.5
Rutile-GeO2 single crystal elastic constants.
Based on density p = 6.279 g/cm 3
(continued)
a S 11+S12+13 = 0.168 Mb~ 1
c S3 3+2S1 3 = 0.062 Mb1
= 2S +S33+2 12+4S13 = 0.398 Mb~1
where a = linear compressibility parallel to a-axis
wc = linear compressibility parallel to c-axis
S= volume compressibility = 2a + CV a c
Symbol Unit Pressure Temperaturederivative derivative(3/3P) Unit (D/3T) Unit
C.., elastic stiffnesses Mb None Kb/*K1J
S, elastic compliances Mb 1 Mb- 2 10-4 Mb-1/K1J

Table 111.6
Rutile-GeO 2 calculated aggregate elastic constants.
(Based on density p = 6.279 g/cm 3 )
Zero pressure aggregate constants
E K V Vs p
Voigt 4.076 1.637 0.245 2.666 0.375 5.106 8.788
Reuss -3.500 1.381 0.268 2.511 0.398 4.689 8.325
Aggregate pressure derivatives
3E/DP Dp/DP 30/aP 3K/3P 3 /aP DV /DP DV /3P
5.19
2.83
1.78
0.67
2.32
4.12
5.83
6.48
-0.82
-0.91
1.82 5.78
0.20 5.40
(continued)
"Voigt"
"Reuss"

Table 111.6. (continued)
Rutile-GeO 2 calculated aggregate elastic constants.
(Based on density p = 6.279 g/cm3 )
Aggregate temperature derivatives
. E/aT By/3T Da/aT aK/3T 36/9T aVs/T 3V /aT
"Voigt" -0.41 -0.16 -0.07 -0.34 0.48 -0.21 -0.44
"Reuss" -0.25 -0.08 -0.19 -0.38 0.54 -0.10 -0.41
Symbol
Young''s modulus
Shear modulus
Poisson's ratio
Bulk modulus
Compressibility
Shear velocity
Compressional velocity
Unit Pressure derivative Temperature derivative(3/3P) unit (3/3T) unit
Mb None kb/*K
Mb None kb/*K
None Mb~1 104 /*K
Mb None kb/*K
Mb~ 1 M-2 10~ 4 Mb 1/OK
-3km/sec (km/sec)/Mb 10 (.km/sec)/*K
-3km/se c (km/s ec) /Mb 10 (km/s e c)/*K
E,
K,
V ,
V p

119
Rutile-GeO2
Figure Captions
Fig. III.l. Rutile structure [after Fyfe, 1964, p. 47]. The
cation is octahedrally coordinated and the oxygen is sur-
rounded by a trigonal-planar group of three cations.
Fig. 111.2. Phase diagram of GeO 2 [after Hill and Chang,
1968].
Fig. 111.3. Sketch of GeO 2 sample at different stages of the
measurements.
Fig. 111.4. Propagation and polarization directions for the
different modes used in determining the elastic constants of
tetragonal crystals [after Rayne and Chandrasekhar, 1960].
The mode designations are shown in Table 111.3.
Fig. 111.5. Polycrysta-lline rutile-GeO2 values for V com-
pared to the single-crystal Voigt and Reuss bounds.
Fig. 111.6. (a) Quartz-GeO2 + rutile-GeO2 transformation
rate curves for different temperatures at 20.4 kb.
(b) Quartz-GeO 2 + rutile-GeO2 transformation rate curves for
different pressures at 480*C [after Zeto and Roy, 1969].
Fig. 111.7. Molar averaging scheme for estimating composition
of lower mantle from seismic # and p solutions [revised from
D.L. Anderson and Jordan, 1970, p. 32].

12
0
+
II
I
H
O
Fig
. III.1

121
140 -
120
100
80-
Liquid
c\l
60 -
40 - Rutile - Ge02
Quartz - GeO 2
20 -
0900 1000 1100
Temperature, OC
. Fig. 111.2

7mm
Fig. 111.3
122
.11101
1110}
mmw

I7I 0 11 5.
z190
V71V
[oo T]
/o- m~imm9
V7173
[10 0]
£ ZT
[O TT]
S3
[0 TO]1717
3

124
9.0 0 Soga porous rutile-Ge02
X Soga extrapolated value Voigt bound
0 Present VRH value
Reuss bound
8.0
0
E
C)
6.0
E
0O
6.0 -
5.0 6.0 7.0
Density, g/cm3
Fig. 111.5
wwwmmmmwm

125
10 20 30 40 50
Time, hr
10 20 . 30 40 50
Time, hr
Fig. 111.6
(a)
1.0
.80
.60
.40
.20
0
co
0$
0
(b)
1.0
.80
.60
.40
.20

70
60
50
3.8 4.0 4.2 4.4 4.6 4.8 5.0 5.2 5.4
p , g /cm 3
E

127
Garnet
IV. Elastic constants of spessartite-almandine garnet.
The word "garnet" is used in two different ways. First,
it represents the six natural silicate garnets with the
VIII VI IVgeneral formula A3 B2 Si3 012* (Table IV.1). Second, it
represents the complex structure (Fig. IV.1) which these
natural garnets possess. The context in which the woid
"garnet" is used should keep the meaning clear.
The elastic properties of garnet are of geophysical
interest in both senses of the word. (1) Garnet is important
in distinguishing between a peridotitic (olivine + pyroxene)
or eclogitic (pyroxene + garnet) upper mantle. Even for the
predominant view of a peridotitic upper mantle, garnet is an
important accessory phase. For example, if garnet pyrolite
is taken to represent the upper mantle at a depth of 150 to
250 km, then garnet represents 14 weight percent [Ringwood,
1970]. (2) Beginning at about 350 km depth pyroxene
gradually transforms into the garnet structure [Ringwood,
1967]. For example, MgSiO 3 has the garnet structural formula
Mg (Mg,Si) VSi 0 "Such garnets, characterized by par-3 3 12*.
tial octahedral coordination of silicon, are fundamentally dif-
ferent from the common garnet family of minerals in which sil-
icon is always in tetrahedral coordination" [Ringwood, 1967,
p.258]. The density increase over the pyroxene -+ garnet
*The Roman numeral superscripts indicate coordination number.

128
Garnet
transformation is about 10% [Ringwood, 1969, p. 406]. Because
of the high pressures and temperatures required for synthesis,
garnet-transformed pyroxenes will not be readily available in
amounts necessary for ultrasonic experiments. So perhaps the
partial octahedral coordination of the silicon may be under-
stood through a combination of analogue studies, namely,
ordinary garnets and six-coordinated silica analogues such as
rutile-GeO2 '
Ultrasonic measurements on garnet in this country have
been limited. Verma [1960] measured the room condition elas-
tic constants of an almandine-pyrope garnet and a spessartite-
almandine garnet. (Table IV.1 is a reminder list of common
end member names of natural garnets and synthetic or rare-
earth garnets as well as their chemical formulas.) Soga
11967] measured the pressure and temperature dependence of the
elastic constants of another almandine-pyrope garnet. In
Russia Ryzhova et al. [1966] ultrasonically measured the
elastic constants of a number of natural garnets. Several
synthetic garnet measurements and older determinations of
garnets of unspecified composition exist [see the compilation
by Simmons and Wang, 1971].

129
Garnet
A. Sample description.
Table IV.2 lists the chemical analyses, densities, and
mean atomic weights of the present garnet and others con-
sidered in this chapter. The analysis of Verma's spessartite-
almandine garnet and the present one agree in all oxides to
1.5 weight percent. The present garnet was purchased from the
International Mineral Corp., 44 Maiden Lane, New York, New
York, as a 'cut stone (Fig. IV.2a) with Brazil as its likely
source of origin. Its original weight was 7.58 g. After
X-ray orientation, it appeared as in Fig. IV.2b and its weight
was 1.865 g. Only the {llO}-faces were polished. The path
length was 6.217 mm. Verma's garnet was obtained from the
'Harvard collection with Brazil as its origin. His [110]-
path length was 8.79 mm.
The hydrostatically determined density of the present
spessartite-almandine garnet was 4.2374 g/cm 3 while the X-ray
density was 4.2597 g/cm 3. An average value of 4.249 g/cm 3
was used in the determination of the elastic constants.
A mean atomic weight of 25.0 was calculated directly
from the chemical analysis while M from the approximate
chemical formula (based on the ideal 12 oxygens in the garnet
formula) was 24.7. There is a deficiency of cations compared
to the number expected for 12 oxygens (Z cations = 7.95
versus ideal E = 8.00).

130
Garnet
It is worth emphasizing the optical purity of the pre-
sent garnet sample. Under a microscope with a strong light
source, the garnet transmits like a medium red glass with
absolutely no visible flows or inclusions. By way of con-
trast, Soga's almandine sample contained five volume percent
ilmenite inclusions ITakahashi and Liu, 1970].
MWWM1WMWMM

131
Garnet
B. Experimental method and results.
The elastic constants of the spessartite-almandine gar-
net were measured to 5 kb at room temperature (20 *C) by the
pulse-echo-overlap technique IPapadakis, 1967; Chung et al.,
1969]. The garnet was oriented to 1/2* with a Laue back-
reflection camera in the [110] and [1001-directions. However,
only the {ll0}-faces were optically polished flat and parallel
to 10~4 in/in by the A.D. Jones Optical Works of Burlington,
Mass. In this direction there exist three independent pure
modes which yield CL = 1/2 (C 1 + Cl2 + 2C44 ), CS = 1/2 (C -
C1 2), and C4 4 . Then C11 = CL + (CS - C4 4 ) and C1 2 = CL - C -
944. The path length in the [1101-direction was 6.217 mm.
The measurements were made at 20 MHz with coaxially
plated X-cut and AC-cut quartz transducers. At this frequency
the echo train was modulated by guided-wave modes. However,
no particular difficulties occurred if early echoes were
used. The C.. are considered to be accurate to 0.5% and the
3C../3P accurate to 5%.1J
The results of the single crystal measurements are
tabulated in Table IV.3 and calculated aggregate properties
in Table IV.4. No bounds for the aggregate property deriva-
tives are implied. However, because of the very small anisot-
ropy of velocities in single crystal garnet, the averages are
determined fairly well. The raw frequency versus pressure

132
Garnet
data were fitted by a least squares linear relation. The
derivative of the "effective elastic constant" [Thurston,
1965] was obtained either by computing the elastic constant
C.. at different pressures and finding the slope, or by1)
differentiating the expression
C.. = 4 p 12 f 2 (Eqn. IV.1)1J
where p = density
1 = path length
f = reciprocal round trip travel time
with respect to pressure and evaluating it at P = 0. No
distinction between adiabatic and isothermal bulk modulus
was made in calculating DC. ./9P since the difference does noteJr
effect the result within the stated 5% accuracy.

133
Garnet
C. Comparison with other garnets.
1. Ultrasonic measurements on natural garnets.
Tabulated in Table IV.5 are the elastic constants of the
present study, garnets 1 and 2 of Verma [1960], the almandine-
pyrope of Soga [1967], and the grossularite of Ryzhova et al.
[1966]. The immediate conclusion to be drawn from the first
four garnets in the upper half of the table is that all four
of the natural garnets are very similar in their room condition
elastic behavior. All variations are within 2%. Grossularite
is an exception as calcium-rich compounds tend to be [Simmons,
1964].
The comparison of the pressure derivative values of the
present garnet with Soga's almandine-pyrope is shown in the
bottom half of Table IV.5. My value of the bulk modulus
pressure derivative is BK/3P = 5.0 compared to Soga's 3K/3P =
5.4, an 8% difference. Such a difference is not particularly
significant considering the compositional and possible quality
difference between the samples. The derivatives of the shear
moduli C5 and C4 g are about 1.5. No shear instabilities are
indicated.

134
Garnet
2. Isothermal compression measurements on pyrope-almandine
garnets.
The bulk modulus of four garnets in the pyrope-almandine
series, including the end members, were recently determined
from isothermal X-ray measurements up to pressures of 300 kb
by Takahashi and Liu [1970]. The end-member pyrope and
almandine samples were laboratory synthesized. A natural
pyrope isolated from a Roberts Victor Mine eclogite and Soga's
[1967] natural almandine were the other two garnet samples.
The microprobe analysis for the natural pyrope is given in
Table IV.2.
The volume compression V/V versus pressure data were
least-squares fit to a third order Birch-Murnaghan equation
where the zero pressure isothermal bulk modulus K and its
pressure derivative K' = (K/aP) P= were the variable para-
meters. Takahashi and Liu fitted their data once by allowing
both K and K' to be adjustable and then fitted their data0 0
again by fixing K' = 5.45 (Soga's ultrasonic value) and only
allowing K to be adjustable. The two parameter fit yielded
values of K 10 to 15% higher than K obtained with K' fixed01 0 0
at 5.45. Because the latter analysis yielded a K 0value for
Soga's almandine within 1% of the ultrasonic value, Takahashi
and Liu considered the K' = 5.45 fit to be most reliable for0
all four garnets. The results are tabulated in Table IV.6.

135
Garnet
3. Ultrasonic measurements on synthetic garnets.
Tabulated in Table IV.7 are the elastic constants of the
present spessartite-almandine along with several synthetic
or rare-earth garnets. A large range of densities (4.24 <
p < 7.10 g/cm 3 ) and mean atomic weights (24 < N < 51) is
represented. The four synthetic garnets YIG, YGaG, EuIG, and
GdGaG have values of p/N close to 0.14. YAG has p/N = 0.153,
while grossularite has p/M = 0.161 and spessartite-almandine
has p/N = 0.17. Since both YIG and GdGaG have exactly the
same p/R = 0.14 but different values of the seismic parameter
$ = K/p , they cannot both satisfy the seismic equation of
state [D.L. Anderson, 1967].
One might wonder about the effect of electronic structure
(both orbital and spin) on the elastic properties. Several of
the synthetic garnets are ferrimagnetic (indicated in Table
IV.7) and show magnetostriction. The elastic constants might
show a change in value upon application of a magnetic field
below saturation. This change in elastic constants is known
as the AE-effect and is due to interaction of the elastic
field with the magnetic domain structure [see, for example,
Bozorth, 1951]. Thus the tabulated constants may not repre-
sent purely elastic behavior. Of the magnetic garnets
tabulated, the EuIG and YIG measurements were made in a de-
magnetized state [Bateman, 1966]. No mention of the magnetic
state was made in the GdGaG paper [Graham and Chang, 1970].

136
Garnet
The pressure derivative values for YIG were calculated
from the complete set of third-order elastic constants given
by Eastman [1966]. The YIG sample was magnetically saturated
to eliminate magnetostrictive effects under pressure. The
value of (DK/DP)YIG = 4.6 is 10% lower than for spessartite-
almandine, but is in the usual range for oxides and silicates.
Besides magnetic effects the different electronic struc-
tures may be responsible for deviations from general relations
between elastic properties and cell volume. Thus trivalent
yttrium, iron, gadolinium, and gallium have valence electronic
configurations 4p6, 3d5 4f 7, and 3d1 0, respectively.

137
Garnet
4. Crystal chemical considerations.
In some sense the parameter p/M does normalize wide
variations in the individual parameters p and M. When the
normalization is expected to be reliably true within a parti-
cular structural family (namely, the garnets) will be inves-
tigated in this section. The parameter p/M within a struc-
tural family is inversely proportional to the unit cell
volume. Tables of effective ionic radii may be used to indi-
cate the relative sizes of the ions occupying the different
sites in the crystal structure. The site radii for the
natural and synthetic garnets of Tables IV.5, IV.6, and IV.7
are shown in Table IV.8. In addition, site radii are shown
for garnet-transformed MgSiO3 and garnet-transformed bronzite.
As indicated in the introduction, garnet-MgSiO 3 has the struc-
VIII VI IVtural formula Mg3 (MgSi) Si3 012. Garnet-transformed
3+aluminous pyroxenes will also contain some Al in the VI-
coordinated site. The radius of the ion occupying this B or
octahedral site for these transformed garnets is taken to be
the formula number average of the individual ions. Thus the
B-site radius in garnet-MgSiO3 is the simple average of the
32+ 4+radii of Mg and Si appropriate to 6-fold coordination.
All the effective ionic radii are taken from Shannon and
V1 2-0Prewitt 11969] and are based -on r( 02) = 1.40 A. The
radius for 8-coordinated Fe + is estimated by assuming that
the ratios r( Fe +)/r( Fe +) and r( Mn 2+)/r( Mn 2+
are equal.
ONVOk,

138
Garnet
The natural and synthetic garnets separate into two
groups on the basis of different reciprocal volumes per ion.
(Recall that the reciprocal volume per ion is proportional to
p/M .1 The difference is due to the much smaller si'ze of the
Si + ion in the C-site and to the somewhat smaller size of the
2+ 2+ 2+.Mg , Mn , or Fe ions in the A-site compared to the tran-
sition or rare earth ions. Within each group there occurs a
misfit. The Ca2+ occupying the A-site in grossularite is
notably larger than in any of the other natural garnets. And
the Al occupying the C-site in YAG is notably smaller than
in any of the other synthetic garnets. These ionic size
differences also mean values of p/M distinctly different
from other members of the group. For the purpose of the pre-
sent discussion, no particular attempt will be made to fit
these two garnets into their respective groups except to note
that when the relative ratios of the ions in the different
sites change appreciably, the resulting relative distortions
in the coordination polyhedra may lead to elastic anomalies
not predicted from a universal equation of state [see also
D.L. Anderson, 1969]. It turns out that YAG fits in nicely
with the other synthetic garnets when an inverse D versus H
relationship is considered.

139
Garnet
5. Seismic # - density - mean atomic weight relations.
Universal equations of state such as O.L. Anderson's and
Nafe's [1965] relation [also O.L. Anderson, 1966] and D.L.
Anderson's [1967] seismic equation of state relate the mean
volume per ion pair 2M/p (or its reciprocal) to the bulk
modulus K (or the seismic parameter 4) = K/p). In terms of 4)
the two equations may be expressed as follows:
D.L. Anderson 4 = A1 (p/M)Eqn. IV.2)
O.L. Anderson A = 2 K'-l (Eqn. IV.3)
where Al, A2, n = constants
4 = seismic parameter
p = density
M = mean atomic weight
K'= (aK/3P)0 P=0
The exponent n in D.L. Anderson's equation is close to 3 as
determined by fitting the equation to "31 selected minerals
and rocks." When n = 3 the equation implies K' = 4. O.L.0
Anderson's equation then becomes identical to D.L. Anderson's
equation for K' = 4 and compounds of equal mean atomic weight0
M. Except for these special conditions the two relations pre-
dict different behavior. In particular, for all the natural
garnets where p/M is essentially constant, Eqn. IV.2 pre-
dicts equal values of 4 whereas Eqn. IV.3 predicts 4) to be
inversely proportional to M. The inverse proportionality of
- ___ - MMM

140
Garnet
1 and R in garnets from Eqn. IV.3 was pointed out by
Takahashi and Liu 11970] and was satisfied by their isothermal
compression data for the pyrope-almandine series. If all the
garnet data including the synthetic garnets are plotted ac-
cording to 4) versus 1/N , the garnets again separate into two
groups (Fig. IV.3). Within each group (except grossularite)
the data follow the D versus 1/M proportionality fairly well.
Note that within the two groups p/N is being treated as a
constant. For the synthetic garnets p/N varies up to 10%.
If the variations in p/H are taken into account by either
Eqn. IV.2 or IV.3, the fit to the data becomes considerably
poorer. In Fig. IV.3 all the data points (except grossularite)
are within 5% of the fitted lines. Most points are within 2%.
Two conclusions are indicated by the plotted data in terms of
the crystal chemical discussion of the previous section.
a. Within the isostructural garnet family neither D.L. Ander-
son's relation (Eqn. IV.2) nor O.L. Anderson's relation (Eqn.
IV.3) fit all the data. The different A:B:C site-radii in-
fluence 4 in a way not predicted from a cell volume dependence.
b. However, the plausible condition is that if garnets have
equal values of p/N and have ions of equal radii in the in-
dividual coordination sites, then they satisfy the inverse
proportionality between D and N derived from O.L. Anderson's
relation (Eqn. IV.3).

141
Garnet
6. Garnet-MgSiO3 '
If a density increase of 10% over pyroxene-MgSiO3 is
assumed, the density of garnet-MgSiO 3 is 3.52 g/cm 3 , the mean
atomic weight is 20.08, and p/M = 0.175. Compare these values
to pyrope, Mg3Al2Si30 12 . The density of pyrope is 3.56 g/cm 3 ,
the mean atomic weight is 20.16, and p/9 = 0.177. Not only
is the cell volume for garnet-MgSiO3 the same as for pyrope
and the other natural garnets, but also the radii of the
cations in the three sites are the same (see Table IV.8).
Recall that the B-site radius of garnet-MgSiO 3 is the average
of the Mg + and Si4+ radii when both are in 6-fold coordina-
tion. That the effective radii of the three cation sites are
nearly the same for pyrope and garnet-MgSiO3 is consistent
with their nearly equal values for p/M.
So the elastic properties of pyrope and garnet-MgSiO 3
will probably be the same (shown also in Table IV.8). Though
the discussion has so far concentrated on D, the justifica-
tion for also estimating values for Vp (compressional wave
velocity) and Vs (shear wave velocity) comes from noting in
Table IV.5 that the ratio V /V for the ultrasonicallyP Smeasured natural garnets is fairly constant.
Since the single crystal elastic constants of ortho-
pyroxene-bronzite have been determined [Kumazawa, 1969], the
estimated values for a garnet-transformed bronzite have also
been tabulated in Table IV.8. Note that iron substitution

142
Garnet
into garnet-transformed pyroxenes does not affect the cell
volume or individual coordination site radii just as it does
not in the pyrope-almandine series. Hence the elastic
parameters may be determined from the inverse D versus M
proportionality.

143
Garnet
D. Garnet's role in the mantle.
The relative proportion of mantle compounds in the
garnet structure is not well-determined at present. Ring-
wood's estimate of 14 weight percent of pyrope-rich garnet in
the 150 to 250 km region of the upper mantle was mentioned in
the introduction to this chapter. For greater depths high
pressure phase studies show different transformation possibili-
ties. Though emphasis has been placed in this chapter on es-
timating the elastic properties of MgSiO 3 transformed into the
garnet structure, this transformation has not been observed
directly but rather is inferred from Ringwood's studies [re-
,viewed in Ringwood, 1970] on MgSiO 3 :10% Al203 , MnSiO 3, CaGeO3 '
and CdGeO3. Direct transformation of MgSiO3 into the garnet
structure must occur at pressures greater than 200 kb. By
such pressures competing modes of transformation are:
MgSiO 3 MgO + SiO 2 (stishovite)
MgSio 3 + MgSiO 3 (ilmenite).
The presence of Al203 as aluminous pyroxene alters the
situation since the aluminous pyroxenes transform into the
garnet structure at lower pressures.

144
Garnet
Does the seismic data provide evidence for the
pyroxene -+ garnet transformation occurring in the earth's
mantle? First, some laboratory data must be considered.
MgSiO 3 forming a garnet solid solution with pyrope is indi-
cated by the sharp increase in lattice parameter of garnet
crystallized from MgSiO 3:10% Al203 glass at 100 kb (see
Fig. IV.4 after Ringwood, 1967). The magnitude of the
velocity change over the pyroxene -+ garnet transformation may
be obtained from the single crystal elastic constants of
bronzite [Kumazawa, 1969] and the estimated values for the
velocities of bronzite transformed into the garnet structure
shown in Table IV.8. The Hill averages for the single cystal
bronzite are compared with the estimated garnet-bronzite
values
Pyroxene-V = 7.84 km/sec V = 4.74 km/sec
bronzite ps
Garnet-V = 9.32 km/sec V = 5.22 km/sec
bronzite
The value of 4 changes from 31.5 km2/sec 2 to 50.5 km2/sec 2
(estimated) over the pyroxene -* garnet transition in bronzite.

145
Garnet
A density increase of 10% is thus matched by an increase
of 20% in V and an increase of 10% in V . A 20% increasep s
in V accompanying a 10% increase in density was found by
Mizutani et al. [1970] for the olivine + spinel transition
in Fe2SiO 4.
Ringwood in 1967 placed the pyroxene -+ garnet transforma-
tion at a depth of 350 km after correcting the 900 *C con-
ditions of Fig. IV.4 to 1500 *C (the 2500 *C temperature on
p. 260 of his paper must be a misprint). He stated that
"some seismologists now suspect that the rapid increase of
seismic velocity marking the beginning of the transition
zone occurs around 17 or 18*, or a depth of about 350 km."
Since that time compressional wave discontinuities have been
found by looking for reflectors. Whitcomb and D.L. Anderson
[1970] found a P'P' reflector at 280 km but none at 440 km.
Simpson et al. [.1971] separated the 360 km discontinuity-into
ones at 280 km and 440 km. It seems reasonable then to as-
sociate the 280 km discontinuity with Ringwood's aluminous
pyroxene to garnet transformation, as Whitcomb and D.L.
Anderson have done.
The magnitude of the velocity discontinuity is. dependent
upon the amount of the pyroxene component in the upper mantle.
Ringwood's [1970, p. 140] estimate for pyrolite is about

146
Garnet
25 weight percent orthopyroxene. The resulting seismic dis-
continuities would be about 0.4 km/sec for Vp and 0.1 km/sec
for V . Thus there is little chance for resolving the dis-
continuity from shear velocity profiles and only a slight
chance from compressional velocity profiles. Perhaps the ar-
gument so far used may be reversed so that the magnitude of
the discontinuity becomes a broad band estimator of the
pyroxene component.

147
Garnet
References
Anderson, D.L., A seismic equation of state, Geophys. J., 13,
9-30, 1967.
Anderson, D.L., Bulk modulus-density systematics, J. Geophys.
Res., 74, 3857-3864, 1969.
Anderson, O.L., A proposed law of corresponding states for
oxide compounds, J. Geophys. Res., 71, 4963-4971, 1966.
Anderson, O.L., and J.E. Nafe, The bulk modulus-volume rela-
tionship for oxide compounds and related geophysical problems,
J. Geophys. Res., 70, 3951-3963, 1965.
Bateman, T.B., Elastic moduli of single-crystal europium iron
-garnet and yttrium iron garnet, J. Appl. Phys., 37, 2194-
2195, 1966.
Bozorth, R.M., Ferromagnetism, 968 pp., Van Nostrand, New York,
1951.
Chung, D.H., D.J. Silversmith, and B.B. Chick, A modified ul-
trasonic pulse-echo-overlap method for determining sound
velocities and attenuation of solids, Rev. Sci. Inst., 40,
718-720, 1969.
Deer, W.A., R.A. Howie, and J. Zussman., Rock-Forming Minerals,
Vol. 1, Ortho- and Ring Silicates, 333 pp., Longmans, London,
1962.
Eastman, D.E., Measurement of third-order elastic moduli of
yttrium iron garnet, J. Appl. Phys. , 37, 2312-2316, 1966.

148
Garnet
Graham, L.J., and R. Chang, Elastic moduli of single-crystal
gadolinium gallium garnet, J. A Phys., 41, 2247-2248, 1970.
Kumazawa, M., The elastic constants of single-crystal ortho-
pyroxene, J. Geophys. Res., 74, 5973-5980, 1969.
Mizutani, H., Y. Hamano, Y. Ida, and S. Akimoto, Compressional-
wave velocities of fayalite, Fe2SiO4 spinel, and coesite,
J. Geophys. Res., 75, 2741-2747, 1970.
Papadakis, E.P., Ultrasonic phase velocity by the pulse-echo-
overlap method incorporating diffraction phase corrections,
J. Acoust. Soc. Am., 42, 1045-1951, 1967.
Ringwood, A.E., The pyroxene-garnet transformation in the
earth's mantle, Earth Planet. Sci. Letters, 2, 255-263, 1967.
Ringwood, A.E., Phase transformations in the mantle, Earth
Planet. Sci. Letters, 5, 401-412, 1969.
Ringwood, A.E., Phase transformations and the constitution of
the mantle, Phys. Earth Planet. Interiors, 3, 109-155, 1970.
Ryzhova, T.V., L.M. Reshchikova, and K.S. Aleksandrov, Elastic
properties of rock-forming minerals, Izv. Solid Earth Physics,
English Transl., no. 7, 447-450, 1966.
Shannon, R.D., and C.T. Prewitt, Effective ionic radii in
oxides and fluorides, Acta Cryst., B25, 925-946, 1969.
Simmons, G., Velocity of compressional waves in various min-
erals at pressures up to 10 kilobars, J. Geophys. Res., 69,
1117-1121, 1964.

149
Garnet
Simmons, G., and H. Wang, Single Crystal Elastic Constants and
Calculated Aggregate Properties: A Handbook, 370 pp., MIT
Press, Cambridge, 1971.
Simpson, D.W., C. Wright, and J.R. Cleary, Double discontinuity
in the upper mantle, Nature, 231, 201-203, 1971.
Soga, N., Elastic constants of garnet under pressure and tem-
perature, J. Geophys. Res., 72, 4227-4234, 1967.
Spencer, E.G., R.T. Denton, T.B. Bateman, W.B. 'Snow, and L.G.
Van Uitert, J. A Py. 34, 3059-3060, 1963.
Takahashi, T., and L. Liu, Compression of ferromagnesian gar-
nets and the effect of solid solutions on the bulk modulus,
-J. Geophys. Res., 75, 5757-5766, 1970.
Thurston, R.N., Effective elastic coefficients for wave pro-
pagation in crystals under stress, J. Acoust. Soc. Am., 37,
348-356, 1965. Erratum, J. Acoust. Soc. Am., 37, 1147, 1965.
Verma, R.K., Elasticity of some high-density crystals, J. Geo-
phys. Res., 65, 757-766, 1960.
Whitcomb, J.H., and D.L. Anderson, Reflection of P'P' seismic
waves from discontinuities in the mantle, J. Geophys. Res.,
75, 5713-5728, 1970.

Table 'IV. 1
Garnet end-member compositions.
[see Deer et al., 1962, Vol. 1, pp. 77-112]
Natural garnet end members General formula: A +B +C 3+0 (A B VI Ol3 2 3 12 3 B2 3 12'
Almandine
Andradite
Grossular
Pyrope
Spessartite
Fe 2+Al Si 03 2 3 12
Ca3Fe + Si303 2 3 12
Ca 3Al2S 3 012
Mg3Al2S 3012
Mn 3Al2S 3 012
Ca3Cr2S 5012Uvarovite
Roman numeral superscripts indicate coordination number.
(continued)

Table IV.1 (continued)
Synthetic or rare earth garnets General formula: A B +B3+0 = A +B5+03 2 B 3 0 1 2 3 5 12
Yttrium Aluminum Garnet (YAG)
Yttrium Iron Garnet (YIG)
Yttrium Gallium Garnet (YGaG)
Gadolinium Gallium Garnet (GdGaG)
Erbium Aluminum Garnet (ErAlG)
Europium Iron Garnet (EuIG)
3+Y3 Al5012
3+Y Fe 3+03 5 12
3+Y Ga 3+03 5 12
Gd 3Ga5 012
Er3 Al5 012
Eu3 Fe5 012
The B and C of the general formula for natural garnets is now the same ion. Thesynthetic garnets may be thought of as the result of charge-coupled substitutionbetween the A and C sites.

Table IV. 2
Garnet chemical analyses (wt. %), densities, and mean atomic weights.
Oxide Present Verma Verma Soga TakahashiStudy* Garnet 1 Garnet 2 [1967] and Liu
[1960] [1960] [1970]
Sio2
TiO2
Al203 -
Total Feas FeO
MnO
MgO
CaO
36.4 35.4 36.3 37.62
0.01
20.6
19.4
22.3
0.3
99.0
'21.0
19.1
23.8
0.05
0.44
99.79
21.0
37.1
0.4
3.6
1.5
99.9
21.44
33.15
1.10
5.07
1.10
99.49
41.59
0.31
21.29
16.15
0.25
16.37
3.39
99.35
4 *Microprobe analysis by A.
p , g/cm3
0
a., AM
4.249
11.5445
24.9
Reid of
4.247
11.56
24.9
the NASA Manned Spacecraft Center, Houston, Texas.
4.183
11.52
24.3
4.1602
11.531
23.8
3.81
11.521
21.9 H( t
(continued) N

Table IV. 2
Garnet chemical analyses (wt. %1, densities, and mean atomic weights.
(continued)
Sample Approximate chemical formula Name
Present study:
Verma Garnet 1:
Verma Garnet 2:
Soga
3(Mn 54Fe 46)0:Al2 0 3SiO20
3.(Mn 55Fe 45 :Al203:3SiO20
3 (Fe 1Mg14 Ca5) 0 :Al 203: 3SiO 2
3(Fe 76Mg 2 1Ca310:Al 2 3SiO 2
3 (Mg60Fe31 Ca)O:Al2 0 3:3SiO20
Spessartite-almandine
Spessartite-almandine
(Natural) almandine
(Natural) almandine
(Natural) pyrope6 Takahashi & Liu

154
Table IV.3
Spessartite-almandine single crystal elastic constants
11 12 44
C.. 3.085 1.123 0.9481J
aC. ./3P 7.15 3.85 1.301J
S.. 0.4023 -0.1074 1.05491J
as. ./aP -0.746 0.112 -1.45JJ
as _ S ac- - -S-s
Symbol
C.., elastic stiffnesseseo
S. ., elastic compliancesIJ
Unit
Mb
Mb 1
Pressure derivative
None
Mb-2

155
Table IV.4
Spessartite-almandine calculated
aggregate elastic constants.
Zero pressure aggregate constants
E y a K a V Vp
2.443 0.961 0.271 1.777 0.563 4.756 8.484
Aggregate pressure derivatives
3E/aP Dp/3P Ba/3P DK/3P 3/Pp 3V/pp 3V P /P
4.13 1.44 2.51 4.95 -1.57 2.22 7.14
No distinction is made between the different methods of
averaging the single crystal elastic constants since they
all give the same results.
Symbol
E, Young's modulus
p, Shear modulus
a, Poisson's ratio
K, Bulk modulus
, Compressibility
V s, Shear velocity
~ Unit
Mb
Mb
None
Mb
Mb 1
km/se c
V , Compressional velocity km/sec
Pressure derivative(3/3P) unit
None
None
.Mb-
None
Mb
(km/s ec) /Mb
(km/sec)/Mb

Table IV.5
Natural garnets: ultrasonic measurements.
Elastic constants
Garnet p K Cs L 11 12 44 p s p s
Present 4.249 24.9 1.777 0.981 3.052 3.085 1.123 0.948 8.484 4.756 1.784study
Verma 1 4.247 24.9 1.756 0.988 3.037 3.073 1.097 0.952 8.466 4.770 1.775
Verma 2 4.183 24.3 1.765 0.962 3.030 3.048 1.123 0.944 8.515 4.769 1.785
Soga 4.160 23.8 1.770 0.968 3.020 3.062 1.125 0.927 8.531 4.762 1.791
Grossularite 3.598 22.4 1.504 0.970 2.724 2.798 0.857 0.896 8.723 5.071 1.720
Elastic constant pressure derivatives (/aP)
Present 4.249 24.9 4.95 1.65 6.80 7.15 3.85 1.30 7.14 2.22 -----study
Soga 4.160 23.8 5.43 1.54 7.25 7.48 4.41 1.31 7.87 2.18 -----
Symbol Unit
C , elastic stiffnesses Mb
K, bulk modulus Mb
V , compressional velocity km/sec
Vs, shear velocity km/sec
p, density g/cm3
M, mean atomic weight g/mole/atom
Pressure derivative(3/aP) unit
None
None
(km/sec)/Mb
(km/sec)/Mb
Not used
Not used
LH
CL = 1/2 (C11 + C1 2 + 2C4 4 )C S = 1/2 (C 11 - Cl12)

Table IV.6
Pyrope-almandine garnets: isothermal compression measurements.
[Takahashi and Liu, 1970]
Garnet p M K
(g/cm3) (g/mole) (Mb) (km/sec)Atom
Pyrope 3.564
3.81Naturalpyrope
20.2
21.9
1.90
1.77
53.3
46.5
Naturalalmandine(Soga's)
Almandine
4.16 23.8 1.73 41.6
4.312 1.68 39.024.9

Table IV.7
Elastic constants of synthetic garnets.
Garnet Magnetic? p
Elastic constants
K. Cs CL 11 C1 2 C44 Vp s Vp s Ref.
Sp-Alm No 4.25 24.9
YAG No 4.55 29.7
YIG Yes 5.17 36.9
YGaG No 5.79 40.4
EuIG Yes 6.28 46.4
GdGaG Yes 7.09 50.6
1.777
1.849
1.631
1.750
1.550
1.720
0.981
1.112
0.787
0.865
0.720
0.854
3.052
3.370
2.659
2.993
2.552
2.908
3.085
3.332
2.680
2.903
2.510
2.859
1.123
1.107
1.106
1.173
1.070
1.151
0.948
1.150
0.766
0.955
0.762
0.903
8.484
8.596
7.177
7.166
6.364
6.393
4.756
4.994
3.870
3.982
3.444
3.529
1.784
1.721
1.855
1.800
1.848
1.812
Elastic constant pressure derivatives (3/3P)
Sp-Alm No 4.25 24.9 4.95 1.65 6.80 7.15 3.85 1.30 7.14 2.22 ----- (1)
YIG Yes 5.17 36.9 4.60 1.20 6.42 6.21 3.80 1.41 6.39 2.11 (5)
Svmbol Unit Pressure derivative
1. Present study.
2. Spencer et al., 1963.
3. Bateman, 1966.
4. Graham & Chang, 1970.
5. Eastman, 1966
C ., elastic stiffnesses
K, bulk modulus
V , compressional velocity
Vs, shear velocity
p, density
R, mean atomic weight
Mb
Mb
km/sec
km/sec
g/cm3
g/mole/atom
(3/3P) unit
None
None
(km/sec)/Mb
(km/sec)/Mb
Not used
Not used I-1
(J
CS = 1/2 (C11 - C1 2) CL = 1/2 (C11 + C12 2C44 )
References

Table IV.8
Effective ionic radii of garnet sites and someestimated elastic properties of unmeasured garnets.
Garnet p M p/M A-site, B-site C-site 0 Vp VS
radius radius radius
(g/cm) g/mole mol) () () (km/sec)2 (km/sec) (km/sec)atom cm
24.9
22.4
20.2
21.9
0.171 0.89 0.53
0.161
0.176
0.174
1.12
0.89
0.87
4.16 23.8 0.175 0.87
24.9
29.7
36.9
40.4
46.4
7.09 50.6
0.173
0.153
0.140
0.143
0.136
0.85
1.015
1.015
1.015
1.07
0.53
0.53
0.53
0.53
0.53
0.53
0.55
0.62
0.55
0.26
0.26
0.26
0.26
0.26
0.26
0.39
0.49
0.47
0.49
41.8 8.48
41.8
53.3
46.5
42.5
39.0
40.6
31.2
30.2
24.7
0.140 1.06 0.62 0.47 24.3
8.72
(9.60)
(8.94)
8.53
(8.19)
8.60
7.17
7.17
6.36
4.76
5.07
(5.38)
(5.01)
4.76
(4.59)
4.99
3.89
3.98
3.44
Garnet- (3.52) 20.1 (0.175) 0.89 0.56 0.26 (53.0) (9.55) (5.35)MgSiO
3
Garnet- (3.67) 21.1 (0.174) 0.88 0.56 0.26 (50.5) (9.32) (5.22)Bronzite*
*Bronzite (84.5% enstatite) = (Mg8 4 .5Fe1 5.5 )SiO3
Parentheses around values in the table indicate estimated values.
4.25
3.60
3.56
3.81
Presentstudy
Grossularite
Pyrope
NaturalPyrope
NaturalAlmandine
Almandine
YAG
YIG
YGaG
EuIG
GdGaG
4.31
4.55
5.17
5.79
6.28
6.39 3.53

160
Garnet
Figure Captions
Fig. IV.l. Garnet structure showing the different coordina-
tion polyhedra [taken from Deer et al., 1962, Vol. 1, p. 79].
Fig. IV.2. Sketches of garnet sample before and after cutting.
Fig. IV.3. 0 versus l/M proportionality for natural and
synthetic garnets.
Fig. IV.4. Lattice parameter versus pressure for garnets
crystallized from MgSiO 3:10% Al203. Around 100 kb the
MgSiO 3 transforms into the garnet structure and forms a
solid solution with pyrope [after Ringwood, 1967].

161
0 Si4 +
Fe 2+or Mn2+
Fig. IV.1

(a) (b)
(loo)
10 mm
lomm
End view

163
60 r-
Pyrope
O Grossularite
40 -Almandine
30 -o Natural garnets
0 Synthetic garnets
23 4
100 ,mole/g11
Fig. IV.3

164
11.48 r-
11.47 I-
MgSiO3 . 10 percent A1203
I. I I I
100 150
Pressure, kilobars
11.46 1-
11.45200
Rg. IV.4

165
Summary
V. Summary.
The elasticity of high-pressure mantle phases may be
characterized by measurements on crystal chemically similar
compounds. Analogue compounds available as single crystals
yield the most reliable elastic constant data.
A. Spinel.
The Cs = 1/2 (C11 - C1 2) shear modulus pressure deriva-
tive of pleonaste is slightly negative. Though the pressure
derivative of C5 in MgO:2.6Al 203 is positive, it is small in
magnitude. Small shear moduli pressure derivatives are
characteristic of the spinel structure. The weak shear modes
'imply a low kinetic barrier to phase transformations and
diffusion. The decrease in C with iron substitution due to
Jahn-Teller relaxation indicates that for iron-rich spinels
an electronic instability is superposed on the structural
weakness.
Pleonaste and hercynite belong to the MgAl2O4 - FeAl 204
series. The series is a particularly good analogue to the
Mg2SiOg - Fe2 Si04 series in the spinel phase. The molar vol-
umes, densities, and mean atomic weights are exactly similar
for (Mg1 _Fe )Al204 and (Mg -zFe Z)2SiO4 when z = x/2. Lines
for compressional velocity Vp and shearvelocity Vs as a
function of mean atomic weight are determined by the new
pleonaste and hercynite elastic constant data. Application

166
Summary
of the data to the question of iron content change in the
transition zone leads to inconclusive results. An increase
in iron content is indicated by the Vp data while no increase
is indicated by the Vs data.
B. Rutile.
Germanium dioxide and germanates are good crystal chemi-
cal analogues to silica and silicates. The bulk modulus
pressure derivative aK/DP of rutile-structure GeO 2 is about
6.2, a value higher than most other oxides and silicates.
Since rutile-Tio2 has a value of 3K/3P equal to 6.8, it is
likely that K/aP for stishovite is between 6 and 7. Both
rutile-GeO2 and TiO 2 are elastically anisotropic and both
display a weak C5 -mode.
The seismic parameter 0 of stishovite is not well-deter-
mined at present. The use of 0(stishovite) in a molar
averaging scheme to deduce the FeO and SiO2 content of the
lower mantle contains inconsistencies. There is no strong
evidence for enrichment of either component in the lower
mantle.
C. Garnet.
Ultrasonic and static compression elastic constant data
exist for both natural garnets and synthetic garnets. Within
each group of garnets the unit cell volumes are nearly the

167
Summary
same and the ions occupying the different coordination sites
have similar sizes. Then within each group the seismic
parameter 0 is inversely proportional to the mean atomic
weight M.
The elastic velocities of garnet-transformed MgSiO3 may
be estimated from the inverse proportionality between 0 and M.
The velocity change over the pyroxene -+ garnet transformation
is estimated to be 20% for compressional velocity Vp and 10%
for shear velocity Vs'

168
Procedure
Appendix A: Experimental procedure.
In this appendix I describe my experimental procedure.
The documentation may be useful to someone in the future
making similar measurements or for any evaluation of my
results. At present some differences between ultrasonic
laboratories seem to exist on values for the pressure.-deri-
vatives of elastic constants. The values are sensitive to
experimental procedure. A section is devoted to discussing
ambiguities that occurred in the pulse-echo-overlap method
of measurement.
A. X-ray orientation and polishing.
The crystals were cut and oriented by a standard Laue
back-reflection X-ray method in the MIT Crystal Physics
Laboratory. A crystal was mounted on a goniometer aligned
with the X-ray beam. A~Polaroid camera (Type 57 film) was
between the sample and the beam. After exposure the angular
distances (both horizontal and vertical) between the center
of the beam and a point of symmetry on the film were deter-
mined by overlaying a Greninger chart on the film [see, for
example, Cullity, 1956]. The Greninger chart is a graphical
display of the coordinate transforrmation between the back-
scattered X-rays and the flat film plane. Fig. A.l is an
example of an oriented {l00}-face with the Greninger chart
shown for scale. The goniometer was adjusted over several

169
Procedure
exposures until the center of the beam and the desired sym-
metry axis nearly coincided. Since the Greninger chart
translated angles into distances on the film, the goniometer
could be adjusted until orientation within 1/2* was-assured.
The goniometer was then taken off the X-ray track and slid
into a track perpendicular to a diamond saw blade who'se
thickness was about 0.020" . Two parallel cuts were made
and the alignment of the blade was checked by placing the
crystal on the end of a machined rod with double-stick tape
and taking a final Laue picture.
Extremely small samples could be accurately oriented.
For example, I oriented and cut a pair of {l00}-faces and
a pair of {ll0}-faces on an FeAl 204 crystal 4 x 4 x 10 mm
(Fig. 11.2, Chapter II).
Accurate ultrasonic measurements required sample faces
to be optically polished flat and parallel to 10~4 in/in.
I could not do a good enough job with simple holding jigs
and hence had it commercially done by the A.D. Jones Optical
Works in Burlington, Mass. They charged $150 per pair of
faces.

170
Procedure
B. Transducers and bonding.
Coaxially plated one-quarter inch X-cut and AC-cut
quartz transducers generated compressional and shear waves,
respectively. They were purchased from the Valpey-Fisher
Corp., Holliston, Mass. with resonant frequencies of 10 or
20 MHz (±l%) and with third-overtone polish. The shear wave
polarization (±1*) was marked by a flat to which the par-
ticle motion was perpendicular.
A 50/50 mixture (by volume) of 4thalic anhydride and
glycerin was used as the bonding material for pressure runs
and an epoxy (Tra-bond 2101, Tra-Con, Inc., Medford, Mass.)
was used for shear wave temperature runs. Methylene chloride
was the epoxy stripping agent. A few small drops of the
pthalic anhydride and glycerin mixture were heated on the
sample under an infrared lamp until it flowed quite readily.
It was spread thinly and uniformly over the sample face with
copper wire before the transducer was "wrung" on with a Q-tip.
The pthalic anhydride and glycerin mixture was not dissolved
by the pressure fluid of petroleum ether so that both shear
and compressional waves could be transmitted. An epoxy
bond was cured for at least 2 hours at 80 *C and it remained
hard to 100 *C whereas a thermosetting bond became too soft
to maintain a good shear signal.

171
Procedure
The crystal sample with transducer was then placed in a
cylindrical holder with a spring-loaded pin making electrical
contact with the center spot of the coaxial transducer
(Fig. A.2). The entire assembly was grounded and placed
directly into either the pressure vessel or oven.

172
Procedure
C. Ultrasonic equipment.
The elastic constants were determined by measuring the
velocity of plane compressional or shear waves in specific
propagation directions. Since sample lengths were 5 to 10 mm
and velocities were 5 to 10 mm/ysec (1 mm/psec = 1 km/sec),
round trip travel times were 1 to 4 ysec. I measured these
travel times by the pulse-echo-overlap method developed by
Papadakis [1964, 1967]. The particular modification in our
laboratory enabled the simultaneous measurement of travel
time and attenuation [Chung et al., 1969], but attenuation
was not a part of my study.
I only briefly describe the principles of the technique
since it is covered in detail by Papdakis and Chung et al.
A block diagram of the equipment, as I used it, is shown in
Fig. A.3. An rf-pulse whose rf-frequency was tuned to the
resonance or overtone of the transducer was applied to the
transducer. The same transducer was used also for receiving
successive echoes which have travelled the length of the
specimen and back. A typical echo-train is shown in Fig. A.4a.
A rough idea of the travel time in the sample was obtained by
using the oscilloscope's calibrated time base and noting the
distance between successive echoes on the screen grid. The
actual measurement was made by intensifying any two echoes

173 £
Procedure
and sweeping the X-axis of the oscilloscope at just the re-
ciprocal of the travel time between the echoes. Only the-
intensified echoes were displayed on the oscilloscope face.
The X-axis sweep rate was controlled by a sinusoidal fre-
quency generator. Thus when the triggering frequency was the
reciprocal of the travel time, successive sweeps of the
electron beam presented a stable image of the two echoes
with their rf-cycles in synchronization (Fig. A.4b). The
frequency was read directly on a digital counter and was the
raw datum of the experiment.
All my measurements were made with f0 = l/T (where
T is the travel time) between 100 kHz and 1 MHz. Rf-pulses
from the Arenberg pulsed oscillator had a repetition rate
f /100 and were in synchronism with all the echoes. Using a
division factor of 100 in the single crystals kept only one
pulse train in the crystal at a time, i.e., all the echoes
from the input pulse died away before the next pulse occurred.
The synchronism between the main pulse and echoes was
necessary for a stable display of the individual echoes when
the oscilloscope was swept at the reciprocal of the travel
time.

174
Procedure
D. Ambiguities in the measurements.
While making my measurements, I found ambiguities which
could limit the accuracy of the frequency determination as a
function of pressure or temperature. These ambiguities were
especially significant for the short path length and high-
velocity crystals with which I worked. I discuss the- follow-
ing difficulties,- several of which are related: (1) Guided-
wave modes (2) Cyclic mismatches (3) Changes of transducer
resonance with pressure or temperature (4) Incomplete damping
of one echo before the next (5) Trigger delay between channels
in dual channel operation. (6) Shear wave polarization mis-
orientation.
1. Guided-wave modes.
In my samples one pair of parallel faces nearly always
had another pair perpendicular to them (see Figs. 11.1, 11.2,
111.3, and IV.2 for sample shapes). Thus, besides the re-
flection at the end of the wave path, there existed multiple
side-wall reflections. When the side-wall reflections were
in phase, a guided-wave mode resonance occurred. The reso-
nance appeared as a modulation on the envelope of the wave
train (Fig. A.5). Without the effect the echoes should have
decayed exponentially. The nodal miniia and build up again
in amplitude indicated that energy was being fed in by the

175
Procedure
"free oscillations" which were of longer period than the time
between successive echoes. Also side-wall reflections could
lead to spurious echoes in the oscilloscope display.
The guided-wave modes could affect measurements in two
ways if a pair of echoes near a node was chosen. First,
phasing effects near a node might alter the proper cyblic
match [Papadakis, 1969; also discussed in the next section
D.2]. Second, the strong phasing near a node was a function
of pressure and temperature and hence might lead to incorrect
coefficients for the elastic constants.
The solution of the problem was to stay away from nodal
points and to work preferably with the first and second or
second and third echoes. Another help was to use the slightly
higher frequency of 30 MHz rather than 20 MHz so that less
beam energy was diffracted to the parallel side-walls. A
careful study of the effects of phasing near nodal points on
the pressure and temperature derivatives of the elastic con-
stants would be useful.
2. Cyclic mismatch.
A big error (2 to 5%) in the travel time determination
occurs if the overlapping of two echoes is off by one or more
cycles. It is not reliable to merely match the "leading
edge" of the pulse nor to match peak half-cycle with peak
half-cycle. The maximum peaks of two adjacent echoes are

176
Procedure
often displaced one cycle apart because part of the energy of
each cycle of the first echo is delayed by the transducer
upon reflection at that interface, and makes its appearance
in a subsequent cycle of the second echo [Papadakis, 1969].
Papadakis [1967, 1969] described two methods of deter-
mining the proper cyclic matching in the pulse-echo-overlap
technique. The first method is based on the McSkimin cri-
terion and the second is based on a video-pulse-matching
method. These methods will be discussed in turn.
a. McSkimin criterion.
The basis of the McSkimin criterion or method [McSkimin,
1962] is to measure the travel time both at the resonant
frequency of the transducer and at a frequency 10% lower
for different cyclic matches. The travel time T is given by
T = p6 - 3 + n360 f f
where 6
p
Y
f
n
(Eqn. A.1)
= true round trip travel time
= number of round trips between echoes used
= phase angle upon reflection at the specimen-
transducer interface
= rf frequency
= number of cycles of mismatch.

177
Procedure
Then denote the measurements at resonance by the subscript R
and denote the measurements at 0.9 fR by the subscript L.
1 L l RAT = . (n- ) - f (n -3) (Eqn. A.2)
L R
where AT TL - TR
For a thin bond yR L [see calculations by McSkimin,
1961, Table I, p. 15]. Then
AT ~f(0.111 n 3 (Eqn. A.3)R
Eqn. A.3 is the basic equation to be interpreted for the con-
dition n = 0, i.e., no cyclic mismatch. Putting n = 0 in
Eqn. A.3 yields AT(n=O) < 0. So a necessary condition for
proper cyclic matching is that AT < 0. But note that for
any n < 0, AT < 0. Therefore, the condition AT < 0 is
not a sufficient condition for proper cyclic matching. Also
note from Eqn. A.3 that for some n > 1, AT will be greater
than zero. Then consider the following theorem.
For adjacent echoes in high density (p > 3 g/cm3 )
- high elasticity (Vp > 7 km/sec, Vs > 4 km/sec)
crystals, AT > 0 whenever n > 1. Thus the pro-
per cyclic match occurs at the las't negative AT
just before it turns positive, i.e., at the small-
est negative AT in magnitude.

178
Procedure
Call the result of the theorem the "crossover condition."
It is illustrated by an example for a shear mode in garnet
(Fig. A.6 and Table A.1).
The assumptions of adjacent echoes, high density, and
high elasticity are important. For example, the crossover
condition is not always true for fused quartz [Papadakis,
1967]. Also examination of Eqn. A.3 shows that for some
p > 1 (several round trips between echoes), AT < 0 for
n = 1.
The justification for the crossover condition is now
given. The assumption of a high density - high elasticity
crystal is immediately translated into a high value for the
acoustic impedance Z = pV where p is the density and V
is the compressional or shear velocity. The assumption
of adjacent echoes sets p = 1 in Eqn. A.3. Then in order for
AT to be greater than zero for n = 1, yL must be less than
360. To satisfy yL < 360 for X-cut quartz transducers, the
impedance Z should be greater than about 20 [McSkimin and
Andreatch, 1962, Fig. 11, p.614]. For Y-cut quartz transducers,
Z should be greater than about 10 [McSkimin and Andreatch,
1962, Fig. 13, p.614]. Then for high density (o > 3 g/cm 3) _
high elasticity (Vp > 7 km/sec, Vs > 4 km/sec) crystals,
the cyclic match.condition occurs at the last negative AT
before it turns positive.

179Procedure
b. Video-pulse-matching method.
Ambiguities still occurred, however, in determining the
sign of AT in the course of an actual experiment. Changing
the rf-frequency changed the pulse shape so the match at
0.9 fR became uncertain. Furthermore, guided-wave effects
could introduce spurious AT measurements. Proper cyclic
matching was then determined by Papadakis' [1969] video-
pulse-matching method. A video or square pulse rather than
an rf-pulse was used for the electrical input to the trans-
ducer. In terms of the block diagram (Fig. A.3) a Velonex
pulse generator was substituted for the Arenberg pulsed
oscillator. The pulse had an amplitude of about 200 V and
its width was 0.1 psec. Because of the finite bandwidth of
the transducer resonance, its spectrum was broad enough to
encompass both the sharp phase fluctuation near a node and
the large region of little fluctuation.
The first echo had the trident shape seen also in rock
velocity measurements in which a square pulse input is used.
The second echo had a portion of energy from each half cycle
shifted one cycle because of delay in the transducer. The
proper cyclic match was made as in Fig. A.7. The earlier of
the two large peaks in the second echo was aligned with the
maximum peak in the first echo. When the rf-pulse was sub-
stituted back for the square pulse, only a very minor adjust-
ment in the reciprocal travel-time frequency was necessary;

180
Procedure
the proper cyclic match had already been effected.
An experiment of possible interest would be to test the
effect of a one cycle mismatch on the measured pressure or
temperature coefficients. Would the effect be large or
small?
3. Changes of transducer resonance with pressure or tempera-
ture.
The transducer was bonded directly to the sample for
both the pressure and temperature runs. As a result the
transducer's resonant frequency will change slightly during
a run [less than 1% over either 5 kb or 100 *C, McSkimin and
Andreatch, 1962].
For the n = 0 condition and symbols as in Eqn. A.l,
T YO6 fi-+ 360 f
S600 (Eqn. A.4)
T +p 360 f
Variables with a subscript zero refer to values at room con-
ditions and unsubscripted variables refer to values at some
pressure or temperature. Since 3 f , Eqn. A.4360bf p
becomes

181
Procedure
Y6 0T 0 1+ pYO YO0 _ o+1+ 0 (1 - 0(Eqn. A.5)T 360 f T f T
0 o
What error results for not taking into account the change
in transducer resonance? That is, what is the magnitude of
0 ? For typical values (y = 10*, f = 20 MHz,360 f T 0 0
0 0
T = 1 ysec) , the error in travel time is about 0.5%.
Then the error in the pressure or temperature derivatives
of the elastic constants is about 1 to 2%.
r4. Incomplete damping of one echo before the next.
The incomplete damping of one echo before the next
arrived was quite a problem for a few compressional wave
modes (see Fig. A.8 for an example). The input rf-pulse had
a width of about 1/2 psec, but returned echoes had a width
of about 1 ysec. Because of the short path lengths in the
crystals, some travel times were 1.1 psec and caused the
blending of echoes. In addition side-wall reflections
could clutter returned echoes. The presence of a high noise
level resulted in phase shifts equivalent to an uncertainty
of 0.3% in the velocity. What was unknown was the relative
change in these phase shifts as a function of pressure or

182Procedure
temperature. The blending of echoes was probably the major
source of error and was a consequence of having small samples.
On the basis of cross checks from different modes, the
accuracy of pressure and temperature derivatives was about
5 and 10%, respectively.
5. Trigger delay between channels in dual channel operation.
Chung et al. [1969] mentioned a dual channel mode of
operation in which the oscilloscope sweep was on an alternate
mode. The amplitudes of the intensified echoes could then be
adjusted individually. I found that dual channel operation
could lead to a minor ambiguity. Because the triggering
levels of the two channels were not calibrated, a phase
lag or lead was introduced.
6. Shear wave polarization misorientation.
The shear wave polarization was aligned by eye to within
1 or 2*. A small misorientation meant that a minor amount
of energy would be propagated with the velocity of the shear
mode 90* to the one desired (assuming nondegenerate shear
modes). The second mode was never detected in the echo
train.

183
Procedure
7. Summary of ambiguities.
The main source of error was a high background noise
level due to insufficient echo damping. The existence of
side-wall reflections contributed to spurious noise. Guided-
wave modes caused no problem if echoes away from nodes were
chosen. Cyclic mismatches could be avoided either by an
analysis of the McSkimin criterion or by video-pulse-matching.
The change in transducer resonant frequency as a function of
pressure or temperature could be neglected. Single channel
operation was preferred. The accuracy of zero pressure,
room temperature elastic constants was 0.5%. Pressure and
temperature derivatives were 5 and 10%, respectively.

184
Procedure
E. Reduction of raw data.
1. Pressure data.
The reciprocal travel-time frequency f = l/T where
T is the travel time was linear with pressure P. The raw
data were represented by a least squares line
- 1 + b P (Eqn. A.6)f0
where b = least squares slope
and f0 = least squares zero pressure frequency.
.CNote that the symbol f no longer refers to the rf-frequency0
as in the previous section.)
The elastic constant C., is given by:13
C.. = p (2 R 1 f)2 (Eqn. A.7)13 m
where p = density
1 = sample path length
p = number of round trips between
echoes used
m = integer multiple of reciprocal
of travel time; m/f = travel time
between echoes used
= some multiple m of l/T

185
Procedure
Then
CX - 2 + 2bI C0cii (Eqn. A.8)
where
b
C?,1J
= volume compressibility, kb 1
= linear compressibility in propa-
gation direction, kb"1
= slope of f versus P line', kb 1f0
= elastic constant at zero pressure, kb
2. Temperature data.
For temperature runs the elastic constant C,. is given
by:
C CT1 = p0 (2 1 f(T))2 1 + (2a - a )AT] (Eqn. A.9)
where a = volume thermal expansion, *Cl
a = linear thermal expansion in propa-gation direction, OC~
A least squares fit for the coefficient 3C. ./3T was thenJJ
made on the C.. as a function of T.13
3C iac-I'

186
Procedure
F. Pressure system.
Pressure runs were made to 5 kb in a standard liquid-
medium (petroleum ether) pressure system (Fig. A.9). A cylin-
drical hydraulic ram pushed a piston of smaller area into the
vessel so that pressure behind the ram was intensified by the
ratio of the areas. The top seal was an 0-ring and the bottom
seal was an 0-ring and brass retaining ring assembly.
Pressures were read both on a calibrated Heise gauge and
on a digital voltmeter. The digital voltmeter recorded the
output of a linear bridge amplifier [Philbrick Researches,
Inc., 1966, section 111.80] in which the gain was linear with
the resistance change in a manganin coil (Fig. A.10). The
amplifier was calibrated so that 1 mV = 1 bar. The pressure
in the vessel could be held to ±2 bar for periods of thirty
minutes. Readings were taken at 500 bar intervals every
twenty minutes to allow the vessel to equilibrate to room
temperature (20 *C).

187
Procedure
G. Temperature system.
A non-inductively wound tubular oven was used to 100 *C
for temperature runs. The sample holder was directly inserted
into a brass tube in the oven. Mullite was plugged into the
ends as an insulator. Temperature could be maintained to
±0.2 *C simply by allowing the sample to equilibrate twenty
minutes for some fixed current value in the oven windings.
The temperature was read on a potentiometer with a copper-
constantan thermocouple in contact with the sample. The
thermocouple junction was shielded from direct radiation from
the windings. The temperature corresponding to a thermocouple
voltage was determined from a quadratic fit to standard
emf tables:
T = -0.2135 + 25.4442 E - 0.4918 E (Eqn. A.10)
where T = temperature in *C
E = copper-constantan thermocouple emf in mV
The formula fitted the tables to within 0.1 *C.
The most difficult problem in making temperature measure-
ments was in maintaining a good bond between the sample and
the transducer. Above 100 *C an epoxy bond was not very
satisfactory, so this was the upper temperature limit used.
The 20 to 100 *C temperature range provided just about the
same changes in elastic constants as did the 0 to 5 kb pressure
range.

188
Procedure
H. Density determination.
Since an elastic constant C.. is the product of a density1J
and a velocity squared, accurate density determinations were
necessary. Both hydrostatic weighing and X-ray densities
were measured. Agreement between the two was within 0.3 to 0.5%.
The hydrostatic weighings were made in the MIT Crystal Physics
Laboratory with ethylene bromide (C2H4Br2) as the immersion
fluid. The apparatus was described in Smakula and Sils [1955].

189Procedure
References
Chung, D.H., D.J. Silversmith, and B.B. Chick, A modified
ultrasonic pulse-echo-overlap method for determining sound
velocities and attenuation of solids, Rev. Sci. Inst., 40,
718-720, 1969.
Cullity, B.D., Elements of X-ray Diffraction, 514 pp.,
Addison-Wesley, Reading, Mass., 1956.
McSkimin, H.J., Pulse superposition method for measuring
ultrasonic wave velocities in solids, J. Acoust. Soc. Am.,
33, 12-16, 1961.
McSkimin, H.J., and P. Andreatch, Analysis of the pulse
superposition method for measuring ultrasonic wave velocities
as a function of temperature and pressure, J. Acoust. Soc.
Am., 34, 609-615, 1962.
Papadakis, E.P., Ultrasonic attenuation and velocity in
three transformation products in steel, J. Appl. Phys., 35,
1474-1482, 1964.
Papadakis, E.P., Ultrasonic phase velocity by the pulse-echo-
overlap method incorporating diffraction phase corrections,
J. Acoust. Soc. Am., 42, 1045-1051, 1967.
- Papadakis, E.P., Effect of multimode guided-wave propagation
on ultrasonic phase velocity measurements: problem and
remedy, J. Acoust. Soc. Am., 45, 1547-1555, 1969.

190
Procedure
Philbrick Researches, Inc., Applications Manual for Computing
Amplifiers for Modelling, Measuring, Manipulating and Much
Else, 115 pp., Nimrod Press, Boston, 1966.
Smakula, A., and V..Sils, Precision density determination of
large single crystals by hydrostatic weighing, Phys. Rev.,
99, 1744-1746, 1955.

Table A.1
Experimental test of cross-over condition for shear mode
S[1TO] in [110)-direction in garnet.
p=l p=2
n TL T AT n TL TRL RLR
-0.01204
-0.00897
-0.00549
-0.00163
+0.00208
+0.00492
+0.00875
-2
-1
0
+1
+2
+3
5.06660
5.11941
5.17239
5.22561
5.27880
5.33219
5.38561
5.07472
5.12474
5.17504
5.22529
5.27568
5.32629
5.37709
-0.00812
-0.00533
-0.00265
+0.00032
+0.00312
+0.00590
+0.00852
(continued)
-3-
-2
-l
0
+1
+2
+3
2.42547
2.47868
2.53216
2.58591
2.63967
2.69306
2.74679
2.43751
2.48765
2.53765
2.58754
2.63759
2.68814
2.73804

Table A.1 (continued)
Experimental test of cross-over condition for shear mode
S[110] in [110]-direction in garnet.
The subscript L refers to echo-overlap readings taken at a carrier frequency 10%
below resonance R.
T = travel time in sample, psec
AT = TL ~ R' psec
n = number of cycles of mismatch
The results are plotted in Fig. A.6.
p=l refers to one round trip in the sample and
p=2 refers to two round trips in the sample.

193
Procedure
Figure Captions
Fig. A.l. Laue back-reflection photograph showing four-fold
axis of symmetry in pleonaste. The center of the X-ray beam
is indicated by the intersection of the horizontal and ver-
tical line segments connecting the four black spots or fidu-
cial points. The center of symmetry is indicated by the in-
tersection of the line segments connecting Laue spots related
by inversion symmetry. When the two points of intersection
are one, orientation is perfect. The scale for misorienta-
tion is indicated by the Greninger chart.
Fig. A.2. Schematic of assembly for making electrical contact
with a coaxially-plated transducer.
Fig. A.3. Block diagram of ultrasonic equipment [after
Chung et al., 19691. .(1) Hewlett-Packard model 606B signal
generator (2) Hewlett-Packard model 524L electronic counter
(3) Airtech model DD-103 decade divider (4) General Radio
model 1217-C unit pulse generator (5) Arenberg model
PG-650C pulsed oscillator (6) Matec model 5-30 MHz broad
band receiver (7) Matec model 2470 attenuation recorder
with double delay strobe (8) Tek.tronix model 546 oscillo-
scope.

194
Procedure
Fig. A.4. (a) Typical pulse-echo train. The picture is for
a shear wave polarized in the [ll1-direction and propagating
in the [110)-direction in garnet. The time base is 10 ysec/
cm. (b) Overlap of two echoes.
Fig. A.5. Guided-wave mode effect appearing as modulation of
the echo train envelope. The picture is for a shear wave
polarized in the [1101-direction and propagating in the
[110)-direction in GeO 2. The time base 20 psec/cm.
Fig. A.6. Crossover condition for proper cyclic matching.
Plotted are the experimentally determined AT = TL - TR
versus the number of cycles of mismatch n for p = 1 and
p = 2. The AT values are for a shear wave polarized in the
[001)-direction and propagating in the [110)-direction in
garnet. Note that in accord with Eqn. A.3, AT is smaller
for p = 2 than for p = 1. If the cross plotted at n = 1
had been very slightly negative, application of the smallest-
negative-AT-in-magnitude criterion would have lead to a one
cycle mismatch. However, for p = 1 (adjacent echoes) in a
high acoustic impedance crystal, the distinction is quite
clear.
Fig. A.7. Proper cyclic-match overlap for video-pulse-
matching method- [after Papadakis, 1969, p. 1553).

195
Procedure
Fig. A.8. Incomplete damping of one echo before the next
arrived. The picture is for a compressional wave propagating
in the [100)-direction in pleonaste. The time base is
2 ysec/cm.
Fig. A.9. Schematic of pressure system.
Fig. A.10. Schematic of manganin pressure sensor.

00 =
~01 =
ooz =
oOz =9 001= = 9 00 = 9

Tensionspring -
I///////
3/4 in. --

Transducer

199
(a)
(b)
Fig. A.4

200
Fig. A.5

AT12
10
-4 -3 -2
(n sec)
P = 2
' 1 2 3 4-2
-4
-6
-8
-10
-12
Fig.
201
A. 6

202
First echo
#a
QV I
Second echo
I
Proper overlap
Fig. A.7

203
Fig. A.8

Fig. A.9
204
DUMPVALVE

Out

206
Pressure data
Appendix B: Least squares fits to pressure data.
For any pressure run the individual frequency readings
at different pressures were least squares fit to a straight
fline. The slope of the least squares line = 1+ bP0
is given in Tables B.1, B.2, and B.3 for the individual
pressure runs in pleonaste, GeO 2 , and spessartite-almandine,
respectively. The standard deviation of the slope is also
given.

Table B.1
Pleonaste least squares fits to raw pressure data. ff~
+ bP
Mode Direction Polarization Elastic Path Number b, a 3C. ./3Pconstant length of data Mb-~ Mb
points
L [110] CL 6.645 19 0.760 0.008 6.08
L [110] C 6.645 9 0.728 0.025 5.86
T [110] [110] C 6.645 20 -0.084 0.002 0.00
T [110] [110] C 6.645 19 -0.167 0.013 -0.09
T [110] [001] C4 4 6.645 9 0.153 0.002 0.69
T [110] [001] C44 6.645 10 0.194 0.003 0.80
T [100] Any C44 4.933 14 0.179 0.012 0.76
L [100] --- C1 1 4.933 17 0.808 0.010 4.82
L [100] --- C1 1 4.933 21 0.783 0.008 4.69
= standard deviation of b, CL = 1/2 (C1 1 12 + 2C4 4 ) , , C = 1/2 (C 11
L = longitudinal
ab - C1 2)
T = transverse

Table B.2
GeO 2 least squares fits to raw pressure data. f
0
= 1 + bP
Mode Direc- Polari- Elastic Path Number b, b ac . /aPtion zation constant length of data _ b
points Mb Mb
C L
C
C s
C s
C4 4
C 4 4
C4 4
C4 4
C3 3
C3 3
C3 3
C3 3
5225
5225
5225
5225
5225
5225
5225
7686
8669
7686
7686
7686
24
23
23
11
15
21
23
22
12
23
19
15
1.
1.
-0.
-0.
-0.
0.
0.
0.
0.
0.
0.
0 .
[110]
[110]
[110]
[110]
[110]
[110]
[110]
[001]
[100]
[001]
[001]
[001]
[001]
084
085
508
543
442
514
529
399
537
380
435
468
006
006
004
006
008
004
004
004
004
003
008
018
11.
11.
-0.
-0.
-0.
1.
1.
1.
1.
6.
6.
7.
0.403 0.007
(continued)
6.48
[110]
[110 ]
[110 ]
[0 01]
[0 01]
Any
[001]
6. 7686

Table B.2 (continued)
Mode Direc- Polari- Elastic Path Number b ab 3C../3Ption zation constant length points 1)
L [001] --- C33 6.7686 13 0.391 0.007 6.33
L [100] --- C1 1 6.8669 13 0.857 0.011 5.97
L [100] --- C1 1 6.8669 11 0.991 0.013 6.90
L [100] --- C 6.8669 13 0.951 0.009 6.64
T [100] [010] C66 6.8669 16 0.762 0.006 4.10
T [100] [010] C66 6.8669 11 0.762 0.007 4.10
T [101] [101] C 4.9878 14 0.529 0.004 1.60
T [101] [101] CT2 4.9878 18 0.490 0.009 1.49
L [101] --- CL2 4.9878 15 0.628 0.041 7.16
ab = standard deviation of b, CLi = 1/2 (C11 +
= A + B, CT2 = A - B where A = 1/4 (C11 + C33 + 2C 4 4 )
and B = 1/4 [(C 1 1 - C 3 3 )2 + 4 Cl3 + C 4 4 )2]1/2
L = longitudinal
CL2
C1 2 + 2C66), CS = 1/2 (Ci - C 1 2 )
T = transverse

Table B.3
Garnet least squares fits to raw pressure data.ff
0
= 1 + bP
Mode Direc- Polari- Elastic Path Number b, abF a C./3Ption zation constant length of data _1 -1
points Mb Mb
L [110] C--L 6.217 16 0.984 0.008 6.59
L [110] --- CL 6.217 16 1.023 0.009 6.82
L [110] --- CL 6.217 16 1.048 0.017 6.95
T [110]. [110] C 6.217 15 0.759 0.004 1.68
T [110] [iO] C 6.217 17 0.741 0.003 1.64
T [110] [001] C44 6.217 14 0.585 0.004 1.29
T [110] [001] C44 6.217 16 0.584 0.002 1.28
= standard deviation of b, CL = 1/2 (C11 + C1 2 + .2C44 ), C = 1/2
L = longitudinal
a b - C12
T = transverse

211
Biographical Note
Birth date and place: 14 September 1946 in Shanghai, China.
Marital status: Married with one child.
Education:
Grade School
K-234-67-910-1213-1617-1819-21
Summer jobs:
Title
Physicist
Union HillLealWileyUniversity HighWisconsin HighU. WisconsinHarvard U.MIT
Description .
X-ray analyzedglass samples
Instructor Taught elemen-tary calculus
Location
Boulder, Colo.Urbana, Ill.Urbana, Ill.Urbana, Ill.Madison, Wisc.Madison, Wisc.Cambridge, Mass.Cambridge, Mass.
Institution
Corning GlassWorks
Corning Commu-nity College
Years
1951-19541954-19551955-19581958-19601960-19631963-19661966-t19681968-1971
Location
Corning,New York
Corning,New York
Teachingassistantships:
Fellowships:
Physics of the Earth (1970)Planetary Physics and Chemistry (1971)
NSF (1966-1968), NDEA (1968-1970)Chevron (1970-1971)
Honorary societies: Phi Beta Kappa (1966), Sigma Xi (1969)
Co-authored publications:
On the calculation of the seismic parameter $ at high pres-sure and high temperatures, J. Geophys. Res., 75, 5113-5120, 1970.
The elastic constants of an iron-bearing spinel--(Mg75Fe25)Al2O4 (abstract), Trans. Am. Geophys. Union,52, 358, 1971.
Single Crystal Elastic Constants and Calculated AggregateProperties: A Handbook, 2nd edition, 370 pp., MIT Press,Cambridge, 1971.
Elastic properties of Apollo 12 rocks, in Proceedings of theSecond Lunar Science Conference, Vol. 3, edited by A. A.Levinson, MIT Press, Cambridge, 1971, in press.
Degree
B.A.A.M.Ph.D.
Year
1966
1967