elections report - general elections 2010:layout 1 report - general... · elections, 28 of whom...
TRANSCRIPT

ELECTIONS REPORT
Thursday 6 May 2010
PREPARED BY CST
020 8457 9999
www.thecst.org.uk
Copyright © 2010 Community Security Trust
Registered charity number 1042391
Introduction
Thursday 6th May 2010 saw the biggest ever effort
by a far right party in a British general election,
with 338 candidates standing for the British National
Party (BNP) breaking the record set by the National
Front in 1979, when they stood 303 candidates.
The BNP hoped to make a serious challenge
for seats in East London and Stoke on Trent.
On the same day, elections were held for all 32
London boroughs (although not the London
Assembly), and 132 other metropolitan boroughs,
district councils and unitary authorities in England.
The BNP stood 739 candidates in these local
elections, 28 of whom were sitting BNP candidates
hoping for re-election.
Beyond the BNP, other fringe far right parties
stood in the general and local elections, of whom
the best known was the National Front, with
17 Parliamentary candidates and 18 local election
candidates.
The Respect Party, an amalgam of far left
and Islamist political activists, stood ten Parliamentary
candidates and 64 council candidates, and hoped
to win Parliamentary seats in Birmingham
and East London.
This report will analyse the performance of these
parties in the general and local elections and explain
some of the reasons for their successes or failures.
It will look at some examples of third-party
campaigning of interest to the Jewish community.
Lastly, it will speculate on the future paths of these
extremist trends in electoral politics.
Political Background
The general election took place against the backdrop
of a recent recession which had left a severe
budget deficit, and a lingering problem of trust
and credibility engendered by the expenses scandal
of 2009. Issues of specific interest to the Jewish
community, such as Israel, antisemitism or terrorism,
played little or no role in the election. The issue
of immigration did emerge during the campaign,
but it never reached a dominant position in the political
debate. The BNP sought to exploit all these issues
to present themselves as the only party that cared
about white working class voters.
The BNP entered 2010 with the momentum
of a series of electoral successes which had
brought them a seat on the London Assembly
in 2008, and two MEPs in 2009. They were already
the second-biggest party on Barking & Dagenham
council with 12 councillors, and had serious hopes
to become the biggest single party or even to take
outright control of the council.
CST Elections Report 2010
2
British National Party
General Election
The British National Party (BNP) went into this
general election with genuine hopes of breaking
the mould by making a serious challenge for
a seat in Parliament, and establishing the BNP
as Britain’s fourth political party. In fact, they suffered
a series of embarrassing defeats and an overall
decline in their average support.
The BNP stood 338 candidates in England,
Scotland and Wales, the highest number ever put
forward in a general election by any far right party.
This was a significant increase on the 119 BNP
candidates in the 2005 general election, or their 33
Parliamentary candidates in 2001. The BNP’s
hopes and efforts were mainly to be found
in the seats of Barking, East London, which was
contested by party leader Nick Griffin; the neighbouring
seat of Dagenham & Rainham, contested by Michael
Barnbrook; and Stoke on Trent Central in the West
Midlands, where the BNP candidate was their
Deputy Chairman Simon Darby.
Beyond these key seats, the geographical spread
of BNP candidates gives some indication of where
their organisational and numerical strength as a party
currently lies. They stood in all 29 Parliamentary
constituencies in the North East region; 48 out of 54
seats in Yorkshire & The Humber; 33 out of 46
seats in the East Midlands; and 41 out of 58
in the East of England. By contrast, they only
managed to stand in 19 out of 55 seats in the South
West; 26 out of 84 in the South East (excluding
London); 38 out of 75 in the North West; 13 out of 59
in Scotland; and 34 out of 73 in London.
The BNP’s best result came in Barking, where Griffin
came third with 6,620 votes, or 14.6% of the votes
cast. Their second best result came in Dagenham
& Rainham, where Barnbrook also came third, with
4,952 votes at 11.2%. These are both creditable
results: they were the only two third-place finishes
achieved by any BNP candidates, and Griffin polled
the highest number of votes ever cast for a far right
candidate in a British general election. In 2005,
Richard Barnbrook (no relation) had also come
third in Barking, with 4,916 votes at 16.9%. Still,
these results were disappointing for the BNP,
who had hoped to come (at least) second in Barking.
In the end, Griffin was a very distant third behind
Margaret Hodge, who held the seat for Labour with
an increased share of the vote. The reasons why
the BNP fell short of expectations will be discussed
in more detail in the ‘Analysis’ section of this report
(see page 4), but it is worth noting that voter turnout
rose from 50.5% in the 2005 general election to 61.4%
in 2010; however, this was still below the average
turnout in London (64.6%) and nationally (65%).
Overall, the BNP polled 563,743 votes nationally,
or 1.9% of the national vote. While this is an increase
from the 192,746 votes they polled in 2005, the higher
figure is to be expected given that they stood
in nearly three times as many seats. In fact,
the average BNP vote share in the 338 seats they
contested was 3.7%, down from the 4.2% they
achieved in 119 seats in 2005. Similarly,
71 of the 338 BNP candidates, or 21%, retained
their financial deposits by achieving 5% or more
of the vote in 2010; whereas in 2005, 34 of their
119 candidates, or 29%, retained their deposits.
In terms of both vote share and deposits lost,
therefore, the BNP’s decision to spread themselves
so thinly across the country may have come at the cost
of a decline in their average performance. This is not
just statistical: at £500 per deposit, the BNP’s 267
lost deposits will have cost the party £133,500.
Other notable results for the BNP include 10.4%
of the vote in Rotherham; 9.4% in Stoke on Trent
South; 9% in Burnley; 8.9% in Barnsley Central
and 8.6% in Barnsley East. In Stoke on Trent Central,
Simon Darby came fourth with 7.7% of the vote.
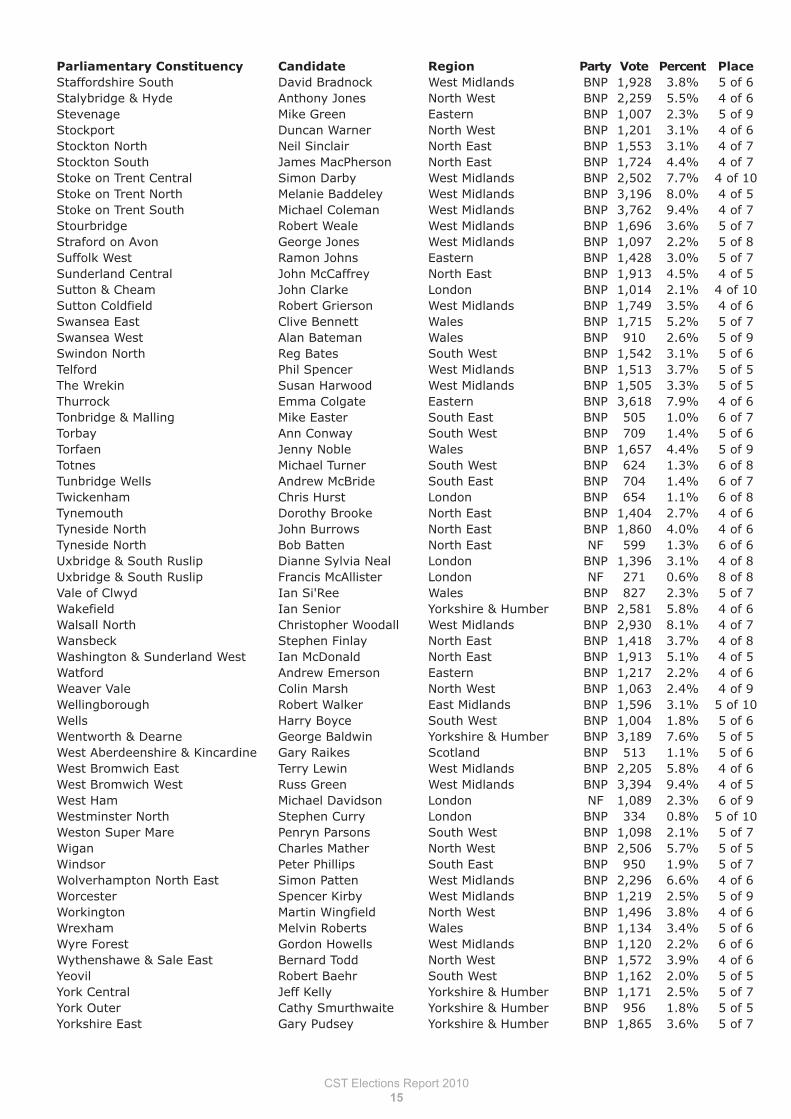
The BNP’s results across the country add further
weight to the idea that the party is in retreat across
the south of England, has patchy support in the
Midlands and the North West and is strongest
in Yorkshire and the North East. Of the BNP’s best
20 results in the general election, nine came
in the Yorkshire & The Humber region, five in the West
Midlands and three in the North West; none were
in the South East or South West and the only two
in London were in Barking and Dagenham & Rainham.
They retained 40% of their deposits in Yorkshire
& The Humber, 37% in the North West, 32%
in the West Midlands and 31% in the North East;
but only 15% of their deposits in London, just two
deposits in the East of England, one in Wales
and none in the South East, South West or Scotland.
18 of the BNP’s best 20 results came in seats won
by Labour and the other two were in seats
previously held by Labour but lost at this election.
Before the general election, Nick Griffin had promised
that it would confirm the BNP as the UK’s fourth
political party, a boast which the BNP has repeated
in the days following the election. In fact, as with
CST Elections Report 2010
3
much of the BNP’s public analysis of their performance,
this claim is not justified by the facts. Discounting
the Scottish National Party which polled more votes
than the BNP but only stood candidates in Scotland,
the BNP came fifth on the national share of the vote.
Although the BNP tended to beat candidates from
the United Kingdom Independence Party (UKIP)
when they contested the same seats, on a national
level they were easily out-performed by UKIP who
stood 572 candidates and polled 917,832 votes.
The only regions in which the BNP came fourth
were the North East and Yorkshire & The Humber.
Overall, 162 BNP candidates – just short of half -
came fourth in their respective seats.
Local Elections
The BNP stood 739 candidates in the local elections,
in 21 London boroughs and 79 other local authorities
(they also stood in the mayoral election in the London
borough of Lewisham, coming sixth with 2.7%
of the vote). If the BNP’s general election results
came as a disappointment to the far right party, their
performance in the local elections was little short
of catastrophic. Of the 28 BNP councillors across
England who were up for re-election, only two managed
to keep hold of their seat. No other BNP candidates
managed to win a seat anywhere. This was a brutal
cull that saw the BNP’s representation in local
government cut almost in half, from 54 councillors
to 28 (plus their single seat on the London Assembly).
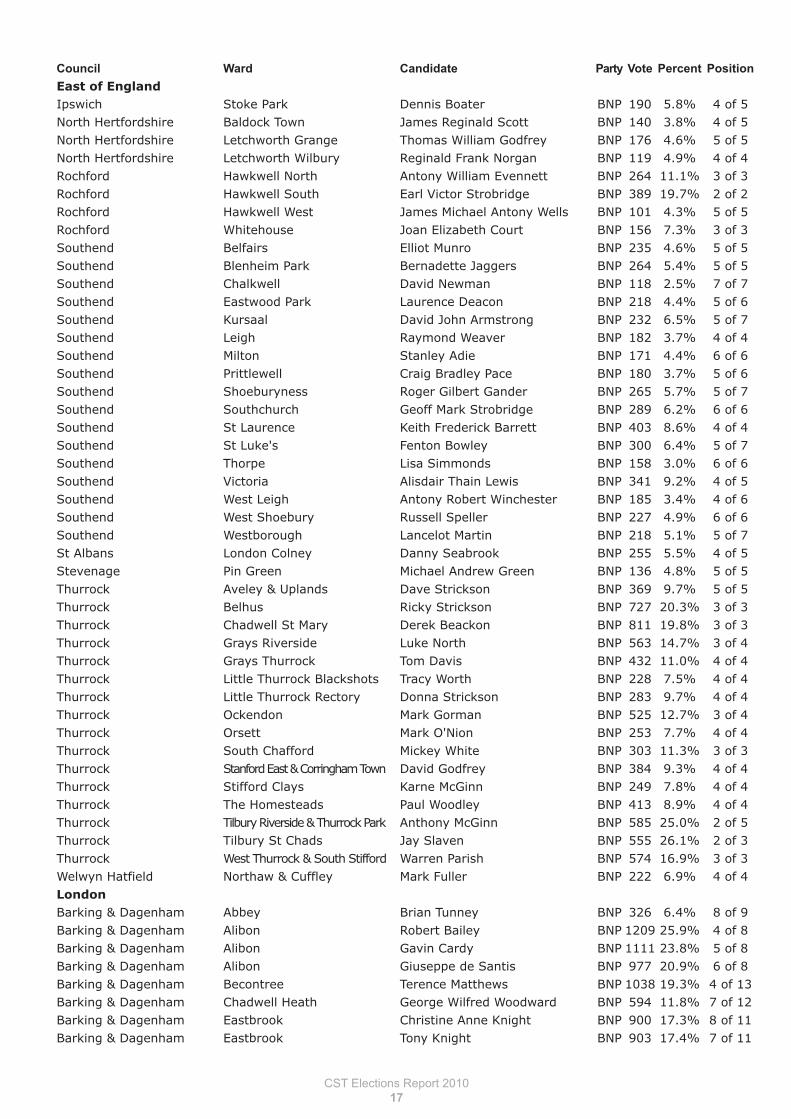
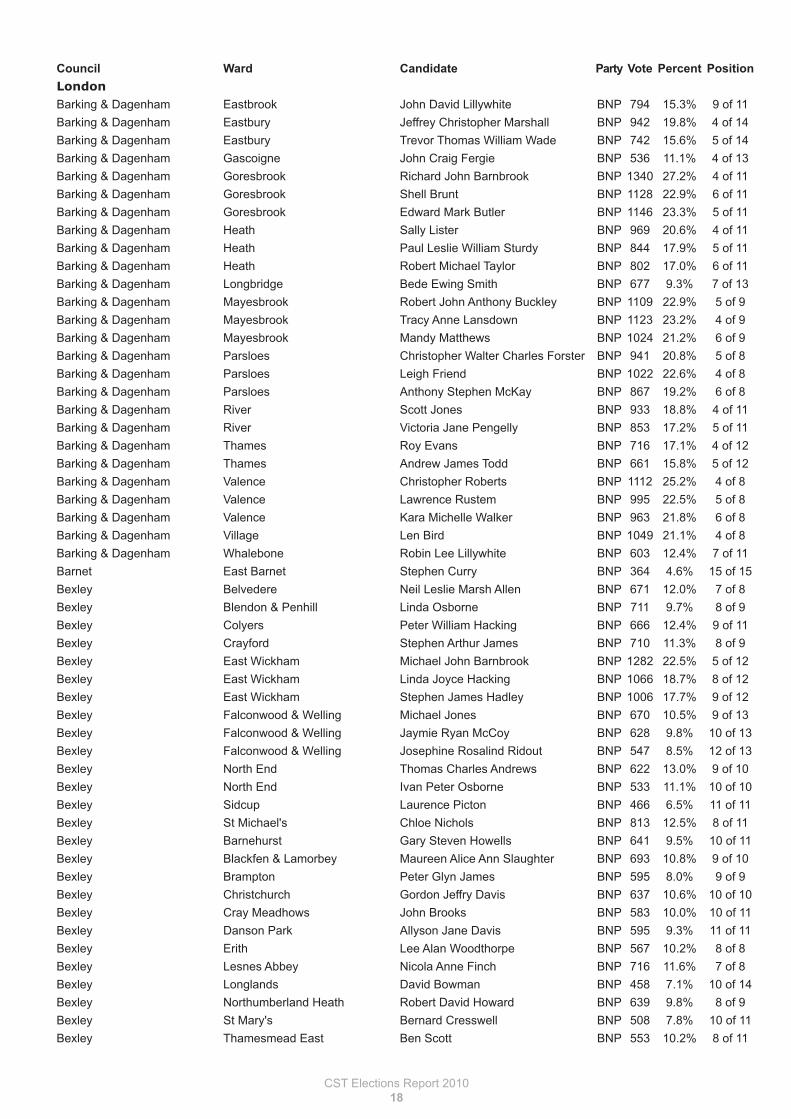
In Barking & Dagenham, where becoming the single
biggest party was the BNP’s main target in the entire
election, they lost every seat they held on the council.
They also lost their sole seats on Havering council
and Redbridge council, meaning that they no longer
have any councillors in London.
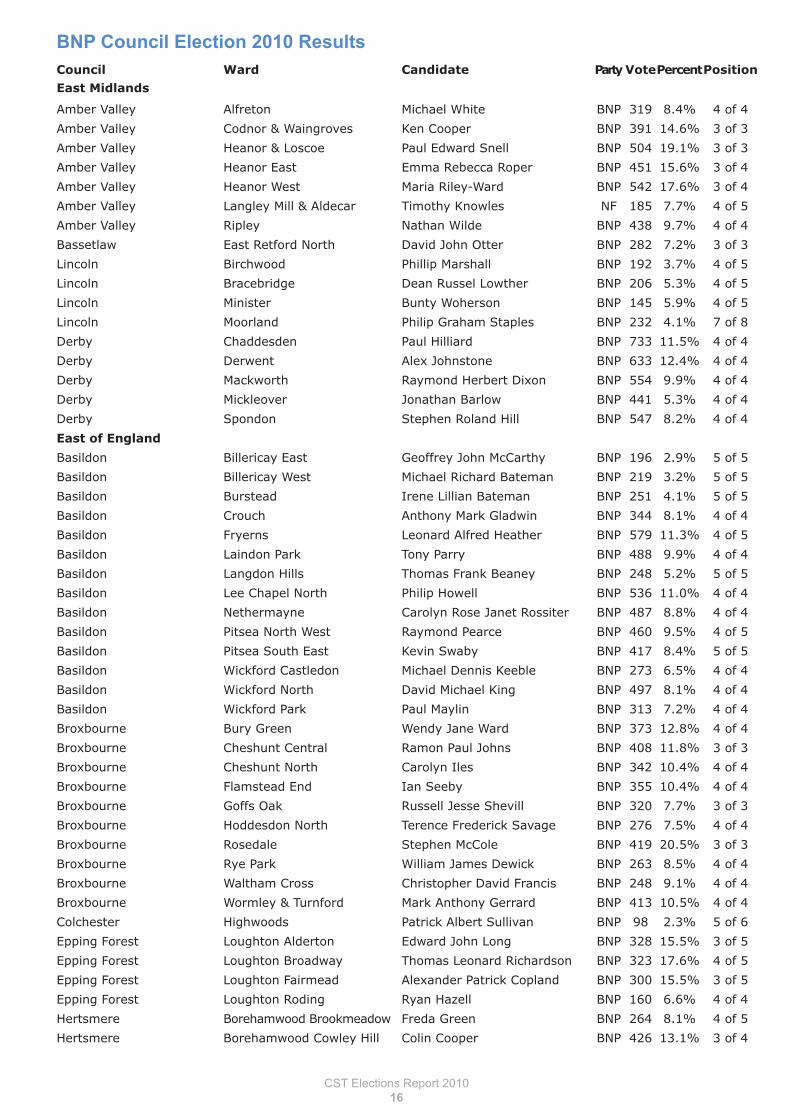
The BNP also lost three of their four seats in Epping
Forest, both their seats in Sandwell, two of their
seven seats in Stoke, two of their four in Burnley
and one each in Leeds, Redditch and Solihull.
Their single biggest council group is now in Stoke,
where they still have five councillors. The two council
seats that the BNP did win came for Brian Parker
in Marsden ward, Pendle, and for Paul Cromie
in Queensbury ward, Bradford. Both were already
BNP councillors, and the BNP still have two councillors
on each of those councils. Taken regionally, they
have seven local councillors in the West Midlands
(five of whom are in Stoke), seven in the East
Midlands, five in the North West, four in Yorkshire
& The Humber, four in the East of England and
one in the South East.
Elsewhere, there was little to cheer up the BNP.
In Barking & Dagenham they missed out on victory
by one place in 12 of the 17 wards they contested.
In Rotherham, BNP candidates came second
in four wards (Brinsworth & Catcliffe, Maltby,
Rotherham West and Valley), in addition to the 10.4%
they polled in the general election. Other second
places came in Primrose ward, South Tyneside; St.
Helen’s ward, Barnsley; Tilbury Riverside & Thurrock
Park ward and Tilbury St. Chads ward, both in Thurrock;
Bentilee & Townsend ward, Stoke-on-Trent;
Gawthorpe ward, Burnley; Kirkdale ward, Liverpool;
Charlestown ward, Manchester; and Douglas ward
and Ince ward, both in Wigan. But for the vast
majority of the 739 BNP candidates, this was a very
disappointing election.
The BNP stood full slates of candidates in South
Tyneside, Basildon, Thurrock and Sandwell.
They had 16 candidates out of 17 seats in Solihull,
17 out of 19 in Southend-on-Sea, 19 out of 21
in Wakefield, 21 out of 22 in Kirklees, 31 out of 34
in Leeds, 21 out of 23 in Barnsley, 24 out of 26
in Newcastle upon Tyne and 16 out of 22 in Gateshead.
However, the large total number of BNP candidates
masks some significant gaps in their presence
on ballot papers around the country. In Stoke-on-Trent,
the BNP’s main target area after Barking & Dagenham,
the party could only find candidates to stand in six
of the 20 seats on offer. In Oldham, where the BNP
first gave a hint of their electoral potential in the 2001
general election, the party only stood in one
of the 20 seats being fought. In Bradford, where
they did win a seat, they only stood in ten out of 30
seats; and in Pendle, the site of their other success,
they only stood in half the 18 seats available.
In Rotherham they only stood in 11 out of 21
seats. Even in Barking & Dagenham, the BNP’s
main target, they only managed to stand 34
candidates for the 51 seats on offer.
Analysis
The shock of the BNP’s defeat at this election cannot
be overstated. While they had only an outside
chance at best of taking a Parliamentary seat, they
were genuinely confident of becoming the biggest
single party on Barking & Dagenham council,
a fear shared by their opponents. That they not only
failed to do so, but in fact lost every seat they held
on the council, surprised everybody.
The BNP’s failure was largely down to two factors:
devastating internal divisions and anti-fascist
campaigning that was unprecedented in its scale
CST Elections Report 2010
4
and sophistication. The ongoing challenge to the BNP’s
legal status by the Equalities and Human Rights
Commission had disrupted the party’s pre-election
planning and taken up both their attention and financial
resources. In the weeks prior to the election campaign,
the BNP’s Director of Publicity, Mark Collett, was
expelled from the party after allegations that he had
made threats to kill Nick Griffin and James Dowson,
the BNP’s main fundraiser, for which he was
arrested by Humberside police. At the same time,
veteran BNP activist Eddy Butler was sacked
as the party’s National Organiser and, more
importantly, their Elections Organiser, and Emma
Colgate was removed from her position as staff
manager to the BNP’s two MEPs. The wider
allegation was that they were part of a clique that
was plotting to overthrow the party leadership.
In Stoke, the leader of their group on the council,
Alby Walker, left the BNP in January claiming that
“there is a vein of Holocaust denial running through
the BNP.” His wife, also a councillor, left the party
in April. The disruption this caused to the BNP
branch is the main reason why they only managed
to stand in six council seats in Stoke. Then just
a few days before polling day, Simon Bennett,
the BNP’s webmaster, fell out with Griffin and Dowson
to such an extent that he took down the BNP’s
website. This was not a party in a fit state
to challenge for power.
The other side of the coin of the BNP’s failure was
the anti-fascist campaigning that they faced, principally
from Searchlight magazine’s Hope Not Hate campaign.
The BNP’s successes in 2005 and 2006 were based
on a low turnout and a fall in Labour’s vote. While
Labour made a focused effort to reconnect with their
traditional supporters, Hope Not Hate concentrated
in getting out the anti-BNP vote. Approximately 1,000
people volunteered for Hope Note Hate in Barking
during the election campaign, and 200-300 in Stoke.
Hundreds of thousands of leaflets were targeted
at different types of voters, while email and websites
were also used in a campaign as sophisticated
as anything used by the mainstream political parties.
In both the local and general elections, it was
the return of the Labour vote that caused the most
damage to the BNP’s ambitions. Another new factor
in 2010 was the ‘Nothing British about the BNP’
campaign group, which aimed to encourage anti-BNP
activities from a centre-right perspective. This group
challenged the BNP’s use of traditional patriotic
messages, such as Winston Churchill and World
War Two imagery, and successfully mobilised public
opposition to the BNP from high-profile military
personalities. If anti-fascism in history has often
involved street violence and physical force, 2010
was the year when electoral anti-fascism really
came of age.
As was to be expected, the BNP leadership put
on a brave face after the election, but they could
not mask the depth of their failure and faced immediate
criticism from within the party. Griffin’s immediate
response to their collapse in Barking & Dagenham
was to declare London as “occupied territories”
in which the BNP could no longer hope to win
elections. Nationally, he has pinned his future hopes
on the possibility that electoral reform, promised
by the new Conservative/Liberal Democrat coalition
government, would open up a new route into
mainstream politics for smaller parties like the BNP.
This may be overly optimistic, but it is ironic that
a BNP that has suffered such a devastating electoral
blow is depending on the Liberal Democrats being
in government to revive it. Before this happens,
though, Griffin may have trouble simply holding his
party together, and retaining his grip on the leadership.
His subsequent announcement that he would stand
down in 2013 may not be enough to silence his
critics. Dissent quickly spread through online social
networks of BNP supporters, stirred up by Eddy
Butler and the other senior BNP activists who
Griffin had expelled before the campaign began.
In the European elections in 2009, the BNP polled
just short of 950,000 votes across the entire
United Kingdom. This year, despite the BNP’s
internal problems and their loss of council seats,
they still got over half a million votes across 338
Parliamentary constituencies (out of a possible
650 seats). This suggests that they now have a core
vote of around 900,000 voters across the UK.
It should also be remembered that Griffin
did manage to increase the BNP’s vote in Barking,
but this achievement was rendered irrelevant
by the significant increases in votes for both Labour
and the Conservatives. The experience in Barking
& Dagenham also shows that, while the BNP may
retain its core vote, there are large numbers
of people who are motivated enough to campaign
against them, and even more people who can
be persuaded to use their vote to keep them from
power. The BNP will not disappear from local
politics and campaigns like Hope Not Hate will
continue to be necessary in the future. Their work
will be made easier by the fact that the BNP has
not lost the far right’s tendency for self-destruction.
CST Elections Report 2010
5
OTHER FAR RIGHT PARTIES
None of the smaller far right parties that fought
the 2010 elections can be considered any sort
of significant political force. The National Front (NF)
stood 17 candidates in the general election,
all of whom lost their deposits. Their presence around
the UK is patchy in the extreme: they stood four
candidates in London, three in the South East, three
in Yorkshire & the Humber, one in the North East,
three in the West Midlands and two in the North
West. Their best result came in Rochdale, where
Chris Jackson, a veteran far right activist, polled
2,236 votes at 4.9%. In the local elections the NF
stood 18 candidates: three for Hillingdon council
in London; five in Birmingham, two in Dudley,
one in Newcastle, two in North Tyneside, two
in Kingston-Upon-Hull, one in Maidstone, one in Amber
Valley in the East Midlands and one in Rossendale
in the North West. Most of the NF candidates came
last in their ward. Their best results came in Rossendale,
where Kevin Bryan came third in Irwell ward with
11.6% of the vote; and in Sheldon ward, Birmingham,
where Paul Morris came fourth with 8.85% of the vote.
The Democratic Nationalists, a small far right
remnant of a previous BNP split, stood general
election candidates in Bradford South and Bradford
West, both of whom came bottom of the poll. Their
two candidates, James Lewthwaite and Neil Craig,
also stood in the local elections in Bradford, both
coming last in Royds ward and Wyke ward respectively.
The England First Party, led by former American
Friends of the BNP organiser Mark Cotterill,
is a small group of former BNP supporters and other
‘racial-nationalists’. They stood seven candidates
in the local elections: three in Stoke-on-Trent,
and one each in Oldham, Pendle, Preston and Wigan,
all in the North West region. Their best results
were in Longton North ward, Stoke-on-Trent, where
Mark Leat came fourth with 606 votes (10.3%);
Ribbleton ward, Preston, where Cotterill came fourth
out of four with 315 votes (12.5%); and in St. James
ward, Oldham, where Andrew Clayton came fourth
out of four with 425 votes (10.5%).
THE RESPECT PARTY
General Election
The Respect Party was created in 2004 out
of a combination of far left and Islamist political
activism, primarily to campaign on an anti-war ticket
in areas with relatively large Muslim populations.
Respect stood ten candidates in the general election,
of whom four were in London, four in the North
West, one in Birmingham and one in Bradford.
Of these, their best chances of success lay with
Salma Yaqoob, the party leader, who ran
in Birmingham Hall Green and was hoping
to become Britain’s first hijab-wearing MP; George
Galloway, who had left his Bethnal Green & Bow
seat to challenge in the neighbouring Poplar
& Limehouse constituency; and Abjol Miah in
Galloway’s old Bethnal Green & Bow seat.
Most of the media attention was focused, as ever,
on Galloway, who came a disappointing third place
with 8,532 votes or 16.8%. Miah also came third,
with 8,160 votes (17.5%). Galloway’s much-promised
unseating of Labour’s Jim Fitzpatrick MP, who
he had accused of “waging war on Muslims” during
the campaign, failed to materialise and Galloway
did not even attend the count to hear his defeat
formally announced. More humiliating for Galloway
was the fact that he was beaten into third place
by the Conservatives, for whom that part of East
London has traditionally been an impossible place
to win. In both East London seats, the turnout was
higher than in 2005, but lower than both the London
and national averages, suggesting that Respect, like
the BNP, had benefitted in 2005 from a low turnout, rather
than suffering from an unusually high turnout in 2010.
Respect came closest to winning a seat in Birmingham,
where Salma Yaqoob came second with 12,240
votes (25.1%) thanks to a significant swing from
Labour to Respect, but again failed to unseat
the Labour MP Roger Godsiff. None of Respect’s
other Parliamentary candidates managed to retain
their deposits, and only one, Arshad Ali in Bradford
West, managed to poll more than 1,000 votes.
Local Elections
Respect stood 85 candidates in the local elections
and here, too, they suffered significant setbacks, losing
seven of their eight sitting councillors on Tower Hamlets
council and their one councillor in neighbouring
Newham. Of their 50 candidates in Tower Hamlets
(where three councillors are elected in each ward),
CST Elections Report 2010
6
only one won a seat – Harun Miah in Shadwell
ward – and three others missed out by one place.
In Newham, two Respect candidates missed out
on a seat by one place. In Birmingham, where
a third of the council seats were up for election,
Salma Yaqoob retained her seat but the three
other Respect candidates were defeated.
Elsewhere, Respect candidates failed to make
any sort of impression. They stood candidates
in Redbridge, Bradford, Manchester, Salford,
Oldham and Rochdale, but none came close
to winning. Indeed, of the 19 Respect candidates
in these areas, 14 came bottom of the poll. The only
ward that showed some promise for the future was
Milkstone & Deeplish in Rochdale, where Javed
Iqbal came third with 21% of the vote. This leaves
Respect with a total of four local councillors: three
in Birmingham (all in the same Sparkbrook ward)
and one in Tower Hamlets.
Analysis
Respect always had limited appeal, both in terms
of its policies and the section of the electorate
at whom it directed its efforts. In 2005, with anger
over the Iraq war running high, this was enough
for Respect to win a Parliamentary seat in Bethnal
Green & Bow and perform well enough to promise
more success in the future. The following year,
Respect stood 163 candidates in the local elections,
winning sixteen council seats and establishing
themselves as a significant opposition on Tower
Hamlets council. However, small fringe parties need
favourable political conditions and internal harmony
to prosper, and Respect, just like the BNP, has not
been able to maintain its electoral momentum.
The most significant factor in Respect’s decline
was a split in the party in 2008. The ejection
of the Socialist Workers Party (SWP) left Respect
in the hands of Galloway, Yaqoob and their mainly
Muslim followers. This cost Respect an important
section of their political activists and organisational
structure, while hitching it even closer to Galloway’s
particular brand of celebrity politics. While some
leftists from the SWP and other groups did remain
with Respect, the fact that the party’s strength
is so localised reflects the fact that its voter appeal
is still community-based. However, this is far from
the whole story and it would be wrong to assume
that Respect is synonymous with Muslim electoral
ambitions. Yaqoob has experienced resistance
to her political ambitions from older, more
conservative Muslims who do not like the idea
of a young ‘hijabi’ being such a high-profile politician.
Galloway lost a lot of Muslim support when
he debased himself on the Big Brother reality TV
show. He was replaced in Bethnal Green & Bow
by the Labour candidate Rushnara Ali - a Bangladeshi
woman who has become the first Bangladeshi
to sit in Parliament, bringing much pride to her
community as a result. With British soldiers
no longer in Iraq and more pressing issues
of the economy, unemployment and housing
coming to the fore, Respect’s particular character
and image offer little to address the primary
concerns of voters, whether Muslim or not.
The question of ‘what happens next’ has always
hovered around Respect, and is more acute now
than ever. The fact that Respect only managed
to stand just over half the number of candidates
that they had in 2006 suggests that they
are a declining force, even before their 2010
losses are factored into the equation. Galloway
has promised to remain with the party and even
raised suggestions that he might stand for Mayor
of Tower Hamlets (which will be directly elected
in October 2010), but has also spoken of broadening
out his already diverse media activities. It would
not be a surprise if his future ambitions lie elsewhere.
Yaqoob remains eminently electable, but might
have to leave Respect to fulfil her ambitions;
she would definitely be an MP by now had she stood
for one of the three main parties. Respect has also
failed to establish a permanent and reliable
support base, even amongst the Bangladeshi
community in East London where it has found
most support. Respect councillors in Tower Hamlets
have defected to Labour, the Liberal Democrats
and the Conservatives in the past four years.
This process is likely to accelerate after their 2010
collapse; their Tower Hamlets Chairman, Azmal
Hussein, announced within days of the election
that he was leaving the party. While Respect
is likely to remain active in local politics in Birmingham
and East London, it would take a significant
victory, such as winning the mayoralty of Tower
Hamlets, to reverse the party’s general decline.
CST Elections Report 2010
7

COMMUNITY CAMPAIGNING
As with previous elections, there was some public
debate as to the existence and nature of a supposed
‘Muslim vote’ in the general election. Some
organisations, particularly those of an Islamist
or anti-Zionist orientation, tried to mobilise and direct
Muslim voters for or against particular candidates.
The Muslim Council of Britain (MCB) launched
‘Muslim Vote 2010’, to encourage British Muslims
to vote in the general election. The website followed
the MCB’s practice at previous elections of not
endorsing any particular candidates or parties,
but instead encouraging voters to ask candidates
for their views on specific issues. In 2010, these
were listed as anti-Muslim hatred and Islamophobia;
public services; democratic renewal; foreign
affairs; security and counter-terrorism; education;
and employment. This wide range of concerns
reflected the MCB’s opinion that it would be wrong
to assume there is such a thing as a Muslim bloc
vote: “the Muslim voter, like any other Briton,
may well make discerning choices of which their
‘Muslim identity’, if ever there was one, is only
a part of a menu of considerations.” This campaign
was also partly a response to the view put forward
by some groups, that voting in the elections was
‘haram’, or not allowed according to Islamic law.
A similar venture, set up and run by activists from
the anti-Israel Friends of al-Aqsa pressure group,
was called ‘You Elect’. You Elect also set out
to encourage participation in the election, while not
endorsing any specific candidates or parties.
Their work included leaflets to encourage voter
participation – one of which was produced jointly
with the Islamic Forum of Europe – opinion polls
of Muslim voters and organising hustings for
candidates. As befits a campaign run by a single
issue pressure group, its list of questions for
candidates had a much narrower focus:
Islamophobia, freedom of dress, extremism,
climate change, foreign policy and aid.
The Palestine Solidarity Campaign issued a six-point
election pledge that it asked candidates to answer.
The points included calls for an arms embargo
on Israel and limited economic sanctions. The pledge
was signed by 30 Labour candidates; 28 Liberal
Democrat candidates; no Conservatives; 79 Greens;
and all ten Respect candidates. The PSC also
claimed to have received an official response from
the Liberal Democrats as a party, which included
endorsing an arms embargo and suspension of EU
trade agreements with Israel “until the blockade
of Gaza is lifted”. PSC also organised election
hustings around the country. However, the Israel-
Palestine conflict as an issue did not play any
significant role in the election campaign, and was
not even mentioned in the second televised
leaders’ debate, which focused on foreign affairs.
The British Muslim Initiative (BMI), which is closely
aligned with the Muslim Brotherhood, issued a list of
“recommended candidates” for Muslims. This is the
same approach as that taken by the BMI’s
predecessor organisation, the Muslim Association
of Britain, in 2005. Unlike the MCB, the BMI
did endorse the idea of a ‘Muslim vote’ that could
swing elections, arguing that: “The Muslim vote
does not only count. It can decide. Vote responsibly
and vote tactically.” The BMI’s list included 52
candidates: 26 Labour, 16 Liberal Democrats, five
Conservatives, three from Respect, one Green
and one Independent. However, the BMI’s lack
of a grassroots campaigning structure meant that
this list was not backed up by significant campaigning
support and no consistent pattern was discernable
in the fortunes of the BMI’s preferred candidates.
One organisation that did engage in on-the-ground
campaigning was the Muslim Public Affairs
Committee (MPAC), which has developed
a strategy over successive elections of targeting
individual MPs who it considers to be “Zionist”
or “pro-war”. In 2010 MPAC produced a list
of 32 MPs and four Prospective Parliamentary
Candidates (PPCs) which it titled, “Is your MP
a Zionist?” It then whittled this down to seven
constituencies where it actively campaigned
against the sitting MP: Claire Ward in Watford;
Denis MacShane in Rotherham; Andrew Dismore
in Hendon; Terry Rooney in Bradford East; Phil
Woolas in Oldham East & Saddleworth; Khalid
Mahmood in Birmingham Perry Barr; and Mike
Gapes in Ilford South. Some of these have been
long-running campaigns: Gapes, for example,
complained in the House of Commons about
the activities of MPAC after the 2001 general
election. MPAC calls its campaign a “Jihad”
and its material is often extremely abusive about
its targets, describing them as “Zio-Nazis” amongst
other insults. This kind of scare-mongering can
have an impact on voters, and those candidates
who are targeted by MPAC often feel the need
to respond by pointing out their good relations with
mosques and Muslim groups in their constituency.
Of the seven MPs targeted by MPAC, three lost
CST Elections Report 2010
8
their seats, for which MPAC claimed the credit.
However, this does not tell the whole story. One
of the unseated MPs, Andrew Dismore in Hendon,
suffered a smaller swing against him than
in neighbouring seats and has been replaced
by Matthew Offord, a Conservative who has a long
pro-Israel record. Another, Claire Ward in Watford,
has been replaced by Richard Harrington, formerly
the Chairman of Conservative Friends of Israel.
These examples point to the immaturity of MPAC’s
approach, and the ultimate futility of their narrow
agenda. This was summed up by their campaign
to unseat Terry Rooney, who has never engaged
in pro-Israel campaigning and signed the PSC election
pledge, on the grounds that he is a “pro-war Zionist”.
MPAC’s style also introduces a poisonous tone into
local campaigning: Lee Scott, a Jewish MP in the
neighbouring Ilford North constituency to Mike Gapes,
suffered antisemitic death threats that he believed
were indirectly attributable to the atmosphere
generated by MPAC. While MPAC is capable
of generating a short-term, local effect, its tactics
have not shown evidence of a sustainable, long-
term impact: Mike Gapes, who has suffered its
particular brand of campaigning more than any other
MP, actually increased his share of the vote
in 2010, and polled more votes than in any general
election since before MPAC began its campaigns
against him.
CST Elections Report 2010
9
CST Elections Report 2010
10
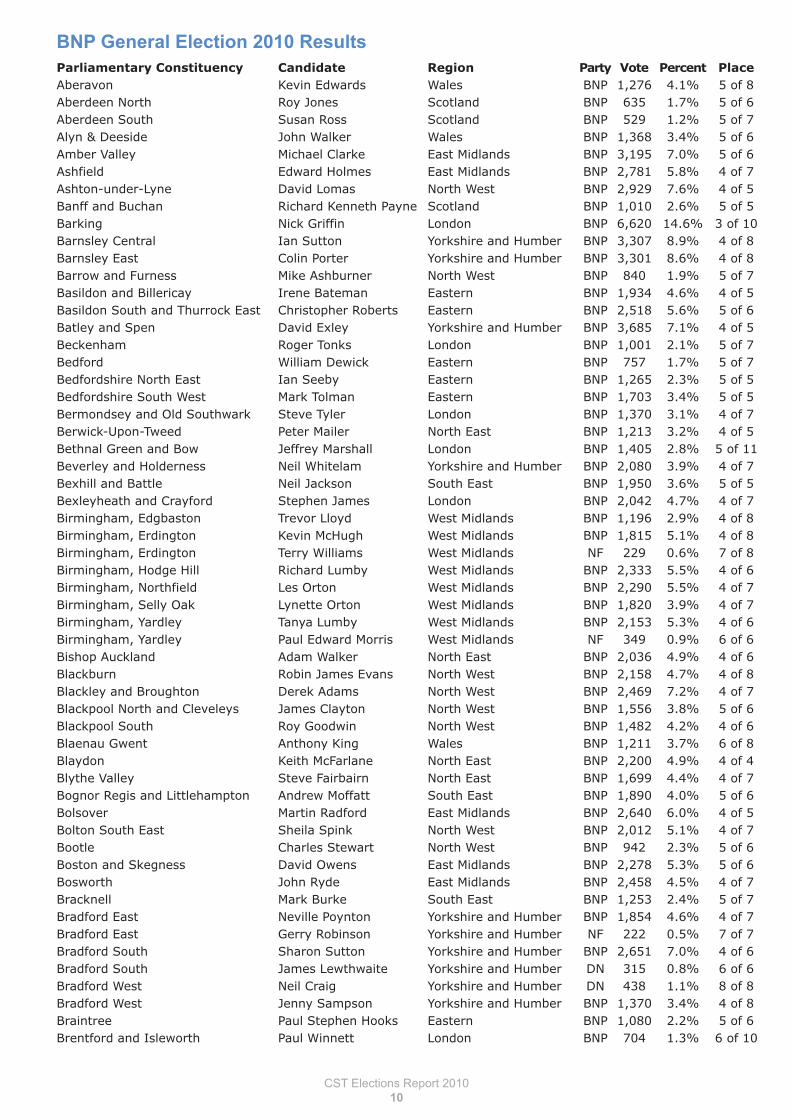
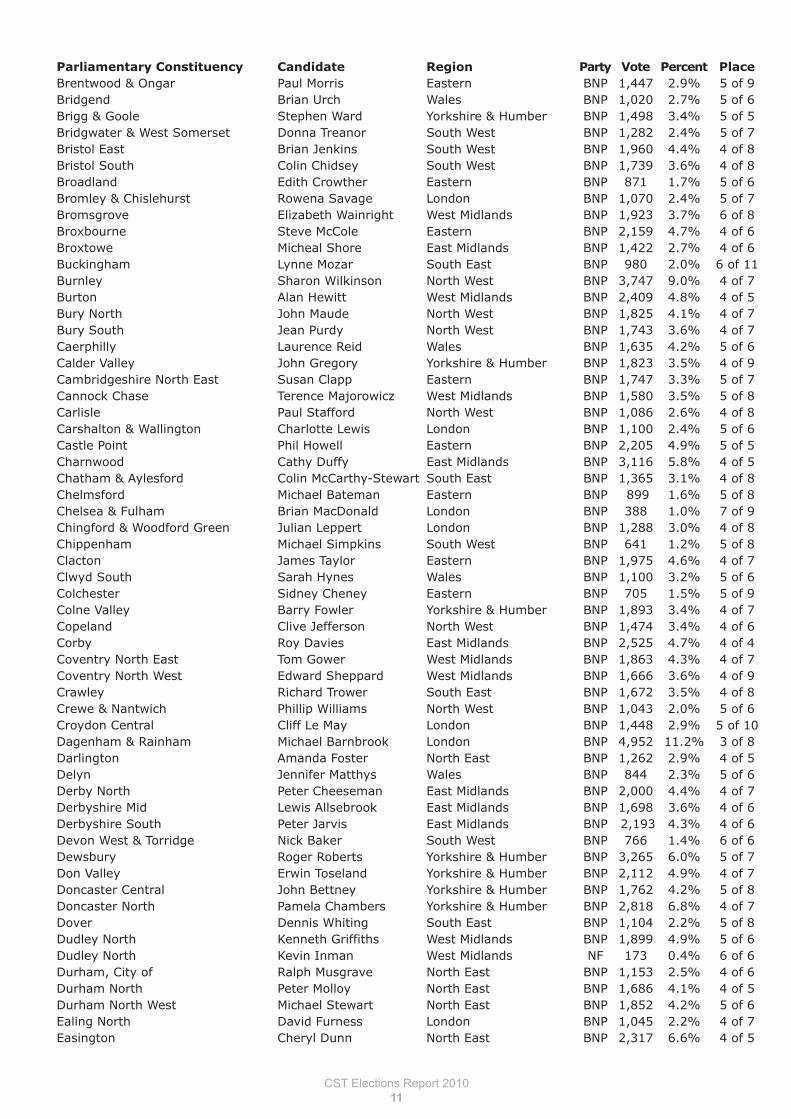
Parliamentary Constituency Candidate Region Party Vote Percent Place Aberavon Kevin Edwards Wales BNP 1,276 4.1% 5 of 8Aberdeen North Roy Jones Scotland BNP 635 1.7% 5 of 6Aberdeen South Susan Ross Scotland BNP 529 1.2% 5 of 7Alyn & Deeside John Walker Wales BNP 1,368 3.4% 5 of 6Amber Valley Michael Clarke East Midlands BNP 3,195 7.0% 5 of 6Ashfield Edward Holmes East Midlands BNP 2,781 5.8% 4 of 7Ashton-under-Lyne David Lomas North West BNP 2,929 7.6% 4 of 5Banff and Buchan Richard Kenneth Payne Scotland BNP 1,010 2.6% 5 of 5Barking Nick Griffin London BNP 6,620 14.6% 3 of 10 Barnsley Central Ian Sutton Yorkshire and Humber BNP 3,307 8.9% 4 of 8Barnsley East Colin Porter Yorkshire and Humber BNP 3,301 8.6% 4 of 8Barrow and Furness Mike Ashburner North West BNP 840 1.9% 5 of 7Basildon and Billericay Irene Bateman Eastern BNP 1,934 4.6% 4 of 5Basildon South and Thurrock East Christopher Roberts Eastern BNP 2,518 5.6% 5 of 6Batley and Spen David Exley Yorkshire and Humber BNP 3,685 7.1% 4 of 5Beckenham Roger Tonks London BNP 1,001 2.1% 5 of 7Bedford William Dewick Eastern BNP 757 1.7% 5 of 7Bedfordshire North East Ian Seeby Eastern BNP 1,265 2.3% 5 of 5Bedfordshire South West Mark Tolman Eastern BNP 1,703 3.4% 5 of 5Bermondsey and Old Southwark Steve Tyler London BNP 1,370 3.1% 4 of 7Berwick-Upon-Tweed Peter Mailer North East BNP 1,213 3.2% 4 of 5Bethnal Green and Bow Jeffrey Marshall London BNP 1,405 2.8% 5 of 11Beverley and Holderness Neil Whitelam Yorkshire and Humber BNP 2,080 3.9% 4 of 7Bexhill and Battle Neil Jackson South East BNP 1,950 3.6% 5 of 5Bexleyheath and Crayford Stephen James London BNP 2,042 4.7% 4 of 7Birmingham, Edgbaston Trevor Lloyd West Midlands BNP 1,196 2.9% 4 of 8Birmingham, Erdington Kevin McHugh West Midlands BNP 1,815 5.1% 4 of 8Birmingham, Erdington Terry Williams West Midlands NF 229 0.6% 7 of 8Birmingham, Hodge Hill Richard Lumby West Midlands BNP 2,333 5.5% 4 of 6Birmingham, Northfield Les Orton West Midlands BNP 2,290 5.5% 4 of 7Birmingham, Selly Oak Lynette Orton West Midlands BNP 1,820 3.9% 4 of 7Birmingham, Yardley Tanya Lumby West Midlands BNP 2,153 5.3% 4 of 6Birmingham, Yardley Paul Edward Morris West Midlands NF 349 0.9% 6 of 6Bishop Auckland Adam Walker North East BNP 2,036 4.9% 4 of 6Blackburn Robin James Evans North West BNP 2,158 4.7% 4 of 8Blackley and Broughton Derek Adams North West BNP 2,469 7.2% 4 of 7Blackpool North and Cleveleys James Clayton North West BNP 1,556 3.8% 5 of 6Blackpool South Roy Goodwin North West BNP 1,482 4.2% 4 of 6Blaenau Gwent Anthony King Wales BNP 1,211 3.7% 6 of 8Blaydon Keith McFarlane North East BNP 2,200 4.9% 4 of 4Blythe Valley Steve Fairbairn North East BNP 1,699 4.4% 4 of 7Bognor Regis and Littlehampton Andrew Moffatt South East BNP 1,890 4.0% 5 of 6Bolsover Martin Radford East Midlands BNP 2,640 6.0% 4 of 5Bolton South East Sheila Spink North West BNP 2,012 5.1% 4 of 7Bootle Charles Stewart North West BNP 942 2.3% 5 of 6Boston and Skegness David Owens East Midlands BNP 2,278 5.3% 5 of 6Bosworth John Ryde East Midlands BNP 2,458 4.5% 4 of 7Bracknell Mark Burke South East BNP 1,253 2.4% 5 of 7Bradford East Neville Poynton Yorkshire and Humber BNP 1,854 4.6% 4 of 7Bradford East Gerry Robinson Yorkshire and Humber NF 222 0.5% 7 of 7Bradford South Sharon Sutton Yorkshire and Humber BNP 2,651 7.0% 4 of 6Bradford South James Lewthwaite Yorkshire and Humber DN 315 0.8% 6 of 6Bradford West Neil Craig Yorkshire and Humber DN 438 1.1% 8 of 8Bradford West Jenny Sampson Yorkshire and Humber BNP 1,370 3.4% 4 of 8Braintree Paul Stephen Hooks Eastern BNP 1,080 2.2% 5 of 6Brentford and Isleworth Paul Winnett London BNP 704 1.3% 6 of 10
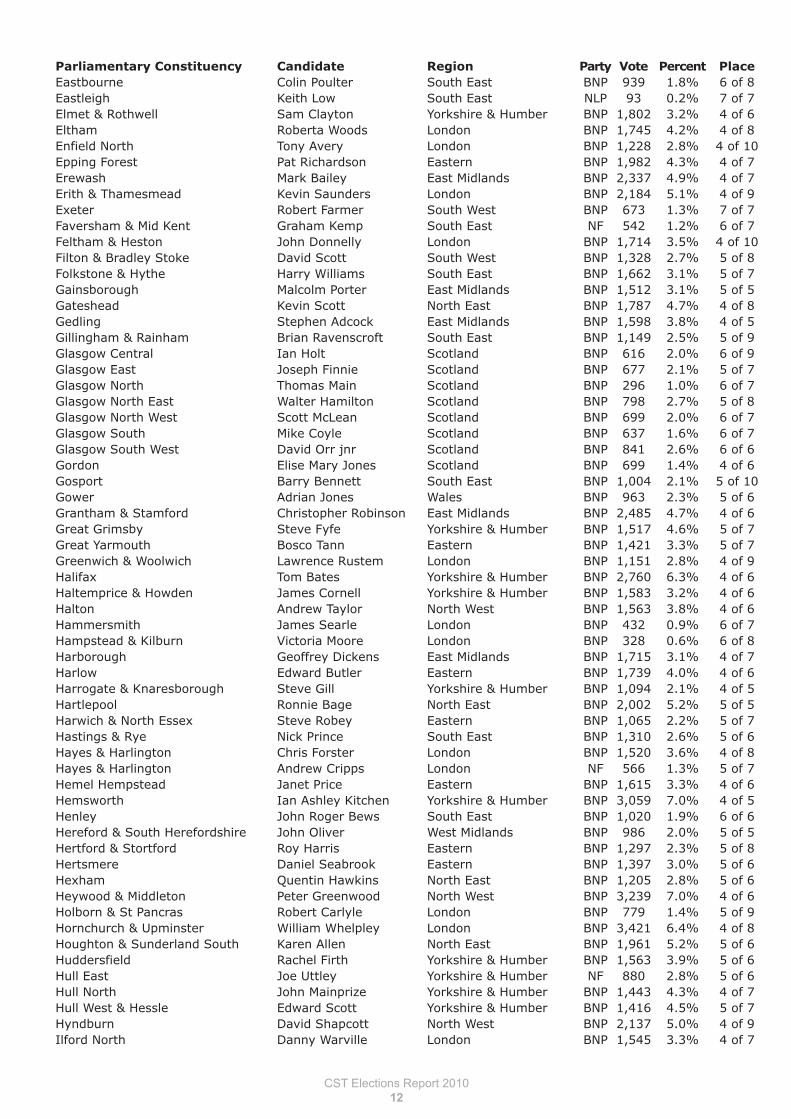
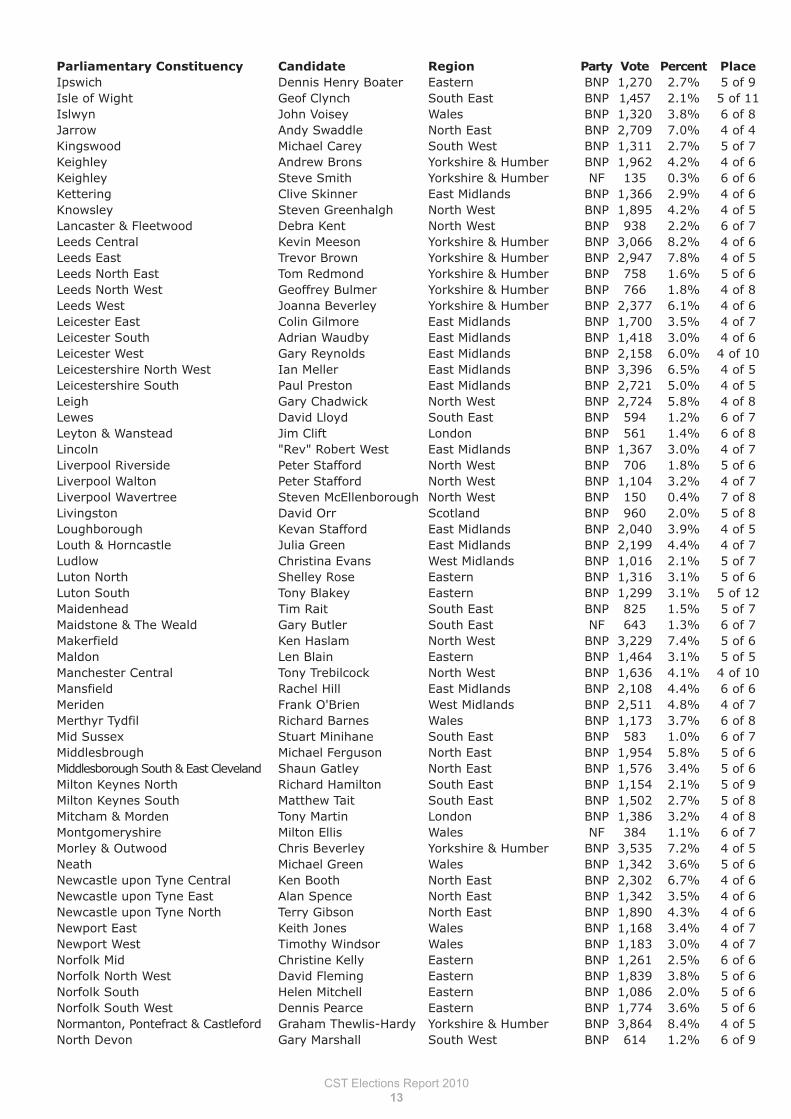
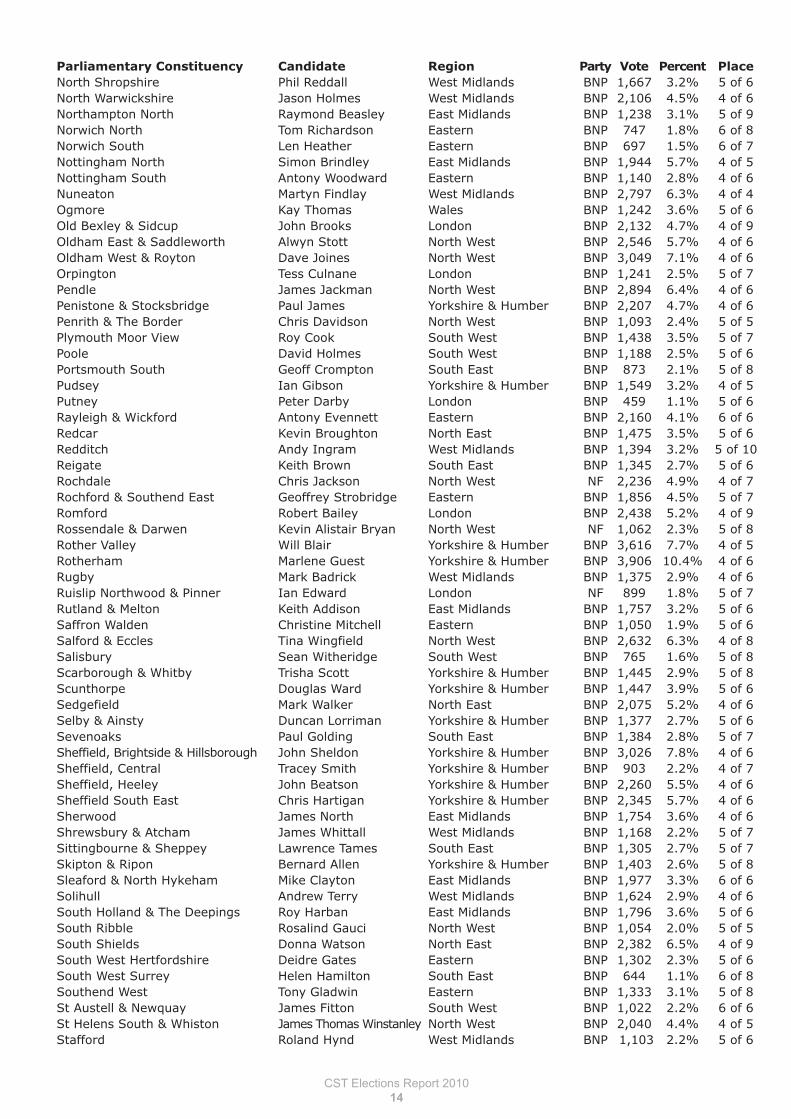
BNP General Election 2010 Results
CST Elections Report 2010
11
Parliamentary Constituency Candidate Region Party Vote Percent Place Brentwood & Ongar Paul Morris Eastern BNP 1,447 2.9% 5 of 9Bridgend Brian Urch Wales BNP 1,020 2.7% 5 of 6Brigg & Goole Stephen Ward Yorkshire & Humber BNP 1,498 3.4% 5 of 5Bridgwater & West Somerset Donna Treanor South West BNP 1,282 2.4% 5 of 7Bristol East Brian Jenkins South West BNP 1,960 4.4% 4 of 8Bristol South Colin Chidsey South West BNP 1,739 3.6% 4 of 8Broadland Edith Crowther Eastern BNP 871 1.7% 5 of 6Bromley & Chislehurst Rowena Savage London BNP 1,070 2.4% 5 of 7Bromsgrove Elizabeth Wainright West Midlands BNP 1,923 3.7% 6 of 8Broxbourne Steve McCole Eastern BNP 2,159 4.7% 4 of 6Broxtowe Micheal Shore East Midlands BNP 1,422 2.7% 4 of 6Buckingham Lynne Mozar South East BNP 980 2.0% 6 of 11Burnley Sharon Wilkinson North West BNP 3,747 9.0% 4 of 7Burton Alan Hewitt West Midlands BNP 2,409 4.8% 4 of 5Bury North John Maude North West BNP 1,825 4.1% 4 of 7Bury South Jean Purdy North West BNP 1,743 3.6% 4 of 7Caerphilly Laurence Reid Wales BNP 1,635 4.2% 5 of 6Calder Valley John Gregory Yorkshire & Humber BNP 1,823 3.5% 4 of 9Cambridgeshire North East Susan Clapp Eastern BNP 1,747 3.3% 5 of 7Cannock Chase Terence Majorowicz West Midlands BNP 1,580 3.5% 5 of 8Carlisle Paul Stafford North West BNP 1,086 2.6% 4 of 8Carshalton & Wallington Charlotte Lewis London BNP 1,100 2.4% 5 of 6Castle Point Phil Howell Eastern BNP 2,205 4.9% 5 of 5Charnwood Cathy Duffy East Midlands BNP 3,116 5.8% 4 of 5Chatham & Aylesford Colin McCarthy-Stewart South East BNP 1,365 3.1% 4 of 8Chelmsford Michael Bateman Eastern BNP 899 1.6% 5 of 8Chelsea & Fulham Brian MacDonald London BNP 388 1.0% 7 of 9Chingford & Woodford Green Julian Leppert London BNP 1,288 3.0% 4 of 8Chippenham Michael Simpkins South West BNP 641 1.2% 5 of 8Clacton James Taylor Eastern BNP 1,975 4.6% 4 of 7Clwyd South Sarah Hynes Wales BNP 1,100 3.2% 5 of 6Colchester Sidney Cheney Eastern BNP 705 1.5% 5 of 9Colne Valley Barry Fowler Yorkshire & Humber BNP 1,893 3.4% 4 of 7Copeland Clive Jefferson North West BNP 1,474 3.4% 4 of 6Corby Roy Davies East Midlands BNP 2,525 4.7% 4 of 4Coventry North East Tom Gower West Midlands BNP 1,863 4.3% 4 of 7Coventry North West Edward Sheppard West Midlands BNP 1,666 3.6% 4 of 9Crawley Richard Trower South East BNP 1,672 3.5% 4 of 8Crewe & Nantwich Phillip Williams North West BNP 1,043 2.0% 5 of 6Croydon Central Cliff Le May London BNP 1,448 2.9% 5 of 10Dagenham & Rainham Michael Barnbrook London BNP 4,952 11.2% 3 of 8Darlington Amanda Foster North East BNP 1,262 2.9% 4 of 5Delyn Jennifer Matthys Wales BNP 844 2.3% 5 of 6Derby North Peter Cheeseman East Midlands BNP 2,000 4.4% 4 of 7Derbyshire Mid Lewis Allsebrook East Midlands BNP 1,698 3.6% 4 of 6Derbyshire South Peter Jarvis East Midlands BNP 2,193 4.3% 4 of 6Devon West & Torridge Nick Baker South West BNP 766 1.4% 6 of 6Dewsbury Roger Roberts Yorkshire & Humber BNP 3,265 6.0% 5 of 7Don Valley Erwin Toseland Yorkshire & Humber BNP 2,112 4.9% 4 of 7Doncaster Central John Bettney Yorkshire & Humber BNP 1,762 4.2% 5 of 8Doncaster North Pamela Chambers Yorkshire & Humber BNP 2,818 6.8% 4 of 7Dover Dennis Whiting South East BNP 1,104 2.2% 5 of 8Dudley North Kenneth Griffiths West Midlands BNP 1,899 4.9% 5 of 6Dudley North Kevin Inman West Midlands NF 173 0.4% 6 of 6Durham, City of Ralph Musgrave North East BNP 1,153 2.5% 4 of 6Durham North Peter Molloy North East BNP 1,686 4.1% 4 of 5Durham North West Michael Stewart North East BNP 1,852 4.2% 5 of 6Ealing North David Furness London BNP 1,045 2.2% 4 of 7Easington Cheryl Dunn North East BNP 2,317 6.6% 4 of 5
CST Elections Report 2010
12
Parliamentary Constituency Candidate Region Party Vote Percent Place Eastbourne Colin Poulter South East BNP 939 1.8% 6 of 8Eastleigh Keith Low South East NLP 93 0.2% 7 of 7Elmet & Rothwell Sam Clayton Yorkshire & Humber BNP 1,802 3.2% 4 of 6Eltham Roberta Woods London BNP 1,745 4.2% 4 of 8Enfield North Tony Avery London BNP 1,228 2.8% 4 of 10Epping Forest Pat Richardson Eastern BNP 1,982 4.3% 4 of 7Erewash Mark Bailey East Midlands BNP 2,337 4.9% 4 of 7Erith & Thamesmead Kevin Saunders London BNP 2,184 5.1% 4 of 9Exeter Robert Farmer South West BNP 673 1.3% 7 of 7Faversham & Mid Kent Graham Kemp South East NF 542 1.2% 6 of 7Feltham & Heston John Donnelly London BNP 1,714 3.5% 4 of 10Filton & Bradley Stoke David Scott South West BNP 1,328 2.7% 5 of 8Folkstone & Hythe Harry Williams South East BNP 1,662 3.1% 5 of 7Gainsborough Malcolm Porter East Midlands BNP 1,512 3.1% 5 of 5Gateshead Kevin Scott North East BNP 1,787 4.7% 4 of 8Gedling Stephen Adcock East Midlands BNP 1,598 3.8% 4 of 5Gillingham & Rainham Brian Ravenscroft South East BNP 1,149 2.5% 5 of 9Glasgow Central Ian Holt Scotland BNP 616 2.0% 6 of 9Glasgow East Joseph Finnie Scotland BNP 677 2.1% 5 of 7Glasgow North Thomas Main Scotland BNP 296 1.0% 6 of 7Glasgow North East Walter Hamilton Scotland BNP 798 2.7% 5 of 8Glasgow North West Scott McLean Scotland BNP 699 2.0% 6 of 7Glasgow South Mike Coyle Scotland BNP 637 1.6% 6 of 7Glasgow South West David Orr jnr Scotland BNP 841 2.6% 6 of 6Gordon Elise Mary Jones Scotland BNP 699 1.4% 4 of 6Gosport Barry Bennett South East BNP 1,004 2.1% 5 of 10Gower Adrian Jones Wales BNP 963 2.3% 5 of 6Grantham & Stamford Christopher Robinson East Midlands BNP 2,485 4.7% 4 of 6Great Grimsby Steve Fyfe Yorkshire & Humber BNP 1,517 4.6% 5 of 7Great Yarmouth Bosco Tann Eastern BNP 1,421 3.3% 5 of 7Greenwich & Woolwich Lawrence Rustem London BNP 1,151 2.8% 4 of 9Halifax Tom Bates Yorkshire & Humber BNP 2,760 6.3% 4 of 6Haltemprice & Howden James Cornell Yorkshire & Humber BNP 1,583 3.2% 4 of 6Halton Andrew Taylor North West BNP 1,563 3.8% 4 of 6Hammersmith James Searle London BNP 432 0.9% 6 of 7Hampstead & Kilburn Victoria Moore London BNP 328 0.6% 6 of 8Harborough Geoffrey Dickens East Midlands BNP 1,715 3.1% 4 of 7Harlow Edward Butler Eastern BNP 1,739 4.0% 4 of 6Harrogate & Knaresborough Steve Gill Yorkshire & Humber BNP 1,094 2.1% 4 of 5Hartlepool Ronnie Bage North East BNP 2,002 5.2% 5 of 5Harwich & North Essex Steve Robey Eastern BNP 1,065 2.2% 5 of 7Hastings & Rye Nick Prince South East BNP 1,310 2.6% 5 of 6Hayes & Harlington Chris Forster London BNP 1,520 3.6% 4 of 8Hayes & Harlington Andrew Cripps London NF 566 1.3% 5 of 7Hemel Hempstead Janet Price Eastern BNP 1,615 3.3% 4 of 6Hemsworth Ian Ashley Kitchen Yorkshire & Humber BNP 3,059 7.0% 4 of 5Henley John Roger Bews South East BNP 1,020 1.9% 6 of 6Hereford & South Herefordshire John Oliver West Midlands BNP 986 2.0% 5 of 5Hertford & Stortford Roy Harris Eastern BNP 1,297 2.3% 5 of 8Hertsmere Daniel Seabrook Eastern BNP 1,397 3.0% 5 of 6Hexham Quentin Hawkins North East BNP 1,205 2.8% 5 of 6Heywood & Middleton Peter Greenwood North West BNP 3,239 7.0% 4 of 6Holborn & St Pancras Robert Carlyle London BNP 779 1.4% 5 of 9Hornchurch & Upminster William Whelpley London BNP 3,421 6.4% 4 of 8Houghton & Sunderland South Karen Allen North East BNP 1,961 5.2% 5 of 6Huddersfield Rachel Firth Yorkshire & Humber BNP 1,563 3.9% 5 of 6Hull East Joe Uttley Yorkshire & Humber NF 880 2.8% 5 of 6Hull North John Mainprize Yorkshire & Humber BNP 1,443 4.3% 4 of 7Hull West & Hessle Edward Scott Yorkshire & Humber BNP 1,416 4.5% 5 of 7Hyndburn David Shapcott North West BNP 2,137 5.0% 4 of 9Ilford North Danny Warville London BNP 1,545 3.3% 4 of 7
CST Elections Report 2010
13
Parliamentary Constituency Candidate Region Party Vote Percent Place Ipswich Dennis Henry Boater Eastern BNP 1,270 2.7% 5 of 9Isle of Wight Geof Clynch South East BNP 1,457 2.1% 5 of 11Islwyn John Voisey Wales BNP 1,320 3.8% 6 of 8Jarrow Andy Swaddle North East BNP 2,709 7.0% 4 of 4Kingswood Michael Carey South West BNP 1,311 2.7% 5 of 7Keighley Andrew Brons Yorkshire & Humber BNP 1,962 4.2% 4 of 6Keighley Steve Smith Yorkshire & Humber NF 135 0.3% 6 of 6Kettering Clive Skinner East Midlands BNP 1,366 2.9% 4 of 6Knowsley Steven Greenhalgh North West BNP 1,895 4.2% 4 of 5Lancaster & Fleetwood Debra Kent North West BNP 938 2.2% 6 of 7Leeds Central Kevin Meeson Yorkshire & Humber BNP 3,066 8.2% 4 of 6Leeds East Trevor Brown Yorkshire & Humber BNP 2,947 7.8% 4 of 5Leeds North East Tom Redmond Yorkshire & Humber BNP 758 1.6% 5 of 6Leeds North West Geoffrey Bulmer Yorkshire & Humber BNP 766 1.8% 4 of 8Leeds West Joanna Beverley Yorkshire & Humber BNP 2,377 6.1% 4 of 6Leicester East Colin Gilmore East Midlands BNP 1,700 3.5% 4 of 7Leicester South Adrian Waudby East Midlands BNP 1,418 3.0% 4 of 6Leicester West Gary Reynolds East Midlands BNP 2,158 6.0% 4 of 10Leicestershire North West Ian Meller East Midlands BNP 3,396 6.5% 4 of 5Leicestershire South Paul Preston East Midlands BNP 2,721 5.0% 4 of 5Leigh Gary Chadwick North West BNP 2,724 5.8% 4 of 8Lewes David Lloyd South East BNP 594 1.2% 6 of 7Leyton & Wanstead Jim Clift London BNP 561 1.4% 6 of 8Lincoln "Rev" Robert West East Midlands BNP 1,367 3.0% 4 of 7Liverpool Riverside Peter Stafford North West BNP 706 1.8% 5 of 6Liverpool Walton Peter Stafford North West BNP 1,104 3.2% 4 of 7Liverpool Wavertree Steven McEllenborough North West BNP 150 0.4% 7 of 8Livingston David Orr Scotland BNP 960 2.0% 5 of 8Loughborough Kevan Stafford East Midlands BNP 2,040 3.9% 4 of 5Louth & Horncastle Julia Green East Midlands BNP 2,199 4.4% 4 of 7Ludlow Christina Evans West Midlands BNP 1,016 2.1% 5 of 7Luton North Shelley Rose Eastern BNP 1,316 3.1% 5 of 6Luton South Tony Blakey Eastern BNP 1,299 3.1% 5 of 12Maidenhead Tim Rait South East BNP 825 1.5% 5 of 7Maidstone & The Weald Gary Butler South East NF 643 1.3% 6 of 7Makerfield Ken Haslam North West BNP 3,229 7.4% 5 of 6Maldon Len Blain Eastern BNP 1,464 3.1% 5 of 5Manchester Central Tony Trebilcock North West BNP 1,636 4.1% 4 of 10Mansfield Rachel Hill East Midlands BNP 2,108 4.4% 6 of 6Meriden Frank O'Brien West Midlands BNP 2,511 4.8% 4 of 7Merthyr Tydfil Richard Barnes Wales BNP 1,173 3.7% 6 of 8Mid Sussex Stuart Minihane South East BNP 583 1.0% 6 of 7Middlesbrough Michael Ferguson North East BNP 1,954 5.8% 5 of 6Middlesborough South & East Cleveland Shaun Gatley North East BNP 1,576 3.4% 5 of 6Milton Keynes North Richard Hamilton South East BNP 1,154 2.1% 5 of 9Milton Keynes South Matthew Tait South East BNP 1,502 2.7% 5 of 8Mitcham & Morden Tony Martin London BNP 1,386 3.2% 4 of 8Montgomeryshire Milton Ellis Wales NF 384 1.1% 6 of 7Morley & Outwood Chris Beverley Yorkshire & Humber BNP 3,535 7.2% 4 of 5Neath Michael Green Wales BNP 1,342 3.6% 5 of 6Newcastle upon Tyne Central Ken Booth North East BNP 2,302 6.7% 4 of 6Newcastle upon Tyne East Alan Spence North East BNP 1,342 3.5% 4 of 6Newcastle upon Tyne North Terry Gibson North East BNP 1,890 4.3% 4 of 6Newport East Keith Jones Wales BNP 1,168 3.4% 4 of 7Newport West Timothy Windsor Wales BNP 1,183 3.0% 4 of 7Norfolk Mid Christine Kelly Eastern BNP 1,261 2.5% 6 of 6Norfolk North West David Fleming Eastern BNP 1,839 3.8% 5 of 6Norfolk South Helen Mitchell Eastern BNP 1,086 2.0% 5 of 6Norfolk South West Dennis Pearce Eastern BNP 1,774 3.6% 5 of 6Normanton, Pontefract & Castleford Graham Thewlis-Hardy Yorkshire & Humber BNP 3,864 8.4% 4 of 5North Devon Gary Marshall South West BNP 614 1.2% 6 of 9
CST Elections Report 2010
14
Parliamentary Constituency Candidate Region Party Vote Percent Place North Shropshire Phil Reddall West Midlands BNP 1,667 3.2% 5 of 6North Warwickshire Jason Holmes West Midlands BNP 2,106 4.5% 4 of 6Northampton North Raymond Beasley East Midlands BNP 1,238 3.1% 5 of 9Norwich North Tom Richardson Eastern BNP 747 1.8% 6 of 8Norwich South Len Heather Eastern BNP 697 1.5% 6 of 7Nottingham North Simon Brindley East Midlands BNP 1,944 5.7% 4 of 5Nottingham South Antony Woodward Eastern BNP 1,140 2.8% 4 of 6Nuneaton Martyn Findlay West Midlands BNP 2,797 6.3% 4 of 4Ogmore Kay Thomas Wales BNP 1,242 3.6% 5 of 6Old Bexley & Sidcup John Brooks London BNP 2,132 4.7% 4 of 9Oldham East & Saddleworth Alwyn Stott North West BNP 2,546 5.7% 4 of 6Oldham West & Royton Dave Joines North West BNP 3,049 7.1% 4 of 6Orpington Tess Culnane London BNP 1,241 2.5% 5 of 7Pendle James Jackman North West BNP 2,894 6.4% 4 of 6Penistone & Stocksbridge Paul James Yorkshire & Humber BNP 2,207 4.7% 4 of 6Penrith & The Border Chris Davidson North West BNP 1,093 2.4% 5 of 5Plymouth Moor View Roy Cook South West BNP 1,438 3.5% 5 of 7Poole David Holmes South West BNP 1,188 2.5% 5 of 6Portsmouth South Geoff Crompton South East BNP 873 2.1% 5 of 8Pudsey Ian Gibson Yorkshire & Humber BNP 1,549 3.2% 4 of 5Putney Peter Darby London BNP 459 1.1% 5 of 6Rayleigh & Wickford Antony Evennett Eastern BNP 2,160 4.1% 6 of 6Redcar Kevin Broughton North East BNP 1,475 3.5% 5 of 6Redditch Andy Ingram West Midlands BNP 1,394 3.2% 5 of 10Reigate Keith Brown South East BNP 1,345 2.7% 5 of 6Rochdale Chris Jackson North West NF 2,236 4.9% 4 of 7Rochford & Southend East Geoffrey Strobridge Eastern BNP 1,856 4.5% 5 of 7Romford Robert Bailey London BNP 2,438 5.2% 4 of 9Rossendale & Darwen Kevin Alistair Bryan North West NF 1,062 2.3% 5 of 8Rother Valley Will Blair Yorkshire & Humber BNP 3,616 7.7% 4 of 5Rotherham Marlene Guest Yorkshire & Humber BNP 3,906 10.4% 4 of 6Rugby Mark Badrick West Midlands BNP 1,375 2.9% 4 of 6Ruislip Northwood & Pinner Ian Edward London NF 899 1.8% 5 of 7 Rutland & Melton Keith Addison East Midlands BNP 1,757 3.2% 5 of 6Saffron Walden Christine Mitchell Eastern BNP 1,050 1.9% 5 of 6Salford & Eccles Tina Wingfield North West BNP 2,632 6.3% 4 of 8Salisbury Sean Witheridge South West BNP 765 1.6% 5 of 8Scarborough & Whitby Trisha Scott Yorkshire & Humber BNP 1,445 2.9% 5 of 8Scunthorpe Douglas Ward Yorkshire & Humber BNP 1,447 3.9% 5 of 6Sedgefield Mark Walker North East BNP 2,075 5.2% 4 of 6Selby & Ainsty Duncan Lorriman Yorkshire & Humber BNP 1,377 2.7% 5 of 6Sevenoaks Paul Golding South East BNP 1,384 2.8% 5 of 7Sheffield, Brightside & Hillsborough John Sheldon Yorkshire & Humber BNP 3,026 7.8% 4 of 6Sheffield, Central Tracey Smith Yorkshire & Humber BNP 903 2.2% 4 of 7Sheffield, Heeley John Beatson Yorkshire & Humber BNP 2,260 5.5% 4 of 6Sheffield South East Chris Hartigan Yorkshire & Humber BNP 2,345 5.7% 4 of 6Sherwood James North East Midlands BNP 1,754 3.6% 4 of 6Shrewsbury & Atcham James Whittall West Midlands BNP 1,168 2.2% 5 of 7Sittingbourne & Sheppey Lawrence Tames South East BNP 1,305 2.7% 5 of 7Skipton & Ripon Bernard Allen Yorkshire & Humber BNP 1,403 2.6% 5 of 8Sleaford & North Hykeham Mike Clayton East Midlands BNP 1,977 3.3% 6 of 6Solihull Andrew Terry West Midlands BNP 1,624 2.9% 4 of 6South Holland & The Deepings Roy Harban East Midlands BNP 1,796 3.6% 5 of 6South Ribble Rosalind Gauci North West BNP 1,054 2.0% 5 of 5South Shields Donna Watson North East BNP 2,382 6.5% 4 of 9South West Hertfordshire Deidre Gates Eastern BNP 1,302 2.3% 5 of 6South West Surrey Helen Hamilton South East BNP 644 1.1% 6 of 8Southend West Tony Gladwin Eastern BNP 1,333 3.1% 5 of 8St Austell & Newquay James Fitton South West BNP 1,022 2.2% 6 of 6St Helens South & Whiston James Thomas Winstanley North West BNP 2,040 4.4% 4 of 5Stafford Roland Hynd West Midlands BNP 1,103 2.2% 5 of 6
CST Elections Report 2010
15
Parliamentary Constituency Candidate Region Party Vote Percent Place Staffordshire South David Bradnock West Midlands BNP 1,928 3.8% 5 of 6Stalybridge & Hyde Anthony Jones North West BNP 2,259 5.5% 4 of 6Stevenage Mike Green Eastern BNP 1,007 2.3% 5 of 9Stockport Duncan Warner North West BNP 1,201 3.1% 4 of 6Stockton North Neil Sinclair North East BNP 1,553 3.1% 4 of 7Stockton South James MacPherson North East BNP 1,724 4.4% 4 of 7Stoke on Trent Central Simon Darby West Midlands BNP 2,502 7.7% 4 of 10Stoke on Trent North Melanie Baddeley West Midlands BNP 3,196 8.0% 4 of 5Stoke on Trent South Michael Coleman West Midlands BNP 3,762 9.4% 4 of 7Stourbridge Robert Weale West Midlands BNP 1,696 3.6% 5 of 7Straford on Avon George Jones West Midlands BNP 1,097 2.2% 5 of 8Suffolk West Ramon Johns Eastern BNP 1,428 3.0% 5 of 7Sunderland Central John McCaffrey North East BNP 1,913 4.5% 4 of 5Sutton & Cheam John Clarke London BNP 1,014 2.1% 4 of 10Sutton Coldfield Robert Grierson West Midlands BNP 1,749 3.5% 4 of 6Swansea East Clive Bennett Wales BNP 1,715 5.2% 5 of 7 Swansea West Alan Bateman Wales BNP 910 2.6% 5 of 9 Swindon North Reg Bates South West BNP 1,542 3.1% 5 of 6Telford Phil Spencer West Midlands BNP 1,513 3.7% 5 of 5The Wrekin Susan Harwood West Midlands BNP 1,505 3.3% 5 of 5Thurrock Emma Colgate Eastern BNP 3,618 7.9% 4 of 6Tonbridge & Malling Mike Easter South East BNP 505 1.0% 6 of 7Torbay Ann Conway South West BNP 709 1.4% 5 of 6Torfaen Jenny Noble Wales BNP 1,657 4.4% 5 of 9Totnes Michael Turner South West BNP 624 1.3% 6 of 8Tunbridge Wells Andrew McBride South East BNP 704 1.4% 6 of 7Twickenham Chris Hurst London BNP 654 1.1% 6 of 8Tynemouth Dorothy Brooke North East BNP 1,404 2.7% 4 of 6Tyneside North John Burrows North East BNP 1,860 4.0% 4 of 6Tyneside North Bob Batten North East NF 599 1.3% 6 of 6Uxbridge & South Ruslip Dianne Sylvia Neal London BNP 1,396 3.1% 4 of 8Uxbridge & South Ruslip Francis McAllister London NF 271 0.6% 8 of 8Vale of Clwyd Ian Si'Ree Wales BNP 827 2.3% 5 of 7Wakefield Ian Senior Yorkshire & Humber BNP 2,581 5.8% 4 of 6Walsall North Christopher Woodall West Midlands BNP 2,930 8.1% 4 of 7Wansbeck Stephen Finlay North East BNP 1,418 3.7% 4 of 8Washington & Sunderland West Ian McDonald North East BNP 1,913 5.1% 4 of 5Watford Andrew Emerson Eastern BNP 1,217 2.2% 4 of 6Weaver Vale Colin Marsh North West BNP 1,063 2.4% 4 of 9Wellingborough Robert Walker East Midlands BNP 1,596 3.1% 5 of 10Wells Harry Boyce South West BNP 1,004 1.8% 5 of 6Wentworth & Dearne George Baldwin Yorkshire & Humber BNP 3,189 7.6% 5 of 5West Aberdeenshire & Kincardine Gary Raikes Scotland BNP 513 1.1% 5 of 6West Bromwich East Terry Lewin West Midlands BNP 2,205 5.8% 4 of 6West Bromwich West Russ Green West Midlands BNP 3,394 9.4% 4 of 5West Ham Michael Davidson London NF 1,089 2.3% 6 of 9Westminster North Stephen Curry London BNP 334 0.8% 5 of 10Weston Super Mare Penryn Parsons South West BNP 1,098 2.1% 5 of 7Wigan Charles Mather North West BNP 2,506 5.7% 5 of 5Windsor Peter Phillips South East BNP 950 1.9% 5 of 7Wolverhampton North East Simon Patten West Midlands BNP 2,296 6.6% 4 of 6Worcester Spencer Kirby West Midlands BNP 1,219 2.5% 5 of 9 Workington Martin Wingfield North West BNP 1,496 3.8% 4 of 6Wrexham Melvin Roberts Wales BNP 1,134 3.4% 5 of 6Wyre Forest Gordon Howells West Midlands BNP 1,120 2.2% 6 of 6Wythenshawe & Sale East Bernard Todd North West BNP 1,572 3.9% 4 of 6Yeovil Robert Baehr South West BNP 1,162 2.0% 5 of 5York Central Jeff Kelly Yorkshire & Humber BNP 1,171 2.5% 5 of 7York Outer Cathy Smurthwaite Yorkshire & Humber BNP 956 1.8% 5 of 5Yorkshire East Gary Pudsey Yorkshire & Humber BNP 1,865 3.6% 5 of 7
CST Elections Report 2010
16
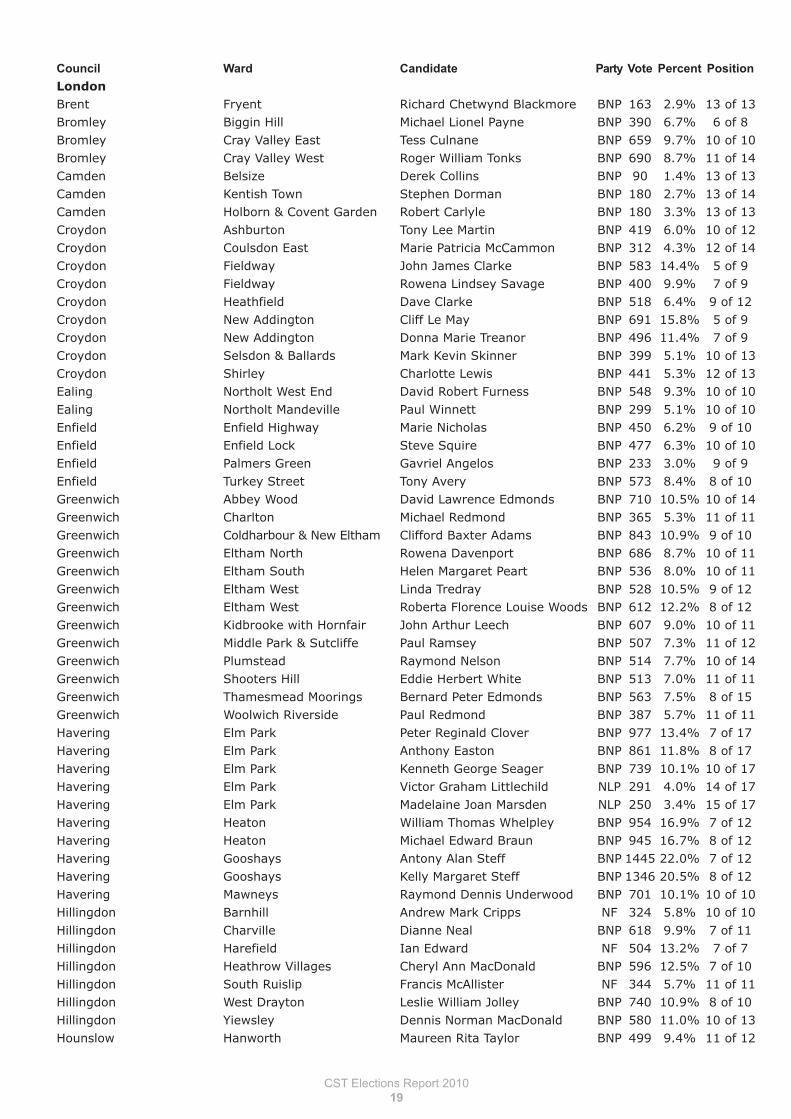
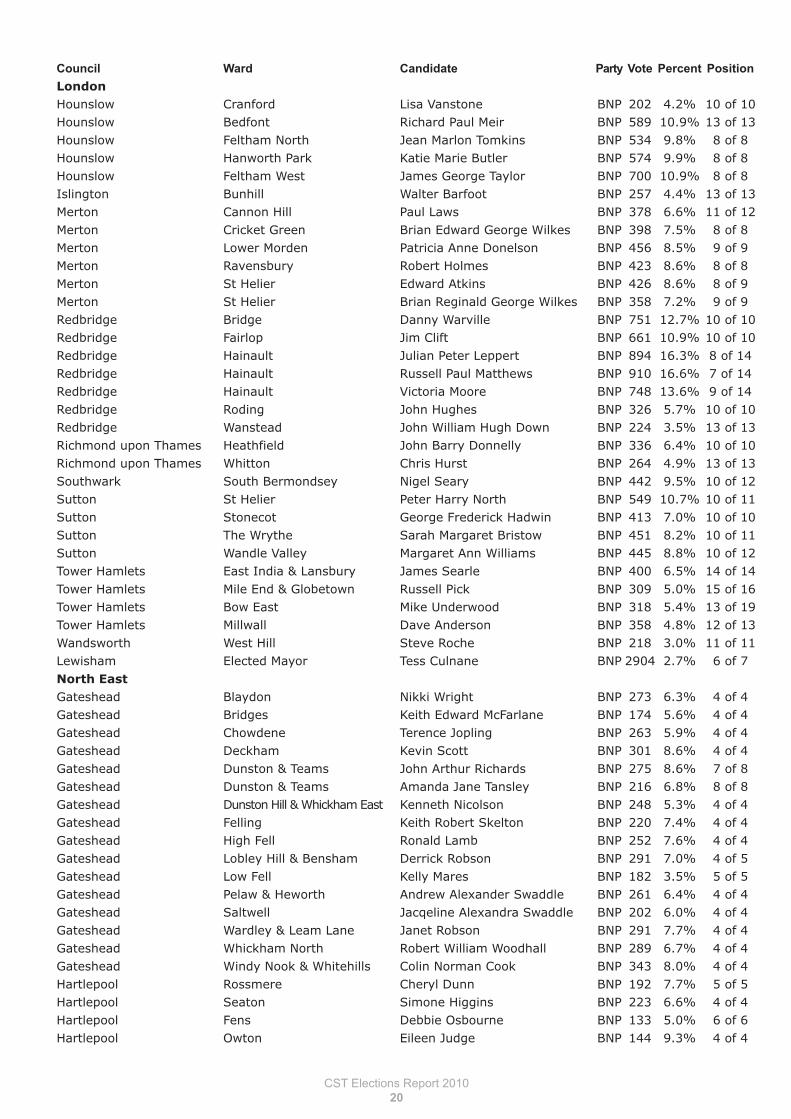
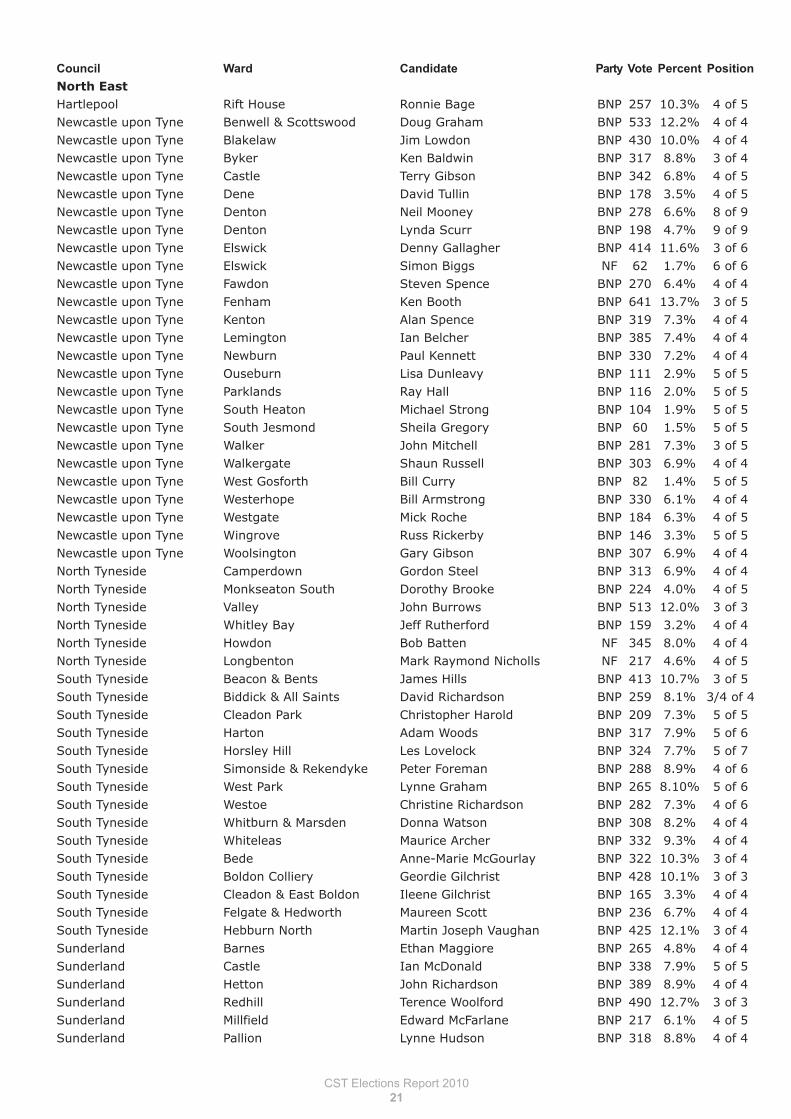
BNP Council Election 2010 Results
Council Ward Candidate Party VotePercentPosition
East Midlands
Amber Valley Alfreton Michael White BNP 319 8.4% 4 of 4
Amber Valley Codnor & Waingroves Ken Cooper BNP 391 14.6% 3 of 3
Amber Valley Heanor & Loscoe Paul Edward Snell BNP 504 19.1% 3 of 3
Amber Valley Heanor East Emma Rebecca Roper BNP 451 15.6% 3 of 4
Amber Valley Heanor West Maria Riley-Ward BNP 542 17.6% 3 of 4
Amber Valley Langley Mill & Aldecar Timothy Knowles NF 185 7.7% 4 of 5
Amber Valley Ripley Nathan Wilde BNP 438 9.7% 4 of 4
Bassetlaw East Retford North David John Otter BNP 282 7.2% 3 of 3
Lincoln Birchwood Phillip Marshall BNP 192 3.7% 4 of 5
Lincoln Bracebridge Dean Russel Lowther BNP 206 5.3% 4 of 5
Lincoln Minister Bunty Woherson BNP 145 5.9% 4 of 5
Lincoln Moorland Philip Graham Staples BNP 232 4.1% 7 of 8
Derby Chaddesden Paul Hilliard BNP 733 11.5% 4 of 4
Derby Derwent Alex Johnstone BNP 633 12.4% 4 of 4
Derby Mackworth Raymond Herbert Dixon BNP 554 9.9% 4 of 4
Derby Mickleover Jonathan Barlow BNP 441 5.3% 4 of 4
Derby Spondon Stephen Roland Hill BNP 547 8.2% 4 of 4
East of England
Basildon Billericay East Geoffrey John McCarthy BNP 196 2.9% 5 of 5
Basildon Billericay West Michael Richard Bateman BNP 219 3.2% 5 of 5
Basildon Burstead Irene Lillian Bateman BNP 251 4.1% 5 of 5
Basildon Crouch Anthony Mark Gladwin BNP 344 8.1% 4 of 4
Basildon Fryerns Leonard Alfred Heather BNP 579 11.3% 4 of 5
Basildon Laindon Park Tony Parry BNP 488 9.9% 4 of 4
Basildon Langdon Hills Thomas Frank Beaney BNP 248 5.2% 5 of 5
Basildon Lee Chapel North Philip Howell BNP 536 11.0% 4 of 4
Basildon Nethermayne Carolyn Rose Janet Rossiter BNP 487 8.8% 4 of 4
Basildon Pitsea North West Raymond Pearce BNP 460 9.5% 4 of 5
Basildon Pitsea South East Kevin Swaby BNP 417 8.4% 5 of 5
Basildon Wickford Castledon Michael Dennis Keeble BNP 273 6.5% 4 of 4
Basildon Wickford North David Michael King BNP 497 8.1% 4 of 4
Basildon Wickford Park Paul Maylin BNP 313 7.2% 4 of 4
Broxbourne Bury Green Wendy Jane Ward BNP 373 12.8% 4 of 4
Broxbourne Cheshunt Central Ramon Paul Johns BNP 408 11.8% 3 of 3
Broxbourne Cheshunt North Carolyn Iles BNP 342 10.4% 4 of 4
Broxbourne Flamstead End Ian Seeby BNP 355 10.4% 4 of 4
Broxbourne Goffs Oak Russell Jesse Shevill BNP 320 7.7% 3 of 3
Broxbourne Hoddesdon North Terence Frederick Savage BNP 276 7.5% 4 of 4
Broxbourne Rosedale Stephen McCole BNP 419 20.5% 3 of 3
Broxbourne Rye Park William James Dewick BNP 263 8.5% 4 of 4
Broxbourne Waltham Cross Christopher David Francis BNP 248 9.1% 4 of 4
Broxbourne Wormley & Turnford Mark Anthony Gerrard BNP 413 10.5% 4 of 4
Colchester Highwoods Patrick Albert Sullivan BNP 98 2.3% 5 of 6
Epping Forest Loughton Alderton Edward John Long BNP 328 15.5% 3 of 5
Epping Forest Loughton Broadway Thomas Leonard Richardson BNP 323 17.6% 4 of 5
Epping Forest Loughton Fairmead Alexander Patrick Copland BNP 300 15.5% 3 of 5
Epping Forest Loughton Roding Ryan Hazell BNP 160 6.6% 4 of 4
Hertsmere Borehamwood Brookmeadow Freda Green BNP 264 8.1% 4 of 5
Hertsmere Borehamwood Cowley Hill Colin Cooper BNP 426 13.1% 3 of 4
CST Elections Report 2010
17
Council Ward Candidate Party Vote Percent Position
East of EnglandIpswich Stoke Park Dennis Boater BNP 190 5.8% 4 of 5North Hertfordshire Baldock Town James Reginald Scott BNP 140 3.8% 4 of 5North Hertfordshire Letchworth Grange Thomas William Godfrey BNP 176 4.6% 5 of 5North Hertfordshire Letchworth Wilbury Reginald Frank Norgan BNP 119 4.9% 4 of 4Rochford Hawkwell North Antony William Evennett BNP 264 11.1% 3 of 3Rochford Hawkwell South Earl Victor Strobridge BNP 389 19.7% 2 of 2Rochford Hawkwell West James Michael Antony Wells BNP 101 4.3% 5 of 5Rochford Whitehouse Joan Elizabeth Court BNP 156 7.3% 3 of 3Southend Belfairs Elliot Munro BNP 235 4.6% 5 of 5Southend Blenheim Park Bernadette Jaggers BNP 264 5.4% 5 of 5Southend Chalkwell David Newman BNP 118 2.5% 7 of 7Southend Eastwood Park Laurence Deacon BNP 218 4.4% 5 of 6Southend Kursaal David John Armstrong BNP 232 6.5% 5 of 7Southend Leigh Raymond Weaver BNP 182 3.7% 4 of 4Southend Milton Stanley Adie BNP 171 4.4% 6 of 6Southend Prittlewell Craig Bradley Pace BNP 180 3.7% 5 of 6Southend Shoeburyness Roger Gilbert Gander BNP 265 5.7% 5 of 7Southend Southchurch Geoff Mark Strobridge BNP 289 6.2% 6 of 6Southend St Laurence Keith Frederick Barrett BNP 403 8.6% 4 of 4Southend St Luke's Fenton Bowley BNP 300 6.4% 5 of 7Southend Thorpe Lisa Simmonds BNP 158 3.0% 6 of 6Southend Victoria Alisdair Thain Lewis BNP 341 9.2% 4 of 5Southend West Leigh Antony Robert Winchester BNP 185 3.4% 4 of 6Southend West Shoebury Russell Speller BNP 227 4.9% 6 of 6Southend Westborough Lancelot Martin BNP 218 5.1% 5 of 7St Albans London Colney Danny Seabrook BNP 255 5.5% 4 of 5Stevenage Pin Green Michael Andrew Green BNP 136 4.8% 5 of 5Thurrock Aveley & Uplands Dave Strickson BNP 369 9.7% 5 of 5Thurrock Belhus Ricky Strickson BNP 727 20.3% 3 of 3Thurrock Chadwell St Mary Derek Beackon BNP 811 19.8% 3 of 3Thurrock Grays Riverside Luke North BNP 563 14.7% 3 of 4Thurrock Grays Thurrock Tom Davis BNP 432 11.0% 4 of 4Thurrock Little Thurrock Blackshots Tracy Worth BNP 228 7.5% 4 of 4Thurrock Little Thurrock Rectory Donna Strickson BNP 283 9.7% 4 of 4Thurrock Ockendon Mark Gorman BNP 525 12.7% 3 of 4Thurrock Orsett Mark O'Nion BNP 253 7.7% 4 of 4Thurrock South Chafford Mickey White BNP 303 11.3% 3 of 3Thurrock Stanford East & Corringham Town David Godfrey BNP 384 9.3% 4 of 4Thurrock Stifford Clays Karne McGinn BNP 249 7.8% 4 of 4Thurrock The Homesteads Paul Woodley BNP 413 8.9% 4 of 4Thurrock Tilbury Riverside & Thurrock Park Anthony McGinn BNP 585 25.0% 2 of 5Thurrock Tilbury St Chads Jay Slaven BNP 555 26.1% 2 of 3Thurrock West Thurrock & South Stifford Warren Parish BNP 574 16.9% 3 of 3Welwyn Hatfield Northaw & Cuffley Mark Fuller BNP 222 6.9% 4 of 4LondonBarking & Dagenham Abbey Brian Tunney BNP 326 6.4% 8 of 9Barking & Dagenham Alibon Robert Bailey BNP 1209 25.9% 4 of 8Barking & Dagenham Alibon Gavin Cardy BNP 1111 23.8% 5 of 8Barking & Dagenham Alibon Giuseppe de Santis BNP 977 20.9% 6 of 8Barking & Dagenham Becontree Terence Matthews BNP 1038 19.3% 4 of 13Barking & Dagenham Chadwell Heath George Wilfred Woodward BNP 594 11.8% 7 of 12Barking & Dagenham Eastbrook Christine Anne Knight BNP 900 17.3% 8 of 11Barking & Dagenham Eastbrook Tony Knight BNP 903 17.4% 7 of 11
CST Elections Report 2010
18
Council Ward Candidate Party Vote Percent Position
LondonBarking & Dagenham Eastbrook John David Lillywhite BNP 794 15.3% 9 of 11
Barking & Dagenham Eastbury Jeffrey Christopher Marshall BNP 942 19.8% 4 of 14
Barking & Dagenham Eastbury Trevor Thomas William Wade BNP 742 15.6% 5 of 14
Barking & Dagenham Gascoigne John Craig Fergie BNP 536 11.1% 4 of 13
Barking & Dagenham Goresbrook Richard John Barnbrook BNP 1340 27.2% 4 of 11
Barking & Dagenham Goresbrook Shell Brunt BNP 1128 22.9% 6 of 11
Barking & Dagenham Goresbrook Edward Mark Butler BNP 1146 23.3% 5 of 11
Barking & Dagenham Heath Sally Lister BNP 969 20.6% 4 of 11
Barking & Dagenham Heath Paul Leslie William Sturdy BNP 844 17.9% 5 of 11
Barking & Dagenham Heath Robert Michael Taylor BNP 802 17.0% 6 of 11
Barking & Dagenham Longbridge Bede Ewing Smith BNP 677 9.3% 7 of 13
Barking & Dagenham Mayesbrook Robert John Anthony Buckley BNP 1109 22.9% 5 of 9
Barking & Dagenham Mayesbrook Tracy Anne Lansdown BNP 1123 23.2% 4 of 9
Barking & Dagenham Mayesbrook Mandy Matthews BNP 1024 21.2% 6 of 9
Barking & Dagenham Parsloes Christopher Walter Charles Forster BNP 941 20.8% 5 of 8
Barking & Dagenham Parsloes Leigh Friend BNP 1022 22.6% 4 of 8
Barking & Dagenham Parsloes Anthony Stephen McKay BNP 867 19.2% 6 of 8
Barking & Dagenham River Scott Jones BNP 933 18.8% 4 of 11
Barking & Dagenham River Victoria Jane Pengelly BNP 853 17.2% 5 of 11
Barking & Dagenham Thames Roy Evans BNP 716 17.1% 4 of 12
Barking & Dagenham Thames Andrew James Todd BNP 661 15.8% 5 of 12
Barking & Dagenham Valence Christopher Roberts BNP 1112 25.2% 4 of 8
Barking & Dagenham Valence Lawrence Rustem BNP 995 22.5% 5 of 8
Barking & Dagenham Valence Kara Michelle Walker BNP 963 21.8% 6 of 8
Barking & Dagenham Village Len Bird BNP 1049 21.1% 4 of 8
Barking & Dagenham Whalebone Robin Lee Lillywhite BNP 603 12.4% 7 of 11
Barnet East Barnet Stephen Curry BNP 364 4.6% 15 of 15
Bexley Belvedere Neil Leslie Marsh Allen BNP 671 12.0% 7 of 8
Bexley Blendon & Penhill Linda Osborne BNP 711 9.7% 8 of 9
Bexley Colyers Peter William Hacking BNP 666 12.4% 9 of 11
Bexley Crayford Stephen Arthur James BNP 710 11.3% 8 of 9
Bexley East Wickham Michael John Barnbrook BNP 1282 22.5% 5 of 12
Bexley East Wickham Linda Joyce Hacking BNP 1066 18.7% 8 of 12
Bexley East Wickham Stephen James Hadley BNP 1006 17.7% 9 of 12
Bexley Falconwood & Welling Michael Jones BNP 670 10.5% 9 of 13
Bexley Falconwood & Welling Jaymie Ryan McCoy BNP 628 9.8% 10 of 13
Bexley Falconwood & Welling Josephine Rosalind Ridout BNP 547 8.5% 12 of 13
Bexley North End Thomas Charles Andrews BNP 622 13.0% 9 of 10
Bexley North End Ivan Peter Osborne BNP 533 11.1% 10 of 10
Bexley Sidcup Laurence Picton BNP 466 6.5% 11 of 11
Bexley St Michael's Chloe Nichols BNP 813 12.5% 8 of 11
Bexley Barnehurst Gary Steven Howells BNP 641 9.5% 10 of 11
Bexley Blackfen & Lamorbey Maureen Alice Ann Slaughter BNP 693 10.8% 9 of 10
Bexley Brampton Peter Glyn James BNP 595 8.0% 9 of 9
Bexley Christchurch Gordon Jeffry Davis BNP 637 10.6% 10 of 10
Bexley Cray Meadhows John Brooks BNP 583 10.0% 10 of 11
Bexley Danson Park Allyson Jane Davis BNP 595 9.3% 11 of 11
Bexley Erith Lee Alan Woodthorpe BNP 567 10.2% 8 of 8
Bexley Lesnes Abbey Nicola Anne Finch BNP 716 11.6% 7 of 8
Bexley Longlands David Bowman BNP 458 7.1% 10 of 14
Bexley Northumberland Heath Robert David Howard BNP 639 9.8% 8 of 9
Bexley St Mary's Bernard Cresswell BNP 508 7.8% 10 of 11
Bexley Thamesmead East Ben Scott BNP 553 10.2% 8 of 11
CST Elections Report 2010
19
Council Ward Candidate Party Vote Percent Position
LondonBrent Fryent Richard Chetwynd Blackmore BNP 163 2.9% 13 of 13Bromley Biggin Hill Michael Lionel Payne BNP 390 6.7% 6 of 8Bromley Cray Valley East Tess Culnane BNP 659 9.7% 10 of 10Bromley Cray Valley West Roger William Tonks BNP 690 8.7% 11 of 14Camden Belsize Derek Collins BNP 90 1.4% 13 of 13Camden Kentish Town Stephen Dorman BNP 180 2.7% 13 of 14Camden Holborn & Covent Garden Robert Carlyle BNP 180 3.3% 13 of 13Croydon Ashburton Tony Lee Martin BNP 419 6.0% 10 of 12Croydon Coulsdon East Marie Patricia McCammon BNP 312 4.3% 12 of 14Croydon Fieldway John James Clarke BNP 583 14.4% 5 of 9Croydon Fieldway Rowena Lindsey Savage BNP 400 9.9% 7 of 9Croydon Heathfield Dave Clarke BNP 518 6.4% 9 of 12Croydon New Addington Cliff Le May BNP 691 15.8% 5 of 9Croydon New Addington Donna Marie Treanor BNP 496 11.4% 7 of 9Croydon Selsdon & Ballards Mark Kevin Skinner BNP 399 5.1% 10 of 13Croydon Shirley Charlotte Lewis BNP 441 5.3% 12 of 13Ealing Northolt West End David Robert Furness BNP 548 9.3% 10 of 10Ealing Northolt Mandeville Paul Winnett BNP 299 5.1% 10 of 10Enfield Enfield Highway Marie Nicholas BNP 450 6.2% 9 of 10Enfield Enfield Lock Steve Squire BNP 477 6.3% 10 of 10Enfield Palmers Green Gavriel Angelos BNP 233 3.0% 9 of 9Enfield Turkey Street Tony Avery BNP 573 8.4% 8 of 10Greenwich Abbey Wood David Lawrence Edmonds BNP 710 10.5% 10 of 14Greenwich Charlton Michael Redmond BNP 365 5.3% 11 of 11Greenwich Coldharbour & New Eltham Clifford Baxter Adams BNP 843 10.9% 9 of 10Greenwich Eltham North Rowena Davenport BNP 686 8.7% 10 of 11Greenwich Eltham South Helen Margaret Peart BNP 536 8.0% 10 of 11Greenwich Eltham West Linda Tredray BNP 528 10.5% 9 of 12Greenwich Eltham West Roberta Florence Louise Woods BNP 612 12.2% 8 of 12Greenwich Kidbrooke with Hornfair John Arthur Leech BNP 607 9.0% 10 of 11Greenwich Middle Park & Sutcliffe Paul Ramsey BNP 507 7.3% 11 of 12Greenwich Plumstead Raymond Nelson BNP 514 7.7% 10 of 14Greenwich Shooters Hill Eddie Herbert White BNP 513 7.0% 11 of 11Greenwich Thamesmead Moorings Bernard Peter Edmonds BNP 563 7.5% 8 of 15Greenwich Woolwich Riverside Paul Redmond BNP 387 5.7% 11 of 11Havering Elm Park Peter Reginald Clover BNP 977 13.4% 7 of 17Havering Elm Park Anthony Easton BNP 861 11.8% 8 of 17Havering Elm Park Kenneth George Seager BNP 739 10.1% 10 of 17Havering Elm Park Victor Graham Littlechild NLP 291 4.0% 14 of 17Havering Elm Park Madelaine Joan Marsden NLP 250 3.4% 15 of 17Havering Heaton William Thomas Whelpley BNP 954 16.9% 7 of 12Havering Heaton Michael Edward Braun BNP 945 16.7% 8 of 12Havering Gooshays Antony Alan Steff BNP 1445 22.0% 7 of 12Havering Gooshays Kelly Margaret Steff BNP 1346 20.5% 8 of 12Havering Mawneys Raymond Dennis Underwood BNP 701 10.1% 10 of 10Hillingdon Barnhill Andrew Mark Cripps NF 324 5.8% 10 of 10Hillingdon Charville Dianne Neal BNP 618 9.9% 7 of 11Hillingdon Harefield Ian Edward NF 504 13.2% 7 of 7Hillingdon Heathrow Villages Cheryl Ann MacDonald BNP 596 12.5% 7 of 10Hillingdon South Ruislip Francis McAllister NF 344 5.7% 11 of 11Hillingdon West Drayton Leslie William Jolley BNP 740 10.9% 8 of 10Hillingdon Yiewsley Dennis Norman MacDonald BNP 580 11.0% 10 of 13Hounslow Hanworth Maureen Rita Taylor BNP 499 9.4% 11 of 12
CST Elections Report 2010
20
Council Ward Candidate Party Vote Percent Position
LondonHounslow Cranford Lisa Vanstone BNP 202 4.2% 10 of 10Hounslow Bedfont Richard Paul Meir BNP 589 10.9% 13 of 13Hounslow Feltham North Jean Marlon Tomkins BNP 534 9.8% 8 of 8Hounslow Hanworth Park Katie Marie Butler BNP 574 9.9% 8 of 8Hounslow Feltham West James George Taylor BNP 700 10.9% 8 of 8Islington Bunhill Walter Barfoot BNP 257 4.4% 13 of 13Merton Cannon Hill Paul Laws BNP 378 6.6% 11 of 12Merton Cricket Green Brian Edward George Wilkes BNP 398 7.5% 8 of 8Merton Lower Morden Patricia Anne Donelson BNP 456 8.5% 9 of 9Merton Ravensbury Robert Holmes BNP 423 8.6% 8 of 8Merton St Helier Edward Atkins BNP 426 8.6% 8 of 9Merton St Helier Brian Reginald George Wilkes BNP 358 7.2% 9 of 9Redbridge Bridge Danny Warville BNP 751 12.7% 10 of 10Redbridge Fairlop Jim Clift BNP 661 10.9% 10 of 10Redbridge Hainault Julian Peter Leppert BNP 894 16.3% 8 of 14Redbridge Hainault Russell Paul Matthews BNP 910 16.6% 7 of 14Redbridge Hainault Victoria Moore BNP 748 13.6% 9 of 14Redbridge Roding John Hughes BNP 326 5.7% 10 of 10Redbridge Wanstead John William Hugh Down BNP 224 3.5% 13 of 13Richmond upon Thames Heathfield John Barry Donnelly BNP 336 6.4% 10 of 10Richmond upon Thames Whitton Chris Hurst BNP 264 4.9% 13 of 13Southwark South Bermondsey Nigel Seary BNP 442 9.5% 10 of 12Sutton St Helier Peter Harry North BNP 549 10.7% 10 of 11Sutton Stonecot George Frederick Hadwin BNP 413 7.0% 10 of 10Sutton The Wrythe Sarah Margaret Bristow BNP 451 8.2% 10 of 11Sutton Wandle Valley Margaret Ann Williams BNP 445 8.8% 10 of 12Tower Hamlets East India & Lansbury James Searle BNP 400 6.5% 14 of 14Tower Hamlets Mile End & Globetown Russell Pick BNP 309 5.0% 15 of 16Tower Hamlets Bow East Mike Underwood BNP 318 5.4% 13 of 19Tower Hamlets Millwall Dave Anderson BNP 358 4.8% 12 of 13Wandsworth West Hill Steve Roche BNP 218 3.0% 11 of 11Lewisham Elected Mayor Tess Culnane BNP 2904 2.7% 6 of 7North EastGateshead Blaydon Nikki Wright BNP 273 6.3% 4 of 4Gateshead Bridges Keith Edward McFarlane BNP 174 5.6% 4 of 4Gateshead Chowdene Terence Jopling BNP 263 5.9% 4 of 4Gateshead Deckham Kevin Scott BNP 301 8.6% 4 of 4Gateshead Dunston & Teams John Arthur Richards BNP 275 8.6% 7 of 8Gateshead Dunston & Teams Amanda Jane Tansley BNP 216 6.8% 8 of 8Gateshead Dunston Hill & Whickham East Kenneth Nicolson BNP 248 5.3% 4 of 4Gateshead Felling Keith Robert Skelton BNP 220 7.4% 4 of 4Gateshead High Fell Ronald Lamb BNP 252 7.6% 4 of 4Gateshead Lobley Hill & Bensham Derrick Robson BNP 291 7.0% 4 of 5Gateshead Low Fell Kelly Mares BNP 182 3.5% 5 of 5Gateshead Pelaw & Heworth Andrew Alexander Swaddle BNP 261 6.4% 4 of 4Gateshead Saltwell Jacqeline Alexandra Swaddle BNP 202 6.0% 4 of 4Gateshead Wardley & Leam Lane Janet Robson BNP 291 7.7% 4 of 4Gateshead Whickham North Robert William Woodhall BNP 289 6.7% 4 of 4Gateshead Windy Nook & Whitehills Colin Norman Cook BNP 343 8.0% 4 of 4Hartlepool Rossmere Cheryl Dunn BNP 192 7.7% 5 of 5Hartlepool Seaton Simone Higgins BNP 223 6.6% 4 of 4Hartlepool Fens Debbie Osbourne BNP 133 5.0% 6 of 6Hartlepool Owton Eileen Judge BNP 144 9.3% 4 of 4
CST Elections Report 2010
21
Council Ward Candidate Party Vote Percent Position
North EastHartlepool Rift House Ronnie Bage BNP 257 10.3% 4 of 5Newcastle upon Tyne Benwell & Scottswood Doug Graham BNP 533 12.2% 4 of 4Newcastle upon Tyne Blakelaw Jim Lowdon BNP 430 10.0% 4 of 4Newcastle upon Tyne Byker Ken Baldwin BNP 317 8.8% 3 of 4Newcastle upon Tyne Castle Terry Gibson BNP 342 6.8% 4 of 5Newcastle upon Tyne Dene David Tullin BNP 178 3.5% 4 of 5Newcastle upon Tyne Denton Neil Mooney BNP 278 6.6% 8 of 9Newcastle upon Tyne Denton Lynda Scurr BNP 198 4.7% 9 of 9Newcastle upon Tyne Elswick Denny Gallagher BNP 414 11.6% 3 of 6Newcastle upon Tyne Elswick Simon Biggs NF 62 1.7% 6 of 6Newcastle upon Tyne Fawdon Steven Spence BNP 270 6.4% 4 of 4Newcastle upon Tyne Fenham Ken Booth BNP 641 13.7% 3 of 5Newcastle upon Tyne Kenton Alan Spence BNP 319 7.3% 4 of 4Newcastle upon Tyne Lemington Ian Belcher BNP 385 7.4% 4 of 4Newcastle upon Tyne Newburn Paul Kennett BNP 330 7.2% 4 of 4Newcastle upon Tyne Ouseburn Lisa Dunleavy BNP 111 2.9% 5 of 5Newcastle upon Tyne Parklands Ray Hall BNP 116 2.0% 5 of 5Newcastle upon Tyne South Heaton Michael Strong BNP 104 1.9% 5 of 5Newcastle upon Tyne South Jesmond Sheila Gregory BNP 60 1.5% 5 of 5Newcastle upon Tyne Walker John Mitchell BNP 281 7.3% 3 of 5Newcastle upon Tyne Walkergate Shaun Russell BNP 303 6.9% 4 of 4Newcastle upon Tyne West Gosforth Bill Curry BNP 82 1.4% 5 of 5Newcastle upon Tyne Westerhope Bill Armstrong BNP 330 6.1% 4 of 4Newcastle upon Tyne Westgate Mick Roche BNP 184 6.3% 4 of 5Newcastle upon Tyne Wingrove Russ Rickerby BNP 146 3.3% 5 of 5Newcastle upon Tyne Woolsington Gary Gibson BNP 307 6.9% 4 of 4North Tyneside Camperdown Gordon Steel BNP 313 6.9% 4 of 4North Tyneside Monkseaton South Dorothy Brooke BNP 224 4.0% 4 of 5North Tyneside Valley John Burrows BNP 513 12.0% 3 of 3North Tyneside Whitley Bay Jeff Rutherford BNP 159 3.2% 4 of 4North Tyneside Howdon Bob Batten NF 345 8.0% 4 of 4North Tyneside Longbenton Mark Raymond Nicholls NF 217 4.6% 4 of 5South Tyneside Beacon & Bents James Hills BNP 413 10.7% 3 of 5South Tyneside Biddick & All Saints David Richardson BNP 259 8.1% 3/4 of 4South Tyneside Cleadon Park Christopher Harold BNP 209 7.3% 5 of 5South Tyneside Harton Adam Woods BNP 317 7.9% 5 of 6South Tyneside Horsley Hill Les Lovelock BNP 324 7.7% 5 of 7South Tyneside Simonside & Rekendyke Peter Foreman BNP 288 8.9% 4 of 6South Tyneside West Park Lynne Graham BNP 265 8.10% 5 of 6South Tyneside Westoe Christine Richardson BNP 282 7.3% 4 of 6South Tyneside Whitburn & Marsden Donna Watson BNP 308 8.2% 4 of 4South Tyneside Whiteleas Maurice Archer BNP 332 9.3% 4 of 4South Tyneside Bede Anne-Marie McGourlay BNP 322 10.3% 3 of 4South Tyneside Boldon Colliery Geordie Gilchrist BNP 428 10.1% 3 of 3South Tyneside Cleadon & East Boldon Ileene Gilchrist BNP 165 3.3% 4 of 4South Tyneside Felgate & Hedworth Maureen Scott BNP 236 6.7% 4 of 4South Tyneside Hebburn North Martin Joseph Vaughan BNP 425 12.1% 3 of 4Sunderland Barnes Ethan Maggiore BNP 265 4.8% 4 of 4Sunderland Castle Ian McDonald BNP 338 7.9% 5 of 5Sunderland Hetton John Richardson BNP 389 8.9% 4 of 4Sunderland Redhill Terence Woolford BNP 490 12.7% 3 of 3Sunderland Millfield Edward McFarlane BNP 217 6.1% 4 of 5Sunderland Pallion Lynne Hudson BNP 318 8.8% 4 of 4
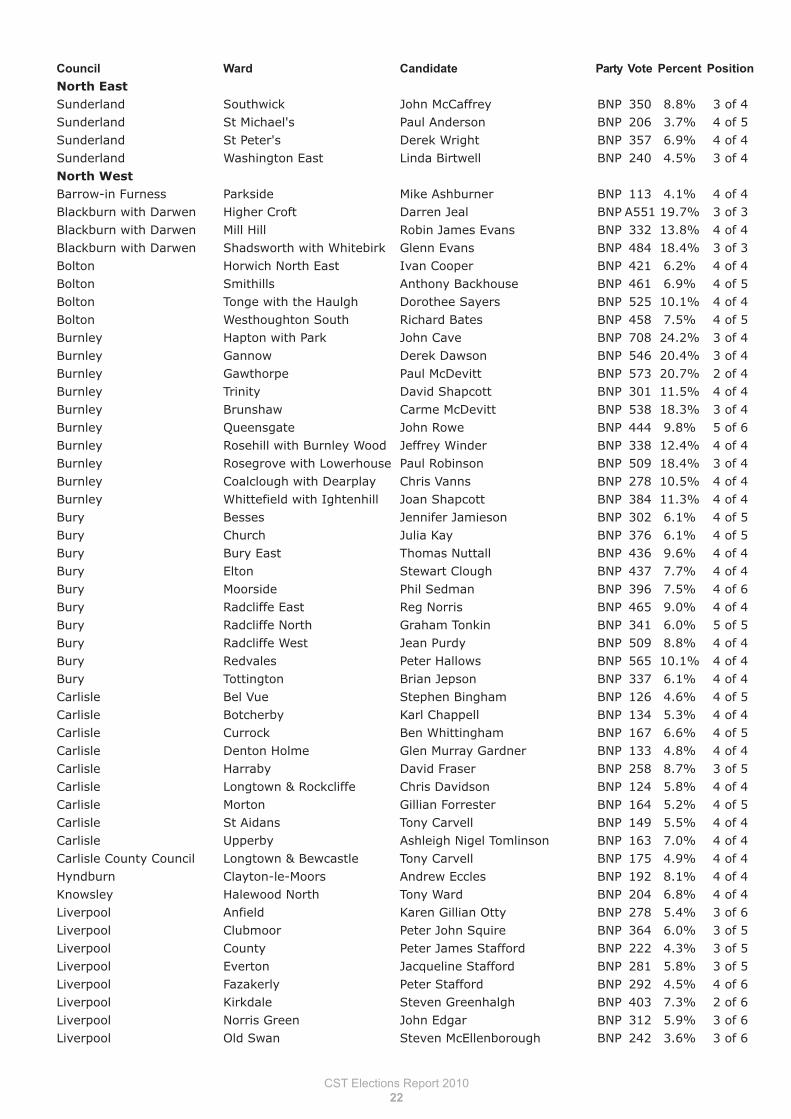
CST Elections Report 2010
22
Council Ward Candidate Party Vote Percent Position
North EastSunderland Southwick John McCaffrey BNP 350 8.8% 3 of 4Sunderland St Michael's Paul Anderson BNP 206 3.7% 4 of 5Sunderland St Peter's Derek Wright BNP 357 6.9% 4 of 4Sunderland Washington East Linda Birtwell BNP 240 4.5% 3 of 4North WestBarrow-in Furness Parkside Mike Ashburner BNP 113 4.1% 4 of 4Blackburn with Darwen Higher Croft Darren Jeal BNP A551 19.7% 3 of 3Blackburn with Darwen Mill Hill Robin James Evans BNP 332 13.8% 4 of 4Blackburn with Darwen Shadsworth with Whitebirk Glenn Evans BNP 484 18.4% 3 of 3Bolton Horwich North East Ivan Cooper BNP 421 6.2% 4 of 4Bolton Smithills Anthony Backhouse BNP 461 6.9% 4 of 5Bolton Tonge with the Haulgh Dorothee Sayers BNP 525 10.1% 4 of 4Bolton Westhoughton South Richard Bates BNP 458 7.5% 4 of 5Burnley Hapton with Park John Cave BNP 708 24.2% 3 of 4Burnley Gannow Derek Dawson BNP 546 20.4% 3 of 4Burnley Gawthorpe Paul McDevitt BNP 573 20.7% 2 of 4Burnley Trinity David Shapcott BNP 301 11.5% 4 of 4Burnley Brunshaw Carme McDevitt BNP 538 18.3% 3 of 4Burnley Queensgate John Rowe BNP 444 9.8% 5 of 6Burnley Rosehill with Burnley Wood Jeffrey Winder BNP 338 12.4% 4 of 4Burnley Rosegrove with Lowerhouse Paul Robinson BNP 509 18.4% 3 of 4Burnley Coalclough with Dearplay Chris Vanns BNP 278 10.5% 4 of 4Burnley Whittefield with Ightenhill Joan Shapcott BNP 384 11.3% 4 of 4Bury Besses Jennifer Jamieson BNP 302 6.1% 4 of 5Bury Church Julia Kay BNP 376 6.1% 4 of 5Bury Bury East Thomas Nuttall BNP 436 9.6% 4 of 4Bury Elton Stewart Clough BNP 437 7.7% 4 of 4Bury Moorside Phil Sedman BNP 396 7.5% 4 of 6Bury Radcliffe East Reg Norris BNP 465 9.0% 4 of 4Bury Radcliffe North Graham Tonkin BNP 341 6.0% 5 of 5Bury Radcliffe West Jean Purdy BNP 509 8.8% 4 of 4Bury Redvales Peter Hallows BNP 565 10.1% 4 of 4Bury Tottington Brian Jepson BNP 337 6.1% 4 of 4Carlisle Bel Vue Stephen Bingham BNP 126 4.6% 4 of 5Carlisle Botcherby Karl Chappell BNP 134 5.3% 4 of 4Carlisle Currock Ben Whittingham BNP 167 6.6% 4 of 5Carlisle Denton Holme Glen Murray Gardner BNP 133 4.8% 4 of 4Carlisle Harraby David Fraser BNP 258 8.7% 3 of 5Carlisle Longtown & Rockcliffe Chris Davidson BNP 124 5.8% 4 of 4Carlisle Morton Gillian Forrester BNP 164 5.2% 4 of 5Carlisle St Aidans Tony Carvell BNP 149 5.5% 4 of 4Carlisle Upperby Ashleigh Nigel Tomlinson BNP 163 7.0% 4 of 4Carlisle County Council Longtown & Bewcastle Tony Carvell BNP 175 4.9% 4 of 4Hyndburn Clayton-le-Moors Andrew Eccles BNP 192 8.1% 4 of 4Knowsley Halewood North Tony Ward BNP 204 6.8% 4 of 4Liverpool Anfield Karen Gillian Otty BNP 278 5.4% 3 of 6Liverpool Clubmoor Peter John Squire BNP 364 6.0% 3 of 5Liverpool County Peter James Stafford BNP 222 4.3% 3 of 5Liverpool Everton Jacqueline Stafford BNP 281 5.8% 3 of 5Liverpool Fazakerly Peter Stafford BNP 292 4.5% 4 of 6Liverpool Kirkdale Steven Greenhalgh BNP 403 7.3% 2 of 6Liverpool Norris Green John Edgar BNP 312 5.9% 3 of 6Liverpool Old Swan Steven McEllenborough BNP 242 3.6% 3 of 6
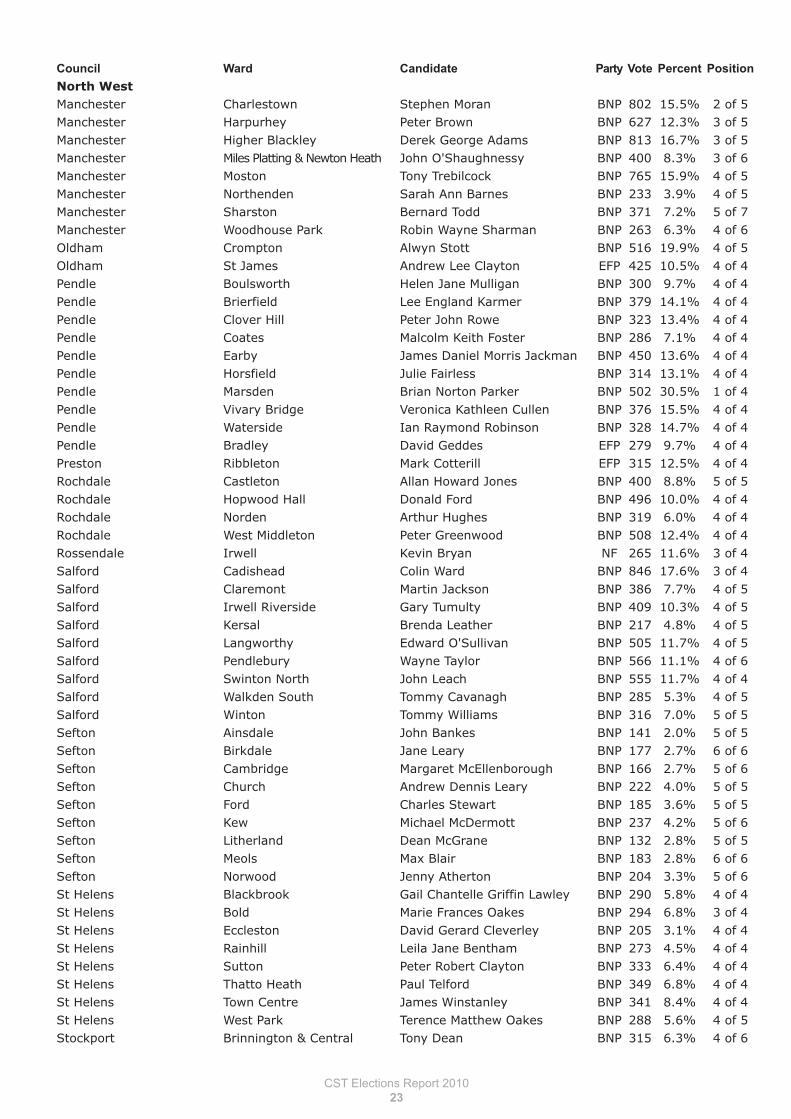
CST Elections Report 2010
23
Council Ward Candidate Party Vote Percent Position
North WestManchester Charlestown Stephen Moran BNP 802 15.5% 2 of 5Manchester Harpurhey Peter Brown BNP 627 12.3% 3 of 5Manchester Higher Blackley Derek George Adams BNP 813 16.7% 3 of 5Manchester Miles Platting & Newton Heath John O'Shaughnessy BNP 400 8.3% 3 of 6Manchester Moston Tony Trebilcock BNP 765 15.9% 4 of 5Manchester Northenden Sarah Ann Barnes BNP 233 3.9% 4 of 5Manchester Sharston Bernard Todd BNP 371 7.2% 5 of 7Manchester Woodhouse Park Robin Wayne Sharman BNP 263 6.3% 4 of 6Oldham Crompton Alwyn Stott BNP 516 19.9% 4 of 5Oldham St James Andrew Lee Clayton EFP 425 10.5% 4 of 4Pendle Boulsworth Helen Jane Mulligan BNP 300 9.7% 4 of 4Pendle Brierfield Lee England Karmer BNP 379 14.1% 4 of 4Pendle Clover Hill Peter John Rowe BNP 323 13.4% 4 of 4Pendle Coates Malcolm Keith Foster BNP 286 7.1% 4 of 4Pendle Earby James Daniel Morris Jackman BNP 450 13.6% 4 of 4Pendle Horsfield Julie Fairless BNP 314 13.1% 4 of 4Pendle Marsden Brian Norton Parker BNP 502 30.5% 1 of 4Pendle Vivary Bridge Veronica Kathleen Cullen BNP 376 15.5% 4 of 4Pendle Waterside Ian Raymond Robinson BNP 328 14.7% 4 of 4Pendle Bradley David Geddes EFP 279 9.7% 4 of 4Preston Ribbleton Mark Cotterill EFP 315 12.5% 4 of 4Rochdale Castleton Allan Howard Jones BNP 400 8.8% 5 of 5Rochdale Hopwood Hall Donald Ford BNP 496 10.0% 4 of 4Rochdale Norden Arthur Hughes BNP 319 6.0% 4 of 4Rochdale West Middleton Peter Greenwood BNP 508 12.4% 4 of 4Rossendale Irwell Kevin Bryan NF 265 11.6% 3 of 4Salford Cadishead Colin Ward BNP 846 17.6% 3 of 4Salford Claremont Martin Jackson BNP 386 7.7% 4 of 5Salford Irwell Riverside Gary Tumulty BNP 409 10.3% 4 of 5Salford Kersal Brenda Leather BNP 217 4.8% 4 of 5Salford Langworthy Edward O'Sullivan BNP 505 11.7% 4 of 5Salford Pendlebury Wayne Taylor BNP 566 11.1% 4 of 6Salford Swinton North John Leach BNP 555 11.7% 4 of 4Salford Walkden South Tommy Cavanagh BNP 285 5.3% 4 of 5Salford Winton Tommy Williams BNP 316 7.0% 5 of 5Sefton Ainsdale John Bankes BNP 141 2.0% 5 of 5Sefton Birkdale Jane Leary BNP 177 2.7% 6 of 6Sefton Cambridge Margaret McEllenborough BNP 166 2.7% 5 of 6Sefton Church Andrew Dennis Leary BNP 222 4.0% 5 of 5Sefton Ford Charles Stewart BNP 185 3.6% 5 of 5Sefton Kew Michael McDermott BNP 237 4.2% 5 of 6Sefton Litherland Dean McGrane BNP 132 2.8% 5 of 5Sefton Meols Max Blair BNP 183 2.8% 6 of 6Sefton Norwood Jenny Atherton BNP 204 3.3% 5 of 6St Helens Blackbrook Gail Chantelle Griffin Lawley BNP 290 5.8% 4 of 4St Helens Bold Marie Frances Oakes BNP 294 6.8% 3 of 4St Helens Eccleston David Gerard Cleverley BNP 205 3.1% 4 of 4St Helens Rainhill Leila Jane Bentham BNP 273 4.5% 4 of 4St Helens Sutton Peter Robert Clayton BNP 333 6.4% 4 of 4St Helens Thatto Heath Paul Telford BNP 349 6.8% 4 of 4St Helens Town Centre James Winstanley BNP 341 8.4% 4 of 4St Helens West Park Terence Matthew Oakes BNP 288 5.6% 4 of 5Stockport Brinnington & Central Tony Dean BNP 315 6.3% 4 of 6
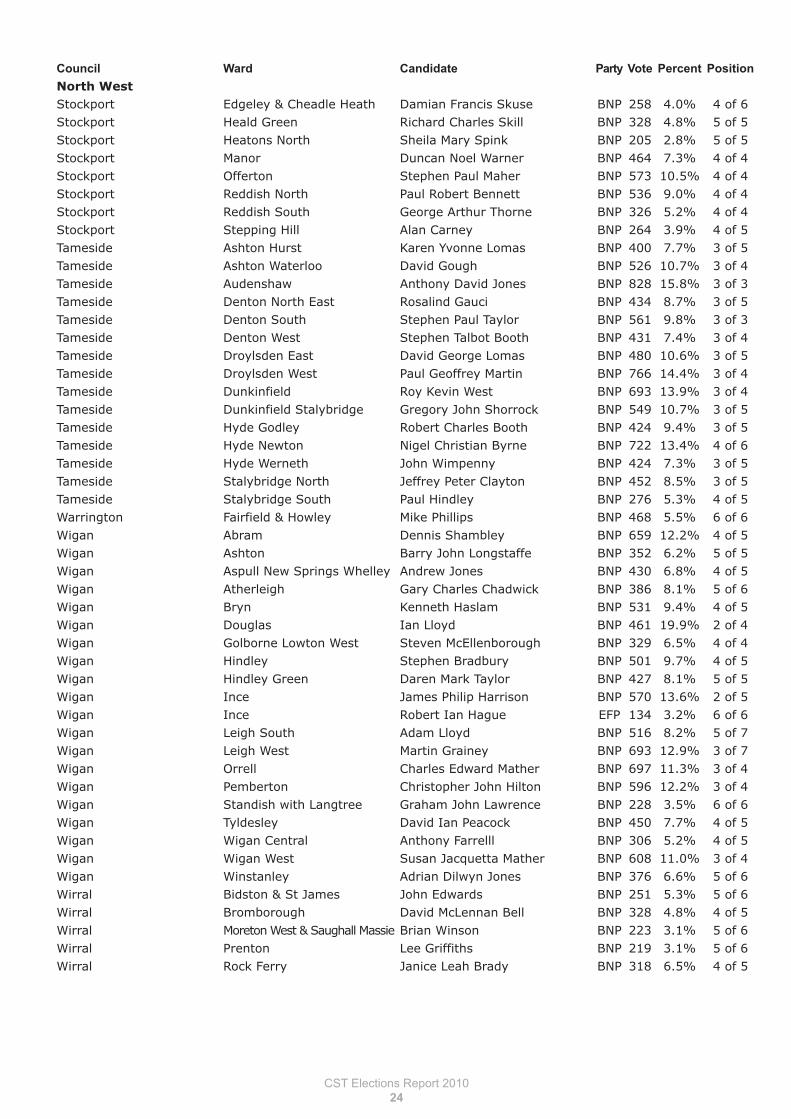
CST Elections Report 2010
24
Council Ward Candidate Party Vote Percent Position
North WestStockport Edgeley & Cheadle Heath Damian Francis Skuse BNP 258 4.0% 4 of 6Stockport Heald Green Richard Charles Skill BNP 328 4.8% 5 of 5Stockport Heatons North Sheila Mary Spink BNP 205 2.8% 5 of 5Stockport Manor Duncan Noel Warner BNP 464 7.3% 4 of 4Stockport Offerton Stephen Paul Maher BNP 573 10.5% 4 of 4Stockport Reddish North Paul Robert Bennett BNP 536 9.0% 4 of 4Stockport Reddish South George Arthur Thorne BNP 326 5.2% 4 of 4Stockport Stepping Hill Alan Carney BNP 264 3.9% 4 of 5Tameside Ashton Hurst Karen Yvonne Lomas BNP 400 7.7% 3 of 5Tameside Ashton Waterloo David Gough BNP 526 10.7% 3 of 4Tameside Audenshaw Anthony David Jones BNP 828 15.8% 3 of 3Tameside Denton North East Rosalind Gauci BNP 434 8.7% 3 of 5Tameside Denton South Stephen Paul Taylor BNP 561 9.8% 3 of 3Tameside Denton West Stephen Talbot Booth BNP 431 7.4% 3 of 4Tameside Droylsden East David George Lomas BNP 480 10.6% 3 of 5Tameside Droylsden West Paul Geoffrey Martin BNP 766 14.4% 3 of 4Tameside Dunkinfield Roy Kevin West BNP 693 13.9% 3 of 4Tameside Dunkinfield Stalybridge Gregory John Shorrock BNP 549 10.7% 3 of 5Tameside Hyde Godley Robert Charles Booth BNP 424 9.4% 3 of 5Tameside Hyde Newton Nigel Christian Byrne BNP 722 13.4% 4 of 6Tameside Hyde Werneth John Wimpenny BNP 424 7.3% 3 of 5Tameside Stalybridge North Jeffrey Peter Clayton BNP 452 8.5% 3 of 5Tameside Stalybridge South Paul Hindley BNP 276 5.3% 4 of 5Warrington Fairfield & Howley Mike Phillips BNP 468 5.5% 6 of 6Wigan Abram Dennis Shambley BNP 659 12.2% 4 of 5Wigan Ashton Barry John Longstaffe BNP 352 6.2% 5 of 5Wigan Aspull New Springs Whelley Andrew Jones BNP 430 6.8% 4 of 5Wigan Atherleigh Gary Charles Chadwick BNP 386 8.1% 5 of 6Wigan Bryn Kenneth Haslam BNP 531 9.4% 4 of 5Wigan Douglas Ian Lloyd BNP 461 19.9% 2 of 4Wigan Golborne Lowton West Steven McEllenborough BNP 329 6.5% 4 of 4Wigan Hindley Stephen Bradbury BNP 501 9.7% 4 of 5Wigan Hindley Green Daren Mark Taylor BNP 427 8.1% 5 of 5Wigan Ince James Philip Harrison BNP 570 13.6% 2 of 5Wigan Ince Robert Ian Hague EFP 134 3.2% 6 of 6Wigan Leigh South Adam Lloyd BNP 516 8.2% 5 of 7Wigan Leigh West Martin Grainey BNP 693 12.9% 3 of 7Wigan Orrell Charles Edward Mather BNP 697 11.3% 3 of 4Wigan Pemberton Christopher John Hilton BNP 596 12.2% 3 of 4Wigan Standish with Langtree Graham John Lawrence BNP 228 3.5% 6 of 6Wigan Tyldesley David Ian Peacock BNP 450 7.7% 4 of 5Wigan Wigan Central Anthony Farrelll BNP 306 5.2% 4 of 5Wigan Wigan West Susan Jacquetta Mather BNP 608 11.0% 3 of 4Wigan Winstanley Adrian Dilwyn Jones BNP 376 6.6% 5 of 6Wirral Bidston & St James John Edwards BNP 251 5.3% 5 of 6Wirral Bromborough David McLennan Bell BNP 328 4.8% 4 of 5Wirral Moreton West & Saughall Massie Brian Winson BNP 223 3.1% 5 of 6Wirral Prenton Lee Griffiths BNP 219 3.1% 5 of 6Wirral Rock Ferry Janice Leah Brady BNP 318 6.5% 4 of 5
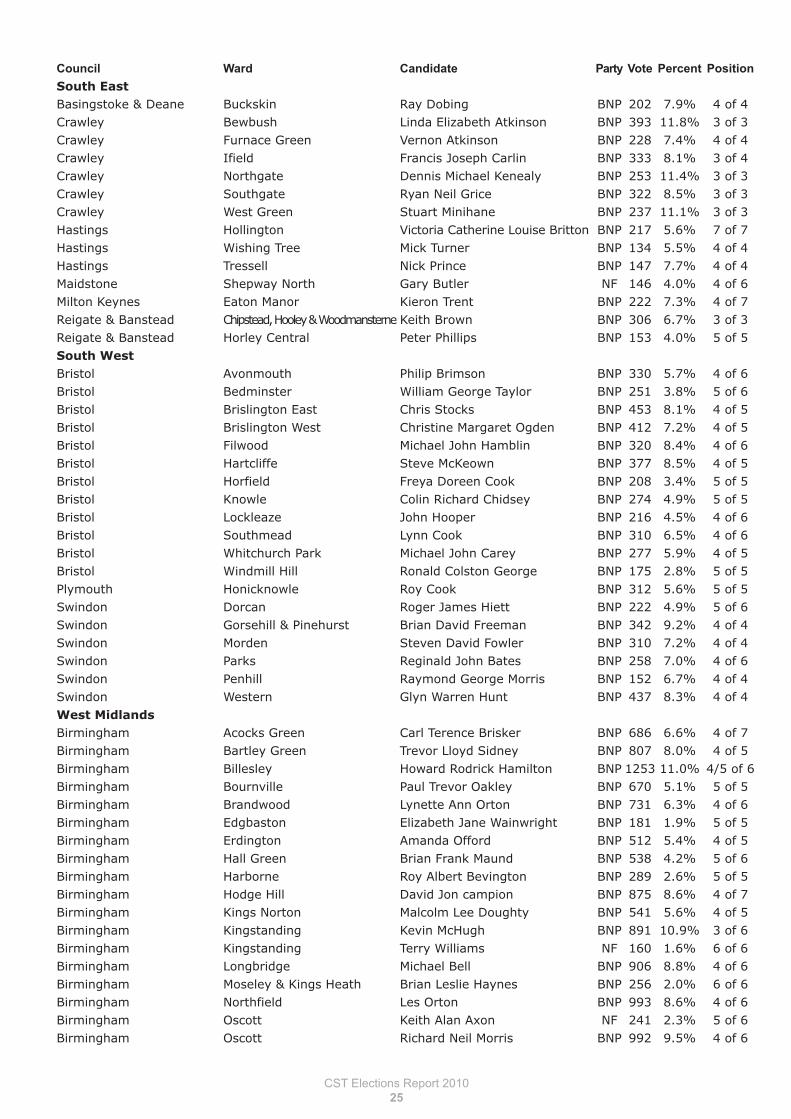
CST Elections Report 2010
25
Council Ward Candidate Party Vote Percent Position
South EastBasingstoke & Deane Buckskin Ray Dobing BNP 202 7.9% 4 of 4Crawley Bewbush Linda Elizabeth Atkinson BNP 393 11.8% 3 of 3Crawley Furnace Green Vernon Atkinson BNP 228 7.4% 4 of 4Crawley Ifield Francis Joseph Carlin BNP 333 8.1% 3 of 4Crawley Northgate Dennis Michael Kenealy BNP 253 11.4% 3 of 3Crawley Southgate Ryan Neil Grice BNP 322 8.5% 3 of 3Crawley West Green Stuart Minihane BNP 237 11.1% 3 of 3Hastings Hollington Victoria Catherine Louise Britton BNP 217 5.6% 7 of 7Hastings Wishing Tree Mick Turner BNP 134 5.5% 4 of 4Hastings Tressell Nick Prince BNP 147 7.7% 4 of 4Maidstone Shepway North Gary Butler NF 146 4.0% 4 of 6Milton Keynes Eaton Manor Kieron Trent BNP 222 7.3% 4 of 7Reigate & Banstead Chipstead, Hooley & Woodmansterne Keith Brown BNP 306 6.7% 3 of 3Reigate & Banstead Horley Central Peter Phillips BNP 153 4.0% 5 of 5South WestBristol Avonmouth Philip Brimson BNP 330 5.7% 4 of 6Bristol Bedminster William George Taylor BNP 251 3.8% 5 of 6Bristol Brislington East Chris Stocks BNP 453 8.1% 4 of 5Bristol Brislington West Christine Margaret Ogden BNP 412 7.2% 4 of 5Bristol Filwood Michael John Hamblin BNP 320 8.4% 4 of 6Bristol Hartcliffe Steve McKeown BNP 377 8.5% 4 of 5Bristol Horfield Freya Doreen Cook BNP 208 3.4% 5 of 5Bristol Knowle Colin Richard Chidsey BNP 274 4.9% 5 of 5Bristol Lockleaze John Hooper BNP 216 4.5% 4 of 6Bristol Southmead Lynn Cook BNP 310 6.5% 4 of 6Bristol Whitchurch Park Michael John Carey BNP 277 5.9% 4 of 5Bristol Windmill Hill Ronald Colston George BNP 175 2.8% 5 of 5Plymouth Honicknowle Roy Cook BNP 312 5.6% 5 of 5Swindon Dorcan Roger James Hiett BNP 222 4.9% 5 of 6Swindon Gorsehill & Pinehurst Brian David Freeman BNP 342 9.2% 4 of 4Swindon Morden Steven David Fowler BNP 310 7.2% 4 of 4Swindon Parks Reginald John Bates BNP 258 7.0% 4 of 6Swindon Penhill Raymond George Morris BNP 152 6.7% 4 of 4Swindon Western Glyn Warren Hunt BNP 437 8.3% 4 of 4West MidlandsBirmingham Acocks Green Carl Terence Brisker BNP 686 6.6% 4 of 7Birmingham Bartley Green Trevor Lloyd Sidney BNP 807 8.0% 4 of 5Birmingham Billesley Howard Rodrick Hamilton BNP 1253 11.0% 4/5 of 6Birmingham Bournville Paul Trevor Oakley BNP 670 5.1% 5 of 5Birmingham Brandwood Lynette Ann Orton BNP 731 6.3% 4 of 6Birmingham Edgbaston Elizabeth Jane Wainwright BNP 181 1.9% 5 of 5Birmingham Erdington Amanda Offord BNP 512 5.4% 4 of 5Birmingham Hall Green Brian Frank Maund BNP 538 4.2% 5 of 6Birmingham Harborne Roy Albert Bevington BNP 289 2.6% 5 of 5Birmingham Hodge Hill David Jon campion BNP 875 8.6% 4 of 7Birmingham Kings Norton Malcolm Lee Doughty BNP 541 5.6% 4 of 5Birmingham Kingstanding Kevin McHugh BNP 891 10.9% 3 of 6Birmingham Kingstanding Terry Williams NF 160 1.6% 6 of 6Birmingham Longbridge Michael Bell BNP 906 8.8% 4 of 6Birmingham Moseley & Kings Heath Brian Leslie Haynes BNP 256 2.0% 6 of 6Birmingham Northfield Les Orton BNP 993 8.6% 4 of 6Birmingham Oscott Keith Alan Axon NF 241 2.3% 5 of 6Birmingham Oscott Richard Neil Morris BNP 992 9.5% 4 of 6
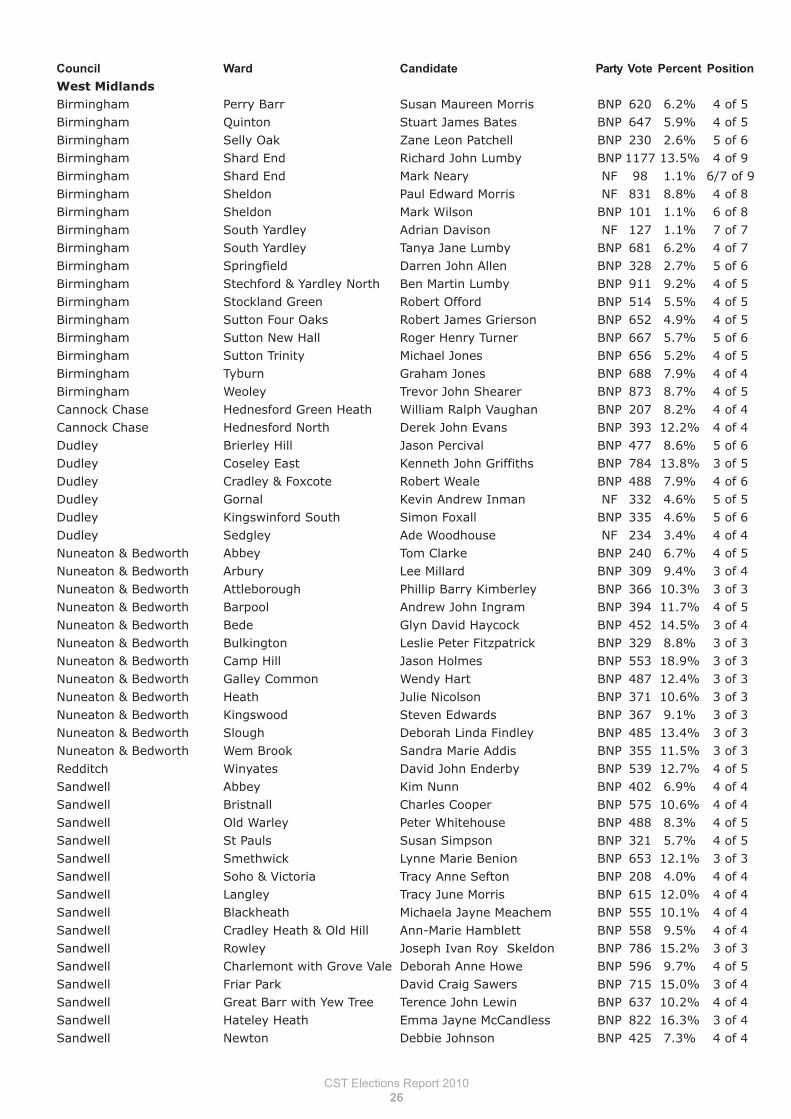
CST Elections Report 2010
26
Council Ward Candidate Party Vote Percent Position
West MidlandsBirmingham Perry Barr Susan Maureen Morris BNP 620 6.2% 4 of 5Birmingham Quinton Stuart James Bates BNP 647 5.9% 4 of 5Birmingham Selly Oak Zane Leon Patchell BNP 230 2.6% 5 of 6Birmingham Shard End Richard John Lumby BNP 1177 13.5% 4 of 9Birmingham Shard End Mark Neary NF 98 1.1% 6/7 of 9Birmingham Sheldon Paul Edward Morris NF 831 8.8% 4 of 8Birmingham Sheldon Mark Wilson BNP 101 1.1% 6 of 8Birmingham South Yardley Adrian Davison NF 127 1.1% 7 of 7Birmingham South Yardley Tanya Jane Lumby BNP 681 6.2% 4 of 7Birmingham Springfield Darren John Allen BNP 328 2.7% 5 of 6Birmingham Stechford & Yardley North Ben Martin Lumby BNP 911 9.2% 4 of 5Birmingham Stockland Green Robert Offord BNP 514 5.5% 4 of 5Birmingham Sutton Four Oaks Robert James Grierson BNP 652 4.9% 4 of 5Birmingham Sutton New Hall Roger Henry Turner BNP 667 5.7% 5 of 6Birmingham Sutton Trinity Michael Jones BNP 656 5.2% 4 of 5Birmingham Tyburn Graham Jones BNP 688 7.9% 4 of 4Birmingham Weoley Trevor John Shearer BNP 873 8.7% 4 of 5Cannock Chase Hednesford Green Heath William Ralph Vaughan BNP 207 8.2% 4 of 4Cannock Chase Hednesford North Derek John Evans BNP 393 12.2% 4 of 4Dudley Brierley Hill Jason Percival BNP 477 8.6% 5 of 6Dudley Coseley East Kenneth John Griffiths BNP 784 13.8% 3 of 5Dudley Cradley & Foxcote Robert Weale BNP 488 7.9% 4 of 6Dudley Gornal Kevin Andrew Inman NF 332 4.6% 5 of 5Dudley Kingswinford South Simon Foxall BNP 335 4.6% 5 of 6Dudley Sedgley Ade Woodhouse NF 234 3.4% 4 of 4Nuneaton & Bedworth Abbey Tom Clarke BNP 240 6.7% 4 of 5Nuneaton & Bedworth Arbury Lee Millard BNP 309 9.4% 3 of 4Nuneaton & Bedworth Attleborough Phillip Barry Kimberley BNP 366 10.3% 3 of 3Nuneaton & Bedworth Barpool Andrew John Ingram BNP 394 11.7% 4 of 5Nuneaton & Bedworth Bede Glyn David Haycock BNP 452 14.5% 3 of 4Nuneaton & Bedworth Bulkington Leslie Peter Fitzpatrick BNP 329 8.8% 3 of 3Nuneaton & Bedworth Camp Hill Jason Holmes BNP 553 18.9% 3 of 3Nuneaton & Bedworth Galley Common Wendy Hart BNP 487 12.4% 3 of 3Nuneaton & Bedworth Heath Julie Nicolson BNP 371 10.6% 3 of 3Nuneaton & Bedworth Kingswood Steven Edwards BNP 367 9.1% 3 of 3Nuneaton & Bedworth Slough Deborah Linda Findley BNP 485 13.4% 3 of 3Nuneaton & Bedworth Wem Brook Sandra Marie Addis BNP 355 11.5% 3 of 3Redditch Winyates David John Enderby BNP 539 12.7% 4 of 5Sandwell Abbey Kim Nunn BNP 402 6.9% 4 of 4Sandwell Bristnall Charles Cooper BNP 575 10.6% 4 of 4Sandwell Old Warley Peter Whitehouse BNP 488 8.3% 4 of 5Sandwell St Pauls Susan Simpson BNP 321 5.7% 4 of 5Sandwell Smethwick Lynne Marie Benion BNP 653 12.1% 3 of 3Sandwell Soho & Victoria Tracy Anne Sefton BNP 208 4.0% 4 of 4Sandwell Langley Tracy June Morris BNP 615 12.0% 4 of 4Sandwell Blackheath Michaela Jayne Meachem BNP 555 10.1% 4 of 4Sandwell Cradley Heath & Old Hill Ann-Marie Hamblett BNP 558 9.5% 4 of 4Sandwell Rowley Joseph Ivan Roy Skeldon BNP 786 15.2% 3 of 3Sandwell Charlemont with Grove Vale Deborah Anne Howe BNP 596 9.7% 4 of 5Sandwell Friar Park David Craig Sawers BNP 715 15.0% 3 of 4Sandwell Great Barr with Yew Tree Terence John Lewin BNP 637 10.2% 4 of 4Sandwell Hateley Heath Emma Jayne McCandless BNP 822 16.3% 3 of 4Sandwell Newton Debbie Johnson BNP 425 7.3% 4 of 4
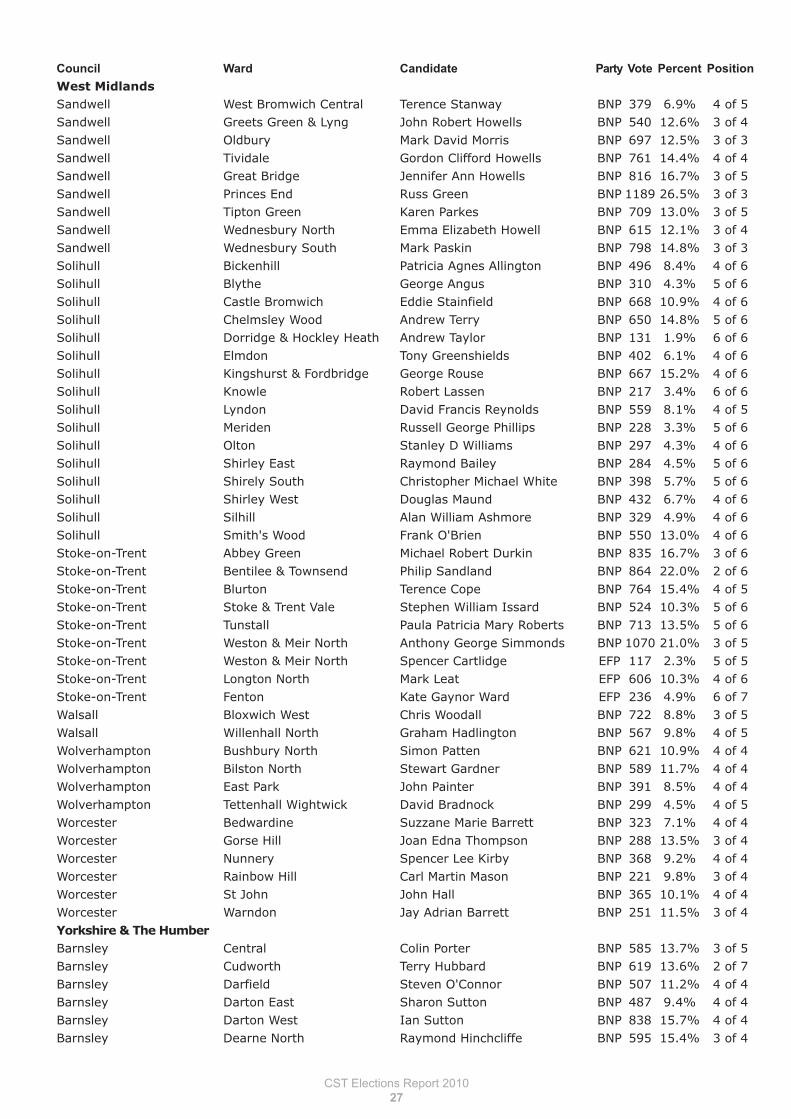
CST Elections Report 2010
27
Council Ward Candidate Party Vote Percent Position
West MidlandsSandwell West Bromwich Central Terence Stanway BNP 379 6.9% 4 of 5Sandwell Greets Green & Lyng John Robert Howells BNP 540 12.6% 3 of 4Sandwell Oldbury Mark David Morris BNP 697 12.5% 3 of 3Sandwell Tividale Gordon Clifford Howells BNP 761 14.4% 4 of 4Sandwell Great Bridge Jennifer Ann Howells BNP 816 16.7% 3 of 5Sandwell Princes End Russ Green BNP 1189 26.5% 3 of 3Sandwell Tipton Green Karen Parkes BNP 709 13.0% 3 of 5Sandwell Wednesbury North Emma Elizabeth Howell BNP 615 12.1% 3 of 4Sandwell Wednesbury South Mark Paskin BNP 798 14.8% 3 of 3Solihull Bickenhill Patricia Agnes Allington BNP 496 8.4% 4 of 6Solihull Blythe George Angus BNP 310 4.3% 5 of 6Solihull Castle Bromwich Eddie Stainfield BNP 668 10.9% 4 of 6Solihull Chelmsley Wood Andrew Terry BNP 650 14.8% 5 of 6Solihull Dorridge & Hockley Heath Andrew Taylor BNP 131 1.9% 6 of 6Solihull Elmdon Tony Greenshields BNP 402 6.1% 4 of 6Solihull Kingshurst & Fordbridge George Rouse BNP 667 15.2% 4 of 6Solihull Knowle Robert Lassen BNP 217 3.4% 6 of 6Solihull Lyndon David Francis Reynolds BNP 559 8.1% 4 of 5Solihull Meriden Russell George Phillips BNP 228 3.3% 5 of 6Solihull Olton Stanley D Williams BNP 297 4.3% 4 of 6Solihull Shirley East Raymond Bailey BNP 284 4.5% 5 of 6Solihull Shirely South Christopher Michael White BNP 398 5.7% 5 of 6Solihull Shirley West Douglas Maund BNP 432 6.7% 4 of 6Solihull Silhill Alan William Ashmore BNP 329 4.9% 4 of 6Solihull Smith's Wood Frank O'Brien BNP 550 13.0% 4 of 6Stoke-on-Trent Abbey Green Michael Robert Durkin BNP 835 16.7% 3 of 6Stoke-on-Trent Bentilee & Townsend Philip Sandland BNP 864 22.0% 2 of 6Stoke-on-Trent Blurton Terence Cope BNP 764 15.4% 4 of 5Stoke-on-Trent Stoke & Trent Vale Stephen William Issard BNP 524 10.3% 5 of 6Stoke-on-Trent Tunstall Paula Patricia Mary Roberts BNP 713 13.5% 5 of 6Stoke-on-Trent Weston & Meir North Anthony George Simmonds BNP 1070 21.0% 3 of 5Stoke-on-Trent Weston & Meir North Spencer Cartlidge EFP 117 2.3% 5 of 5Stoke-on-Trent Longton North Mark Leat EFP 606 10.3% 4 of 6Stoke-on-Trent Fenton Kate Gaynor Ward EFP 236 4.9% 6 of 7Walsall Bloxwich West Chris Woodall BNP 722 8.8% 3 of 5Walsall Willenhall North Graham Hadlington BNP 567 9.8% 4 of 5Wolverhampton Bushbury North Simon Patten BNP 621 10.9% 4 of 4Wolverhampton Bilston North Stewart Gardner BNP 589 11.7% 4 of 4Wolverhampton East Park John Painter BNP 391 8.5% 4 of 4Wolverhampton Tettenhall Wightwick David Bradnock BNP 299 4.5% 4 of 5Worcester Bedwardine Suzzane Marie Barrett BNP 323 7.1% 4 of 4Worcester Gorse Hill Joan Edna Thompson BNP 288 13.5% 3 of 4Worcester Nunnery Spencer Lee Kirby BNP 368 9.2% 4 of 4Worcester Rainbow Hill Carl Martin Mason BNP 221 9.8% 3 of 4Worcester St John John Hall BNP 365 10.1% 4 of 4Worcester Warndon Jay Adrian Barrett BNP 251 11.5% 3 of 4Yorkshire & The HumberBarnsley Central Colin Porter BNP 585 13.7% 3 of 5Barnsley Cudworth Terry Hubbard BNP 619 13.6% 2 of 7Barnsley Darfield Steven O'Connor BNP 507 11.2% 4 of 4Barnsley Darton East Sharon Sutton BNP 487 9.4% 4 of 4Barnsley Darton West Ian Sutton BNP 838 15.7% 4 of 4Barnsley Dearne North Raymond Hinchcliffe BNP 595 15.4% 3 of 4
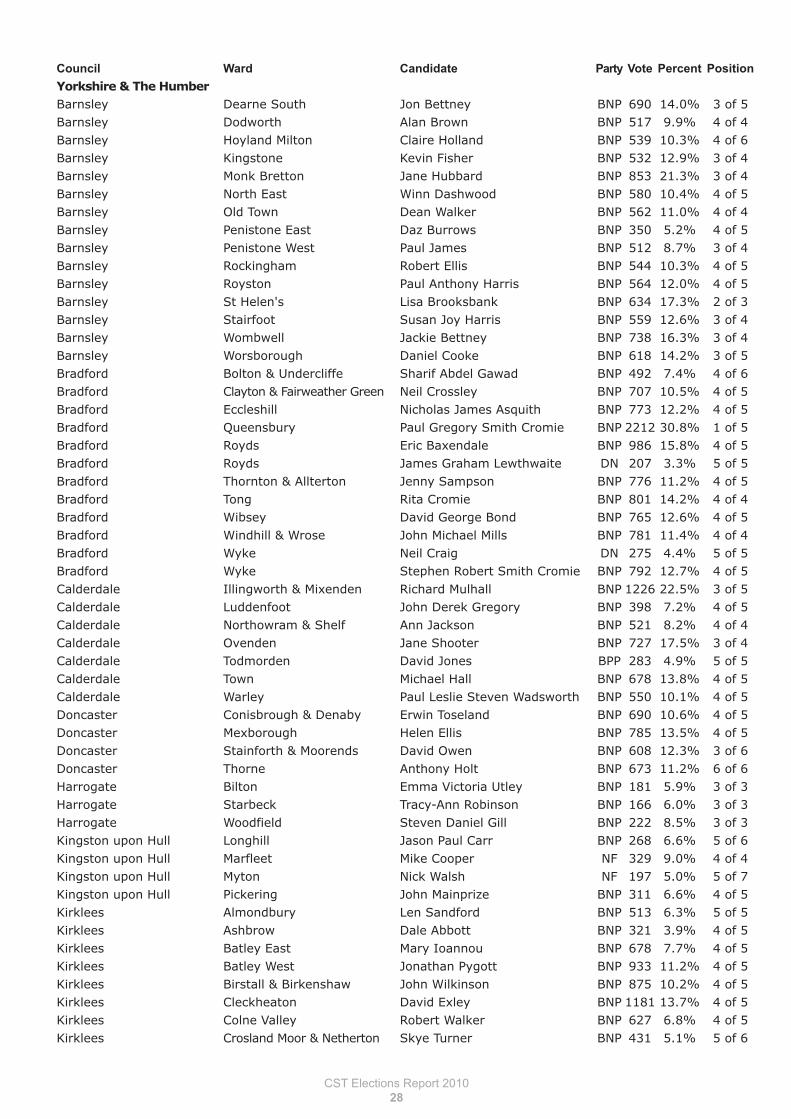
CST Elections Report 2010
28
Council Ward Candidate Party Vote Percent Position
Yorkshire & The HumberBarnsley Dearne South Jon Bettney BNP 690 14.0% 3 of 5Barnsley Dodworth Alan Brown BNP 517 9.9% 4 of 4Barnsley Hoyland Milton Claire Holland BNP 539 10.3% 4 of 6Barnsley Kingstone Kevin Fisher BNP 532 12.9% 3 of 4Barnsley Monk Bretton Jane Hubbard BNP 853 21.3% 3 of 4Barnsley North East Winn Dashwood BNP 580 10.4% 4 of 5Barnsley Old Town Dean Walker BNP 562 11.0% 4 of 4Barnsley Penistone East Daz Burrows BNP 350 5.2% 4 of 5Barnsley Penistone West Paul James BNP 512 8.7% 3 of 4Barnsley Rockingham Robert Ellis BNP 544 10.3% 4 of 5Barnsley Royston Paul Anthony Harris BNP 564 12.0% 4 of 5Barnsley St Helen's Lisa Brooksbank BNP 634 17.3% 2 of 3Barnsley Stairfoot Susan Joy Harris BNP 559 12.6% 3 of 4Barnsley Wombwell Jackie Bettney BNP 738 16.3% 3 of 4Barnsley Worsborough Daniel Cooke BNP 618 14.2% 3 of 5Bradford Bolton & Undercliffe Sharif Abdel Gawad BNP 492 7.4% 4 of 6Bradford Clayton & Fairweather Green Neil Crossley BNP 707 10.5% 4 of 5Bradford Eccleshill Nicholas James Asquith BNP 773 12.2% 4 of 5Bradford Queensbury Paul Gregory Smith Cromie BNP 2212 30.8% 1 of 5Bradford Royds Eric Baxendale BNP 986 15.8% 4 of 5Bradford Royds James Graham Lewthwaite DN 207 3.3% 5 of 5Bradford Thornton & Allterton Jenny Sampson BNP 776 11.2% 4 of 5Bradford Tong Rita Cromie BNP 801 14.2% 4 of 4Bradford Wibsey David George Bond BNP 765 12.6% 4 of 5Bradford Windhill & Wrose John Michael Mills BNP 781 11.4% 4 of 4Bradford Wyke Neil Craig DN 275 4.4% 5 of 5Bradford Wyke Stephen Robert Smith Cromie BNP 792 12.7% 4 of 5Calderdale Illingworth & Mixenden Richard Mulhall BNP 1226 22.5% 3 of 5Calderdale Luddenfoot John Derek Gregory BNP 398 7.2% 4 of 5Calderdale Northowram & Shelf Ann Jackson BNP 521 8.2% 4 of 4Calderdale Ovenden Jane Shooter BNP 727 17.5% 3 of 4Calderdale Todmorden David Jones BPP 283 4.9% 5 of 5Calderdale Town Michael Hall BNP 678 13.8% 4 of 5Calderdale Warley Paul Leslie Steven Wadsworth BNP 550 10.1% 4 of 5Doncaster Conisbrough & Denaby Erwin Toseland BNP 690 10.6% 4 of 5Doncaster Mexborough Helen Ellis BNP 785 13.5% 4 of 5Doncaster Stainforth & Moorends David Owen BNP 608 12.3% 3 of 6Doncaster Thorne Anthony Holt BNP 673 11.2% 6 of 6Harrogate Bilton Emma Victoria Utley BNP 181 5.9% 3 of 3Harrogate Starbeck Tracy-Ann Robinson BNP 166 6.0% 3 of 3Harrogate Woodfield Steven Daniel Gill BNP 222 8.5% 3 of 3Kingston upon Hull Longhill Jason Paul Carr BNP 268 6.6% 5 of 6Kingston upon Hull Marfleet Mike Cooper NF 329 9.0% 4 of 4Kingston upon Hull Myton Nick Walsh NF 197 5.0% 5 of 7Kingston upon Hull Pickering John Mainprize BNP 311 6.6% 4 of 5Kirklees Almondbury Len Sandford BNP 513 6.3% 5 of 5Kirklees Ashbrow Dale Abbott BNP 321 3.9% 4 of 5Kirklees Batley East Mary Ioannou BNP 678 7.7% 4 of 5Kirklees Batley West Jonathan Pygott BNP 933 11.2% 4 of 5Kirklees Birstall & Birkenshaw John Wilkinson BNP 875 10.2% 4 of 5Kirklees Cleckheaton David Exley BNP 1181 13.7% 4 of 5Kirklees Colne Valley Robert Walker BNP 627 6.8% 4 of 5Kirklees Crosland Moor & Netherton Skye Turner BNP 431 5.1% 5 of 6
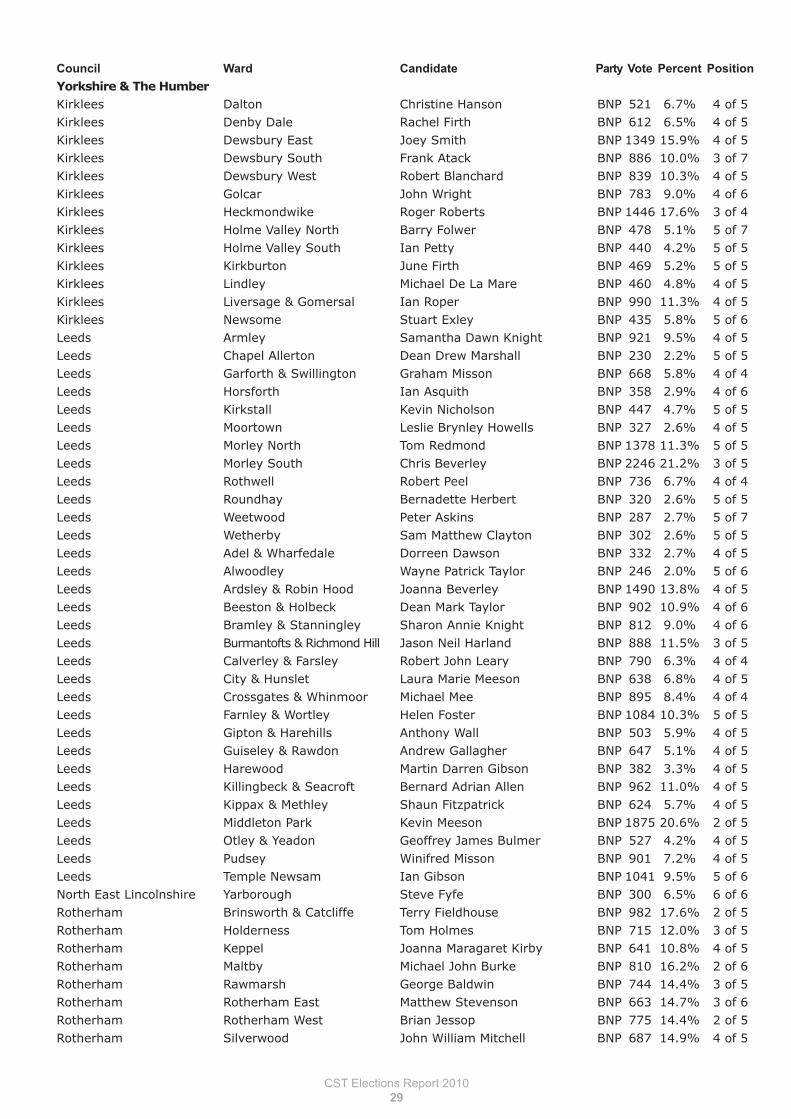
CST Elections Report 2010
29
Council Ward Candidate Party Vote Percent Position
Yorkshire & The HumberKirklees Dalton Christine Hanson BNP 521 6.7% 4 of 5Kirklees Denby Dale Rachel Firth BNP 612 6.5% 4 of 5Kirklees Dewsbury East Joey Smith BNP 1349 15.9% 4 of 5Kirklees Dewsbury South Frank Atack BNP 886 10.0% 3 of 7Kirklees Dewsbury West Robert Blanchard BNP 839 10.3% 4 of 5Kirklees Golcar John Wright BNP 783 9.0% 4 of 6Kirklees Heckmondwike Roger Roberts BNP 1446 17.6% 3 of 4Kirklees Holme Valley North Barry Folwer BNP 478 5.1% 5 of 7Kirklees Holme Valley South Ian Petty BNP 440 4.2% 5 of 5Kirklees Kirkburton June Firth BNP 469 5.2% 5 of 5Kirklees Lindley Michael De La Mare BNP 460 4.8% 4 of 5Kirklees Liversage & Gomersal Ian Roper BNP 990 11.3% 4 of 5Kirklees Newsome Stuart Exley BNP 435 5.8% 5 of 6Leeds Armley Samantha Dawn Knight BNP 921 9.5% 4 of 5Leeds Chapel Allerton Dean Drew Marshall BNP 230 2.2% 5 of 5Leeds Garforth & Swillington Graham Misson BNP 668 5.8% 4 of 4Leeds Horsforth Ian Asquith BNP 358 2.9% 4 of 6Leeds Kirkstall Kevin Nicholson BNP 447 4.7% 5 of 5Leeds Moortown Leslie Brynley Howells BNP 327 2.6% 4 of 5Leeds Morley North Tom Redmond BNP 1378 11.3% 5 of 5Leeds Morley South Chris Beverley BNP 2246 21.2% 3 of 5Leeds Rothwell Robert Peel BNP 736 6.7% 4 of 4Leeds Roundhay Bernadette Herbert BNP 320 2.6% 5 of 5Leeds Weetwood Peter Askins BNP 287 2.7% 5 of 7Leeds Wetherby Sam Matthew Clayton BNP 302 2.6% 5 of 5Leeds Adel & Wharfedale Dorreen Dawson BNP 332 2.7% 4 of 5Leeds Alwoodley Wayne Patrick Taylor BNP 246 2.0% 5 of 6Leeds Ardsley & Robin Hood Joanna Beverley BNP 1490 13.8% 4 of 5Leeds Beeston & Holbeck Dean Mark Taylor BNP 902 10.9% 4 of 6Leeds Bramley & Stanningley Sharon Annie Knight BNP 812 9.0% 4 of 6Leeds Burmantofts & Richmond Hill Jason Neil Harland BNP 888 11.5% 3 of 5Leeds Calverley & Farsley Robert John Leary BNP 790 6.3% 4 of 4Leeds City & Hunslet Laura Marie Meeson BNP 638 6.8% 4 of 5Leeds Crossgates & Whinmoor Michael Mee BNP 895 8.4% 4 of 4Leeds Farnley & Wortley Helen Foster BNP 1084 10.3% 5 of 5Leeds Gipton & Harehills Anthony Wall BNP 503 5.9% 4 of 5Leeds Guiseley & Rawdon Andrew Gallagher BNP 647 5.1% 4 of 5Leeds Harewood Martin Darren Gibson BNP 382 3.3% 4 of 5Leeds Killingbeck & Seacroft Bernard Adrian Allen BNP 962 11.0% 4 of 5Leeds Kippax & Methley Shaun Fitzpatrick BNP 624 5.7% 4 of 5Leeds Middleton Park Kevin Meeson BNP 1875 20.6% 2 of 5Leeds Otley & Yeadon Geoffrey James Bulmer BNP 527 4.2% 4 of 5Leeds Pudsey Winifred Misson BNP 901 7.2% 4 of 5Leeds Temple Newsam Ian Gibson BNP 1041 9.5% 5 of 6North East Lincolnshire Yarborough Steve Fyfe BNP 300 6.5% 6 of 6Rotherham Brinsworth & Catcliffe Terry Fieldhouse BNP 982 17.6% 2 of 5Rotherham Holderness Tom Holmes BNP 715 12.0% 3 of 5Rotherham Keppel Joanna Maragaret Kirby BNP 641 10.8% 4 of 5Rotherham Maltby Michael John Burke BNP 810 16.2% 2 of 6Rotherham Rawmarsh George Baldwin BNP 744 14.4% 3 of 5Rotherham Rotherham East Matthew Stevenson BNP 663 14.7% 3 of 6Rotherham Rotherham West Brian Jessop BNP 775 14.4% 2 of 5Rotherham Silverwood John William Mitchell BNP 687 14.9% 4 of 5
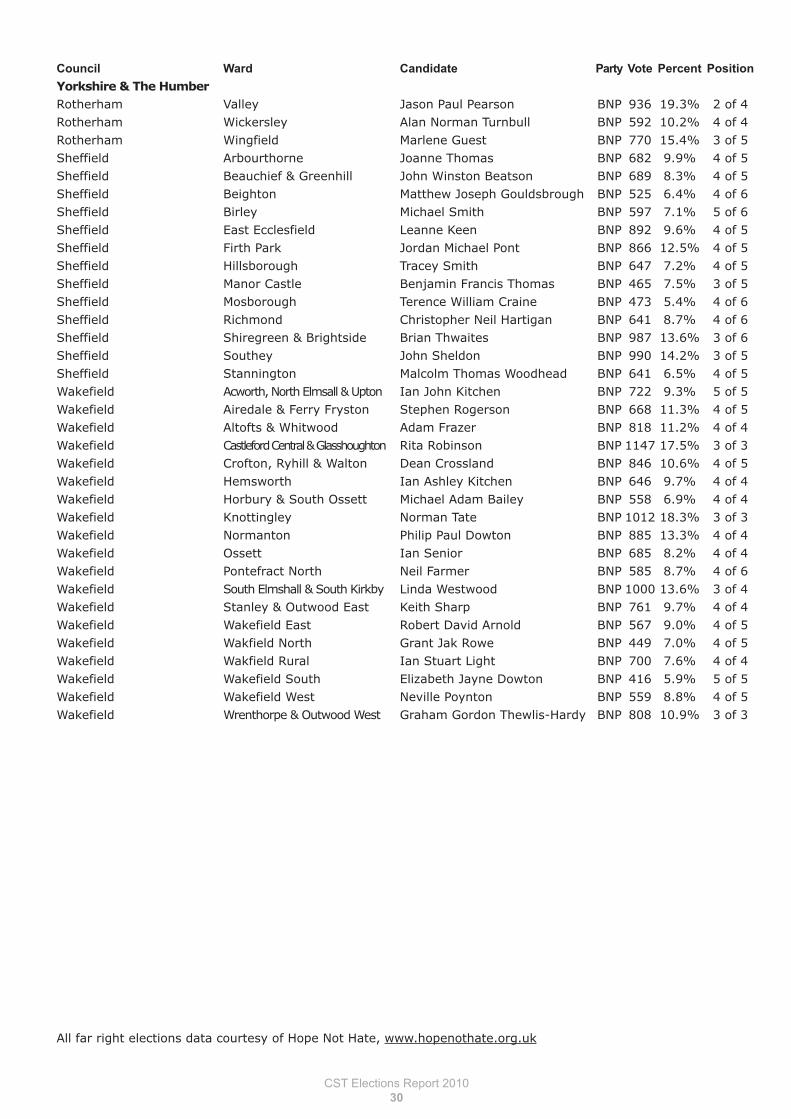
CST Elections Report 2010
30
Council Ward Candidate Party Vote Percent Position
Yorkshire & The HumberRotherham Valley Jason Paul Pearson BNP 936 19.3% 2 of 4Rotherham Wickersley Alan Norman Turnbull BNP 592 10.2% 4 of 4Rotherham Wingfield Marlene Guest BNP 770 15.4% 3 of 5Sheffield Arbourthorne Joanne Thomas BNP 682 9.9% 4 of 5Sheffield Beauchief & Greenhill John Winston Beatson BNP 689 8.3% 4 of 5Sheffield Beighton Matthew Joseph Gouldsbrough BNP 525 6.4% 4 of 6Sheffield Birley Michael Smith BNP 597 7.1% 5 of 6Sheffield East Ecclesfield Leanne Keen BNP 892 9.6% 4 of 5Sheffield Firth Park Jordan Michael Pont BNP 866 12.5% 4 of 5Sheffield Hillsborough Tracey Smith BNP 647 7.2% 4 of 5Sheffield Manor Castle Benjamin Francis Thomas BNP 465 7.5% 3 of 5Sheffield Mosborough Terence William Craine BNP 473 5.4% 4 of 6Sheffield Richmond Christopher Neil Hartigan BNP 641 8.7% 4 of 6Sheffield Shiregreen & Brightside Brian Thwaites BNP 987 13.6% 3 of 6Sheffield Southey John Sheldon BNP 990 14.2% 3 of 5Sheffield Stannington Malcolm Thomas Woodhead BNP 641 6.5% 4 of 5Wakefield Acworth, North Elmsall & Upton Ian John Kitchen BNP 722 9.3% 5 of 5Wakefield Airedale & Ferry Fryston Stephen Rogerson BNP 668 11.3% 4 of 5Wakefield Altofts & Whitwood Adam Frazer BNP 818 11.2% 4 of 4Wakefield Castleford Central & Glasshoughton Rita Robinson BNP 1147 17.5% 3 of 3Wakefield Crofton, Ryhill & Walton Dean Crossland BNP 846 10.6% 4 of 5Wakefield Hemsworth Ian Ashley Kitchen BNP 646 9.7% 4 of 4Wakefield Horbury & South Ossett Michael Adam Bailey BNP 558 6.9% 4 of 4Wakefield Knottingley Norman Tate BNP 1012 18.3% 3 of 3Wakefield Normanton Philip Paul Dowton BNP 885 13.3% 4 of 4Wakefield Ossett Ian Senior BNP 685 8.2% 4 of 4Wakefield Pontefract North Neil Farmer BNP 585 8.7% 4 of 6Wakefield South Elmshall & South Kirkby Linda Westwood BNP 1000 13.6% 3 of 4Wakefield Stanley & Outwood East Keith Sharp BNP 761 9.7% 4 of 4Wakefield Wakefield East Robert David Arnold BNP 567 9.0% 4 of 5Wakefield Wakfield North Grant Jak Rowe BNP 449 7.0% 4 of 5Wakefield Wakfield Rural Ian Stuart Light BNP 700 7.6% 4 of 4Wakefield Wakefield South Elizabeth Jayne Dowton BNP 416 5.9% 5 of 5Wakefield Wakefield West Neville Poynton BNP 559 8.8% 4 of 5Wakefield Wrenthorpe & Outwood West Graham Gordon Thewlis-Hardy BNP 808 10.9% 3 of 3
All far right elections data courtesy of Hope Not Hate, www.hopenothate.org.uk
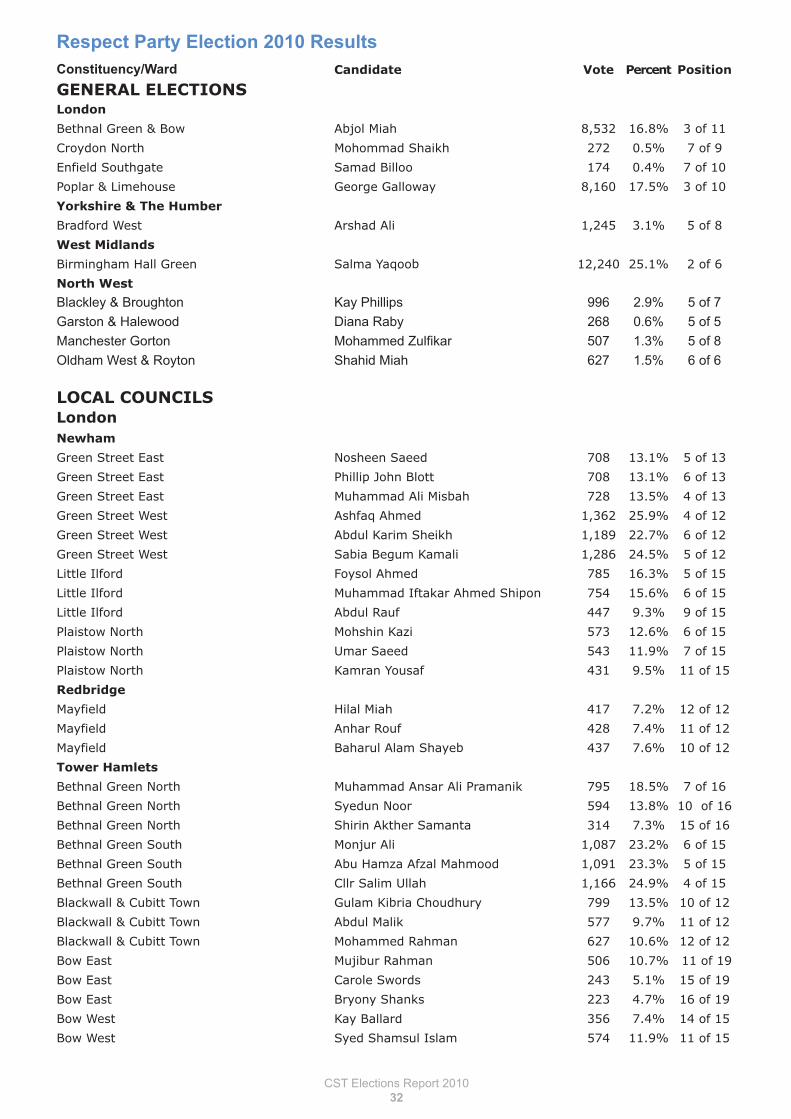
CST Elections Report 2010
32
Constituency/Ward Candidate Vote Percent Position
GENERAL ELECTIONSLondon
Bethnal Green & Bow Abjol Miah 8,532 16.8% 3 of 11
Croydon North Mohommad Shaikh 272 0.5% 7 of 9
Enfield Southgate Samad Billoo 174 0.4% 7 of 10
Poplar & Limehouse George Galloway 8,160 17.5% 3 of 10
Yorkshire & The Humber
Bradford West Arshad Ali 1,245 3.1% 5 of 8
West Midlands
Birmingham Hall Green Salma Yaqoob 12,240 25.1% 2 of 6
North West
Blackley & Broughton Kay Phillips 996 2.9% 5 of 7
Garston & Halewood Diana Raby 268 0.6% 5 of 5
Manchester Gorton Mohammed Zulfikar 507 1.3% 5 of 8
Oldham West & Royton Shahid Miah 627 1.5% 6 of 6
LOCAL COUNCILSLondonNewham
Green Street East Nosheen Saeed 708 13.1% 5 of 13
Green Street East Phillip John Blott 708 13.1% 6 of 13
Green Street East Muhammad Ali Misbah 728 13.5% 4 of 13
Green Street West Ashfaq Ahmed 1,362 25.9% 4 of 12
Green Street West Abdul Karim Sheikh 1,189 22.7% 6 of 12
Green Street West Sabia Begum Kamali 1,286 24.5% 5 of 12
Little Ilford Foysol Ahmed 785 16.3% 5 of 15
Little Ilford Muhammad Iftakar Ahmed Shipon 754 15.6% 6 of 15
Little Ilford Abdul Rauf 447 9.3% 9 of 15
Plaistow North Mohshin Kazi 573 12.6% 6 of 15
Plaistow North Umar Saeed 543 11.9% 7 of 15
Plaistow North Kamran Yousaf 431 9.5% 11 of 15
Redbridge
Mayfield Hilal Miah 417 7.2% 12 of 12
Mayfield Anhar Rouf 428 7.4% 11 of 12
Mayfield Baharul Alam Shayeb 437 7.6% 10 of 12
Tower Hamlets
Bethnal Green North Muhammad Ansar Ali Pramanik 795 18.5% 7 of 16
Bethnal Green North Syedun Noor 594 13.8% 10 of 16
Bethnal Green North Shirin Akther Samanta 314 7.3% 15 of 16
Bethnal Green South Monjur Ali 1,087 23.2% 6 of 15
Bethnal Green South Abu Hamza Afzal Mahmood 1,091 23.3% 5 of 15
Bethnal Green South Cllr Salim Ullah 1,166 24.9% 4 of 15
Blackwall & Cubitt Town Gulam Kibria Choudhury 799 13.5% 10 of 12
Blackwall & Cubitt Town Abdul Malik 577 9.7% 11 of 12
Blackwall & Cubitt Town Mohammed Rahman 627 10.6% 12 of 12
Bow East Mujibur Rahman 506 10.7% 11 of 19
Bow East Carole Swords 243 5.1% 15 of 19
Bow East Bryony Shanks 223 4.7% 16 of 19
Bow West Kay Ballard 356 7.4% 14 of 15
Bow West Syed Shamsul Islam 574 11.9% 11 of 15
Respect Party Election 2010 Results
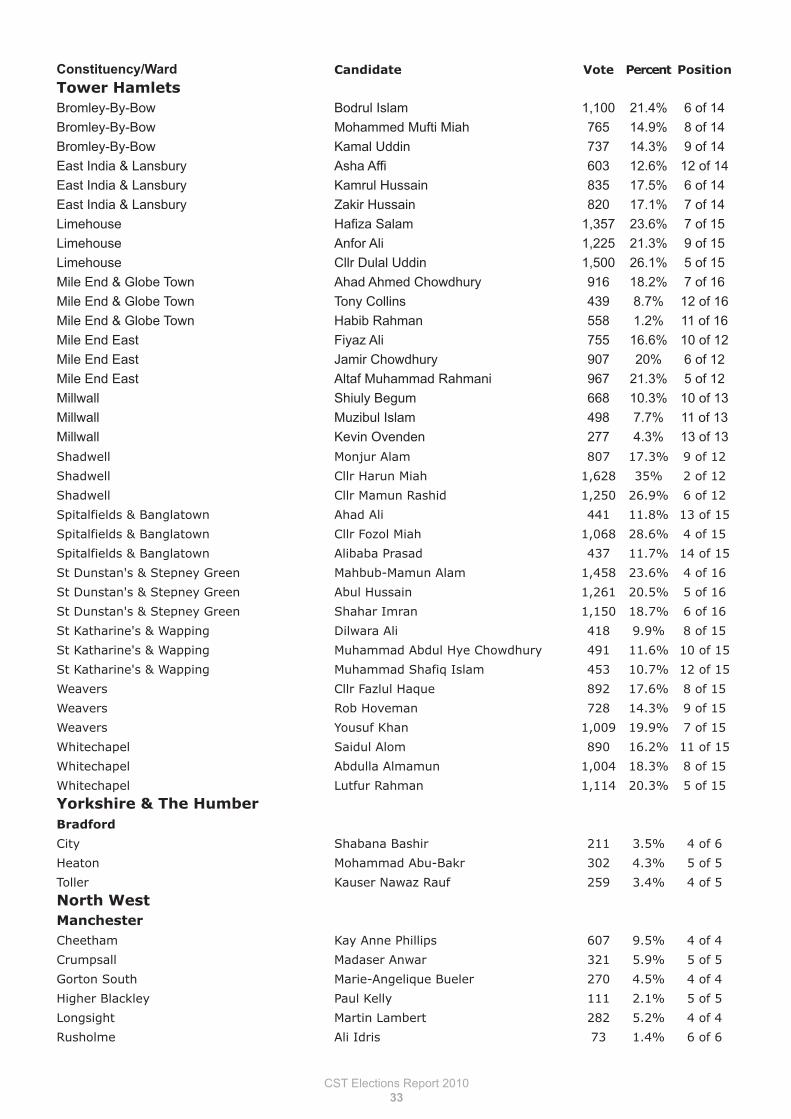
Constituency/Ward Candidate Vote Percent Position
Tower HamletsBromley-By-Bow Bodrul Islam 1,100 21.4% 6 of 14
Bromley-By-Bow Mohammed Mufti Miah 765 14.9% 8 of 14
Bromley-By-Bow Kamal Uddin 737 14.3% 9 of 14
East India & Lansbury Asha Affi 603 12.6% 12 of 14
East India & Lansbury Kamrul Hussain 835 17.5% 6 of 14
East India & Lansbury Zakir Hussain 820 17.1% 7 of 14
Limehouse Hafiza Salam 1,357 23.6% 7 of 15
Limehouse Anfor Ali 1,225 21.3% 9 of 15
Limehouse Cllr Dulal Uddin 1,500 26.1% 5 of 15
Mile End & Globe Town Ahad Ahmed Chowdhury 916 18.2% 7 of 16
Mile End & Globe Town Tony Collins 439 8.7% 12 of 16
Mile End & Globe Town Habib Rahman 558 1.2% 11 of 16
Mile End East Fiyaz Ali 755 16.6% 10 of 12
Mile End East Jamir Chowdhury 907 20% 6 of 12
Mile End East Altaf Muhammad Rahmani 967 21.3% 5 of 12
Millwall Shiuly Begum 668 10.3% 10 of 13
Millwall Muzibul Islam 498 7.7% 11 of 13
Millwall Kevin Ovenden 277 4.3% 13 of 13
Shadwell Monjur Alam 807 17.3% 9 of 12
Shadwell Cllr Harun Miah 1,628 35% 2 of 12
Shadwell Cllr Mamun Rashid 1,250 26.9% 6 of 12
Spitalfields & Banglatown Ahad Ali 441 11.8% 13 of 15
Spitalfields & Banglatown Cllr Fozol Miah 1,068 28.6% 4 of 15
Spitalfields & Banglatown Alibaba Prasad 437 11.7% 14 of 15
St Dunstan's & Stepney Green Mahbub-Mamun Alam 1,458 23.6% 4 of 16
St Dunstan's & Stepney Green Abul Hussain 1,261 20.5% 5 of 16
St Dunstan's & Stepney Green Shahar Imran 1,150 18.7% 6 of 16
St Katharine's & Wapping Dilwara Ali 418 9.9% 8 of 15
St Katharine's & Wapping Muhammad Abdul Hye Chowdhury 491 11.6% 10 of 15
St Katharine's & Wapping Muhammad Shafiq Islam 453 10.7% 12 of 15
Weavers Cllr Fazlul Haque 892 17.6% 8 of 15
Weavers Rob Hoveman 728 14.3% 9 of 15
Weavers Yousuf Khan 1,009 19.9% 7 of 15
Whitechapel Saidul Alom 890 16.2% 11 of 15
Whitechapel Abdulla Almamun 1,004 18.3% 8 of 15
Whitechapel Lutfur Rahman 1,114 20.3% 5 of 15
Yorkshire & The HumberBradford
City Shabana Bashir 211 3.5% 4 of 6
Heaton Mohammad Abu-Bakr 302 4.3% 5 of 5
Toller Kauser Nawaz Rauf 259 3.4% 4 of 5
North WestManchesterCheetham Kay Anne Phillips 607 9.5% 4 of 4
Crumpsall Madaser Anwar 321 5.9% 5 of 5
Gorton South Marie-Angelique Bueler 270 4.5% 4 of 4
Higher Blackley Paul Kelly 111 2.1% 5 of 5
Longsight Martin Lambert 282 5.2% 4 of 4
Rusholme Ali Idris 73 1.4% 6 of 6
CST Elections Report 2010
33
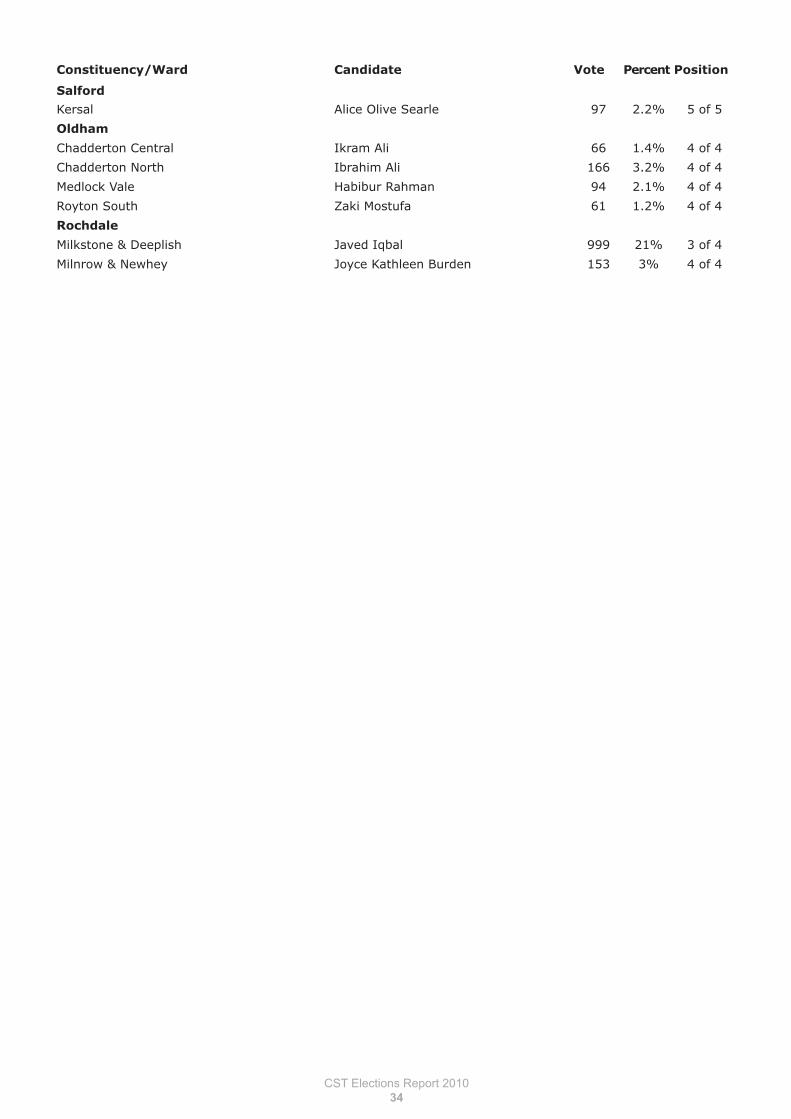
Constituency/Ward Candidate Vote Percent Position
Salford
Kersal Alice Olive Searle 97 2.2% 5 of 5
Oldham
Chadderton Central Ikram Ali 66 1.4% 4 of 4
Chadderton North Ibrahim Ali 166 3.2% 4 of 4
Medlock Vale Habibur Rahman 94 2.1% 4 of 4
Royton South Zaki Mostufa 61 1.2% 4 of 4
Rochdale
Milkstone & Deeplish Javed Iqbal 999 21% 3 of 4
Milnrow & Newhey Joyce Kathleen Burden 153 3% 4 of 4
CST Elections Report 2010
34
The following publications are available on CST’s website (www.thecst.org.uk)
or in hard copy on request
Perspectives
on antisemitism
Perspectives
on antisemitism, racism
and society from some
of the members of CST's
Advisory Board.
Cartoons and Extremism
by Joel Kotek
A CST, European Jewish
Congress and Anti Defamation League
co-sponsored publication, looking at antisemitic
themes in anti-Israel cartoons
A Police Officer's Guide
to Judaism
A publication which
introduces Police officers
to the laws and traditions
of Judaism.
A Student's Guide
to Antisemitism
on Campus
A guide telling students
what to do if they suffer
antisemitism
Antisemitic Incidents
Report 2009
The annual Antisemitic
Incidents Report
is CST’s most significant
publication.
Antisemitic
Discourse in Britain
An annual report into
antisemitic language
and imagery in main-
stream public debate
CST Publications
For news and updates visit the CST blog at www.thecst.org.uk/blog