electric light sport aircraft the flyin’ lion
TRANSCRIPT
AERSP 402B Detailed Aircraft Design
Electric Light Sport Aircraft The Flyin’ Lion
March 16, 2012
Group Members David Baver
Christopher Gumke Alex Karns Mike Disori
Harshad Kapoor Stephen Barr
TA: Kirk Miles
Course Instructor: Dr. Maughmer, Dr. Langelaan
Page 2 of 63
Executive Summary
Electric aircraft are now becoming more popular and feasible. With the improvement of
energy density and charge times of batteries, the electric aircraft has developed a niche in the
light sport aircraft market. This electric light sport aircraft, known as the Flyin’ Lion, is an all-
electric trainer with an innovative design. Concept studies introduced many parent aircraft into
this design process. Aircraft ranging from the Piper J-3 Cub to the Pipistrel G2 Taurus were
studied to optimize and create the best light sport aircraft possible while continuing to meet the
FAA and FAR requirements.
Preliminary sizing was based on the parent aircraft designs to try to come up with an
optimal configuration, which resulted in the Flyin’ Lion. With its natural laminar flow airfoils
and an aerodynamic shape, the Flyin’ Lions’ strong performance characteristics outperform the
competition. The Flyin’ Lion has a very short take-off and landing distance, and performs well
for an electric light sport aircraft, having a battery life of two and a half hours with two 200
pound people onboard, with a back-up battery pack that is able to last for ten minutes.
In terms of performance, the Flyin’ Lion is capable of matching most conventional fuel
burning aircraft. It has an 81 horsepower power plant that allows the Lion to obtain the
maximum speed allowable for a light sport aircraft. This aircraft is a pure joy to fly, and
continues to outperform the competition.

Page 3 of 63
Table of Contents
Aircraft Mission Description ......................................................................................................................... 1
Concept Studies ............................................................................................................................................ 4
Procedure Outline ....................................................................................................................................... 11
Performance ........................................................................................................................................... 11
Stability & Control ................................................................................................................................... 19
Aileron Sizing ........................................................................................................................................... 21
Rudder Sizing........................................................................................................................................... 21
Motor, Controller, and Batteries ................................................................................................................ 22
Specifications .............................................................................................................................................. 23
Drag ......................................................................................................................................................... 26
Power ...................................................................................................................................................... 27
Rate of Climb ........................................................................................................................................... 30
Stall Speed ............................................................................................................................................... 32
Lift to Drag Ratio ..................................................................................................................................... 33
Range ...................................................................................................................................................... 34
Lift Curves and Drag Polars ..................................................................................................................... 35
Turning Performance .................................................................................................................................. 38
Flight and Gust Envelope ............................................................................................................................ 40
Weight and Cost Estimation ....................................................................................................................... 41
Design Philosophy ....................................................................................................................................... 46
Weights ................................................................................................................................................... 47
Wing Configuration and Planform .......................................................................................................... 47
Fuselage and Cabin Design ..................................................................................................................... 48
Tail Design ............................................................................................................................................... 50
Batteries and Electric Motor System ...................................................................................................... 51
Innovations in the Design ....................................................................................................................... 53
Focus of the Design ................................................................................................................................. 53

Page 4 of 63
References .................................................................................................................................................. 55
Appendix I: Aircraft Specifications .............................................................................................................. 58
Appendix II: Panel Method for Windows .................................................................................................... 60
Appendix III: X-Foil ...................................................................................................................................... 61
Appendix IV: Aileron Roll Rate Calculations................................................................................................ 62
Page 1 of 63
Aircraft Mission Description
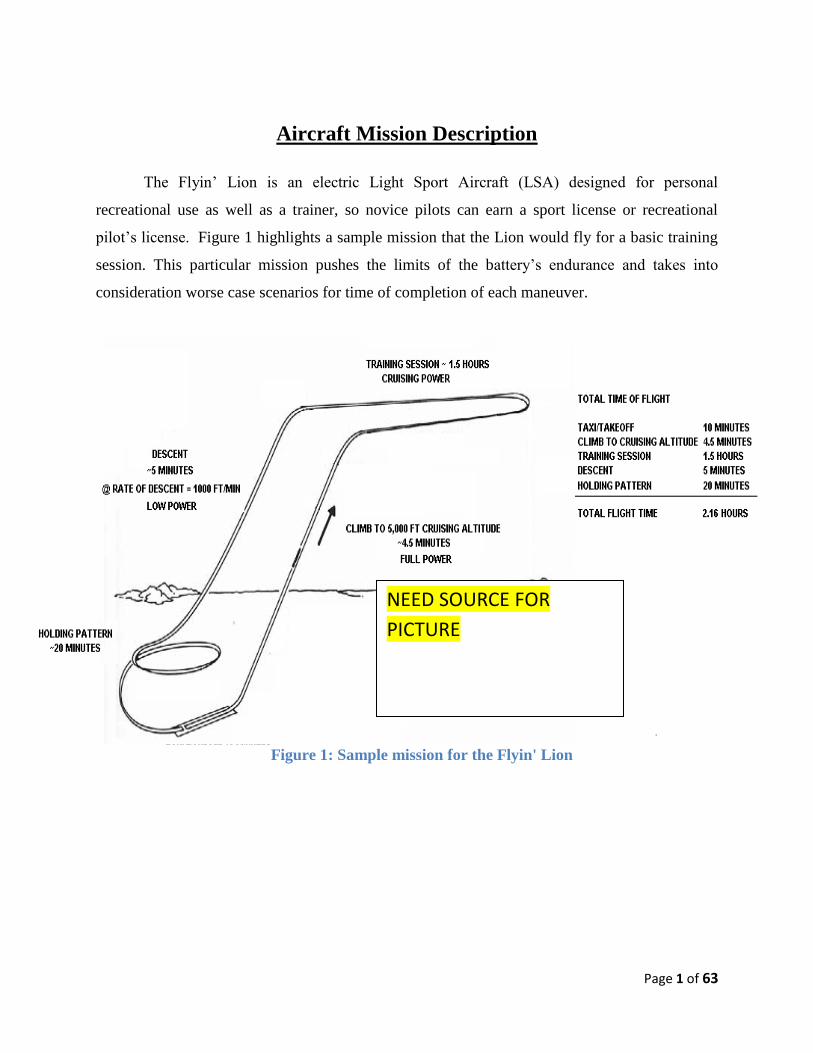
The Flyin’ Lion is an electric Light Sport Aircraft (LSA) designed for personal
recreational use as well as a trainer, so novice pilots can earn a sport license or recreational
pilot’s license. Figure 1 highlights a sample mission that the Lion would fly for a basic training
session. This particular mission pushes the limits of the battery’s endurance and takes into
consideration worse case scenarios for time of completion of each maneuver.
Figure 1: Sample mission for the Flyin' Lion
NEED SOURCE FOR
PICTURE

Page 2 of 63
Several basic requirements for safety and classification need to be satisfied in order for
the aircraft to meet its mission requirements. These requirements are highlighted in Table 1.
The battery performance and electric motor performance were projected three to five
years in the future. Current technology limits the possible performance of the aircraft, but using
projected trends in the performance of these components, the Lion can achieve these
specifications.
The critical mission requirements include meeting the FAR and FAA requirements for a
Light Sport Aircraft, and earn a Standard Airworthiness Certification. These requirements drive
several of the performance parameters listed in Table 1. Additionally, two seats are needed so
that the aircraft can function as a trainer aircraft. Most importantly the aircraft will run only on
electricity. With emerging technology in batteries and electric motors, the Lion has the
opportunity to take ahold in a new class of light sport aircraft.
Table 1: ELECTRIC Light Sport Aircraft (LSA) Mission Requirements
Takeoff and Landing capabilities:
LSA take off will be achieved on a paved runway
LSA will be compliant with airport VFR (Visual Flight Rules) only during flight.
NOTE: No IFR (Instrument Flight Rules) allowed.
Performance:
Maximum Velocity approximately 120 kt.
Stall speed should be 43 kt.
Sustained cruise at Steady Level Flight of 100 kt.
Service ceiling of 10,000 feet.
Minimum mission endurance of two hours.
Maximum range of 200 nautical miles.
Maximum takeoff weight of 1300 lbs.
Small backup battery system with a ten minute life cycle at 65 kt.
Critical Requirements
Meets FAR and FAA requirements for a LSA / Standard Airworthiness Certification.
Two Seat LSA that can be used to as a trainer to earn a sport or recreational pilots license.
Electric motor power plant.

Page 3 of 63
Expanding on Table 1, the Lion’s takeoff distance was calculated to be 315 feet, well
within the minimum 6000 feet length of common paved runways. The landing distance was also
calculated to be 255 feet.
Also, the Lion must meet and comply with VFR (Visual Flight Rules). This means that
the pilot must have a certain degree of visibility. The visibility will depend upon time of day as
well as weather conditions. VFR are dictated by the FAA and the FAR.
The aircraft’s performance requirements come mostly from parent aircraft such as the
Piper J-3 Cub, the Yuneec e430, and Pipistrel Taurus Electro G2. The Lion has been designed to
be a better performing aircraft than its most similar parent the Yuneec e430, giving it a
distinctive edge in the light sport category. These performance parameters include cruise speed
and max speed. For example the Yuneec e430’s has a cruise speed of 52 knots and a max speed
of 80 knots. The Lion will outperform the Yuneec e430 with a cruise speed of 100 knots and its
max speed of 120 knots.
The stall speed for the Lion is 43 knots; the requirement needed to satisfy the FAR and
the FAA requirements are 45 knots. The slower stall speed allows for easier landings, an ideal
characteristic for a training aircraft.
The service ceiling of 10,000 feet that is imposed on the Lion comes from environmental
factors. At altitudes much higher than this, the aircraft must carry supplemental oxygen and at
higher altitudes pressurization becomes a requirement for any kind of sustained flight.
The mission endurance of 2 hours comes from the length of a longer than average training
session. The range of 200 nautical miles is limited by the endurance of the batteries. Because
the aircraft is a trainer, this should be sufficient time and distance for a typical training lesson.
These values were confirmed by projected capabilities of the batteries that will be used in the
aircraft.
The takeoff weight is mostly driven by FAR requirements. In order to be classified as a
light sport aircraft the aircraft must be no heavier than 1,320 lbs. The aircraft has a takeoff
weight of 1300 lbs. This weight was chosen, so that the Lion could fly with as much weight as
possible and still be considered an LSA, as well as matching the performance
characteristics. This weight came from the need to satisfy the performance requirements.

Page 4 of 63
As an extra safety feature there will be a backup battery for emergencies. This battery
will be capable of powering the Lion for 10 minutes of flight at a cruise speed of 65 knots. This
will allow for the capability to safely land the aircraft.
Concept Studies To begin the design process, the group members were initially asked to submit original
sketches of what they thought the aircraft should look like. Figures 2, 3 and 4 demonstrate
several of these early concepts.
Figure 2: Early Design Concept for the Flyin’ Lioin

Page 5 of 63
Figure 3: Early Design Concept for the Flyin’ Lion
Figure 4: Early Design Concept for the Flyin’ Lion
These original sketches were created as a first step. Even though none of these designs
closely resemble the final design, it allowed the group members to think creatively and
Page 6 of 63
brainstorm ideas. The initial sketches lead to more serious discussion and the decision to begin
looking for a parent aircraft.
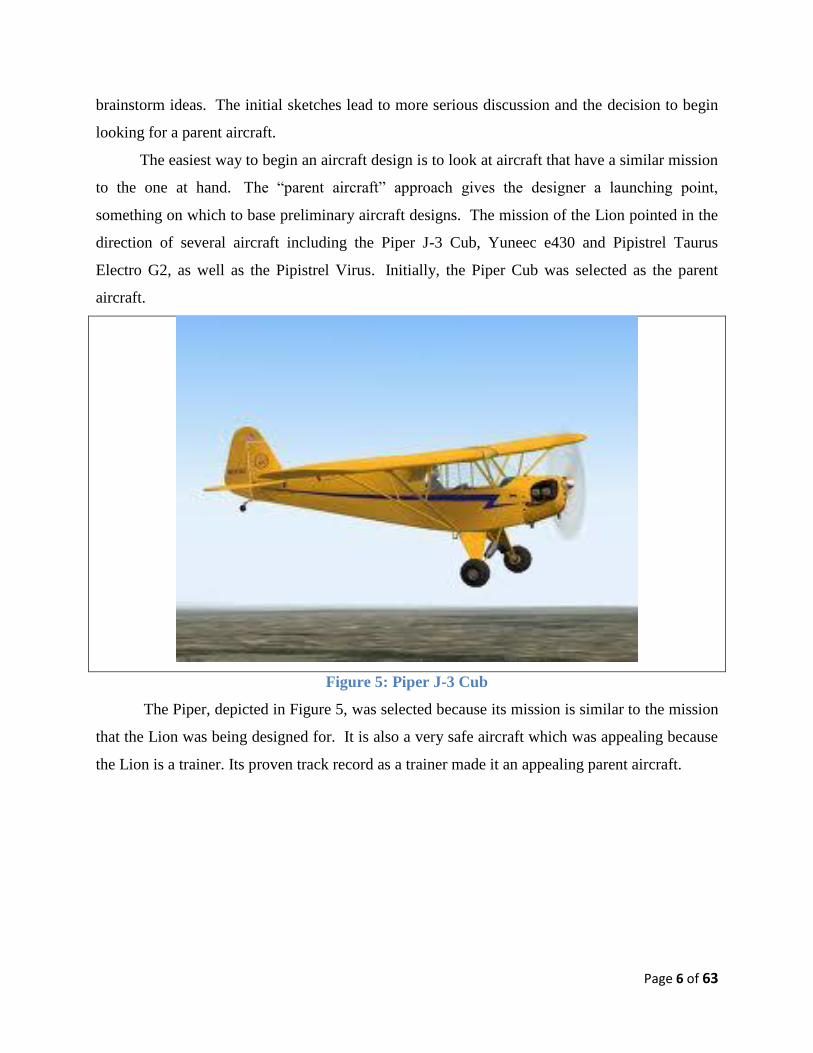
The easiest way to begin an aircraft design is to look at aircraft that have a similar mission
to the one at hand. The “parent aircraft” approach gives the designer a launching point,
something on which to base preliminary aircraft designs. The mission of the Lion pointed in the
direction of several aircraft including the Piper J-3 Cub, Yuneec e430 and Pipistrel Taurus
Electro G2, as well as the Pipistrel Virus. Initially, the Piper Cub was selected as the parent
aircraft.
Figure 5: Piper J-3 Cub
The Piper, depicted in Figure 5, was selected because its mission is similar to the mission
that the Lion was being designed for. It is also a very safe aircraft which was appealing because
the Lion is a trainer. Its proven track record as a trainer made it an appealing parent aircraft.
Page 7 of 63
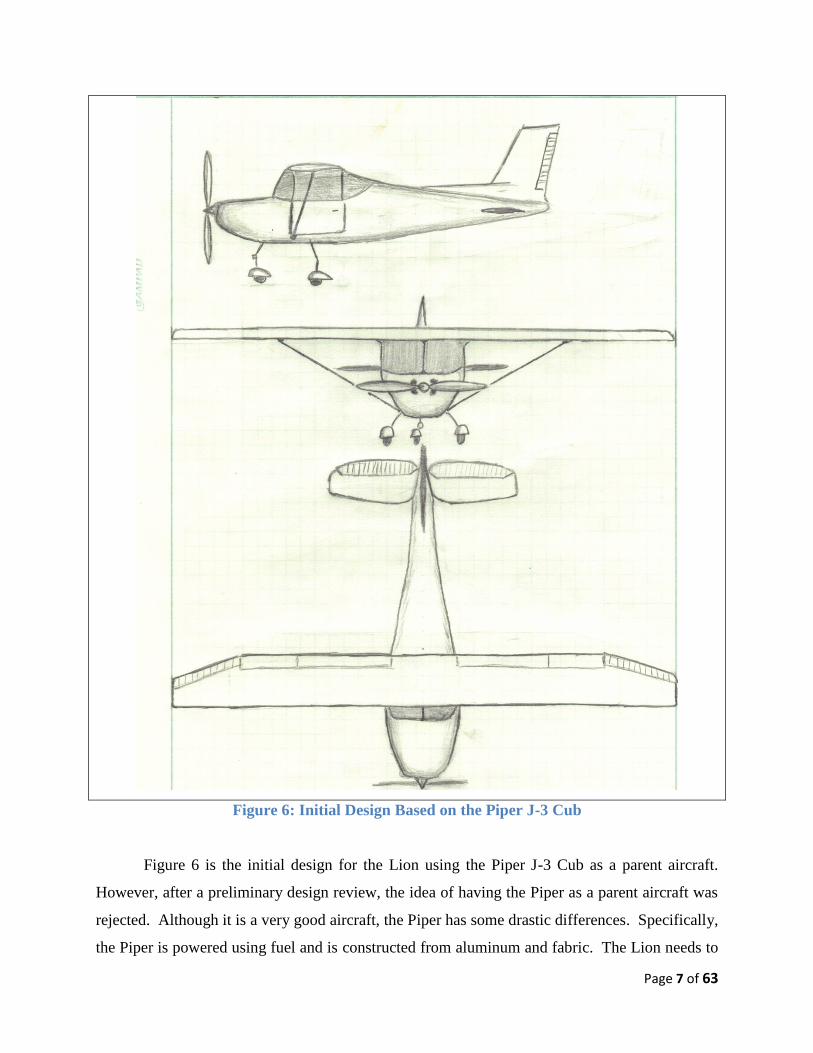
Figure 6: Initial Design Based on the Piper J-3 Cub
Figure 6 is the initial design for the Lion using the Piper J-3 Cub as a parent aircraft.
However, after a preliminary design review, the idea of having the Piper as a parent aircraft was
rejected. Although it is a very good aircraft, the Piper has some drastic differences. Specifically,
the Piper is powered using fuel and is constructed from aluminum and fabric. The Lion needs to

Page 8 of 63
be electrically powered and needs to be made of lightweight materials to satisfy weight
requirements.
After the initial design was scrapped, more research was put into finding electric light
sport aircraft made with more lightweight materials. These are the parent aircraft that the Flyin’
Lion is based on.
Figure 7: Yuneec e430
The Yuneec e430, depicted in Figure 7, is an all composite, electric light sport
aircraft. The Yuneec had several aspects that were adopted into the design; however, it was also
not a perfect match. The high wing design provides good visibility for the pilot and the winglets
decrease the induced drag on the aircraft. Also, the Yuneec is able to hold two passengers side-
by-side yet it still has an aerodynamic body shape. The group felt as though the V-tail design
and the shape of the wings could be improved upon. This change would help better meet the
mission requirements by decreasing the complexity of the control system.
Page 9 of 63
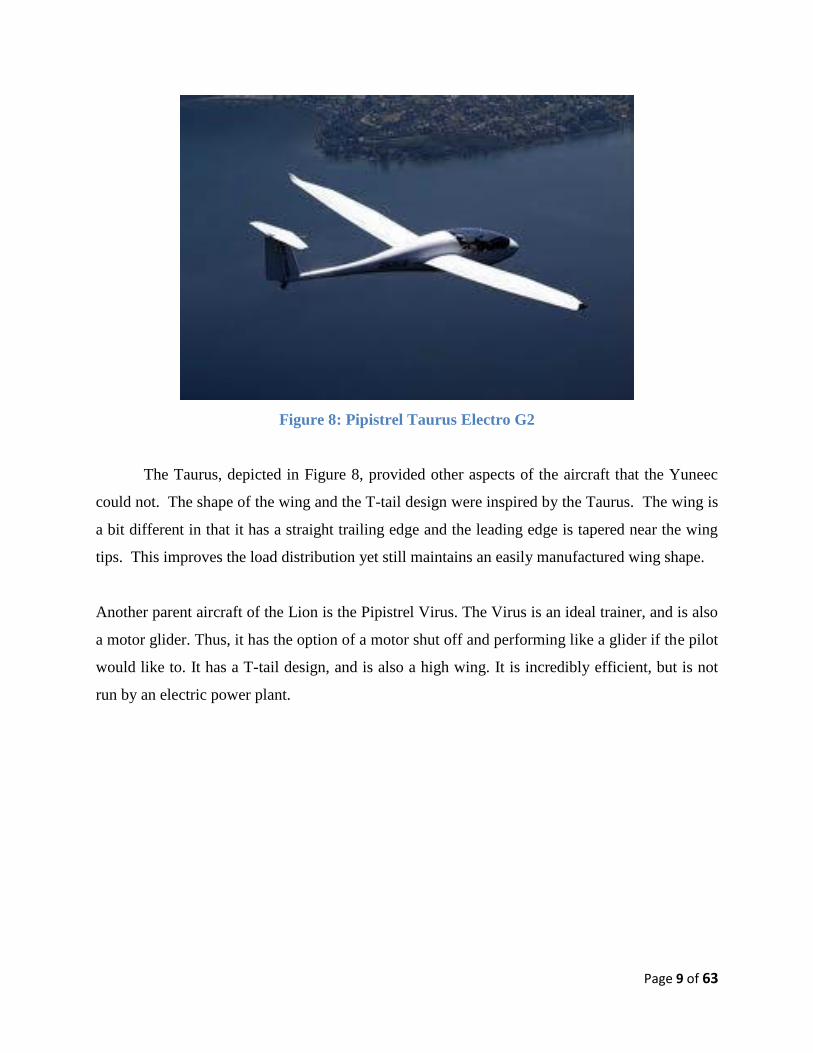
Figure 8: Pipistrel Taurus Electro G2
The Taurus, depicted in Figure 8, provided other aspects of the aircraft that the Yuneec
could not. The shape of the wing and the T-tail design were inspired by the Taurus. The wing is
a bit different in that it has a straight trailing edge and the leading edge is tapered near the wing
tips. This improves the load distribution yet still maintains an easily manufactured wing shape.
Another parent aircraft of the Lion is the Pipistrel Virus. The Virus is an ideal trainer, and is also
a motor glider. Thus, it has the option of a motor shut off and performing like a glider if the pilot
would like to. It has a T-tail design, and is also a high wing. It is incredibly efficient, but is not
run by an electric power plant.
Page 10 of 63
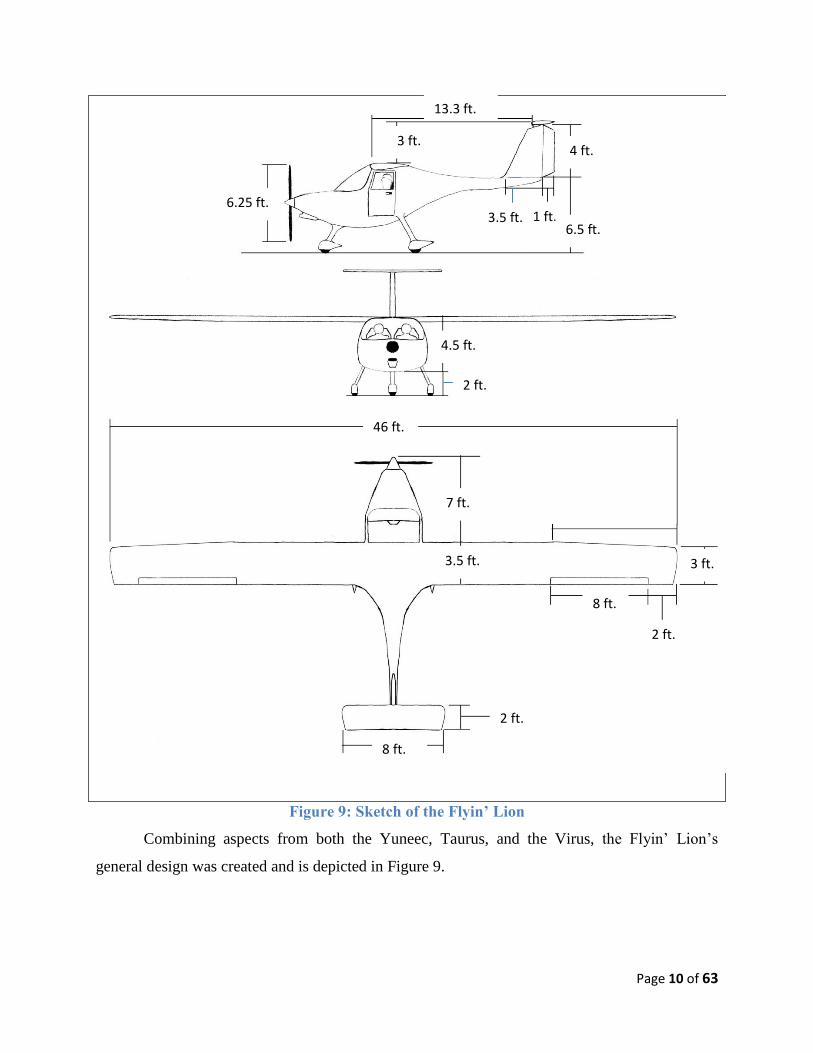
Figure 9: Sketch of the Flyin’ Lion
Combining aspects from both the Yuneec, Taurus, and the Virus, the Flyin’ Lion’s
general design was created and is depicted in Figure 9.
4 ft.
13.3 ft.
3.5 ft. 6.25 ft.
3 ft.
1 ft. 6.5 ft.
4.5 ft.
8 ft.
7 ft.
3.5 ft.
2 ft.
46 ft.
3 ft.
2 ft.
8 ft.
2 ft.

Page 11 of 63
Procedure Outline
Performance
The first calculations of the design were based on the mission requirements and were then
compared to the parent aircraft. The group compiled the data from the parameter equations
below into a table of specifications that can be found in the Appendix I.
The taper ratio for a partially tapered wing was calculated by weighting the tapered and
un-tapered ratios for the sections of the wings. This is calculated using the equation
The taper ratio for the wing was calculated using the root chord and tip chord ratio for the
wing of the aircraft.
The standard taper ratio of a light sport aircraft is typically between 0.6 – 1.
The planform area for a straight-tapered wing can be calculated from the wing span, root
chord, and taper ratio. The Flyin’ Lion has a partially tapered wing which changes the method of
calculating the planform area. The area was then calculated by adding a rectangular area to the
trapezoidal area of the semi-span of the wing.
Planform Area ( )
( ) (2)
Using the determined planform area, the aspect ratio can be calculated.
Aspect Ratio
( ) (3)
Taper Ratio for a partially
tapered wing
( ) ( )
(1)
Taper Ratio (
)

Page 12 of 63
The importance of the aspect ratio for the overall aircraft will affect the induced drag and
the lift to drag ratio of the aircraft during the preliminary calculations. A typical aspect ratio for
personal and utility aircraft ranges between 5 and 8.
Next, the weight of the aircraft needed to be determined for the performance
specifications. The weight can affect many different parameters in the design process. Such
factors affected by weight are the structural integrity, aerodynamic drag, performance, and sizing
parameters. It should be noted that the maximum allowable gross weight for an LSA is 1320
pounds, and that the gross weight of the Lion will not vary during flight.
The total gross takeoff weight of the aircraft is composed of the empty structural weight,
batteries, passengers and cargo weights.
Total Gross Weight (4)
The constant weight reflects the removal of the liquid fuel system of a conventional
aircraft. The standard gross takeoff weight range of the parent aircraft was found to be between
946 and 1220 pounds.
Using the aforementioned calculations, the first conceptual design estimations for the
critical performance parameters were determined. These parameters included the wing loading,
lift coefficients, drag coefficients, thrust, lift-to-drag ratio, ground roll, and power estimations.
These parameters were influenced by parent aircraft and design specification requirements.
Wing Loading
(5)
The wing loading can be determined from Equation (5). This is a very important
parameter that is based on the weight and planform area of the wing. The wing loading has a
direct effect upon many parameters such as the lift, drag, and thrust.
In order to obtain these performance parameters, various equations were utilized to
standardize our values. Initially, the temperature was needed at the specific altitudes desired for
the flight envelope. This was found using the standard temperature lapse rate.

Page 13 of 63
Temperature Lapse Rate (
) (6)
Next, the temperature ratio was used in order to acquire the density ratio.
Temperature Ratio
(7)
The standard density ratio, was utilized to ensure uniformity of the calculations.
Density Ratio
(8)
Using information calculated from the above equations, the total drag can be determined.
Compiling drag from all the components of an aircraft is probably the most crucial and perhaps
the most difficult step in determining an aircraft’s performance. Several key performance
parameters depend directly on the force of drag an aircraft experiences in crucial stages of
flight. For example, it would be difficult to determine the time to climb to a certain altitude
without drag estimates. Generally speaking, cruise, take-off, turning, and landing behavior
cannot be predicted without an accurate estimation of drag at those conditions.
The wing of an aircraft is the largest contributor of drag. At low airspeeds, induced drag
is the main factor but profile drag also contributes significantly. X-Foil was used to give simple
estimations of the lift and drag coefficients of the airfoil section. X-Foil is a computer program
which uses potential flow and boundary layer analysis to determine lift and drag on an airfoil.
Refer to Appendix III for X-Foil results on the wing of the aircraft.
The induced drag coefficient was calculated using parameters of the airfoil.
Induced Drag Coefficient
(9)
Page 14 of 63
Using the Panel Method for Windows, the span efficiency was calculated as 0.961 for the
wing of the Flyin’ Lion. For further discussion on the Panel Method for Windows, refer to
Appendix II
The induced drag was then calculated and added to the X-Foil provided profile drag. The
result was the total drag.
Drag Equation
∑
(10)
This is also a valid procedure for the horizontal tail.
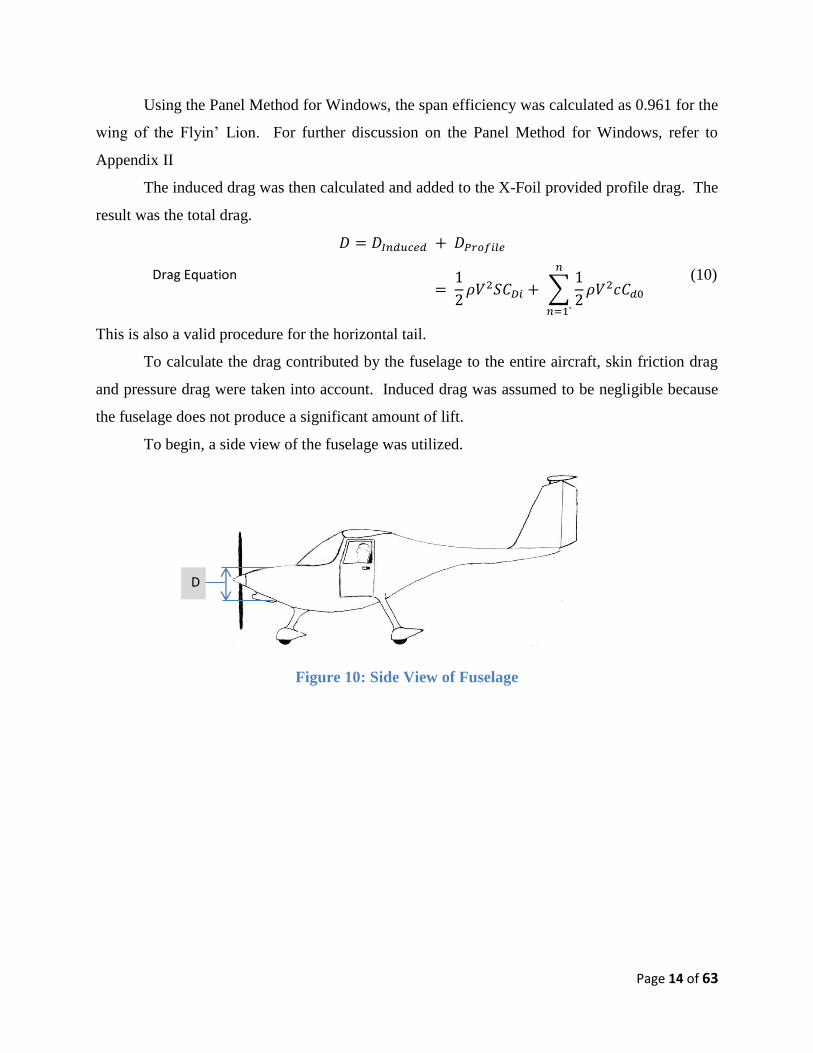
To calculate the drag contributed by the fuselage to the entire aircraft, skin friction drag
and pressure drag were taken into account. Induced drag was assumed to be negligible because
the fuselage does not produce a significant amount of lift.
To begin, a side view of the fuselage was utilized.
Figure 10: Side View of Fuselage
D
Page 15 of 63
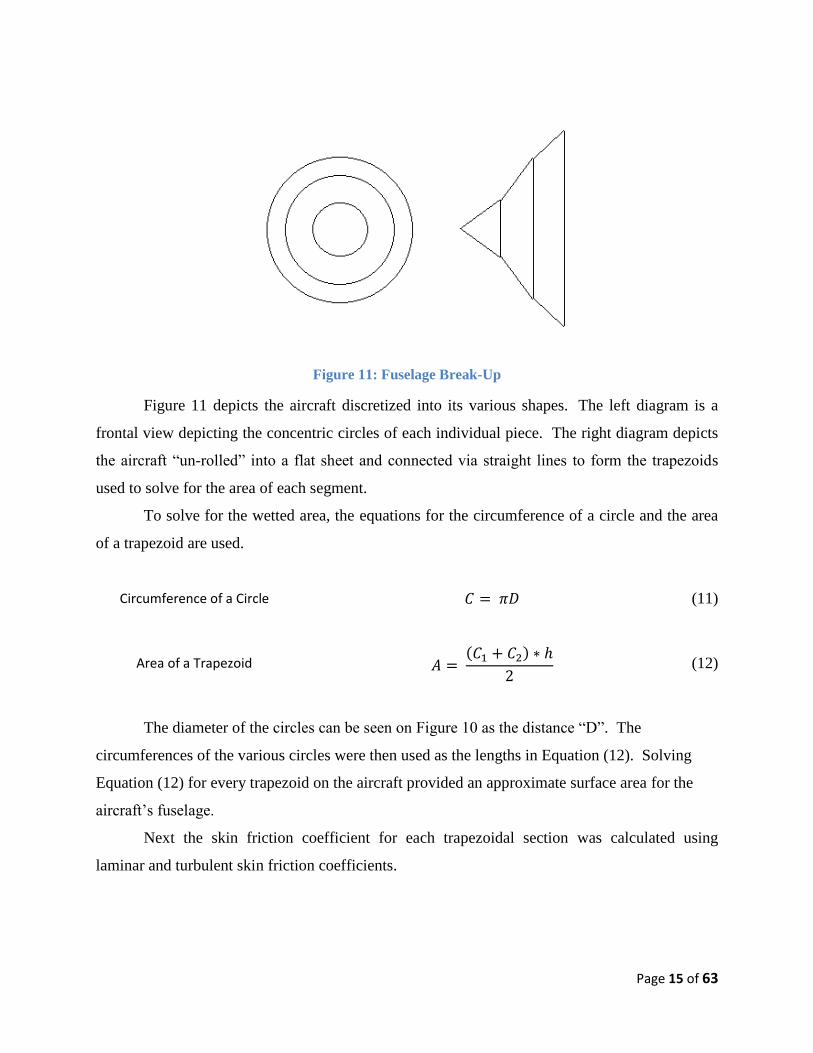
Figure 11: Fuselage Break-Up
Figure 11 depicts the aircraft discretized into its various shapes. The left diagram is a
frontal view depicting the concentric circles of each individual piece. The right diagram depicts
the aircraft “un-rolled” into a flat sheet and connected via straight lines to form the trapezoids
used to solve for the area of each segment.
To solve for the wetted area, the equations for the circumference of a circle and the area
of a trapezoid are used.
Circumference of a Circle (11)
Area of a Trapezoid ( )
(12)
The diameter of the circles can be seen on Figure 10 as the distance “D”. The
circumferences of the various circles were then used as the lengths in Equation (12). Solving
Equation (12) for every trapezoid on the aircraft provided an approximate surface area for the
aircraft’s fuselage.
Next the skin friction coefficient for each trapezoidal section was calculated using
laminar and turbulent skin friction coefficients.

Page 16 of 63
Laminar Skin Friction Coefficient
√
(13)
Turbulent Skin Friction Coefficient
(14)
It was assumed that most of the flow over the fuselage of the aircraft was turbulent;
however, due to the aerodynamic shape of the fuselage, there was still a small section at the front
of the aircraft that had laminar flow. That section was assumed to be 1.5 feet from the front tip of
the aircraft. However without doing comprehensive wind tunnel testing this might not be
entirely accurate.
The final skin friction drag was determined by summing all of the contributions of each
discretized section.
Fuselage Profile Drag
∑
(15)
Given the skin friction drag of the aircraft, the next task was to determine the pressure
drag of the aircraft. The pressure drag of any aircraft is very difficult to determine so an
approximation was used. Based on the streamlined shape of the fuselage and low velocities, the
addition of pressure drag was approximated to add 40 percent to the calculated skin friction drag.
The drag on the vertical tail was calculated using X-Foil. Because the vertical tail does
not generate lift, its only major contribution to the overall drag of the aircraft is profile drag.
The total drag value was calculated by adding the components from the tail surfaces, wing
surface, and fuselage. These values are sufficiently accurate for the purposes of calculating the
performance characteristics of the Flyin’ Lion.
The coefficient of the thrust needs to be calculated to further determine aircraft
performance characteristics.
Coefficient of Thrust ( ) (16)

Page 17 of 63
Note that the thrust is directly related to drag in the condition of steady level flight,
leading to a simplified relationship.
Coefficient of Thrust, Simplified (17)
Utilizing these non-dimensional equations, thrust of the aircraft can be calculated.
The lift-to-drag ratio can now be determined as well.
Lift/Drag Ratio
(18)
This is necessary to predict the maximum glide range in case of engine out conditions.
This is a vital parameter because the aircraft will be used primarily as a trainer. The estimated
lift-to-drag ratio is a key factor used to select an airfoil for the Flyin’ Lion.
From the mission requirements and parent aircraft, the desired thrust range was
determined for the different flight parameters. The thrust is used to calculate the rate-of-climb,
ground roll, and thrust-to-weight ratio.
Thrust (19)
Note that Equation (19) is for a small angle approximation.
Now a thrust-to-weight ratio can be calculated. Note that this directly affects the take-off
and landing ground roll for the LSA.
Thrust/Weight Ratio
(20)
The distance of the ground roll is important to meet the mission requirements that were
established. It can be crucial to the design goals of the aircraft.

Page 18 of 63
Ground Roll Distance (
)
(
)
(21)
Note that Equation (21) does not consider ground effect lift.
The minimum power required and power available are vital parameters that can be
utilized to help find rate-of-climb and other important specifications.
Power Required (22)
Power Available (23)
Where η is the prop efficiency and BHP is the break horse power in Equation 23.
The rate-of-climb can be calculated after power available and power required are
determined.
Rate of Climb
(
) (24)
The rate-of-climb must be sufficient enough to clear the required ground obstacles on
takeoff. It is also essential to reach an optimal rate of climb to arrive at cruise altitude; thus,
maximizing flight time at cruise and reducing the overall power consumption.
Next, the calculations of the endurance and range were performed in order to satisfy the
mission requirements. The endurance calculation of an electric LSA is different than that of a
normal aircraft because it is not fuel powered. However, the premise is still the same. The
simple idea of endurance is how much fuel the aircraft has in relation to how much power it
takes to fly at a desired speed. Thus, the endurance was derived.
Endurance Equation
(25)
Page 19 of 63
It is important to note that the energy density of the batteries is noted as C in this equation.
Some energy is lost due to lack of efficiency between the batteries and the output from the
engine. The goal for the Flyin’ Lion was to fly for at least 2 hours, which can be achieved with
400 pounds of batteries.
The fuel efficiency for the airplane was based on the electrical power system. The fuel
was considered as the electrical current which was available from the Lithium Ion battery packs
and delivered through the charging system. The fuel efficiency remained constant throughout
flight at various power settings since the battery controller regulated the current flux through the
system. The two main efficiency factors which effect the electrical system were the battery
efficiency, 90%, and the controller efficiency, 95%. These efficiencies are reasonable values
based upon current technology.
The range can then be determined from the endurance. Simply multiply the desired
airspeed by the endurance to obtain the range of the aircraft
Range
(26)
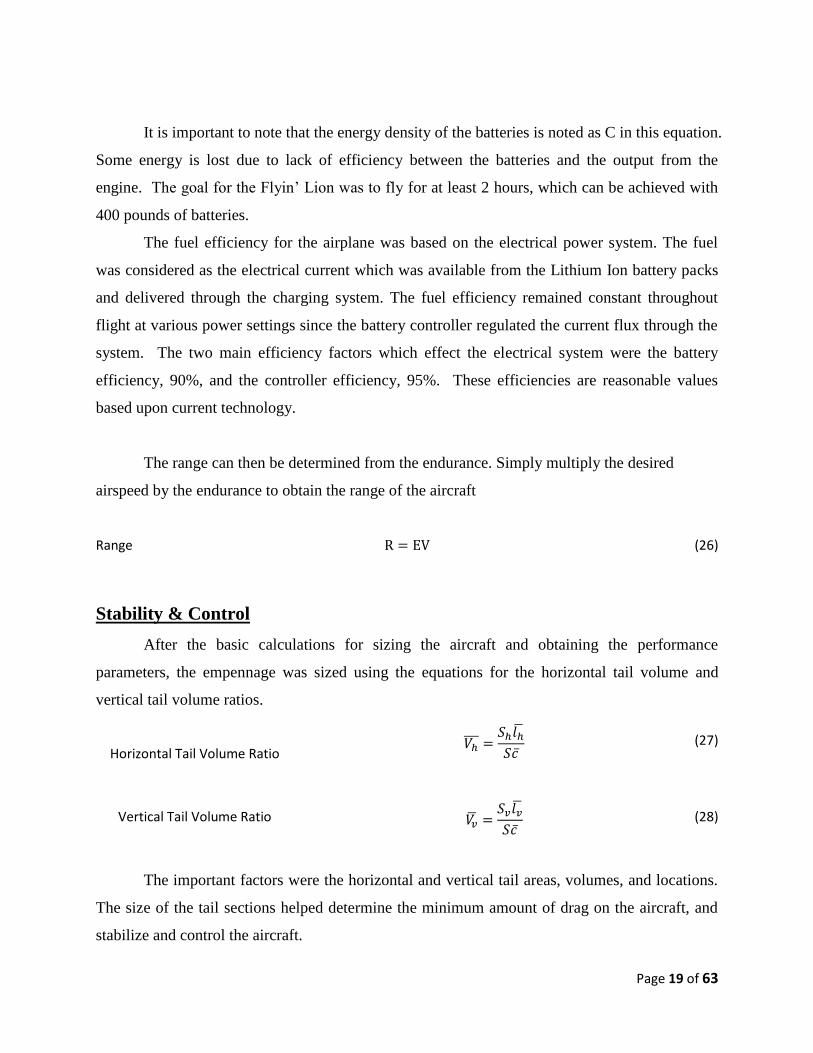
Stability & Control
After the basic calculations for sizing the aircraft and obtaining the performance
parameters, the empennage was sized using the equations for the horizontal tail volume and
vertical tail volume ratios.
Horizontal Tail Volume Ratio
(27)
Vertical Tail Volume Ratio
(28)
The important factors were the horizontal and vertical tail areas, volumes, and locations.
The size of the tail sections helped determine the minimum amount of drag on the aircraft, and
stabilize and control the aircraft.

Page 20 of 63
In order for the Lion to be able to achieve flight the first stability quantity that needs to be
calculated is the neutral point of the aircraft.
Neutral Point
(
) (29)
The neutral point is the aft limit of the cg location. The neutral point of the aircraft is
calculated using parameters from the aircraft including the lift slope of the aircraft, the lift slope
of the tail, the horizontal tail volume coefficient, the neutral point of the wing body, and the
downwash parameter. All of these factors play into the neutral point of the Lion.
Next the forward limit of the center of gravity must be determined. The forward limit is
determined by the flight conditions at takeoff. This is when CL is at its max and the aircraft is in
ground effect.
(
)
(
)
(
( ))
Forward C.G. Location
(
) (30)
The equation takes into account many aspects of the aircraft. This includes the lift slopes
for the tail wing and aircraft, the surface areas and inclination of the tail and wing, the
effectiveness of the tail, the location of the fuselage aerodynamic center, and the maximum lift
coefficient.
Now that the forward and aft limits for the aircraft have been determined the internal
components can be placed inside of the Lion so that its center of gravity is within the limits. To
determine the center of gravity each major contributor of weight was given a position in the
fuselage and then a moment calculation was used to determine the equivalent location of the
center of gravity.
Aircraft C.G. Location ∑( )
(31)

Page 21 of 63
Aileron Sizing
After viewing case studies of the Flyin’ Lions parent aircraft, an average roll rate was determined
to be about 40 deg. /sec. To obtain this roll rate, the ailerons size needed to be determined based
on this specification at the cruise velocity of 100 knots. The ailerons were limited to 10 degrees
of deflection due to the parent aircrafts average aileron deflection. Then the outboard location of
the aileron was decided to be 22 feet from the centerline of the aircraft, as seen in Figure 9. From
these details, it was determined that the inboard aileron should begin at 12 feet from the
centerline of the aircraft. This gives an approximate roll rate of 45 deg./sec. This makes the Flyin’
Lion an exciting and exhilarating aircraft to maneuver. To see the Matlab code used to calculate
the aileron sizing, view Appendix IV.
Rudder Sizing
Rudder and vertical tail sizing is necessary to ensure lateral directional stability of an
aircraft. An adequately sized tail is needed to ensure proper control of the aircraft during gusts
and sideslips. The rudder is used to coordinate turns as well as to correct heading. The major
driving variables for tail and rudder sizing are vertical tail lift slope, the weathercock stability
derivative, and the vertical tail volume coefficient. Another factor that influences the
effectiveness of the tail is the size and shape of the fuselage. The geometry of the fuselage can
induce side wash effects which alter the effective angle of attack and airflow the tail sees.
In order to ensure static lateral directional stability, the aircraft needs a positive
weathercock stability derivative. This physically means that if a gust yaws the aircraft to the right,
the aircraft will automatically return to the trimmed state, and vice versa. Assuming the side
wash coefficient is 0.17, based on the Morelli document, the weathercock stability derivative
results in
(
)

Page 22 of 63
where is the vertical tail lift slope, is the vertical tail volume coefficient, and
is the side
wash coefficient. Due to the destabilizing effect of the Lion’s fuselage, the total weathercock
stability is reduced by a value of 0.02.
FAR Sec. 23 states that the aircraft must be capable of stabilizing in a maximum sideslip
of 11.5°. This is the minimum amount of sideslip the aircraft can be exposed to, although, it is
desirable for the aircraft to operate in higher gust conditions. The need to meet these conditions
led to our rudder size. The Flying Lion’s rudder power results in
where τ is an efficiency for the vertical tail. With rudder power, rudder deflection to meet FAR
requirements is calculated as
where is the sideslip angle. Once the rudder deflection was obtain, a factor of safety was
obtained based on a maximum rudder deflection of 30°.
Motor, Controller, and Batteries
Figure 12: Yuneec Power Drive 60 Motor

Page 23 of 63
The Yuneec Power Drive 60 in Figure 12 was chosen as the electric motor for the Flyin’
Lion. The following are the specifications for this motor.
Table 2: Engine Specifications
Parameter Value Units
Power 81 Horsepower
Rotational Speed 2400 Revolutions/Minute
Weight 66 lbs
Diameter 11 inches
Because electric battery technology is improving at an exponential rate, the specifications
for the battery system are estimated using projections 3-5 years into the future. The motor will
be power by Lithium-Ion batteries weighing 400 lbs and having an energy density of 240
WHr/kg. These parameters will be used later to calculate endurance and range of the aircraft.
A Yuneec power controller will accompany the batteries and the motor. The Power
Block 60 is encased in a plastic, fire-retardant material. It weighs around 22 lbs.
To reduce the overall temperature of the motor, battery, and controller system, a cooling
duct and system was designed for the aircraft. Electrical controllers and battery systems can
reach high temperatures and need to be lowered since the air will be recirculating in the cabin.
These temperatures can create malfunctions in sensitive avionics and electronics of the aircraft.
Specifications
Page 24 of 63
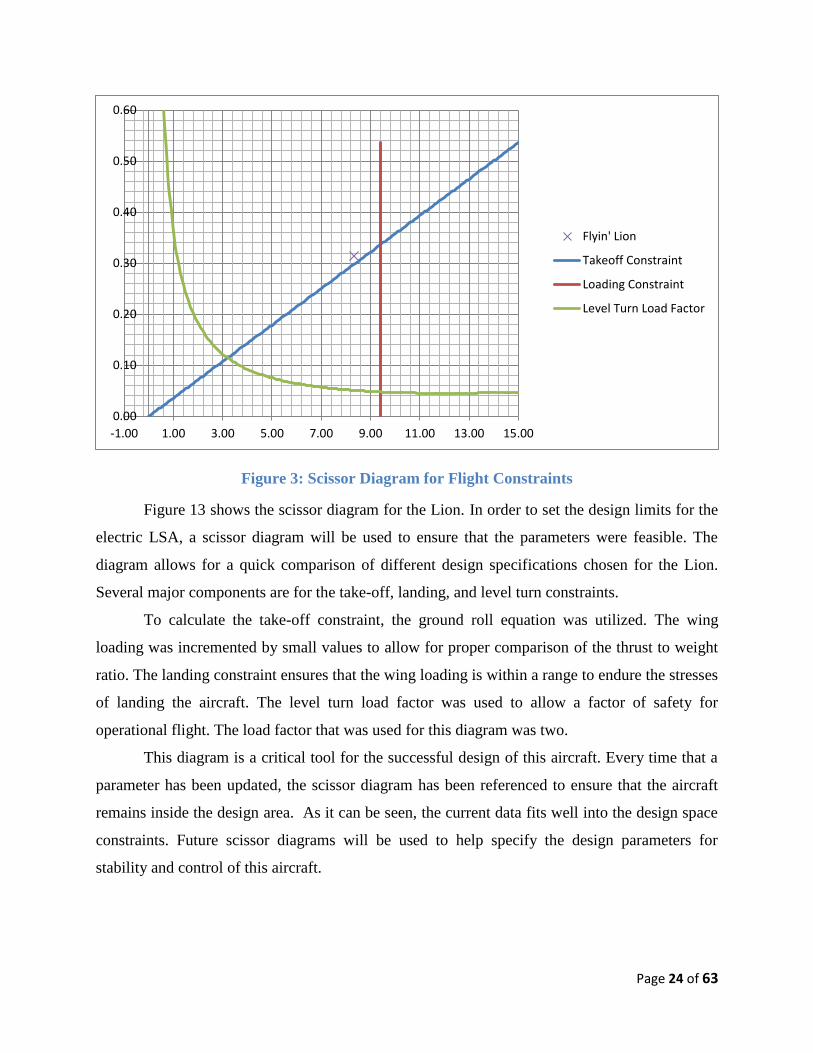
Figure 3: Scissor Diagram for Flight Constraints
Figure 13 shows the scissor diagram for the Lion. In order to set the design limits for the
electric LSA, a scissor diagram will be used to ensure that the parameters were feasible. The
diagram allows for a quick comparison of different design specifications chosen for the Lion.
Several major components are for the take-off, landing, and level turn constraints.
To calculate the take-off constraint, the ground roll equation was utilized. The wing
loading was incremented by small values to allow for proper comparison of the thrust to weight
ratio. The landing constraint ensures that the wing loading is within a range to endure the stresses
of landing the aircraft. The level turn load factor was used to allow a factor of safety for
operational flight. The load factor that was used for this diagram was two.
This diagram is a critical tool for the successful design of this aircraft. Every time that a
parameter has been updated, the scissor diagram has been referenced to ensure that the aircraft
remains inside the design area. As it can be seen, the current data fits well into the design space
constraints. Future scissor diagrams will be used to help specify the design parameters for
stability and control of this aircraft.
0.00
0.10
0.20
0.30
0.40
0.50
0.60
-1.00 1.00 3.00 5.00 7.00 9.00 11.00 13.00 15.00
Flyin' Lion
Takeoff Constraint
Loading Constraint
Level Turn Load Factor
Page 25 of 63
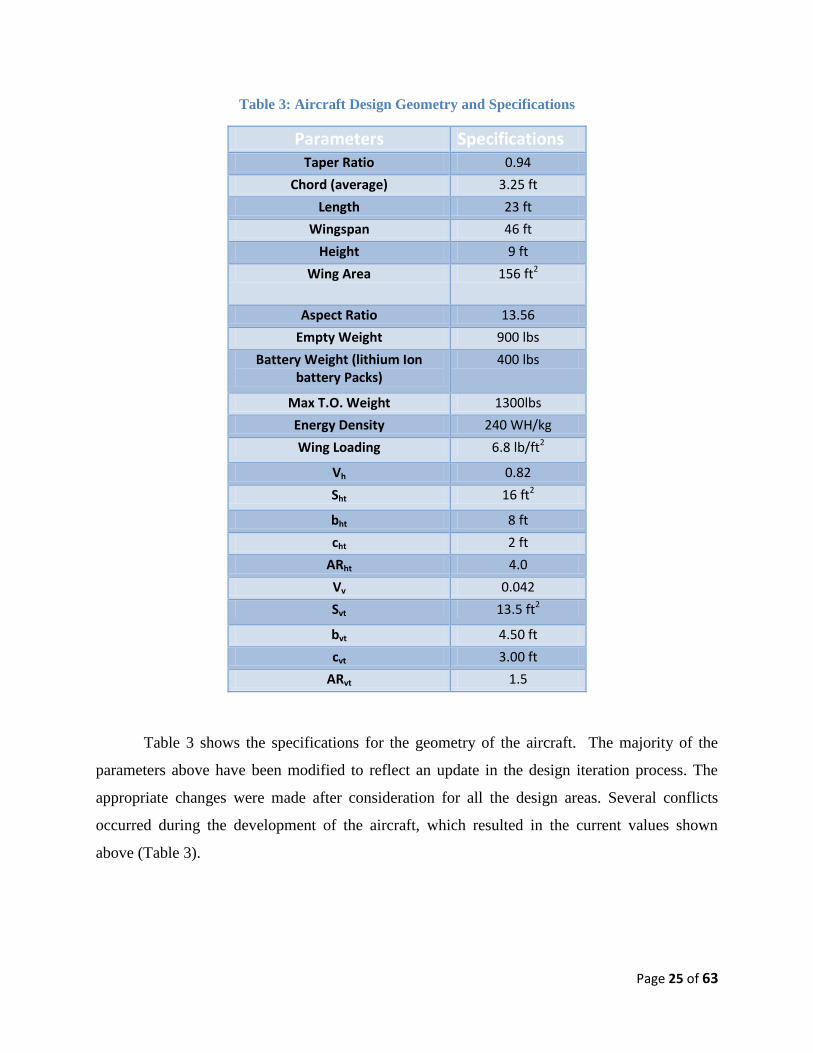
Table 3: Aircraft Design Geometry and Specifications
Parameters Specifications Taper Ratio 0.94
Chord (average) 3.25 ft
Length 23 ft
Wingspan 46 ft
Height 9 ft
Wing Area 156 ft2
Aspect Ratio 13.56
Empty Weight 900 lbs
Battery Weight (lithium Ion battery Packs)
400 lbs
Max T.O. Weight 1300lbs
Energy Density 240 WH/kg
Wing Loading 6.8 lb/ft2
Vh 0.82
Sht 16 ft2
bht 8 ft
cht 2 ft
ARht 4.0
Vv 0.042
Svt 13.5 ft2
bvt 4.50 ft
cvt 3.00 ft
ARvt 1.5
Table 3 shows the specifications for the geometry of the aircraft. The majority of the
parameters above have been modified to reflect an update in the design iteration process. The
appropriate changes were made after consideration for all the design areas. Several conflicts
occurred during the development of the aircraft, which resulted in the current values shown
above (Table 3).
Page 26 of 63
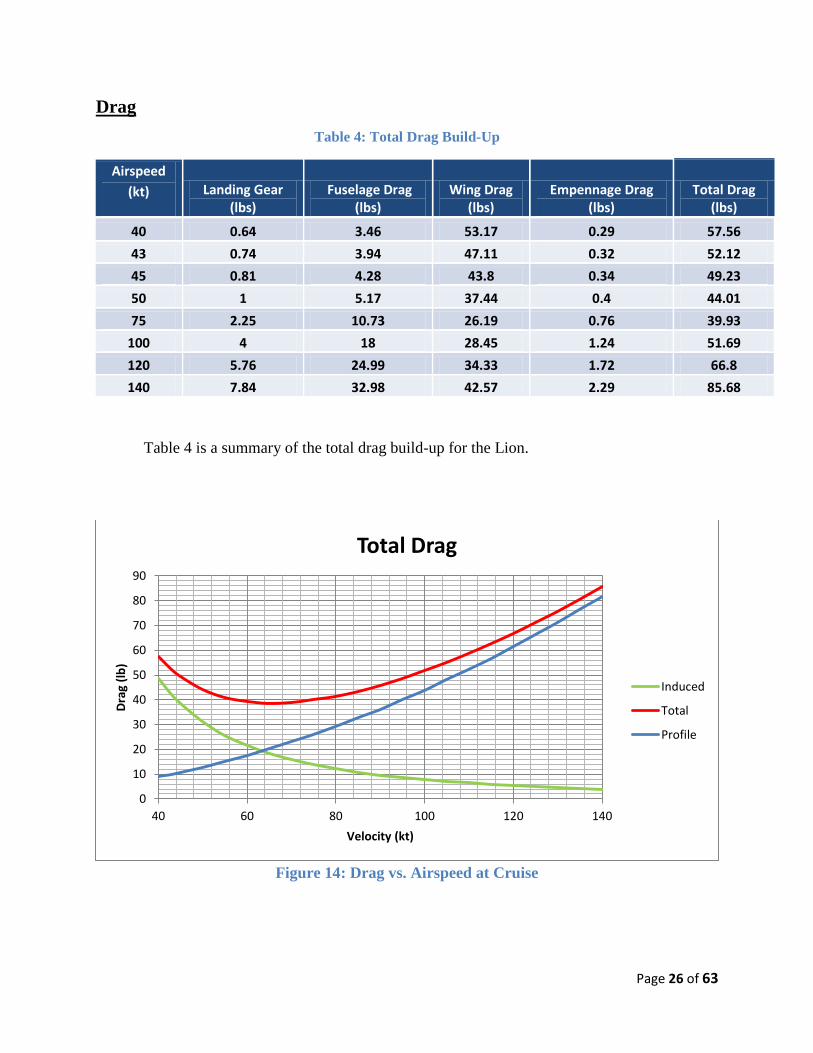
Drag
Table 4: Total Drag Build-Up
Airspeed
(kt) Landing Gear (lbs)
Fuselage Drag (lbs)
Wing Drag (lbs)
Empennage Drag (lbs)
Total Drag (lbs)
40 0.64 3.46 53.17 0.29 57.56
43 0.74 3.94 47.11 0.32 52.12
45 0.81 4.28 43.8 0.34 49.23
50 1 5.17 37.44 0.4 44.01
75 2.25 10.73 26.19 0.76 39.93
100 4 18 28.45 1.24 51.69
120 5.76 24.99 34.33 1.72 66.8
140 7.84 32.98 42.57 2.29 85.68
Table 4 is a summary of the total drag build-up for the Lion.
Figure 14: Drag vs. Airspeed at Cruise
0
10
20
30
40
50
60
70
80
90
40 60 80 100 120 140
Dra
g (l
b)
Velocity (kt)
Total Drag
Induced
Total
Profile

Page 27 of 63
Figure 14 demonstrates the drag versus airspeed at the cruise altitude. Note that this is
curve is created for standard gross weight. The stall of the aircraft is shown to be right around 43
knots, which fits within the specifications of a light sport aircraft. It also can be seen that the
drag significantly increases with airspeed, which is an expected effect for this aircraft. It can also
be seen that the maximum L/D occurs at a value of around 65 knots.
Power
Figure 15: Power vs. Velocity at Cruise
The power available curve in Figure 15 is based on the total power available for the Lion.
After taking into account the efficiency losses of the batteries and the control system, a general
power available was determined. Since the power plant is purely electric, there are no efficiency
losses with altitude except for that of the propeller. Thus, calculating the propeller efficiency was
necessary for the power available curve. To calculate power available, the advance ratio (J) must
be determined.
0
10
20
30
40
50
60
70
0 20 40 60 80 100 120 140 160
Po
we
r R
eq
uir
ed
(h
p)
Velocity (kt)
Power Required vs. Velocity
Sea Level
1300 ft
5000 ft
12000 ft
Power Available

Page 28 of 63
Advance ratio
Note that it is purely dependent on velocity (V), the engine speed in revolutions per
second (N), and the diameter of the propeller (D).
Figure 16: Propeller Efficiency versus Advance Ratio
From this calculation, Figure 16 was used to determine the propeller efficiency. The
Flyin’ Lions propeller is a fixed pitch version of the Vario, a propeller made by Pipistrel. Since
efficiency data on the Vario was not able to be directly obtained, Figure 16 is a subsequent fixed
pitch propeller for the Cessna 172R. This curve is a reasonable approximation for the propeller
used on the Flyin’ Lion. As the speed of the aircraft increases, the efficiency of the propeller
changes, giving the Flyin’ Lion the power available as shown in Figure 15.
Power Required: To obtain the power required, one must find the total drag of the aircraft
at different velocities. It makes sense to think of the power required as the total power needed to

Page 29 of 63
overcome the drag at a certain velocity. Thus, Equation 22 shows the simple relation of power
required to drag.
Thus, the curve obtained for the required power of the Flyin’ Lion is shown in Figure 15.
Note that it follows the same basic trend of a drag curve. It can be seen that the power required
does change with different altitudes, unlike the power available. This is due to the fact that the
drag changes with altitude, making the power curve shift/ rotate to the right and up as shown in
Figure 15. To obtain the power obtained at different altitudes, the drag coefficient needed to be
determined. To do this, a plot of drag coefficient versus lift coefficient was created, as shown in
Figure 17.
Figure 17: Cd versus Cl curve
Next, it was necessary to find the lift coefficient at the different altitudes of interest, since
they change with density. However, the lift coefficient and drag coefficient can still be found
directly with Figure 17. Thus, the drag coefficient can be determined. From this, the Power
required for different altitudes can be found.
0.000
0.010
0.020
0.030
0.040
0.050
0.060
0.070
0.080
0.00 0.20 0.40 0.60 0.80 1.00 1.20 1.40 1.60 1.80
CD
CL
CD vs. CL

Page 30 of 63
Power Required at different
altitudes √
( )
(
( )
)
The next important step is to determine the rate of climb.
Rate of Climb
From the power available and power required, the rate of climb of an aircraft can be
determined. Subtracting the power required for the aircraft to perform at a given setting from the
power available at that setting, the excess power is found. The excess power of the aircraft is
directly correlated to the rate of climb as shown in Equation 24.
The excess power can be visually represented using a power versus velocity graph such as the
one below.
Figure 18: Visualization of Excess Power
0
10
20
30
40
50
60
70
0 20 40 60 80 100 120 140 160
Po
we
r R
eq
uir
ed
(h
p)
Velocity (kt)
Power Required vs. Velocity
Sea Level
1300 ft
5000 ft
12000 ft
Power Available
Excess Power

Page 31 of 63
Calculating the rate of climb using Equation 24, Figure 19 was created.
Figure 19: Rate of Climb versus Airspeed
Figure 19 shows the rate of climb at various altitudes and airspeeds and is used to
determine the absolute ceiling of the aircraft. As the aircraft increases its altitude, it cannot
continue to climb without increasing its airspeed or it will stall. Therefore, each set of blue dots
represents a new airspeed. Due to the large amount of available power of the aircraft, the
absolute ceiling is limited by the speed requirements of an LSA. The Flyin’ Lion will reach its
maximum allowable airspeed of 120 knots and stall around 53000 feet (making 53000 feet the
absolute ceiling) even though the aircraft still has power available.

Page 32 of 63
Data obtained from Figure 19 can also be used to calculate the time to climb to any given
altitude
Time-to-Climb
( ⁄ ) [
] (32)
where is the absolute ceiling of the aircraft, is the desired altitude, and ( ⁄ ) is the rate
of climb of the aircraft at sea level. Using Equation 32, it was determined that the Lion could
climb to a cruising altitude of 5000 feet in approximately 4.5 minutes.
Stall Speed
Using Figure 19, Figure 20 was created. It summarizes the stall speeds at various altitudes.
Figure 20: Stall Speed versus Altitude
0.00
20.00
40.00
60.00
80.00
100.00
120.00
140.00
160.00
0 10000 20000 30000 40000 50000 60000
Stal
l Sp
ee
d (
kt)
Altitude (ft)
Stall Speed vs. Altitude

Page 33 of 63
Lift to Drag Ratio
Figure 21: L/D vs. Airspeed at Cruise
Figure 21 shows the lift to drag ratio versus airspeed at the cruise altitude and total gross
weight. Note that as airspeed increases, the lift to drag ratio increases and peaks at approximately
65 knots. The cruise speed of the Lion fits well into the optimal lift to drag ratio. By cruising
within the optimal lift to drag ratio, the Lion will get optimal endurance during cruise.
0.000
5.000
10.000
15.000
20.000
25.000
30.000
35.000
40.000
0 20 40 60 80 100 120 140 160
L/D
Velocity (kts)
L/D Versus Airspeed

Page 34 of 63
Range
The plot below depicts the range of the Lion at various airspeeds.
Figure 22: Range versus Airspeed
Figure 22 shows the range at cruising power of 100 knots was determined to be 222 miles and
the maximum range peaks at 300 miles. This maximum range occurs at a speed of 65 knots
which is approximately the speed for maximum excess power of the Lion.
0
50
100
150
200
250
300
350
0 20 40 60 80 100 120 140 160
Ran
ge (
mi)
Airspeed (kt)
Range vs. Airspeed

Page 35 of 63
Lift Curves and Drag Polars
Figure 23: Lift vs. Angle of Attack
Figure 23 depicts the lift coefficient versus angle of attack at various flight conditions.
The lift coefficients at the given flight conditions meet mission specifications for stall speed and
takeoff.
-0.5
0
0.5
1
1.5
-10 -5 0 5 10 15 20
Lift
Co
eff
icie
nt
Angle of Attack (degrees)
Lift Curves
Stall
Cruise
Max

Page 36 of 63
Figure 24: Cl vs. Cd
Figure 24 depicts the lift coefficient versus the drag coefficient. Since the Lion usually
operates in a lift coefficient range of 0.2 – 0.65, the drag bucket for the given mission and flight
conditions is favorable.
-0.5
0
0.5
1
1.5
0 0.005 0.01 0.015 0.02
Lift
Co
eff
icie
nt
Drag Coefficient
Drag Polar
Stall
Cruise
Max
Page 37 of 63
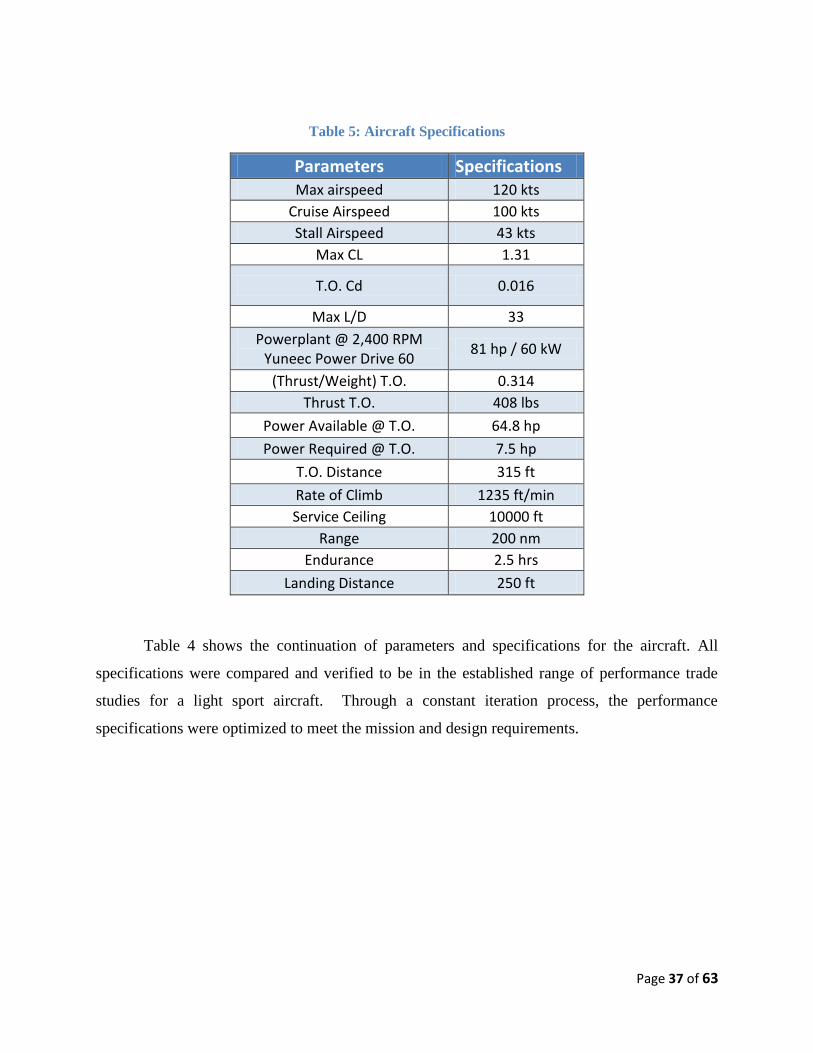
Table 5: Aircraft Specifications
Parameters Specifications Max airspeed 120 kts
Cruise Airspeed 100 kts
Stall Airspeed 43 kts
Max CL 1.31
T.O. Cd 0.016
Max L/D 33
Powerplant @ 2,400 RPM Yuneec Power Drive 60
81 hp / 60 kW
(Thrust/Weight) T.O. 0.314
Thrust T.O. 408 lbs
Power Available @ T.O. 64.8 hp
Power Required @ T.O. 7.5 hp
T.O. Distance 315 ft
Rate of Climb 1235 ft/min
Service Ceiling 10000 ft
Range 200 nm
Endurance 2.5 hrs
Landing Distance 250 ft
Table 4 shows the continuation of parameters and specifications for the aircraft. All
specifications were compared and verified to be in the established range of performance trade
studies for a light sport aircraft. Through a constant iteration process, the performance
specifications were optimized to meet the mission and design requirements.

Page 38 of 63
Turning Performance An analysis of turning performance is necessary to develop a flight envelope for the
aircraft. There are two key turning performance analyses which must be evaluated; instantaneous
pull-up and push-over, and steady level banked turn.
Instantaneous pull-up is a maneuver in which the aircraft is initially in steady level flight
followed by an instantaneous constant change in pitch attitude. In order to calculate the turning
radius in an instantaneous pull-up or push-over, the load factor needs to be found.
Load Factor
(32)
Once the load factor is found for a range of airspeeds, the instantaneous turn radius can be
determined.
Instantaneous Pull-Up Radius
( ) (33)
Instantaneous Push-Over Radius
( ) (34)
A range of instantaneous turn radii for the Lion are shown in Figure 25 below.
Figure 25: Instantaneous Turn Radius versus Velocity
0
50
100
150
200
250
300
350
400
450
500
0 20 40 60 80 100 120 140 160
Inst
anta
ne
ou
s Tu
rn R
adiu
s (f
t)
Velocity (kt)
Instantaneous Turn Radius vs. Velocity
Page 39 of 63
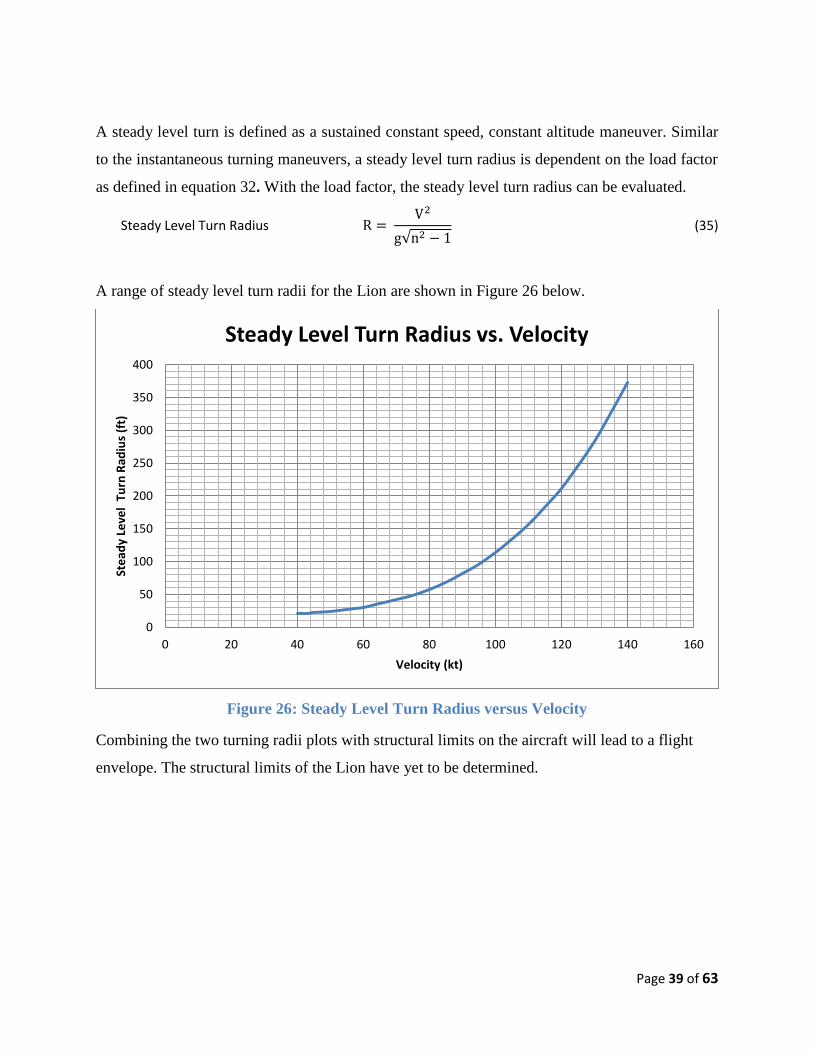
A steady level turn is defined as a sustained constant speed, constant altitude maneuver. Similar
to the instantaneous turning maneuvers, a steady level turn radius is dependent on the load factor
as defined in equation 32. With the load factor, the steady level turn radius can be evaluated.
Steady Level Turn Radius
√ (35)
A range of steady level turn radii for the Lion are shown in Figure 26 below.
Figure 26: Steady Level Turn Radius versus Velocity
Combining the two turning radii plots with structural limits on the aircraft will lead to a flight
envelope. The structural limits of the Lion have yet to be determined.
0
50
100
150
200
250
300
350
400
0 20 40 60 80 100 120 140 160
Ste
ady
Leve
l Tu
rn R
adiu
s (f
t)
Velocity (kt)
Steady Level Turn Radius vs. Velocity

Page 40 of 63
Flight and Gust Envelope
Figure 27: Flight and Gust Envelopes
The flight and gust envelopes for the Flyin’ Lion are shown in Figure 27. The
accelerated flight conditions are calculated using
where n represents the load factor on the aircraft. Exceeding this limit would stall the aircraft.
To avoid structural damage, the FAR limits the aircraft to a positive load factor at 3.8 Gs
and negative load factor -1.5 Gs. Note that these are structural yield limits. The ultimate
structural limits would have a certain factor of safety associated with it allowing the pilot to fly
above 3.8 G’s without breaking the aircraft. According to FAR standards, the limit load factor in
the negative region varies linearly from cruise speed to a load factor of zero at the dive speed.
Although the Lion is limited, as a light sport aircraft, to a maximum airspeed of 120 knots,
it is still possible for the aircraft to achieve a greater airspeed. To ensure safety at higher

Page 41 of 63
airspeeds, which may occur during a dive, the limit airspeed was determined as 50% higher than
the cruise speed and the aircraft was designed to handle such loads.
The red lines in Figure 27 indicate the gust envelope. In the case where the aircraft
encounters a gust, the flight condition of the aircraft will shift to the corresponding gust flight
condition. According to Figure 27, the Lion cannot handle a gust of 66 feet per second at any
time during flight. However, this condition rarely ever happens and the Lion should not be
flying in these sorts of conditions to begin with. The Lion would also have difficulties handling
a 30 feet per second flight condition, although it fairs slightly better especially if the aircraft
experiences a negative load factor as a result of the gust. At gusts of 15 feet per second the Lion
is well within the flight envelope for most airspeeds, meaning it is safe to fly. To determine the
gust envelope, the aircraft mass factor must first be calculated.
Aircraft Mass Factor ( ⁄ )
Using the mass factor, the gust alleviation factor can be calculated.
Gust Alleviation Factor
The gust alleviation factor is simply an empirical formula that is used to compensate for the gust
gradient, the airplanes response, and the lag in the change in lift due to the change in the angle of
attack. Finally, the load factor can be calculated:
Gust Load Factor
( ⁄ )
where Ude is equal to the gust speed and Ve equal to the aircraft’s equivalent airspeed. By
changing the airspeed of the aircraft to the values corresponding to those in Figure 27, the red
lines can be made.
Weight and Cost Estimation
In order to estimate costs, the aircraft was broken down into various sections. Several of
the sections were: the engine system and nacelle, the main fuselage and interior cabin, wing
Page 42 of 63
structure, and the empennage. Each of the sections were divided into a detailed component
listing which contained the manufacturer specifications, component unit weights, number of
parts, and part costs. The total kit price estimate was determined from the entire parts
breakdown. The overall kit price was estimated to be $46,000 for all of the aircraft components.
The price was competitive compared to a parent aircraft, the Pipistrel Virus, which cost $76,509
for the entire 400 hour aircraft kit. Various components were approximated and may be
over/under estimated. The aircraft skins and structural components were the main components
with the highest estimation errors. The cost of carbon fiber materials was estimated based on the
price per ft2. Several items will need to be added into the overall cost as miscellaneous hardware
parts, total electrical system wiring, and cooling systems. These additional items will continue to
increase the total cost. Once the final kit cost is determined, the estimates for production
quantities will be calculated. Variables such as manufacturing costs and labors will need to be
added. Generalized airframe material and equipment costs can be comparatively estimated for
non-pressurized aircraft using general aviation costing trends and graphs.

Page 43 of 63
Table 6: Weight and Cost Breakdown

Page 44 of 63
Stability and Control
First the neutral point was calculated giving the Flyin’ Lion its aft center of gravity limit.
Using Equation 29, the neutral point was found to be located at 0.46 aft of the chord from the
leading edge.
Next the forward limit center of gravity limit was determined. This limit is driven by the
down force need to safely control the aircraft when it is flying in ground effect and CL max. Using
Equation 30, the forward center of gravity was found to be 0.32 of the chord from the leading
edge.

Page 45 of 63
With the forward and aft limits of the center of gravity are determined, the interior layout
of the Lion was determined. Laying out the major contributors to weight the center of gravity
was determined and manipulated. Table 7 outlines the major contributors to weight as well as
their positions in the aircraft. After several iterations using Equation 31 the layout in Figure 28
was determined to allow the center of gravity to fit the limits.
Figure 28: Layout of Cabin and the C.G Locations of Weight Contributor’s
Table 7: Major Weigh Contributors and C.G. Locations from the Nose and Moment
Moment Calculation
Component Weight of Part (lb)
CG location from nose (ft)
Moment (ft*lb)
Passengers 400 8.2 3280
Batteries 200 3.5 700
Batteries 200 12 2400
Motor 42 2 84
Controller 30 10 300
Propeller 15 0.5 7.5
Seats 40 8.2 328
Tail 60 20.5 1230
Fuse+Wing 313 7.5 2347.5
Total Weight
1300 8.21 10677
Passengers
and seats
Propeller
Airframe C.G
Controller
Battery pack
Tail Section
Motor
Battery pack

Page 46 of 63
During the iterations to find a center of gravity it was noted that the passengers would be
best placed on the aircraft center of gravity. This is because the Lion’s only variation in weight
comes from passengers. Therefore, the passengers were placed very close to the center of gravity
of the Flyin’ Lion. The center of gravity gives the Lion a static margin of 11% as shown in
Table 8.
Table 8: C.G. Limits and Static Margin.
Forward limit Cg location aft limit
Distance from Nose (ft) 8.15 8.21 8.61
% Cord 0.33 0.35 0.46
Static Margin 0.11
Design Philosophy
While there are many successful Light Sport Aircraft in operation today, the market for
an electric-powered LSA is in its infancy. This emerging industry promises a bright future in
terms of low cost, fuel-efficient, and easy-to-fly recreational aircraft. An innovative new product
such as this poses many technical challenges and comes with investment risks. To overcome
these challenges and minimize risks, it is important to understand mistakes made in similar
designs and capitalize on design elements that proved successful. This includes adding new
technologies that would advance the performance of the final design. All of these considerations
dictate the design philosophy.
Some of the design considerations for this aircraft were inspired from the parent
aircraft. These include the Yuneec e430 and the Taurus Electro G2, depicted in Figures 7 and 8
respectively, among several other light electric powered aircraft. These airplanes provide a
reference point when the answer to a solution is not obvious. For instance, the size and moment
arm of the tail required for sufficient balance between stability and control was estimated by
studying the schematics of similar airplanes. The idea for a high aspect ratio for the wing came
from researching pictures and videos of parent aircraft. Since minimizing drag was a priority, a
laminar flow airfoil was used on the wing of this aircraft significantly cut down on profile drag
and a high aspect ratio was used to minimize induced drag. Also a high aspect ratio comes at a
cost of high root bending moment, but since the structure is composite, these loads can be carried

Page 47 of 63
effectively. The range and endurance depend on the type and size of batteries used, so batteries
used in previous electric airplanes were investigated to find suitable matches. Conversely, many
ideas for the aircraft were original. Several hours were spent in brainstorming sessions and
individual research in order to improve on the design through innovative ideas, including
instrument panel integrated with an iPad, and detachable and rechargeable batteries. Some of
these ideas are discussed later.
Weights
The initial estimate on the gross takeoff weight of the aircraft was determined to be 1300
pounds. This weight was based on the weights of the batteries needed to obtain the desired
performance, the weight of a pilot and flight trainer, and the limitations set forth on light sport
aircraft determined by the FAA & FAR. The estimated weight of the batteries needed to power
the airplane was 400 pounds. This weight was determined by comparing power and endurance
needs with other electric powered vehicles and research conducted on current batteries. Because
the aircraft is not powered using fuel, the “fuel” weight is constant throughout our range of
operations. The passenger weight of 400 pounds was an estimation based on an above average
weight of a person. The weight limitation on the light sport aircraft category, determined by the
FAA, is 1,320 pounds gross takeoff weight.
Wing Configuration and Planform
A high wing configuration was chosen because it offered better visibility below the
aircraft which is more beneficial for training. Another benefit of a high wing aircraft
configuration is that the wing spar will not interfere with the instrument panel or the cabin space.
The wing will have a high aspect ratio, a slight taper towards the outboard section, and blended
wing-tips. High aspect ratio wings are essential for high glide ratios, increased range, and longer
endurance. The downside to high aspect ratio wings is the large root bending moment, but
because of the aircraft’s stronger composite construction, the airframe can support these
increased loads. The planform of the wing will be mostly rectangular. This is to keep the
construction costs of the wing down. One downside of the mostly rectangular planform is that
the wing will have a less than elliptic lift distribution which translates to higher induced drag. To

Page 48 of 63
fix this problem, the wing has linear taper, washout, and raked wing-tips to bring the lift
distribution closer to elliptic. This also improves the stall characteristics of the wing. The aspect
ratio and taper ratio were decreased by making the chord relatively short at 3.5 feet.
Figure 29: NLF-0115
The airfoil section being used for the Lion is the NLF-0115, shown in Figure 29. This
airfoil was selected based on the size of the drag bucket, low profile drag, and it offered a Cl
range which matched our mission specifications. Natural Laminar Flow airfoils can maintain
laminar flow in some cases up to 50% of the chord length, and reduce the dependence of flow
separation with surface roughness. These airfoils were also designed for low speed, general
aviation aircraft like the Flyin’ Lion.
Fuselage and Cabin Design
Considering the Lion is a trainer aircraft, a two person side-to-side configuration was
determined to be appropriate. Having the student and the instructor sit side-by-side would make
communication easier and more effective. It would also make demonstrating a maneuver or
flight procedure an easier task for the instructor. The side-by-side configuration and battery
placement influenced the design of the fuselage.
Although there are innumerable starting points when it comes to fuselage design, one
could be to determine the cross-sectional shape. This is an obvious starting point because the
Page 49 of 63
cross-sectional shape is primarily influenced by the required payload of the aircraft. The idea is
to design the shape to accommodate passengers, crew, service equipment, flight electronics, and
luggage. Minimizing empty space and making most of the available space is important in
aircraft design because large parasite drag can translate into an increase in fuel consumption.
The two passengers in a side-by-side configuration made the design of the fuselage fairly
simple. An aerodynamic shape was drawn around the electric motor, passengers, and
batteries. The wetted area was reduced towards the aft region of the aircraft until reaching the
tail region. This estimation should be accurate because there is no need for a space to retract
landing gear or an area to store fuel.
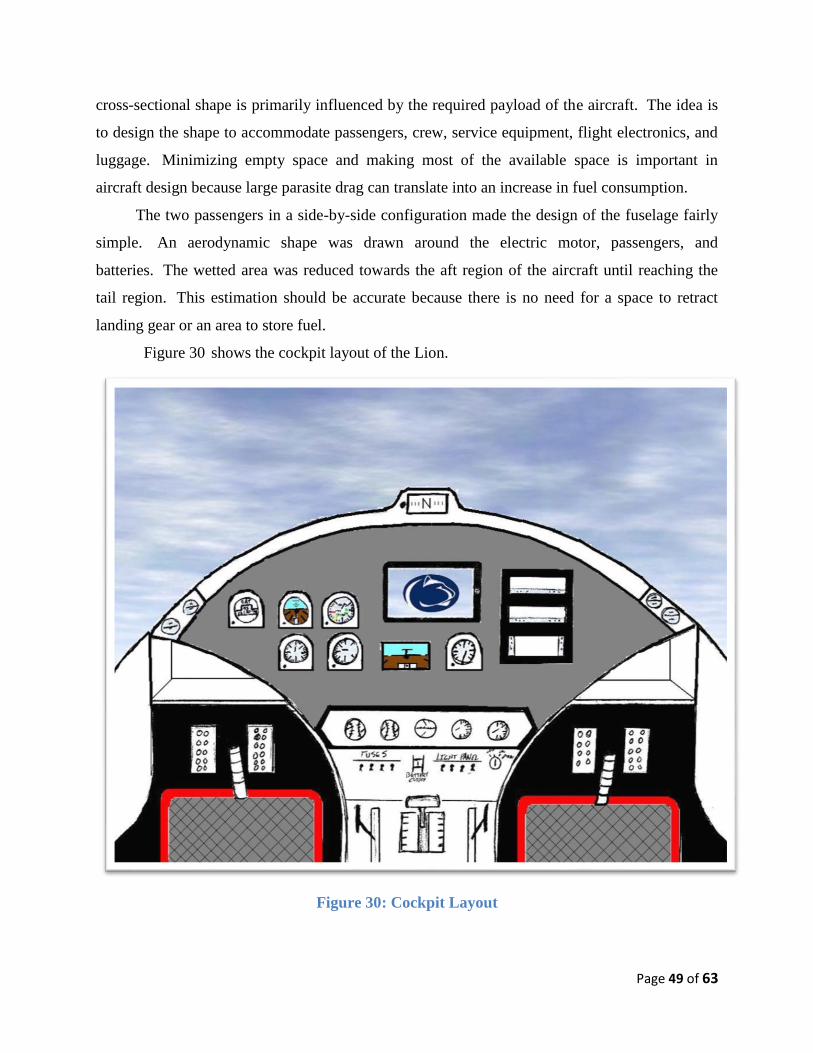
Figure 30 shows the cockpit layout of the Lion.
Figure 30: Cockpit Layout

Page 50 of 63
Tail Design
A T-tail configuration was selected for the empennage of the aircraft. This design was
decided primarily because of the stability the aircraft would gain from the benefits of a high tail.
The high tail configuration reduces the downwash parameter of the tail, which is the amount of
air directed downward on the tail from the main wing. A smaller downwash parameter results in
a further aft neutral point. This is essential for our aircraft because the position of the batteries
can be changed in a finalized design and the fact that aircraft can be flown with one or two
passengers.
A T-tail design was also somewhat of an adoption of many glider designs. To give the
Lion high glide characteristics and low drag the best place to look was at gliders. The fact that
many gliders utilized T-tails was an assurance that it was a good design decision. The airfoil that
was selected for both the horizontal and vertical stabilizers was the Eppler 521 depicted in Figure
31, which was deemed to be the optimum choice for the mission of the Lion.
Figure 31: Horizontal & Vertical tail Airfoil
The airfoil section for the horizontal tail was decided to be a symmetric airfoil at a positive tail
incidence angle. The positive tail incidence angle of the airfoil will produce the down-force on
the tail needed at the wing-body’s zero angle of attack. This will also help with the stability of
the airplane. For the elevator sizing, the lion has been fitted with an all-moving elevator. During
the stability and control calculations the elevator effectiveness factor became extremely
Page 51 of 63
important in the calculation of the forward center of gravity. In order for the lion to be able to be
controllable at max CL and in ground affect, the effectiveness of the elevator had to be 1.
Batteries and Electric Motor System
The primary objective of the battery system was to supply 2 hours mission time for the
designated flight envelope and design speeds. The largest power draw during flight will be
during takeoff and climb. The minimal power setting will be during descent. In order to choose
a proper battery system, various characteristics and trends in the development of battery
technology were considered:
1. Engine Output: 50-65 kW ideal engine power for the light sport aircraft of similar
size. This figure is expected to rise significantly with improving battery
technology over the next few years.
2. Type of battery system - The most common battery types are Lithium Ion, Lithium
Polymer, or Lithium – “Metal Air Batteries.”
3. Battery system weight - High energy density (Whr/kg delivered) batteries are
preferred. Three to four year projections suggest that energy density will be
increased, resulting in an increase in power output of 10%.
4. Type of Motor – Out-runner Brushless DC Electric Motors were considered for
convenience of propeller placement, motor cooling, higher efficiency, decreased
size, and decreased weight (weight to power ratio). The disadvantage is that it
costs more.
5. Battery Management System (Controller) - Required to control the energy flow and
distribution to and from the batteries to ensure that the system runs efficiently and
does not completely drain the battery system.
The battery system will be the power source for the entire aircraft and will be important
to achieve the desired design specifications. Also, all navigation, communication, and aircraft
indicators will be powered from the battery system. These secondary systems will create a power
draw on the batteries. To accommodate these additional power draws, the battery system will
Page 52 of 63
need to have the maximum excess power. The excess power will allow for additional take-off
and climb demands as well as the proper operation of the secondary systems.
The type of battery system selected determines the type of controller system necessary,
the cooling requirements, the max power output, as well as the cost of the overall system. The
system for our LSA will be a balanced integration of the optimal characteristics using the
projected trends available in a few years. The primary battery system inserted in aircraft was the
Lithium Ion battery due to the high energy density, projected to be around 240 kWH/kg. This
allows for the highest power-to-weight ratio. The weight of the battery system is expected to be
around 20-25% of the entire aircraft weight, since the aircraft is primarily composite materials.
Another component of the battery system is the battery management system controller.
The controller can be expected to add an additional 20-40 pounds, but is necessary to ensure the
proper distribution of power from the battery system. An efficient controller, though it may have
higher costs, will allow for a longer flight time and help to create prolonged battery life. The
controller directly monitors the out-runner brushless DC electric motor that was selected for the
design. The RPM’s are directly related to the controller as well as the entire aircraft electrical
system.
The Yuneec Power Drive 60 out-runner brushless DC electric motor was selected for the
design because of the amount of benefits compared to the disadvantages. The Power Drive uses a
60kW motor to provide enough power and thrust to meet the aircraft mission specifications. The
location of the stator as the main mounting hub, allowed for easy propeller set up. Also, the
location allows for easy set-up of air ducts to help cool the motor. The efficiency of the
brushless vs. brush engine was notably higher and was worth the higher cost. As future trends
progress, improvements in the electromagnetics of the brushless system will help reduce the
costs. Future trends will also continue to increase the power-to-weight ratio and decrease the
size.
The most important factor of the entire batter system was to have the best power-to-
weight ratio. This will allow for the largest excess power in the system. The advancement in the
battery and management systems helps to further increase the power output of the system. Each
component of the battery system was selected based on the weight contribution to the entire
aircraft. A benefit of the electric system is that the weight will remain constant during flight.

Page 53 of 63
Innovations in the Design
The idea to incorporate an iPad into the instrument panel may sound like a gimmick or a
novelty at first, but the power of third party software developers should not be
underestimated. There are iPad applications, otherwise known as ‘apps’, targeted towards
aviation enthusiasts. Some of these apps such as ‘Foreflight: Intelligent Apps for Pilots’
supplement already existing Avionics. Some of the features in this particular app include
realtime, terrain-based maps, radar, satellite imagery, winds, ceilings, flight rules, temperatures,
forecasts and flight planning. This could be an invaluable tool for an instructor allowing him/her
to teach a student about safe flying techniques. Another advantage of using an iPad on board is
that it is a light and compact electronic that comes with its own batteries. For particularly bright
conditions, the iPad can be fit with an anti-glare screen. Even with modest use, iPad 2 has a
battery life of up to 10 hours, sufficient for an entire day’s training sessions.
It is no secret that carbon composite structures are increasingly being used in aerospace
applications these days and for good reason. The high strength-to-weight ratio and excellent
rigidity characteristics make it an appealing material to use on airframes. Although it is more
expensive than aluminum, carbon fiber-reinforced polymer materials offset some of the weight
issues that arise with the use of relatively heavy batteries in the case of an electric LSA. Another
advantage is that the high strength and low weight allows the aircraft to have better performance
characteristics. It is important for this trainer aircraft to be able to perform flight maneuvers
safely and effectively.
Focus of the Design
The focus of this project was always directed to coming up with a better design while
keeping mission requirements and cost in mind. For instance, this aircraft does not have to
perform acrobatics or combat; therefore it does not require any of those performance
characteristics. However, it does need to accommodate two people, fly using an efficient electric
engine, and do so while staying within the legal parameters of what is considered a “light sport
aircraft.” Balancing these requirements and restrictions and going through several iterations, an

Page 54 of 63
interim design was determined. The proposed aircraft has mostly simple features with
innovative ideas and excellent performance characteristics, making it ideal for training
purposes. It is simple so beginners can operate it without a huge learning curve. Most
importantly, it is electric-powered so it stays ahead of the competition that is inevitable in the
future of aviation.

Page 55 of 63
References
Leland M. Nicolai, G. E. (2010). Fundamentals of Aircraft and Airship Design. Reston, Virginia: American
Institute of Aeronautics and Astronautics.
McCormick, B. W. (1995). Aerodynamics, Aeronautics, and Flight Mechanics. Hoboken, NJ: John Wiley &
Sons, Inc.
McCormick, B. W. (2011). Introduction to Flight Testing and Applied Aerodynamics. Reston, Virginia:
American Institute of Aeronautics and Astronautics.
Yuneec Power Drive 60
http://www.yuneec.com/PowerMotor_Tech_spec.html
Electric Controllers, Outrunner Engine, Batteries, Battery Management Systems
http://www.eaa.org/experimenter/articles/2010-05_electric.asp
http://www.sonexaircraft.com/research/e-flight/electric.html
Battery Configuration
http://www.flightglobal.com/assets/getAsset.aspx?ItemID=33533
Lithium Ion Batteries
http://www.lange-aviation.com/htm/english/products/antares_20e/battery_system.html
Costs and Types of Electric Battery Systems
http://www.transportation.anl.gov/pdfs/TA/149.pdf
Eco Friendly Electric LSA
http://www.ecofriend.com/entry/10-zero-emission-electric-aircrafts/
Aircraft Performance Specs and Runway Take Off and Landing Info
http://www.free-online-private-pilot-ground-school.com/aircraft_performance.html
T-Tail Figure
http://www.docstoc.com/docs/40111509/Aircraft-Empennage-With-Fixed-Trailing-Edge-Horizontal-
Stabilizer---Patent-4790494
NACA 0009 Horizontal Tail Airfoil
http://www.worldofkrauss.com/foils/draw/1744.png?axes=true&chord=5
Piper J-3 Cub Picture
http://altairva-fs.com/fleet/ava_fleet_piperj3cub.htm

Page 56 of 63
Yuneec e430 Picture
http://goodcleantech.pcmag.com/aviation/279285-yuneec-e430-electric-light-sport-aircraft\
Pipistrel Taurus Electro G2 Picture
http://www.technologicvehicles.com/en/actualite-mobilite-verte/569/video-le-planeur-electrique-
autonome-pipistre
Electric Power Formula’s for UAV (Used for modified Range and Power Output Equations)
http://contentdm.lib.byu.edu/ETD/image/etd1223.pdf
Sample Mission Picture:
http://history.nasa.gov/SP-4404/ch8-3.htm
Component Pricing Main Website
"Airframe Parts from Aircraft Spruce." Pilot Supplies, Avionics, and Homebuilt Aircraft Parts
from Aircraft Spruce and Specialty Co.. N.p., n.d. Web. 15 Mar. 2012.
<http://www.aircraftspruce.com/menus/ap/index.html>.
"Aircraft." Cheif Aircraft. N.p., n.d. Web. 15 Mar. 2012. <www.chiefaircraft.com/aircraft>. FAA General Aircraft Costings
"Aircraft Weight and Balance Handbook." Federal Aviation Administration 9 July 2007: 97. Carbon Fiber Estimation Costs
"Carbon Fiber Manufacturing - 4'x8'x.050 carbon fiber flat sheet (Powered by CubeCart)."
Welcome to Carbon Fiber Manufacturing. N.p., n.d. Web. 15 Mar. 2012.
<http://www.carbonfibermanufacturing.net/Shop/index.php?act=viewProd&productId=5
90>. Yuneec Motor and E Charger
"Yuneec - Power_Drive_Motor." Yuneec : Home. N.p., n.d. Web. 15 Mar. 2012.
<http://www.yuneec.com/PowerMotor_Tech_spec.html>.

Page 57 of 63
Engine Costs
"Four Stroke." Lockwood Aviation Supply - Welcome. N.p., n.d. Web. 15 Mar. 2012.
<http://www.lockwood-aviation.com/Four_stroke.htm>. Pipistrel Virus Kit Pricing Site
"Pipistrel USA, Sinus, Virus, Taurus, Apis LSA Aircraft Motorgliders Gliders Kit price list
2010." Pipistrel USA, Sinus, Virus, Taurus, Apis LSA Aircraft Motorgliders Gliders.
N.p., n.d. Web. 15 Mar. 2012. <http://pipistrel-usa.com/price-list/price-2010-kit.html>. General Manufacturing Costs Lew, James. "Planning a General Aviation Product." 76-82. Print.
Equation Numbers from this Report Referenced Text
Equations 18, 19, 22, 23, 24 Leland M. Nicolai, G. E. (2010).
Fundamentals of Aircraft and Airship Design.
Reston, Virginia: American Institute of
Aeronautics and Astronautics. Equations 4, 5, 6, 7, 8, 16, 17, 21 McCormick, B. W. (1995). Aerodynamics,
Aeronautics, and Flight Mechanics. Hoboken, NJ:
John Wiley & Sons, Inc.
Equations 1, 2, 3, 9, 10, 13, 14, 16, 20, 28, 29, McCormick, B. W. (2011). Introduction to Flight
Testing and Applied Aerodynamics. Reston,
Virginia: American Institute of Aeronautics and
Astronautics.
Equations 25, 26, 27 Electric Power Formula’s for UAV (Used for
modified Range and Power Output Equations)
http://contentdm.lib.byu.edu/ETD/image/etd1223.p
df
Equation 30 Morelli, P. (1976). Stability and Control of Sailplanes. Voorburg: Levrotto & Bella.

Page 58 of 63
Appendix I: Aircraft Specifications
Parameters Specifications Max airspeed 120 kts
Cruise Airspeed 100 kts
Stall Airspeed 43 kts
Max CL 1.31
T.O. Cd 0.016
Max L/D 33
Powerplant @ 2,400 RPM Yuneec
Power Drive 60 81 hp / 60 kW
(Thrust/Weight) T.O. 0.314
Thrust T.O. 408 lbs
Power Available @ T.O. 64.8 hp
Power Required @ T.O. 7.5 hp
T.O. Distance 315 ft
Rate of Climb 1235 ft/min
Service Ceiling 10000 ft
Range 200 nm
Endurance 2.5 hrs
Landing Distance 250 ft

Page 59 of 63
Parameters Specifications Taper Ratio 0.94
Chord (average) 3.25 ft
Length 23 ft
Wingspan 46 ft
Height 9 ft
Wing Area 156 ft2
Aspect Ratio 13.56
Empty Weight 900 lbs
Battery Weight (lithium Ion
battery Packs)
400 lbs
Max T.O. Weight 1300lbs
Energy Density 240 WH/kg
Wing Loading 6.8 lb/ft2
Vh 0.82
Sht 16 ft2
bht 8 ft
cht 2 ft
ARht 4.0
Vv 0.042
Svt 13.5 ft2
bvt 4.50 ft

Page 60 of 63
cvt 3.00 ft
ARvt 1.5
Appendix II: Panel Method for Windows In order to properly obtain a span efficiency for the wing, the use of panel methods for
windows was used. The method uses coefficients such as the non-dimensional airfoil coordinates,
leading edge positions, aspect ratio, chord length, and angle of attack for the semi-span of the
wing. The hybrid coefficient result was obtained by using the wake influence and relaxation over
24 different filaments a span efficiency value of 0.9606. Refer to Figures A1 and A2 for a visual
representation of Panel Method for Windows.
Figure A1: Top View Panel Method for Windows

Page 61 of 63
Figure A2: Back View Panel Method for Windows
Appendix III: X-Foil

Page 62 of 63
Appendix IV: Aileron Roll Rate Calculations
% This Code will be used to determine the Aileron Size of the Flyin' Lion
% Constants
PI = 3.14159;
d2r = PI/180; % Degrees 2 radians
r2d = 180/PI; % Radians 2 degrees
chord = 3.5; % Feet
V = 169; % Ft/sec (Velocity)
b = 46; % Span in Feet
rho = .002048; % Density @ 5000 ft ( Slugs/ ft^3)
a = 1.25; % Per Radians (Lift Slope)
tau = .6; % Flap efficiency factor
y1 = 20; % Outboard edge of the aileron from mid-span (Ft)
y0 = 15; % Inboard edge of aileron from mid-span (Ft)
del_a = 20; % Aileron Deflection (degrees)
semi_span = 23; % Ft
S = 156; % Area of wing (Ft^2)
% Calculations
L_del_a = 0.5*rho*V^2*a*tau*del_a*d2r*(0.5*y1^2-0.5*y0^2);

Page 63 of 63
Cl_del_a = L_del_a/( S*b*0.5*rho*V^2*del_a*d2r);
Clp = (2*a*chord*(semi_span^3))/(3*S*b*V);
% Roll Rate Calculation
p = Cl_del_a*del_a*d2r*V/(semi_span*Clp);
p= p*r2d