electric vehicle applications for urban travelers...
TRANSCRIPT

Southwest Region University Transportation Center
Electric Vehicle Applications for Urban Travelers:
Technology, Cost, and the Market
SWUTC/96/465530-1
Center for Transportation Research University of Texas at Austin
3208 Red River, Suite 200 Austin, Texas 78705-2650

~ 2. Government Accession No. 1. Report No.
SWUTC/96/465530-1 4. Title and Subtitle
Electric Vehicle Applications for Urban Travelers: Technology, Cost, and the Market 1. Author(s)
Lila Paige Warren and Mark A. Euritt
9. Performing Organization Name and Address
Center for Transportation Research University of Texas at Austin 3208 Red River, Suite 200 Austin, Texas 78705-2650
12. Sponsoring Agency Name and Address
Southwest Region University Transportation Center Texas Transportation Institute The Texas A&M University System College Station, Texas 77843-3135
15. Supplementary Notes
Technical Report Documentation Page
3. Recipient's Catalog No.
5. Report Date
March 1996 6. Perfonning Organization Code
8. Perfonning Organization Report No.
Research Report 465530-1 10. Work Unit No. (l'RAIS)
11. Contract or Grant No.
0079
13. Type of Report and Period Covered
14. Sponsoring Agency Code
Supported by a grant from the Office of the Governor of the State of Texas, Energy Office 16. Abstract
This report examines the viability of the electric vehicle (BV) as a partial solution to Texas' air quality problems. According to the 1990 Federal Clean Air Act, mobile source pollution is the primary contributor to poor air quality in the United States. Texas is among the top 10 emitting states for several air pollutants. In Texas, approximately 71 percent of the total local travel occurs in the Texas cities with populations over 200,000. Such urban areas are clearly most in need of air quality improvement. The technology of the EV makes it most suitable for urban travel. This report investigates whether this apparent match between need and technology is viable in market terms. Chapter One describes the air quality, energy security, and global warming issues that have prompted research into alternative fuels such as the EV, and describes the legislative initiatives that have provided funding for this research. Chapter Two examines the current state of EV technology. Chapter Three provides a life-cycle cost analysis of the EV. In particular, this chapter assesses the economic costs of such externalities as air pollution, and compares the cost of gas vehicles and EV s if such externalities are taken into account. Chapter Four analyzes the potential market for EVs. This chapter surveys current research on the market for EVs, and then introduces the Center for Transportation Research Interactive Web Survey, designed by the author. This survey combines some of the most promising features of previous EV market research--especially research that serves to educate the public and air quality as well as gathering information about vehicle use--in a low-cost, widely-distributable format. The report concludes by examining the data from this survey in light of EV technology, cost and potential marketability.
11. Key Words 18. Distribution Statement
Battery-Powered Vehicle, Electric Vehicle, Zero Emission Vehicle, Alternative Transportation Fuels, Alternative Fueled Vehicle
No Restrictions. This document is available to the public through NTIS:
19. Security Classif.(ofthis report)
Unclassified Form DOT F 1700.7 (8-12)
National Technical Information Service 5285 Port Royal Road Springfield, Virginia 22161
120. Security Classif.(ofthis page) 21. No. of Pages
Unclassified 86 Reproduction of completed page authorized
1 22. Price

ELECTRIC VEHICLE APPLICATIONS FOR URBAN TRAVELLERS: TECHNOLOGY, COST, AND THE MARKET
by
Lila Paige Warren
and
Mark Allen Euritt
Research Report SWUTC/96/465530-1
Southwest Region University Transportation Center
Center for Transportation Research
The University of Texas at Austin
Austin, Texas 78705-2650
March 1996

EXECUTIVE SUMMARY
The air quality in many urban areas in Texas continues to worsen and increasing personal
travel adds to this problem. The battery-powered electric vehicle (EV) is a viable alternative to the
gasoline-powered vehicle for many of these areas. This report contains a life-cycle cost analysis as well
as an analysis of the market potential of the EV. Based on life- cycle costs, including the social costs of
pollutants, the EV compares favorably with the gasoline-powered vehicle. As battery technology
improves, and production of batteries increases, the EV will become even more attractive using the
cost criterion. In addition, the market potential of EV appears favorable. Respondents to a survey
administered over the Internet as part of this project show that there is a significant portion of the
population which can accommodate the limited range of the EV in their household travel. In addition,
participants in the survey showed that the more information they had about both technical attributes
and social benefits of the EV, the more likely they were to consider acquiring an EV. These findings
suggest that both technological development and consumer education are necessary for the market
success of the EV as a partial solution to Texas' air quality problems.
111

ACKNOWLEDGEMENTS
This publication was developed as part of the University Transportation Centers Program,
which is funded 50% in oil overcharge funds from the Stripper Well settlement as provided by the
Texas State Energy Conservation Office and Approved by the U.S. Department of Energy.
Mention of trade names or commercial products does not constitute endorsement or
recommendation for use.
iv

ABSTRACT
This report examines the viability of the electric vehicle (EV) as a partial solution to Texas' air
quality problems. According to the 1990 Federal Clean Air Act, mobile source pollution is the primary
contributor to poor air quality in the United States. Texas is among the top 10 emitting states for
several air pollutants. In Texas, approximately 71 per cent of the total local travel occurs in the Texas
cities with populations over 200,000. Such urban areas are clearly most in need of air quality
improvement. The technology of the EV makes it most suitable for urban travel. This report
investigates whether this apparent match between need and technology is viable in market terms.
Chapter One describes the air quality, energy security, and global warming issues that have
prompted research into alternative fuels such as the EV, and describes the legislative initiatives that
have provided funding for this research. Chapter Two examines the current state of EV technology.
Chapter Three provides a life-cycle cost analysis of the EV. In particular, this chapter assesses the
economic costs of such externalities as air pollution, and compares the cost of gas vehicles and EVs if
such externalities are taken into account. Chapter Four analyzes the potential market for EVs. This
chapter surveys current research on the market for EVs, and then introduces the Center for
Transportation Research Interactive Web Survey, designed by the author. This survey combines
some of the most promising features of previous EV market research--especially research that serves
to educate the public about air quality as well as gathering information about vehicle use--in a low-cost,
widely-distributable format. The report concludes by examining the data from this survey in light of EV
technology, cost, and potential marketability.
v

TABLE OF CONTENTS
CHAPTER 1. INTRODUCTION ............................................................................................ 1
PROBLEM DEFINITION ....................................................................................................... 1
Air Quality ........................................................................................................................... 3
Energy Security .................................................................................................................. 5
Global Warming ................................................................................................................... 5
ALTERNATIVE FUELS INITIATiVES .................................................................................... 6
Legislative and Regulatory .................................................................................................. 6
Utilities ............................................................................................................................... 9
Other Corporations ............................................................................................................. 9
CHAPTER 2. ELECTRIC VEHICLE TECHNOLOGY .............................................................. 11
BATIERIES ....................................................................................................................... 11
United States Advanced Battery Consortium ........................................................................ 11
Battery Technologies .......................................................................................................... 12
FUEL CELLS ..................................................................................................................... 13
How Fuel Cells Work ........................................................................................................... 1 3
Classification of Fuel Cells ................................................................................................... 1 4
Comparison of Fuel Cells with Batteries ................................................................................ 1 4
HYBRID VEHiCLES ............................................................................................................ 1 5
ROADWAY ELECTRIFiCATION ........................................................................................... 16
CHAPTER 3. DETERMINING ELECTRIC VEHICLE COSTS .................................................. 17
DETERMINING MARKET VEHICLE COSTS ........................................................................ ;17
Ownership and Operating Costs for GVs .............................................................................. 1 8
Life-Cycle Cost Analysis Gasoline Vehicle ............................................................................ 1 9
Life-Cycle Cost Analysis Electric Vehicle .............................................................................. 21
Comparison and Summary of GV and EV Life-Cycle Cost... .................................................... 24
DETERMINING EXTERNAL COSTS ..................................................................................... 25
Air Pollution Emissions ........................................................................................................ 25
Monetary Values of Air Pollution Emissions .......................................................................... 29
Monetary Values of Energy Security .................................................................................... 32
CONCLUSIONS ................................................................................................................. 32
vi

Market and External Costs ................................................................................................... 32
Break Even Prices .............................................................................................................. 35
CHAPTER 4. MARKET PENETRATION OF ELECTRIC VEHICLES ....................................... 36
PROBLEM STATEMENT .................................................................................................... 36
CURRENT RESEARCH ON THE ELECTRIC VEHICLE MARKET ........................................... 37
Traditional Approaches ....................................................................................................... 38
Game-type surveys ............................................................................................................. 39
SURVEYS AND MODELS ................................................................................................... 42
THE CENTER FOR TRANSPORTATION RESEARCH INTERACTIVE WEB SURVEY .... 44
Relation to Previous Research ................................................................................... .-........ .44
Survey Design .................................................................................................................... 45
Survey Distribution ............................................................................................................. 4 7
Summary of Data Collected by Survey .................................................................................. 49
Conclusions of Survey ........................................................................................................ 53
EVALUATING THE PREFERENCE ELICITATION PROCESS FOR ELECTRIC VEHICLE
MARKET RESEARCH ........................................................................................................ 53
Reference Points ............................................................................................................... 54
New Technology ................................................................................................................ 56
Public Goods ...................................................................................................................... 57
REFERENCES ................................................................................................................... 59
APPENDIX A ...................................................................................................................... 64
APPENDIX B ...................................................................................................................... 71
vii
- --~- -- ---~ - --- ---- ~---~I------------ --~ -- - ------ ~

LIST OF FIGURES
Figure 4.1 Survey Outline ................................................................................................... 46
Figure A.1 CO Emissions from Highway Vehicles ................................................................. 65
Figure A.2 NOx Emissions from Highway Vehicles ................................................................ 66
Figure A.3 VOC Emissions from Highway Vehicles ............................................................... 67
Figure AA S02 Emissions from Highway Vehicles ............................................................... 68
Figure A.5 Pb Emissions from Highway Vehicles .................................................................. 69
Figure A.6 PM-10 Emissions from Highway Vehicles ............................................................ 70
LIST OF TABLES
Table 2.1 USABC Primary Criteria ........................................................................................ 1 2
Table 3.1 Characteristics of the GVs in the Life-Cycle Cost Analysis ....................................... 2 0
Table 3.2 Characteristics Of EVs In The Life-Cycle Cost Analysis ........................................... 22
Table 3.2 Characteristics Of EVs In The Life-Cycle Cost Analysis (continued) ......................... 23
Table 3.3 Summary of Ownership And Operating Costs GVs ................................................. 24
Table 304 Summary of Ownership and Operating Costs of EVs .............................................. 24
Table 3.5 Fuel Cycle Emissions for GVs ............................................................................... 26
Table 3.6 Vehicle Combustion and Evaporative Emissions for GVs ....................................... 26
Table 3.7 Full Fuel Cycle Emissions for GVs ......................................................................... 27
Table 3.8 Percentage of Electricity Generated by Different Fuels .......................................... 27
Table 3.9 Electric Power Emissions for Compact EVs ........................................................... 28
Table 3.10 Electric Power Emissions for Intermediate-Sized EVs .......................................... 28
Table 3.11 Estimated Emissions Values for Texas ................................................................ 30
Table 3.12 Estimated Urban Emissions Values for Texas for GVs (cents/mile) ......................... 30
Table 3.13 Estimated Urban Emission Values for Texas for Compact EVs (cents/mile) ............. 31
Table 3.14 Estimated Urban Emission Values for Texas for Intermediate EVs (cents/mile) ....... 31
Table 3.15 Estimated Total Costs for GVs ............................................................................ 33
Table 3.16 Estimated Total Costs for Compact EVs .............................................................. 33
Table 3.17 Estimated ~otal Costs for Compact EVs., ............................................................. 34
Table 3.18 Estimated Total Costs for Intermediate EVs (Case 2a) .......................................... 34
Table 3.19 Estimated Total Costs for Intermediate EVs (Case 2b) .......................................... 35
viii

Table 4.1 Survey Demographics ......................................................................................... 50
Table 4.2 Primary Concerns of Respondents Unwilling to Consider an EV ............................. 52
Table 4.3 Impact of Information About Social Benefits on Respondents Initially Unwilling
to Consider an EV ................................................................................................ 52
Table B.1 Ownership And Operating Costs Of A Compact GV (Case 1) .................................. 72
Table B.2 Ownership And Operating Costs Of An Intermediate GV(Case 2) ........................... 73
Table B.3 Ownership And Operating Costs Of A Compact EV ............................................... 74
Table B.4 Ownership And Operating Costs Of A Compact EV ............................................... 75
Table B.5 Ownership And Operating Costs Of An Intermediate EV (Case 2a) ......................... 76
Table B.6 Ownership And Operating Costs Of An Intermediate EV (Case 2b) ......................... 77
ix
-- --- -- - -- -- - -----1---- ------

CHAPTER 1. INTRODUCTION
PROBLEM DEFINITION
At the end of 1987,68 metropolitan areas were exceeding ambient air quality standards for
ozone and 59 were exceeding carbon monoxide standards. A total of 107 areas, including the 24
largest metropolitan regions, containing 135 million people, were violating one or both standards"
(Greene 1988: 227). The transportation sector in the U.S. is the 'single largest consumer of oil in this
country. The use of this fuel contributes significantly to the following pollutants: carbon monoxide,
nitrous oxides, volatile organic compounds, sulfur dioxide, lead, and particulate matter. Measures
such as the Corporate Average Fuel Economy (CAFE) standards, while helpful, have not been able to
solve these problems.
The 1990 Amendments to the Federal Clean Air Act (CAAA) recognizes mobile source
pollution as a primary contributor to poor air quality in the United States. The Act has taken measures
such as further tightening emission standards and requiring the use of reformulated gasoline,
beginning in 1995, in nine urban areas with the worst ozone problems. However, in some cases such
as California, New York, and Massachusetts, it is the states which are taking the lead and mandating
emissions standards even more stringent than the federal regulations. In addition, under the
Intermodal Surface Transportation Efficiency Act of 1991 (ISTEA), air quality has emerged as a
legislative priority. Perhaps more emphatically than any other piece of transportation legislation, ISTEA
addresses the air quality problem. ISTEA directly ties itself to the 1990 CAAA and in so doing
indirectly gives priority to air quality as the most urgent transportation planning goal of this country.
Under ISTEA legislation, transportation projects considered for funding will have to conform with air
quality goals. Although other stated goals of ISTEA are backed by funding and regulations, they have
nothing comparable to the conciseness and power of the CAAA to back them up. Due to the link
between ISTEA and CAAA, air quality has moved from being just one of many criteria for
transportation projects to being a priority for transportation planning.
Many lawmakers and researchers have turned to alternative fueled vehicles (AFVs) to address
these air quality problems and the legal and regulatory pressures they have spawned. Concern over
air quality in the late sixties led to solutions that reduced new vehicle emissions levels by an order of
magnitude (USDOE 1992: 37). AFVs also offer economic and political benefits. Energy supply and
price shocks, such as those seen in the 1970's, can be ameliorated by reducing dependence on
imported petroleum through the use of other fuel sources. AFVs are not the panacea to the crises the
transportation sector of this country is presently facing, but they do provide the possibility of mitigating
1

some of these problems.
Strategies for decreasing air pollution in non-attainment areas contain aggressive plans for
AFVs. For example, the California Air Resources Board (CARB) has announced that two percent of all
cars sold in California by 1998 must be zero emitters, and the number increases to ten percent by
2003. Also, since 1991 in Texas, new vehicle purchases by Texas public agencies have been
required to be capable of operation on an alternative fuel. Although these goals may be ambitious, the
need to curtail tail pipe emissions is clear. This report will address the pivotal and challenging role the
transportation planner plays in evaluating and implementing one of the most promising of alternative
fuels policies, the promotion of the electric vehicle (EV).
The EV is particularly well suited to metropolitan areas. Metropolitan population grew from 56
percent of the total population in 1950 to 77 percent of the total population in 1990 (US DOT 1994:
51). Metropolitan travel accounts for an increasingly large proportion of all personal vehicle travel each
year. In fact, in Texas approximately 71 percent of the total local travel occurs in the Texas cities with
populations over 200,000 people (Euritt et al.: 2). Clearly such urban areas are most in need of air
quality improvement. Furthermore, residents in urban areas on average travel distances well within
present day EV range. This report focuses on the Texas urban traveler.
This report describes the debate surrounding the EVand attempts to analyze critically the
arguments of proponents as well as critics. The EV is often cited as the solution to the air quality
problem because it produces no tail pipe emissions. Another well-known benefit of the EV is that it
allows for flexibility between fuel sources. This factor can allow the EV to be potentially beneficial to air
quality (if the right fuel mix is used for producing electricity) as well as potentially allowing the
transportation sector to decrease its dependence on foreign fuel sources. Other added advantages
such as lower maintenance costs and reduced noise pollution are often cited. On the other hand,
critics of the electric vehicle allege that the EV cannot compete in the marketplace with conventional
gasoline powered vehicles. First, the power source technology of EVs does not produce ranges and
speeds that automobile consumers will accept. Second, the cost of an electric vehicle is prohibitively
high. And finally, there is debate as to whether or not the emissions of the electric power plants offset
the benefits of zero tail pipe emissions.
In addressing these various issues, this report begins with an overview of the EV, including
reasons for researching and developing AFVs and the specific legislative and regulatory measures
that have been implemented to address those concerns. Next, this report includes a description of
EV technology, including battery as well as fuel cell technology, existing hybrid vehicle technology,
and roadway electrification technology. The third chapter will address how EVs compare to gasoline
powered vehicles in terms of cost. The primary focus in this chapter is estimates of vehicle owning and
2
operating costs and of costs of emissions. The fourth chapter describes current research on the
market penetration of EVs. Then the chapter describes an original survey designed by the Alternative
Transportation Fuels Program of the Center for Transportation Research, commenting on its
relationship to previous research. The chapter concludes by describing the results of the survey.
This report set out to explore the following questions: if consumers were aware of the social
costs of operating conventional gas-powered vehicles (GVs), would they be willing to consider
purchasing an EV instead? Would consumers trade off the low purchase price, engine power, and
convenience of a GV for the clean-air benefits of the EV? These questions, however, must be viewed
in the context of the relative unavailability of EVs to consumers. No matter how a survey participant
responds to the question, "Would you be willing to purchase an EV for urban use?" he or she cannot
then go out and purchase one. Thus, the research this report brings together must be considered a
preliminary step in the marketing of EVs or any AFV.
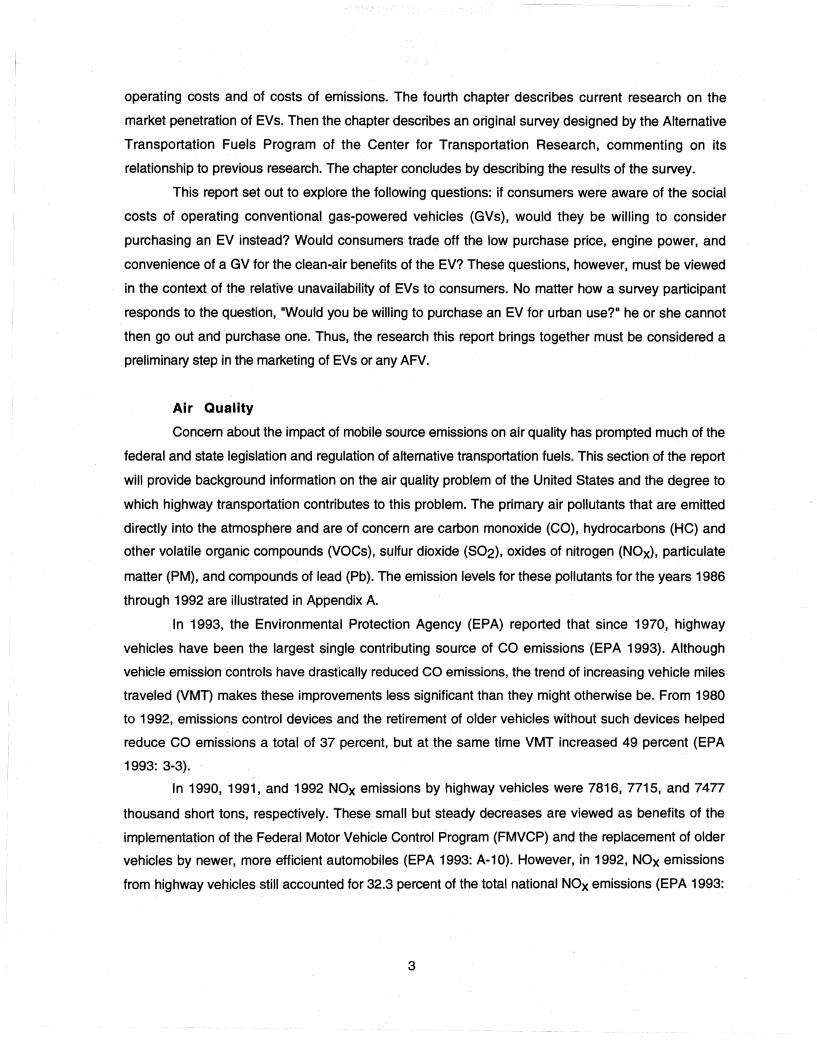
Air Quality
Concern about the impact of mobile source emissions on air quality has prompted much of the
federal and state legislation and regulation of alternative transportation fuels. This section of the report
will provide background information on the air quality problem of the United States and the degree to
which highway transportation contributes to this problem. The primary air pollutants that are emitted
directly into the atmosphere and are of concern are carbon monoxide (CO), hydrocarbons (HC) and
other volatile organic compounds (VOCs), sulfur dioxide (502), oxides of nitrogen (NOx), particulate
matter (PM), and compounds of lead (Pb). The emission levels for these pollutants for the years 1986
through 1992 are illustrated in Appendix A.
In 1993, the Environmental Protection Agency (EPA) reported that since 1970, highway
vehicles have been the largest single contributing source of CO emissions (EPA 1993). Although
vehicle emission controls have drastically reduced CO emissions, the trend of increasing vehicle miles
traveled (VMT) makes these improvements less significant than they might otherwise be. From 1980
to 1992, emissions control devices and the retirement of older vehicles without such devices helped
reduce CO emissions a total of 37 percent, but at the same time VMT increased 49 percent (EPA
1993: 3-3).
In 1990, 1991, and 1992 NOx emissions by highway vehicles were 7816,7715, and 7477
thousand short tons, respectively. These small but steady decreases are viewed as benefits of the
implementation of the Federal Motor Vehicle Control Program (FMVCP) and the replacement of older
vehicles by newer, more efficient automobiles (EPA 1993: A-10). However, in 1992, NOx emissions
from highway vehicles still accounted for 32.3 percent of the total national NOx emissions (EPA 1993:
3

2-37).
Reactive voe and NOx emissions are the principal components in the chemical and physical
atmospheric reactions that form ozone and other photochemical oxidants. Despite increases in VMT,
FMVep initiatives combined with the retirement of older vehicles, are credited for the 50 percent
decrease in voe emissions from gasoline and diesel-powered vehicles from 1970 to 1992. In 1992,
however, highway vehicles were nonetheless responsible for 26.8 percent of total national voe
emissions (EPA 1993: 2-43).
Sulfur dioxide emissions have been identified as precursors of acidic precipitation and
deposition. S02 emissions from highway vehicles have been steadily increasing for over 20 years. In
1992, highway vehicles emitted 785 thousand short tons of sulfur dioxide, accounting for 3.5 percent
of the national S02 emissions (EPA 1993: A-27, 2-49).
Total national Pb emissions have been decreasing since 1970. In 1970, Pb emissions form
highway vehicles were 171,961 short tons. In 1992, Pb emissions from highway vehicles were only
1,383 short tons, which did account, however, for 26.7 percent of the total national Pb emissions
(EPA 1993: 2-55, 3-17). The decreases in Pb emissions are attributed to the FMVep and the EPA
requirement that petroleum refiners lower the Pb content of leaded gasoline to 0.5 grams per gallon in
1985 and 0.1 grams per gallon in 1986. Previously, the Pb content of gasoline had been at 1.1 grams
per gallon or more (EPA 1993: 3-9).
The EPA presents data on fine particulate matter less than ten microns (PM-10). Emissions of
PM-10 shows it greatest decrease in the 1970's. In 1992, the EPA reports a preliminary figure of
1,558 thousand short tons of PM-10 emissions from highway vehicles (EPA 1993: 3-17). This figure
comprises approximately 3 percent of the total national PM-10 emissions in 1992 of 51,427 thousand
short tons (EPA 1993: 3-17).
Texas is on the list for top 10 emitting states for several of the pollutants. Texas is responsible
for 8 percent of national eo emissions (EPA 1993: 2-32). 12 percent of NOx emissions (EPA 1993:
2~38). 13 percent of voe emissions (EPA 1993: 2-44), and five percent of S02 emissions (EPA
1993: 2-50). Although these figures include sources other than highway source emissions, they do
serve as indicators to the severity of the air quality problem in Texas.
In summary, legislative initiatives have done much to decrease the rate of environmental
deterioration. However, emissions may still far exceed the level that the earth's ecosystem can bear.
Increasing vehicle miles traveled,along with increasing numbers of vehicles driven, are difficult factors
to offset. The EPA predicts that between 2000 and 2010 eo and NOx emissions will begin to
increase again (EPA 1993: 6-1).
4

Energy Security
Alternative vehicle fuels offer a very strong potential to aid in the reduction of U.S.
dependence on foreign oil supplies. It is predicted that, without new policy initiatives, U.S. oil
consumption will increase by 20 percent over the next 20 years, reaching 20.3 million barrels per day
in 2010 (Riley: 13). The economic, environmental, and energy security implications of this increase
are significant, given that the Persian Gulf region contains 65 percent of the world's proven reserves
and an increasingly large share of world oil production (Riley: 9). Because the transportation sector
accounts for two-thirds of U.S. oil consumption, and personal transportation vehicles consume over
half of this oil (Riley:12), serious attention should be given to options that might cost-effectively
reduce the use of petroleum-based motor fuels.
Some economists are concerned that increasing oil imports will make it difficult to reduce the
trade deficit. In addition, the Gulf War in the early 1990's and the increasing oil imports have renewed
interest in U.S. economic security. The possibility of soaring gasoline prices had Saudi oil supplies
been interrupted is a significant factor in renewed interest in non-petroleum fueled vehicles.
Global Warming
Over the last one hundred years, the increased use of fossil fuels has caused a significant rise
in the concentration of carbon dioxide, C02, in the atmosphere. Carbon dioxide is the most important
greenhouse gas contributing to global warming, but motor vehicle emissions have also played a part in
increasing concentrations of other anthropogenic greenhouse gases, including nitrous oxide (NOx),
chlorofluorocarbons (CFCs), and methane. Energy from the sun reaches the earth in the form of light.
Since neither C02 nor H20 vapor absorbs the visible light in sunlight, they do not prevent this energy
from reaching the surface of the earth. However, the energy that the earth itself gives off in the form of
heat (lower-energy infrared radiation) is readily absorbed by both C02 and H20. Thus, some of the
heat the earth must lose to maintain thermal equilibrium becomes trapped in the atmosphere, which
can cause the temperature to rise. This is the greenhouse effect. The greenhouse effect is predicted
to cause a 2 degree Celsius rise in average global temperatures by the year 2030 (Green et al. 1993:
5). Indeed, eight of the ten warmest years ever recorded in the Northern Hemisphere occurred
between 1980 and 1989. Substituting electric vehicles for conventional internal combustion engine
vehicles could increase or decrease greenhouse gas emissions depending on the fuels used for
generation of electricity. This report will review some of the recent studies that address this question.
5

ALTERNATIVE FUELS INITIATIVES
Legislative and Regulatory
Recent legislative and regulatory measures have played an important role in attempting to
reduce petroleum consumption in the transportation sector. These measures, which have been
introduced at both the national and state levels, generally fall under one of two labels: air quality or
energy consumption. Most often these measures do not mention electricity specifically as an
alternative transportation fuel; however, the EV can be an important contributor in meeting the
requirements of these measures by decreasing air pollution and petroleum consumption. The
following sections describes the major legislative and regulatory measures now in existence.
National. The measure that most directly solicits alternative fuel development is the
Alternative Motor Fuels Act of 1988 (AMFA), which was signed into law on October 14, 1988, as
Public Law 100-494. AMFA's stated purpose is to 1) encourage the development and widespread
consumer use of methanol, ethanol, and natural gas as transportation fuels; and 2) encourage the
production of methanol-, ethanol-, and natural-gas-powered motor vehicles. This act directs the U.S.
Department of Energy (DOE) to work with other Federal agencies in order to take a number of actions.
The Federal agencies the DOE is encouraged to work with are the General Services Administration
(GSA), the Department of Transportation (DOT), and the EPA. The major programs established by
DOE ( all began in FY 1990) are as follows: 1) the Alternative-Fuel Federal Light-Duty-Vehicle
Program; 2) the Truck Commercial Application Program; and 3) the Alternative-Fuels Bus Testing
Program (USDOE 1992).
Although it does not specifically address the subject of alternative transportation fuels at the
national level, the most far-reaching piece of legislation may be ISTEA. ISTEA directly ties itself to the
CAAA and asserts air quality as a primary goal of transportation policy and projects. Thus, ISTEA
pertains to projects and programs at state and local levels, particularly in clean air non-attainment areas.
In Texas, these non-attainment areas are Beaumont-Port Arthur, EI Paso, Dallas-Fort Worth, and the
Houston region. The Dallas-Fort Worth and Houston-Galveston regions are already proposing
substantial alternative fuel investments using ISTEA funding.
The most likely source of alternative-fuels funding at the present time is the Congestion
Mitigation and Air Quality Improvement Program (CMAQ). A Title 1 program funded at $6 billion over 6
years with an 80 percent federal share, CMAQ can fund projects and programs that contribute to
attainment of air quality standards, such as transportation control measures or transit projects.
An additional measure promoting alternative transportation fuels is the Energy Policy Act
(EPACT), which was signed into law in late 1992 as Public Law 102-486. The underlying philosophy
of the EPACT is to reduce U.S. dependence on foreign oil and to increase energy efficiency. The act
6
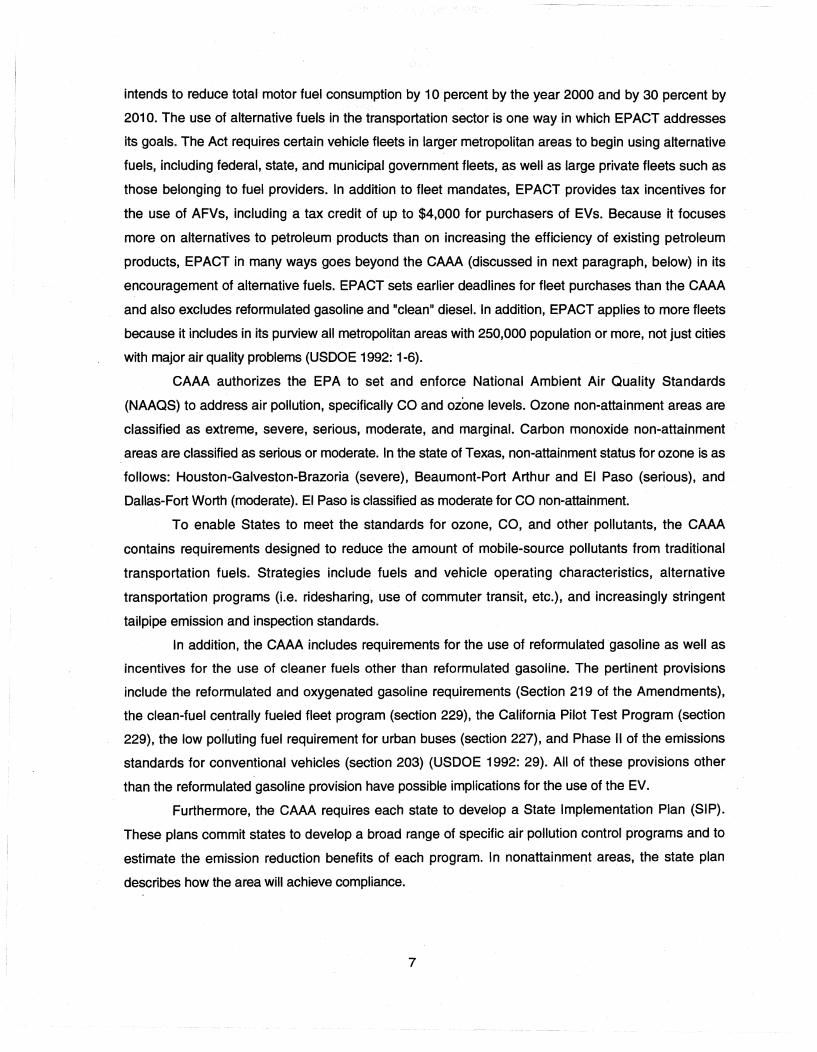
intends to reduce total motor fuel consumption by 10 percent by the year 2000 and by 30 percent by
2010. The use of alternative fuels in the transportation sector is one way in which EPACT addresses
its goals. The Act requires certain vehicle fleets in larger metropolitan areas to begin using alternative
fuels, including federal, state, and municipal government fleets, as well as large private fleets such as
those belonging to fuel providers. In addition to fleet mandates, EPACT provides tax incentives for
the use of AFVs, including a tax credit of up to $4,000 for purchasers of EVs. Because it focuses
more on alternatives to petroleum products than on increasing the efficiency of existing petroleum
products, EPACT in many ways goes beyond the CAAA (discussed in next paragraph, below) in its
encouragement of alternative fuels. EPACT sets earlier deadlines for fleet purchases than the CAAA
and also excludes reformulated gasoline and "clean" diesel. In addition, EPACT applies to more fleets
because it includes in its purview all metropolitan areas with 250,000 population or more, not just cities
with major air quality problems (USDOE 1992: 1-6).
CAAA authorizes the EPA to set and enforce National Ambient Air Quality Standards
(NAAQS) to address air pollution, specifically CO and ozone levels. Ozone non-attainment areas are
classified as extreme, severe, serious, moderate, and marginal. Carbon monoxide non-attainment
areas are classified as serious or moderate. In the state of Texas, non-attainment status for ozone is as
follows: Houston-Galveston-Brazoria (severe), Beaumont-Port Arthur and EI Paso (serious), and
Dallas-Fort Worth (moderate). EI Paso is classified as moderate for CO non-attainment.
To enable States to meet the standards for ozone, CO, and other pollutants, the CAAA
contains requirements designed to reduce the amount of mobile-source pollutants 'from traditional
transportation fuels. Strategies include fuels and vehicle operating characteristics, alternative
transportation programs (Le. ridesharing, use of commuter transit, etc.), and increasingly stringent
tailpipe emission and inspection standards.
In addition, the CAAA includes requirements for the use of reformulated gasoline as well as
incentives for the use of cleaner fuels other than reformulated gasoline. The pertinent provisions
include the reformulated and oxygenated gasoline requirements (Section 219 of the Amendments),
the clean-fuel centrally fueled fleet program (section 229), the California Pilot Test Program (section
229), the low polluting fuel requirement for urban buses (section 227), and Phase II of the emissions
standards for conventional vehicles (section 203) (USDOE 1992: 29). All of these provisions other
than the reformulated gasoline provision have possible implications for the use of the EV.
Furthermore, the CAAA requires each state to develop a State Implementation Plan (SIP).
These plans commit states to develop a broad range of specific air pollution control programs and to
estimate the emission reduction benefits of each program. In nonattainment areas, the state plan
describes how the area will achieve compliance.
7

State of California. California has led the nation in devising state-sponsored measures
for promoting clean air. In fact, the CAAA allow states to adopt and enforce California's Low Emissions
Vehicle (LEV) program rather than the federal vehicle emission standards. The LEV program
establishes four categories of vehicles; Transitional Low Emission Vehicle (TLEV), LEV, Ultra-Low
Emission Vehicle (ULEV), and Zero Emission Vehicle (ZEV). The program allows auto manufacturers
to earn credits that can be banked, traded or sold, which provides some flexibility if vehicle sales for
particular models are poor. It is expected that the California LEV program will increase the use of AFVs.
Certainly, this measure has heightened interest in the EV, possibly the only vehicle that ultimately
qualifies as a ZEV.
State of Texas. Texas, another large state with a growing air quality problem, has also
authored some Significant state measures. The Texas Legislature enacted two bills in 1989 (Senate
Bills 740 and 769) that encourage the use of alternative fuels. Senate bill 740 relates to the purchase,
lease, or conversion of motor vehicles by certain state agencies, school districts, and local transit
authorities and districts to assure use of natural gas or other alternative fuels. The bill requires affected
entities to purchase AFVs and to increase over time the percentage of their fleet that uses alternative
fuels. By 1998, 90 percent or more of the fleet vehicles may be required to be capable of using
alternative fuels. The following entities must comply with SB 740: all school districts with over 50
buses to transport children, state agencies with over 15 vehicles (excluding law enforcement and
emergency vehicles), and all metropolitan transit departments (no fleet size specified). SB 740 set the
following deadlines for affected entities: By September 1, 1994 the fleet had to consist of 30 percent
or more AFVs; By September 1, 1996 the percentage increases to 50 percent; and by September 1,
1998 the percentage increases to 90 percent.
Senate Bill 769 amends the Texas Clean Air Act and addresses air quality in the four Texas
non-attainment regions: Houston, Dallas-Fort Worth, Beaumont-Port Arthur and EI Paso. SB 769
applies to the fleets of metropOlitan and regional transit/transportation authorities, city transportation
departments, local governments with 16 or more vehicles (excluding law enforcement and emergency
vehicles), and private vehicle fleets with 26 or more vehicles (also excluding law enforcement and
emergency vehicles). SB 769 states that public transportation organization fleets had to consist of 30
percent or more AFVs by September 1,1994. By September 1, 1996 the percentage increases to 50
percent and by September 1, 1998 the percentage increases to 90 percent. The schedule is
different for local government and private fleets. If the Texas Air Quality Control Board finds the
alternative fuel program effective by December 31, 1996 local governments with fleets of more than
15 vehicles and private fleets with more than 25 vehicles will be required to add or convert AFVs into
their fleet. By September 1, 1998 these fleets must consist of 30 percent or more AFVs. The
8

percentage increases to 50 percent by September 1, 2000 and to 90 percent by September 1, 2002.
More recently, Senate Bill 7 amends SB 740 and revises the schedules for school districts to
begin converting their fleets. In addition, some portions of the act regarding waivers and reporting
requirements have been amended. Effectively, SB 7 allows for a more gradual implementation of the
alternative fuels program in affected school districts. The deadlines for acquiring alternative fuel
school buses are from 1 to 3 years behind the deadlines stipulated in SB 740. SB 7 states that after
September 1,1993 affected school districts must acquire only school buses capable of using an
alternative fuel. By September 1, 1997 50 percent of a district's fleet must be capable of using an
alternative fuel. And by September 1, 2001 the percentage increases to 90 percent. SB 7 waives the
30 percent AFVs in 1993 that SB 740 previously required.
Utilities
Utility Companies are in a unique position in the discussion of alternative fuels. Not only could
the use of EVs increase overall electricity usage, but overnight charging of EVs could increase energy
consumption during off-peak hours potentially raising revenues for these companies without the
need for increased capacity. Because the majority of electricity is consumed during the day, electric
utilities could greatly benefit from the non-peak overnight consumption of electricity that EVs offer.
Thus, many utility companies are leading the way in research and development of electric vehicles.
Other Corporations
Presently, General Motors, Ford, and Chrysler all manufacture EVs, albeit on a limited scale.
GM has recently developed the Impact and has plans to produce 50 of these vehicles for a program to
develop the EV market and infrastructure (J.E. Sinor September 1993: 151). This vehicle body is
lightweight and was especially designed for EV use. It is not simply a conventional body fitted with an
electric motor. Chrysler has built the TEVan and, as of September of 1993, sold 50 of these vehicles
to electric utilities (J.E. Sinor September 1993: 150). In addition, Ford Motor Company currently has
26 Ecostars (minivans) on the road participating in an electric vehicle test fleet. By the end of 1994,
Ford plans to increase this number to 105. Presently, partiCipants in the test fleet do not purchase
these vehicles, but lease them and agree to participate in a performance study (J.E. Sinor April 1994:
159). An evaluation of prices is somewhat premature given that EVs are not presently being mass
produced. At present, the cost to Ford Motor Company of the Ecostar's sodium-sulfur battery alone is
approximately $50,000 (Hanten 1994). Although other battery technologies are not as expensive as
that of the sodium-sulfur, the approximate prices that the big three American car manufacturers
currently cite are high; but this is clearly due to research and development costs and limited
9

production. The Electric Vehicle Development Corporation reports that the price of a G-VanEV would
be $57,000 when 100 vehicles have been manufactured, but would fall to $18,100 when a
cumulative volume of 50,000 vans had been produced (J.E. Sinor September 1993: 159).
Optimistically, EVs could be more feasible in the near future in terms of price.
Small, innovative technology firms have produced some of the most promising AFVs
currently available. In December 1990, the G-Van became available. Although a limited production
vehicle, this van, priced at $50,000 and produced by Conceptor Industries, was the first ground-up
EV available to meet U.S. Federal Motor Vehicle Safety Standards (Science Applications International
Corporation 1992: 34). Other small EV manufacturers are trying to enter the market but are faced with
some obstacles. Most significantly, these manufacturers are finding it difficult to offer competitive
prices. In general, they retrofit existing internal combustion engine (ICE) vehicles which carries a high
initial investment. For example, Solectria of Arlington, Mass. produces the Force EV which is based on
the Geo Metro subcompact model. After purchasing the Geo Metro, this company removes the
engine, the exhaust system, and other parts of the car that are not needed and installs the electric
engine, battery pack, regenerative braking system, etc. Obviously, in this case many original parts
have been purchased that are not needed. In addition, the retrofitted vehicle is not as efficient as a
ground-up vehicle CQuid be, since the basic design of the car is intended for an entirely different
engine (Kirk, phone interview). However, this same company is planning to use a $1.1 million grant
funded in part from the U.S. Defense Department's Advanced Research Projects Agency defense
conversion grant to develop a ground-up, composite EV called the Flash (Green Car Media 1993:
137). Because of the significant cost of research and labor, the cost is initially estimated at
approximately $20,000, the same as their current retrofit vehicle. If a nickel-cadmium battery is used
instead of a lead-acid battery in either the retrofit or ground-up vehicle, the cost increases
approximately $20,000 to $40,000. On a similar note, Battery Automated Transportation (BAT) has
introduced a converted Geo Metro for $15,900 and a converted Ford Ranger pickup truck for
approximately $25,000 (J.E. Sinor November 1993: 165). Despite such high initial costs, it is apparent
that if increasing numbers of original manufacturers are able to penetrate the EV market, prices are
likely to decrease in the future.
10

CHAPTER 2. ELECTRIC VEHICLE TECHNOLOGY
BATTERIES
At present, the power source used by the majority of electric vehicles (EVs) is the battery. In
the past, the most significant problem cited by critics of the EV was that the battery's limited range
characteristics would decrease the vehicle's feasibility for the average urban household. But battery
technology is improving, and new data indicates that the average commute for most urban drivers is
less than 60 miles per day. In light of these facts, the most popular arguments against aggressively
pursuing EV production may be misapplied. Because batteries represent a crucial issue for EV
development, this chapter will begin with an overview of battery technology.
United States Advanced Battery Consortium
The United States Advanced Battery Consortium (USABC) was formed in January of 1991 in
recognition of the need for a major advancement in battery technology in order for EVs to penetrate
the market. The USABC is a business partnership between Chrysler, Ford, and General Motors (GM).
In July of 1991, participation by the Electric Power Research Institute and some of its member utilities
was formalized. Also, the USABC and the United States Department of Energy (DOE) signed a
Cooperative Agreement in October of 1991, which initiated funding from the DOE to match that of
industry in this effort. The purpose of the consortium is to work with battery developers, universities,
the National Laboratories, and other companies that will conduct research and development on
battery technologies in order to increase the driving range, improve the performance, and reduce the
cost of EVs. The USABC has defined both mid-term and long-term objectives. The mid-term goals for
battery improvement include doubled vehicle range, a power-to-weight ratio of 150 to 200 watts per
kilogram, an energy-to-weight ratio of 80 to 100 watt hours per kilogram and a battery life of five years
at a cost of less than $150 per kilowatt hour. The long-term goal, targeted for the early 21 st century, is
a battery with a power-to-weight ratio of 400 watts per kilogram, an energy-to-weight ratio of 200 watt
hours per kilogram and a battery life of 10 years at a cost of less than $100 per kilowatt hour. The
primary criteria for both mid-term and long-term battery technologies are summarized in Table 2.1.
11

TABLE 2.1 USABC PRIMARY CRITERIA
Criterion Mid-Term Lona-Term
Specific Enerov (Wh/ko) 80 200
Enerov Density (Wh/L) 135 300
Specific Power (W/kg) 150 400
Power Density (W/L) 250 600
Life (vears) 5 10
Life (cvcles at 80% 000) 600 1000
Ultimate Cost ($IkWh) < 150 < 100
Operating Environment (degrees -30 to 65 .. 40 to 85
Celsius)
Recharge Time (hours) <6 3-61 fast recharge for
emeraencv
Continuous Discharge in one hour 75% of rated energy 75% of rated energy
(no failure) capacity capacitv
Power and Capacity Degradation 20 % of rated 20 % of rated
specification specification
Source: OECD 1992: 349
Battery Technologies
Presently, several types of batteries are in public use, or being researched for expected use
in the near future. These include lead-acid, advanced lead-acid, nickel-cadmium, and sodium-sulfur
batteries.
Lead-Acid Battery. Currently, lead-acid batteries are the most popular. In fact, a study
from 100 EV owners in California found that every EV owner in this study group used a lead-acid
battery, although the total battery packs were of varying voltages (Kurani 1994: 11). The primary
reason for the popularity of the lead-acid battery is its relatively low cost and accessible technology.
especially for those who build or convert their own EVs. In addition, lead-acid batteries can be more
easily recycled than other batteries. The major drawbacks of this battery are its heavy weight and low
energy density. In other words, the lead-acid battery cannot provide a great deal of range before
needing to be recharged.
12
-- ----------- -T-

On the other hand, advanced lead-acid batteries are relatively new, and are likely to offer
improved performance as the technology develops. In fact, Electrosource, Inc. of Austin, Texas, has
recently developed the Horizon EV Battery. This advanced lead-acid battery can be recharged to 50
percent of its power in 8 minutes, and to 99 percent of its power in 30 minutes. In addition,
Electrosource estimates their battery will yield an approximate range of 85 miles when installed in a
mid-size van. They project that their battery will last more than 600 cycles in on-road EVs
(Electrosource 1995).
Nickel Cadmium. A number of the EVs manufactured by the major U.S. automobile
companies have recently begun employing other battery technologies. The 1994 Chrysler Minivan
uses a 180 volt nickel-cadmium or nickel-iron battery pack, and advertises an 80-mile range (without
running air conditioning or heating), a top speed of 65 mph, and an acceleration from 0-40 mph in
11.0 seconds (Chrysler 1994). Advantages of the nickel-cadmium battery include higher energy and
power densities, and an anticipated longer life cycle (J.E. Sinor September 1993: 155). In short,
nickel-cadmium batteries have longer ranges between charges, can reach higher top speeds, and will
last longer than the typical lead-acid battery. The primary drawback of this battery is its increased cost
due to the high cost of both nickel and cadmium. Solectria, an electric vehicle manufacturer in
Arlington, Mass, states that using a nickel-cadmium battery as opposed to a lead-acid battery
increases the cost of their EVs by approximately $20,000 (phone interview).
Sodium Sulfur. Like the nickel-cadmium battery, the sodium-sulfur battery provides
vehicle speed advantages. In fact, the sodium-sulfur battery is often cited as the highest performance
battery. The Ford Ecostar, which is powered by a sodium-sulfur battery, is reported to have a range of
100 miles, a top speed of 75. mph, and an estimated 0-60 mph acceleration of 16.5 seconds (Green
Car Journal 1993: 135). The main drawback of the sodium-sulfur battery is that it must operate at a
temperature of 270-410 degrees Centigrade, and the hot liquids in the battery are corrosive. Thus,
manufacturers can incur high costs when trying to reduce failure probabilities of individual cells and
connections (Bevilacqua-Knight, Inc. 1992: 2-3).
FUEL CELLS
Fuel cells are another important technology for the EV, although they have been used for
many years for other purposes such as powering spacecraft. DeLuchi and Swan go so far as to say
that a fuel-cell vehicle is the only zero emission vehicle (ZEV) that could possibly accelerate as fast,
drive as far, and be refueled as quickly as today's gasoline cars (DeLuchi and Swan 1993: 14).
13

How Fuel Cells Work
Instead of storing electricity taken from a wall socket, the fuel cell converts the chemical
energy in a liquid or gaseous fuel to electrical energy. The fuel cells can use hydrogen directly, or
accepts fuel that has been converted to hydrogen from another source. Hydrogen fuel can be
produced from a variety of sources including methanol, coal, natural gas, or solar energy to hydrolyze
water. If a 'fuel is used that needs to be converted to hydrogen, an on-board converter is necessary. A
fuel cell consists of a positive anode, a negative anode and an electrolyte between the two a!1odes.
Usually hydrogen diffuses through the typically platinum-coated anode and strips off electrons,
creating electricity. The protons continue through the electrolyte to the cathode, where the protons,
electrons and oxygen combine to form water (Bevilacqua-Knight, Inc. 1992: 7). A hydrogen-powered
fuel cell vehicle is considered a ZEV since it emits only water vapor. Methanol fuel cell vehicles
produce small amounts of nitrogen oxides (NOx) and carbon monoxide (CO) from the methanol
reformer, and small amounts of evaporated methanol from the fuel supply and storage systems
(DeLuchi and Swan 1993: 19).
Classification of Fuel Cells
Fuel cells are most often classified according to which type of electrolyte they employ. Some
of the most popular ones are alkaline, solid oxide, and alkaline proton exchange membrane (PEM).
Alkaline fuel cells perform very well, and have been prOjected to have a low materials cost, but the
electrolyte is so intolerant of carbon dioxide (C02) that the system must be supplied with either
bottled oxygen or air scrubbed of C02 a costly and space-consuming requirement. Solid-oxide fuel
cells are prOjected to have good performance, but if started cold, they require a relatively long
warm-up period to reach their operating temperature. Projected costs of the solid oxide fuel cell vary.
Generally, they are considered costly, but according to some researchers they may be less expensive
than PEM fuel cells in the future. Currently, PEM fuel cells appear to be the most promising. Their
most important advantage is good performance. In addition, PEM fuel cells provide considerable
power at ambient temperatures without corrosive fluids and are relatively simple in construction.
Because of these qualities, they have the potential to be inexpensive to manufacture. Not
surprisingly, most fuel-cell related vehicle research, development, and demonstration programs are
currently using PEM fuel cells, or anticipate doing so. Although PEM fuel cells will not be commercially
available for a few years, they are perhaps the most promising technology for use in highway vehicl~s
in the short term (OECD: 82).
14
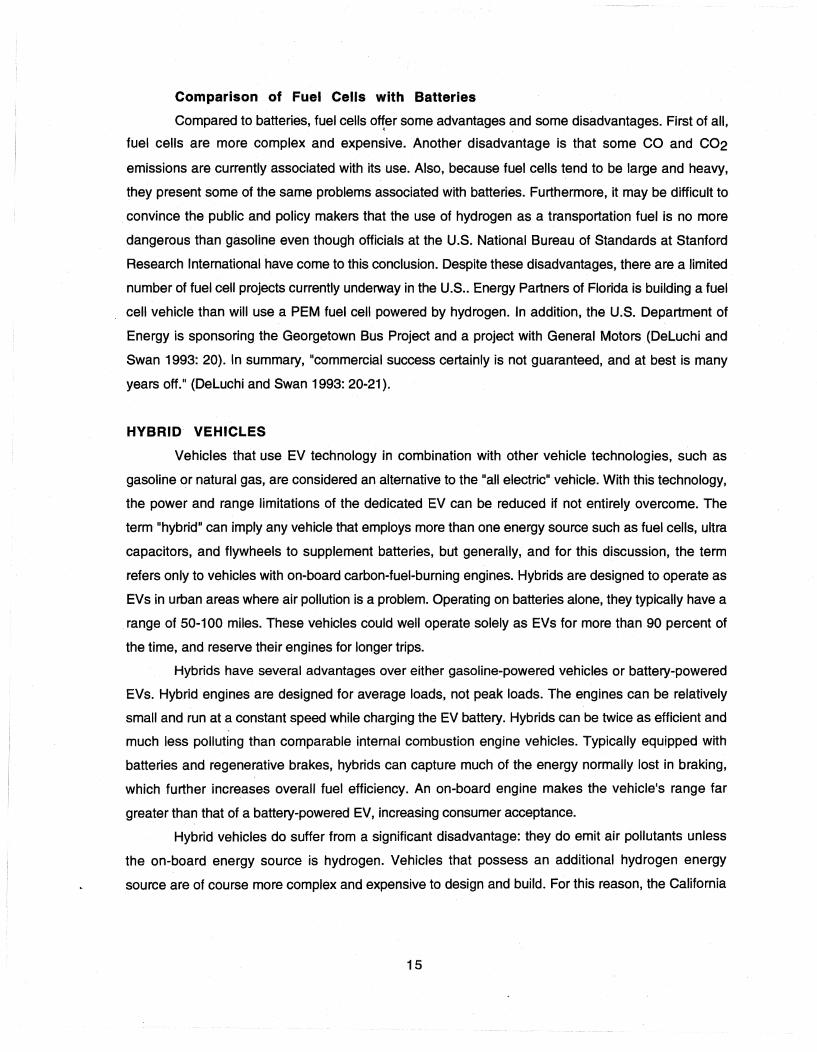
Comparison of Fuel Cells with Batteries
Compared to batteries, fuel cells offer some advantages and some disadvantages. First of all, I .
fuel cells are more complex and expensive. Another disadvantage is that some CO and C02
emissions are currently associated with its use. Also, because fuel cells tend to be large and heavy,
they present some of the same problems associated with batteries. Furthermore, it may be difficult to
convince the public and policy makers that the use of hydrogen as a transportation fuel is no more
dangerous than gasoline even though officials at the U.S. National Bureau of Standards at Stanford
Research International have come to this conclusion. Despite these disadvantages, there are a limited
number of fuel cell projects currently underway in the U.S .. Energy Partners of Florida is building a fuel
cell vehicle than will use a PEM fuel cell powered by hydrogen. In addition, the U.S. Department of
Energy is sponsoring the Georgetown Bus Project and a project with General Motors (DeLuchi and
Swan 1993: 20). In summary, "commercial success certainly is not guaranteed, and at best is many
years off." (DeLuchi and Swan 1993: 20-21).
HYBRID VEHICLES
Vehicles that use EV technology in combination with other vehicle technologies, such as
gasoline or natural gas, are considered an alternative to the "all electric" vehicle. With this technology,
the power and range limitations of the dedicated EV can be reduced if not entirely overcome. The
term "hybrid" can imply any vehicle that employs more than one energy source such as fuel cells, ultra
capacitors, and flywheels to supplement batteries, but generally, and for this discussion, the term
refers only to vehicles with on-board carbon-fuel-burning engines. Hybrids are designed to operate as
EVs in urban areas where air pollution is a problem. Operating on batteries alone, they typically have a
range of 50-100 miles. These vehicles could well operate solely as EVs for more than 90 percent of
the time, and reserve their engines for longer trips.
Hybrids have several advantages over either gasoline-powered vehicles or battery-powered
EVs. Hybrid engines are designed for average loads, not peak loads. The engines can be relatively
small and run at a constant speed while charging the EV battery. Hybrids can be twice as efficient and
much less polluting than comparable internal combustion engine vehicles. Typically equipped with
batteries and regenerative brakes, hybrids can capture much of the energy normally lost in braking,
which further increases overall fuel efficiency. An on-board engine makes the vehicle's range far
greater than that of a battery-powered EV, increasing consumer acceptance.
Hybrid vehicles do suffer from a significant disadvantage: they do emit air pollutants unless
the on-board energy source is hydrogen. Vehicles that possess an additional hydrogen energy
source are of course more complex and expensive to design and build. For this reason, the California
15

Air Resource Board does not currently qualify hybrids as ZEVs. Hybrids are therefore often
considered transitional vehicles whose best use is in filling the gap in technology until more efficient •
batteries or other power storage devices can be made marketable.
Nonetheless, the Department of Energy has awarded GM and Ford money to develop
prototype hybrid vehicles. GM received a $138 million cost-shared contract in September 1993 and in
December of the same year Ford's research group received $122 million.
The goal of these awards is to encourage the emergence of vastly more fuel-efficient vehicles
that can meet emission standards yet still maintain comparable cost and performance to conventional
vehicles. Produc:tion of these vehicles is slated to begin sometime after 2001. In addition, overseas
auto makers are developing their own hybrid vehicles (MacKenzie 1994: 54).
ROADWAY ELECTRIFICATION
Roadway Electrification is another technology that has been proposed to address the
growing problem of poor air quality. Although this technology differs considerably from the battery
powered EV approach which is the focus of this report, roadwayelectri'fication is addressed briefly
here since these two technologies do share some common attributes. Theoretically, roadway
electrification can provide the range, payload, acceleration and the life-cycle costs of the
gasoline-powered vehicle with the zero tailpipe emission advantages of the EV. With an electrified
roadway, an external energy source provides additional fuel to that offered by the battery, making
roadway electrification effective for long trips. For this reason, roadway electrification would be used in
freeways where most long trips occur, so that this external energy could be made available to EVs
during the trip. The external energy source makes possible a significant reduction in onboard battery
size, thus making the vehicle quicker to accelerate and faster, as well as less expensive at least in
terms of battery cost (Bresnock: 3)
The primary drawback of roadway electrification is cost. Estimates are approximately $.78
million/lane-mile ($1.25 million/lane-km) of road (cited in Fowler 1994: 17). In the short term, this cost
is prohibitively high. Other considerations are the following environmental and health issues:
exposure to electromagnetic fields, hazardous waste associated with battery disposal, and acoustic
noise levels in vehicles traveling on the powered roadway.
16

CHAPTER 3. DETERMINING ELECTRIC VEHICLE COSTS
One of the most important factors in evaluating the merits of the electric vehicle (EV) as a
viable solution to the current transportation problems of air pollution, global warming, and growing oil
imports, is the question of cost. How do EVs compare economically and environmentally to gasoline
powered vehicles (GVs) on a full cost basis? This chapter addresses the issues surrounding this
question. First the chapter defines the market costs of owning and operating typical GVs and EVs.
Then the external costs of both types of vehicles are defined and assessed. Next, both market and
external costs of GVs and EVs are calculated. Finally, the impact of potential EVs on energy
consumption is addressed.
DETERMINING MARKET VEHICLE COSTS
In 1993, U.S. consumers spent $455.3 billion on user-operated transportation (AAMA 1994:
60). On average in 1992, consumers spent 17.6 percent of their disposable income on transportation
(AAMA 1994: 59) .
Operating a motor vehicle generates two kinds of costs, which have been defined as "market
costs" and "external costs." Market costs are those consumers most often think of when they
contemplate vehicle ownership: costs for which consumers must actually pay money, including the
car's purchase, the purchase of fuel, paying taxes and fees to pay for road construction, repair, and
parking space, and purchasing automobile insurance. These are the costs that are most easily and
readily perceived by individual consumers.
The second type of costs do not show up directly in the consumer's economic transactions.
These external costs, or "externalities," are hidden from the vehicle consumer because they are
absorbed by all of society. Externalities include the social costs of illnesses resulting from the air
pollution caused by vehicle operation, and the costs of foreign diplomacy, strategic reserves, and
military action necessary for defense of the U.S. oil supply. They also include the economic risks of
global warming caused by vehicle emissions. These are costs that clearly fall outside the scope of
normal market prices. Yet because SOCiety experiences economic risk and loss due to such
externalities, they too must be considered in determining what it costs not just for individual
consumers, but for a whole society to operate motor vehicles. Total costs or full costs of motor vehicle
operation can only be assessed when we determine both market and external costs.
Some current research indicates that the lifetime costs of operating an EV may well be lower
than that of operating a conventional GV. In addition, even short-term costs may be Significantly less
17

for EVs: they will be cheaper to operate and have a longer vehicle life (Sperling 1995: 55). The most
expensive aspect of the EV is the battery, however. Without a significant technological "battery
breakthrough," the initial purchase price of an EV is likely to remain higher than that of a conventional
GV. Thus, it is important in determining the EV market to calculate the total cost of ownership and
operation.
In addition, it is important to examine both the market and external costs associated with GVs
as well as EVs. Although the cost of a battery for the EV may be relatively high, this could potentially
be offset by the benefit to air quality. While consumers generally consider only market costs when
purchasing a vehicle, policy makers have the goal of encouraging consumers to consider external or
non-market costs when purchasing a car. Presently, it is primarily the responsibility of public
institutions to consider the external costs. Considering externalities as part of vehicle cost analysis will
lead to more informed decisions when evaluating policies, initiatives or incentives to use alternative
fuels.
Ownership and Operating Costs for GVs
While some costs occur whether or not the vehicle is driven (fixed costs), other costs vary with
the amount a vehicle is driven (variable costs). The former category is generally referred to as
ownership costs, and the latter as operating costs. Analysts often differ on the costs that should be
included in each category. In this report, we define the two categories consistent with the Federal
Highway Administration (FHWA).
Ownership costs include not only depreciation, finance charges, insurance, registration and
titling fees, but also any taxes applied to these items. Even if a vehicle is rarely or never driven, the
owner incurs most of these costs. Operating costs include scheduled and unscheduled
maintenance, fuel, oil, tires, parking tolls, and the taxes applied to these items.
For the two scenarios of GVs we examine in this chapter (a compact vehicle and an
intermediate-sized vehicle), these costs are based on the FHWA report, "Cost of Owning and
Operating Automobiles, Vans,and Light Trucks 1991." While this report uses many of the values
generated by the FHWA report, they are presented a little differently. The FHWA lists all costs year by
year over the assumed 12 year life of the vehicle. The FHWA assumes the annual mileage decreases
over the lifetime of the vehicle. This occurs because as a vehicle ages, it often becomes a second or
third family vehicle or its ownership is transferred toa household that uses it less. (FHWA 1992: 4). As
one might expect, many of the ownership and operating costs decrease over the life of the vehicle.
However, for the purpose of this report, we present these FHWA values in terms of average annual
cost, dollars/mile, and do"ars/kilometer.
18
-r-

Only differences from the FHWA report in the definitions of each type of cost will be
explained. Depreciation is the loss of value of the vehicle during its lifetime. Several factors contribute
to depreciation, including passage of time, the vehicle's mechanical and physical condition, and the
number of miles it is driven. While the FHWA reports that 25 to 45 percent of all depreciation occurs in
the first year of ownership (FHWA 1992: 5), this report averages the depreciation over the life of the
vehicle (since ultimately we are interested in the average cost per mile). This report calculates
depreciation by subtracting the salvage value from the initial vehicle cost and then dividing the
resulting value by the number of years of the vehicle life. Finance charges, for the purposes of this
report, are based on a three-year financing term, an annual interest rate of 8.25 percent, and a 10
percent down payment. In Texas, the state registration fee varies with the age and value of the car. We
used an average of $58.80 for all vehicles. The state vehicle excise tax is 6.25 percent of the initial
purchase price of the car. In addition, a local fee of $11.50 per year and an inspection fee of $10.50
per year was applied in all scenarios.
For operating costs, differences from the FHWA report include the following. Fuel costs for
GVs are based on a price of $0.816 per gallon excluding taxes. The state fuel tax rate is $0.20 per
gallon, and the federal fuel tax rate is $0.184 per gallon. Maintenance, oil, and tire taxes are base on
an 8 percent sales tax rate in the state of Texas.
Life-Cycle Cost Analysis Gasoline Vehicle
Below is a cost analysis in 1993 dollars which measures market prices and fees for owning and
operating a GV. It is instructive to compare some key scenarios. Worksheets of the owning and
operating costs of a compact and an intermediate-sized GV were formulated since these two vehicles
are most comparable to EVs in terms of space, style, and performance. The detailed results of these
two cases are presented in Appendix A, Tables A.1 and A.2.
The calculations are based on initial prices of $11,896 and $14,973 for the compact and
intermediate-sized cars, respectively. These values are consistent with those presented in the FHWA
report. Below in Table 3.1 is a more detailed description of the characteristics of the compact and
intermediate-sized vehicles.
19

TABLE 3.1 CHARACTERISTICS OF THE GVs IN THE LIFE-CYCLE
COST ANALYSIS
Characteristics Compact GV Intermediate
(case 1) GV
(case ~
Vehicle price ($) $11,895.86 $14,972.93
Payment plan (years) 3 3
Down payment -10% of purchase price ($) $1,189.59 $1 497.29
Monthly payment ($) $336.73 $423.83
Vehicle life (years) 12 12
Vehicle life Jmile~ 128,500 128,500
Average annual driving distance (miles/vear) 10,708 10,708
Price of gasoline excluding taxes ($/gal) $0.816 $0.816
Energy efficiency of vehicle (miles/gal) 22.86 19.87
Federal fuel tax rate ($/gal) $.184 $.184
State fuel tax rate ($/gal) $0.20 $0.20
Source: Assumptions for vehicle price, vehicle life (years and miles), annual driving
distance and energyefficency from FHWA 1992: 14-17. Payment plan and fuel tax rates
are added assumptions of this report.
20

Life-Cycle Cost Analysis Electric Vehicle
Below is a cost analysis which measures market prices and fees for owning and operating an
EV. It is instructive to compare some key scenarios comparable to those of the GVs. The primary
differences are the characteristics of the battery and the resulting cost of the battery. This cost is then
added on to the cost of the gasoline-powered counterpart.
We analyze four EV cost cases. Case 1a is based on the compact GV. The characteristics and
cost of the battery are consistent with those of the USABC's mid-term goals. Case 1 b is also based on
the compact GV; however, the characteristics and cost of the battery are consistent with the USABC's
long-term goals.
Case 2a is based on the intermediate-sized GV. The characteristics and cost of the battery are
consistent with those of the USABC's mid-term goals. Case 2b is also based on the intermediate
sized GV; however, the characteristics and cost of the battery are consistent with the USABC's long
term goals. The detailed results of cases 1 a, 1 b, 2a, and 2b are in Appendix A tables A.3 through A.6.
Calculations are based on initial prices of $11,896 plus the cost of the batteries and $14,973
plus the cost of the batteries for the compact and intermediate-sized cars respectively. The vehicle life
in these scenarios is 12 years, the same as the GVs in this study. However, it is important to note that
many researchers assume EVs will have longer lives than comparable GVs because an electric drive
has fewer moving parts (Sperling 1994: 56 and lEA 1993: 160). In addition, the energy efficiency of
the compact EV measured at the wall outlet is assumed to be 0.38 kWh/mile and the energy efficiency
of the intermediate-sized EV measured at the wall outlet is assumed to be 0.44 kWh/mile. Below in
Table 3.2 is a more detailed description of the characteristics of the compact and intermediate-sized
EVs.
21

TABLE 3.2 CHARACTERISTICS OF EVs IN THE LIFE-CYCLE COST
ANALYSIS
Characteristics of Vehicle Com. EV Com. EV Int. EV Int. EV
Cycle life of battery to 80% 600 1000 600 1000
disc
100 100 100 100
Energy efficiency of vehicle 0.38 0.38 0.44 0.44
measured at the wall outlet
100 150
60000
Number of batteries needed for 2.14 1.28 2.14 1.28
life of a vehicle
Total cost of batteries for life of 13,058.45 5,587.51 15,098.52 6,427.79
22
- ---,----
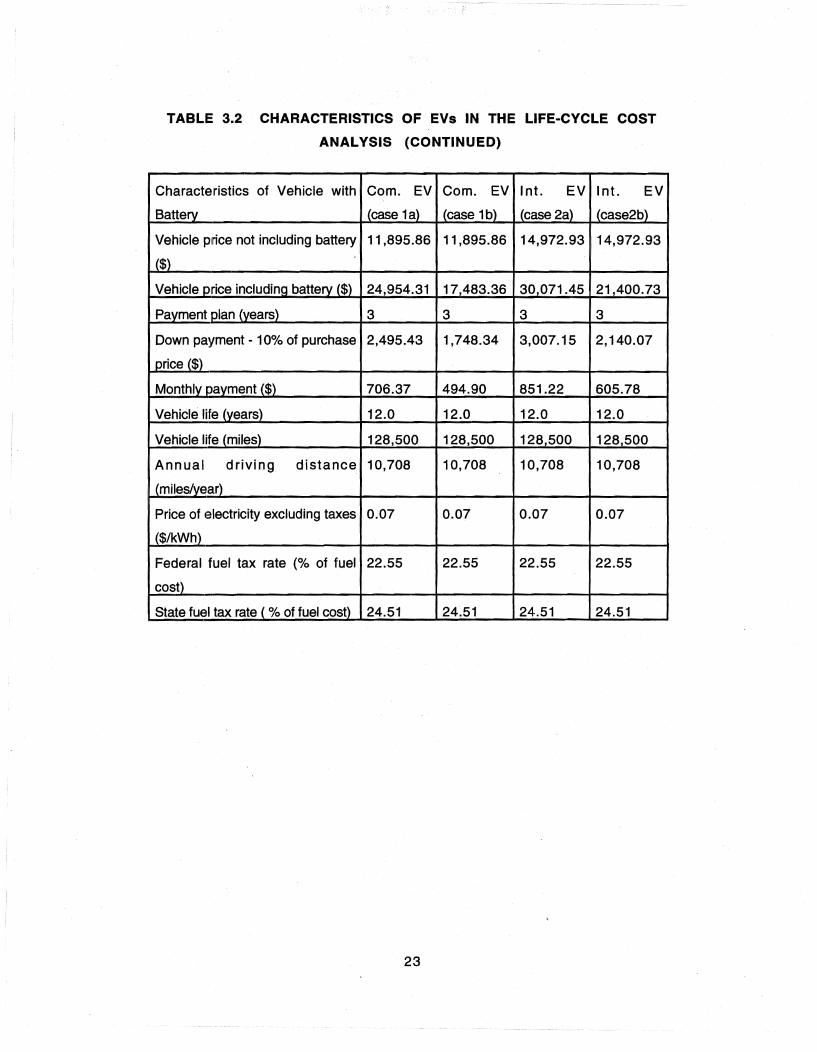
TABLE 3.2 CHARACTERISTICS OF EVs IN THE LIFEaCYCLE COST
ANALYSIS (CONTINUED)
Characteristics of Vehicle with Com. EV Com. EV Int. EV Int. EV
Battery (case 1a) (case 1b) (case 2a) (case2b)
Vehicle pl~ce not including battery 11,895.86 11,895.86 14,972.93 14,972.93
($)
Vehicle_price includin~battery ($t 24,954.31 17,483.36 30,071.45 21,400.73
Payment ~Ian (yearst 3 3 3 3
Down payment· 10% of purchase 2,495.43 1,748.34 3,007.15 2,140.07
price ($)
Monthly payment ($>- 706.37 494.90 851.22 605.78
Vehicle life (yearst 12.0 12.0 12.0 12.0
Vehicle life (miles) 128,500 128,500 128,500 128500
Annual driving distance 10,708 10,708 10,708 10,708
(miles/year)
Price of 131ectricity excluding taxes 0.07 0.07 0.07 0.07
($/kWh)
Federal fuel tax rate (% of fuel 22.55 22.55 22.55 22.55
costt
State fuel tax rate ( % of fuel cost) 24.51 24.51 24.51 24.51
23
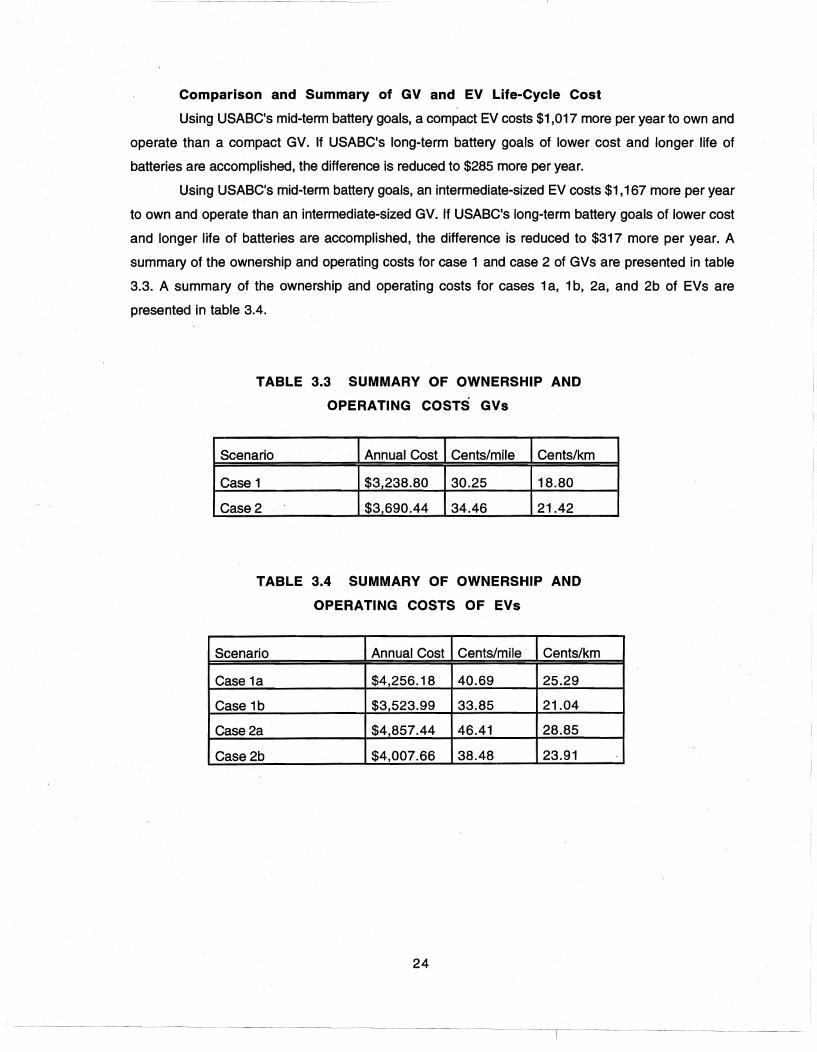
Comparison and Summary of GV and EV Life-Cycle Cost
Using USABC's mid-term battery goals, a compact EV costs $1,017 more per year to own and
operate than a compact GV. If USABC's long-term battery goals of lower cost and longer lifeof
batteries are accomplished, the difference is reduced to $285 more per year.
Using USABC's mid-term battery goals, an intermediate-sized EV costs $1,167 more per year
to own and operate than an intermediate-sized GV. If USABC's long-term battery goals of lower cost
and longer life of batteries are accomplished, the difference is reduced to $317 more per year. A
summary of the ownership and operating costs for case 1 and case 2 of GVs are presented in table
3.3. A summary of the ownership and operating costs for cases 1 a, 1 b, 2a, and 2b of EVs are
presented in table 3.4.
TABLE 3.3 SUMMARY OF OWNERSHIP AND
OPERATING COSTS GVs
Scenario Annual Cost Cents/mile Cents/km
Case 1 $3,238.80 30.25 18.80
Case 2 $3690.44 34.46 21.42
TABLE 3.4 SUMMARY OF OWNERSHIP AND
OPERATING COSTS OF EVs·
Scenario Annual Cost Cents/mile Cents/km
Case 1a $4,256.18 40.69 25.29
Case 1b $3,523.99 33.85 21.04
Case2a $4857.44 46.41 28.85
Case 2b $4,007.66 38.48 23.91
24

DETERMININIG EXTERNAL COSTS
A life-cycle cost analysis such as this is helpful in determining the cost of an individual
consumer's personal travel. However, recent research suggests that such conventional analyses fail
to take into account many of the factors determining the impact of vehicle operation, not just on
individual consumers, but on the communities in which they live. Operation and ownership costs do
not cover many of the costs associated with oil production and use. The costs of a damaged
environment and energy security are also important but less visible and difficult to calculate. Health
and environmental costs include air pollution, greenhouse gas emissions, water pollution, the
destruction of natural habitat, and the clean-up and habitat-loss costs of oil spills that are not directly
paid by oil companies. In addition, mUlti-billion dollar expenditures are made to protect U.S. shipping
and oil interests in the Middle East (Natural Resource Defense Council: 16). This section of the report
will address these issues.
Air Pollution Emissions
In this section of the report we address emissions of the full-fuel cycle for both GVs and EVs.
This analysis relies primarily on Light Duty Vehicle Full-Fuel Cycle Emissions Analysis prepared for the
Gas Research Institute (GRI). For the petroleum fuel cycle, the GRI summarizes the emitting processes
as follows: (1) engine driven pumps and compressors at the wellhead, (2) natural gas flared at the
wellhead, (3) refinery combustion processes, (4) distribution combustion processes, and (5) leakage
and vapor releases from all stages of the fuel cycle including, wellhead, refineries, tank storage, and
retail gasoline distribution (GRI: 8).
For the electric power sector, the GRI summarizes the emissions associated with the electric
power cycle as follows: (1) fossil fuel combustion associated with power production, (2) fugitive
emissions from onsite fuel storage, (3) increased production necessary to meet demand as a result of
resistance losses associated with power transmission and distribution, and (4) upstream fuel-cycle
emissions for fossil fuel electric power feed stocks (GRI: 27). We will only consider emissions from
coal, petroleum, and natural gas feed stocks. We will assume nuclear, hydro, and other feed stocks
have no air emissions associated with them.
Below in Table 3.7 is a summary of the air emissions associated with GVs. We have adjusted
the calculations to reflect the scenarios we presented in the life-cycle cost analysis of GV. Namely, the
emissions reflect the efficiency of the vehicles we are considering: a compact vehicle that gets 22.86
miles per gallon, and an intermediate-sized vehicle that gets 19.87 miles per gallon.
Table 3.8 presents various scenarios for different fuel mixes. Obviously, emissions of electric
vehicle power generation will depend primarily upon the feed stock mix. First, prOjected mixes for the
25

U.S. for 1995 and 2010 are presented. Then the marginal mix for the U.S. in 1990 is presented. The
importance for evaluating marginal feed stock mixes cannot be overstated. If EVs gain a significant
amount of the automobile market share, they will rely on additional electricity generation. This
additional generation will characterize the emissions associated with the EV. In addition, a scenario is
presented that reflects the feed stock mix of Texas and another that reflects the feed stock mix for the
city of Houston. Tables 3.7 and 3.8 summarize the air emissions associated with compact and
intermediate-sized EVs for the various electricity generation scenarios.
TABLE 3.5 FUEL CYCLE EMISSIONS FOR GVs
Pollutant VOC CO NOx SOx PM10 CO2
(grams/mile) eauiv.
Scenario:
Case 1 0.245 0.077 0.217 0.042 0.013 81.6
Case 2 0.281 0.089 0.250 0.049 0.014 93.9
Source: G RI 1994: 61. Revised for fuel efficiencies of 22.86 mpg for case 1 and 19.87
mpg for case 2.
TABLE 3.6 VEHICLE COMBUSTION AND EVAPORATIVE
EMISSIONS FOR GVs
Pollutant VOC CO NOx SOx PM10 CO2
(grams/mile) eauiv
Scenario:
Case 1 .427 3.272 .385 369.3
Case 2 .492 3.764 .443 424.8
Source: GRI 1994: 61. Revised for fuel efficiencies of 22.86 mpg for case 1 and 19.87
mpg for case 2.
26
-1--- -

TABLE 3.7 FULL FUEL CYCLE EMISSIONS FOR GVs
Pollutant VOC CO NOx SOx PM10 CO2
(grams/milet eauiv
Scenario:
Case 1 .672 3.349 .602 .042 .013 450.8
Case 2 .773 3.853 .693 .049 .014 518.6
SourcH: GRI 1994: 61. Revised for fuel efficiencies of 22.86 mpg for case 1 and 19.87
mpg for case 2.
TABLE 3.8 PERCENTAGE OF ELECTRICITY GENERATED BY
DIFFERENT FUELS
ReQion United States Texas Houston
Fuel mix 1995 2010 Marginal 1990 1990
mix, 1990
Coal 54.3 60.4 50.0 50.67 31.4
Petroleum 5.9 3.5 15.0 .23 0.5
Natural Gas 12.3 14.1 30.0 41.53 56.4
Nucle,ar 17.7 14.0 2.0 6.75 11.7
Others 9.8 8.0 3.0 .82 0.0
Source: EIA 1990, EIA 1992, and Wang et al.
27

TABLE 3.9 ELECTRIC POWER EMISSIONS FOR COMPACT EVs
Pollutant (grams/mile) voe CO NOx SOx PM10 CO2
eauiv.
Scenario:
U.S. 1995 0.026 0.050 0.942 2.032 0.032 267.592
U.S. 2010 0.024 0.053 1.026 2.200 0.034 287.620
U.S. marginal mix 0.054 0.077 1.161 2.058 0.037 325.679
Texas 1990 0.037 0.076 1.175 1.793 0.027 302.798
Houston,TX 0.046 0.082 1.079 1.119 0.018 262.503
Source: All values of emissions based on GRI 1994 emissions estimates for 1993
assuming a vehicle efficiency of 22.86 mpg and fuel mixes from Table 3.8.
TABLE 3.10 ELECTRIC POWER EMISSIONS FOR INTERMEDIATE
SIZED EVs
Pollutant (grams/mile) voe CO NOx SOx PM10 CO2
eauiv.
Scenario:
U.S. 1995 0.030 0.058 1.091 2.352 0.037 309.843
U.S. 2010 0.028 0.061 1.188 2.547 0.039 333.034
U.S. marginal mix 0.063 0.089 1.345 2.383 0.043 377.102
Texas 1990 0.043 0.088 1.360 2.076 0.031 350.608
Houston,TX 1990 0.054 0.095 1.249 1.295 0.021 303.950
Source: All values of emissions based on GRI 1994 emissions estimates for 1993
assuming a vehicle efficiency of 19.87 mpg and fuel mixes from Table 3.8.
28

Monetary Values of Air Pollution Emissions
Studies have been conducted to estimate the monetary value of air pollutant emissions in
some U.S. areas. Because of the differences in air quality states and population exposed among
areas, emission values should differ considerably. Application of emission values estimated for one
area to another area without any adjustment is inaccurate. Area specific emission values need to be
estimated.
Two general methods have been used to estimate emission values--namely, the damage
estimate method and the control cost estimate method. The damage estimate method attempts to
estimate the value of the adverse impacts of the actual emissions. Obviously, determination of the
monetary values that individuals place on adverse air pollution effects is the key element. These
values can be related to medical expenses, loss of work, discomfort, and inconvenience that result
from adverse health effects. Physical damage to property and agriculture are also valid. Often market
dollar values of property and agricultural products are used as the opportunity cost of the loss due to
air pollution. The control cost estimate method is based on the assumption that emission standards or
air quality standards are established at a socially acceptable level, where marginal damage is equal to
the marginal control cost. Supposedly, the control cost required to meet predetermined air quality
standards imposed by legislators reveals the value that society places on the emissions being
controlled (thus, the method is sometimes known as the revealed preference method). Therefore,
the estimated marginal control cost to meet an emission standard represents the marginal damage
value of air pollution when the standard is met.
The Center for Transportation Research (CTR) at The University of Texas at Austin in
cooperation with the Tellus Institute of Boston, MA, has usefully established a set of air emission
values appropriate to Texas (Euritt et al. 1995). The dollar values CTR presents lie within the range of
values operative in various areas within the United States and are presented in Table 3.11.
Tables 3.12, 3.13, and 3.14 contain estimates of the urban air emissions associated with GVs
and EVs on a cents per mile basis. In order to calculate these values, the amount of emissions in
grams per mile (Tables 3.7,3.9,3.10) are multiplied by the monetary value of the emissions (Table
3.11 ).
29

TABLE 3.11 ESTIMATED EMISSIONS VALUES FOR TEXAS
Pollutants, Emissions cost, 1993, $/ton
Regions of Texas VOC CO NOx SOx TSP CO2
Urban $6,371 $992 $9070 $300 $4,560 $25
Rural $3,021 $992 $3,705 $300 $4,560 $25
Source: Euritt et al.: 101
TABLE 3.12 ESTIMATED URBAN EMISSIONS VALUES FOR TEXAS
FOR GVs (CENTS/MILE)
Pollutant VOC CO NOx SOx PM10 CO2 Total
cost
Vehicle
compact 0.472 0.366 0.602 0.001 0.007 1.242 2.690
22.86
int-size 0.543 0.421 0.693 0.002 0.007 1.429 3.095
19.87
30
---- -- - - - --- -- -~ ~ ---- - - - - - - l - - - - - - - -- ---- - -- ---- -

TABLE 3.13 ESTIMATED URBAN EMISSION VALUES FOR TEXAS
FOR COMPACT EVs (CENTS/MILE)
Pollutant
U.S. 2010 0.018 0.006 1.026 0.073 0.017 0.793 1.932
Mar.Mix1990 0.040 0.008 1.161 0.068 0.019 0.897 2.194
Texas 1990 0.028 0.008 1.174 0.059 0.014 0.834 2.118
Houston, TX 0.034 0.009 1.079 0.037 0.009 0.723 1.891
TABLE 3.14 ESTIMATED URBAN EMISSION VALUES FOR TEXAS
FOR INTERMEDIATE EVs (CENTS/MILE)
Houston, TX 0.040 0.010 1.249 0.043 0.010 0.838 2.190
1990
31

Monetary Values of Energy Security
Determining the external costs of energy security not born by drivers associated with the use
of petroleum is a difficult task. For the purposes of this report we base our calculations on figures cited
in The Going Rate: What It Really Costs to Drive. These costs include potential impacts that increasing
imports could have on the international price of oil, and potential costs incurred in the case of sudden
interruptions of supply (i.e. inflation, unemployment, etc.). MacKenzie et al. estimate these security
costs for the transportation sector at approximately $25.3 billion (MacKenzie et al. 1992: 15-17). We
calculate this cost to be approximately $0.012 per mile by dividing $25.3 billion by total vehicle miles
traveled (VMT). We use $0.012 per mile for both the compact and intermediate gasoline vehicle
scenarios. We assume this cost will not be incurred in all four EV scenarios.
CONCLUSIONS
Market and External Costs
Tables 3.15 through 3.19 outline the estimated total costs for both GVs and EVs. These
costs include ownership and operating costs, estimated emission costs, and estimated energy
security costs. It should be noted that no energy externality costs have been calculated for any of the
electric vehicle cases. In this part of the report we have assumed that electric vehicles would not incur
energy security costs. This assumption, although conventional in EV market research, overlooks the
fact that in order to completely avoid our dependence on foreign oil, the market penetration of electric
vehicles would need to be far greater than current research anticipates.
In addition, this analysis assumes the same vehicle life for both EVs and GVs. If EVs are able
to attain longer vehicle lives as expected (DeLuchi et al. 1989: 263), they will be even more
competitive with GVs in terms of cost. In addition, the EVs in this analysis are assumed to have very
high initial costs due to the high cost ·of batteries. The ownership costs in this analysis are
conservative because a reduced initial EV cost due to large production schedules associated with a
more mature market are not assumed. Other life-cycle cost analyses (DeLuchi et al. 1989: 263; Euritt
et al.: 138; Sperling 1995: 57) assume much lower initial price of EVs. These two factors cause the
EVs in this analysis to have high ownership costs. In fact, this analysis assumes a type of "worst case"
cost scenario. However, using the long-term battery goals, the cost per mile of EVs is very close to
that of comparable GVs.
However, operating costs and the external costs associated with air quality and energy
security are lower in all cases for EVs. This is an important pOint because as urban centers grow so will
the values placed on air pollutants, making the EV even more attractive in terms of total cost.
In all scenarios, total costs for GVs are less than those of similar size EVs. However, total costs
32

for compact as well as intermediate-sized EVs will be only slightly higher than the comparable GVs
when the long-term battery goals are achieved. For example, the total cost for the compact GV is
34.140 cents per mile; while the total cost of the compact EV is estimated to range from 35.637 to
36.044 cents per mile. Similar cost differences are estimated for the intermediate-sized vehicles. See
tables 3.15 through 3.19 for complete total cost analyses.
TABLE 3.15 ESTIMATED TOTAL COSTS FOR GVs
Case 1
Case 2
Market Emissions Eng
(cents/mile) (cents/mile) Security
30.25 2.690 1.2
34.46 3.095 1.2
Total Cost Total Cost
(cents/mile) (cents/km)
TABLE 3.16 ESTIMATED TOTAL COSTS FOR COMPACT EVs
Mar. Mix
19
Texas 1990
Houston, TX
Market
(cents/mile)
40.69
40.69
40.69 1.891 0.0
33
Total Cost Total Cost
(cents/mile) (cents/km)
42.477 26.378
42.622 26.468
42.884 26.631
42.808 26.584
42.581 26.443

TABLE 3.17 ESTIMATED TOTAL COSTS FOR COMPACT EVs
U.S. 2010
Mar. Mix
Texas 1990
Houston, TX
1990
Market
(cents/mile)
33.85
33.85
33.85
33.85
0.0
1.932 0.0
2.194 0.0
2.118
1.891 0.0
Total Cost Total Cost
(cents/mile) (cents/km)
35.637 22.1
35.782 22.221
36.044 22.383
35.741 22.195
TABLE 3.18 ESTIMATED TOTAL COSTS FOR INTERMEDIATE EVs
Mar. Mix
1990
Texas 1
Houston, TX
1990
Market
(cents/mile)
46.41
46.41
46.41
46.41
0.0
2.237 0.0
2.540 0.0
2.452 0.0
2.190 0.0
34
------- --- --- - ~----- --
Total Cost Total Cost
(cents/mile) (cents/km)
48.647 30.210
48.950 30.398
48.8
48.600 30.181
~- - - - - - - -T- - --- -------- - --- -- --~ ..... - .

TABLE 3.19 ESTIMATED TOTAL COSTS FOR INTERMEDIATE EVs
Mar. Mix
1990
Texas 1990
Houston, TX
1990
Market
(cents/mile)
38.48
38.48
38.48
Break Even Prices
2.540 0.0
2.452 0.0
2.190 0.0
Total Cost Total Cost
(cents/mile) (cents/km)
41.020 25.473
40.932 25.419
40.670 25.256
The cost per mile of compact and intermediate-sized EVs with the long-term battery goals will
equal that of comparable GVs if the total price of gasoline (including all taxes) increases from $1.20 per
gallon to $1.65 per gallon. Disregarding the factor of gasoline prices, the total cost per mile of a
compact EV with the long-term battery goals will equal that of a compact GV if the cost of the EV
battery decreases from $4781 to $3000. The total cost per mile of an intermediate-sized EV with the
long-term battery goals will equal that of an intermediate-sized GV if the cost of the EV battery
decreases from $5500 to $3600.
35

CHAPTER 4. MARKET PENETRATION OF ELECTRIC VEHICLES
PROBLEM STATEMENT
This final chapter analyzes the potential market for electric vehicles (EVs), summarizing
current research on EV market penetration and then describing and analyzing the results of a new
survey of potential EV consumers, the Center for Transportation Research Interactive Web Survey
(CTRIWS). Because the CTRIWS is available on the Internet, participants share the demographic
characteristics of Internet users: primarily male, well-educated and with higher-than-average incomes.
As described below, this group merits the scrutiny of EV researchers because it is also the group most
likely to purchase a new car of any kind, including the EV. The majority of respondents indicated
interest in considering the purchase of an EV, especially once they had received information about
the air quality and energy security issues surrounding EV research. But it is not the argument of this
report that, in some simple way, consumers aware of these issues constitute a ready-made EV market.
Rather, the research summarized in this report, as well as the results of the CTRIWS, suggest that the
respondents identified by CTRIWS, because they are receptive to education about EVs and because
they are favorably inclined toward EV purchase in the abstract, are a group that merits further study. At
such time as EVs become available to consumers, it is this group and th~ techniques to which they
respond--primarily education about new technology--that offer EV marketers an entree into the
consumer market.
This chapter begins by addressing the problem of identifying an urban market for EVs using
decision theory to comment on the methods of framing questions that may characterize current
consumer research on the topic. Previous research has relied on four main approaches to estimate
EV marketability: traditional travel surveys, attitude surveys, stated-preference surveys, and game
type surveys. Traditional travel surveys do not typically solicit information about EVs per se, but are
used to identify household travel patterns that are most amenable to EV use. Attitude surveys and
stated-preference surveys have the advantage of directly querying consumers about their
perceptions of EVs, but they share problems common to new technology surveys as discussed later.
Game-type surveys, like traditional travel surveys, allow researchers to gain information about
household travel patterns and vehicle use; like stated-preference and attitude surveys, they have
been used to solicit specific responses about EVs. Identifying the underlying assumptions and
framing of questions in game-type EV surveys is especially important. The most extensive EV survey,
Purchase Intentions and Range Estimation Games (PIREG), draws heavily on this approach. Finally,
this report will analyze the CTRIWS which draws on PIREG and also on the technology of the Internet,
36

exploring the way questions for CTRIWS are framed in light of the approaches of and information
obtained from previous surveys about EVs. The report concludes with a discussion of the distinction
between surveys and models as it affects the framing of questions in EV research.
Determining a market for EVs is a difficult task for several reasons. First, it is never easy to
identify a market for a new technology product, particularly a product which benefits from continual
and rapid technology advances, Second, the uncertainty in the market for EVs does not rest solely
with the consumers; clean air initiatives and regulations as well as the responses of motor vehicle
manufacturers to these policies will continue to shape the market for EVs. In addition, the EV market
will depend on the relative success or failure of the markets for other alternative fueled vehicles
(AFVs). Indeed, the market for all of these AFVs appears to be one and the same, because they all to
a large degree are in response to clean air and energy security policies. In other words, the level of
market penetration of EVs will depend largely on the market penetration of natural gas-powered
vehicles, propane-powered vehicles, and other AFVs. Finally, it is difficult to determine the degree to
which consumers will accept or reject the attributes of the EV. The underlying hypotheses in this
report is that degree to which consumers are educated not only about the attributes associated with
EV operation but about underlying issues of energy consumption and clean air will undoubtedly have
a large effect on the market for EVs.
The attempt to determine the potential market for EVs is made even more complex by the
different interests of various agencies and institutions seeking this information. For example, motor
vehicle manufacturers want to know how many consumers might purchase an EV in orderto establish
current production schedules and to antiCipate future revenues. As well, manufacturers faced with
designing and marketing clean-fuel vehicles need to know whether costs can be reduced by high
volume sales, and must base their designs on the consumer uses of EVs. Another example would be
government agencies charged with promoting clean-fuel vehicles, which are in need of methods to
analyze proposed policies for stimulating the demand for clean-fuel vehicles.
CURRENT RESEARCH ON THE ELECTRIC VEHICLE MARKET
This section summarizes relevant market research pertinent to developing an EV market.
First, travel behavior studies, attitude surveys, and stated-preference surveys are discussed. These
non-game surveys are compared with the results of models based on game-type approaches. Several
game-type approaches, while not necessarily developed to determine the EV market have influenced
the methodology of EV research, are reviewed. The most important game-type EV model, the PIREG
study from The University of California at Davis (U.C. Davis), is discussed in detail. Next, CTRIWS,
which draws on many of PIREG's innovations while providing a more economical and accessible
37

survey than PIREG, is described. Both PIREG and CTRIWS play an important role in educating
potential EV consumers about their own travel patterns as well as about the air quality and energy
issues promoting government and industry interest for AFVs and EVs in particular.
Traditional Approaches
One of the simplest methods for predicting EV market penetration is the use of information
obtained by traditional travel surveys. Researchers examine this information looking for households
whose travel patterns can accommodate the attributes of EVs, particularly that of limited range
between charges. For example, researchers determine which types of households they believe will
be able to accommodate a limited range EV. Often these households have two cars and a garage
where recharging could potentially take place. Most often one of the vehicles in these households
only travels 30 or 40 miles per day. Researchers reason that these households may be willing to
replace one of their gasoline-powered vehicles (GVs) with an EV since this change will not significantly
alter their present travel pattern.
According to one such study, 57 percent of households in the U.S. could accommodate a
vehicle with a range of approximately 80 miles (Kiselwich and Hamilton 1982). Other studies estimate
that 60 percent of U:S. households drive 96 miles or less 348 days per year (Deshpande 1984) and
that 95 percent of the time, 50 percent of U.S. drivers take trips that total less than 100 miles per day
(G reene 1985). Nesbitt et al. (1992) found that 28 percent of households have the basic
requirements for EV operation: two or more vehicles, a garage or carport for recharging, and at least
one vehicle that almost never travels more than 80 miles per day (All studies cited in lEA 1993: 29 and
Kurani et al. 1994: 3). While travel surveys are useful in that they take into account the constraints of
consumers' actual travel patterns and relate those to the attributes of EVs, their drawback is that they
do not account for the actual preferences of consumers. This type of analysis is called a constraints
based attribute-matching approach. Actually, this approach is not a survey but a fairly simple demand
forecasting model.
There are limitations to this type of analysis. First, this type of research only states what
consumers might be willing to do. In other words, it defines an upper bound on the size of the market
without behavior adjustments. It says nothing about what consumers are willing to do. In addition, this
approach assumes the only attribute that needs to be considered is the range of the vehicle. In other
types of EV research, range has been identified as an important attribute; however, it is not the only
attribute consumers consider. The primary benefit of this type of analysis is that it is simple to conduct
and analyze.
Attitude surveys have been developed to gauge consumer preferences. Attitude surveys
38

must confront the problem that consumers know very little about EVs. The most common method
developed to help consumers gain the information they need to respond sensibly to questions about
EVs is an informal focus group in which facilitators lead approximately 10-person discussions
exploring group members' likely future travel behavior.
The focus groups have benefits as well as limitations. They provide an excellent opportunity
for a small group of people to learn about EVs as well as some other issues such as air pollution. In
addition, the focus groups provide individuals with a forum to discuss and perhaps evaluate their
driving behaviors. But because focus groups are not selected randomly, their results cannot be
generalized. A further disadvantage is that participants in these groups have little or no experience
operating an EV, and have certainly never experienced many of the attributes associated with EVs. In
particular, such novelties as home recharging, shorter driving range, and very high reliability would be
unfamiliar and thus hard to evaluate for most consumers (lEA 1993: 29). In addition, the focus group
method is particularly sensitive to the influence of surveyor bias. A wide range of unintended
responses can be promoted especially when there is a face to face interview process.
Stated-preference surveys, usually a mail or telephone survey, generally suggest
hypothetical scenarios that explore consumers' willingness to pay, or accept compensation, for
vehicle and fuel attributes. These attributes include creating less pollution and lower l)1aintenance
costs on the positive side, and on the negative side, shorter driving range and higher purchase price.
Respondents to stated-preference surveys aJe asked to make hypothetical choices from sets of
vehicle attributes. The results of these studies to date predict very small markets for EVs. According to
these surveys, consumers would need unrealistically laJge compensation in order to accept the short
driving ranges and long recharging times of the typical EV. To accept a range of 50 miles (80
kilometers) instead of 199 miles (320 kilometers), for instance, Bunch et al. (1992) found that
consumers would need to be compensated $15,000 (all figures adjusted to 1991 U.S. dollars).
Independent research by auto motor vehicle manufacturers confirms the findings of stated
preference surveys about the unwillingness of consumers to accommodate EV attributes. The Ford
Motor Company, for example, arrived at a 1 percent market penetration estimate, using focus groups
and defining an EV as being 100 percent emission-free, a top speed of just over 75 mph (120 km/h),
50 percent less space, reduced range, and a $3,000 higher purchase price. (lEA 1993: 29).
Game-type Surveys
Because the traditional approaches to gathering travel information cannot take into account
both consumers' existing travel patterns and their desires or preferences at the same time, many
researchers have turned to game-type surveys to develop a more dynamic model for determining the
39
---I

EV market.
Household Activity Transportation Studies. The game type survey originated in the
late 1970's with Peter Jones of Oxford University, England as one of the leading figures. Jones
formulated a data collection device of transportation mode choice called the Household Activity
Transportation Studies (HATS). HATS studies household activity and travel patterns and the way in
which households respond to various travel constraints. By using HATS, some logical discipline is
imposed on previously unrationalized survey responses. HATS offers household members a set of
colored blocks with which to construct a simple model of his or her activity schedule on a display
board. Changes to the activity schedule are represented by rearranging the blocks. Thus, HATS
offers a physical analog of the logic of the household's activity, and hypothetical reactions are
rendered more realistic by the respondents' sense of the overall framework in which activity decisions
are made. In his paper "Methodology for Assessing Transportation Policy Impacts," Jones concludes
that "by its nature, HATS is primarily an exploratory device, to be used when policy impacts are
uncertain or as an aid to policy generation. " In a research context, the technique has obvious value as
an aid to theory and model development, and is particularly useful at eliciting the decision rules that
should be built into behavioral models. Because students take on the role of household members
and recreate the impact of new policies on the daily routine of the household, HATS serves an
important educational purpose. Not only does it illustrate the role of travel in daily life, it allows students
to experience the effects of alternative travel policies (Jones 1979: 57).
The impact of HATS on transportation research has been significant. Cabrera and Hartgen
(1990) conclude "although other methods may be as effective as methods of information transfer, this
approach offers a unique experience to both the players and the researcher in that it affords a light,
informal atmosphere for the give-and-take of ideas. The approach enables all of those concerned to
get actively involved in a potentially useful learning situation and quite possibly will reach segments of
the population that will not be reached by other methods."
Purchase Intentions and Range Estimation Games. Kurani, Turrentine, and
Sperling of U.C. Davis with the help of Lee-Gosselin of Laval University in Quebec City, Canada
developed a survey to explore the demand for EVs.
PIREG is an important advance in EV market survey research for several reasons. Its
designers and their institution, U.C. Davis, have been responsible for the majority of EV research in
the U.S., both technical and economic. Their collaboration with Lee-Gosselin, who designed a critical
gaming-approach survey of vehicle use, brought together significant and innovative research ideas
on the EV problem. In PIREG, problems encountered in previous survey research were addressed.
The authors felt that attitude surveys and focus group studies done by other researchers
40

misrepresented the decision-making process of consumers. They suggest that consumers often
answered attitude surveys in ways that indicated their interest in AFVs and particularly EVs, usually
because of the technical innovation or environmental attractiveness of the EV. And in travel behavior
surveys, many consumers revealed a pattern of vehicle use that would be compatible with replacing at
least one household vehicle with an EV. Yet in stated preference surveys, consumers targeted by
attitude and travel behavior surveys as ideal candidates for EV use indicated a surprising inflexibility
when it came to accommodating the limited range and other limiting factors of EV use. In fact, one
survey indicated that consumers would rather pay full price for a vehicle with a 200-mile range than
receive a vehicle at no cost with only a 50-mile range (cited in Kurani et. al. 1994: 4). Rather than
concluding that attitude and focusugroup surveys had simply reflected consumers' "pie-in-the-sky"
ideals and had no relation to their real patterns of vehicle purchase and use, the U.C. Davis team
hypothesized that more detailed information was needed about consumers' decision~making
processes.
PIREG employs interactive stated lifestyle-preference techniques. The authors state that this
type of survey responds to inconsistencies and oversights in previous survey work in the EV market.
This method begins by determining the actual decision-making behavior of the household. The
researcher and participants use this information to design simulated decision-making contexts that
use .the household's actual activities as the basis for a series of hypothetical choices. The responses
generated by PIREG, the researchers argue, are more valid than those of previous surveys because
they ~re rooted in observations of the household's lifestyle decisions. These observations are
gathered in two ways. First, household members themselves keep detailed one-week diaries
recording all household motor vehicle travel. Researchers use householders' own records to
construct a timeline that represents a" trips taken that week, including trip purposes, origins,
destinations, distances and end times. The second major source of information is a two-hour interview
conducted by researchers with household members. In this interview, the timeline is used to
construct "what if" scenarios in which household members consider whether and how they could
accommodate EV use in a variety of routine and emergency travel situations.
As a result of this new approach, new decision variables were discovered: safety buffer,
routine activity space, and critical destination. The safety buffer is the range to be left on the EV at all
times. The routine activity space is the area that contains the locations of activities that the household
accesses on a routine basis. The critical destination is the furthest destination which the household
member using the EV feel they must be able to reach. In addition, PIREG discovered 'that consumers
need more information about recharging. Recharging of EVs is an unfamiliar concept and the benefit
of home recharging is not initially understood by the consumer. All of these factors, not just vehicle
41

range, proved to be important to consumers. The results of PIREG thus suggest that future research
must solicit information about potential constraints other than vehicle range.
The authors divided the 51 surveyed households into three categories: pre-adapted
households, which would require no changes in their vehicle use pattern to accommodate EVs; easily
adapted households, which might infrequently need to change vehicles between drivers to
accommodate an EV; and non-adapted households, in which it would be difficult or impossible to
accommodate an EV in their current traffic patterns. Of the 51 households surveyed, 29 were pre
adapted, 15 were easily-adapted, and 7 were non-adapted. These results clearly suggest that with
information about their own patterns of vehicle use and education about EV technology such as the
travel diaries and interviews made possible, there exists a significant potential market for EVs. But
these two factors--a break-down of the decision-making process regarding vehicle use, and education
about EVs and their potential--are crucial to consumers' willingness to consider using an EV. Overall,
the primary finding of PIREG is that consumers' perceived driving range needs are substantially lower
than previous hypothetical stated preference studies.
Disadvantages or problems with PIREG stem mostly from the limited size and type of audience
this survey reached. In all, only 51 households were interviewed. In addition, the researchers only
interviewed two or more vehicle households who are buying new motor vehicles in California. The
great majority of the households owned their own homes and had incomes greater than $50,000.
SURVEYS AND MODELS
The distinction between surveys and models is an important one in EV research. Surveys of
potential consumers do not in themselves identify a potential market. In order to identify a group of
consumers that can be accurately called a market for EVs, survey data must be incorporated into an
appropriate model. A model can take into account the importance not just of consumer preferences
but also of proposed policies for stimulating the demand for clean-fuel vehicles. A model can also take
into account the observation that the market for EVs is only a part of a larger more general market for all
AFVs.
Presently, Brownstone, Bunch and Golob are engaged in a project to develop a demand
forecasting model for clean-fuel vehicles in California. This project focuses on both households and
commercial fleet operators. The transactions models are estimated using standard econometric
techniques. The key inputs to the forecasting system are vehicle technology, fuel price, fuel
infrastructure, and incentives. Vehicle technology includes all attributes of vehicles which will become
available in the future, including fuel type, refueling or recharging range, pric~, operating costs,
vehicle tailpipe emissions, payload, and performance. The number of vehicles demanded is
42

determined by a model that starts from the current condition and forecasts vehicle transactions. The
baseline year is 1994, and the vehicle stock for this year is based on current data from vehicle
registrations, with some additional information from large scale surveys of household and fleet
behavior. The goal of this model is to analyze proposed policies for stimulating the demand for clean
fuel vehicles. The authors state that the system can also be used by vehicle manufacturers to help
gauge the demand for various types and configurations of clean-fuel vehicles (Brownstone et al.
1994: 3).
The personal vehicle sub-model is the most complicated part of their modeling system. Since
the model is concerned with the demand for a new product that does not yet exist, the researchers
must ask respondents to make choices among hypothetical vehicles. The researchers collected this
data through a three-part personal vehicle survey in June and July, 1993. First, the sample was
identified using pure random digit dialing and covered most of the urbanized area of California.
Preliminary information about household structure and vehicle usage was obtained. This information
was used to create an individualized follow-up survey that was distributed by mail. The purpose of this
survey was to obtain more detailed information about the travel patterns and vehicle usage of
individual household members, The mail-out questionnaire contained two stated preference
experiments for each household. Members of the household were asked to choose a preferred
vehicle from three hypothetical vehicles, including both clean-fuel and gasoline vehicles,
Respondents were also asked about their attitudes towards clean-fuel vehicles. The households
were then contacted by telephone and the responses to the mail-out questions were collected,
Complete sets of all data were gathered from a total of 4,747 households.
The most significant results of this survey process are as follOWS. Eighty percent of the
households had exactly one driver per vehicle. In two vehicle households, approximately one-third of
the vehicles are driven 10,000 miles per year or less, a third are driven 10,000 - 15,000 miles per year,
and almost one-third are driven more than 15,000 miles per year. Fifty-four percent of these vehicles
are driven on trips of 100 miles or more six or fewer times per year. The survey collected information
about how easily households could make technical accommodations to limited-range EVs. Sixteen
percent of the households have access to a private garage or carport with electric service and
commute less than 30 miles per day round trip. An additional 20 percent of all households have a
private garage or carport with electric service and commute less than 60 miles per day round trip
(Brownstone et al. 1994: 12-13).
Another demand forecasting model addresses many assumptions of choice modeling and
notes that the assumptions of stable tastes, good consumer knowledge of the alternatives, and
consumer choices independent of social choices are not supportable for the AFVs market (Turrentine
43
-T .

and Sperling 1992) . The authors incorporate research in disciplines of economics, sociology,
psychology and marketing to address the uniqueness of the AFV market. The uniqueness of this
market stems primarily from new product attributes and social benefits. This demand model takes
seriously the developing AFV market and the evolving conditions of social choice. However, because
of this, the model does not make conclusive predictions of the AFV market in the near future but tries
to more theoretically model mature decision processes.
The distinction between surveys and models needs to be highlighted in order to better
understand the preliminary status of the data gathered by CTRIWS. CTRIWS is a survey, not a model.
Thus, it does not in and of itself identify a potential market for EVs. Rather, CTRIWS provides new data
about a group of potential EV consumers: most importantly, that some respondents who initially say
they would not consider purchasing an EV will, at least hypotheticallY, change their minds after they
have received information about air quality, energy security, and greenhouse gas issues, as well as
information about their own travel patterns in relation to the capabilities of the EV. CTRIWS thus
identifies a group of respondents that deserves further 'research in order to construct an adequate
model forecasting EV demand.
The two influential demand-forecasting models described below, then, need to be
understood as in some ways premature. The results of CTRIWS suggest that we need much more
data about how consumers make decisions about EV purchase before we can accurately model
demand. The authors of these models themselves acknowledge this limitation to their research. As
Brownstone, Bunch, and Golob put it: "Although the key models in the system will be calibrated from
new surveys, it will be necessary to undertake additional survey work to validate and extend these
models. Our preliminary work suggests that consumer's responses to our hypothetical vehicle choice
experiments are realistic, but the only proof of this assertion will come when clean-fuel Vehicles similar
to these hypothetical vehicles are actually offered in the marketplace" (14).
THE CENTER FOR TRANSPORTATION RESEARCH INTERACTIVE WEB SURVEY
Relation to Previous Research
While this survey shares with the PI REG survey an emphasis on the roles of information,
education, and consideration in the consumer's decision-making process, it also differs in important
ways. The PIREG study focuses mostly on range, asking whether a household can adapt to shorter
trips in their weekly schedule. The present survey, however, questions whether range is the only
deterrent to consumer adoption of EVs. It is natural for researchers to assume that range might be the
most important limitation in consumer perception because it is well known that range is one of the
primary technological limitations facing EV research and development. This survey tries to begin from
44

the pOint of view of the consumer, necessarily less familiar with the technological status of EV
research. In this survey, we pursue consumer "prejudices" that may play an important role in the
decision whether or not to purchase an EV. Factors such as reliability, auto manufacturers' support,
safety, ease of operation, resale value, and others may playa more important role than previous
research has indicated. CTRIWS allows us to determine whether or not a specific group of consumers
(Internet users) will alter their opinions, at least in the abstract, if they receive education and
information about energy security, air quality, EV technology, and their own travel patterns.
Survey Design
The survey begins by exploring how consumers currently view EVs. Using hypertext
interactive modeling, the survey ascertains at what level of knowledge about EVs participants are, and
what perceptions (whether false or true) they may have about EVs. When a participant makes a false
assertion or displays an unfounded prejudice, he or she is given brief informative statements about air
quality issues or EVs themselves. Because the hypertext model allows individual participants to
"branch off" at different points in the survey process, we are able to track with some precision at what
pOint participants' lack of information or preconceived ideas might prevent them from becoming EV
consumers (Figure 4.1).
45

yes
willing to use EV
still interest if cost more
no
~ no
rank concerns
I social benefits of EVs
EV technology info.
resolve concerns?
now more willing to try EV?
-
Figure 4.1 Survey Outline
46

Survey Distribution
One of the distinct advantages of the CTRIWS is its wide availability on the Internet. A
memorandum briefly describing the survey and its aims and asking for participants was distributed
both to general news groups and to news groups concerning energy, the environment, and
automobiles. The most general newsgroups were: utexas.general, comp.infosystems.www.users,
comp.infosystems.www.misc, and comp.infosysterms.www.authoring.cgi. More specific interest
oriented groups included those for auto buffs (rec.autos.tech, rec.autos.misc, austin.autos, and
alt.manufacturing.misc). for those interested in energy and the environment (sci.energy,
scLenvironment, and alt.energy.renewable). and a group for progressive Californians (alt.california),
since residents of California are potentially the most educated geographic group on issues of EVs in
the U.S. By posting the memorandum to the general news groups, we hoped to take advantage of
the higher volume of users on such groups. Respondents from general news groups also offered the
possibility of a more diverse set of respondents than those selected from interest-specific news
groups. On the other hand, we speculated that members of the interest-specific news groups might
have a higher rate of response to the memorandum due to their greater motivation to inform
themselves on issues of energy, the environment, and automobile ownership. Distributing the
memorandum to both kinds of news groups ensured that we would be able to measure the response
of something like the "general public" to the survey, but also make sure that we had a numerically
sufficient core of responses to use as data.
Of course, the "general public" of Internet users is actually rather specific. It is difficult to get
accurate demographic information about Internet users because of "the amorphous nature of
cyberspace, with its lack of borders and its culture of anonymity" (Lohr 1995). However, the most
complete study done so far suggests the following: of those users with direct access to the Internet,
67 percent are male and over half are between the ages of 18 and 34. Nearly half work in large
organizations (those with over 1,000 employees). The majority are in the field of education, but those
in sales make up 19 percent of users and those in engineering, 15 percent. Finally, the median
household income of Internet users polled is between $50,000 and $75,000 (Lohr 1995).
These demographics intersect in potentially significant ways with the demographics of new
car buyers in the United States. A 1994 study found that fifty-six percent of new car buyers in 1994
were male. Fifty-six percent were under the age of 50, and 67 percent had some college level
education. The median household income was $50, 930. (All statistics from AAMA 1994: 55.) Thus,
both Internet users and new-caJ buyers are likely to be male, have higher-than-average incomes, and
have more education than average.
CTRIWS was distributed via the Internet for several reasons. Like the PIREG survey, the
47
-- -- - - 1
CTRIWS is somewhat personalized in its gathering of data. That is, the survey can flexibly
accommodate a variety of responses drawn from the participants. CTRIWS does this via the interactive
capabilities of the Internet, in which participants can follow different information paths based on their
differing responses to survey questions and statements. Thus, in distributing CTRIWS on the
Internet, we hoped to replicate some of the strengths of the PIREG survey.
There are three important differences between PIREG's face-to-face interview method and
CTRIWS's interactive response method. The first is that participants in CTRIWS are not interacting with
another human being but with a computer. This difference poses a limitation because the survey
design had to anticipate and hypothesize participants' potential responses, rather than answering the
actual questions participants have as those questions develop, the way a human researcher can. On
the other hand, because there is no incentive for participants to have a pleasant social interaction with
another human being, we speculate that participants' responses to questions about what degree of
inconvenience they are willing to accommodate might be more accurate than they would be if
participants were talking in a face to face interview.
The second difference is the vastly lower cost of distributing an interactive survey on the Web
as opposed to conducting intensive house-to-house surveys in person. The PIREG interviews cost
$2,000 per household to conduct (Sperling 1995: 60). By contrast, once CTRIWS in on-line, it costs
less than ten dollars a year in computer time to maintain. Thus, the pool of respondents for PIREG
must remain necessarily small due to the high cost of conducting the survey. For CTRIWS, however,
each additional household from which responses are gathered costs nothing. In addition, CTRIWS
can remain available and operative over a potentially limitless span of time. During that time the survey
can be inexpensively amended or changed as the data is analyzed. Thus, CTRIWS has the potential
not only to have a greater impact on the public, but also to provide researchers with a far greater
database than PIREG.
But the most important difference between PIREG and CTRIWS is their different strategies.
Although there are stated-preference questions in CTRIWS, it is not a game-type survey based on a
previously-amassed travel diary. This is a limitation of CTRIWS, in the sense that participants do not get
the benefit of seeing their travel patterns laid out for them, as opposed to responding with their
perceptions of what those patterns are. This is one way in which CTRIWS has less power to educate
the potential EV consumer than PIREG. While researchers will gain information about consumer
perceptions and travel patterns, consumers themselves will not necessarily have their perceptions
about travel patterns challenged. However, respondents to CTRIWS do get some minimal analysis of
their travel patterns when the survey informs them whether or not their travel patterns fit into the range
of current EV technology.
48

CTRIWS strikes a balance between informing consumers about EVs and air quality, and
advocating EV use. While CTRIWS participants may not have their preconceptions challenged as
thoroughly as participants in PIREG, by that same token CTRIWS may provide a more realistic
assessment of how much consumers are willing to change their perceptions and habits in order to
accommodate EVs. Since market-wide intervention on the scale of PIREG's house-to-house
interviews is unrealistic, the interactive method of CTRIWS may offer a more practical basis for
assessing a potential EV market.
Summary of Data Collected by Survey
The survey went on-line July 13, 1995 through August 20, 1995 and again from November
14, 1995 through December 7, 1995 at the following address: http://daisy.cc.utexas.edu:7071/.
During these two time periods, there were 203 responses. Respondents were not required to answer
every question in order to participate in the survey. Therefore, the total number of answers varies from
question to question.
Demographic Information. The survey respondents were overwhelmingly male. Of 190
persons who identified their gender, 174 are male and 16 are female (Table 4.1).
The respondents are also, for the most part, well-educated. One hundred ninety-two persons
answered the question about their level of education: three participants had not finished high school
(all were under 21, so perhaps they were not old enough), six people had a General Equivalency
Diploma, 33 persons had some college education, 12 had an associate's degree, 64 had a bachelor's
degree, 55 had a master's degree, 15 had doctorates, and four had professional degrees (Table 4.1).
Not surprisingly, participants tended to have higher than average incomes. There were 178
responses to the question about household income. Sixteen persons indicated that they had an
income of under $20,000 per year. Twenty-eight responded that their income was between $20,000
and $40,000 per year. Sixty-one gave an income between $40,000 and $60,000 per year. Twenty
five participants said they had an income of between $60,000 and $80,000 per year and 39 persons
indicated an income of over $80,000 per year (Table 4.1).
In terms of geographic location, the greatest number of respondents in one state live in
California--forty-six. Twenty-four respondents live in Texas, seven in Massachusetts, five in New York,
and eight in Canada.
49
---1-

TABLE 4.1 SURVEY DEMOGRAPHICS
Gender Education Income
male 174 not compo hs 3 <$20000 16
female 16 GED 6 $20,000-$40,000 28
# of responses 190 some colleQe 45 $40000-$60,000 61
bach. deQree 64 $60 000-$80 000 25
graduate degree 74 >$80,000 39
# of responses 192 # of responses 169
Travel Information. Merely one-fourth of those taking the survey live in households that
own one car or fewer. Fourteen persons taking the survey did not have a vehicle in their household.
Forty-two persons had one car in their household. Of these 42 households, 17 had only one licensed
driver, 19 had two licensed drivers, and the other six had three licensed drivers. Sixty-three persons
answering this question had two cars in their household, 38 persons had three vehicles in their
household, 33 had four cars in the household, and four participants chose not to answer this
question. Of the 192 survey participants who answered both questions (giving information about the
number of vehicles and the number of licensed drivers in the household) there is a ratio of
approximately 1.07 cars per licensed driver.
Most respondents had access to electricity in the area where their cars are parked. Of the 179
people who answered the question of whether or not they had a garage or carport equipped with
electricity, 60 said no and 119 said yes.
The vast majority of respondents make average daily trips that fall well below the most
conservative estimates of the maximum range of current EVtechnology--60 miles. Seventy
participants estimate their average daily travel to be between 0-20 miles. Seventy-five participants
estimate this travel to be 21-40 miles. Twenty-two estimate it to be between 41-60 miles, seven
participants travel 61-80 miles and five travel 80 miles or more. Twenty-four persons did not answer
this question. Clearly, according to the range constraints of current EV technology, 167 of the 203
households described by respondents could accommodate an EV.
Participants' responses to Electric Vehicles. Depending on how many vehicles
were in a participants' household, the following questions were asked. Before giving the survey
participant any information, the respondent was asked if they would be willing to use an EV. If
respondents did not currently own vehicles, they were asked if they would consider buying an EV in
50
the future. If the respondent lived in a household with one vehicle, they were asked if they would
replace their current GV with an EV if the cost were the same. If the respondent's household had two
or more vehicles, the respondent was asked if he or she would be willing to replace one existing
vehicle with an EV. A surprisingly large number (101 respondents) were immediately willing to accept
an EV, while 91 said no, ten chose not to answer, and one person already owned an EV. Of the 101
that said yes immediately, 72 partiCipants said they would be interested in an EV if it cost $1,000 more
per year to own and operate than a GV, while 22 said they would not and seven did not answer this
question. Of the 91 people who initially said they would not be interested in acquiring an EV, 53
participated further in the survey by ranking their concerns. The primary concern for 14 people was
their concern that EVs would not be suitable for long-distance trips. Given a brief bulletin about the
current range of EVs, five of these 14 changed their mind and said they would now be willing to
consider acquiring an EV. Out of the 53 partiCipants ranking their concerns, 12 said their primary
concern was the fear that the EV would be too expensive to maintain. After reading some brief
information about EV costs, five of those 12 changed their minds and said they would now consider
acquiring an EV. Six of the 53 participants were primarily concerned that an EV would be inconvenient
to recharge. When they had read a brief informative statement about fast recharging and the
convenience of overnight recharging, .five of the six said they would now consider acquiring an EV.
Six of the 53 were primarily concerned that an EV would take too long to recharge. When informed
about fast and overnight recharging, five of these six said they would now consider acquiring an EV.
Four of the 53 were primarily concerned that the EV would not be fast enough. When informed about
the current average and top speeds of EVs, only one of these four said they would now be willing to
acquire an EV. Six of the 53 were primarily concerned that EVs would not have auto manufacturers
support. After some brief information on this subject, two persons said they would now be willing to
acquire an EV. Two people were primarily concerned that the EV would not be dependable enough.
When informed about the dependability of the electric drive train, one person indicated a willingness
to acquire an EV.
The 91 partiCipants who initially said no to an EV also received information about various social
benefits of EVs. These bulletins included information about energy security, air pollution, and
greenhouse gases. These participants were then asked if knowing about any of these three issues
made them more willing to acquire an EV. Eighty-four of the 91 received the information about energy
security. Of these, 50 said that they were now more willing to acquire an EV; 34 said no. Eighty-five
out of the 91 received information about air pollution. Of these, 51 said they were now more willing to
acquire an EV, while 34 said no. Eighty-six of the 91 participants received information about
greenhouse gases. For 52, this information made them more willing to acquire an EV, while for 34, it
51

did not change their minds (Table 4.3).
TABLE 4.2 PRIMARY CONCERNS OF RESPONDENTS UNWILLING TO
CONSIDER AN EV
no. willing to %onwhich
Primary concern listed no. of ~onsider EV more info had
responses latter more info Ipositive impact
Not suitable for long-distance trips 14 5 36%
iroo expensive to maintain 12 5 42%
Inconvenient to recharge 6 5 83%
Iroo long to recharge 6 5 83%
Not fast enough 4 1 25%
Not supported by manufacturers 6 2 33%
Not dependable enouah 2 1 50%
Did not rank concerns 41 0 0%
Irotal 91 24 *26%
*There was a presumtion that those who did not rank and read additional information
concerning EVs would not reconsider their original decision.
TABLE 4.3 IMPACT OF INFORMATION ABOUT SOCIAL BENEFITS ON
RESPONDENTS INITIALLY UNWILLING TO CONSIDER AN EV
no. willing to no. not willing Yo on which
Isocial Benefit no. reading ~onsider EV o consider EV more info had
benefit latter more info latter more info Ipositive impact
Energy security 75 49 26 65%
lAir pollution 76 51 25 67%
!Greenhouse gases 76 51 26 66%
52

Conclusions of Survey
Respondents to CTRIWS were overwhelmingly male and had incomes and education above
the U.S. average. This demographic feature also reflects the profile of the typical Internet user, and
may say more about who has access to the Internet than it does about who is interested in EVs.
Clearly, although the survey participants were better educated than the average citizen and
may even have had an initial interest in or awareness of EVs, further education about EV issues made
a difference to their willingness to acquire an EV. The more information they had about both technical
attributes and social benefits of the EV, the more likely they were to consider acquiring an EV. The
survey also indicates that people who are willing to consider EV acquisition from the outset are willing
to pay more for an EV than for its gaSOline counterpart. This willingness, however, may be contingent
on the relative affluence of the survey respondents.
In the future, it would be profitable to post the survey in places that might attract a wider range
of respondents--on newsgroups set up for women, for example. It might also be useful to copy the
survey to a disk and circulate it to diverse workplaces, schools, and community groups. Such
strategies might more directly target the populations currently underrepresented in the survey results.
However, the demographic specificity of the respondents does reflect the demographics of
both Internet users and new car buyers. Thus, the very limitations of this survey's demographic
distribution may suggest that this group (well-educated males with higher-than-average incomes)
merits further research. They may well be the most likely group to consider EV purchase because of
these traits, which make them more likely to take financial risks and more likely to be interested in new
technology, new vehicle purchases, and consumer goods of any kind. Acquiring more detailed
information about the decision-making practices of this group, as CTRIWS does, may well provide the
basis for a more accurate model of the potential EV market.
EVALUATING THE PREFERENCE ELICITATION PROCESS FOR ELECTRIC
VEHICLE MARKET RESEARCH
As the above discussion indicates, researchers attempting to use market surveys to
determine a market for EVs confront a fundamental problem: because consumers are unfamiliar with
the new EV technology, such surveys must both educate partiCipants and also gather information
about consumer preferences. The potential conflict between these two goals has implications for the
way questions are framed in EV market research. Traditional surveys such as travel, stated
preference, and attitude surveys are framed to accomplish only one of these goals: gathering the
empirical information needed to determine a market for EVs. PIREG constitutes a breakthrough in EV
market research because it takes seriously the necessity of bringing consumers up to speed on the
53

new technology before discussing preferences. The wide availability of CTRIWS is thus all the more
important in that CTRIWS extends this breakthrough, taking seriously in its design both the
educational and the empirical tasks of a survey that would successfully elicit consumer preferences on
the subject of EVs. In fact, PIREG and CTRIWS can be said to have shifted the emphasis in EV market
research from eliciting preferences to creating the conditions necessary to determine with any
accuracy what consumer preferences might be.
The unique problem facing EV market research is threefold. First, researchers must contend
with consumers' unfamiliarity with EV technology. Second, in order to get consumers to genuinely
compare EV and GV ownership, researchers must create a survey framework in which a new
technology, rather than bringing the consumer a totally new kirtd of experience in the way that
computers or microwave ovens did when they were first introduced, is being offered as a replacement
for an existing good--the gasoline vehicle--with which consumers may not feel dissatisfied.
Researchers must be aware of the consequences of doing this. Third, in order to create the basis for
genuine comparison, researchers must in a sense create that dissatisfaction by asking consumers to
take public goods such as air quality as seriously as private goods. In effect, market research that
accurately elicits consumer preferences must radically alter the usual basis for consumer decisions-
individual preferences cut off from their social costs.
Reference Points
Theoretical work on the question of reference pOints is one helpful way of understanding the
complexity demanded of EV survey research. When eliciting preferences either for a single attribute
or for an outcome, an important concept is that of the reference point in which the options are framed.
Because outcomes are commonly perceived as positive or negative in relation to a reference outcome
that is judged neutral, varying a reference point can determine whether a given outcome is evaluated
as a gain or as a loss. In addition, the difference between options can loom larger when framed as a
disadvantage of one option rather than as an advantage of the other option (Tversky and Kahneman
1981: 456).
In this case, in which EVs are a new technology and potential EV users generally have no
experience with them (usually they have not only never driven them but they don't recollect even
having seen one), the gasoline vehicle is the reference for a vehicle. In various EV survey methods
this phenomenon expresses itself in different ways. The hypotheSiS of this report is that the task of
educating people about the attributes of EVs cannot truly be separated from the act of asking people
what they think about them. Education must occur not only because of the newness of the
technology but because of the potential social (as opposed to individual) benefits of EVs. In attitude
54

surveys this education occurs in a simple exchange of information between a facilitator and a
participant. In game-type surveys the participant is educated in a more active manner. The participant
takes part in an activity that has the ability to change his or her perceptions. In general, the goal of
educating the consumer can be viewed as a desire to change the reference point.
Related to this last point is an interesting debate discussed by Kahneman (1992). He states,
"studies of framing effects have often been couched in terms of the adoption of one reference point
or another. Indeed, one of the important implications of framing effects is that people are usually
unaware of the possibility that their views of a problem might change with a different formulation--for
example, that risk aversion could be replaced by risk-seeking when the same problems were framed in
terms of losses rather than gains. However, there are many situations in which people are fully aware
of the multiplicity of relevant reference points and the question of how they experience such
outcomes and think about them must be raised" (Kahneman 1992: 305). Kahneman suggests that
acts and attributes of outcomes can be evaluated in relation to multiple discrete reference pOints,
without fully resolving the conflict between these values. As a consequence, the same aspect of an
outcome can be both attractive and aversive, a gain and a loss (Kahneman 1992: 307).
The idea of multiple reference pOints .certainly corroborates the findings of much of the
research done on EV market penetration. In fact, it could very well explain the difference between
information gathered in travel behavior surveys, attitude surveys, and stated-preference surveys. The
notion that consumers should be willing to accept EVs (especially in terms of range) according to
travel behavior studies and are enthusiastic about EVs according to many attitude surveys but appear
not to want to own and operate EVs (particularly the limited range aspects) according to stated
preference surveys may well be due to the problem of multiple reference points. EV research until
now has treated all attributes and constraints as if they were the same. As stated earlier, a reference
point may change with the framing of the question. For example, the same consumer may perceive an
EV differently in response to the question, "Can you accommodate limited range?" versus "Do you
want improved air quality?" But what about the question, "Would you be willing to give up a given
amount of range for a given amount of improvement in air quality?" This question may be more difficult
for the respondent and be seen as both a gain and a loss. A more flexible framework such as multiple
reference points is helpful for understanding what has previously been seen as a contradiction in
research.
In addition, Kahneman (1992) expands on this theory by considering the different valuations
of owners and choosers. He states that owners and choosers face precisely the same choices.
Subjectively, however, the situations of choosers and owners are quite different: the former evaluate
a good as a gain, the latter as something to be given up. He poses the question, "does ownership
55

increase fondness for a good, or merely induce a dislike for giving it up?" He answers that mere
ownership of a good does have an effect: it greatly increases the preference for that good over an
alternative in a direct choice. The general principle is straightforward: when an option is compaJed to
the reference point, the comparison is stated in terms of the advantages and disadvantages of that
option. A particularly important case arises when the reference point is the status quo, and when the
retention of the status quo is an option. Because the disadvantages of any alternative to the status
quo are weighted more heavily than its advantages, a powerful bias in favor of the status quo exists
(Samuelson & Zeckhauser, 1988).
In any type of EV survey at this time in history, respondents are more likely to be owners of
gasoline vehicles than choosers. The attachment of owners to their current gasoline vehicles is likely
to be a factor in their response and should be taken into account. One difference between PIREG and
CTRIWS is that CTRIWS does allow those who do not presently own a car to participate in the survey.
CTRIWS does not assume that persons who do not presently own a car are not potential consumers
of EVs. Rather than trying to frame the questions in such a way as to make EVs seem technologically
attractive to consumers, CTRIWS offers information about air quality, energy use, and the
environment so as to provide participants with multiple reference points. PIREG, by focusing on range
as the major impediment to EV acquisition in consumers' eyes, may shift participants' reference point
somewhat as they understand their gasoline vehicle use more realistically, but it cannot really offer
participants the opportunity to trade off a private good such as range against a public good such as
cleaner air. But it is precisely such tradeoffs that are most likely to motivate consumers to accept the
new technology of the EV.
New Technology
The introduction of AFVs will increase the diversity, complexity and uncertainty of the
personal-use vehicle market. EVs will have attributes unfamiliar to consumers, including home
refueling, reduced refueling ranges, different noise levels, safety, and performance characteristics.
Also, the reduced emissions and greater energy security associated with EVs will make personal
vehicle selection and use a more prominent public issue. Researchers are not fully aware of what are
these differences in vehicle attributes and the prominence that social concerns will have on vehicle
purchase and travel behavior.
Turrentine and Sperling (1992) note that while many attributes can be tested on a limited
basis, such as performance, many attributes of automobiles are experience attributes, such as
maintenance, reliability and seasonal performance. This is problematic for EVs since consumers have
less experience with them (Turrentine and Sperling 1992: 10).
56

In the next decade, the EV market is expected to develop and expand. Demographic trends
and price-unit reductions, although common to all product life cycles, will have a unique impact on
AFVs because of their reliance on technical changes and emissions mandates. These factors will
spark many shifts in the attributes of vehicle selection. Such attributes as range, refueling time, home
refueling, shifts in maintenance routines, performance changes, and preferences for clean fuels will
be subject to changing consumer perceptions. Under such rapidly changing conditions, "consumers
must experiment, investigate, and imitate in order to make selections from the array of new
alternatives." Clearly, consumers'vehicle choices will be influenced significantly by education and
information and these factors may be even more influential than preferences alone (Turrentine and
Sperling 1992: 12).
Public Goods
Because the GV is generally the reference, consumers often view the EV as a smaller, less
versatile vehicle: one with less range, speed, space, etc. As Tversky and Kahneman note, "the
displeasure associated with losing a sum of money (read here: speed, range, etc.) is generally greater
than the pleasure associated with winning the same amount."
The observation complicates our understanding of the choice between a GV and an EV
because losses associated with replacing a GV with an EV are individual losses where the gains
usually associated with this same trade are seen as public gains. Proponents of EVs usually describe
the benefits of them in termsof improved air quality and reduced consumption of foreign oil. It has
been observed that the relation between such goods and individuals is as follows: everybody wants
them, no one wants to 'pay for them. The improved air quality, decreased greenhouse gases, and
improved national fuel security that are the prime benefits of AFVs cannot be enjoyed or
demonstrated directly by individual consumers. Economists call these benefits a "public good" while
environmentalists refer to the dilemma as the "tragedy of the commons." It will take many consumers
switching to alternatives before the effects can be demonstrated, and such improvements cannot be
restricted to those who make the switch. Therefore, despite popular support for improving air quality,
questions remain as to whether individual consumers will act on their good intentions by purchasing
AFVs (Turrentine and Sperling 1992: 15).
The normal assumptions undergirding stated-preference surveys are highly speculative for
new technology products, with whose attributes consumers may have no experience. Transitivity and
communicativity, the definitional properties of preferences, for example, may not be obtained
because of the instability and lack of longitudinal data in the EV market. As this report has
demonstrated, these problems are more generally true of the other types of surveys examined as
57

well. Prior work concludes that innovative survey and interview methods will be needed to provide
both consumers and researchers with an adequate context in which to understand the decisions
made by consumers in relation to EVs (Kurani et al. 1994).
CTRIWS, like PIREG, frames its questions in such a way as to take into account that
consumers need information before they can make a decision about a new technology product with
the specific market location of the EV. Because CTRIWS can remain available indefinitely and
inexpensively on the Internet, it goes even further than PIREG in its ability to reach and educate
consumers. CTRIWS addresses the necessity, at this moment in EV market development, of an open
ended, ongoing process in which consumer education and market development loop back into one
another, and both are changed in the process.
58

REFERENCES
American Automobile Manufacturers Association [AAMA] (1994). "AAMA Motor Vehicle Facts and
Figures," Washington, D.C.
Ben-Akiva, M. and S.A. Lerman (1985). Discrete Choice Analysis: Theory and Application to
Travel Demand, MIT Press, Cambridge, MA.
Bevilacqua-Knight, Inc. (1992). 1992 Electric Vehicle Technology and Emissions Update.
prepared for the California Air Resources Board.
Bresnock, A., M. Miller, E.Lechner, S. Shladoner (1993). "Roadway Electrification: Regional
Impacts Assessment," paper presented at Transportation Research Board 72nd Annual
Meeting, January 1993, Washington, D.C.
Brownstone, D., D.S. Bunch, and T.F. Golob (1994). "A Demand Forecasting System for Clean
Fuel Vehicles," Berkeley, CA, University of California Transportation Center Working
Paper No. 221.
Bunch, D., M. Bradley, T. Golob, A. Kitamura and G. Occhuizzo (1993). "Demand for Clean
Fueled Vehicles in California: A Discrete-Choice Stated Preference Survey,"
Transportation Research A.
Cabrera, Dianne and David T. Hartgen (1990). "An Assessment of Games as Methods of
Providing Information on Gasoline Conservation," Transportation Research Record 801.
Washington D.C.
Chrysler Corporation (1994). AdvertiSing Publication for Dodge Caravan and Plymouth Voyager.
Committee for Economic Development (1993). What Price Clean Air? A Market Approach to
Energy and Environmental Policy. New York.
Cronk, Scott A. (1995). Building the E-Motive Industry: Essays and Conversations About
Strategies for Creating an Electric Vehicle Industry, SAE, Warrendale PA. DeLuchi, M.A.,
D. Sperling and A.A. Johnston (1987). "A Comparative Analysis of Future Transportation
Fuels," research report, Institute of Transportation Studies, University of California at
Berkeley.
DeLuchi, Mark, Quanlu Wang, and Daniel Sperling (1989). "Electric Vehicles: Performance, Life
Cycle Costs, Emissions, and Recharging Requirements," Berkeley, CA, University of
California Transportation Center Reprint NO.7. Reprinted from Transportation Research-A
Vol. 23A NO.3.
DeLuchi, M.A. and D. Swan (1993). "The Promise of Fuel-Cell Vehicles," in Access No.3,
59

University of California Transportation Center, Berkeley, CA.
Deshpande, D.K. (1984). "Development of Driving schedules for Advanced Vehicle
Asessment," SAE Technical Paper Series, No. 840360, Warrendale, PA.
Dyszel, Bill (1994). Letter to the Editor, New York Times, April 5.
Elei:::trosource (1995). promotional publication, Austin, TX.
Energy Information- Administration [EIA] (1990). "Annual Energy Outlook 1990, with Projections
to 2010," DOElEIA-0383 (90), Washington D.C.
Energy Information Administration [EIA] (1992). "State Energy Data Report: Consumption
Estimates 1960-1990," DOE/EIA-0214 (90),Washington, D.C.
Environmental Protection Agency [EPA] (1993). National Air Pollutant Emission Trends 1900-
1992. EPA-454/R-93-032, Research Triangle Park, NC.
Euritt, Mark A., and Angela Weissmann, Robert Harrison, Mike Martello, Jiefeng Qin, Sreedhar R.
Varada, Stephen Bernow, John M. DeCiccco, Mark Fulmer, Jeffrey Hall, and Irene Peters
(1995). "An Assessment of Transportatio'n Control Measures, Transportation
Technologies, and Pricing/Regulatory Policies," prepared for the Texas Sustainable
Energy Development Council by the Center for Transprotation Research at The
University of Texas at Austin and The Tellus Institute, Boston, MA.
Federal Highway Administration (1992) "Cost of Owning and Operating Automobiles, Vans &
Light Trucks 1991 ,Ii Washington D.C.
Foute, Steven J. and Carol J. Hammel (1990). "An Alternative Fuels Evaluation System or Fleet
Vehicles," Energy Task Force of the Urban Consortium, Denver, CO.
Fowler, Thomas (1994). "Electric Bus Operations: A Feasibility Study," Research Report
SWUTC/95/60057-1 ,Southwest Region University Transportation Center, University of
Texas at Austin, May 1995 (with M. Euritt and C.M. Walton).
Gas Research Institute [GRI] (1994). "Light Duty Vehicle Full Fuel Cycle Emissions Analysis," GRI-
93/0472.
Gas Research Institute [GRI] (1992). "Energy Utilization and Greenhouse Gas Emissions:
Transportation Sector," GRI--9210182.
Green Car Media (1993). "Ford's Sodium-Sulfur Powered Ecostars Take to the Highway," Green
Car Journal, Upland, CA.
Greene, D. (1985). "Estimating the Daily Use Age Distributions and Implications for Limited Range
Vehicles", Transportation Research 19B,
Greene, D.L., and D.J. Santini, eds. (1993). Transportation and Global Climate Change, American
Council for an Energy-Efficient Economy, Washington D.C.
60

Greene, D.L., D. Sperling, and B. McNutt (1988). "Transportation Energy to the Year 2000,"
from Transportation Research Board, "A Look Ahead: Year 2020" Special Report No.
W. National Research Council, Washington D.C.
HARC Center for Global Centers (February 1991). Alternative Fuels Transportation Briefs.
August, 1991.
September, 1991.
August, 1993.
June, 1993.
-----. July, 1993.
-----. August 1993.
Hanten, Howard. Ford Motor Co. representative, phone interview, April 1994.
Hu, Patricia S. and Jennifer Young (1992). Summary of Travel Trends: 1990 Nationwide Personal
Transportation Survey, Technical Report, U.S. Department of Transportation,
Washington, D.C.
Huscroft, Susan V. (1993). "Electric Vehicles: A Key Element of California's Air Quality Strategy,"
IATSS Research Vol 17 No~ 2.
J.E. Sinor Consultants, Inc. The Clean Fuels Report. September, 1993.
-----. November, 1993.
-----. April, 1994.
International Energy Agency [lEA] (1993). Electric Vehicles: Technology. Performance. and
Potential. Organisation for Economic Co-operation and Development, Paris, France.
Jones, Peter M. (1979). "Methodology for Assessing Transportation Policy Impacts,"
Transportation Research Record 723.Washington D.C.
Kahneman, Daniel (1992). "Reference POints, Anchors, Norms, and Mixed Feelings,"
Organizational Behavior and Human Decision processes, Vol 51, pp 296-312.
Kiselesich, S.J. and W.F. Hamilton (1982). "Electrification of Household Travel by Electric and
Hybrid Vehicles," SAE Technical Paper Series No. 820452, Warrendale, PA.
Kirk, Tisha (April 1994). Solectria representative, phone interview.
Knack, Ruth (October 1992). "Plug in and Commute," Planning, pp 26-27.
Kurani, Kenneth S., Thomas Turrentine, and Daniel Sperling (1994). "Electric Vehicle Owners:
Tests of Assumptions and Lessons on Future Behavior from 100 Electric Vehicle Owners
in California," Paper prepared for presentation to the Transportation Research Board,
1994 Annual Meeting.
Kurani, Kenneth S., T. Turrnetine, and D. Sperling (1994) "Demand for Electric Vehicles in Hybrid
61
Households: An Exploratory Analysis," Berkeley, CA: University of California
Transportation Center Working Paper No. 232.
Lohr, Steve (1995). "Who Uses Internet? 5.8 Million Are Said to Be Linked in U.S.," New York
Times, Sept 27, p C2.
MacKenzie, James J.and Roger C. Dower, and Donald D.T. Chen (1992). "The Going Rate: What
it Really Costs to Drive", World Resources Institute, Washington, D.C.
MacKenzie, James J. (1994). "The Keys to the Car: Electric and Hydrogen Vehicles for the 21 st
Century," World Resources Institute, Washington, D.C.
MacCready, Paul B. (1994). "Small and Electric: Vehicles with a Future," Paper prepared for
presentation to the Transportation Research Board, 1994 Annual Meeting.
Mahajan, Vijay, Eitan Muller, and Frank M. Bass (1990). "New Product Diffusion Models in
Marketing: A Review and Directions for Research," Journal of Marketing, Vol 54, pp 1-26.
Maxwell, Timothy T. and Jesse C. Jones (1995). Alternative fyels: Emissions. Economics. and
Performance. SAE, Warrendale, PA.
Natural Resource Defense Council (1993). "The Price of Mobility: Uncovering the Hidden Costs
of Transportation," Ottawa, Canada.
Nesbitt, K., K. Kurani and M. DeLuchi (1992). "Home Recharging and the Household Electric
Vehicle Market: A Near-Term Constraints Analysis," Transportation Research Record.
Organization for Economic Cooperation and Development (OECD) (1992). The Urban Electric
Vehicle: Policy Options. Technology Trends. and Market Prospects. Proceedings of an
International Conference, Stockholm, Sweden, May 25-27, 1992, Paris France.
Pearson, D.F. (1993). Urban Travel in Texas: An Overview of Travel Surveys. Texas
Transportation Institute.
Riley, Robert Q. (1994). Alternative Cars in the 21 st Century. Society of Automotive Engineers,
Inc., Warrendale, PA.
Samuelson, W. and R. Zeckhauser, (1988)."Status Quo Bias in Decision Making," Journal of Risk
and Uncertainty. Vol 1 , pp 7-59.
Science Applications International Corporation (1992). Introduction to Alternative Fuel Vehicles.
prepared for the U.S. Department of Energy.
Sperling, Daniel (1994) "Prospects for Neighborhood Electric Vehicles", Paper prepared for
presentation to the Transportation Research Board, 1994 Annual Meeting.
Sperling, Daniel (1995). Future Drive: Electric Vehicles and Sustainable Transportation. Island
Press, Washington D.C.
Turrentine, Thomas and Daniel Sperling (1992). "Theories of New Technology Purchase
62

Decisions: The Case of Alternative Fuel Vehicles," Berkeley, CA: University of California
Transportation Center Working Paper No 129.
Tversky, Amos and Daniel Kahneman (1981). "The Framing of Decisions and the Psychology of
Choice," Science. Vol 211, pp 453-458.
United States Department of Energy (USDOE) (1992). Final Report of the Interagency
Commission on Alternative Motor Fuels. DOE/EP-0002P, Washington, D.C.
United States Department of Transportation (USDOT) (1994). Bureau of Transportation Statistics.
Transportation Statistics; Annual Report 1994. Washington, D.C.
Wang, Quanlu and Mark DeLuchi (1991). "Inpacts of Electric Vehicles on Primary Energy
Consumption And Petroleum Displacement," Berkeley, CA: University of California
Transportation Center Working Paper NO.6.
63

APPENDIX A
EMISSIONS FROM HIGHWAY VEHICLES
64
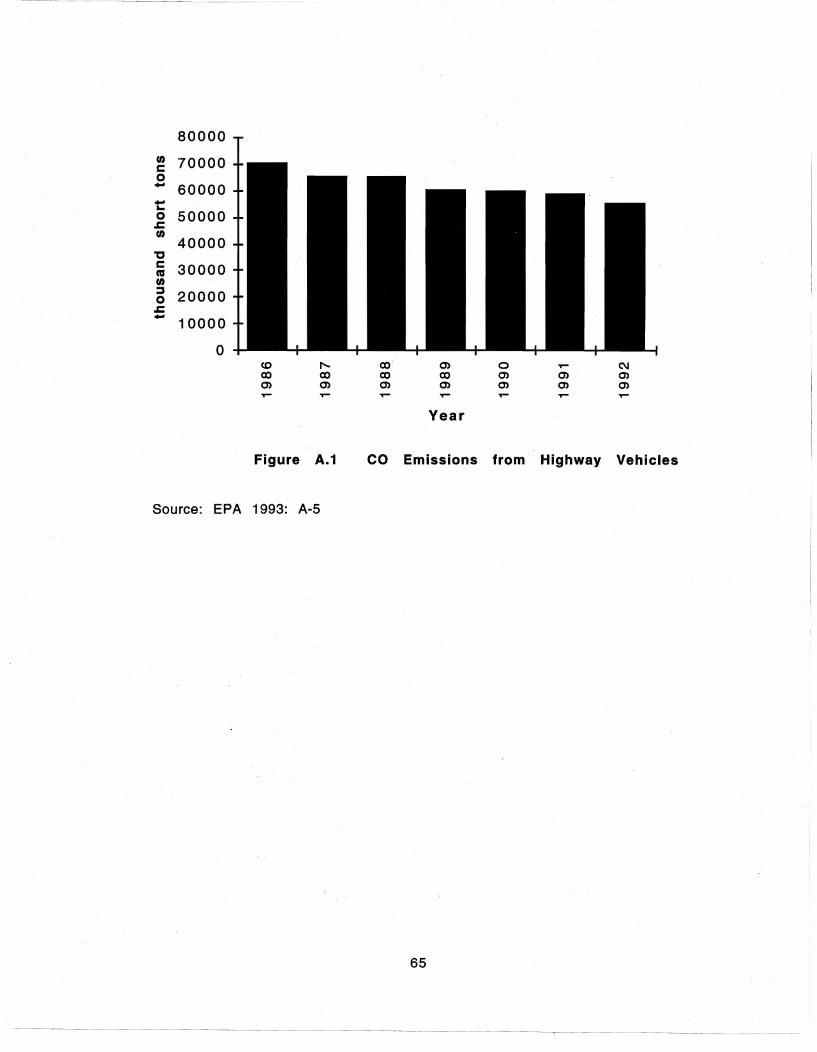
~-- ~-----
80000
In 70000 c 0 - 60000 -... 0 50000 J:: In
40000 "'C C 30000 ca In :;,
20000 0 J:: - 10000
0 co I"'- co (J) 0 T"" C\J co co co co 0) 0) (J) (J) 0) (J) (J) (J) (J) (J) T"" T"" T"" T"" ..- T""
Year
Figure A.1 CO Emissions from Highway Vehicles
Source: EPA 1993: A-5
65

8000 II) 7900 c 0 - 7800 -'"" 0 7700 .c rn
7600 "C c 7500 CIS rn ::;, 7400 0 .c - 7300
7200 co ..... co 0) 0 ...- C\I 00 co co 00 0> 0> 0> 0> 0> 0> 0) 0) 0> 0> ...- ...- ...- ...- ...- ...- ...-
Year
Figure A.2 NOx Emissions from Highway Vehicles
Source: EPA 1993: A-10
66

9000
en 8000 c: 0 7000 -- 6000 .. 0 .c 5000 en
"C 4000 c: CIS 3000 en ::::s 0 2000 .c - 1000
a co " to (J) 0 ..... (\J
to to to to m (J) m (J) m (J) m m m m ..... ..... ..... ..... ..... ..... .....
Year
Figure A.3 voe Emissions from Highway Vehicles
Source: EPA 1993: A-20
67

800
U) 700 r:: 0 - 600 -... 0 .z:. 500 U)
400 "C r:: 300 co U) ::s 200 0 .c: - 100
0 co I'-- co 0) 0 T""" C\I co co co co 0) 0) 0> 0) 0> 0) 0) 0> 0> 0)
T""" T""" T""" T""" T""" T""" T"""
Year
Figure A.4 S02 Emissions from Highway Vehicles
Source: EPA 1993: A-27
68

4000
3500
3000 I/) c 2500 0 -- 2000 ... 0 .c 1500 I/)
1000
500
0 co l"'- to 0'> 0 T""" C\I to to to to en en 0'> 0'> en 0'> 0'> en 0'> en T""" T""" T""" T""" ...... T"""
Year
Figure A.S Pb Emissions from Highway Vehicles
Source: EPA 1993: A-30
69

1600
rn 1400 c 0 - 1200 -... 0 1000 .c rn
800 "C C 600 as rn = 400 0 .c - 200
0 co "- en (J) 0 or- C\I en en en en (J) (J) (J) (J) (J) (J) (J) (J) (J) (J) or- or- or- or- or- or- or-
Year
Figure A.6 PM-10 Emissions from Highway Vehicles
Source: EPA 1993: A-32
r
70

APPENDIX B
OWNERSHIP AND OPERATING COSTS OF ELECTRIC VEHICLES AS
COMPARED TO GASOLINE-POWERED VEHICLES
71

TABLE B.1 OWNERSHIP AND OPERATING COSTS OF A
COMPACT GV (CASE 11 Ownership Costs Annual Cents/Mile Cents/Km
Depreciation $991.32 9.26 5.75
Finance $174.53 1.63 1.01
Insurance $835.41 7.80 4.85
Registration fee $58.80 0.55 0.34
Local fee $11.50 0.11 0.07
Inspection fee $10.50 0.10 0.06
Taxes:
State Vehicle Excise Tax $61.96 0.58 0.36
Total Ownership Costs $2,144.02 20.02 12.44
Operating Costs
Fuel (excluding taxes) $382.24 3.57 2.22
Maintenance $375.25 3.50 2.18
Oil $19.05 0.18 0.11
Tires $98.91 0.92 0.57
Taxes:
State:
Fuel $93.69 0.87 0.54
Maintenance $30.02 0.28 0.17
Oil $1.52 0.01 0.01
Tire $7.91 0.07 0.05
Subtotal State Taxes $133.14 1.24 0.77
Federal:
Fuel $86.19 0.80 0.50
Total Operating Costs $1,094.79 10.22 6.35
Total Owning & Operating Costs $3,238.80 30.25 18.80
72

TABLE B.2 OWNERSHIP AND OPERATING COSTS OF AN
INTERMEDIATE GV(CASE 2)
Ownership Costs Annual Cents/Mile Cents/Km
Depreciation $1,247.74 11.65 7.24
Finance $219,68 2.05 1.28
Insurance $841.14 7.86 4.88
Registration fee $58.80 0.55 0.34
Local fee $11.50 0.11 0.07
Inspection fee $10.50 0.10 0.06
Taxes:
State Vehicle Excise Tax $77.98 0.73 0.45
Total Ownership Costs $2,467.35 23.04 14.32
Operatinq Costs
Fuel (excludinq taxes) $439.76 4.11 2.55
Maintenance $400.30 3.74 2.32
Oil $19.05 0.18 0.11
Tires $114.34 1.07 0.66
Taxes:
State:
Fuel $107.78 1.01 0.63
Maintenance $32.02 0.30 0.19
Oil $1.52 0.01 0.01
Tire $9.15 0.09 0.05
Subtotal State Taxes $150.48 1.41 0.87
Federal:
Fuel $99.16 0.93 0.58
Total Operating Costs $1,223.09 11.42 7.10
Total Owning & Operating Costs $3,690.44 34.46 21.42
73

TABLE B.3 OWNERSHIP AND OPERATING COSTS OF A
COMPACT EV
(CASE 1A)
Ownership Costs Annual Cents/Mile Cents/Km
Depreciation $2 079.53 19.42 12.07
Finance $366.12 3.42 2.12
Insurance $835.41 7.80 4.85
Registration fee $58.80 0.55 0.34
Local fee $11.50 0.11 0.07
Inspection fee $10.50 0.10 0.06
Taxes:
State Vehicle Excise Tax $61.96 0.58 0.36
Total Ownership Costs $3 423.81 31.97 19.87
Operating Costs
Fuel (excludina taxes) $286.68 2.68 1.66
Maintenance $281.44 2.63 1.63
Oil $0.00 0.00 0.00
Tires $98.91 0.92 0.57
Taxes:
State:
Fuel $70.26 0.66 0.41
Maintenance $22.52 0.21 0.13
Oil $0.00 0.00 0.00
Tire $7.91 0.07 0.05
Subtotal State Taxes $100.69 0.94 0.58
Federal:
Fuel $64.65 0.60 0.38
Total Operating Costs $832.36 8.71 5.42
Total Owninq & Operatina Costs $4,256.18 40.69 25.29
74
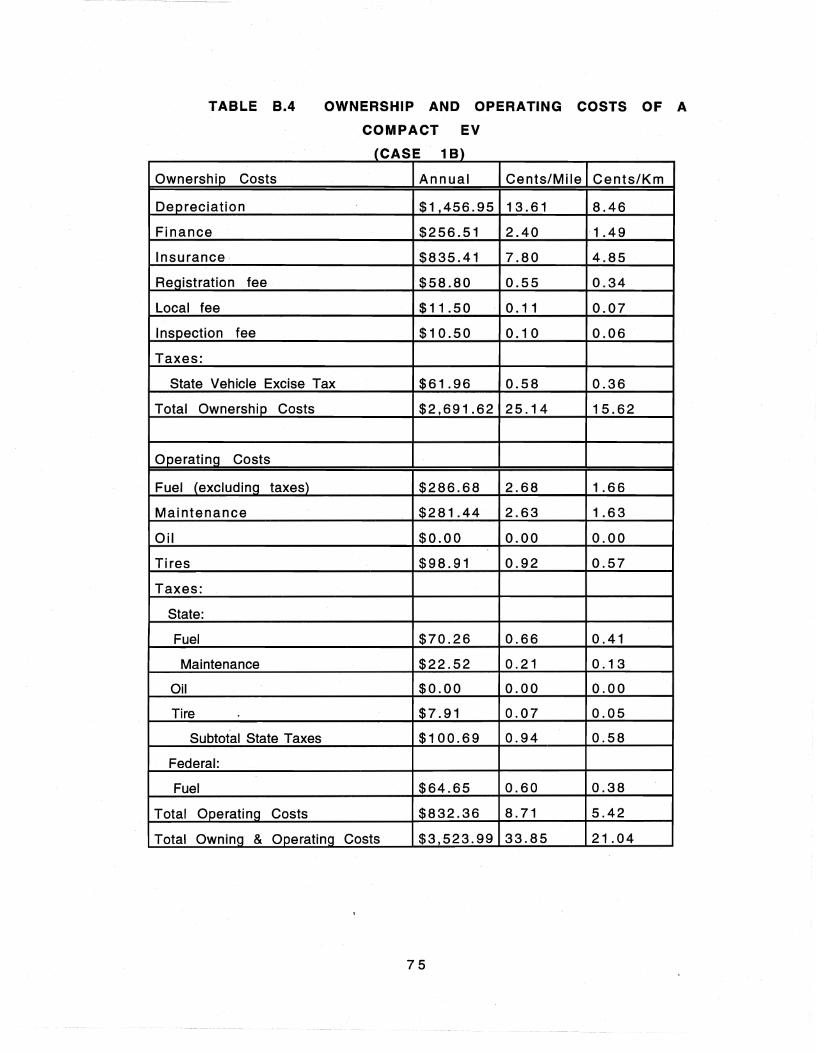
TABLE B.4 OWNERSHIP AND OPERATING COSTS OF A
COMPACT EV
(CASE 1 B)
Ownership Costs Annual Cents/Mile Cents/Km
Depreciation $1,456.95 13.61 8.46
Finance $256.51 2.40 1.49
Insurance· $835.41 7.80 4.85
Registration fee $58.80 0.55 0.34
Local fee $11.50 0.11 0.07
Inspection fee $10.50 0.10 0.06
Taxes:
State Vehicle Excise Tax $61.96 0.58 0.36
Total Ownership Costs $2,691.62 25.14 15.62
Operating Costs
Fuel (excluding taxes) $286.68 2.68 1.66
Maintenance $281.44 2.63 1.63
Oil $0.00 0.00 0.00
Tires $98.91 0.92 0.57
Taxes:
State:
Fuel $70.26 0.66 0.41
Maintenance $22.52 0.21 0.13
Oil $0.00 0.00 0.00
Tire $7.91 0.07 0.05
Subtotal State Taxes $100.69 0.94 0.58
Federal:
Fuel $64.65 0.60 0.38
Total Operating Costs $832.36 8.71 5.42
Total Owning & Operating Costs $3 523.99 33.85 21.04
75

TABLE B.S OWNERSHIP AND OPERATING COSTS OF AN
INTERMEDIATE EV (CASE 2A)
Ownership Costs Annual Cents/Mile Cents/Km
Depreciation $2,505.95 23.40 14.54
Finance $441.20 4.12 2.56
Insurance $835.41 7.80 4.85
ReQistration fee $58.80 0.55 0.34
Local fee $11.50 0.11 0.07
Inspection fee $10.50 0.10 0.06
Taxes:
State Vehicle Excise Tax $77.98 0.73 0.45
Total Ownership Costs $3,941.35 36.81 22.88
O~eratinq Costs
Fuel (excludinQ taxes) $329.82 3.08 1.91
Maintenance $300.23 2.80 1. 74
Oil $0.00 0.00 0.00
Tires $98.91 0.92 0.57
Taxes:
State:
Fuel $80.84 0.75 0.47
Maintenance $24.02 0.22 0.14
Oil $0.00 0.00 0.00
Tire $7.91 0.07 0.05
Subtotal State Taxes $112.77 1.05 0.65
Federal:
Fuel $74.37 0.69 0.43
Total Operating Costs $916.09 9.61 5.97
Total OwninQ & OperatinQ Costs $4,857.44 46.41 28.85
76

TABLE B.6 OWNERSHIP AND OPERATING COSTS OF AN
INTERMEDIATE EV (CASE 2B)
Ownership Costs Annual Cents/Mile Cents/Km
Depreciation $1,783.39 16.65 10.35
Finance $313.98 2.93 1.82
Insurance $835.41 7.80 4.85
Registration fee $58.80 0.55 0.34
Local fee $11.50 0.11 0.07
Inspection fee $10.50 0.10 0.06
Taxes:
State Vehicle Excise Tax $77.98 0.73 0.45
Total Ownership Costs $3,091.57 28.87 17.94
O~eratinq Costs
Fuel (excludinq taxes) $329.82 3.08 1. 91
Maintenance $300.23 2.80 1.74
Oil $0.00 0.00 0.00
Tires $98.91 0.92 0.57
Taxes:
State:
Fuel $80.84 0.75 0.47
Maintenance $24.02 0.22 0.14
Oil $0.00 0.00 0.00
Tire $7.91 0.07 0.05
Subtotal State Taxes $112.77 1.05 0.65
Federal:
Fuel $74.37 0.69 0.43
Total Operatinq Costs $916.09 9.61 5.97
Total Owninq & Operating Costs $4,007.66 38.48 23.91
77