electric vehicle charger placement optimization in
TRANSCRIPT
i
Prepared by:
Michigan State University
Principal Investigator:
Dr. Mehrnaz Ghamami
Assistant Professor
Civil and Environmental Engineering
428 S. Shaw Lane, East Lansing, MI 48824
Phone: (517) 355-1288, Fax: (517) 432-1827
Email: [email protected]
March 7, 2020
Prepared for:
Michigan Department of Environment, Great Lakes, and Energy (EGLE)
Constitution Hall
525 West Allegan Street
P.O. Box 30473
Lansing, MI 48909-7973
Electric Vehicle Charger Placement Optimization in
Michigan: Phase II - Urban

ii
Authors
Dr. Mehrnaz Ghamami (PI)
Assistant Professor 0F
1
Phone: (517) 355-1288, Fax: (517) 432-1827
Email: [email protected]
Dr. Ali Zockaie (Co-PI)1
Assistant Professor
Phone: (517) 355-8422, Fax: (517) 432-1827
Email : [email protected]
Dr. Steven Miller (Co-PI)1F
2
Director of Center for Economic Analysis
Phone: (517) 355-2153
Email: [email protected]
Mohammadreza Kavianipour1
Doctoral Researcher
Email: [email protected]
Fatemeh Fakhrmoosavi1
Doctoral Researcher
Email: [email protected]
Harprinderjot Singh1
Doctoral Researcher
Email: [email protected]
Farish Jazlan1
Doctoral Researcher
Email: [email protected]
MohammadHossein Shojaei1
Doctoral Researcher
Email: [email protected]
1 Department of Civil and Environmental Engineering, Michigan State University, 428 S. Shaw Lane,
East Lansing, MI 48824 2 Department of Agricultural, Food, and Resource Economics, Michigan State University, Morrill Hall of
Agriculture, 446 W Circle Dr Room 88, East Lansing, MI 48824 U.S.

iii
ACKNOWLEDGMENTS
The Michigan State University researchers would like to acknowledge the Michigan
Department of Environment, Great Lakes, and Energy (EGLE) for sponsoring this research,
understanding the timeliness of the topic, and supporting this unique approach to allocating electric
vehicle charging infrastructure. We are grateful to the EGLE team for arranging stakeholder
meetings that enabled the team to obtain the necessary information for the analysis. Lastly, but not
least, we thank the many stakeholders listed below for their engagement, willingness to share data
and insights, and their valued partnership.
EGLE
▪ Robert Jackson
▪ Lisa Thomas
Michigan Department of Transportation
Auto Companies
▪ Ford Motor Company
▪ General Motors
▪ Toyota
Transmission and Utility Companies
▪ American Transmission Company
▪ Cherryland Electric Cooperative
▪ Consumers Energy
▪ DTE Energy
▪ Great Lakes Energy Cooperative
▪ Indiana Michigan Power
▪ ITC Transmission Company
▪ Lansing Board of Water and Light
▪ Michigan Electric Cooperative
Association
▪ Michigan Municipal Electric Association
▪ Wolverine Power Cooperative
Charging Station Companies
▪ ChargePoint
▪ Greenlots
Cities and Communities
▪ City of Ann Arbor and Ecology Center
▪ City of Grand Rapids
▪ City of East Lansing
▪ City of Marquette
▪ City of Kalamazoo
National Organizations
▪ Electrify America
▪ National Association of State Energy
Officials
Electric Vehicle Drivers & Owners
This work was supported by the Department of Energy and Energy Services under Award
Number EE008653.
iv
Table of Contents
Executive Summary ................................................................................................................... viii
Introduction ................................................................................................................................... 1
Problem Statement ........................................................................................................................ 2
Literature Review ......................................................................................................................... 2
Methodology .................................................................................................................................. 4
Traffic Simulation ....................................................................................................................... 6
State of Charge Simulator ........................................................................................................... 8
Optimization Model .................................................................................................................. 10
Solution Approach ......................................................................................................................11
Regression Models .................................................................................................................... 12
City Selection ............................................................................................................................... 14
Data Collection ............................................................................................................................ 15
Michigan Road Network and Origin-Destination Travel Demand ........................................... 15
Land Use Information ............................................................................................................... 16
Charging Station and Charger Costs ......................................................................................... 16
Site Acquisition Costs ............................................................................................................ 16
Utility Provision Costs........................................................................................................... 16
Vehicle and User Characteristics ............................................................................................... 17
Battery Range and Performance Variation ............................................................................ 17
Electric Vehicle Market Share ............................................................................................... 17
Scenarios ................................................................................................................................... 18
Results and Discussion ................................................................................................................ 18
Results of the Optimization Model for Charging Station Placement and Charger Counts for
Major Urban Areas .................................................................................................................... 19
City of Marquette................................................................................................................... 19
City of Muskegon .................................................................................................................. 22
City of Ann Arbor .................................................................................................................. 24
City of Kalamazoo ................................................................................................................. 27
City of Flint ........................................................................................................................... 29
v
City of Saginaw ..................................................................................................................... 32
City of Lansing ...................................................................................................................... 34
City of Grand Rapids ............................................................................................................. 37
City of Detroit ........................................................................................................................ 39
Regression Models and Results for Charging Station and Charger Counts for Smaller Urban
Areas.......................................................................................................................................... 42
Conclusion ................................................................................................................................... 45
References .................................................................................................................................... 46
Appendix A- City of Ann Arbor with External Demand ......................................................... 51
Appendix B- Charging Station Location and Number in each Urban Area ......................... 54
List of Tables Table 1. Summary of the findings for different urban areas and different scenarios, sorted by travel
demand ......................................................................................................................................... viii
Table 2. Initial state of charge of vehicles departing before 12 PM for different land uses ......... 10
Table 3. Model variable descriptions and definitions ................................................................... 10
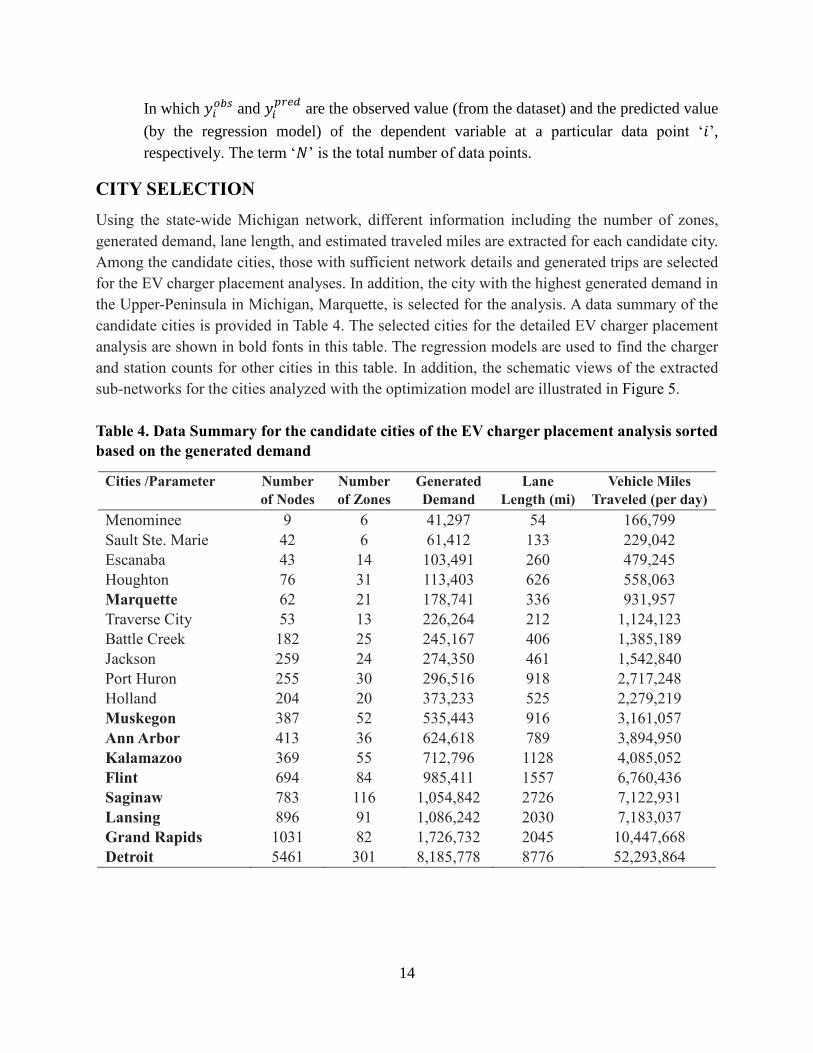
Table 4. Data Summary for the candidate cities of the EV charger placement analysis sorted based
on the generated demand .............................................................................................................. 14
Table 5. Specifications of the considered scenarios for the target year of 2030 ........................... 18
Table 6. Scenario results for the city of Marquette: charging stations, chargers, required investment,
and charge time ............................................................................................................................. 19
Table 7. Scenario results for the city of Muskegon: charging stations, chargers, required
investment, and charge time.......................................................................................................... 22
Table 8. Scenario results for the city of Ann Arbor: charging stations, chargers, required
investment, and charge time.......................................................................................................... 24
Table 9. Scenario results for the city of Kalamazoo: charging stations, chargers, required
investment, and charge time.......................................................................................................... 27
Table 10. Scenario results for the city of Flint: charging stations, chargers, required investment,
and charge time ............................................................................................................................. 29
Table 11. Scenario results for the city of Saginaw: charging stations, chargers, required investment,
and charge time ............................................................................................................................. 32
Table 12. Scenario results for the city of Lansing: charging stations, chargers, required investment,
and charge time ............................................................................................................................. 34
Table 13. Scenario results for the city of Grand Rapids: charging stations, chargers, required
investment, and charge time.......................................................................................................... 37
vi
Table 14. Scenario results for the city of Detroit: charging stations, chargers, required investment,
and charge time ............................................................................................................................. 39
Table 15. The regression models dataset ...................................................................................... 42
Table 16. Regression model characteristics for the number of charging stations ......................... 43
Table 17. Regression model characteristics for the number of chargers ...................................... 43
Table 18. Estimated values from the optimization model and the regression model ................... 43
Table 19. Number of charging stations and chargers for small urban areas of Michigan based on
the results of the regression models .............................................................................................. 44
Table 20. Scenario results for the city of Ann Arbor with external demand: charging stations,
chargers, required investment, and charge time ............................................................................ 51
List of Figures Figure 1. General research framework............................................................................................ 6
Figure 2. State-wide Michigan network.......................................................................................... 7
Figure 3. Simulation results (vehicles distributed in the network) for the Detroit metropolitan area
......................................................................................................................................................... 8
Figure 4. Person trips by start time (hour) and trip purpose (Wilaby and Casas, 2016) ................. 9
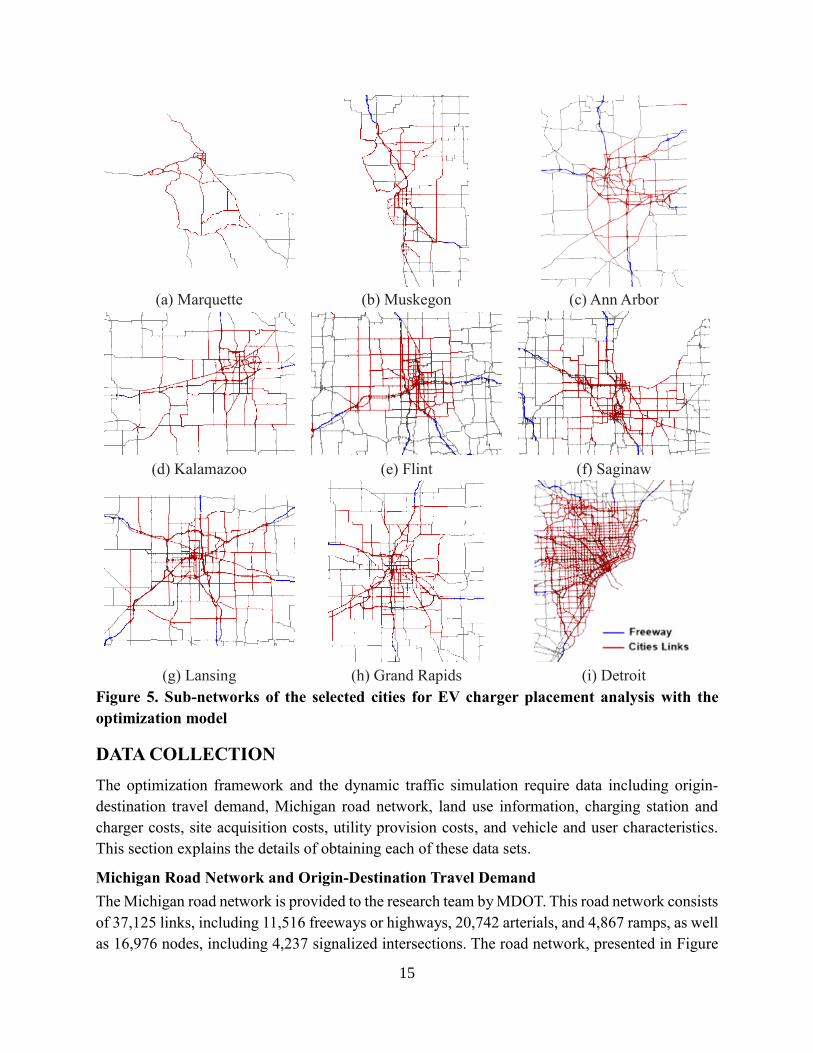
Figure 5. Sub-networks of the selected cities for EV charger placement analysis with the
optimization model ....................................................................................................................... 15
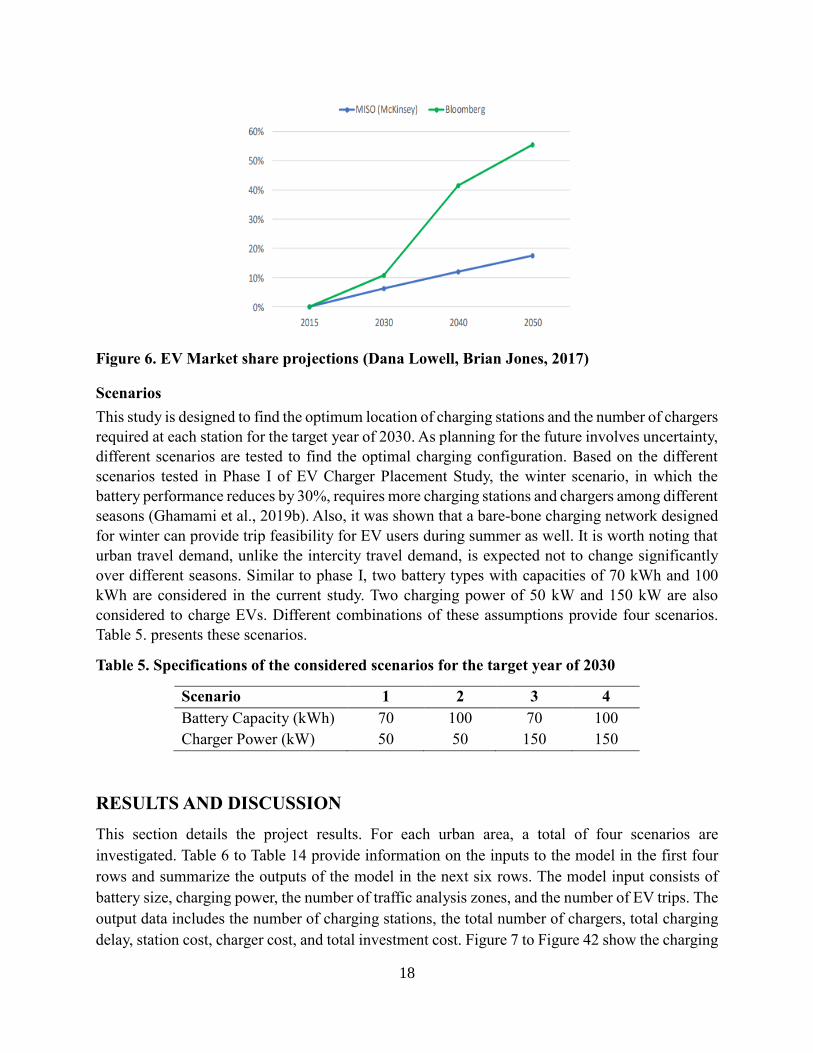
Figure 6. EV Market share projections (Dana Lowell, Brian Jones, 2017) .................................. 18
Figure 7. 70 kWh battery-50 kW charger configuration for the city of Marquette ...................... 20
Figure 8. 100 kWh battery-50 kW charger configuration for the city of Marquette .................... 20
Figure 9. 70 kWh battery-150 kW charger configuration for the city of Marquette .................... 21
Figure 10. 100 kWh battery-150 kW charger configuration for city of Marquette ...................... 21
Figure 11. 70 kWh battery-50 kW charger configuration for the city of Muskegon .................... 22
Figure 12. 100 kWh battery-50 kW charger configuration for the city of Muskegon .................. 23
Figure 13. 70 kWh battery-150 kW charger configuration for the city of Muskegon .................. 23
Figure 14. 100 kWh battery-150 kW charger configuration for the city of Muskegon ................ 24
Figure 15. 70 kWh battery-50 kW charger configuration for the city of Ann Arbor .................... 25
Figure 16. 100 kWh battery-50 kW charger configuration for the city of Ann Arbor .................. 25
Figure 17. 70 kWh battery-150 kW charger configuration for the city of Ann Arbor .................. 26
Figure 18. 100 kWh battery-150 kW charger configuration for the city of Ann Arbor ................ 26
Figure 19. 70 kWh battery-50 kW charger configuration for the city of Kalamazoo ................... 27
Figure 20. 100 kWh battery-50 kW charger configuration for the city of Kalamazoo ................. 28
Figure 21. 70 kWh battery-150 kW charger configuration for the city of Kalamazoo ................. 28
Figure 22. 100 kWh battery-150 kW charger configuration for the city of Kalamazoo ............... 29
Figure 23. 70 kWh battery-50 kW charger configuration for the city of Flint ............................. 30
Figure 24. 100 kWh battery-50 kW charger configuration for the city of Flint ........................... 30
vii
Figure 25. 70 kWh battery-150 kW charger configuration for the city of Flint ........................... 31
Figure 26. 100 kWh battery-150 kW charger configuration for the city of Flint ......................... 31
Figure 27. 70 kWh battery-50 kW charger configuration for the city of Saginaw ....................... 32
Figure 28. 100 kWh battery-50 kW charger configuration for the city of Saginaw ..................... 33
Figure 29. 70 kWh battery-150 kW charger configuration for the city of Saginaw ..................... 33
Figure 30. 100 kWh battery-150 kW charger configuration for the city of Saginaw ................... 34
Figure 31. 70 kWh battery-50 kW charger configuration for the city of Lansing ........................ 35
Figure 32. 100 kWh battery-50 kW charger configuration for the city of Lansing ...................... 35
Figure 33. 70 kWh battery-150 kW charger configuration for the city of Lansing ...................... 36
Figure 34. 100 kWh battery-150 kW charger configuration for the city of Lansing .................... 36
Figure 35. 70 kWh battery-50 kW charger configuration for the city of Grand Rapids ............... 37
Figure 36. 100 kWh battery-50 kW charger configuration for the city of Grand Rapids ............. 38
Figure 37. 70 kWh battery-150 kW charger configuration for the city of Grand Rapids ............. 38
Figure 38. 100 kWh battery-150 kW charger configuration for the city of Grand Rapids ........... 39
Figure 39. 70 kWh battery-50 kW charger configuration for the city of Detroit ......................... 40
Figure 40. 100 kWh battery-50 kW charger configuration for the city of Detroit ....................... 40
Figure 41. 70 kWh battery-150 kW charger configuration for the city of Detroit ....................... 41
Figure 42. 100 kWh battery-150 kW charger configuration for the city of Detroit...................... 41
Figure 43. 70 kWh battery-50 kW charger configuration for the city of Ann Arbor with external
demand .......................................................................................................................................... 51
Figure 44. 100 kWh battery-50 kW charger configuration for the city of Ann Arbor with external
demand .......................................................................................................................................... 52
Figure 45. 70 kWh battery-150 kW charger configuration for the city of Ann Arbor with external
demand .......................................................................................................................................... 52
Figure 46. 100 kWh battery-150 kW charger configuration for the city of Ann Arbor with external
demand .......................................................................................................................................... 53
viii
EXECUTIVE SUMMARY The primary purpose of this report is help local units of government develop a plan to support the
use of plug-in electric vehicles (EV), and develop policies and strategies that support investment
into public charging infrastructure. Michigan Department of Environment, Great Lakes, and
Energy (EGLE) has funded the development of a comprehensive approach, including analytical
models considering applied constraints, to find the optimum investment scenario for each urban
area and has supported it through a series of stakeholders’ meetings. Researchers at Michigan State
University led this effort by developing and executing the modeling framework.
This study builds on a previous study conducted by the same research team at Michigan
State University supported by EGLE (former MI Energy office) which located DC fast chargers
across the state of Michigan supporting long-distance (highway) trips of EVs in 2030. During the
highway study it became evident that there is a need for a framework to optimaly locate charging
infrastructure in urban areas. This report presents the study approach and results of the
optimization model for locating DC fast chargers in different urban areas in Michigan for the urban
trips of EV users in the state by the year 2030. Note that level 2 chargers are not the focus of this
study, however, the impact of these chargers, located at shopping centers or work places, is
considered in the state of charge estimator function, as an input to the optimization framework.
The results for major urban areas in Michigan are presented in more detail, while the results for
smaller urban areas are presented in a more aggregate manner, depending on the availability of
data for these urban areas.
Through a series of stakeholder meetings, different scenarios with different battery and
charger technologies were suggested and investigated for this study. The suggested battery energy
levels are 70 kWh and 100 kWh, and power levels of 50 kW and 150 kW are considered for
chargers. Also, the winter scenario is selected for this study, as the number of urban trips is known
to remain relatively constant seasonally, while the reduced battery performance during the cold
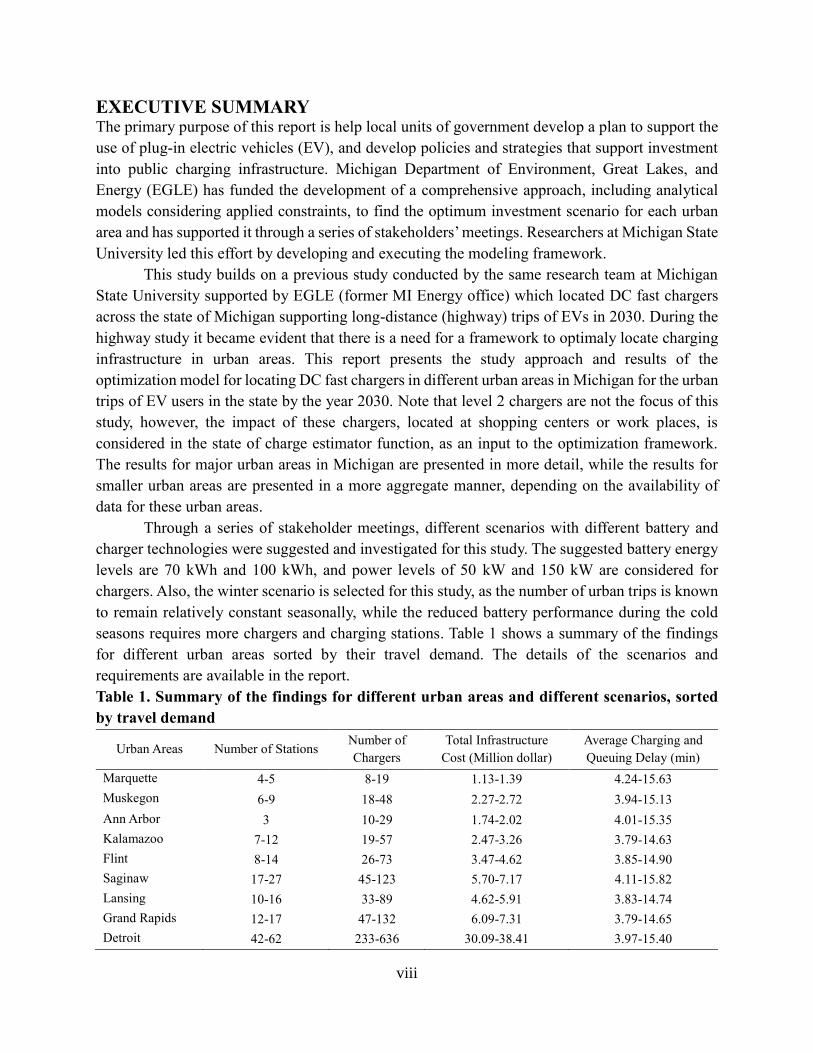
seasons requires more chargers and charging stations. Table 1 shows a summary of the findings
for different urban areas sorted by their travel demand. The details of the scenarios and
requirements are available in the report.
Table 1. Summary of the findings for different urban areas and different scenarios, sorted
by travel demand
Urban Areas Number of Stations Number of
Chargers
Total Infrastructure
Cost (Million dollar)
Average Charging and
Queuing Delay (min)
Marquette 4-5 8-19 1.13-1.39 4.24-15.63
Muskegon 6-9 18-48 2.27-2.72 3.94-15.13
Ann Arbor 3 10-29 1.74-2.02 4.01-15.35
Kalamazoo 7-12 19-57 2.47-3.26 3.79-14.63
Flint 8-14 26-73 3.47-4.62 3.85-14.90
Saginaw 17-27 45-123 5.70-7.17 4.11-15.82
Lansing 10-16 33-89 4.62-5.91 3.83-14.74
Grand Rapids 12-17 47-132 6.09-7.31 3.79-14.65
Detroit 42-62 233-636 30.09-38.41 3.97-15.40

ix
This study suggests a list of locations for charging stations and the number of chargers at each
location, with an approximate cost of building such network for major urban areas in the state of
Michigan. The tables and figures of these results are available in the results section, as well as the
appendices. For smaller urban areas in Michigan the minimum number of chargers and charging
stations is suggested in this report for each urban area. The major findings of this study are listed
below:
1. Even though the battery size (driving range) is one of the main decisive factors in EV
infrastructure configuration to support the intercity trips of EV users. The battery size is not a
significant factor in electric vehicles charger placement to support the urban trips of EV users.
This is due to the shorter distance of the trips in urban areas, compared to that of the intercity
trips.
2. Increasing the power of chargers provides stations with a higher throughput and thus less
number of chargers (and charging stations) are required to support the urban trips of EV users.
3. It is less costly to build a network of 150 kW chargers than 50 kW chargers. Building these
chargers also reduces the charging and waiting time. However, if the vehicles cannot accept
the 150-kW power level, longer delays would be experienced, while all the trips still would
remain feasible.
4. The total length of the roadways, vehicle miles traveled, and number of daily trips generated
are the main factors affecting the number of charging stations. This demonstrates the fact that
the travel demand, including the distance traveled, and the size of the city are factors that affect
the number of charging stations required for urban areas.
5. The factors affecting the number of chargers include the number of daily generated trips and
the total length of the roadways. It is worth noting that most of the smaller cities require less
than two chargers per station to serve the EV demand, however, for redundancy purposes at
least two chargers per station are recommended.
6. The suggested numbers and locations are based on a predicted 6 percent market penetration
rate in 2030. It is suggested that the city planners start building the network of charging stations
in increments and track the utilization rate at each location before proceeding with full
deployment. Detailed analysis for the annual increments can be done for each urban area per
request.
An optimization-based modeling framework is designed and proposed in this study to find the
location of charging stations and number of chargers for the major urban areas in the state of
Michigan, listed as: Muskegon, Ann Arbor, Kalamazoo, Flint, Saginaw, Lansing, Grand Rapids,
and Detroit. As all of the major urban areas are located in lower peninsula, for equity purposes,
Marquette, the largest city in the upper peninsula is added to the list for detailed analysis.
Aggregate level regression models are developed to find the number of charging stations and
chargers in the smaller cities, with limited data availability, such as: Menominee, Sault Ste. Marie,
Escanaba, Houghton, Traverse City, Battle Creek, Jackson, Port Huron, and Holland. The models
proposed in this study can be used for other cities based-on availability of data as the need arises.
1
INTRODUCTION
There is an increasing pattern in the adoption of electric vehicles during the past few years.
However, the rate of this increase varies among different states. This rate is significant for
Michigan, but still it is smaller than the U.S. average (Atlas EV Hub, 2018). This increasing
pattern, among other factors, is due to energy efficiency and low emission production of Electric
Vehicles (EVs) (Eberhard and Tarpenning, 2006; Philippe Crist, 2012). The market share of
alternative fuel vehicles, such as EVs is affected by a variety of factors, including but not limited
to fuel cost, purchase price, and demographics (Eppstein et al., 2011; Lin et al., 2014; Lin and
Greene, 2010, 2011; NRC, 2013; Shafiei et al., 2012). However, recent studies have revealed that
a dense network of charging stations is the most important factor leading to an increase in the
adoption of EVs (Nie et al., 2016).
Due to the limited range of EVs, refueling stations have been vastly studied to support the
long-distance (intercity) trips of these vehicles (Ghamami et al., 2016, 2019a; Nie and Ghamami,
2013). Since the average length of daily trips of EV users is less than the average driving range of
an electric vehicle on a single charge, the urban trips of EV users have attracted less attention. It
is worth noting that by the increasing market share of EVs, not all EV owners are going to have
access to a home charger or a charger at workplace, and many users (depending on their arrival
and departure time) are not going to have enough time to fully charge their car batteries. Thus,
there is an increasing need for Direct Current (DC) fast charging stations to support the urban trips
of EV users.
The Michigan Department of Environment, Great Lakes, and Energy (EGLE) initiated the
investment in an analytical approach to find the optimum location of chargers for the urban trips
of the EV users. This study aims to introduce a framework for urban charging planning. This
approach considers the urban trips of EV users, electric grid infrastructure, and costs associated
with building a network of charging stations to find the optimum investment strategy, while
ensuring the feasibility of urban trips for EVs in Michigan.
EGLE facilitated a series of stakeholder meetings with Metropolitan Planning
Organizations, communities, utility companies, charging station companies, the automotive
industry, and the State of Michigan departments. These meetings enabled the data collection
process and refinement of the assumptions for the analytical approach. The analytical approach
proposed in this study is unique to the best knowledge of the research team. This approach includes
simulating the trips of EV drivers, using the data from travel surveys and planning models, and
incorporating the simulated trips of EV drivers in the optimization framework to find the best
investment strategy.
For the remainder of this report, the problem statement, literature review, methodology
including the modeling framework, and the solution approach are presented, which are followed
by the city selection procedure and data requirements for each city. Finally, the results for each
urban area are presented.
2
PROBLEM STATEMENT
This study aim to provide a guide for palnning urban charging infrastructure. The length of daily
urban trips is usually smaller than the average driving range (on a fully charged battery) of an EV.
However, not all EVs start their trip fully charged. EV users might not have access to chargers at
home or workplaces or they might forget to plug-in their cars. Furthermore, depending on arrival
and departure time, EVs might not get fully charged overnight using a level II charger. More
importantly, in order to alleviate the EV users’ range anxiety and reduce the uncertainty in EV
trips, there is an immediate need for DC fast chargers (level 3 chargers) in urban areas. This study
seeks to find the optimum location of charging stations and the number of chargers for urban trips
of EV users in the state of Michigan. Note that level 2 chargers are not the focus of this study,
however, the impact of these chargers, located at shopping centers or work places, is considered
in the state of charge estimator function, which is elaborated in the following sections. The trips
of users are modeled using a dynamic traffic simulation tool, and the charging behavior and the
state of charge of the users are tracked within the modeling framework. The main aim of this study
is to aid city planners to ensure that the urban trips of EV users are feasible throughout the state,
while minimizing the system cost. This cost consists of infrastructure investment cost, including
charging station and charger costs, and the experienced delay by users, including detour, charging,
and waiting time in queues. It is also recommended that the city planners build the network
gradually and track and compare utilitization rate and energy consumption level at fully functional
stations and chargers. This phase of the project seeks to answer the following questions:
- Where to deploy charging stations in urban areas of Michigan to support the EV travels
in 2030?
- How many chargers should be provided at each charging station?
- What is the cost associated with building the required infrastructure for each urban area?
- What is the expected delay for the considered scenarios in major urban areas?
LITERATURE REVIEW
Increasing vehicle miles traveled (VMT), and the associated emissions have all led the car industry
toward EVs (Dong et al., 2014; He et al., 2013). EVs remove the on-road emission, and if
accompanied by green energy initiatives, they can mitigate air pollution significantly. Limited
range, insufficient supporting infrastructure, and long charging times have hindered the acceptance
of the EVs in the market (He et al., 2013; Nie and Ghamami, 2013). Although some current EV
models can exceed the range of 300 miles per charge, most of the EVs still barely can be compared
with conventional vehicles (CV) in terms of the driving range. It is worth noting that battery
performance of EVs decreases in cold weather, which further reduces the range of EVs (Krisher,
2019). To increase the adoption of EVs, providing enough supporting infrastructure is the key
factor (Nie et al., 2016).
Many data-driven studies have investigated the location of charging infrastructure for EVs.
Based on the travel surveys data, conducted by Metropolitan Travel Survey Archive, a framework
3
is available to locate charging stations using each trip endpoint, distance, purpose, starting time,
and ending time (Andrews et al., 2012). In another study, Dong et al. (2014) used travel data of
275 households and minimized the number of trips not being fulfilled by electricity as the source
of energy, using an activity-based model. Another study uses trajectory data of taxis in Beijing to
identify hotspots, which are defined as candidates to be equipped with charging stations (Cai et
al., 2014). This study is then extended by proposing an optimization model to select among the
hotspots to maximize the VMT on electricity (Shahraki et al., 2015). Taxi GPS data is also used to
develop an optimization model for the location of charging stations using spatial-temporal demand
coverage data (Tu et al., 2016). Another study, using taxi trajectories, minimizes the infrastructure
investment cost considering the congestion at charging stations (Yang et al., 2017). In another
approach, using the average national data, an optimization model is developed minimizing the
infrastructure cost, while serving the EV charging demand in workplaces (Huang and Zhou, 2015).
The above-mentioned models can be applied to fleet vehicle (i.e. taxis or buses), but are not
suitable for private EVs due to the limited availability of GPS data.
Therefore, based on the origin-destination (OD) demand models, the travel behavior can
be modeled and used to allocate charging infrastructure. A group of studies considers the travel
pattern independent of charging infrastructure, and as a function of traffic assignment (Berman et
al., 1992; Hodgson, 1990; Kuby and Lim, 2007, 2005; Lim and Kuby, 2010; Upchurch et al., 2009;
Zockaie et al., 2016). There are also other studies accounting for the impact of desired facilities on
the traffic assignment (Bai et al., 2011; Hajibabai et al., 2014; He et al., 2013, 2018; Huang et al.,
2015; Riemann et al., 2015). However, in large scale networks that have thousands of links and
nodes, the problem becomes computationally demanding. Therefore, researchers favor the fixed
travel patterns in large scale networks.
Urban trips of EV users have been less of an interest to researchers due to their limited
travel distances. However, the importance of these studies has become more evident over the years
(Baouche et al., 2014; Cavadas et al., 2015). There is a variety of approaches for serving the urban
trips of EV users. In one approach, the trips of EV users are modeled based on travel surveys
(Baouche et al., 2014). In another approach, the charging stations can be located based on the
activities (Kang and Recker, 2009; Nie et al., 2016).
To find the optimal location of charging facilities, different objectives have been
investigated. Minimizing only the investment cost (Li et al., 2016; Mak et al., 2013; Mirhassani
and Ebrazi, 2013; Yang et al., 2017) or minimizing the number of charging stations (He et al.,
2016) will not provide the optimum solution; as the delay to access chargers may increase
significantly due to the limited infrastructure availability. Minimizing only the access time
(Nicholas et al., 2004) or minimizing only travel time in urban areas (He et al., 2015) may also
cause budgetary concerns. However, minimizing the system cost (Chen et al., 2017; Ghamami et
al., 2019a; Hajibabai et al., 2014; Nourbakhsh and Ouyang, 2010; Zhu et al., 2018) can make a
balance between cost of charging infrastructure and monetary cost of users’ delay. Therefore, the
required infrastructure would be determined based on infrastructure investment, while keeping the
EV trips feasible and users’ delay reasonable.
4
This study aims to introduce a framework for urban charging planning. Urban networks
usually include many nodes and links, which can make the traffic assignment computationally
demanding. Therefore, using a dynamic traffic assignment framework and the origin-destination
demand, the trajectories for all trips are extracted. Using the large-scale traffic simulation results
the charging behaviors of EV users are investigated. Vehicle trajectories in need of charge, which
are identified based on the initial state of charge and the required energy to complete their trips,
are considered as inputs to the optimization model. This model seeks a charging station
configuration to serve the trips of EV users. Thus, the main contribution of this study is to ensure
feasibility of simulated EV trips considering the impacts of queuing and detours on the location of
charging stations and the number of chargers required at each station.
METHODOLOGY
The first step to the modeling and solution framework proposed in this study is data collection.
The data required for this study includes origin-destination travel demand (OD demand), road
network information, land use information, land cost, electricity provision cost, and charging
station and charger costs and specifications. Users’ trips are then simulated using a dynamic traffic
simulation tool. The main inputs to the simulation are OD demand and road network information.
The main outputs of the traffic simulation are trip trajectories and the dynamic skims including
travel times and distances for every OD-pair and all departure time intervals. Unlike the intercity
trips, which are well-planned and start with fully charged batteries, the urban trips are not usually
well-planned, and users might start with any state of charge. Therefore, a state of charge simulator
is developed, which works based on the trip purpose, and land use at the trip origin. This simulator
determines the initial state of charge for each trip trajectory. Then, all the above-mentioned
information is used as inputs to the optimization model.
The modeling framework proposed in this study considers the limited range of EVs and
ensures that every EV trip is feasible by providing supporting charging infrastructure, while
minimizing the total cost of charging infrastructures and the monetary value of total delay
experienced by EV users. The model differentiates between different candidate locations that can
be equipped with charging stations based on land acquisition cost and electricity provision cost at
each location. The constraints considered in this model include flow conservation equations,
charging station allocation, tracking the state of fuel, trip feasibility, and charging and queuing
delay in stations.
The problem is formulated as a mixed-integer programming with nonlinear constraints,
which is known to be NP-hard. As the commercial solvers cannot solve such problems, it is
decomposed into two sub-problems. The first sub-problem locates the charging stations and
assigns EVs to them by minimizing the charging station cost and the monetary value of detour and
charging time experienced by EVs. The second sub-problem finds the optimum number of chargers
required at each of the selected charging stations while minimizing the charger cost and users’
waiting delay. The vehicles assigned to charging stations are the output of the first sub-problem
and the input to the second sub-problem.
The first sub-problem is solved using a commercial solver, CPLEX, in the AMPL platform.
5
This model can solve the problem efficiently for small to medium-size cities. However, as the size
of the city grows, the efficiency of using commercial solver, in terms of memory requirement and
solution time, decreases significantly. Therefore, a metaheuristic algorithm is required to solve the
problem for large-scale networks. In this study, Simulated Annealing (SA) is used to design an
algorithm for solving the problem for large-scale networks. Simulated annealing is known to
provide a good solution in a reasonable time for facility location problems (Ghamami et al., 2019a;
Zockaie et al., 2016). The output of the first sub-problem is the selected locations for building
charging stations, which support urban trips of EVs while ensuring that all EVs can fulfill their
trips by tracking the state of charge. As the charging stations might not be exactly located along
the users’ routes with minimum travel time, EVs need to deviate from their initial route to access
the charging station. This model minimizes the detours required to access the charging stations
along with considering land acquisition and electricity provision costs.
The second sub-problem optimizes the number of chargers required at each station. As the
EV allocation to charging stations is decided in the first sub-problem, the incoming flow (potential
queue) at each station and the chargers’ cost determine the number of chargers in this step. The
proposed sub-problem captures the trade-off between the cost of providing needed chargers and
users’ delay using a value of time factor, which calculates the monetary value of the experienced
delay. Obtaining the estimated arrival time of EVs to charging stations from the first sub-problem,
a dynamic queuing approach is implemented in this sub-problem to account for the stochasticity
associated with trajectories.
As mentioned earlier, the main inputs to the model include OD demand, road network
information, land use information, land cost, and electricity provision cost. This detailed
information is not always available, especially for small urban areas. Thus, regression models are
calibrated and validated using the results of the proposed optimization model for multiple cities
with available data. The regression models can be used for small urban areas to determine the
number of charging stations and chargers and the total investment cost; however, the aggregate
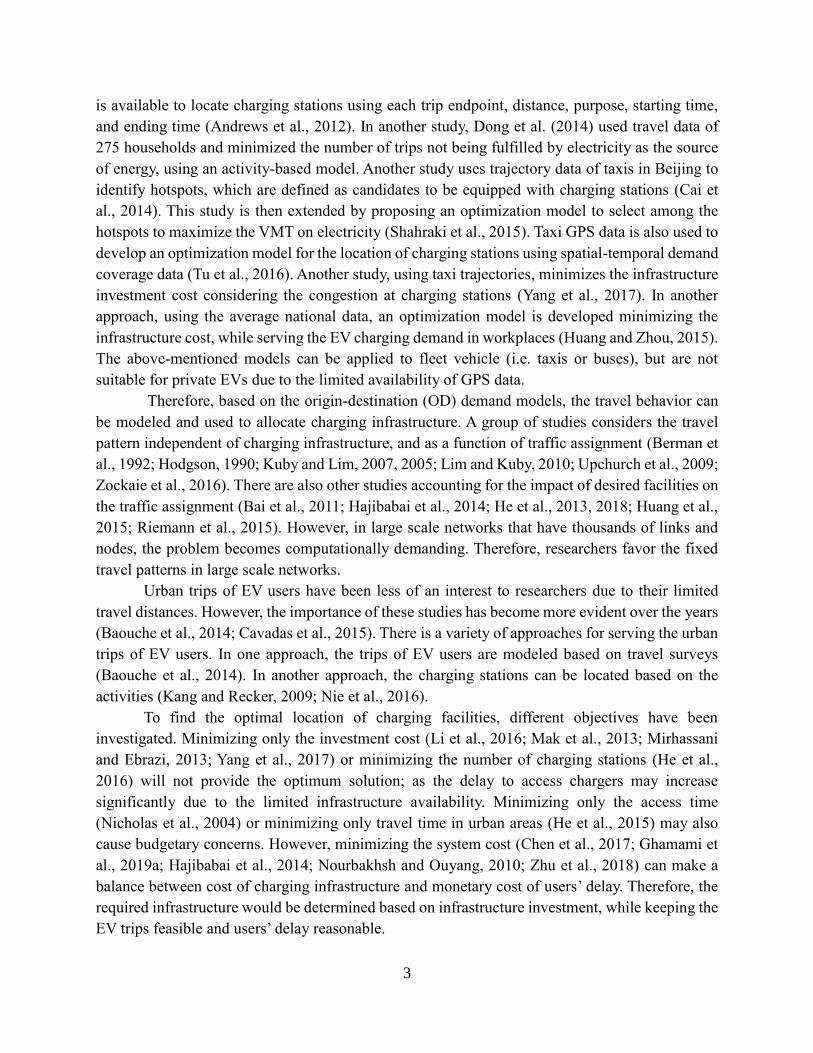
level regression models do not specify the exact location of charging stations. Figure 1 illustrates
the general framework and different steps of this study.
6
Figure 1. General research framework
Traffic Simulation
Traffic state and congestion level affect the route choice of EV users as well as non-EV drivers. In
addition, trip chains of EV users should be considered in the charger placement problem. In this
project, road traffic of the state-wide Michigan network is simulated and the trajectories of EV
trips (vehicle traveled paths on the road as a function of time), happening daily at different cities,
are extracted. Traffic simulation is a mathematical application of transportation systems through a
computer tool that is utilized for planning, operational, or design purposes. Visual demonstration
of present or future scenarios is an important application of the traffic simulation in transportation
systems. Therefore, in order to predict the time-dependent charging demands for different locations
using the trajectories of EV trips, which are assigned randomly as 6% of all trips in the selected
cities sub-networks, state-wide Michigan traffic is simulated through a traffic simulator. In general,
transportation models can be classified into three classes in terms of the level of details:
microscopic, mesoscopic, and macroscopic. To have a fast execution and easy calibration, the
mesoscopic simulation tool of DYNASMART-P is used for the purpose of this study (Jayakrishnan
et al., 1994). For traffic flow propagation, meso-simulation tools move individual entities
(vehicles) according to traffic flow relations coming from macroscopic speed-density relations.
Using the dynamic traffic assignment, DYNASMART-P supports many different
transportation planning and operational decisions. This tool combines dynamic traffic assignment
models and traffic simulation models. In addition, DYNASMART-P provides the capability to
model traffic flows in a network resulting from the decisions of adaptive users seeking for the
optimal paths en-route over the planning horizon. Thus, it overcomes many of the limitations of

7
tools used in current planning practice. DYNASMART-P takes road network data and system
configurations as the inputs, and generates individual vehicles based on time-dependent OD
demands. Once all vehicles are generated, they will be assigned to the paths with the minimum
generalized cost and the user equilibrium process is executed. Finally, the trajectories of all
vehicles, including electric vehicles, along with all optimal paths from origins to destinations are
reported as the outputs of the software. The EV trajectories are then extracted from all vehicles to
be used in an optimization framework to find the optimal charging infrastructure configuration
minimizing the total system cost. Note that a portion of vehicles, either electric or not, is assumed
to be adaptive and may use alternate routes in case of congestion or gridlock on initially selected
routes. These vehicles are aware of the current traffic conditions in different regions of the network
by having access to real-time information. Five categories of data are required for DYNASMART-
P as below.
▪ Network data: the main input in this category is a file containing the state-wide network
nodes and links information. Michigan Department of Transportation (MDOT) provided a
TransCAD file of the Michigan network, which is converted to a readable format by
DYNASMART-P. Figure 2 depicts the configuration of the state-wide Michigan network.
▪ Control data: the control data file represents the control types of all Michigan network nodes
(intersections) and the phasing details of the signalized intersections.
▪ Demand data: the static demand matrix is provided on the daily basis by MDOT. Hourly
factors are multiplied into the static demands to convert them into a time-dependent OD
demand matrix.
▪ Traffic flow relations: the speed-density curves, specific for the Michigan network are
calibrated using the data of installed loop detectors by MDOT along Michigan freeways.
▪ Scenario and system data: these two inputs are critical for scenario analysis and defining the
settings of the simulation runs.
Figure 2. State-wide Michigan network
8
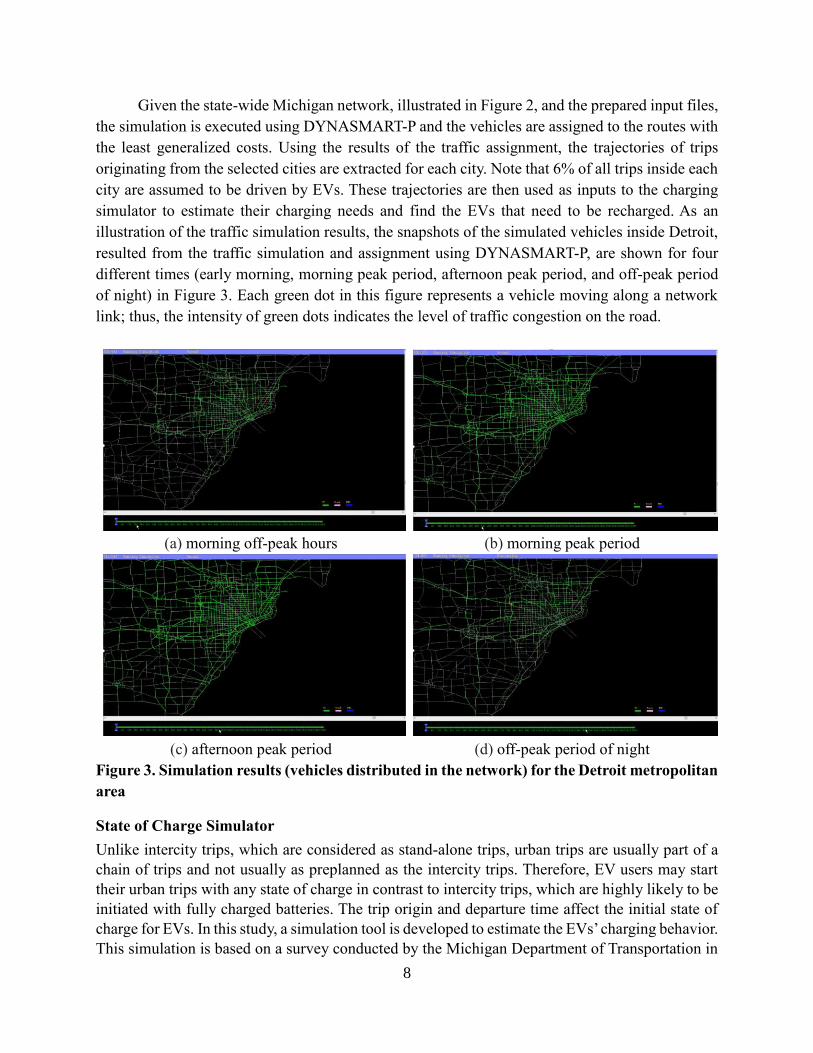
Given the state-wide Michigan network, illustrated in Figure 2, and the prepared input files,
the simulation is executed using DYNASMART-P and the vehicles are assigned to the routes with
the least generalized costs. Using the results of the traffic assignment, the trajectories of trips
originating from the selected cities are extracted for each city. Note that 6% of all trips inside each
city are assumed to be driven by EVs. These trajectories are then used as inputs to the charging
simulator to estimate their charging needs and find the EVs that need to be recharged. As an
illustration of the traffic simulation results, the snapshots of the simulated vehicles inside Detroit,
resulted from the traffic simulation and assignment using DYNASMART-P, are shown for four
different times (early morning, morning peak period, afternoon peak period, and off-peak period
of night) in Figure 3. Each green dot in this figure represents a vehicle moving along a network
link; thus, the intensity of green dots indicates the level of traffic congestion on the road.
(a) morning off-peak hours (b) morning peak period
(c) afternoon peak period (d) off-peak period of night
Figure 3. Simulation results (vehicles distributed in the network) for the Detroit metropolitan
area
State of Charge Simulator
Unlike intercity trips, which are considered as stand-alone trips, urban trips are usually part of a
chain of trips and not usually as preplanned as the intercity trips. Therefore, EV users may start
their urban trips with any state of charge in contrast to intercity trips, which are highly likely to be
initiated with fully charged batteries. The trip origin and departure time affect the initial state of
charge for EVs. In this study, a simulation tool is developed to estimate the EVs’ charging behavior.
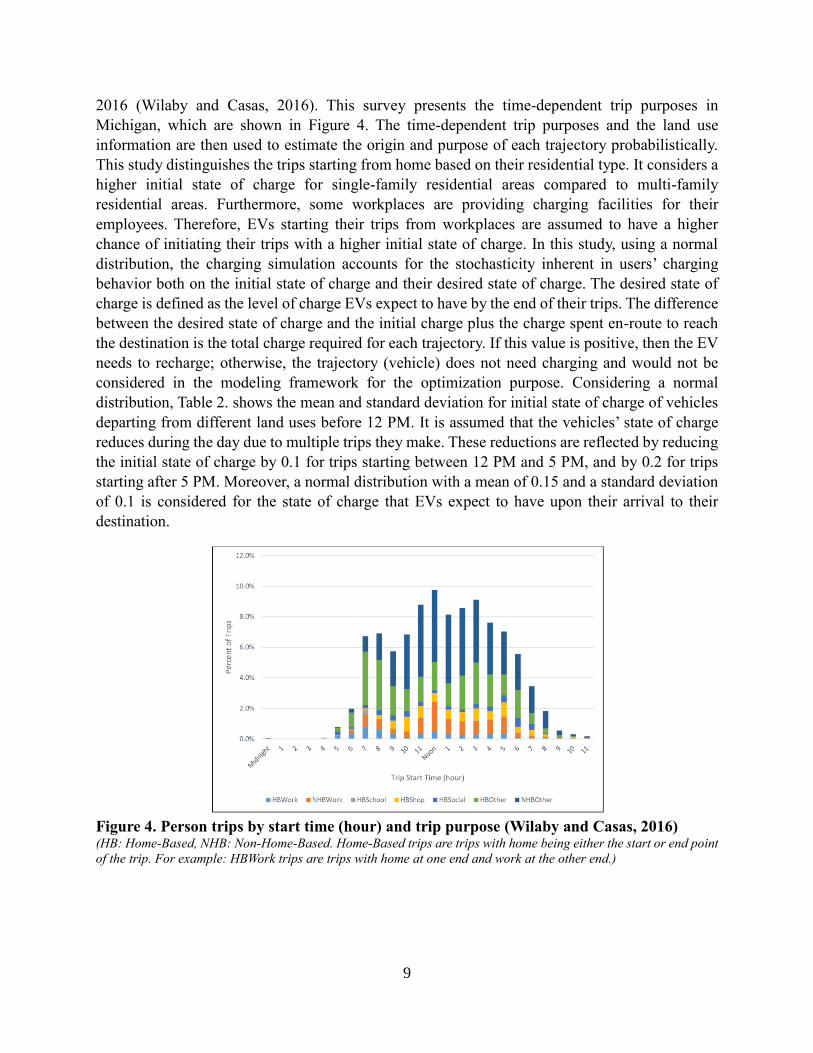
This simulation is based on a survey conducted by the Michigan Department of Transportation in
9
2016 (Wilaby and Casas, 2016). This survey presents the time-dependent trip purposes in
Michigan, which are shown in Figure 4. The time-dependent trip purposes and the land use
information are then used to estimate the origin and purpose of each trajectory probabilistically.
This study distinguishes the trips starting from home based on their residential type. It considers a
higher initial state of charge for single-family residential areas compared to multi-family
residential areas. Furthermore, some workplaces are providing charging facilities for their
employees. Therefore, EVs starting their trips from workplaces are assumed to have a higher
chance of initiating their trips with a higher initial state of charge. In this study, using a normal
distribution, the charging simulation accounts for the stochasticity inherent in users’ charging
behavior both on the initial state of charge and their desired state of charge. The desired state of
charge is defined as the level of charge EVs expect to have by the end of their trips. The difference
between the desired state of charge and the initial charge plus the charge spent en-route to reach
the destination is the total charge required for each trajectory. If this value is positive, then the EV
needs to recharge; otherwise, the trajectory (vehicle) does not need charging and would not be
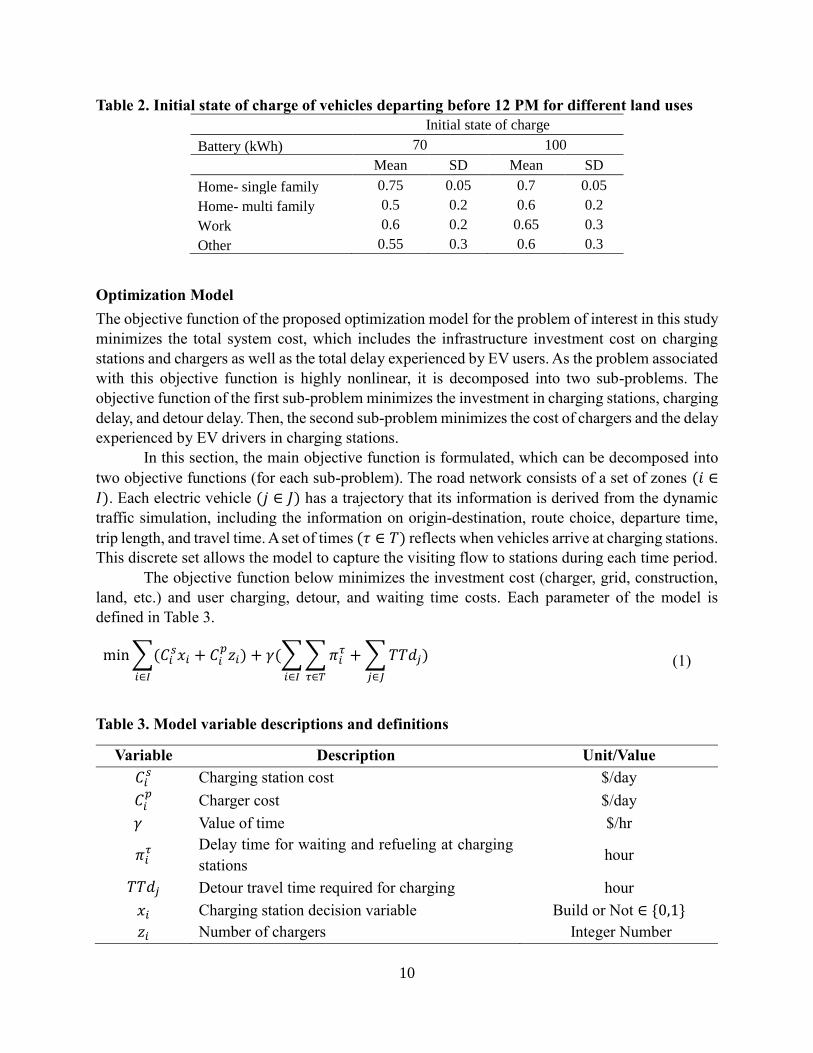
considered in the modeling framework for the optimization purpose. Considering a normal
distribution, Table 2. shows the mean and standard deviation for initial state of charge of vehicles
departing from different land uses before 12 PM. It is assumed that the vehicles’ state of charge
reduces during the day due to multiple trips they make. These reductions are reflected by reducing
the initial state of charge by 0.1 for trips starting between 12 PM and 5 PM, and by 0.2 for trips
starting after 5 PM. Moreover, a normal distribution with a mean of 0.15 and a standard deviation
of 0.1 is considered for the state of charge that EVs expect to have upon their arrival to their
destination.
Figure 4. Person trips by start time (hour) and trip purpose (Wilaby and Casas, 2016) (HB: Home-Based, NHB: Non-Home-Based. Home-Based trips are trips with home being either the start or end point
of the trip. For example: HBWork trips are trips with home at one end and work at the other end.)
10
Table 2. Initial state of charge of vehicles departing before 12 PM for different land uses
Initial state of charge
Battery (kWh) 70 100
Mean SD Mean SD
Home- single family 0.75 0.05 0.7 0.05
Home- multi family 0.5 0.2 0.6 0.2
Work 0.6 0.2 0.65 0.3
Other 0.55 0.3 0.6 0.3
Optimization Model
The objective function of the proposed optimization model for the problem of interest in this study
minimizes the total system cost, which includes the infrastructure investment cost on charging
stations and chargers as well as the total delay experienced by EV users. As the problem associated
with this objective function is highly nonlinear, it is decomposed into two sub-problems. The
objective function of the first sub-problem minimizes the investment in charging stations, charging
delay, and detour delay. Then, the second sub-problem minimizes the cost of chargers and the delay
experienced by EV drivers in charging stations.
In this section, the main objective function is formulated, which can be decomposed into
two objective functions (for each sub-problem). The road network consists of a set of zones (𝑖 ∈
𝐼). Each electric vehicle (𝑗 ∈ 𝐽) has a trajectory that its information is derived from the dynamic
traffic simulation, including the information on origin-destination, route choice, departure time,
trip length, and travel time. A set of times (𝜏 ∈ 𝑇) reflects when vehicles arrive at charging stations.
This discrete set allows the model to capture the visiting flow to stations during each time period.
The objective function below minimizes the investment cost (charger, grid, construction,
land, etc.) and user charging, detour, and waiting time costs. Each parameter of the model is
defined in Table 3.
min ∑(𝐶𝑖𝑠𝑥𝑖 + 𝐶𝑖
𝑝𝑧𝑖
𝑖∈𝐼
) + 𝛾(∑ ∑ 𝜋𝑖𝜏
𝜏∈𝑇𝑖∈𝐼
+ ∑ 𝑇𝑇𝑑𝑗)
𝑗∈𝐽
(1)
Table 3. Model variable descriptions and definitions
Variable Description Unit/Value
𝐶𝑖𝑠 Charging station cost $/day
𝐶𝑖𝑝 Charger cost $/day
𝛾 Value of time $/hr
𝜋𝑖𝜏
Delay time for waiting and refueling at charging
stations hour
𝑇𝑇𝑑𝑗 Detour travel time required for charging hour
𝑥𝑖 Charging station decision variable Build or Not ∈ {0,1}
𝑧𝑖 Number of chargers Integer Number

11
The objective function consists of two main terms. The first term, infrastructure investment
cost, includes the fixed cost of building charging stations and the variable cost of providing
chargers. The cost of charging stations includes the cost of facilities required for the installation of
chargers and the electricity provision cost. The cost of chargers consists of the chargers’ cost
(equipment, activation cost, etc.), construction cost, and land cost. The second term in the objective
function represents the monetary value of the delay experienced by EV users. It includes the
charging and queuing delay experienced by EV users captured by 𝜋𝑖𝜏 and the required detour for
each EV user to access the charging station, which is captured by 𝑇𝑇𝑑𝑗. These delays are multiplied
by 𝛾, which is the value of time and is assumed to be $18/h, to provide the monetary value of the
delay time. The decision variables are the zones that should be equipped with charging stations
and the number of chargers at each station.
The objective function is followed by a set of constraints. These constraints include
tracking the state of charge, flow conservation, detour time, and queuing constraints. For tracking
the state of fuel, it is considered that EVs cannot charge more than their capacity. Therefore, EVs
cannot charge in stations where their required charge is more than their available capacity.
Furthermore, EVs can only charge in a charging station that is within their current range. The
detour time for each trajectory is calculated considering the difference between the initial trip
duration and the trip duration in which the vehicle visits the charging station.
Solution Approach
As mentioned earlier, the optimization model is a mixed-integer problem with non-linear
constraints. Due to the computational complexity, the commercial solvers cannot provide solutions
efficiently for these types of problems, especially for large-scale networks. In this study, using a
decomposition technique, the problem is transformed into two sub-problems. The first sub-
problem locates the charging stations in the network minimizing the cost of charging stations,
detour, and charging delay. The second sub-problem finds the number of required chargers
minimizing the cost of chargers and the queue experienced by EV users. A solution framework is
presented for each of these sub-problems.
The first sub-problem determines the location of charging stations. The objective function
of this problem is as follows:
min ∑(𝐶𝑖𝑠𝑥𝑖
𝑖∈𝐼
) + 𝛾(∑ ∑ ∑ ∑ 𝑄𝑖𝑗𝜏𝜃
𝑗∈𝐽𝑖∈𝐼
𝑅𝑖𝑗𝜃
𝜃∈𝑇𝜏∈𝑇
+ ∑ 𝑇𝑇𝑑𝑗)
𝑗∈𝐽
(2)
The decision variable in the above objective function is 𝑥𝑖, which is equal to 1 if there is a
charging station and 0 otherwise. This objective function along with its constraints form a mixed-
integer program with linear constraints. The commercial solvers, e.g. CPLEX, can be incorporated
to solve these problems. However, as the problem size grows, the computational requirement
increases exponentially. Therefore, a metaheuristic approach is also implemented for large case
studies. The metaheuristic algorithm implemented in this project is based on Simulated Annealing
(SA). An SA-based algorithm usually involves two steps. First, the feasible set of integer solutions
is searched to find a neighbor solution for the current solution. Then, the algorithm compares the
objective functions of the current and the new solution. If the neighbor solution improves the
12
objective function, the neighbor solution replaces the current solution and becomes the new current
solution. However, if the objective function is not improved (a worse solution), the probability of
replacing the current solution is a function of the relative difference between the objective function
values of the neighbor and the current solution. The probability is gradually reduced as the solution
process proceeds through the iterations of the algorithm. This probability is close to zero by the
end of the iterations meaning that the worse solution will not be accepted anymore. This
mechanism prevents the solution from getting trapped in local optima. Then, the trajectories are
assigned to an available station minimizing their total detour.
The second sub-problem finds the optimum number of chargers in charging stations. Based
on the first problem, trajectories assigned to each charging station are known. These trajectories
reach to charging stations having a temporal distribution with AM and PM peaks. Based on the
availability of chargers, they either charge upon their arrival or wait in queue for an available
charger. This sub-problem makes a trade-off between providing more chargers and letting the users
to wait in queue for an available charge. The objective function of this sub-problem, which
minimizes the charger costs and the queuing delay experienced by EV users at charging stations,
is as follows:
min 𝐶𝑝𝑧𝑖 + 𝛾 ∑ 𝑦𝑖𝜏�̅�𝑖
𝜏
𝜏∈𝑇
(3)
The decision variable in this sub-problem is the number of chargers. 𝑦𝑖𝜏 represents the
number of EVs entering the charging station while the queuing delay is captured in �̅�𝑖𝜏. The
objective function value can be estimated based on some assumptions on arrival and service rates.
Assuming a uniform arrival rate and service rate, the queuing behavior can be modeled based on
a deterministic queue modeling approach (Zukerman, 2013). Then, the objective function along
with its constraints forms a mixed-integer problem with nonlinear constraints. Since the objective
function is strictly convex and the constraints are convex, the proposed problem can be solved
with the Golden-section search technique, which is designed to find the extreme value of a function
in a pre-defined interval as its domain (Kavianipour et al., 2020). In addition, commercial solvers
such as Knitro can be also incorporated to solve this problem. The deterministic queuing
assumption provides the minimum number of chargers required to support the EVs’ charging.
However, once the arrival rate of vehicles to charging stations is lower than the service rate, then
the arrival process can be modeled as a Poisson distribution with exponential service rate
distribution. Therefore, the M/M/k queuing formulations should be used to model the users’
queuing behavior (Zukerman, 2013). The average queue size of the M/M/k system is convex with
respect to the traffic flow (Grassmann, 1983). Therefore, the optimum value of the objective
function can be calculated using the Golden-section search technique. It is worth noting that the
M/M/k equations are applicable where service rate is greater than arrival rate. If the arrival rate is
greater than the service rate, only the deterministic approach is applicable.
Regression Models
The proposed optimization model needs detailed data on road network information, spatial-
temporal distribution of trips, electricity provision cost, and land cost. However, this detailed

13
information may not always be available and often harder to obtain for smaller urban areas
depending on the resources available. Thus, two regression models are developed to estimate the
number of chargers and the number of charging stations for areas with limited data availability.
The results of the optimization model provide inputs for the regression models calibration. These
models estimate the number of chargers and charging stations for any city based on aggregate
measures without requiring detailed information.
A variety of linear and non-linear regression models were estimated considering different
combinations of input variables (aggregate measures as independent variables) to estimate the total
number of charging stations and chargers (dependent variables) needed in urban areas. The
estimated regression models are compared based on the following parameters:
1. p-value: The p-value, also known as the calculated probability, investigate the truth of the
null hypothesis. A p-value of less than 0.05 indicates that the null hypothesis can be
rejected with enough evidence. This value explains the statistical significance of a
particular variable in the model and the model as a whole. The statistically insignificant
models and models with insignificant variables are not considered.
2. R-squared and Adjusted R-squared values: The R-squared value explains the goodness-
of-fit for each regression model. The adjusted R-squared take into account the number of
variables in the model and is used to compare models with different numbers of
independent variables. The higher the adjusted R-squared, the better the model. The
equations for estimating R-squared and adjusted R-squared are as follows (Listen Data,
2019):
𝑅2 = 1 −𝑆𝑆𝑟𝑒𝑠
𝑆𝑆𝑡𝑜𝑡 (4)
𝑅𝑎𝑑𝑗𝑢𝑠𝑡𝑒𝑑2 = 1 −
(1 − 𝑅2)(𝑁 − 1)
𝑁 − 𝑝 − 1
(5)
Where 𝑆𝑆𝑟𝑒𝑠 is the sum of squares of residuals. A residual is the difference between the
observed value and the predicted value of the dependent variable by the model at a
particular data point. 𝑆𝑆𝑡𝑜𝑡 is the total sum of squares, which measures the total variation
in the data. It is given by the sum of squares of the difference between the observed value
of the dependent variable at the data points and the mean (average) of all the observed
values in the dataset. The terms ‘𝑁’ and ‘𝑝’ are the number of data points and the number
of independent variables considered in the model, respectively.
3. RMSE: It is the root mean square error of the observed value and the predicted value. This
parameter explains the overall deviations of all predicted values by the model from the
observed values in the dataset. The smaller this error term, the better the model is in
predicting the dependent variable. The RMSE for a dataset is estimated as follows
(Barnston, 1992):
𝑅𝑀𝑆𝐸 = √∑ (𝑦𝑖𝑜𝑏𝑠 − 𝑦𝑖
𝑝𝑟𝑒𝑑)𝑁𝑖=1
2
𝑁
(6)
14
In which 𝑦𝑖𝑜𝑏𝑠 and 𝑦𝑖
𝑝𝑟𝑒𝑑 are the observed value (from the dataset) and the predicted value
(by the regression model) of the dependent variable at a particular data point ‘𝑖’,
respectively. The term ‘𝑁’ is the total number of data points.
CITY SELECTION
Using the state-wide Michigan network, different information including the number of zones,
generated demand, lane length, and estimated traveled miles are extracted for each candidate city.
Among the candidate cities, those with sufficient network details and generated trips are selected
for the EV charger placement analyses. In addition, the city with the highest generated demand in
the Upper-Peninsula in Michigan, Marquette, is selected for the analysis. A data summary of the
candidate cities is provided in Table 4. The selected cities for the detailed EV charger placement
analysis are shown in bold fonts in this table. The regression models are used to find the charger
and station counts for other cities in this table. In addition, the schematic views of the extracted
sub-networks for the cities analyzed with the optimization model are illustrated in Figure 5.
Table 4. Data Summary for the candidate cities of the EV charger placement analysis sorted
based on the generated demand
Cities /Parameter Number
of Nodes
Number
of Zones
Generated
Demand
Lane
Length (mi)
Vehicle Miles
Traveled (per day)
Menominee 9 6 41,297 54 166,799
Sault Ste. Marie 42 6 61,412 133 229,042
Escanaba 43 14 103,491 260 479,245
Houghton 76 31 113,403 626 558,063
Marquette 62 21 178,741 336 931,957
Traverse City 53 13 226,264 212 1,124,123
Battle Creek 182 25 245,167 406 1,385,189
Jackson 259 24 274,350 461 1,542,840
Port Huron 255 30 296,516 918 2,717,248
Holland 204 20 373,233 525 2,279,219
Muskegon 387 52 535,443 916 3,161,057
Ann Arbor 413 36 624,618 789 3,894,950
Kalamazoo 369 55 712,796 1128 4,085,052
Flint 694 84 985,411 1557 6,760,436
Saginaw 783 116 1,054,842 2726 7,122,931
Lansing 896 91 1,086,242 2030 7,183,037
Grand Rapids 1031 82 1,726,732 2045 10,447,668
Detroit 5461 301 8,185,778 8776 52,293,864
15
(a) Marquette (b) Muskegon (c) Ann Arbor
(d) Kalamazoo (e) Flint (f) Saginaw
(g) Lansing (h) Grand Rapids (i) Detroit
Figure 5. Sub-networks of the selected cities for EV charger placement analysis with the
optimization model
DATA COLLECTION
The optimization framework and the dynamic traffic simulation require data including origin-
destination travel demand, Michigan road network, land use information, charging station and
charger costs, site acquisition costs, utility provision costs, and vehicle and user characteristics.
This section explains the details of obtaining each of these data sets.
Michigan Road Network and Origin-Destination Travel Demand
The Michigan road network is provided to the research team by MDOT. This road network consists
of 37,125 links, including 11,516 freeways or highways, 20,742 arterials, and 4,867 ramps, as well
as 16,976 nodes, including 4,237 signalized intersections. The road network, presented in Figure
16
2, is provided to the research team in TransCAD format. MDOT also provided origin-destination
travel demand information. MDOT conducts travel surveys periodically. The results of these
surveys are inputs to the MDOT travel planning models, which provide the demand table for about
3,000 traffic analysis zones (TAZs) for a weekday in fall. Given these data, the road networks of
different candidate cities are extracted from the state-wide road network.
Land Use Information
The initial state-of-charge (i-SOC) depends on the probability of users having access to an
available charger. The accessibility of chargers is currently highly correlated with land-use. Thus,
land-use information was obtained from MDOT and also from different cities and communities.
The land-use information obtained from the different sources were compared and in case of
inconsistencies, the city/community data was prioritized over the MDOT data. The land-use
categories of interest in this study include residential (single or multi-family), industrial,
commercial, and other.
Charging Station and Charger Costs
The charging station and charger costs were provided by different charging station companies,
such as Greenlots and ChargePoint. The chargers considered here have either a CHAdeMO or SAE
combo connector. The chargers are assumed to charge one vehicle at a time, requiring one parking
spot. Thus, the charger cost used in the current study includes charger cost, land cost, validation,
and activation costs. The charging station costs include site acquisition, utility upgrade, electrical
panel and switchgear, engineering and design, permitting, and project management costs.
Site acquisition costs and utility costs at each candidate location, which are discussed in
more details in the following subsections, are obtained from cities/communities and utility
companies, respectively. Thus, the approximate values provided by charging station companies for
site acquisition cost and utility provision costs are replaced with the values estimated by cities/
communities and utility companies, respectively.
Site Acquisition Costs
Site acquisition costs are obtained from cities and communities. The cities and communities had a
variety of approaches in preparing this data. The most common approach was using the assessors’
data to find the land cost by square feet and apply the unit land cost to the area required for each
of the charging stations.
Utility Provision Costs
Michigan Public Service Commission website was used to find the utility companies at each
candidate point. The utility companies with jurisdiction at the candidate points are:
▪ Alger Delta
▪ DTE Energy
▪ ConsumersEnergy
▪ Grand Haven Board of Light and Power
▪ Great Lakes Energy
▪ Indiana Michigan Power

17
▪ Marquette Board of Light and Power
▪ Upper Peninsula Power Company
▪ Midwest Energy
▪ Tri-county
▪ Lansing Board of Water and Light
It is worth noting that the basis for utility cost calculations vary from location to location
or among different utility companies depending on the resources available at each company. Utility
companies either reported the cost at the exact candidate point (center of the TAZ), the average
cost over the TAZ, or an approximate average cost over an area with a few TAZs. The costs were
requested for 100 kVA, 500 kVA, 1,000 kVA, and 2,000 kVA load levels. However, utility
companies reported that the load ranges listed do not affect the electricity provision cost. For the
locations with no data, interpolation and extrapolation of the data available in Phase II (the current
project), as well as averaging data available from Phase I of the project, are adopted.
The electricity provision costs reported by the utility companies include but are not limited
to conduit from the transformer to the meter enclosure, meter enclosure, protective equipment, and
conduit and conductor from the meter enclosure to the charging station.
Vehicle and User Characteristics
This study aims to introduce a framework for urban charging infrastructure planning. For this
purpose, this study suggests networks of charging stations for urban areas in Michigan. The design
of such system requires information about vehicles and users’ characteristics. The main reason is
that the system is designed for the users to operate their vehicles. The details of such characteristics
are described as follows:
Battery Range and Performance Variation
Driving range of EVs determines the charging behavior of EV users. Thus, through stakeholder
meetings with automobile manufacturers, the EV battery capacities for the upcoming year of 2030
were investigated. They suggested 50kWh batteries for small cars, 70-80 kWh for mid-size
vehicles, and 100-120 kWh for large vehicles. Therefore, in this study, battery sizes of 70 kWh
and 100 kWh were tested for a variety of scenarios. Also, a battery performance of 3.5 miles/kWh
for summer with a 30% reduction factor for winter weather conditions was suggested.
Electric Vehicle Market Share
The EVs’ adoption rate has been increasing in the past decade. The expected market share of EVs
for the state of Michigan in 2030 is 6%, as shown in Figure 6, which is predicted by Midcontinent
Independent System Operator (MISO) (Dana Lowell, Brian Jones, 2017).
18
Figure 6. EV Market share projections (Dana Lowell, Brian Jones, 2017)
Scenarios
This study is designed to find the optimum location of charging stations and the number of chargers
required at each station for the target year of 2030. As planning for the future involves uncertainty,
different scenarios are tested to find the optimal charging configuration. Based on the different
scenarios tested in Phase I of EV Charger Placement Study, the winter scenario, in which the
battery performance reduces by 30%, requires more charging stations and chargers among different
seasons (Ghamami et al., 2019b). Also, it was shown that a bare-bone charging network designed
for winter can provide trip feasibility for EV users during summer as well. It is worth noting that
urban travel demand, unlike the intercity travel demand, is expected not to change significantly
over different seasons. Similar to phase I, two battery types with capacities of 70 kWh and 100
kWh are considered in the current study. Two charging power of 50 kW and 150 kW are also
considered to charge EVs. Different combinations of these assumptions provide four scenarios.
Table 5. presents these scenarios.
Table 5. Specifications of the considered scenarios for the target year of 2030
Scenario 1 2 3 4
Battery Capacity (kWh) 70 100 70 100
Charger Power (kW) 50 50 150 150
RESULTS AND DISCUSSION
This section details the project results. For each urban area, a total of four scenarios are
investigated. Table 6 to Table 14 provide information on the inputs to the model in the first four
rows and summarize the outputs of the model in the next six rows. The model input consists of
battery size, charging power, the number of traffic analysis zones, and the number of EV trips. The
output data includes the number of charging stations, the total number of chargers, total charging
delay, station cost, charger cost, and total investment cost. Figure 7 to Figure 42 show the charging
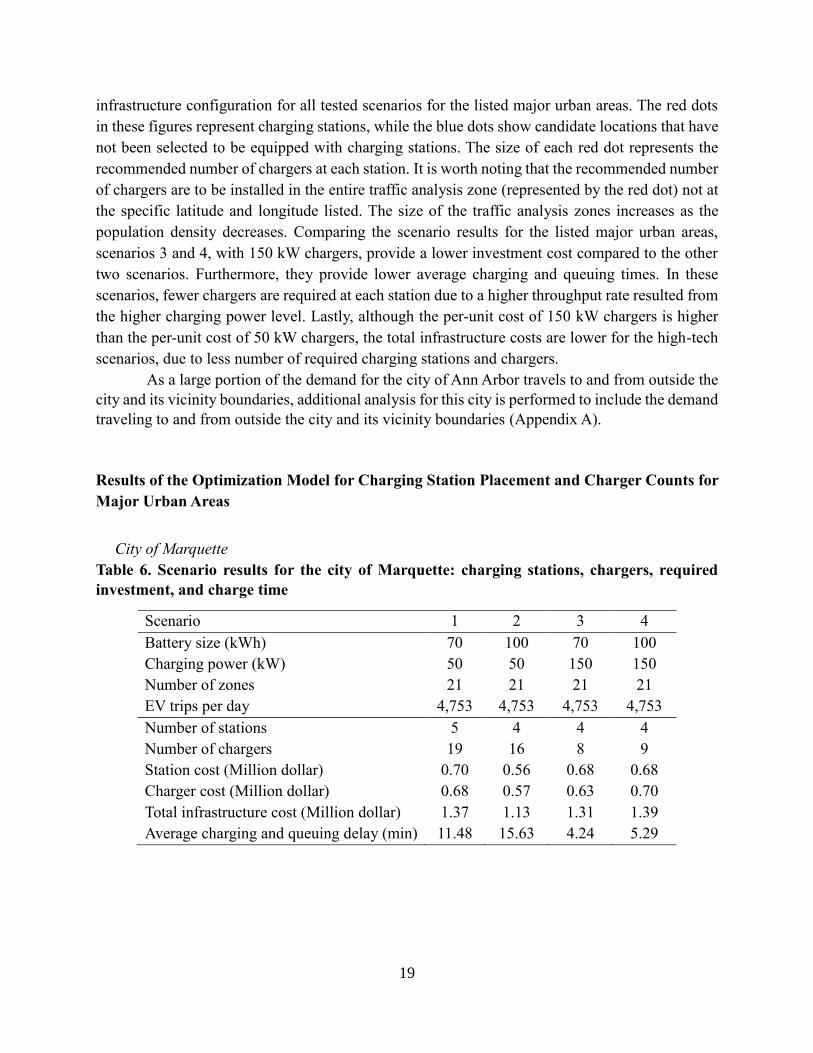
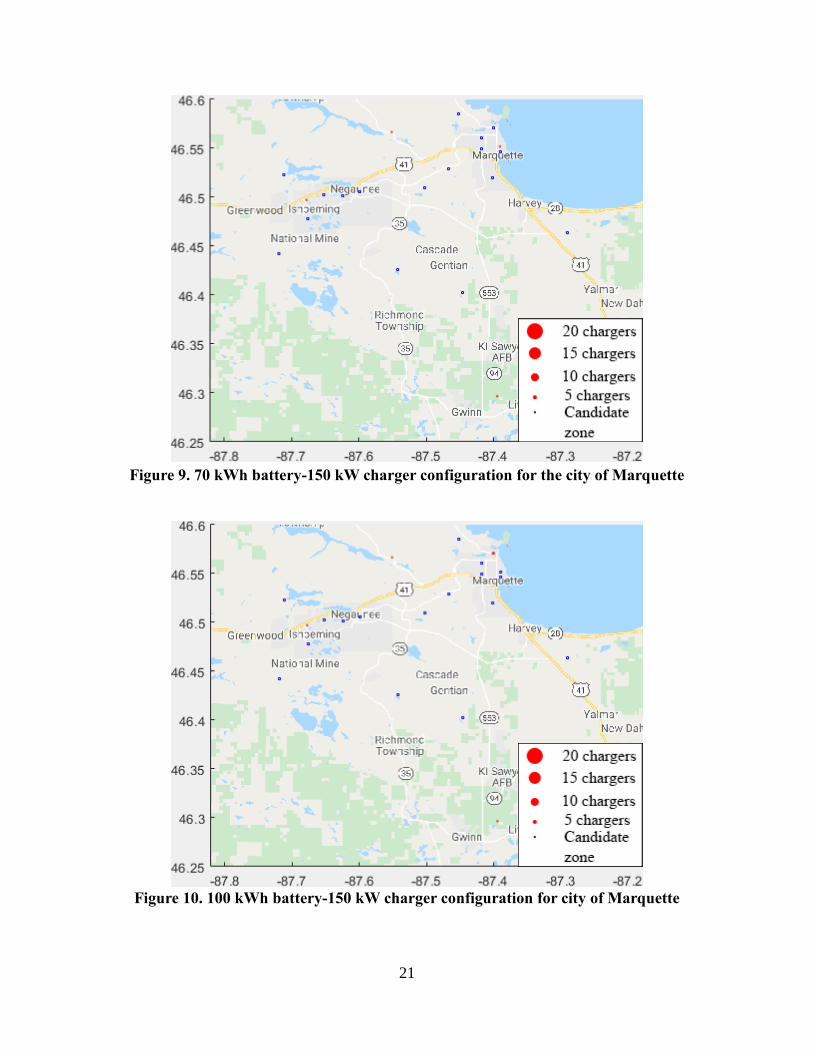
19
infrastructure configuration for all tested scenarios for the listed major urban areas. The red dots
in these figures represent charging stations, while the blue dots show candidate locations that have
not been selected to be equipped with charging stations. The size of each red dot represents the
recommended number of chargers at each station. It is worth noting that the recommended number
of chargers are to be installed in the entire traffic analysis zone (represented by the red dot) not at
the specific latitude and longitude listed. The size of the traffic analysis zones increases as the
population density decreases. Comparing the scenario results for the listed major urban areas,
scenarios 3 and 4, with 150 kW chargers, provide a lower investment cost compared to the other
two scenarios. Furthermore, they provide lower average charging and queuing times. In these
scenarios, fewer chargers are required at each station due to a higher throughput rate resulted from
the higher charging power level. Lastly, although the per-unit cost of 150 kW chargers is higher
than the per-unit cost of 50 kW chargers, the total infrastructure costs are lower for the high-tech
scenarios, due to less number of required charging stations and chargers.
As a large portion of the demand for the city of Ann Arbor travels to and from outside the
city and its vicinity boundaries, additional analysis for this city is performed to include the demand
traveling to and from outside the city and its vicinity boundaries (Appendix A).
Results of the Optimization Model for Charging Station Placement and Charger Counts for
Major Urban Areas
City of Marquette
Table 6. Scenario results for the city of Marquette: charging stations, chargers, required
investment, and charge time
Scenario 1 2 3 4
Battery size (kWh) 70 100 70 100
Charging power (kW) 50 50 150 150
Number of zones 21 21 21 21
EV trips per day 4,753 4,753 4,753 4,753
Number of stations 5 4 4 4
Number of chargers 19 16 8 9
Station cost (Million dollar) 0.70 0.56 0.68 0.68
Charger cost (Million dollar) 0.68 0.57 0.63 0.70
Total infrastructure cost (Million dollar) 1.37 1.13 1.31 1.39
Average charging and queuing delay (min) 11.48 15.63 4.24 5.29

20
Figure 7. 70 kWh battery-50 kW charger configuration for the city of Marquette
Figure 8. 100 kWh battery-50 kW charger configuration for the city of Marquette
21
Figure 9. 70 kWh battery-150 kW charger configuration for the city of Marquette
Figure 10. 100 kWh battery-150 kW charger configuration for city of Marquette
22
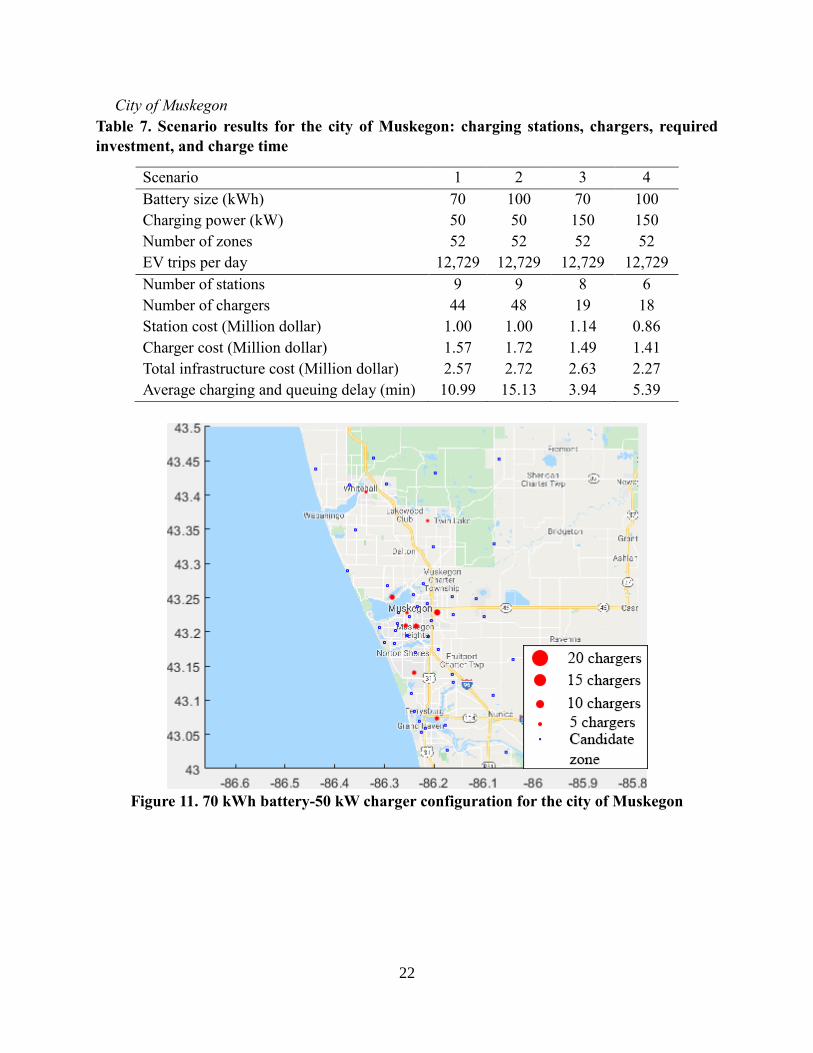
City of Muskegon
Table 7. Scenario results for the city of Muskegon: charging stations, chargers, required
investment, and charge time
Scenario 1 2 3 4
Battery size (kWh) 70 100 70 100
Charging power (kW) 50 50 150 150
Number of zones 52 52 52 52
EV trips per day 12,729 12,729 12,729 12,729
Number of stations 9 9 8 6
Number of chargers 44 48 19 18
Station cost (Million dollar) 1.00 1.00 1.14 0.86
Charger cost (Million dollar) 1.57 1.72 1.49 1.41
Total infrastructure cost (Million dollar) 2.57 2.72 2.63 2.27
Average charging and queuing delay (min) 10.99 15.13 3.94 5.39
Figure 11. 70 kWh battery-50 kW charger configuration for the city of Muskegon
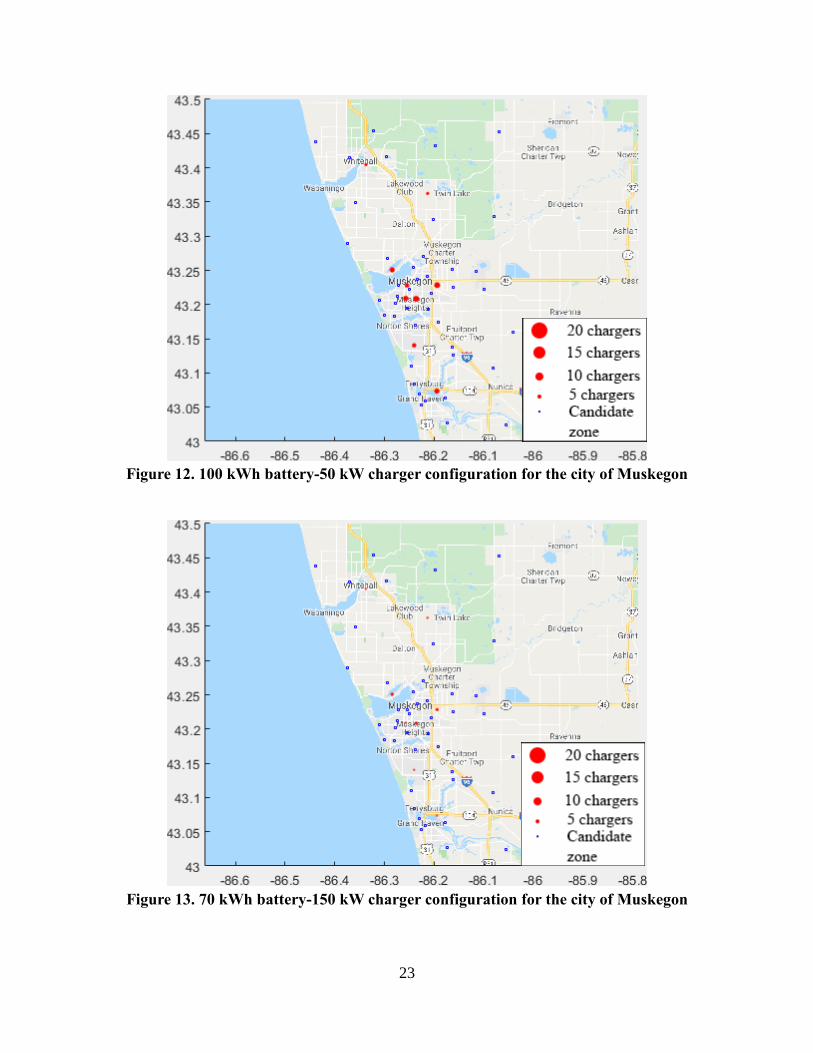
23
Figure 12. 100 kWh battery-50 kW charger configuration for the city of Muskegon
Figure 13. 70 kWh battery-150 kW charger configuration for the city of Muskegon
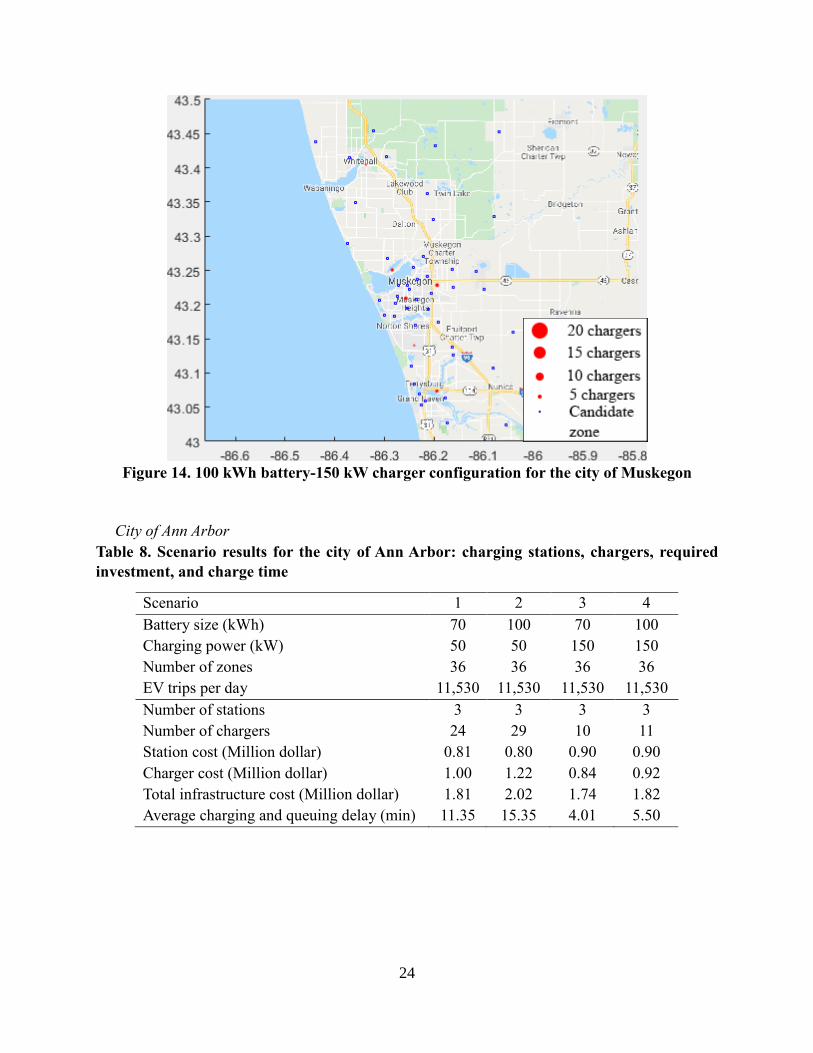
24
Figure 14. 100 kWh battery-150 kW charger configuration for the city of Muskegon
City of Ann Arbor
Table 8. Scenario results for the city of Ann Arbor: charging stations, chargers, required
investment, and charge time
Scenario 1 2 3 4
Battery size (kWh) 70 100 70 100
Charging power (kW) 50 50 150 150
Number of zones 36 36 36 36
EV trips per day 11,530 11,530 11,530 11,530
Number of stations 3 3 3 3
Number of chargers 24 29 10 11
Station cost (Million dollar) 0.81 0.80 0.90 0.90
Charger cost (Million dollar) 1.00 1.22 0.84 0.92
Total infrastructure cost (Million dollar) 1.81 2.02 1.74 1.82
Average charging and queuing delay (min) 11.35 15.35 4.01 5.50
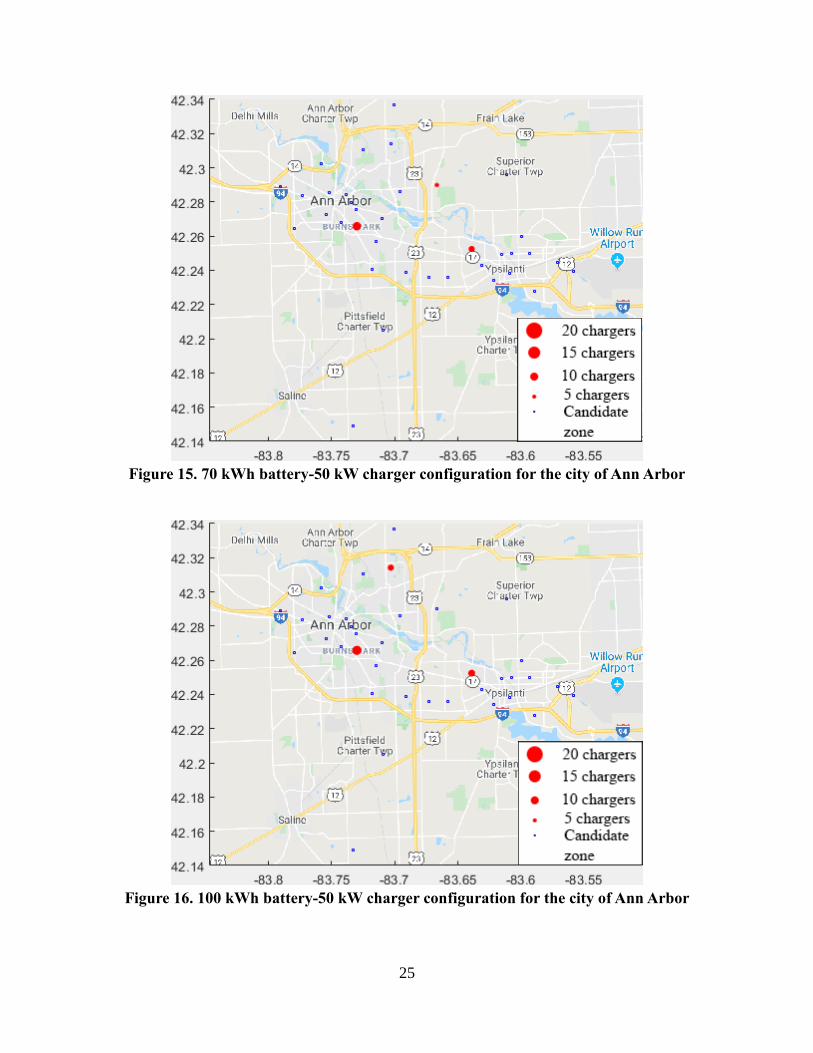
25
Figure 15. 70 kWh battery-50 kW charger configuration for the city of Ann Arbor
Figure 16. 100 kWh battery-50 kW charger configuration for the city of Ann Arbor
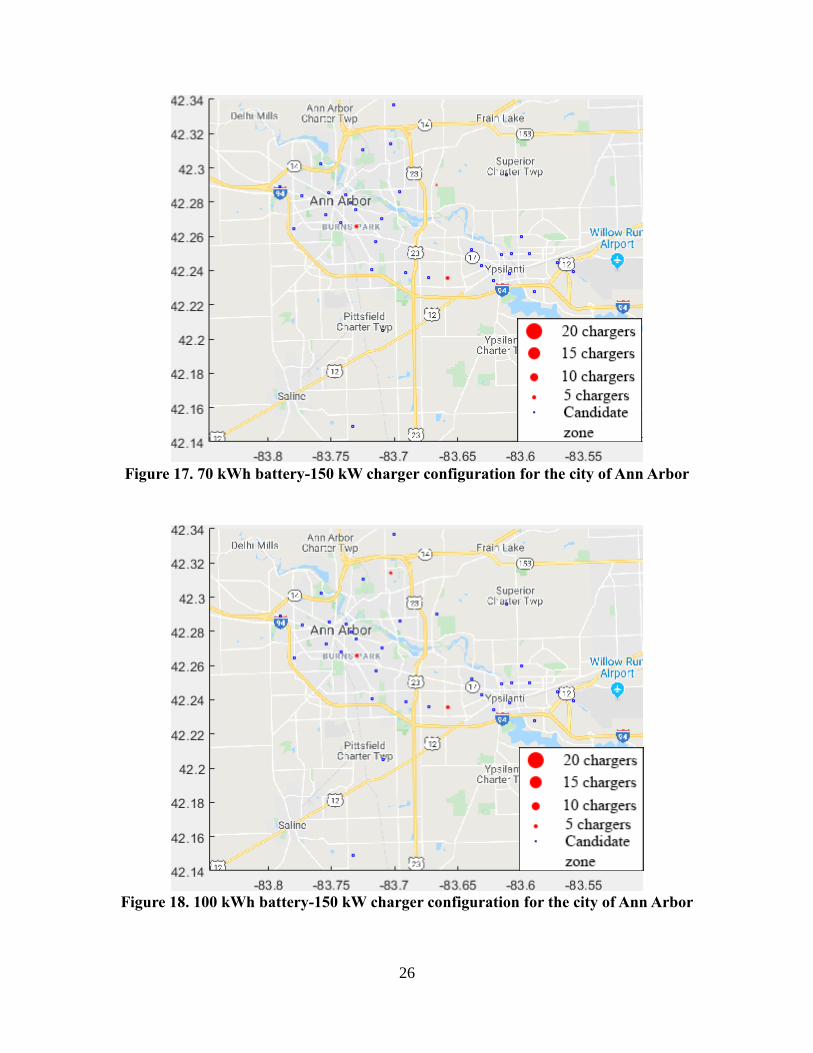
26
Figure 17. 70 kWh battery-150 kW charger configuration for the city of Ann Arbor
Figure 18. 100 kWh battery-150 kW charger configuration for the city of Ann Arbor
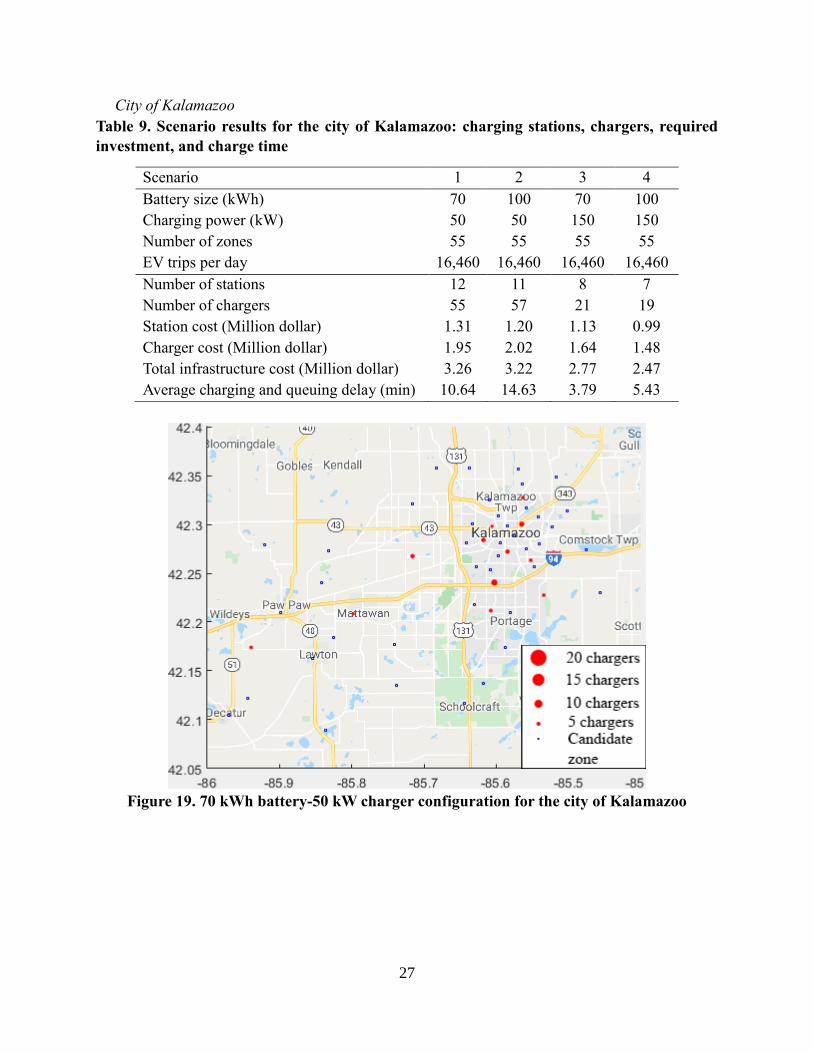
27
City of Kalamazoo
Table 9. Scenario results for the city of Kalamazoo: charging stations, chargers, required
investment, and charge time
Scenario 1 2 3 4
Battery size (kWh) 70 100 70 100
Charging power (kW) 50 50 150 150
Number of zones 55 55 55 55
EV trips per day 16,460 16,460 16,460 16,460
Number of stations 12 11 8 7
Number of chargers 55 57 21 19
Station cost (Million dollar) 1.31 1.20 1.13 0.99
Charger cost (Million dollar) 1.95 2.02 1.64 1.48
Total infrastructure cost (Million dollar) 3.26 3.22 2.77 2.47
Average charging and queuing delay (min) 10.64 14.63 3.79 5.43
Figure 19. 70 kWh battery-50 kW charger configuration for the city of Kalamazoo
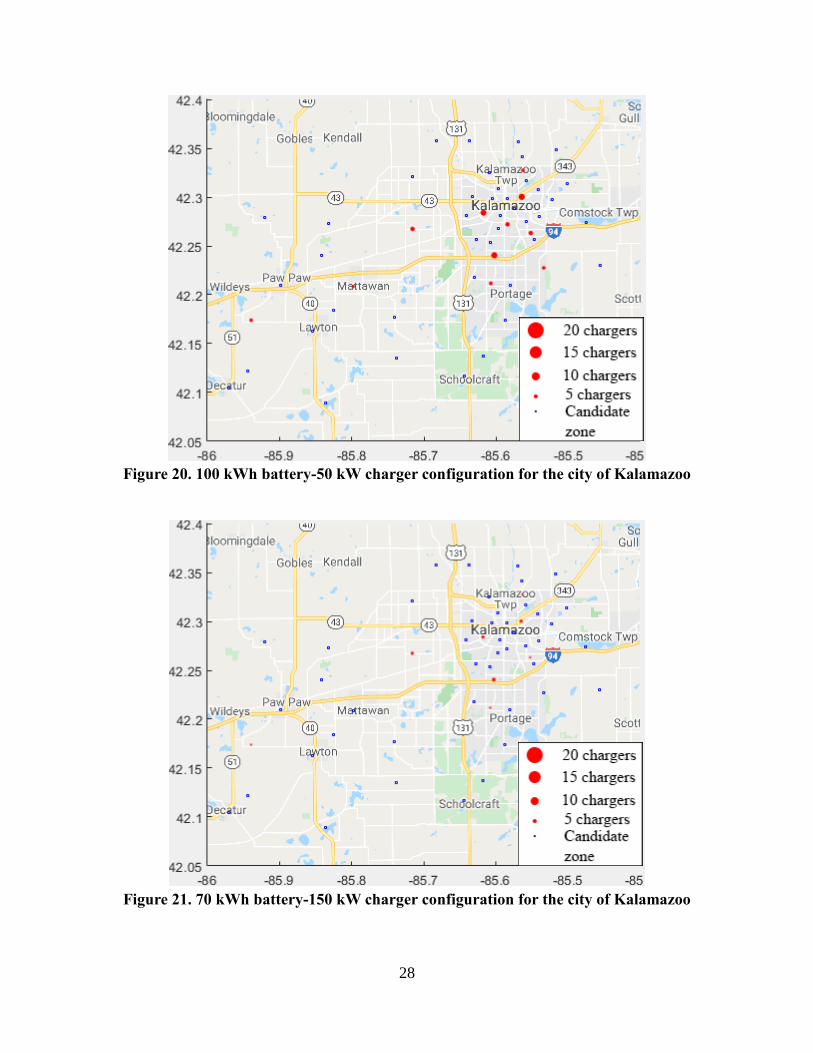
28
Figure 20. 100 kWh battery-50 kW charger configuration for the city of Kalamazoo
Figure 21. 70 kWh battery-150 kW charger configuration for the city of Kalamazoo
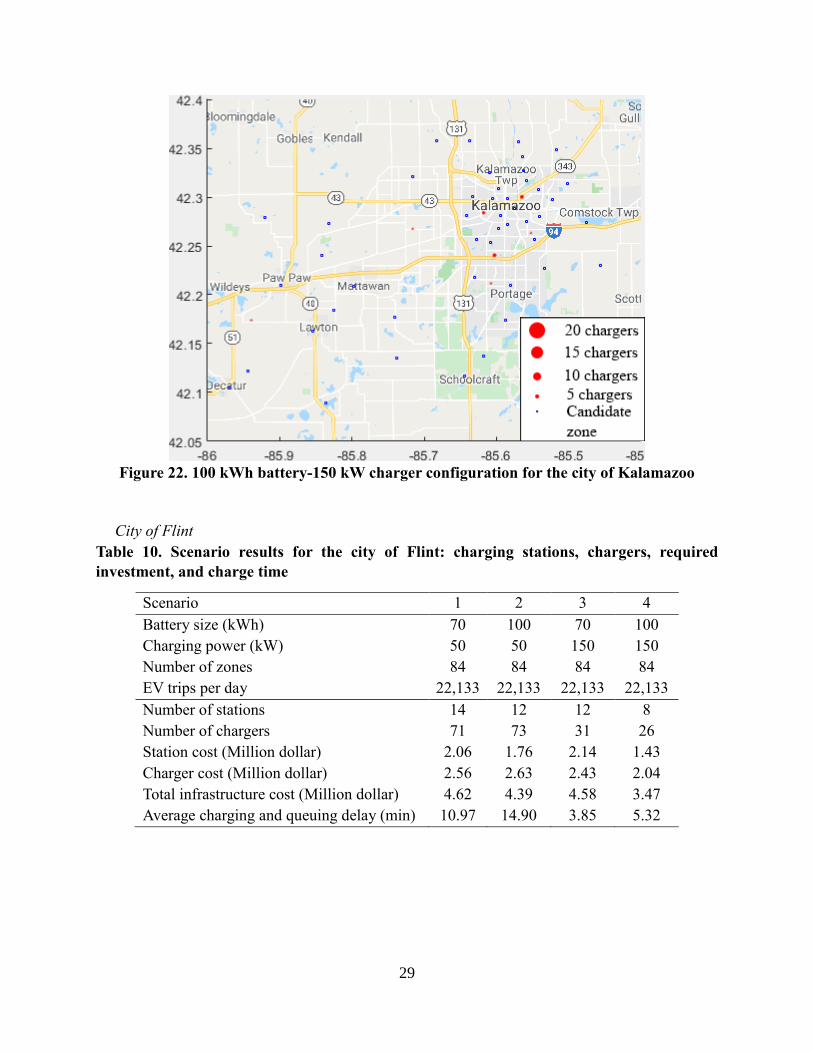
29
Figure 22. 100 kWh battery-150 kW charger configuration for the city of Kalamazoo
City of Flint
Table 10. Scenario results for the city of Flint: charging stations, chargers, required
investment, and charge time
Scenario 1 2 3 4
Battery size (kWh) 70 100 70 100
Charging power (kW) 50 50 150 150
Number of zones 84 84 84 84
EV trips per day 22,133 22,133 22,133 22,133
Number of stations 14 12 12 8
Number of chargers 71 73 31 26
Station cost (Million dollar) 2.06 1.76 2.14 1.43
Charger cost (Million dollar) 2.56 2.63 2.43 2.04
Total infrastructure cost (Million dollar) 4.62 4.39 4.58 3.47
Average charging and queuing delay (min) 10.97 14.90 3.85 5.32
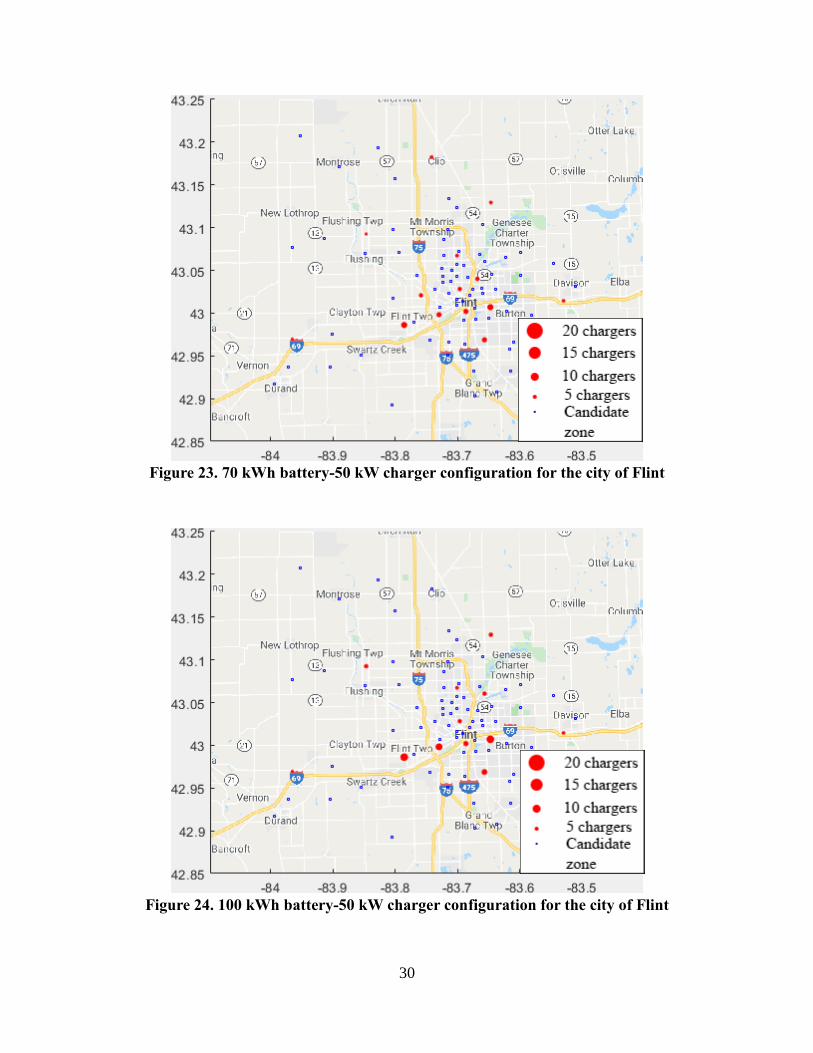
30
Figure 23. 70 kWh battery-50 kW charger configuration for the city of Flint
Figure 24. 100 kWh battery-50 kW charger configuration for the city of Flint
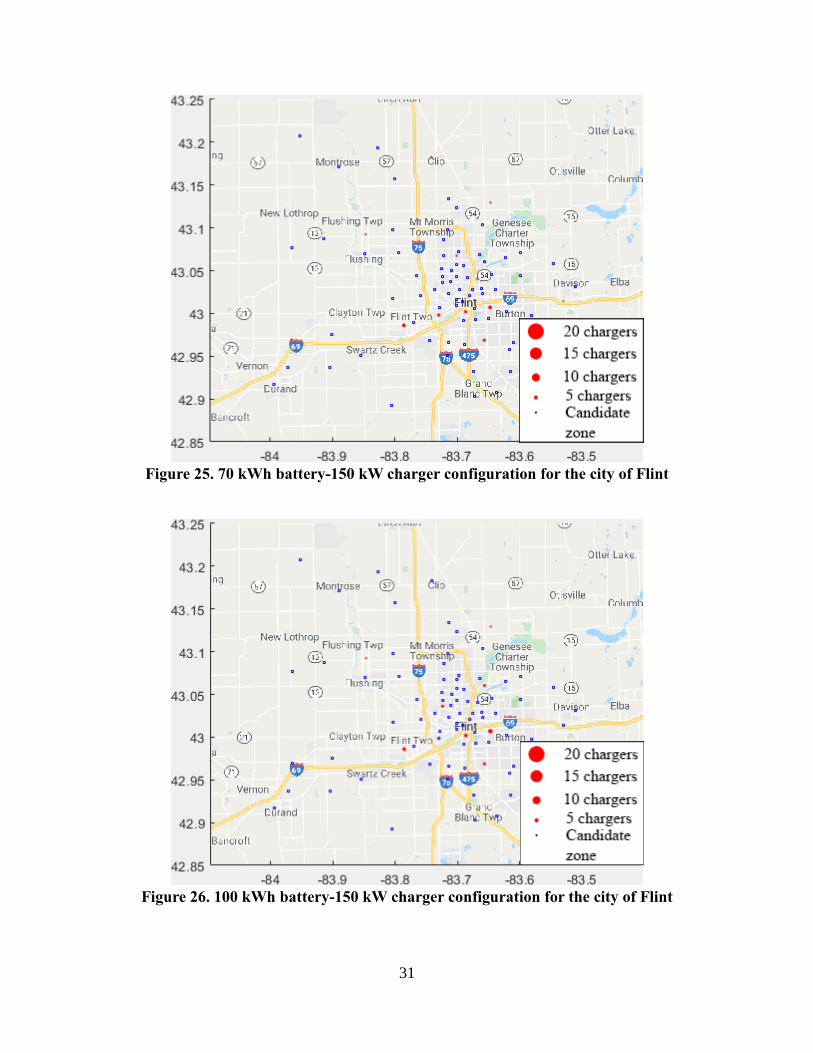
31
Figure 25. 70 kWh battery-150 kW charger configuration for the city of Flint
Figure 26. 100 kWh battery-150 kW charger configuration for the city of Flint
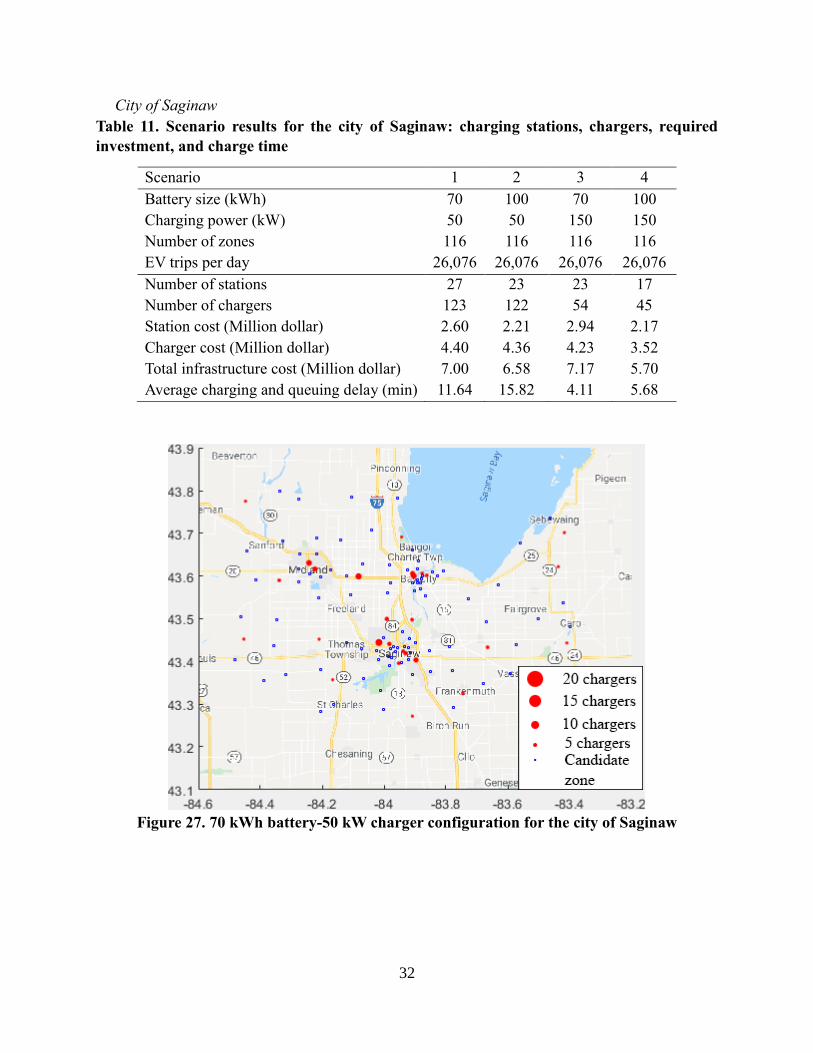
32
City of Saginaw
Table 11. Scenario results for the city of Saginaw: charging stations, chargers, required
investment, and charge time
Scenario 1 2 3 4
Battery size (kWh) 70 100 70 100
Charging power (kW) 50 50 150 150
Number of zones 116 116 116 116
EV trips per day 26,076 26,076 26,076 26,076
Number of stations 27 23 23 17
Number of chargers 123 122 54 45
Station cost (Million dollar) 2.60 2.21 2.94 2.17
Charger cost (Million dollar) 4.40 4.36 4.23 3.52
Total infrastructure cost (Million dollar) 7.00 6.58 7.17 5.70
Average charging and queuing delay (min) 11.64 15.82 4.11 5.68
Figure 27. 70 kWh battery-50 kW charger configuration for the city of Saginaw
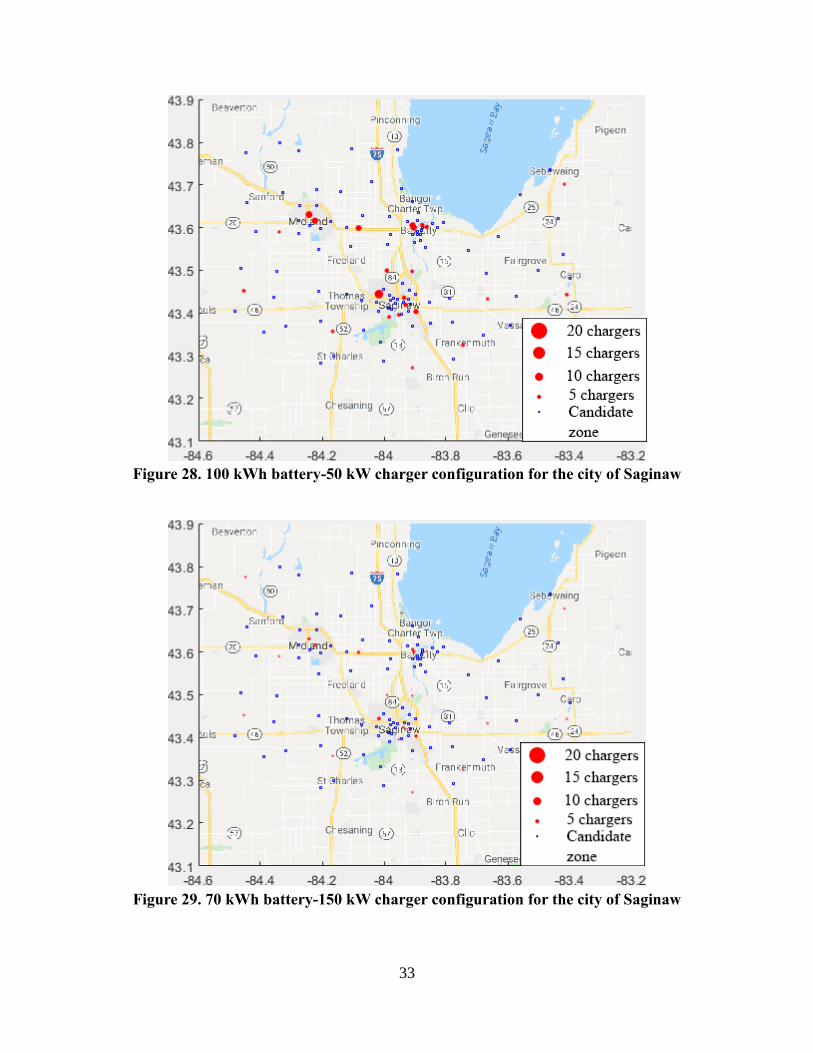
33
Figure 28. 100 kWh battery-50 kW charger configuration for the city of Saginaw
Figure 29. 70 kWh battery-150 kW charger configuration for the city of Saginaw
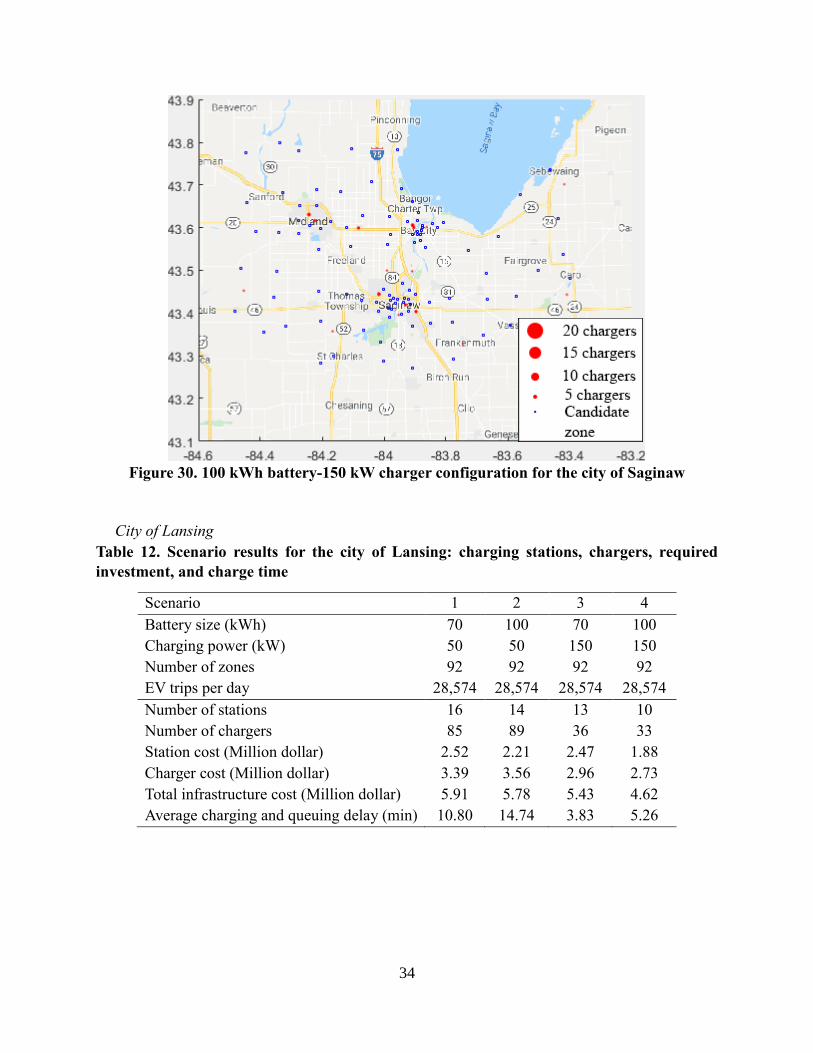
34
Figure 30. 100 kWh battery-150 kW charger configuration for the city of Saginaw
City of Lansing
Table 12. Scenario results for the city of Lansing: charging stations, chargers, required
investment, and charge time
Scenario 1 2 3 4
Battery size (kWh) 70 100 70 100
Charging power (kW) 50 50 150 150
Number of zones 92 92 92 92
EV trips per day 28,574 28,574 28,574 28,574
Number of stations 16 14 13 10
Number of chargers 85 89 36 33
Station cost (Million dollar) 2.52 2.21 2.47 1.88
Charger cost (Million dollar) 3.39 3.56 2.96 2.73
Total infrastructure cost (Million dollar) 5.91 5.78 5.43 4.62
Average charging and queuing delay (min) 10.80 14.74 3.83 5.26
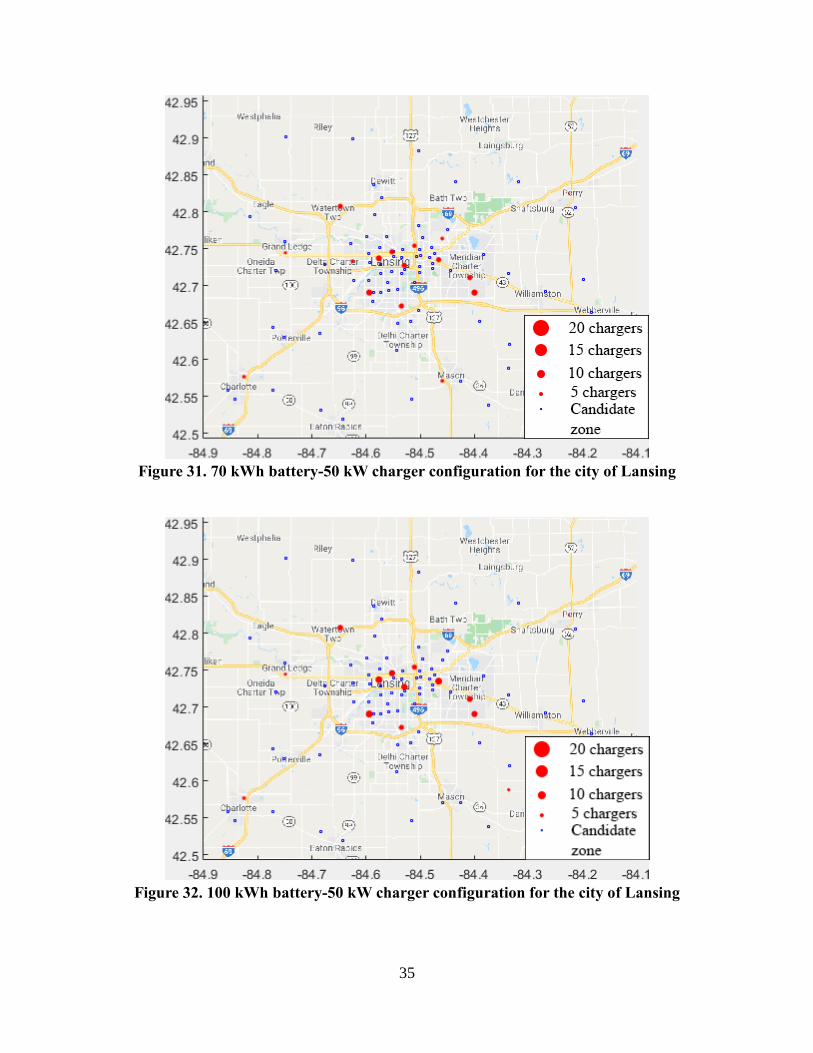
35
Figure 31. 70 kWh battery-50 kW charger configuration for the city of Lansing
Figure 32. 100 kWh battery-50 kW charger configuration for the city of Lansing
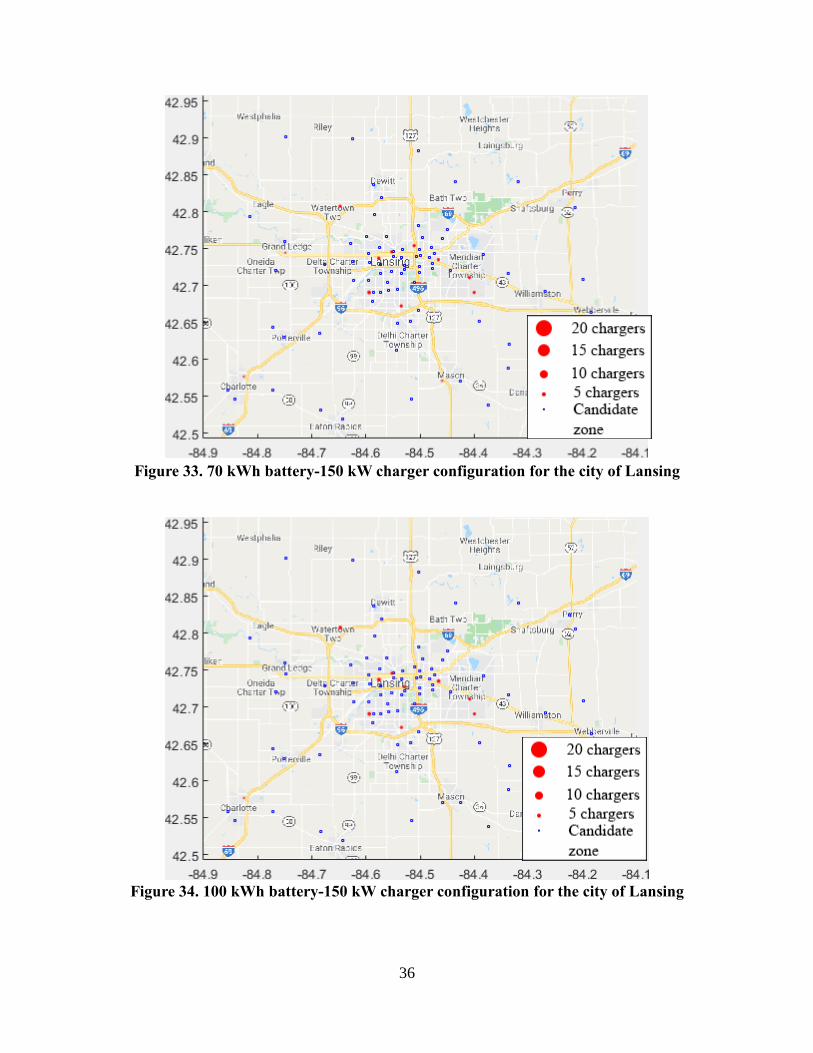
36
Figure 33. 70 kWh battery-150 kW charger configuration for the city of Lansing
Figure 34. 100 kWh battery-150 kW charger configuration for the city of Lansing
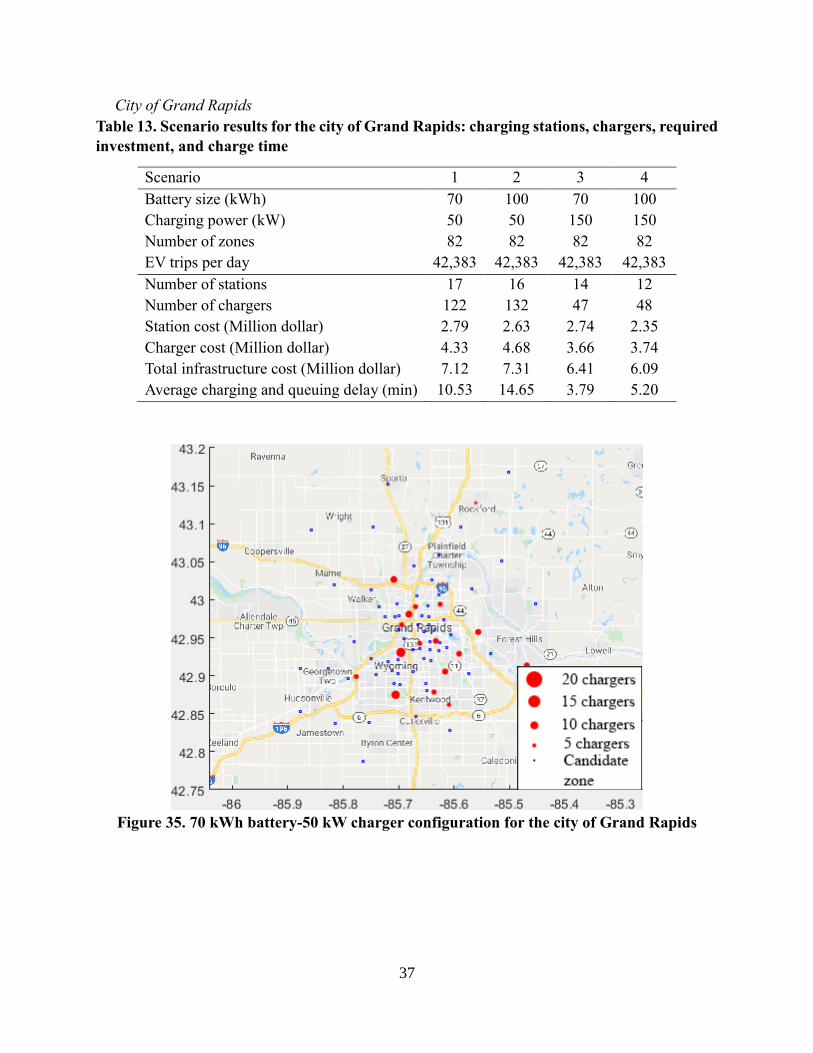
37
City of Grand Rapids
Table 13. Scenario results for the city of Grand Rapids: charging stations, chargers, required
investment, and charge time
Scenario 1 2 3 4
Battery size (kWh) 70 100 70 100
Charging power (kW) 50 50 150 150
Number of zones 82 82 82 82
EV trips per day 42,383 42,383 42,383 42,383
Number of stations 17 16 14 12
Number of chargers 122 132 47 48
Station cost (Million dollar) 2.79 2.63 2.74 2.35
Charger cost (Million dollar) 4.33 4.68 3.66 3.74
Total infrastructure cost (Million dollar) 7.12 7.31 6.41 6.09
Average charging and queuing delay (min) 10.53 14.65 3.79 5.20
Figure 35. 70 kWh battery-50 kW charger configuration for the city of Grand Rapids
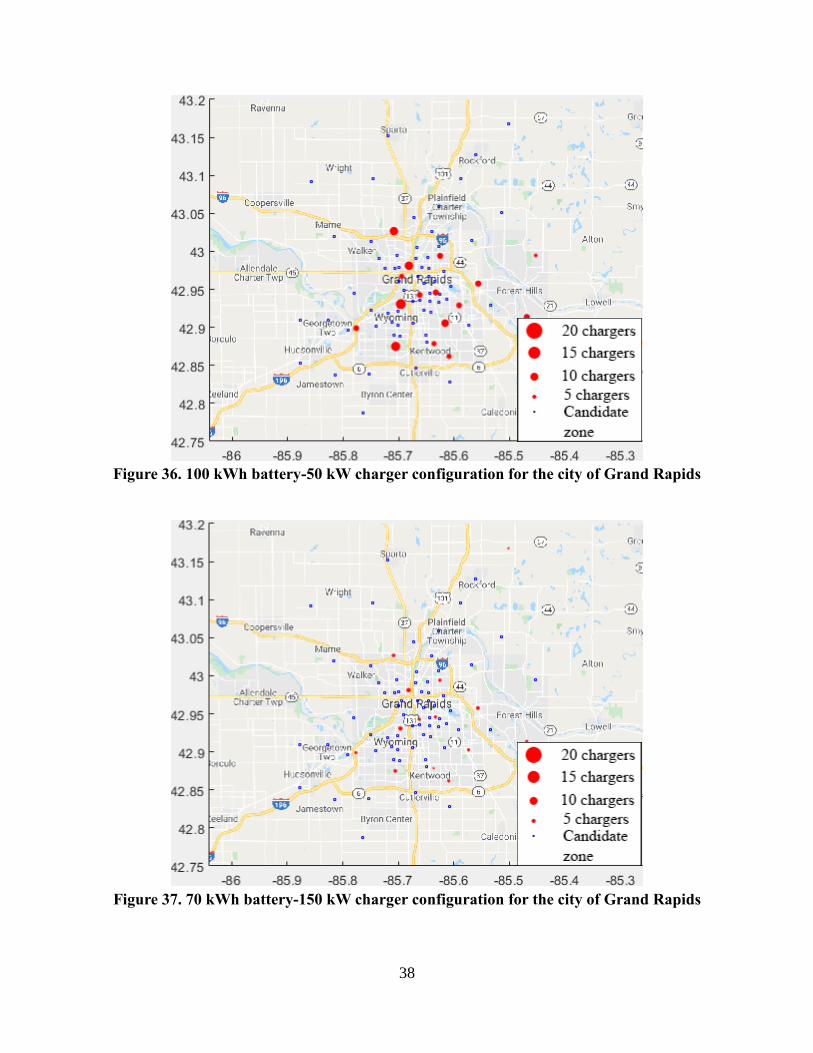
38
Figure 36. 100 kWh battery-50 kW charger configuration for the city of Grand Rapids
Figure 37. 70 kWh battery-150 kW charger configuration for the city of Grand Rapids
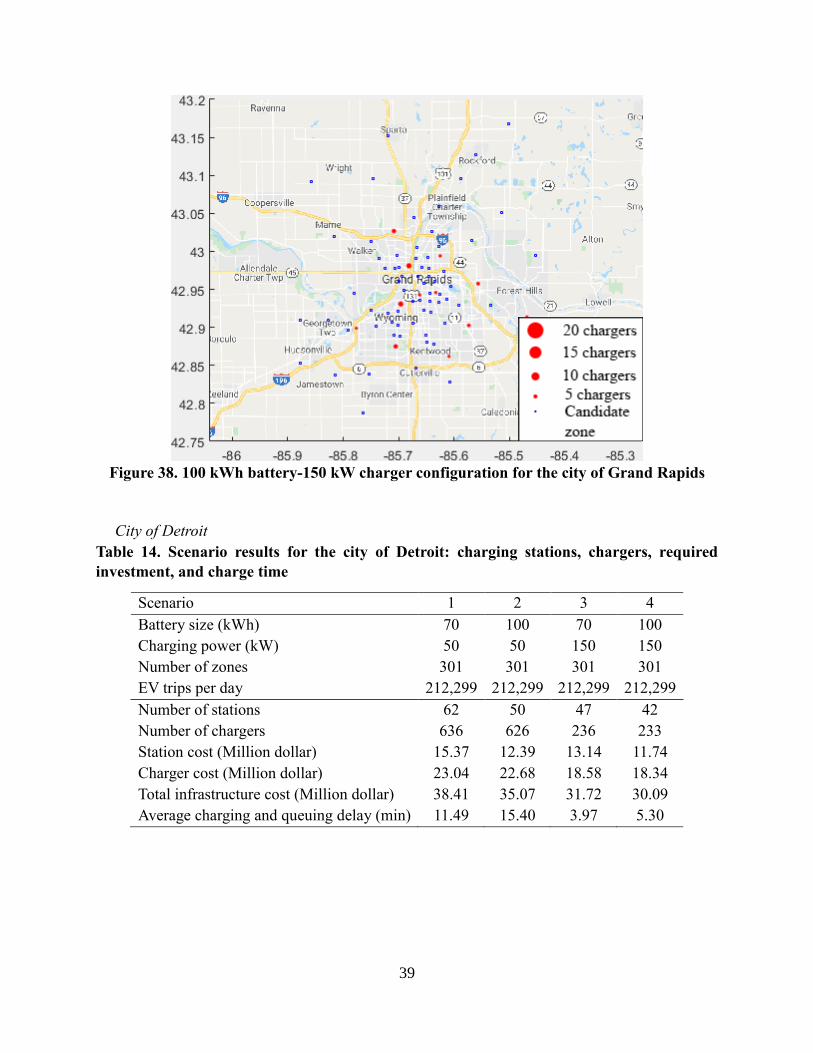
39
Figure 38. 100 kWh battery-150 kW charger configuration for the city of Grand Rapids
City of Detroit
Table 14. Scenario results for the city of Detroit: charging stations, chargers, required
investment, and charge time
Scenario 1 2 3 4
Battery size (kWh) 70 100 70 100
Charging power (kW) 50 50 150 150
Number of zones 301 301 301 301
EV trips per day 212,299 212,299 212,299 212,299
Number of stations 62 50 47 42
Number of chargers 636 626 236 233
Station cost (Million dollar) 15.37 12.39 13.14 11.74
Charger cost (Million dollar) 23.04 22.68 18.58 18.34
Total infrastructure cost (Million dollar) 38.41 35.07 31.72 30.09
Average charging and queuing delay (min) 11.49 15.40 3.97 5.30
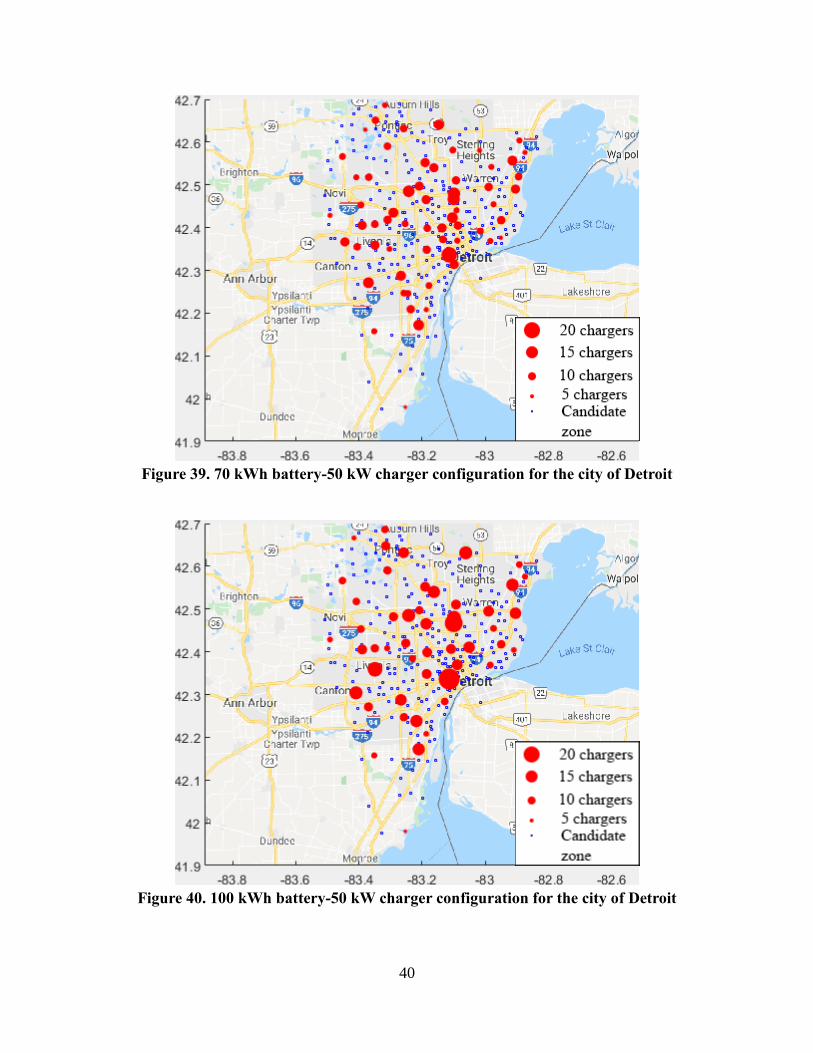
40
Figure 39. 70 kWh battery-50 kW charger configuration for the city of Detroit
Figure 40. 100 kWh battery-50 kW charger configuration for the city of Detroit
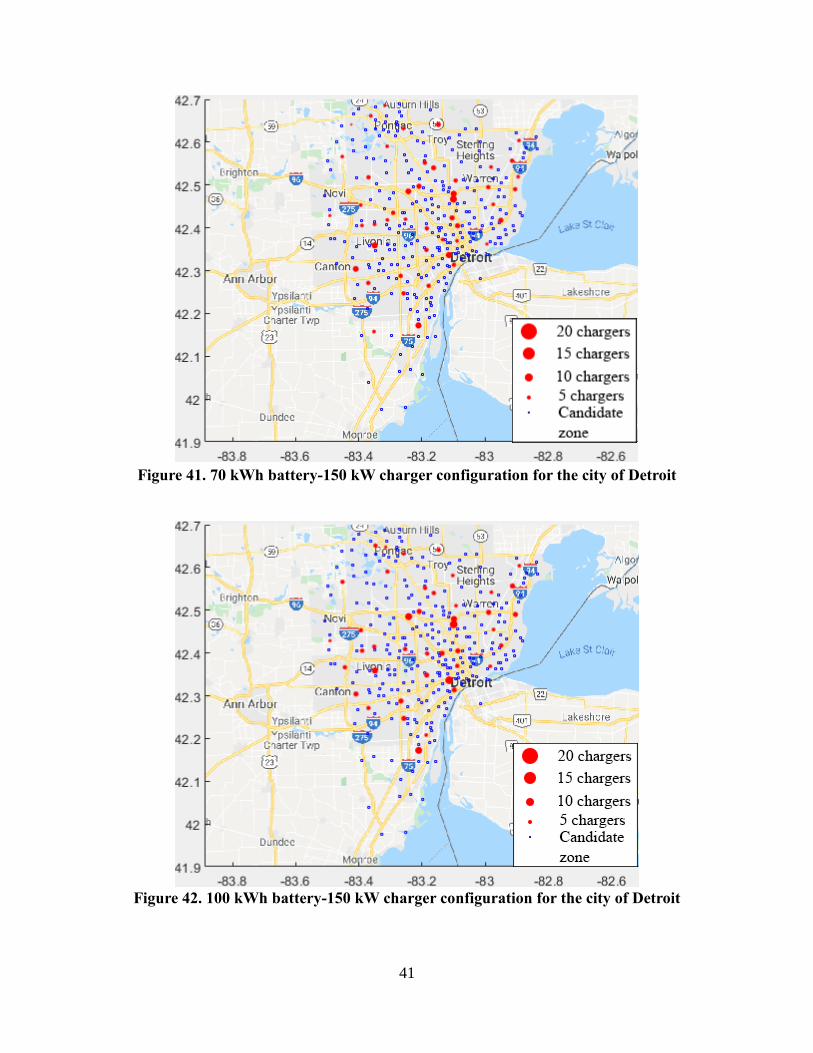
41
Figure 41. 70 kWh battery-150 kW charger configuration for the city of Detroit
Figure 42. 100 kWh battery-150 kW charger configuration for the city of Detroit
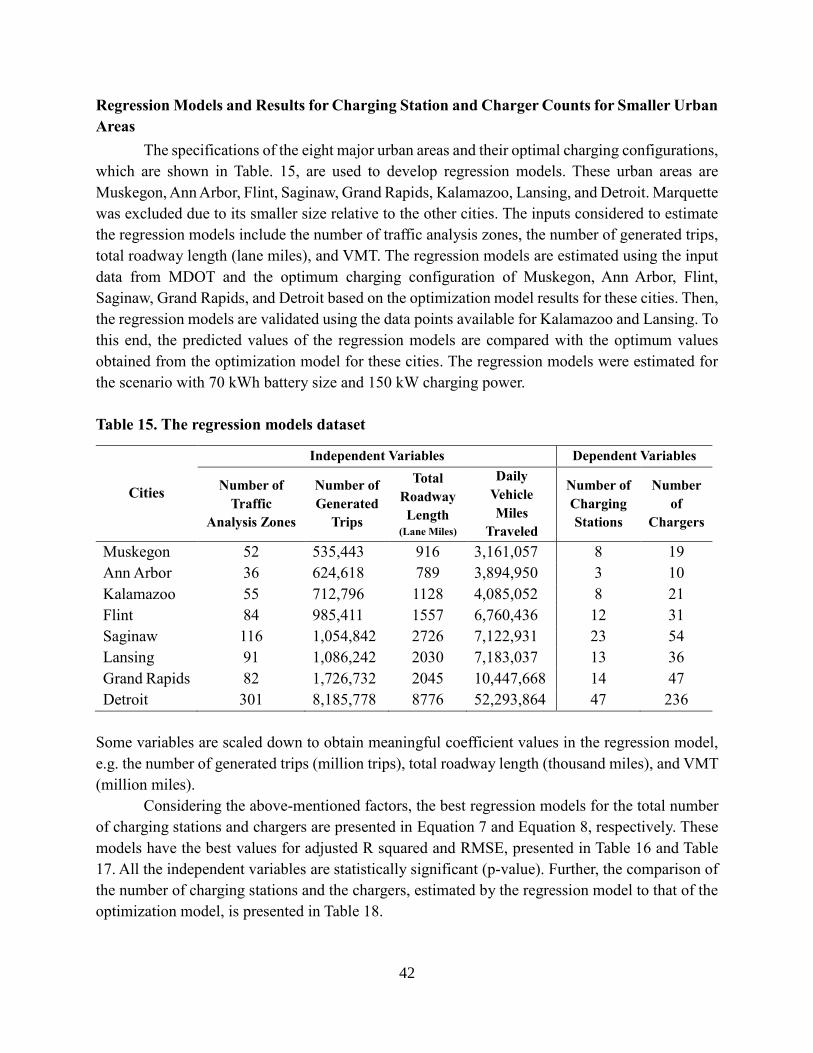
42
Regression Models and Results for Charging Station and Charger Counts for Smaller Urban
Areas
The specifications of the eight major urban areas and their optimal charging configurations,
which are shown in Table. 15, are used to develop regression models. These urban areas are
Muskegon, Ann Arbor, Flint, Saginaw, Grand Rapids, Kalamazoo, Lansing, and Detroit. Marquette
was excluded due to its smaller size relative to the other cities. The inputs considered to estimate
the regression models include the number of traffic analysis zones, the number of generated trips,
total roadway length (lane miles), and VMT. The regression models are estimated using the input
data from MDOT and the optimum charging configuration of Muskegon, Ann Arbor, Flint,
Saginaw, Grand Rapids, and Detroit based on the optimization model results for these cities. Then,
the regression models are validated using the data points available for Kalamazoo and Lansing. To
this end, the predicted values of the regression models are compared with the optimum values
obtained from the optimization model for these cities. The regression models were estimated for
the scenario with 70 kWh battery size and 150 kW charging power.
Table 15. The regression models dataset
Cities
Independent Variables Dependent Variables
Number of
Traffic
Analysis Zones
Number of
Generated
Trips
Total
Roadway
Length (Lane Miles)
Daily
Vehicle
Miles
Traveled
Number of
Charging
Stations
Number
of
Chargers
Muskegon 52 535,443 916 3,161,057 8 19
Ann Arbor 36 624,618 789 3,894,950 3 10
Kalamazoo 55 712,796 1128 4,085,052 8 21
Flint 84 985,411 1557 6,760,436 12 31
Saginaw 116 1,054,842 2726 7,122,931 23 54
Lansing 91 1,086,242 2030 7,183,037 13 36
Grand Rapids 82 1,726,732 2045 10,447,668 14 47
Detroit 301 8,185,778 8776 52,293,864 47 236
Some variables are scaled down to obtain meaningful coefficient values in the regression model,
e.g. the number of generated trips (million trips), total roadway length (thousand miles), and VMT
(million miles).
Considering the above-mentioned factors, the best regression models for the total number
of charging stations and chargers are presented in Equation 7 and Equation 8, respectively. These
models have the best values for adjusted R squared and RMSE, presented in Table 16 and Table
17. All the independent variables are statistically significant (p-value). Further, the comparison of
the number of charging stations and the chargers, estimated by the regression model to that of the
optimization model, is presented in Table 18.
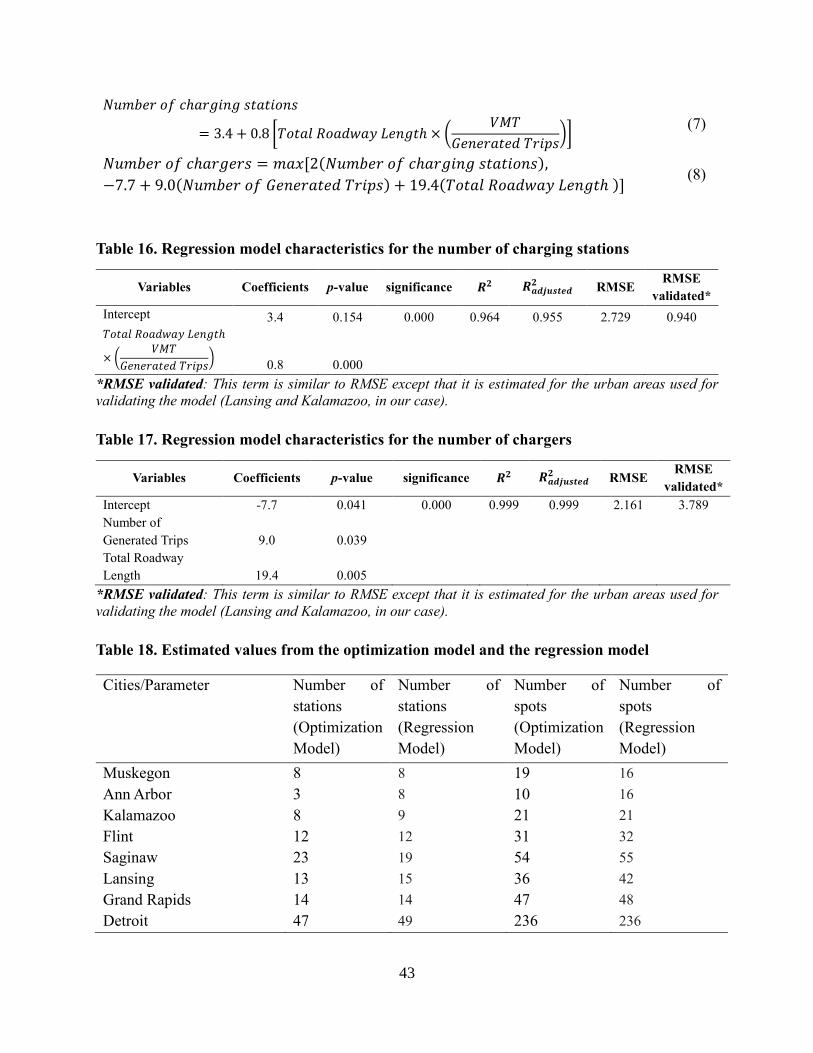
43
𝑁𝑢𝑚𝑏𝑒𝑟 𝑜𝑓 𝑐ℎ𝑎𝑟𝑔𝑖𝑛𝑔 𝑠𝑡𝑎𝑡𝑖𝑜𝑛𝑠
= 3.4 + 0.8 [𝑇𝑜𝑡𝑎𝑙 𝑅𝑜𝑎𝑑𝑤𝑎𝑦 𝐿𝑒𝑛𝑔𝑡ℎ × (𝑉𝑀𝑇
𝐺𝑒𝑛𝑒𝑟𝑎𝑡𝑒𝑑 𝑇𝑟𝑖𝑝𝑠)]
(7)
𝑁𝑢𝑚𝑏𝑒𝑟 𝑜𝑓 𝑐ℎ𝑎𝑟𝑔𝑒𝑟𝑠 = 𝑚𝑎𝑥 [2(𝑁𝑢𝑚𝑏𝑒𝑟 𝑜𝑓 𝑐ℎ𝑎𝑟𝑔𝑖𝑛𝑔 𝑠𝑡𝑎𝑡𝑖𝑜𝑛𝑠),
−7.7 + 9.0(𝑁𝑢𝑚𝑏𝑒𝑟 𝑜𝑓 𝐺𝑒𝑛𝑒𝑟𝑎𝑡𝑒𝑑 𝑇𝑟𝑖𝑝𝑠) + 19.4(𝑇𝑜𝑡𝑎𝑙 𝑅𝑜𝑎𝑑𝑤𝑎𝑦 𝐿𝑒𝑛𝑔𝑡ℎ )] (8)
Table 16. Regression model characteristics for the number of charging stations
Variables Coefficients p-value significance 𝑹𝟐 𝑹𝒂𝒅𝒋𝒖𝒔𝒕𝒆𝒅𝟐 RMSE
RMSE
validated*
Intercept 3.4 0.154 0.000 0.964 0.955 2.729 0.940
𝑇𝑜𝑡𝑎𝑙 𝑅𝑜𝑎𝑑𝑤𝑎𝑦 𝐿𝑒𝑛𝑔𝑡ℎ
× (𝑉𝑀𝑇
𝐺𝑒𝑛𝑒𝑟𝑎𝑡𝑒𝑑 𝑇𝑟𝑖𝑝𝑠)
0.8 0.000
*RMSE validated: This term is similar to RMSE except that it is estimated for the urban areas used for
validating the model (Lansing and Kalamazoo, in our case).
Table 17. Regression model characteristics for the number of chargers
Variables Coefficients p-value significance 𝑹𝟐 𝑹𝒂𝒅𝒋𝒖𝒔𝒕𝒆𝒅𝟐 RMSE
RMSE
validated*
Intercept -7.7 0.041 0.000 0.999 0.999 2.161 3.789
Number of
Generated Trips 9.0 0.039
Total Roadway
Length 19.4 0.005
*RMSE validated: This term is similar to RMSE except that it is estimated for the urban areas used for
validating the model (Lansing and Kalamazoo, in our case).
Table 18. Estimated values from the optimization model and the regression model
Cities/Parameter Number of
stations
(Optimization
Model)
Number of
stations
(Regression
Model)
Number of
spots
(Optimization
Model)
Number of
spots
(Regression
Model)
Muskegon 8 8 19 16
Ann Arbor 3 8 10 16
Kalamazoo 8 9 21 21
Flint 12 12 31 32
Saginaw 23 19 54 55
Lansing 13 15 36 42
Grand Rapids 14 14 47 48
Detroit 47 49 236 236
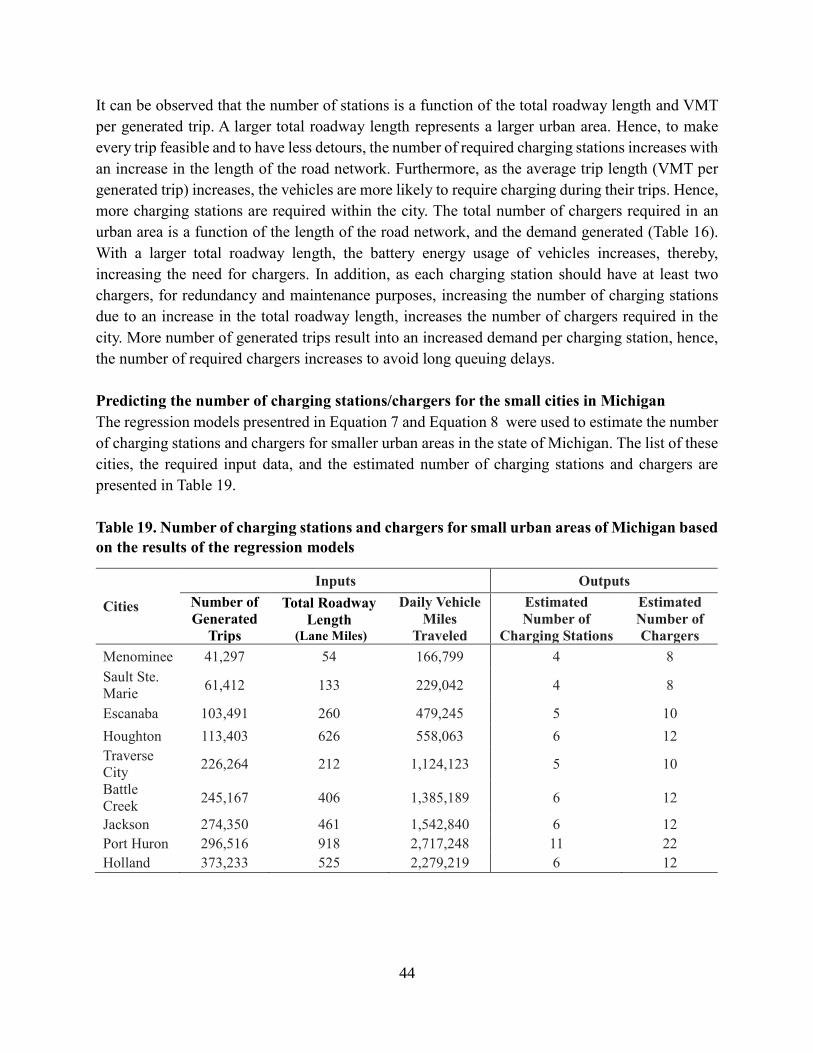
44
It can be observed that the number of stations is a function of the total roadway length and VMT
per generated trip. A larger total roadway length represents a larger urban area. Hence, to make
every trip feasible and to have less detours, the number of required charging stations increases with
an increase in the length of the road network. Furthermore, as the average trip length (VMT per
generated trip) increases, the vehicles are more likely to require charging during their trips. Hence,
more charging stations are required within the city. The total number of chargers required in an
urban area is a function of the length of the road network, and the demand generated (Table 16).
With a larger total roadway length, the battery energy usage of vehicles increases, thereby,
increasing the need for chargers. In addition, as each charging station should have at least two
chargers, for redundancy and maintenance purposes, increasing the number of charging stations
due to an increase in the total roadway length, increases the number of chargers required in the
city. More number of generated trips result into an increased demand per charging station, hence,
the number of required chargers increases to avoid long queuing delays.
Predicting the number of charging stations/chargers for the small cities in Michigan
The regression models presentred in Equation 7 and Equation 8 were used to estimate the number
of charging stations and chargers for smaller urban areas in the state of Michigan. The list of these
cities, the required input data, and the estimated number of charging stations and chargers are
presented in Table 19.
Table 19. Number of charging stations and chargers for small urban areas of Michigan based
on the results of the regression models
Cities
Inputs Outputs
Number of
Generated
Trips
Total Roadway
Length (Lane Miles)
Daily Vehicle
Miles
Traveled
Estimated
Number of
Charging Stations
Estimated
Number of
Chargers
Menominee 41,297 54 166,799 4 8
Sault Ste.
Marie 61,412 133 229,042 4 8
Escanaba 103,491 260 479,245 5 10
Houghton 113,403 626 558,063 6 12
Traverse
City 226,264 212 1,124,123 5 10
Battle
Creek 245,167 406 1,385,189 6 12
Jackson 274,350 461 1,542,840 6 12
Port Huron 296,516 918 2,717,248 11 22
Holland 373,233 525 2,279,219 6 12

45
CONCLUSION
This study developed a methodological framework to find the optimum investment plan for
building a network of charging stations for different urban areas in the state of Michigan. This
report presents the research approach and results for different urban areas in Michigan to ensure
the feasibility of the urban trips of EV users in the state by 2030. Major urban areas usually have
more resources to gather travel and road network data, while this type of information is usually
very limited in smaller urban areas. Depending on the availability of data, the results for major
urban areas in Michigan are provided based on the optimization-based approach and hence
presented in more details, while the results for smaller urban areas are based on the regression
models and presented in a more aggregate form. The results of this report can be used by local
governments to plan their investments on building EV charging infrastructures within their
communities. This study suggests a list of locations for charging stations and the number of
chargers at each location, with an approximate cost of building such network for major urban areas
in the state. The tables and figures of these results are available in the results section, as well as
the appendices. For smaller urban areas in Michigan the minimum number of chargers and
charging stations is suggested in this report for each urban area. During the series of stakeholder
meetings, different scenarios with different vehicles and charger technologies were suggested and
tested for this study. The winter scenario with 70 percent battery performance is selected and
battery energy levels of 70 kWh and 100 kWh, and charger power levels of 50 kW and 150 kW
are tested.
The tested scenarios revealed the following findings:
• The 150 kW chargers reduce the charging and waiting time, compared to that of the 50kW
chargers.
• Due to the higher throughput of 150kW charger, the number of 150 kW chargers needed
to support the trips of EV users in urban areas is less than that of the 50 kW chargers.
Therefore, implementing a network of 150 kW chargers is less costly.
• Building a network of 150 kW chargers when the vehicles cannot accept a 150 kW power,
would still support the feasibility of trips in urban areas, while resulting in longer delays.
• The total length of the roadway is the main factor affecting the number of charging stations.
• The number of generated trips and the total length of the roadways affect the number of
chargers.
• The battery size does not affect the number of chargers, as the length of the urban trips is
significantly lower than the range of the EVs.
• The suggested numbers and locations are based on a predicted 6 percent market penetration
rate in 2030. It is suggested that the city planners start building the network of charging
stations in increments and track the utilization rate at each location before proceeding with
full deployment. Detailed analysis for the annual increments can be done for each urban
area per request.
46
The optimization-based modeling framework designed and proposed in this study finds the
location of charging stations and number of chargers for the major urban areas in the state of
Michigan, listed as: Muskegon, Ann Arbor, Kalamazoo, Flint, Saginaw, Lansing, Grand Rapids,
and Detroit. As all of the major urban areas are located in lower peninsula, Marquette, the largest
city in the upper peninsula is added to the list for the detailed analysis. The number of stations for
the different scenarios for these cities ranges between 3-62 stations and 8-636 chargers. Aggregate
level regression models are developed to find the number of charging stations and chargers in the
smaller cities, with limited data availability, such as: Menominee, Sault Ste. Marie, Escanaba,
Houghton, Traverse City, Battle Creek, Jackson, Port Huron, and Holland. The models proposed
in this study can be used for other cities based-on availability of data as the need arises. The number
of stations for the 150 kW charger and 70 kWh battery scenario for these cities ranges between 4-
11 stations and 8-22 chargers.
REFERENCES
Andrews, M., Do˘ Gru, M.K., Hobby, J.D., Jin, Y., Tucci, G.H., 2012. Modeling and Optimization
for Electric Vehicle Charging Infrastructure.
Atlas EV Hub, 2018. Market Data [WWW Document].
Bai, Y., Hwang, T., Kang, S., Ouyang, Y., 2011. Biofuel refinery location and supply chain
planning under traffic congestion. Transp. Res. Part B Methodol. 45, 162–175.
https://doi.org/10.1016/J.TRB.2010.04.006
Baouche, F., Billot, R., Trigui, R., El Faouzi, N.E., 2014. Efficient allocation of electric vehicles
charging stations: Optimization model and application to a dense urban network. IEEE Intell.
Transp. Syst. Mag. 6, 33–43. https://doi.org/10.1109/MITS.2014.2324023
Barnston, A.G., 1992. Correspondence among the correlation, RMSE, and Heidke Foresast
verification measures; Refinement of the Heidke Score. Weather Forecast. 7, 699–709.
https://doi.org/10.1175/1520-0434(1992)007<0699:CATCRA>2.0.CO;2
Berman, O., Larson, R.C., Fouska, N., 1992. Optimal Location of Discretionary Service Facilities.
Transp. Sci. 26, 201–211.
Cai, H., Jia, X., Chiu, A.S.F., Hu, X., Xu, M., 2014. Siting public electric vehicle charging stations
in Beijing using big-data informed travel patterns of the taxi fleet. Transp. Res. Part D Transp.
Environ. 33, 39–46. https://doi.org/10.1016/j.trd.2014.09.003
Cavadas, J., de Almeida Correia, G.H., Gouveia, J., 2015. A MIP model for locating slow-charging
stations for electric vehicles in urban areas accounting for driver tours. Transp. Res. Part E
Logist. Transp. Rev. 75, 188–201. https://doi.org/10.1016/j.tre.2014.11.005
Chen, Z., Liu, W., Yin, Y., 2017. Deployment of stationary and dynamic charging infrastructure
for electric vehicles along traffic corridors. Transp. Res. Part C Emerg. Technol. 77, 185–206.
https://doi.org/10.1016/j.trc.2017.01.021
47
Dana Lowell, Brian Jones, and D.S., 2017. Electric Vehicle Cost-Benefit Analysis Plug-in Electric
Vehicle Cost-Benefit Analysis: Michigan.
Dong, J., Liu, C., Lin, Z., 2014. Charging infrastructure planning for promoting battery electric
vehicles: An activity-based approach using multiday travel data. Transp. Res. Part C Emerg.
Technol. 38, 44–55. https://doi.org/10.1016/J.TRC.2013.11.001
Eberhard, M., Tarpenning, M., 2006. The 21 st Century Electric Car.
Eppstein, M.J., Grover, D.K., Marshall, J.S., Rizzo, D.M., 2011. An agent-based model to study
market penetration of plug-in hybrid electric vehicles. Energy Policy 39, 3789–3802.
https://doi.org/10.1016/J.ENPOL.2011.04.007
Ghamami, M., Kavianipour, M., Zockaie, A., Hohnstadt, L., Ouyang, Y., 2019a. Refueling
infrastructure planning in intercity networks considering route choice and travel time delay
for mixed fleet of electric and conventional vehicles. Transp. Res. Part C.
Ghamami, M., Zockaie, A., Nie, Y. (Marco), 2016. A general corridor model for designing plug-in
electric vehicle charging infrastructure to support intercity travel. Transp. Res. Part C Emerg.
Technol. 68, 389–402. https://doi.org/10.1016/J.TRC.2016.04.016
Ghamami, M., Zockaie, A., Wang, J., Miller, S., Kavianipour, M., Shojaie, M., Fakhrmoosavi, F.,
Hohnstadt, L., Singh, H., 2019b. Electric Vehicle Charger Placement Optimization in
Michigan: Phase I – Highways.
Grassmann, W., 1983. The Convexity of the Mean Queue Size of the M/M/c Queue with Respect
to the Traffic, Source: Journal of Applied Probability.
Hajibabai, L., Bai, Y., Ouyang, Y., 2014. Joint optimization of freight facility location and
pavement infrastructure rehabilitation under network traffic equilibrium. Transp. Res. Part B
Methodol. 63, 38–52. https://doi.org/10.1016/J.TRB.2014.02.003
He, F., Wu, D., Yin, Y., Guan, Y., 2013. Optimal deployment of public charging stations for plug-
in hybrid electric vehicles. Transp. Res. Part B Methodol. 47, 87–101.
https://doi.org/10.1016/J.TRB.2012.09.007
He, F., Yin, Y., Zhou, J., 2015. Deploying public charging stations for electric vehicles on urban
road networks. Transp. Res. Part C Emerg. Technol. 60, 227–240.
https://doi.org/10.1016/j.trc.2015.08.018
He, J., Yang, H., Tang, T.-Q., Huang, H.-J., 2018. An optimal charging station location model with
the consideration of electric vehicle’s driving range. Transp. Res. Part C Emerg. Technol. 86,
641–654. https://doi.org/10.1016/J.TRC.2017.11.026
He, S.Y., Kuo, Y.H., Wu, D., 2016. Incorporating institutional and spatial factors in the selection
of the optimal locations of public electric vehicle charging facilities: A case study of Beijing,
China. Transp. Res. Part C Emerg. Technol. 67, 131–148.
https://doi.org/10.1016/j.trc.2016.02.003
Hodgson, M.J., 1990. A Flow-Capturing Location-Allocation Model. Geogr. Anal. 22, 270–279.
48
https://doi.org/10.1111/j.1538-4632.1990.tb00210.x
Huang, Y., Li, S., Qian, Z.S., 2015. Optimal Deployment of Alternative Fueling Stations on
Transportation Networks Considering Deviation Paths. Networks Spat. Econ. 15, 183–204.
https://doi.org/10.1007/s11067-014-9275-1
Huang, Y., Zhou, Y., 2015. An optimization framework for workplace charging strategies. Transp.
Res. Part C Emerg. Technol. 52, 144–155. https://doi.org/10.1016/j.trc.2015.01.022
Jayakrishnan, R., Mahmassani, H.S., Hu, T.-Y., 1994. An evaluation tool for advanced traffic
information and management systems in urban networks. Transp. Res. Part C Emerg.
Technol. 2, 129–147.
Kang, J.E., Recker, W.W., 2009. An activity-based assessment of the potential impacts of plug-in
hybrid electric vehicles on energy and emissions using 1-day travel data. Transp. Res. Part D
Transp. Environ. 14, 541–556. https://doi.org/10.1016/j.trd.2009.07.012
Kavianipour, M., Zockaie, A., Ghamami, M., 2020. Urban Charging Planning Considering Range
Anxiety and Users Delay.
Krisher, T., 2019. AAA: Cold weather can cut electric car range over 40 percent [WWW
Document]. URL https://apnews.com/04029bd1e0a94cd59ff9540a398c12d1 (accessed
11.4.19).
Kuby, M., Lim, S., 2007. Location of Alternative-Fuel Stations Using the Flow-Refueling Location
Model and Dispersion of Candidate Sites on Arcs. Networks Spat. Econ. 7, 129–152.
https://doi.org/10.1007/s11067-006-9003-6
Kuby, M., Lim, S., 2005. The flow-refueling location problem for alternative-fuel vehicles.
Socioecon. Plann. Sci. 39, 125–145. https://doi.org/10.1016/J.SEPS.2004.03.001
Li, S., Huang, Y., Mason, S.J., 2016. A multi-period optimization model for the deployment of
public electric vehicle charging stations on network. Transp. Res. Part C Emerg. Technol. 65,
128–143. https://doi.org/10.1016/j.trc.2016.01.008
Lim, S., Kuby, M., 2010. Heuristic algorithms for siting alternative-fuel stations using the Flow-
Refueling Location Model. Eur. J. Oper. Res. 204, 51–61.
https://doi.org/10.1016/J.EJOR.2009.09.032
Lin, C., Choy, K.L., Ho, G.T.S., Chung, S.H., Lam, H.Y., 2014. Survey of Green Vehicle Routing
Problem: Past and future trends. Expert Syst. Appl. 41, 1118–1138.
https://doi.org/10.1016/J.ESWA.2013.07.107
Lin, Z., Greene, D., 2010. Who Will More Likely Buy PHEV: A Detailed Market Segmentation
Analysis The 25th World Battery, Hybrid and Fuel Cell Electric Vehicle Symposium &
Exhibition Who Will More Likely Buy PHEV: A Detailed Market Segmentation Analysis.
Lin, Z., Greene, D.L., 2011. Promoting the Market for Plug-In Hybrid and Battery Electric
Vehicles. Transp. Res. Rec. J. Transp. Res. Board 2252, 49–56. https://doi.org/10.3141/2252-
07
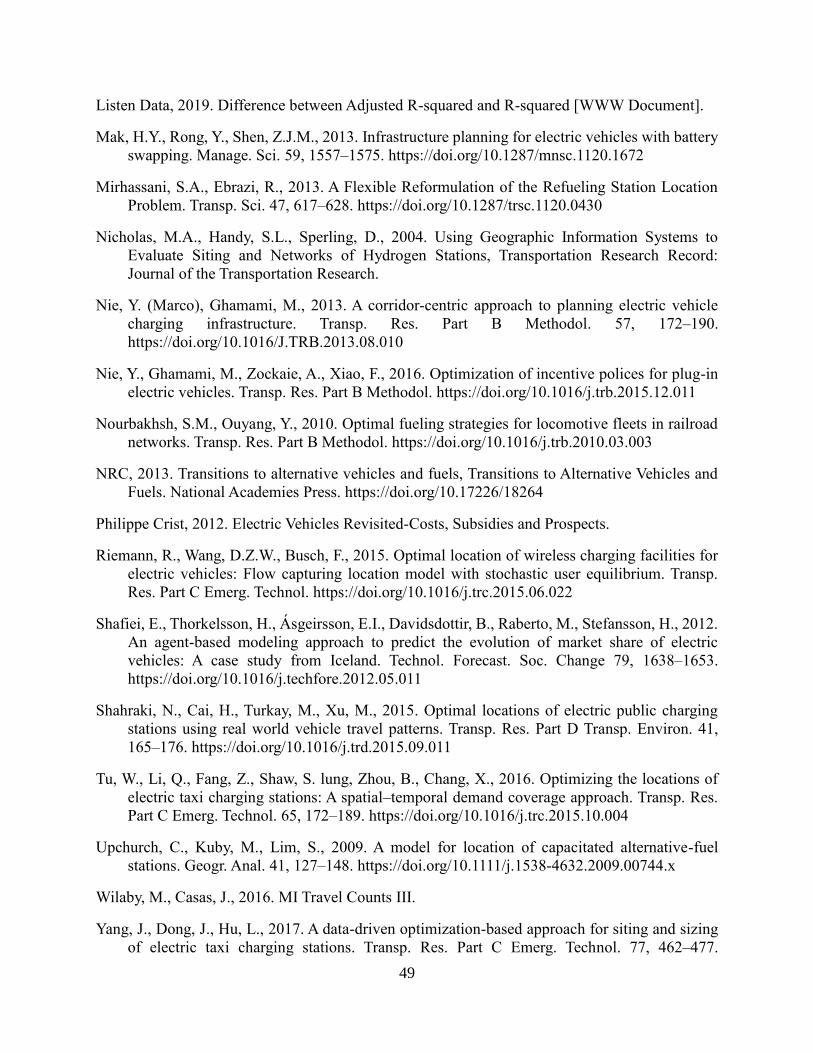
49
Listen Data, 2019. Difference between Adjusted R-squared and R-squared [WWW Document].
Mak, H.Y., Rong, Y., Shen, Z.J.M., 2013. Infrastructure planning for electric vehicles with battery
swapping. Manage. Sci. 59, 1557–1575. https://doi.org/10.1287/mnsc.1120.1672
Mirhassani, S.A., Ebrazi, R., 2013. A Flexible Reformulation of the Refueling Station Location
Problem. Transp. Sci. 47, 617–628. https://doi.org/10.1287/trsc.1120.0430
Nicholas, M.A., Handy, S.L., Sperling, D., 2004. Using Geographic Information Systems to
Evaluate Siting and Networks of Hydrogen Stations, Transportation Research Record:
Journal of the Transportation Research.
Nie, Y. (Marco), Ghamami, M., 2013. A corridor-centric approach to planning electric vehicle
charging infrastructure. Transp. Res. Part B Methodol. 57, 172–190.
https://doi.org/10.1016/J.TRB.2013.08.010
Nie, Y., Ghamami, M., Zockaie, A., Xiao, F., 2016. Optimization of incentive polices for plug-in
electric vehicles. Transp. Res. Part B Methodol. https://doi.org/10.1016/j.trb.2015.12.011
Nourbakhsh, S.M., Ouyang, Y., 2010. Optimal fueling strategies for locomotive fleets in railroad
networks. Transp. Res. Part B Methodol. https://doi.org/10.1016/j.trb.2010.03.003
NRC, 2013. Transitions to alternative vehicles and fuels, Transitions to Alternative Vehicles and
Fuels. National Academies Press. https://doi.org/10.17226/18264
Philippe Crist, 2012. Electric Vehicles Revisited-Costs, Subsidies and Prospects.
Riemann, R., Wang, D.Z.W., Busch, F., 2015. Optimal location of wireless charging facilities for
electric vehicles: Flow capturing location model with stochastic user equilibrium. Transp.
Res. Part C Emerg. Technol. https://doi.org/10.1016/j.trc.2015.06.022
Shafiei, E., Thorkelsson, H., Ásgeirsson, E.I., Davidsdottir, B., Raberto, M., Stefansson, H., 2012.
An agent-based modeling approach to predict the evolution of market share of electric
vehicles: A case study from Iceland. Technol. Forecast. Soc. Change 79, 1638–1653.
https://doi.org/10.1016/j.techfore.2012.05.011
Shahraki, N., Cai, H., Turkay, M., Xu, M., 2015. Optimal locations of electric public charging
stations using real world vehicle travel patterns. Transp. Res. Part D Transp. Environ. 41,
165–176. https://doi.org/10.1016/j.trd.2015.09.011
Tu, W., Li, Q., Fang, Z., Shaw, S. lung, Zhou, B., Chang, X., 2016. Optimizing the locations of
electric taxi charging stations: A spatial–temporal demand coverage approach. Transp. Res.
Part C Emerg. Technol. 65, 172–189. https://doi.org/10.1016/j.trc.2015.10.004
Upchurch, C., Kuby, M., Lim, S., 2009. A model for location of capacitated alternative-fuel
stations. Geogr. Anal. 41, 127–148. https://doi.org/10.1111/j.1538-4632.2009.00744.x
Wilaby, M., Casas, J., 2016. MI Travel Counts III.
Yang, J., Dong, J., Hu, L., 2017. A data-driven optimization-based approach for siting and sizing
of electric taxi charging stations. Transp. Res. Part C Emerg. Technol. 77, 462–477.
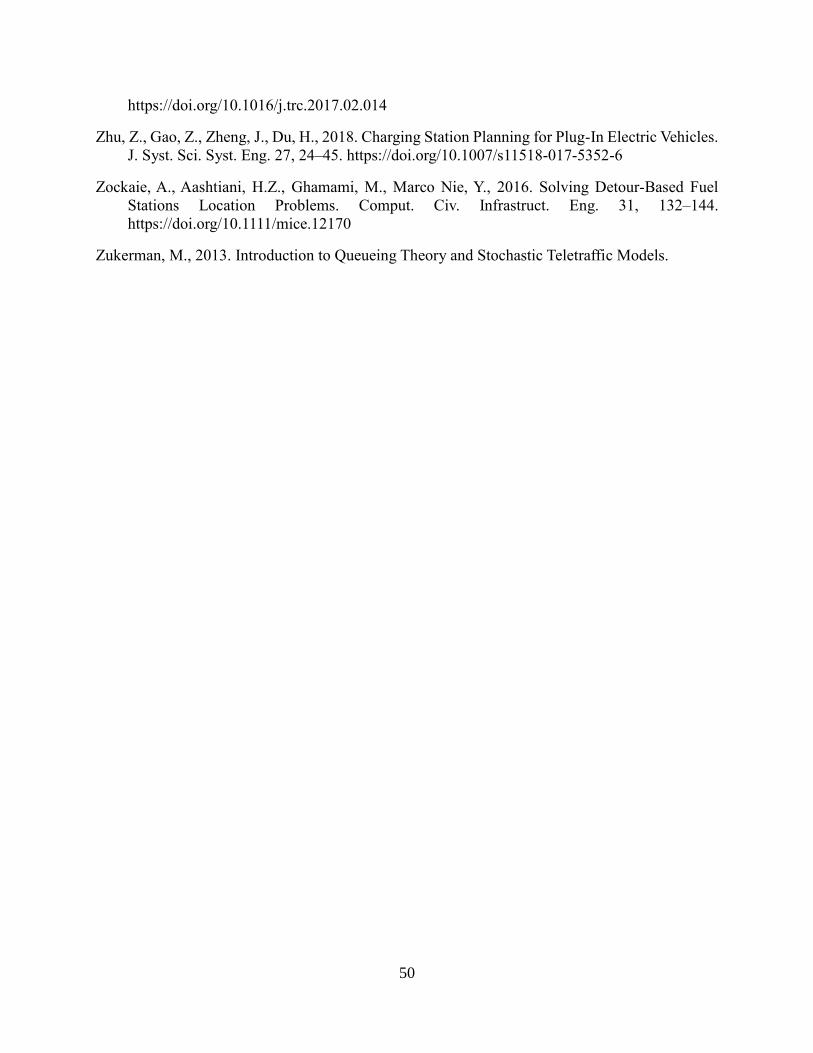
50
https://doi.org/10.1016/j.trc.2017.02.014
Zhu, Z., Gao, Z., Zheng, J., Du, H., 2018. Charging Station Planning for Plug-In Electric Vehicles.
J. Syst. Sci. Syst. Eng. 27, 24–45. https://doi.org/10.1007/s11518-017-5352-6
Zockaie, A., Aashtiani, H.Z., Ghamami, M., Marco Nie, Y., 2016. Solving Detour-Based Fuel
Stations Location Problems. Comput. Civ. Infrastruct. Eng. 31, 132–144.
https://doi.org/10.1111/mice.12170
Zukerman, M., 2013. Introduction to Queueing Theory and Stochastic Teletraffic Models.
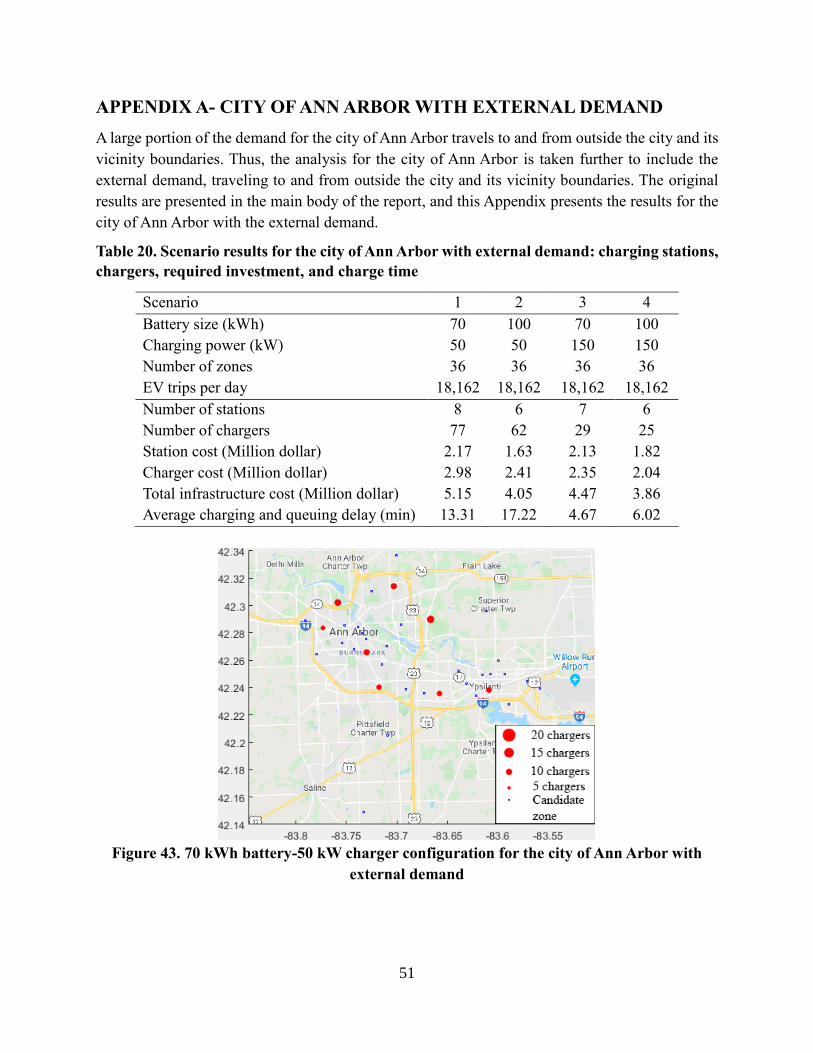
51
APPENDIX A- CITY OF ANN ARBOR WITH EXTERNAL DEMAND
A large portion of the demand for the city of Ann Arbor travels to and from outside the city and its
vicinity boundaries. Thus, the analysis for the city of Ann Arbor is taken further to include the
external demand, traveling to and from outside the city and its vicinity boundaries. The original
results are presented in the main body of the report, and this Appendix presents the results for the
city of Ann Arbor with the external demand.
Table 20. Scenario results for the city of Ann Arbor with external demand: charging stations,
chargers, required investment, and charge time
Scenario 1 2 3 4
Battery size (kWh) 70 100 70 100
Charging power (kW) 50 50 150 150
Number of zones 36 36 36 36
EV trips per day 18,162 18,162 18,162 18,162
Number of stations 8 6 7 6
Number of chargers 77 62 29 25
Station cost (Million dollar) 2.17 1.63 2.13 1.82
Charger cost (Million dollar) 2.98 2.41 2.35 2.04
Total infrastructure cost (Million dollar) 5.15 4.05 4.47 3.86
Average charging and queuing delay (min) 13.31 17.22 4.67 6.02
Figure 43. 70 kWh battery-50 kW charger configuration for the city of Ann Arbor with
external demand
52
Figure 44. 100 kWh battery-50 kW charger configuration for the city of Ann Arbor with
external demand
Figure 45. 70 kWh battery-150 kW charger configuration for the city of Ann Arbor with
external demand
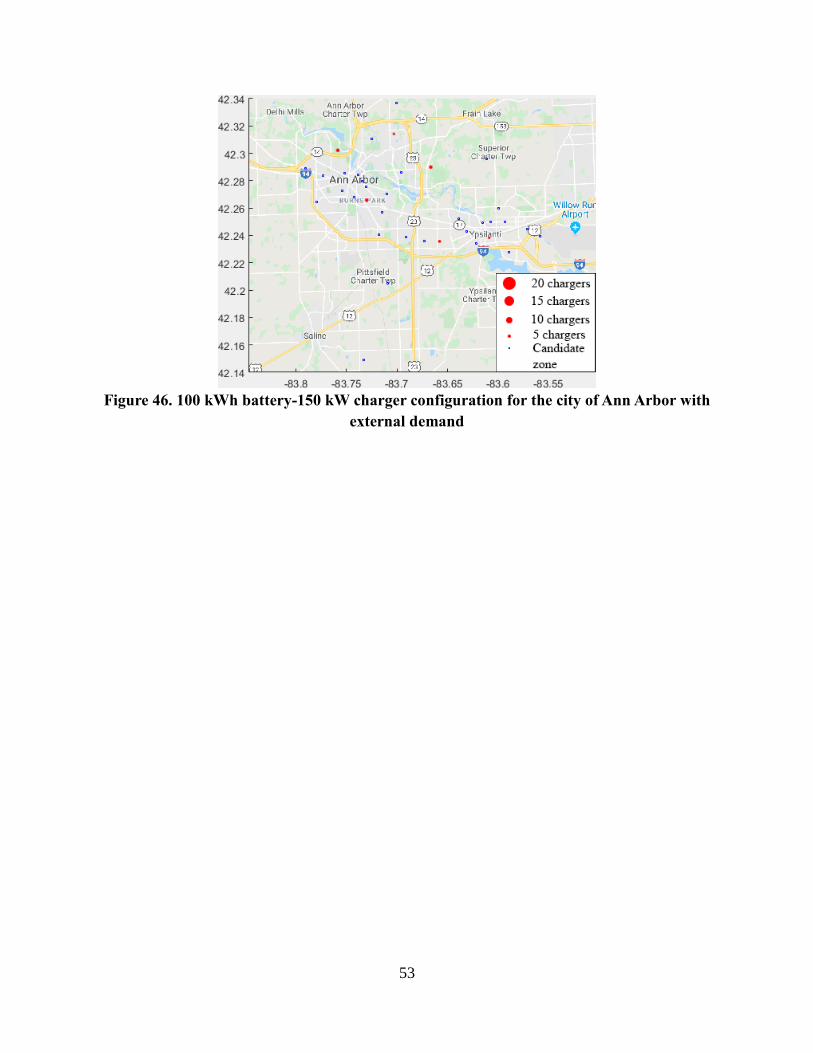
53
Figure 46. 100 kWh battery-150 kW charger configuration for the city of Ann Arbor with
external demand
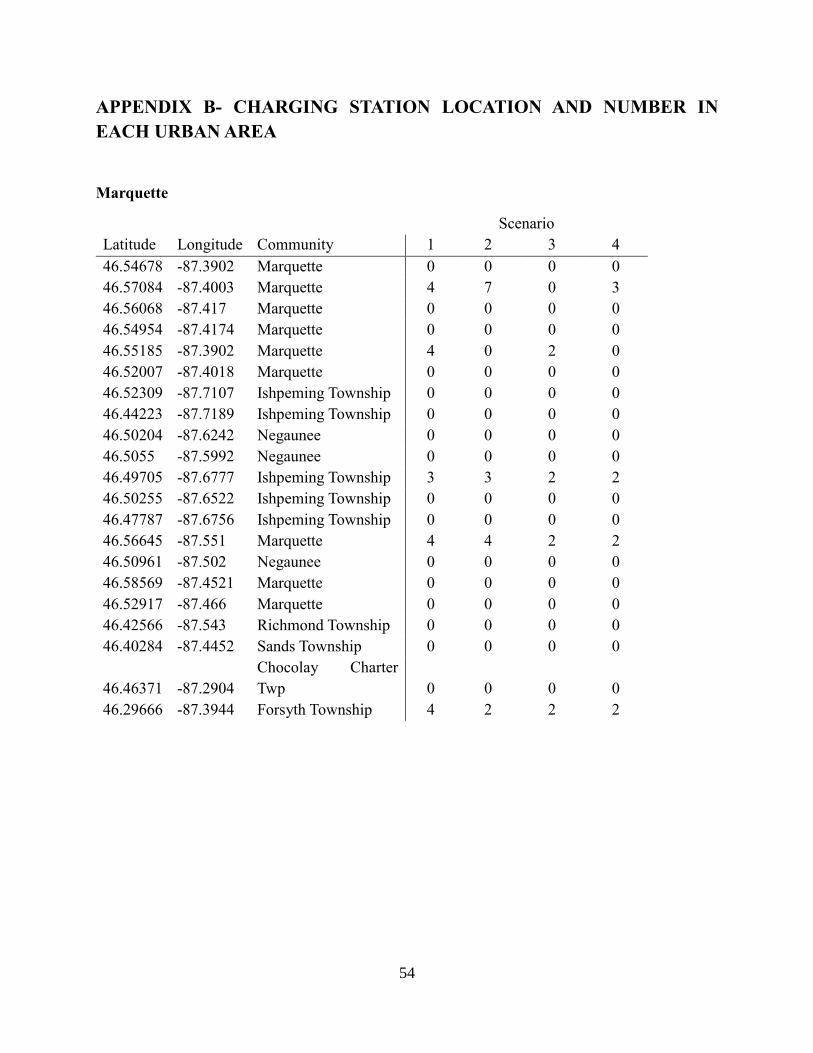
54
APPENDIX B- CHARGING STATION LOCATION AND NUMBER IN
EACH URBAN AREA
Marquette
Scenario
Latitude Longitude Community 1 2 3 4
46.54678 -87.3902 Marquette 0 0 0 0
46.57084 -87.4003 Marquette 4 7 0 3
46.56068 -87.417 Marquette 0 0 0 0
46.54954 -87.4174 Marquette 0 0 0 0
46.55185 -87.3902 Marquette 4 0 2 0
46.52007 -87.4018 Marquette 0 0 0 0
46.52309 -87.7107 Ishpeming Township 0 0 0 0
46.44223 -87.7189 Ishpeming Township 0 0 0 0
46.50204 -87.6242 Negaunee 0 0 0 0
46.5055 -87.5992 Negaunee 0 0 0 0
46.49705 -87.6777 Ishpeming Township 3 3 2 2
46.50255 -87.6522 Ishpeming Township 0 0 0 0
46.47787 -87.6756 Ishpeming Township 0 0 0 0
46.56645 -87.551 Marquette 4 4 2 2
46.50961 -87.502 Negaunee 0 0 0 0
46.58569 -87.4521 Marquette 0 0 0 0
46.52917 -87.466 Marquette 0 0 0 0
46.42566 -87.543 Richmond Township 0 0 0 0
46.40284 -87.4452 Sands Township 0 0 0 0
46.46371 -87.2904
Chocolay Charter
Twp 0 0 0 0
46.29666 -87.3944 Forsyth Township 4 2 2 2
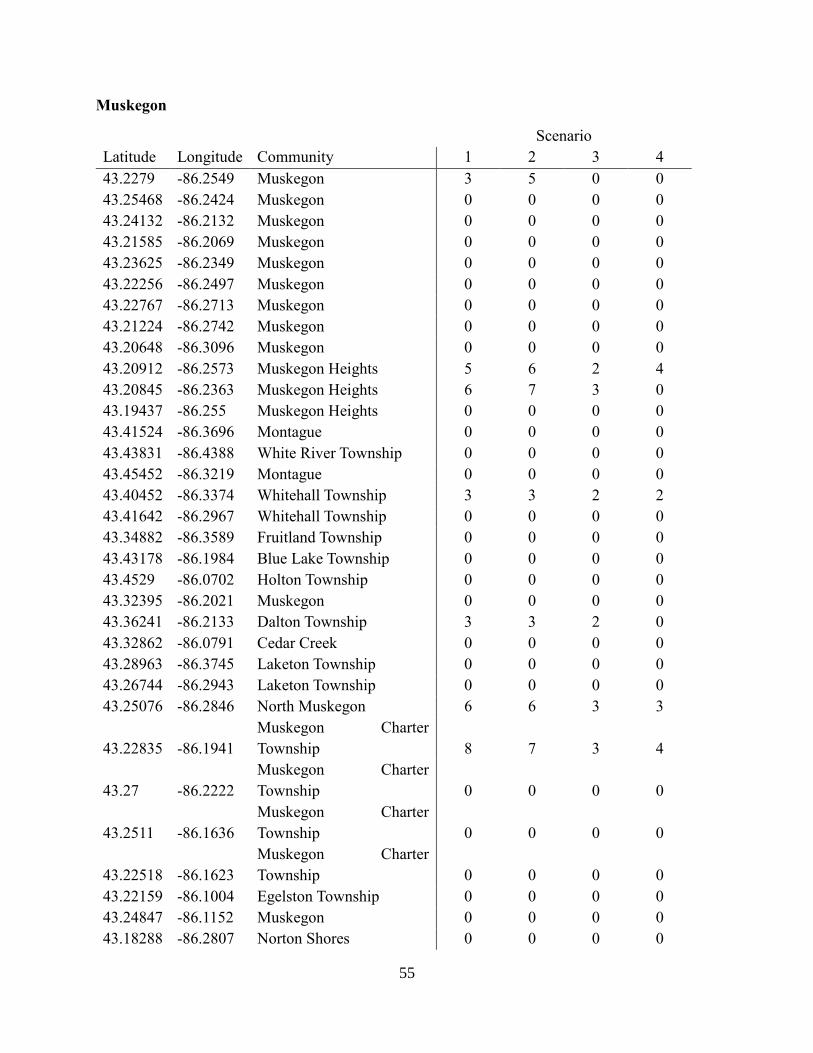
55
Muskegon
Scenario
Latitude Longitude Community 1 2 3 4
43.2279 -86.2549 Muskegon 3 5 0 0
43.25468 -86.2424 Muskegon 0 0 0 0
43.24132 -86.2132 Muskegon 0 0 0 0
43.21585 -86.2069 Muskegon 0 0 0 0
43.23625 -86.2349 Muskegon 0 0 0 0
43.22256 -86.2497 Muskegon 0 0 0 0
43.22767 -86.2713 Muskegon 0 0 0 0
43.21224 -86.2742 Muskegon 0 0 0 0
43.20648 -86.3096 Muskegon 0 0 0 0
43.20912 -86.2573 Muskegon Heights 5 6 2 4
43.20845 -86.2363 Muskegon Heights 6 7 3 0
43.19437 -86.255 Muskegon Heights 0 0 0 0
43.41524 -86.3696 Montague 0 0 0 0
43.43831 -86.4388 White River Township 0 0 0 0
43.45452 -86.3219 Montague 0 0 0 0
43.40452 -86.3374 Whitehall Township 3 3 2 2
43.41642 -86.2967 Whitehall Township 0 0 0 0
43.34882 -86.3589 Fruitland Township 0 0 0 0
43.43178 -86.1984 Blue Lake Township 0 0 0 0
43.4529 -86.0702 Holton Township 0 0 0 0
43.32395 -86.2021 Muskegon 0 0 0 0
43.36241 -86.2133 Dalton Township 3 3 2 0
43.32862 -86.0791 Cedar Creek 0 0 0 0
43.28963 -86.3745 Laketon Township 0 0 0 0
43.26744 -86.2943 Laketon Township 0 0 0 0
43.25076 -86.2846 North Muskegon 6 6 3 3
43.22835 -86.1941
Muskegon Charter
Township 8 7 3 4
43.27 -86.2222
Muskegon Charter
Township 0 0 0 0
43.2511 -86.1636
Muskegon Charter
Township 0 0 0 0
43.22518 -86.1623
Muskegon Charter
Township 0 0 0 0
43.22159 -86.1004 Egelston Township 0 0 0 0
43.24847 -86.1152 Muskegon 0 0 0 0
43.18288 -86.2807 Norton Shores 0 0 0 0

56
Muskegon
Scenario
Latitude Longitude Community 1 2 3 4
43.18422 -86.301 Norton Shores 0 0 0 0
43.19291 -86.2116 Norton Shores 0 0 0 0
43.16974 -86.2383 Norton Shores 0 0 0 0
43.1403 -86.2405 Norton Shores 5 5 2 2
43.20119 -86.278 Muskegon 0 0 0 0
43.13824 -86.1629 Fruitport Charter Twp 0 0 0 0
43.12558 -86.1628 Fruitport Charter Twp 0 0 0 0
43.1745 -86.1915 Fruitport Charter Twp 0 0 0 0
43.15997 -86.0413 Fruitport Charter Twp 0 0 0 0
43.0735 -86.1947 Spring Lake 5 6 2 3
43.10969 -86.2465 Spring Lake 0 0 0 0
43.06291 -86.1786 Spring Lake 0 0 0 0
43.0839 -86.2398 Ferrysburg 0 0 0 0
43.0693 -86.2294 Grand Haven 0 0 0 0
43.05309 -86.2251 Grand Haven 0 0 0 0
43.05897 -86.2176 Grand Haven 0 0 0 0
43.10681 -86.0822 Fruitport Charter Twp 0 0 0 0
43.0271 -86.174 Grand Haven 0 0 0 0
43.02365 -86.0556 Robinson Township 0 0 0 0
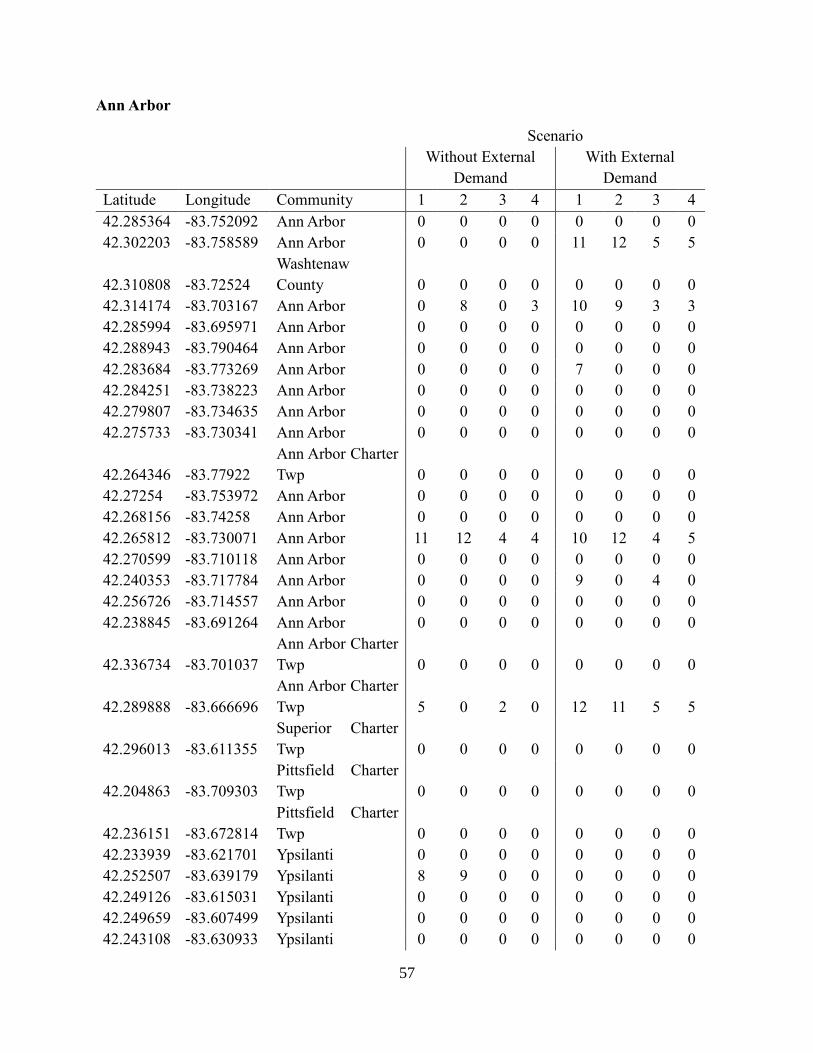
57
Ann Arbor
Scenario
Without External
Demand
With External
Demand
Latitude Longitude Community 1 2 3 4 1 2 3 4
42.285364 -83.752092 Ann Arbor 0 0 0 0 0 0 0 0
42.302203 -83.758589 Ann Arbor 0 0 0 0 11 12 5 5
42.310808 -83.72524
Washtenaw
County 0 0 0 0 0 0 0 0
42.314174 -83.703167 Ann Arbor 0 8 0 3 10 9 3 3
42.285994 -83.695971 Ann Arbor 0 0 0 0 0 0 0 0
42.288943 -83.790464 Ann Arbor 0 0 0 0 0 0 0 0
42.283684 -83.773269 Ann Arbor 0 0 0 0 7 0 0 0
42.284251 -83.738223 Ann Arbor 0 0 0 0 0 0 0 0
42.279807 -83.734635 Ann Arbor 0 0 0 0 0 0 0 0
42.275733 -83.730341 Ann Arbor 0 0 0 0 0 0 0 0
42.264346 -83.77922
Ann Arbor Charter
Twp 0 0 0 0 0 0 0 0
42.27254 -83.753972 Ann Arbor 0 0 0 0 0 0 0 0
42.268156 -83.74258 Ann Arbor 0 0 0 0 0 0 0 0
42.265812 -83.730071 Ann Arbor 11 12 4 4 10 12 4 5
42.270599 -83.710118 Ann Arbor 0 0 0 0 0 0 0 0
42.240353 -83.717784 Ann Arbor 0 0 0 0 9 0 4 0
42.256726 -83.714557 Ann Arbor 0 0 0 0 0 0 0 0
42.238845 -83.691264 Ann Arbor 0 0 0 0 0 0 0 0
42.336734 -83.701037
Ann Arbor Charter
Twp 0 0 0 0 0 0 0 0
42.289888 -83.666696
Ann Arbor Charter
Twp 5 0 2 0 12 11 5 5
42.296013 -83.611355
Superior Charter
Twp 0 0 0 0 0 0 0 0
42.204863 -83.709303
Pittsfield Charter
Twp 0 0 0 0 0 0 0 0
42.236151 -83.672814
Pittsfield Charter
Twp 0 0 0 0 0 0 0 0
42.233939 -83.621701 Ypsilanti 0 0 0 0 0 0 0 0
42.252507 -83.639179 Ypsilanti 8 9 0 0 0 0 0 0
42.249126 -83.615031 Ypsilanti 0 0 0 0 0 0 0 0
42.249659 -83.607499 Ypsilanti 0 0 0 0 0 0 0 0
42.243108 -83.630933 Ypsilanti 0 0 0 0 0 0 0 0
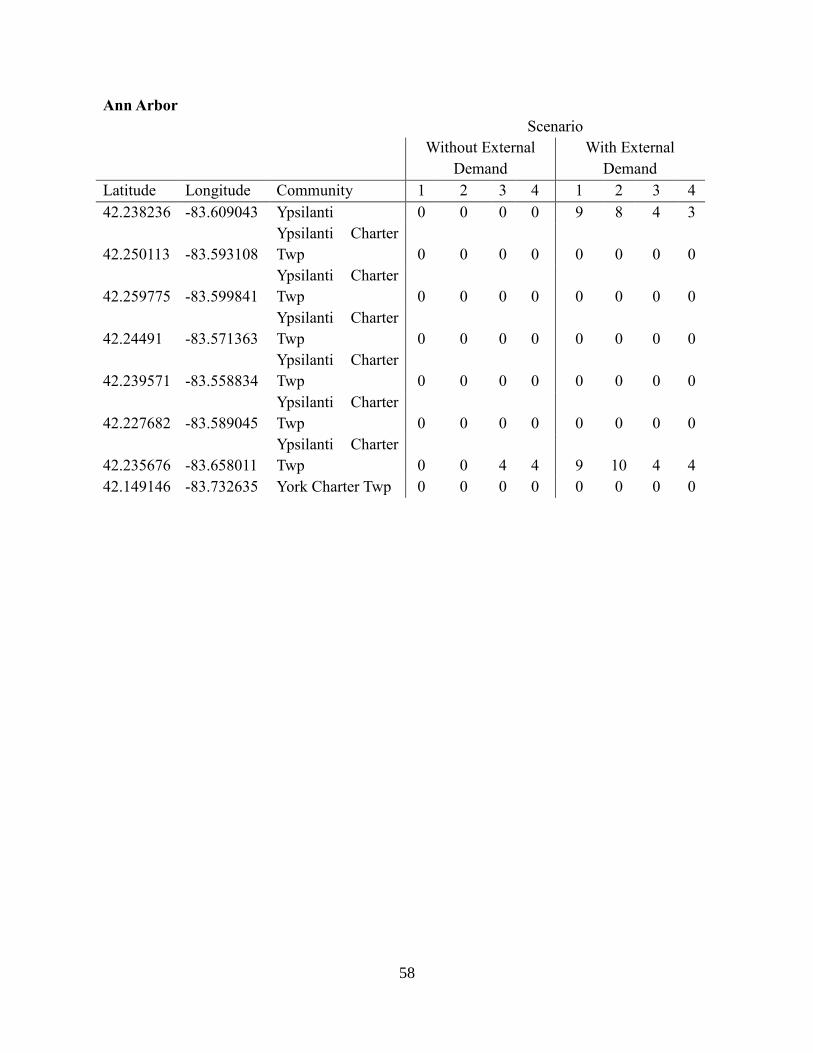
58
Ann Arbor
Scenario
Without External
Demand
With External
Demand
Latitude Longitude Community 1 2 3 4 1 2 3 4
42.238236 -83.609043 Ypsilanti 0 0 0 0 9 8 4 3
42.250113 -83.593108
Ypsilanti Charter
Twp 0 0 0 0 0 0 0 0
42.259775 -83.599841
Ypsilanti Charter
Twp 0 0 0 0 0 0 0 0
42.24491 -83.571363
Ypsilanti Charter
Twp 0 0 0 0 0 0 0 0
42.239571 -83.558834
Ypsilanti Charter
Twp 0 0 0 0 0 0 0 0
42.227682 -83.589045
Ypsilanti Charter
Twp 0 0 0 0 0 0 0 0
42.235676 -83.658011
Ypsilanti Charter
Twp 0 0 4 4 9 10 4 4
42.149146 -83.732635 York Charter Twp 0 0 0 0 0 0 0 0
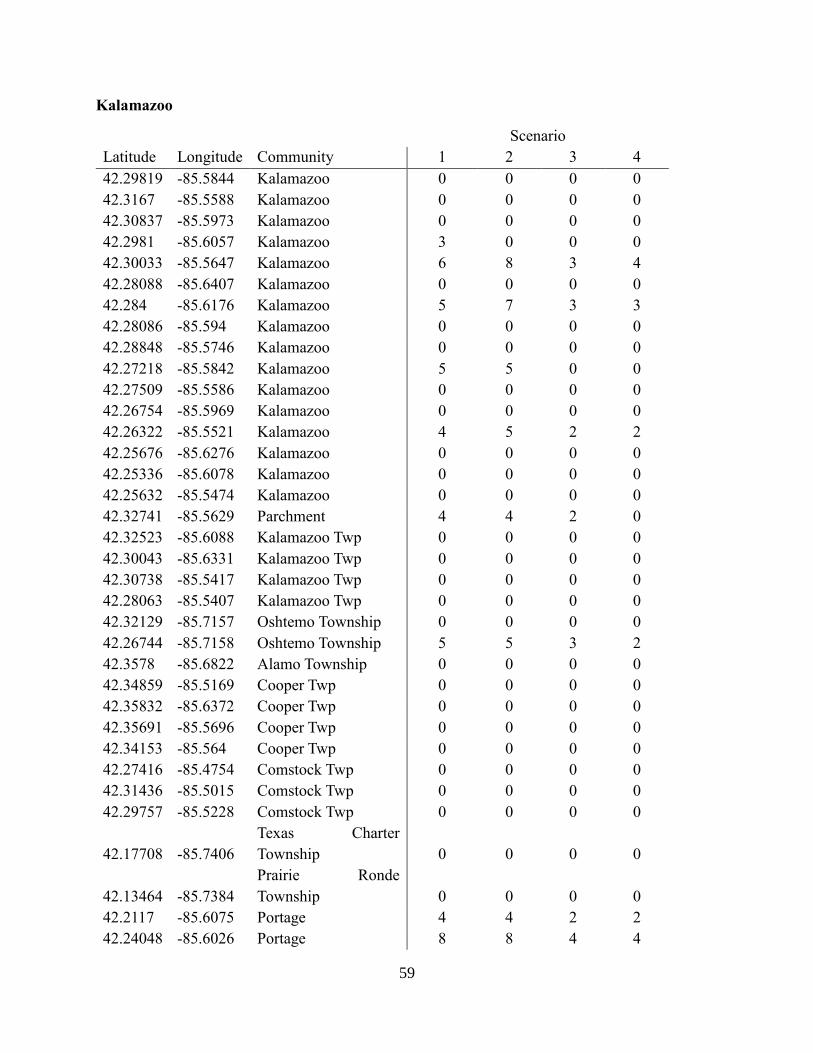
59
Kalamazoo
Scenario
Latitude Longitude Community 1 2 3 4
42.29819 -85.5844 Kalamazoo 0 0 0 0
42.3167 -85.5588 Kalamazoo 0 0 0 0
42.30837 -85.5973 Kalamazoo 0 0 0 0
42.2981 -85.6057 Kalamazoo 3 0 0 0
42.30033 -85.5647 Kalamazoo 6 8 3 4
42.28088 -85.6407 Kalamazoo 0 0 0 0
42.284 -85.6176 Kalamazoo 5 7 3 3
42.28086 -85.594 Kalamazoo 0 0 0 0
42.28848 -85.5746 Kalamazoo 0 0 0 0
42.27218 -85.5842 Kalamazoo 5 5 0 0
42.27509 -85.5586 Kalamazoo 0 0 0 0
42.26754 -85.5969 Kalamazoo 0 0 0 0
42.26322 -85.5521 Kalamazoo 4 5 2 2
42.25676 -85.6276 Kalamazoo 0 0 0 0
42.25336 -85.6078 Kalamazoo 0 0 0 0
42.25632 -85.5474 Kalamazoo 0 0 0 0
42.32741 -85.5629 Parchment 4 4 2 0
42.32523 -85.6088 Kalamazoo Twp 0 0 0 0
42.30043 -85.6331 Kalamazoo Twp 0 0 0 0
42.30738 -85.5417 Kalamazoo Twp 0 0 0 0
42.28063 -85.5407 Kalamazoo Twp 0 0 0 0
42.32129 -85.7157 Oshtemo Township 0 0 0 0
42.26744 -85.7158 Oshtemo Township 5 5 3 2
42.3578 -85.6822 Alamo Township 0 0 0 0
42.34859 -85.5169 Cooper Twp 0 0 0 0
42.35832 -85.6372 Cooper Twp 0 0 0 0
42.35691 -85.5696 Cooper Twp 0 0 0 0
42.34153 -85.564 Cooper Twp 0 0 0 0
42.27416 -85.4754 Comstock Twp 0 0 0 0
42.31436 -85.5015 Comstock Twp 0 0 0 0
42.29757 -85.5228 Comstock Twp 0 0 0 0
42.17708 -85.7406
Texas Charter
Township 0 0 0 0
42.13464 -85.7384
Prairie Ronde
Township 0 0 0 0
42.2117 -85.6075 Portage 4 4 2 2
42.24048 -85.6026 Portage 8 8 4 4
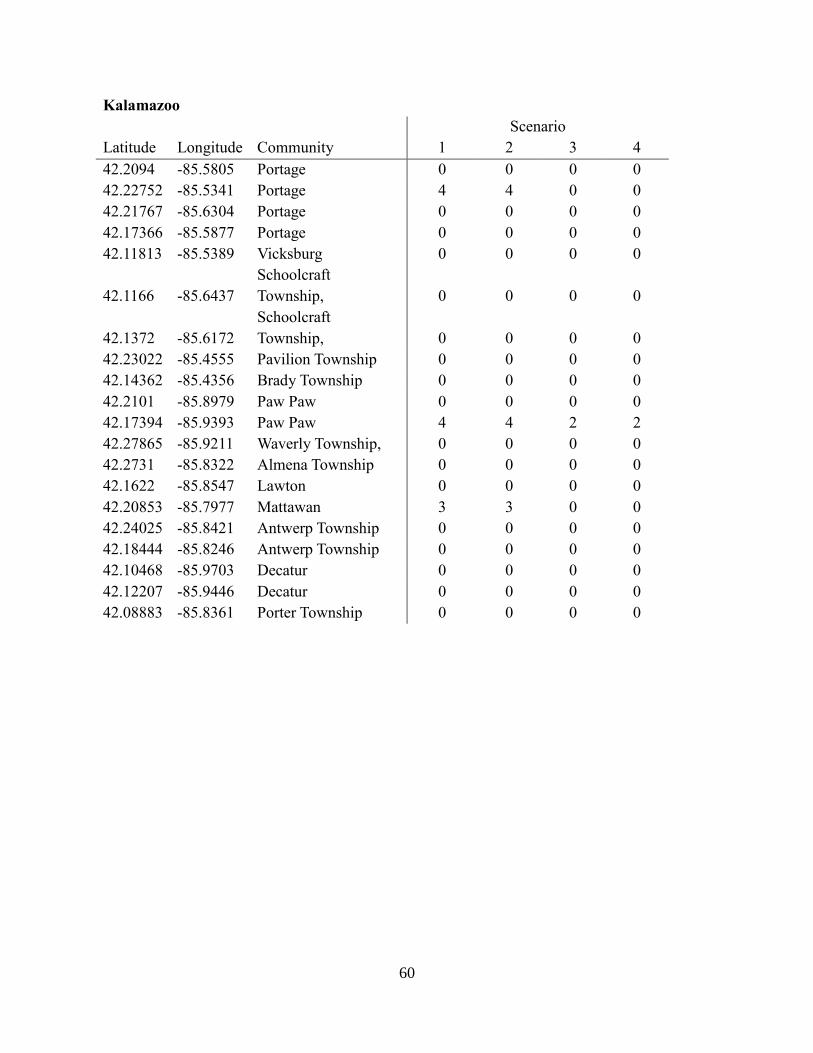
60
Kalamazoo
Scenario
Latitude Longitude Community 1 2 3 4
42.2094 -85.5805 Portage 0 0 0 0
42.22752 -85.5341 Portage 4 4 0 0
42.21767 -85.6304 Portage 0 0 0 0
42.17366 -85.5877 Portage 0 0 0 0
42.11813 -85.5389 Vicksburg 0 0 0 0
42.1166 -85.6437
Schoolcraft
Township, 0 0 0 0
42.1372 -85.6172
Schoolcraft
Township, 0 0 0 0
42.23022 -85.4555 Pavilion Township 0 0 0 0
42.14362 -85.4356 Brady Township 0 0 0 0
42.2101 -85.8979 Paw Paw 0 0 0 0
42.17394 -85.9393 Paw Paw 4 4 2 2
42.27865 -85.9211 Waverly Township, 0 0 0 0
42.2731 -85.8322 Almena Township 0 0 0 0
42.1622 -85.8547 Lawton 0 0 0 0
42.20853 -85.7977 Mattawan 3 3 0 0
42.24025 -85.8421 Antwerp Township 0 0 0 0
42.18444 -85.8246 Antwerp Township 0 0 0 0
42.10468 -85.9703 Decatur 0 0 0 0
42.12207 -85.9446 Decatur 0 0 0 0
42.08883 -85.8361 Porter Township 0 0 0 0
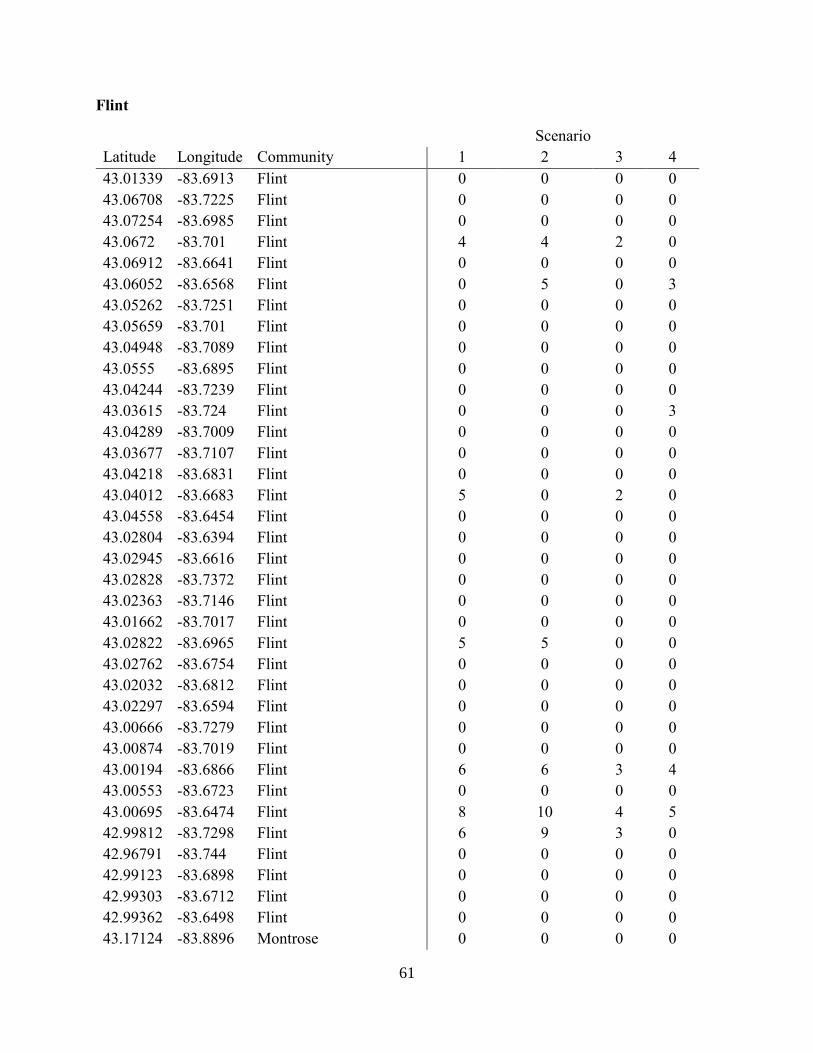
61
Flint
Scenario
Latitude Longitude Community 1 2 3 4
43.01339 -83.6913 Flint 0 0 0 0
43.06708 -83.7225 Flint 0 0 0 0
43.07254 -83.6985 Flint 0 0 0 0
43.0672 -83.701 Flint 4 4 2 0
43.06912 -83.6641 Flint 0 0 0 0
43.06052 -83.6568 Flint 0 5 0 3
43.05262 -83.7251 Flint 0 0 0 0
43.05659 -83.701 Flint 0 0 0 0
43.04948 -83.7089 Flint 0 0 0 0
43.0555 -83.6895 Flint 0 0 0 0
43.04244 -83.7239 Flint 0 0 0 0
43.03615 -83.724 Flint 0 0 0 3
43.04289 -83.7009 Flint 0 0 0 0
43.03677 -83.7107 Flint 0 0 0 0
43.04218 -83.6831 Flint 0 0 0 0
43.04012 -83.6683 Flint 5 0 2 0
43.04558 -83.6454 Flint 0 0 0 0
43.02804 -83.6394 Flint 0 0 0 0
43.02945 -83.6616 Flint 0 0 0 0
43.02828 -83.7372 Flint 0 0 0 0
43.02363 -83.7146 Flint 0 0 0 0
43.01662 -83.7017 Flint 0 0 0 0
43.02822 -83.6965 Flint 5 5 0 0
43.02762 -83.6754 Flint 0 0 0 0
43.02032 -83.6812 Flint 0 0 0 0
43.02297 -83.6594 Flint 0 0 0 0
43.00666 -83.7279 Flint 0 0 0 0
43.00874 -83.7019 Flint 0 0 0 0
43.00194 -83.6866 Flint 6 6 3 4
43.00553 -83.6723 Flint 0 0 0 0
43.00695 -83.6474 Flint 8 10 4 5
42.99812 -83.7298 Flint 6 9 3 0
42.96791 -83.744 Flint 0 0 0 0
42.99123 -83.6898 Flint 0 0 0 0
42.99303 -83.6712 Flint 0 0 0 0
42.99362 -83.6498 Flint 0 0 0 0
43.17124 -83.8896 Montrose 0 0 0 0
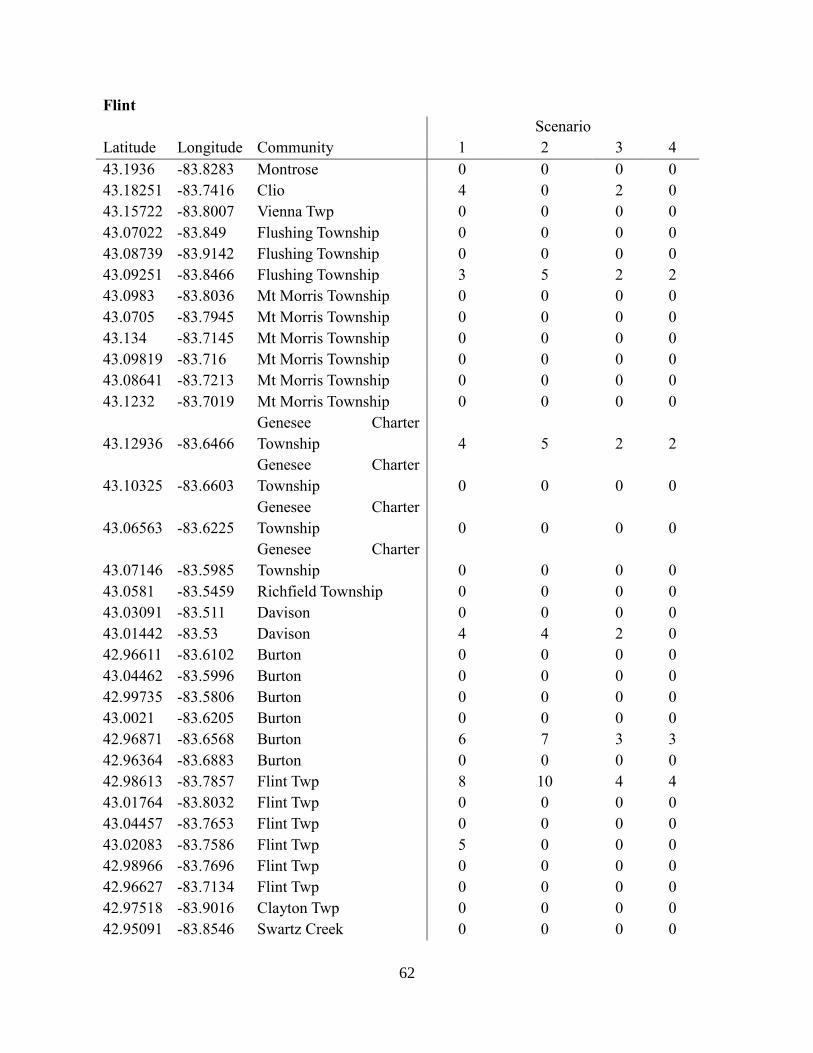
62
Flint
Scenario
Latitude Longitude Community 1 2 3 4
43.1936 -83.8283 Montrose 0 0 0 0
43.18251 -83.7416 Clio 4 0 2 0
43.15722 -83.8007 Vienna Twp 0 0 0 0
43.07022 -83.849 Flushing Township 0 0 0 0
43.08739 -83.9142 Flushing Township 0 0 0 0
43.09251 -83.8466 Flushing Township 3 5 2 2
43.0983 -83.8036 Mt Morris Township 0 0 0 0
43.0705 -83.7945 Mt Morris Township 0 0 0 0
43.134 -83.7145 Mt Morris Township 0 0 0 0
43.09819 -83.716 Mt Morris Township 0 0 0 0
43.08641 -83.7213 Mt Morris Township 0 0 0 0
43.1232 -83.7019 Mt Morris Township 0 0 0 0
43.12936 -83.6466
Genesee Charter
Township 4 5 2 2
43.10325 -83.6603
Genesee Charter
Township 0 0 0 0
43.06563 -83.6225
Genesee Charter
Township 0 0 0 0
43.07146 -83.5985
Genesee Charter
Township 0 0 0 0
43.0581 -83.5459 Richfield Township 0 0 0 0
43.03091 -83.511 Davison 0 0 0 0
43.01442 -83.53 Davison 4 4 2 0
42.96611 -83.6102 Burton 0 0 0 0
43.04462 -83.5996 Burton 0 0 0 0
42.99735 -83.5806 Burton 0 0 0 0
43.0021 -83.6205 Burton 0 0 0 0
42.96871 -83.6568 Burton 6 7 3 3
42.96364 -83.6883 Burton 0 0 0 0
42.98613 -83.7857 Flint Twp 8 10 4 4
43.01764 -83.8032 Flint Twp 0 0 0 0
43.04457 -83.7653 Flint Twp 0 0 0 0
43.02083 -83.7586 Flint Twp 5 0 0 0
42.98966 -83.7696 Flint Twp 0 0 0 0
42.96627 -83.7134 Flint Twp 0 0 0 0
42.97518 -83.9016 Clayton Twp 0 0 0 0
42.95091 -83.8546 Swartz Creek 0 0 0 0

63
Flint
Scenario
Latitude Longitude Community 1 2 3 4
42.8928 -83.8049 Mundy Township 0 0 0 0
42.95049 -83.7154 Flint Twp 0 0 0 0
42.93715 -83.9048 Gaines Township 0 0 0 0
42.93167 -83.6147 Grand Blanc 0 0 0 0
42.93171 -83.6746 Grand Blanc 0 0 0 0
42.95734 -83.616 Grand Blanc 0 0 0 0
42.90788 -83.6368 Grand Blanc 0 0 0 0
42.90287 -83.673 Grand Blanc 0 0 0 0
42.88006 -83.5272 Atlas Township 0 0 0 0
43.20801 -83.9525 Maple Grove Township 0 0 0 0
42.96957 -83.9649 Venice Township 3 3 2 0
43.07661 -83.9644 Hazelton Township 0 0 0 0
42.91677 -83.9937 Durand 0 0 0 0
42.93642 -83.9721 Vernon Township 0 0 0 0
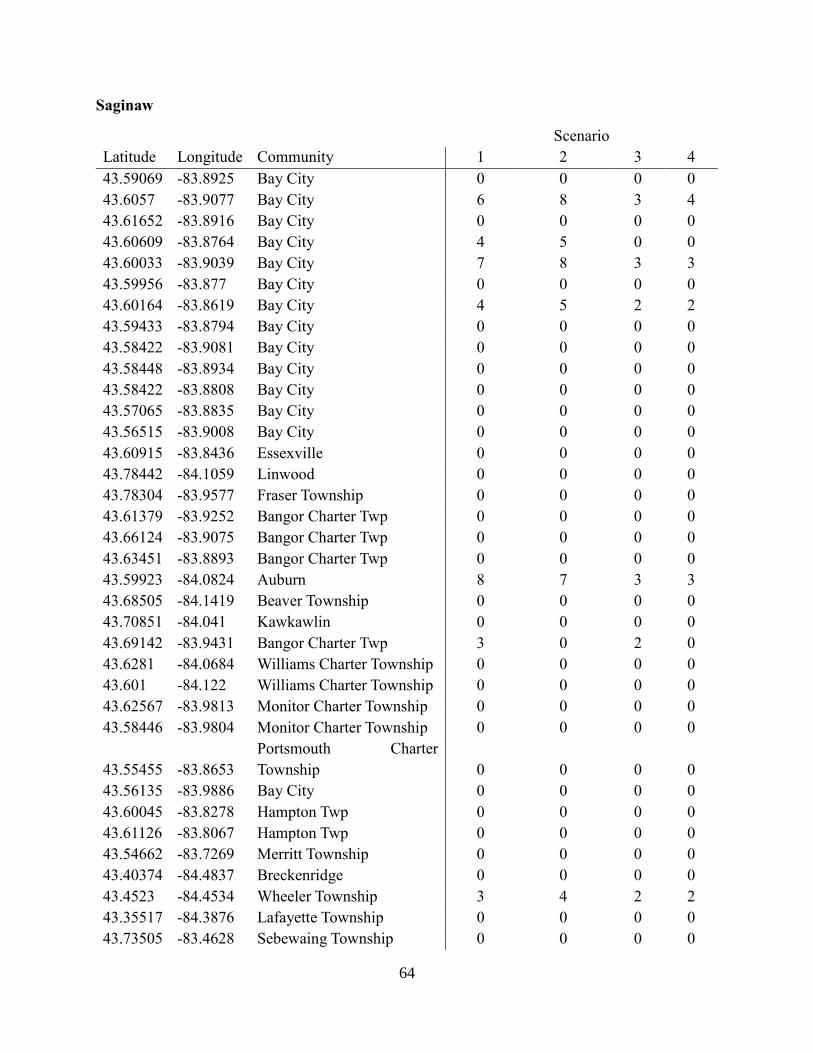
64
Saginaw
Scenario
Latitude Longitude Community 1 2 3 4
43.59069 -83.8925 Bay City 0 0 0 0
43.6057 -83.9077 Bay City 6 8 3 4
43.61652 -83.8916 Bay City 0 0 0 0
43.60609 -83.8764 Bay City 4 5 0 0
43.60033 -83.9039 Bay City 7 8 3 3
43.59956 -83.877 Bay City 0 0 0 0
43.60164 -83.8619 Bay City 4 5 2 2
43.59433 -83.8794 Bay City 0 0 0 0
43.58422 -83.9081 Bay City 0 0 0 0
43.58448 -83.8934 Bay City 0 0 0 0
43.58422 -83.8808 Bay City 0 0 0 0
43.57065 -83.8835 Bay City 0 0 0 0
43.56515 -83.9008 Bay City 0 0 0 0
43.60915 -83.8436 Essexville 0 0 0 0
43.78442 -84.1059 Linwood 0 0 0 0
43.78304 -83.9577 Fraser Township 0 0 0 0
43.61379 -83.9252 Bangor Charter Twp 0 0 0 0
43.66124 -83.9075 Bangor Charter Twp 0 0 0 0
43.63451 -83.8893 Bangor Charter Twp 0 0 0 0
43.59923 -84.0824 Auburn 8 7 3 3
43.68505 -84.1419 Beaver Township 0 0 0 0
43.70851 -84.041 Kawkawlin 0 0 0 0
43.69142 -83.9431 Bangor Charter Twp 3 0 2 0
43.6281 -84.0684 Williams Charter Township 0 0 0 0
43.601 -84.122 Williams Charter Township 0 0 0 0
43.62567 -83.9813 Monitor Charter Township 0 0 0 0
43.58446 -83.9804 Monitor Charter Township 0 0 0 0
43.55455 -83.8653
Portsmouth Charter
Township 0 0 0 0
43.56135 -83.9886 Bay City 0 0 0 0
43.60045 -83.8278 Hampton Twp 0 0 0 0
43.61126 -83.8067 Hampton Twp 0 0 0 0
43.54662 -83.7269 Merritt Township 0 0 0 0
43.40374 -84.4837 Breckenridge 0 0 0 0
43.4523 -84.4534 Wheeler Township 3 4 2 2
43.35517 -84.3876 Lafayette Township 0 0 0 0
43.73505 -83.4628 Sebewaing Township 0 0 0 0
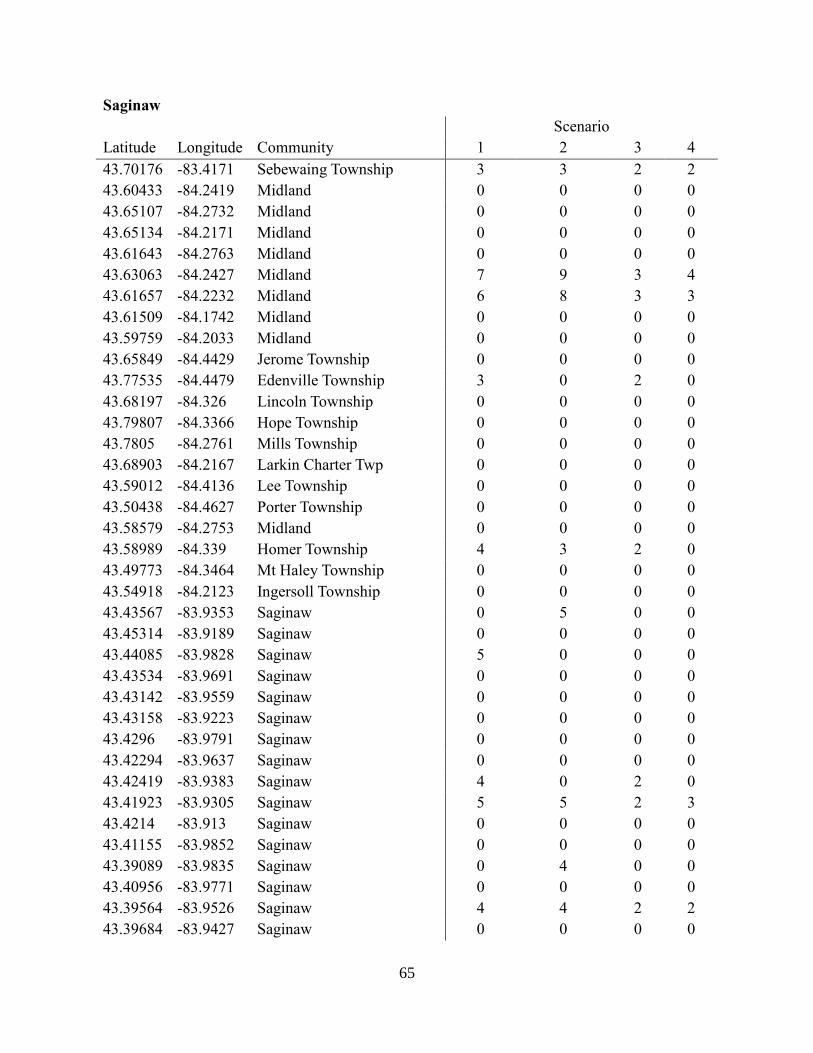
65
Saginaw
Scenario
Latitude Longitude Community 1 2 3 4
43.70176 -83.4171 Sebewaing Township 3 3 2 2
43.60433 -84.2419 Midland 0 0 0 0
43.65107 -84.2732 Midland 0 0 0 0
43.65134 -84.2171 Midland 0 0 0 0
43.61643 -84.2763 Midland 0 0 0 0
43.63063 -84.2427 Midland 7 9 3 4
43.61657 -84.2232 Midland 6 8 3 3
43.61509 -84.1742 Midland 0 0 0 0
43.59759 -84.2033 Midland 0 0 0 0
43.65849 -84.4429 Jerome Township 0 0 0 0
43.77535 -84.4479 Edenville Township 3 0 2 0
43.68197 -84.326 Lincoln Township 0 0 0 0
43.79807 -84.3366 Hope Township 0 0 0 0
43.7805 -84.2761 Mills Township 0 0 0 0
43.68903 -84.2167 Larkin Charter Twp 0 0 0 0
43.59012 -84.4136 Lee Township 0 0 0 0
43.50438 -84.4627 Porter Township 0 0 0 0
43.58579 -84.2753 Midland 0 0 0 0
43.58989 -84.339 Homer Township 4 3 2 0
43.49773 -84.3464 Mt Haley Township 0 0 0 0
43.54918 -84.2123 Ingersoll Township 0 0 0 0
43.43567 -83.9353 Saginaw 0 5 0 0
43.45314 -83.9189 Saginaw 0 0 0 0
43.44085 -83.9828 Saginaw 5 0 0 0
43.43534 -83.9691 Saginaw 0 0 0 0
43.43142 -83.9559 Saginaw 0 0 0 0
43.43158 -83.9223 Saginaw 0 0 0 0
43.4296 -83.9791 Saginaw 0 0 0 0
43.42294 -83.9637 Saginaw 0 0 0 0
43.42419 -83.9383 Saginaw 4 0 2 0
43.41923 -83.9305 Saginaw 5 5 2 3
43.4214 -83.913 Saginaw 0 0 0 0
43.41155 -83.9852 Saginaw 0 0 0 0
43.39089 -83.9835 Saginaw 0 4 0 0
43.40956 -83.9771 Saginaw 0 0 0 0
43.39564 -83.9526 Saginaw 4 4 2 2
43.39684 -83.9427 Saginaw 0 0 0 0
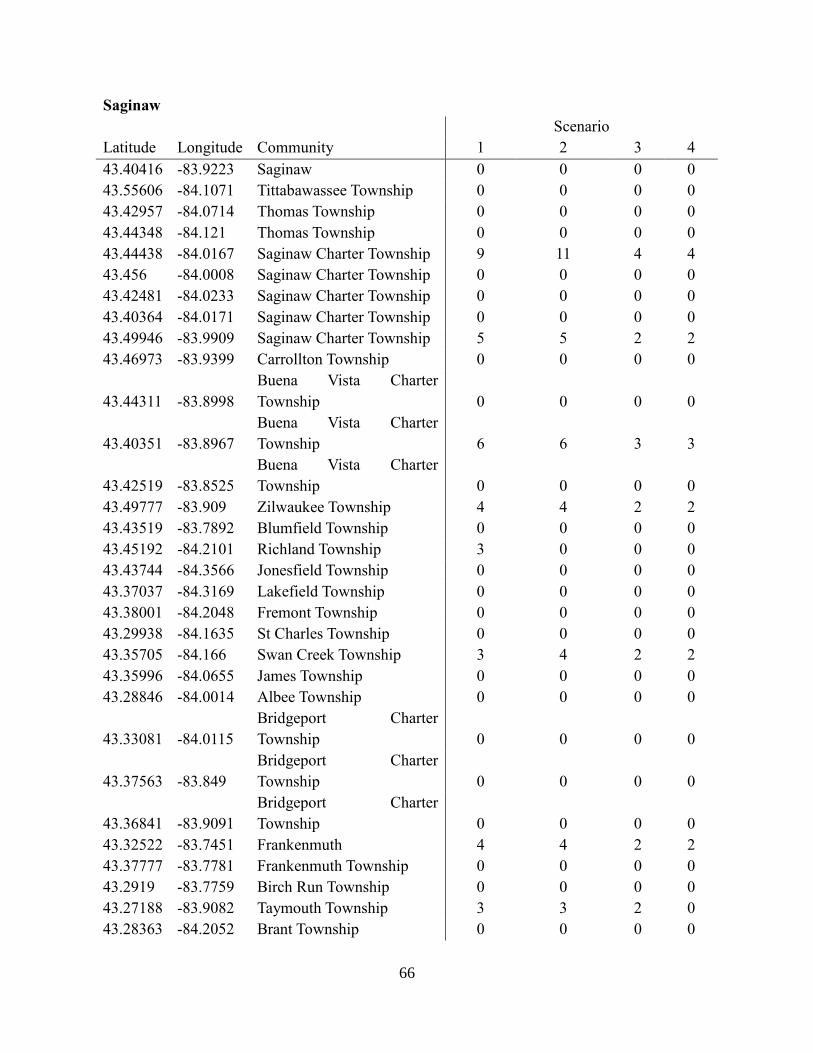
66
Saginaw
Scenario
Latitude Longitude Community 1 2 3 4
43.40416 -83.9223 Saginaw 0 0 0 0
43.55606 -84.1071 Tittabawassee Township 0 0 0 0
43.42957 -84.0714 Thomas Township 0 0 0 0
43.44348 -84.121 Thomas Township 0 0 0 0
43.44438 -84.0167 Saginaw Charter Township 9 11 4 4
43.456 -84.0008 Saginaw Charter Township 0 0 0 0
43.42481 -84.0233 Saginaw Charter Township 0 0 0 0
43.40364 -84.0171 Saginaw Charter Township 0 0 0 0
43.49946 -83.9909 Saginaw Charter Township 5 5 2 2
43.46973 -83.9399 Carrollton Township 0 0 0 0
43.44311 -83.8998
Buena Vista Charter
Township 0 0 0 0
43.40351 -83.8967
Buena Vista Charter
Township 6 6 3 3
43.42519 -83.8525
Buena Vista Charter
Township 0 0 0 0
43.49777 -83.909 Zilwaukee Township 4 4 2 2
43.43519 -83.7892 Blumfield Township 0 0 0 0
43.45192 -84.2101 Richland Township 3 0 0 0
43.43744 -84.3566 Jonesfield Township 0 0 0 0
43.37037 -84.3169 Lakefield Township 0 0 0 0
43.38001 -84.2048 Fremont Township 0 0 0 0
43.29938 -84.1635 St Charles Township 0 0 0 0
43.35705 -84.166 Swan Creek Township 3 4 2 2
43.35996 -84.0655 James Township 0 0 0 0
43.28846 -84.0014 Albee Township 0 0 0 0
43.33081 -84.0115
Bridgeport Charter
Township 0 0 0 0
43.37563 -83.849
Bridgeport Charter
Township 0 0 0 0
43.36841 -83.9091
Bridgeport Charter
Township 0 0 0 0
43.32522 -83.7451 Frankenmuth 4 4 2 2
43.37777 -83.7781 Frankenmuth Township 0 0 0 0
43.2919 -83.7759 Birch Run Township 0 0 0 0
43.27188 -83.9082 Taymouth Township 3 3 2 0
43.28363 -84.2052 Brant Township 0 0 0 0

67
Saginaw
Scenario
Latitude Longitude Community 1 2 3 4
43.48154 -83.3984 Caro 0 0 0 0
43.44319 -83.409 Caro 3 4 2 2
43.44013 -83.5732 Juniata Township 0 0 0 0
43.62189 -83.4365 Columbia Township 3 0 0 0
43.58044 -83.6309 Wisner Township 0 0 0 0
43.67693 -83.5582 Akron Township 0 0 0 0
43.50105 -83.5 Fairgrove Township 0 0 0 0
43.49363 -83.668 Reese 0 0 0 0
43.53775 -83.4206 Almer Township 0 0 0 0
43.43307 -83.6651 Denmark Township 4 3 2 0
43.34823 -83.6801 Tuscola Township 0 0 0 0
43.37079 -83.5925 Vassar 0 0 0 0
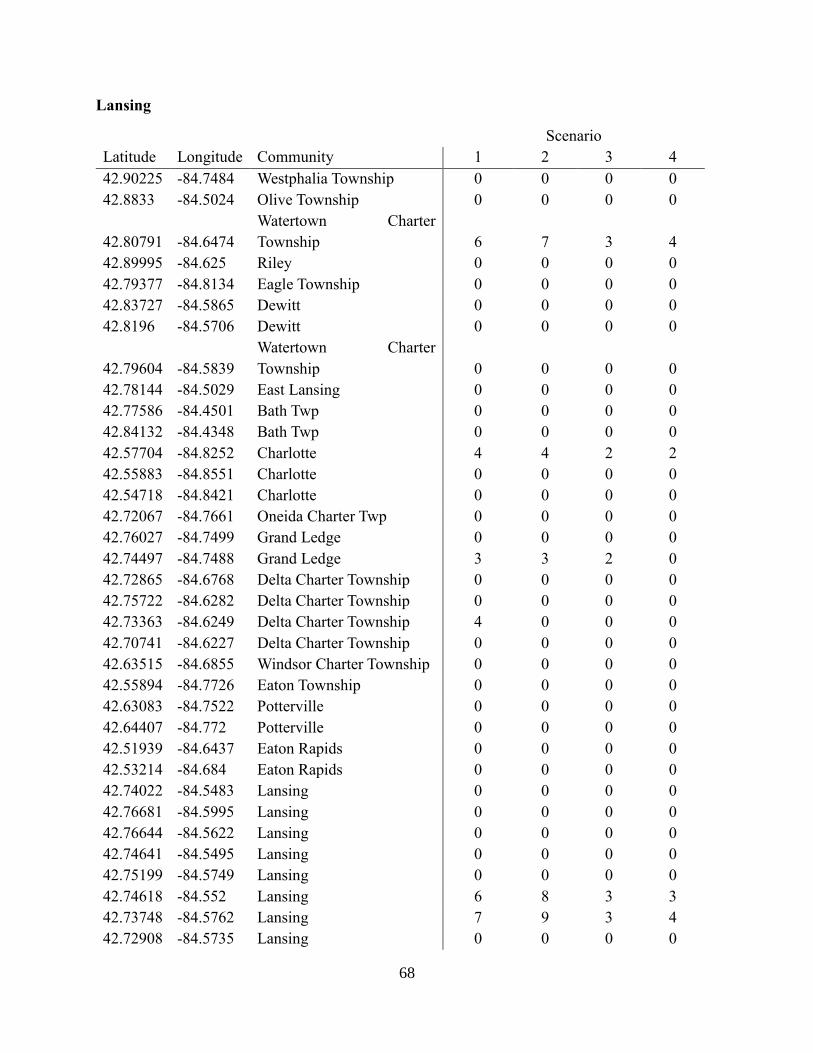
68
Lansing
Scenario
Latitude Longitude Community 1 2 3 4
42.90225 -84.7484 Westphalia Township 0 0 0 0
42.8833 -84.5024 Olive Township 0 0 0 0
42.80791 -84.6474
Watertown Charter
Township 6 7 3 4
42.89995 -84.625 Riley 0 0 0 0
42.79377 -84.8134 Eagle Township 0 0 0 0
42.83727 -84.5865 Dewitt 0 0 0 0
42.8196 -84.5706 Dewitt 0 0 0 0
42.79604 -84.5839
Watertown Charter
Township 0 0 0 0
42.78144 -84.5029 East Lansing 0 0 0 0
42.77586 -84.4501 Bath Twp 0 0 0 0
42.84132 -84.4348 Bath Twp 0 0 0 0
42.57704 -84.8252 Charlotte 4 4 2 2
42.55883 -84.8551 Charlotte 0 0 0 0
42.54718 -84.8421 Charlotte 0 0 0 0
42.72067 -84.7661 Oneida Charter Twp 0 0 0 0
42.76027 -84.7499 Grand Ledge 0 0 0 0
42.74497 -84.7488 Grand Ledge 3 3 2 0
42.72865 -84.6768 Delta Charter Township 0 0 0 0
42.75722 -84.6282 Delta Charter Township 0 0 0 0
42.73363 -84.6249 Delta Charter Township 4 0 0 0
42.70741 -84.6227 Delta Charter Township 0 0 0 0
42.63515 -84.6855 Windsor Charter Township 0 0 0 0
42.55894 -84.7726 Eaton Township 0 0 0 0
42.63083 -84.7522 Potterville 0 0 0 0
42.64407 -84.772 Potterville 0 0 0 0
42.51939 -84.6437 Eaton Rapids 0 0 0 0
42.53214 -84.684 Eaton Rapids 0 0 0 0
42.74022 -84.5483 Lansing 0 0 0 0
42.76681 -84.5995 Lansing 0 0 0 0
42.76644 -84.5622 Lansing 0 0 0 0
42.74641 -84.5495 Lansing 0 0 0 0
42.75199 -84.5749 Lansing 0 0 0 0
42.74618 -84.552 Lansing 6 8 3 3
42.73748 -84.5762 Lansing 7 9 3 4
42.72908 -84.5735 Lansing 0 0 0 0
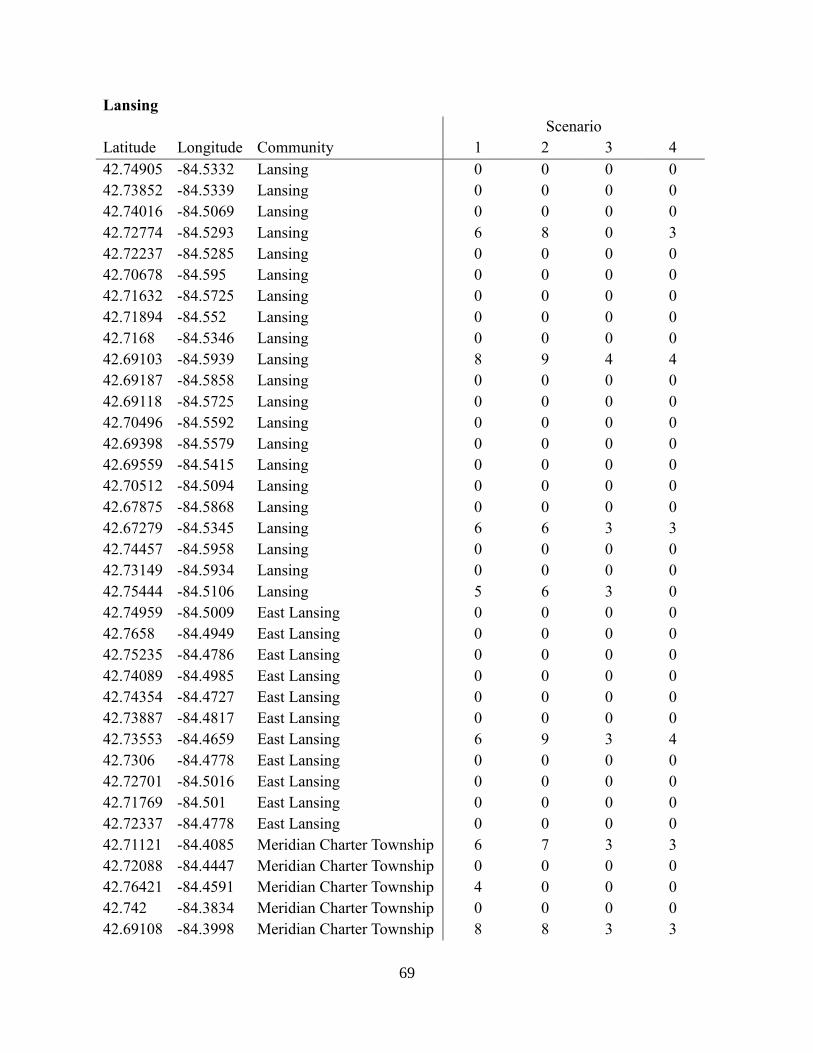
69
Lansing
Scenario
Latitude Longitude Community 1 2 3 4
42.74905 -84.5332 Lansing 0 0 0 0
42.73852 -84.5339 Lansing 0 0 0 0
42.74016 -84.5069 Lansing 0 0 0 0
42.72774 -84.5293 Lansing 6 8 0 3
42.72237 -84.5285 Lansing 0 0 0 0
42.70678 -84.595 Lansing 0 0 0 0
42.71632 -84.5725 Lansing 0 0 0 0
42.71894 -84.552 Lansing 0 0 0 0
42.7168 -84.5346 Lansing 0 0 0 0
42.69103 -84.5939 Lansing 8 9 4 4
42.69187 -84.5858 Lansing 0 0 0 0
42.69118 -84.5725 Lansing 0 0 0 0
42.70496 -84.5592 Lansing 0 0 0 0
42.69398 -84.5579 Lansing 0 0 0 0
42.69559 -84.5415 Lansing 0 0 0 0
42.70512 -84.5094 Lansing 0 0 0 0
42.67875 -84.5868 Lansing 0 0 0 0
42.67279 -84.5345 Lansing 6 6 3 3
42.74457 -84.5958 Lansing 0 0 0 0
42.73149 -84.5934 Lansing 0 0 0 0
42.75444 -84.5106 Lansing 5 6 3 0
42.74959 -84.5009 East Lansing 0 0 0 0
42.7658 -84.4949 East Lansing 0 0 0 0
42.75235 -84.4786 East Lansing 0 0 0 0
42.74089 -84.4985 East Lansing 0 0 0 0
42.74354 -84.4727 East Lansing 0 0 0 0
42.73887 -84.4817 East Lansing 0 0 0 0
42.73553 -84.4659 East Lansing 6 9 3 4
42.7306 -84.4778 East Lansing 0 0 0 0
42.72701 -84.5016 East Lansing 0 0 0 0
42.71769 -84.501 East Lansing 0 0 0 0
42.72337 -84.4778 East Lansing 0 0 0 0
42.71121 -84.4085 Meridian Charter Township 6 7 3 3
42.72088 -84.4447 Meridian Charter Township 0 0 0 0
42.76421 -84.4591 Meridian Charter Township 4 0 0 0
42.742 -84.3834 Meridian Charter Township 0 0 0 0
42.69108 -84.3998 Meridian Charter Township 8 8 3 3

70
Lansing
Scenario
Latitude Longitude Community 1 2 3 4
42.69191 -84.2693 Williamstown Township 0 0 0 0
42.71689 -84.3368 Williamstown Township 0 0 0 0
42.62103 -84.3347 Wheatfield Township 0 0 0 0
42.66364 -84.1834 Webberville 0 0 0 0
42.61329 -84.227 Leroy Township 0 0 0 0
42.7087 -84.1983 Locke Township 0 0 0 0
42.65153 -84.5171 Delhi Charter Township 0 0 0 0
42.6489 -84.5414 Delhi Charter Township 0 0 0 0
42.6665 -84.5028 Delhi Charter Township 0 0 0 0
42.61252 -84.5427 Delhi Charter Township 0 0 0 0
42.57031 -84.4254 Mason 0 0 0 0
42.57152 -84.4591 Mason 4 0 2 0
42.65184 -84.3897 Alaiedon Township 0 0 0 0
42.53862 -84.3733 Vevay Township 0 0 0 0
42.58836 -84.3365 Ingham Township 0 3 0 0
42.58708 -84.2402 White Oak Township 0 0 0 0
42.54631 -84.5162 Mason 0 0 0 0
42.82483 -84.2249 Perry 2 2 2 0
42.84121 -84.318 Woodhull Township 0 0 0 0
42.80567 -84.2134 Perry Township 0 0 0 0
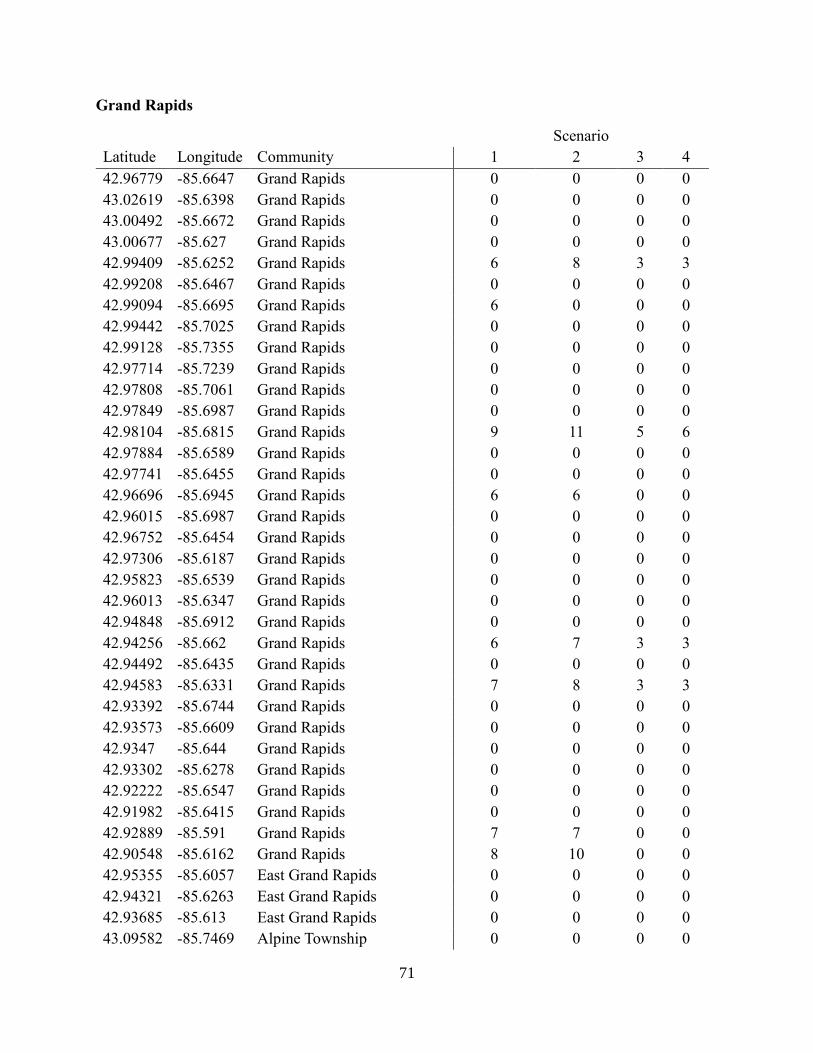
71
Grand Rapids
Scenario
Latitude Longitude Community 1 2 3 4
42.96779 -85.6647 Grand Rapids 0 0 0 0
43.02619 -85.6398 Grand Rapids 0 0 0 0
43.00492 -85.6672 Grand Rapids 0 0 0 0
43.00677 -85.627 Grand Rapids 0 0 0 0
42.99409 -85.6252 Grand Rapids 6 8 3 3
42.99208 -85.6467 Grand Rapids 0 0 0 0
42.99094 -85.6695 Grand Rapids 6 0 0 0
42.99442 -85.7025 Grand Rapids 0 0 0 0
42.99128 -85.7355 Grand Rapids 0 0 0 0
42.97714 -85.7239 Grand Rapids 0 0 0 0
42.97808 -85.7061 Grand Rapids 0 0 0 0
42.97849 -85.6987 Grand Rapids 0 0 0 0
42.98104 -85.6815 Grand Rapids 9 11 5 6
42.97884 -85.6589 Grand Rapids 0 0 0 0
42.97741 -85.6455 Grand Rapids 0 0 0 0
42.96696 -85.6945 Grand Rapids 6 6 0 0
42.96015 -85.6987 Grand Rapids 0 0 0 0
42.96752 -85.6454 Grand Rapids 0 0 0 0
42.97306 -85.6187 Grand Rapids 0 0 0 0
42.95823 -85.6539 Grand Rapids 0 0 0 0
42.96013 -85.6347 Grand Rapids 0 0 0 0
42.94848 -85.6912 Grand Rapids 0 0 0 0
42.94256 -85.662 Grand Rapids 6 7 3 3
42.94492 -85.6435 Grand Rapids 0 0 0 0
42.94583 -85.6331 Grand Rapids 7 8 3 3
42.93392 -85.6744 Grand Rapids 0 0 0 0
42.93573 -85.6609 Grand Rapids 0 0 0 0
42.9347 -85.644 Grand Rapids 0 0 0 0
42.93302 -85.6278 Grand Rapids 0 0 0 0
42.92222 -85.6547 Grand Rapids 0 0 0 0
42.91982 -85.6415 Grand Rapids 0 0 0 0
42.92889 -85.591 Grand Rapids 7 7 0 0
42.90548 -85.6162 Grand Rapids 8 10 0 0
42.95355 -85.6057 East Grand Rapids 0 0 0 0
42.94321 -85.6263 East Grand Rapids 0 0 0 0
42.93685 -85.613 East Grand Rapids 0 0 0 0
43.09582 -85.7469 Alpine Township 0 0 0 0
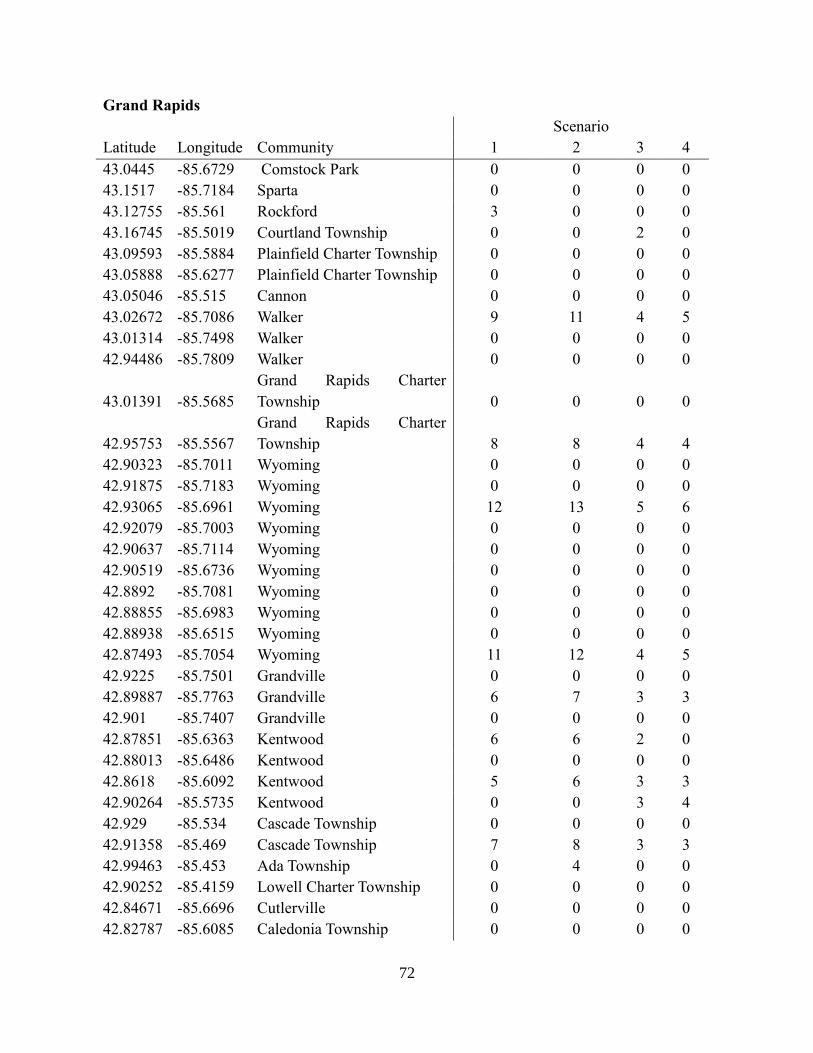
72
Grand Rapids
Scenario
Latitude Longitude Community 1 2 3 4
43.0445 -85.6729 Comstock Park 0 0 0 0
43.1517 -85.7184 Sparta 0 0 0 0
43.12755 -85.561 Rockford 3 0 0 0
43.16745 -85.5019 Courtland Township 0 0 2 0
43.09593 -85.5884 Plainfield Charter Township 0 0 0 0
43.05888 -85.6277 Plainfield Charter Township 0 0 0 0
43.05046 -85.515 Cannon 0 0 0 0
43.02672 -85.7086 Walker 9 11 4 5
43.01314 -85.7498 Walker 0 0 0 0
42.94486 -85.7809 Walker 0 0 0 0
43.01391 -85.5685
Grand Rapids Charter
Township 0 0 0 0
42.95753 -85.5567
Grand Rapids Charter
Township 8 8 4 4
42.90323 -85.7011 Wyoming 0 0 0 0
42.91875 -85.7183 Wyoming 0 0 0 0
42.93065 -85.6961 Wyoming 12 13 5 6
42.92079 -85.7003 Wyoming 0 0 0 0
42.90637 -85.7114 Wyoming 0 0 0 0
42.90519 -85.6736 Wyoming 0 0 0 0
42.8892 -85.7081 Wyoming 0 0 0 0
42.88855 -85.6983 Wyoming 0 0 0 0
42.88938 -85.6515 Wyoming 0 0 0 0
42.87493 -85.7054 Wyoming 11 12 4 5
42.9225 -85.7501 Grandville 0 0 0 0
42.89887 -85.7763 Grandville 6 7 3 3
42.901 -85.7407 Grandville 0 0 0 0
42.87851 -85.6363 Kentwood 6 6 2 0
42.88013 -85.6486 Kentwood 0 0 0 0
42.8618 -85.6092 Kentwood 5 6 3 3
42.90264 -85.5735 Kentwood 0 0 3 4
42.929 -85.534 Cascade Township 0 0 0 0
42.91358 -85.469 Cascade Township 7 8 3 3
42.99463 -85.453 Ada Township 0 4 0 0
42.90252 -85.4159 Lowell Charter Township 0 0 0 0
42.84671 -85.6696 Cutlerville 0 0 0 0
42.82787 -85.6085 Caledonia Township 0 0 0 0

73
Grand Rapids
Scenario
Latitude Longitude Community 1 2 3 4
42.83801 -85.7527 Byron Township 0 0 0 0
42.78772 -85.7635 Byron Township 0 0 0 0
42.82246 -85.4739 Caledonia Township 0 0 0 0
43.09211 -85.8575 Polkton Charter Twp 0 0 0 0
43.01924 -85.816 Tallmadge Charter Township 0 0 0 0
42.85359 -85.8764 Hudsonville 0 0 0 0
42.90885 -85.878 Georgetown Twp 0 0 0 0
42.90876 -85.8275 Georgetown Twp 0 0 0 0
42.89614 -85.7917 Georgetown Twp 0 0 0 0
42.83717 -85.8144 Jamestown Charter Township 0 0 0 0
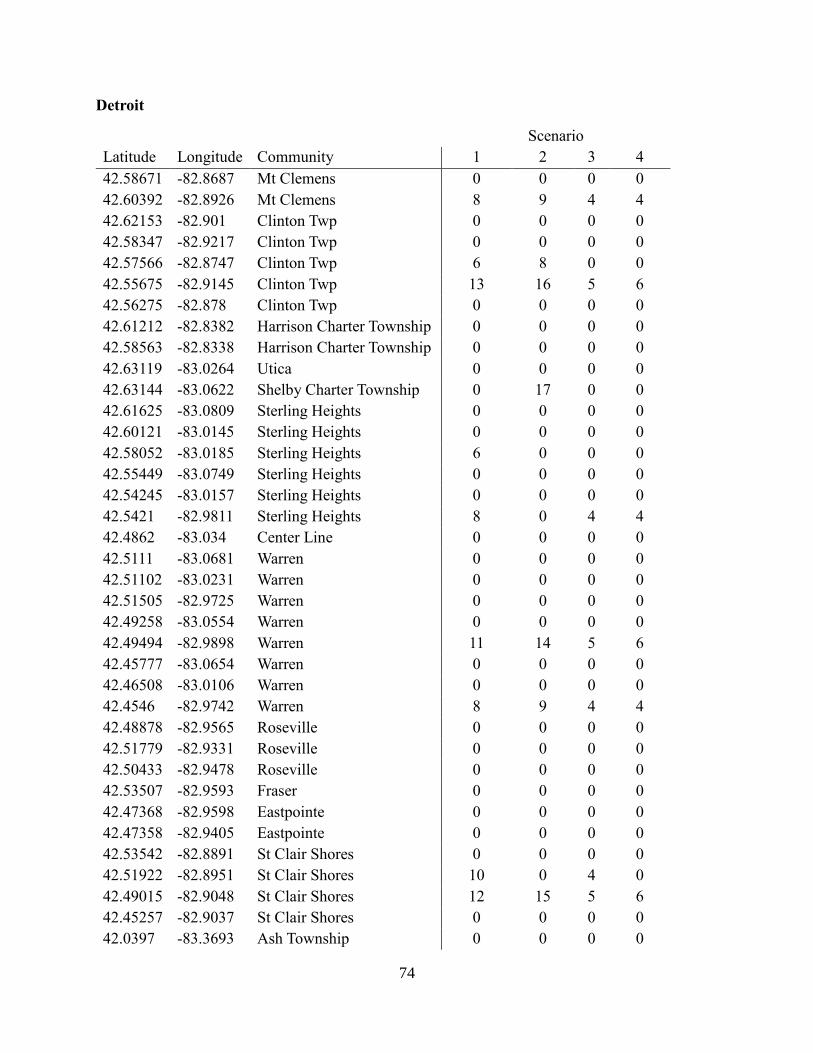
74
Detroit
Scenario
Latitude Longitude Community 1 2 3 4
42.58671 -82.8687 Mt Clemens 0 0 0 0
42.60392 -82.8926 Mt Clemens 8 9 4 4
42.62153 -82.901 Clinton Twp 0 0 0 0
42.58347 -82.9217 Clinton Twp 0 0 0 0
42.57566 -82.8747 Clinton Twp 6 8 0 0
42.55675 -82.9145 Clinton Twp 13 16 5 6
42.56275 -82.878 Clinton Twp 0 0 0 0
42.61212 -82.8382 Harrison Charter Township 0 0 0 0
42.58563 -82.8338 Harrison Charter Township 0 0 0 0
42.63119 -83.0264 Utica 0 0 0 0
42.63144 -83.0622 Shelby Charter Township 0 17 0 0
42.61625 -83.0809 Sterling Heights 0 0 0 0
42.60121 -83.0145 Sterling Heights 0 0 0 0
42.58052 -83.0185 Sterling Heights 6 0 0 0
42.55449 -83.0749 Sterling Heights 0 0 0 0
42.54245 -83.0157 Sterling Heights 0 0 0 0
42.5421 -82.9811 Sterling Heights 8 0 4 4
42.4862 -83.034 Center Line 0 0 0 0
42.5111 -83.0681 Warren 0 0 0 0
42.51102 -83.0231 Warren 0 0 0 0
42.51505 -82.9725 Warren 0 0 0 0
42.49258 -83.0554 Warren 0 0 0 0
42.49494 -82.9898 Warren 11 14 5 6
42.45777 -83.0654 Warren 0 0 0 0
42.46508 -83.0106 Warren 0 0 0 0
42.4546 -82.9742 Warren 8 9 4 4
42.48878 -82.9565 Roseville 0 0 0 0
42.51779 -82.9331 Roseville 0 0 0 0
42.50433 -82.9478 Roseville 0 0 0 0
42.53507 -82.9593 Fraser 0 0 0 0
42.47368 -82.9598 Eastpointe 0 0 0 0
42.47358 -82.9405 Eastpointe 0 0 0 0
42.53542 -82.8891 St Clair Shores 0 0 0 0
42.51922 -82.8951 St Clair Shores 10 0 4 0
42.49015 -82.9048 St Clair Shores 12 15 5 6
42.45257 -82.9037 St Clair Shores 0 0 0 0
42.0397 -83.3693 Ash Township 0 0 0 0
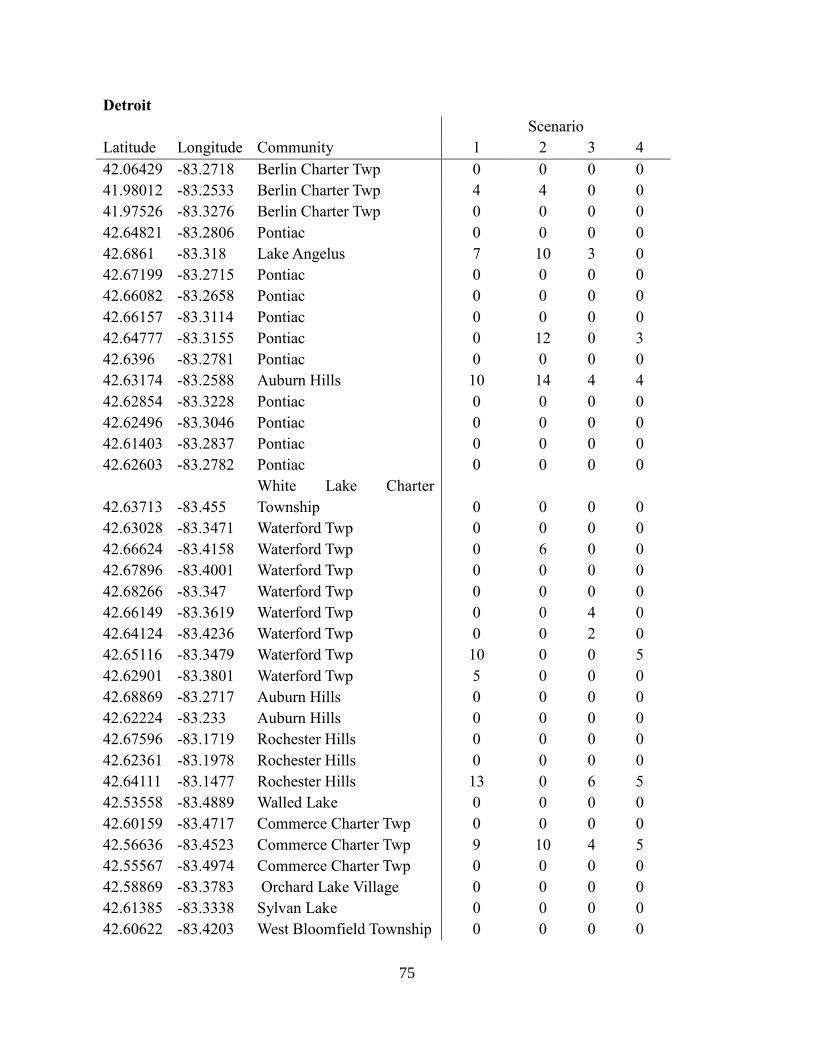
75
Detroit
Scenario
Latitude Longitude Community 1 2 3 4
42.06429 -83.2718 Berlin Charter Twp 0 0 0 0
41.98012 -83.2533 Berlin Charter Twp 4 4 0 0
41.97526 -83.3276 Berlin Charter Twp 0 0 0 0
42.64821 -83.2806 Pontiac 0 0 0 0
42.6861 -83.318 Lake Angelus 7 10 3 0
42.67199 -83.2715 Pontiac 0 0 0 0
42.66082 -83.2658 Pontiac 0 0 0 0
42.66157 -83.3114 Pontiac 0 0 0 0
42.64777 -83.3155 Pontiac 0 12 0 3
42.6396 -83.2781 Pontiac 0 0 0 0
42.63174 -83.2588 Auburn Hills 10 14 4 4
42.62854 -83.3228 Pontiac 0 0 0 0
42.62496 -83.3046 Pontiac 0 0 0 0
42.61403 -83.2837 Pontiac 0 0 0 0
42.62603 -83.2782 Pontiac 0 0 0 0
42.63713 -83.455
White Lake Charter
Township 0 0 0 0
42.63028 -83.3471 Waterford Twp 0 0 0 0
42.66624 -83.4158 Waterford Twp 0 6 0 0
42.67896 -83.4001 Waterford Twp 0 0 0 0
42.68266 -83.347 Waterford Twp 0 0 0 0
42.66149 -83.3619 Waterford Twp 0 0 4 0
42.64124 -83.4236 Waterford Twp 0 0 2 0
42.65116 -83.3479 Waterford Twp 10 0 0 5
42.62901 -83.3801 Waterford Twp 5 0 0 0
42.68869 -83.2717 Auburn Hills 0 0 0 0
42.62224 -83.233 Auburn Hills 0 0 0 0
42.67596 -83.1719 Rochester Hills 0 0 0 0
42.62361 -83.1978 Rochester Hills 0 0 0 0
42.64111 -83.1477 Rochester Hills 13 0 6 5
42.53558 -83.4889 Walled Lake 0 0 0 0
42.60159 -83.4717 Commerce Charter Twp 0 0 0 0
42.56636 -83.4523 Commerce Charter Twp 9 10 4 5
42.55567 -83.4974 Commerce Charter Twp 0 0 0 0
42.58869 -83.3783 Orchard Lake Village 0 0 0 0
42.61385 -83.3338 Sylvan Lake 0 0 0 0
42.60622 -83.4203 West Bloomfield Township 0 0 0 0
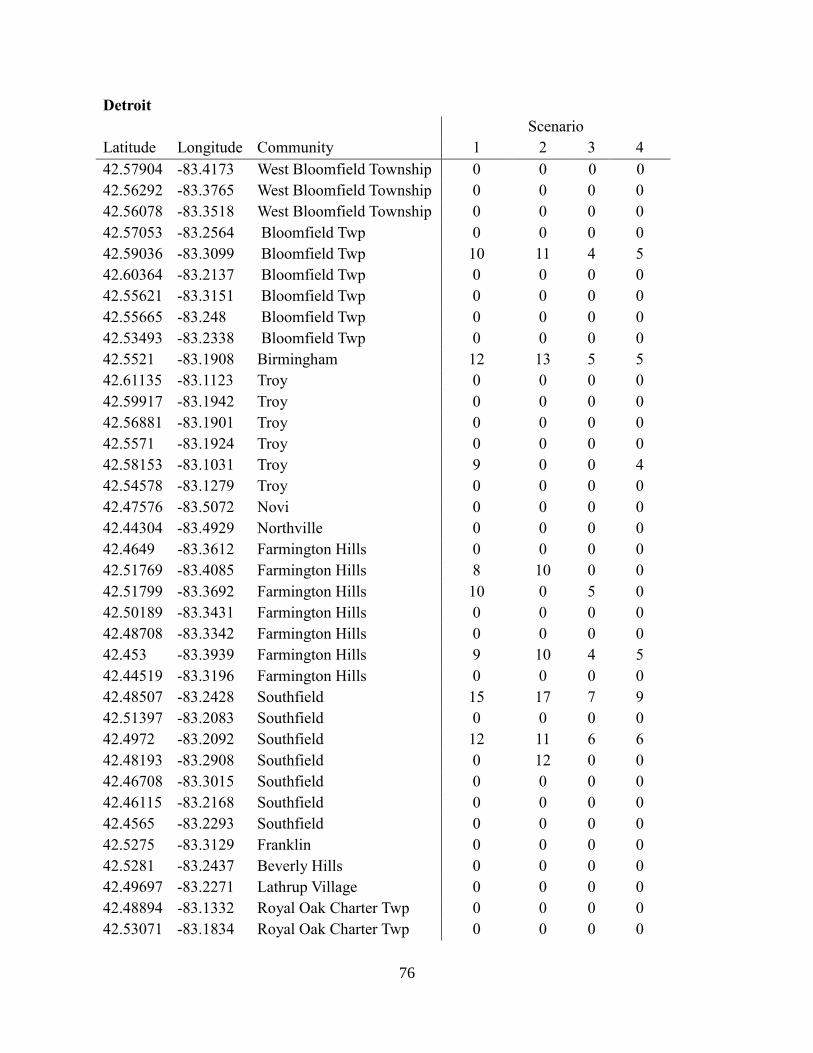
76
Detroit
Scenario
Latitude Longitude Community 1 2 3 4
42.57904 -83.4173 West Bloomfield Township 0 0 0 0
42.56292 -83.3765 West Bloomfield Township 0 0 0 0
42.56078 -83.3518 West Bloomfield Township 0 0 0 0
42.57053 -83.2564 Bloomfield Twp 0 0 0 0
42.59036 -83.3099 Bloomfield Twp 10 11 4 5
42.60364 -83.2137 Bloomfield Twp 0 0 0 0
42.55621 -83.3151 Bloomfield Twp 0 0 0 0
42.55665 -83.248 Bloomfield Twp 0 0 0 0
42.53493 -83.2338 Bloomfield Twp 0 0 0 0
42.5521 -83.1908 Birmingham 12 13 5 5
42.61135 -83.1123 Troy 0 0 0 0
42.59917 -83.1942 Troy 0 0 0 0
42.56881 -83.1901 Troy 0 0 0 0
42.5571 -83.1924 Troy 0 0 0 0
42.58153 -83.1031 Troy 9 0 0 4
42.54578 -83.1279 Troy 0 0 0 0
42.47576 -83.5072 Novi 0 0 0 0
42.44304 -83.4929 Northville 0 0 0 0
42.4649 -83.3612 Farmington Hills 0 0 0 0
42.51769 -83.4085 Farmington Hills 8 10 0 0
42.51799 -83.3692 Farmington Hills 10 0 5 0
42.50189 -83.3431 Farmington Hills 0 0 0 0
42.48708 -83.3342 Farmington Hills 0 0 0 0
42.453 -83.3939 Farmington Hills 9 10 4 5
42.44519 -83.3196 Farmington Hills 0 0 0 0
42.48507 -83.2428 Southfield 15 17 7 9
42.51397 -83.2083 Southfield 0 0 0 0
42.4972 -83.2092 Southfield 12 11 6 6
42.48193 -83.2908 Southfield 0 12 0 0
42.46708 -83.3015 Southfield 0 0 0 0
42.46115 -83.2168 Southfield 0 0 0 0
42.4565 -83.2293 Southfield 0 0 0 0
42.5275 -83.3129 Franklin 0 0 0 0
42.5281 -83.2437 Beverly Hills 0 0 0 0
42.49697 -83.2271 Lathrup Village 0 0 0 0
42.48894 -83.1332 Royal Oak Charter Twp 0 0 0 0
42.53071 -83.1834 Royal Oak Charter Twp 0 0 0 0
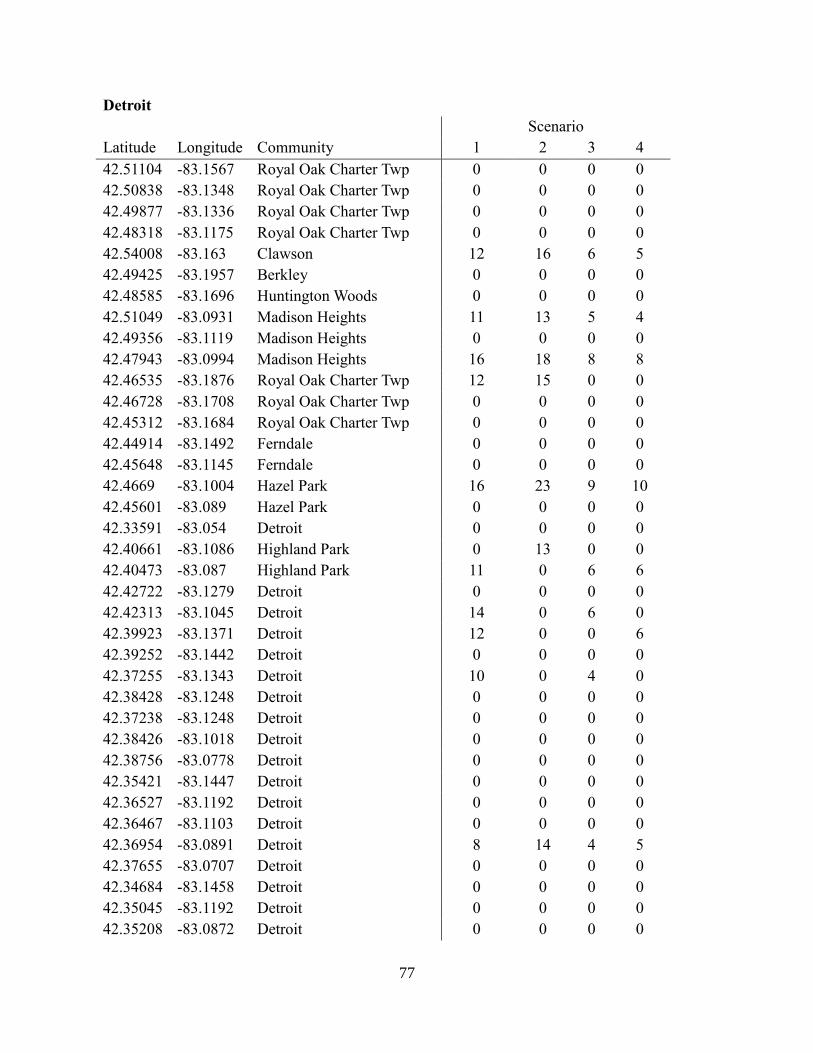
77
Detroit
Scenario
Latitude Longitude Community 1 2 3 4
42.51104 -83.1567 Royal Oak Charter Twp 0 0 0 0
42.50838 -83.1348 Royal Oak Charter Twp 0 0 0 0
42.49877 -83.1336 Royal Oak Charter Twp 0 0 0 0
42.48318 -83.1175 Royal Oak Charter Twp 0 0 0 0
42.54008 -83.163 Clawson 12 16 6 5
42.49425 -83.1957 Berkley 0 0 0 0
42.48585 -83.1696 Huntington Woods 0 0 0 0
42.51049 -83.0931 Madison Heights 11 13 5 4
42.49356 -83.1119 Madison Heights 0 0 0 0
42.47943 -83.0994 Madison Heights 16 18 8 8
42.46535 -83.1876 Royal Oak Charter Twp 12 15 0 0
42.46728 -83.1708 Royal Oak Charter Twp 0 0 0 0
42.45312 -83.1684 Royal Oak Charter Twp 0 0 0 0
42.44914 -83.1492 Ferndale 0 0 0 0
42.45648 -83.1145 Ferndale 0 0 0 0
42.4669 -83.1004 Hazel Park 16 23 9 10
42.45601 -83.089 Hazel Park 0 0 0 0
42.33591 -83.054 Detroit 0 0 0 0
42.40661 -83.1086 Highland Park 0 13 0 0
42.40473 -83.087 Highland Park 11 0 6 6
42.42722 -83.1279 Detroit 0 0 0 0
42.42313 -83.1045 Detroit 14 0 6 0
42.39923 -83.1371 Detroit 12 0 0 6
42.39252 -83.1442 Detroit 0 0 0 0
42.37255 -83.1343 Detroit 10 0 4 0
42.38428 -83.1248 Detroit 0 0 0 0
42.37238 -83.1248 Detroit 0 0 0 0
42.38426 -83.1018 Detroit 0 0 0 0
42.38756 -83.0778 Detroit 0 0 0 0
42.35421 -83.1447 Detroit 0 0 0 0
42.36527 -83.1192 Detroit 0 0 0 0
42.36467 -83.1103 Detroit 0 0 0 0
42.36954 -83.0891 Detroit 8 14 4 5
42.37655 -83.0707 Detroit 0 0 0 0
42.34684 -83.1458 Detroit 0 0 0 0
42.35045 -83.1192 Detroit 0 0 0 0
42.35208 -83.0872 Detroit 0 0 0 0
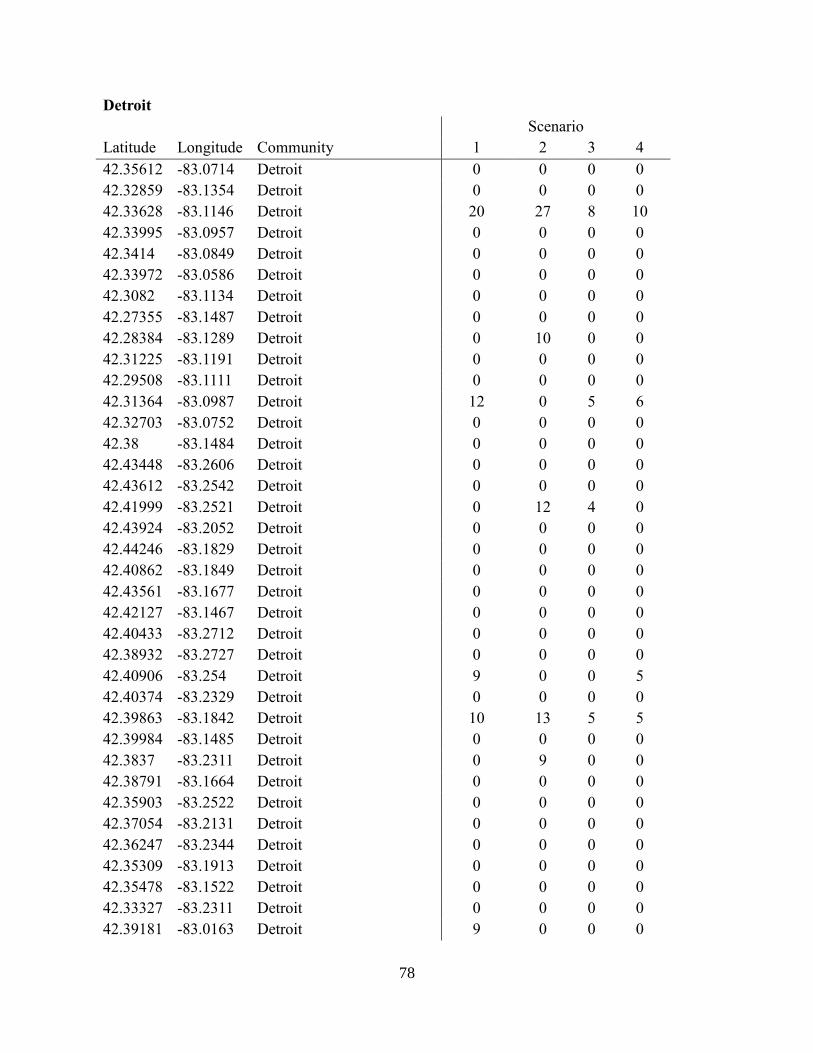
78
Detroit
Scenario
Latitude Longitude Community 1 2 3 4
42.35612 -83.0714 Detroit 0 0 0 0
42.32859 -83.1354 Detroit 0 0 0 0
42.33628 -83.1146 Detroit 20 27 8 10
42.33995 -83.0957 Detroit 0 0 0 0
42.3414 -83.0849 Detroit 0 0 0 0
42.33972 -83.0586 Detroit 0 0 0 0
42.3082 -83.1134 Detroit 0 0 0 0
42.27355 -83.1487 Detroit 0 0 0 0
42.28384 -83.1289 Detroit 0 10 0 0
42.31225 -83.1191 Detroit 0 0 0 0
42.29508 -83.1111 Detroit 0 0 0 0
42.31364 -83.0987 Detroit 12 0 5 6
42.32703 -83.0752 Detroit 0 0 0 0
42.38 -83.1484 Detroit 0 0 0 0
42.43448 -83.2606 Detroit 0 0 0 0
42.43612 -83.2542 Detroit 0 0 0 0
42.41999 -83.2521 Detroit 0 12 4 0
42.43924 -83.2052 Detroit 0 0 0 0
42.44246 -83.1829 Detroit 0 0 0 0
42.40862 -83.1849 Detroit 0 0 0 0
42.43561 -83.1677 Detroit 0 0 0 0
42.42127 -83.1467 Detroit 0 0 0 0
42.40433 -83.2712 Detroit 0 0 0 0
42.38932 -83.2727 Detroit 0 0 0 0
42.40906 -83.254 Detroit 9 0 0 5
42.40374 -83.2329 Detroit 0 0 0 0
42.39863 -83.1842 Detroit 10 13 5 5
42.39984 -83.1485 Detroit 0 0 0 0
42.3837 -83.2311 Detroit 0 9 0 0
42.38791 -83.1664 Detroit 0 0 0 0
42.35903 -83.2522 Detroit 0 0 0 0
42.37054 -83.2131 Detroit 0 0 0 0
42.36247 -83.2344 Detroit 0 0 0 0
42.35309 -83.1913 Detroit 0 0 0 0
42.35478 -83.1522 Detroit 0 0 0 0
42.33327 -83.2311 Detroit 0 0 0 0
42.39181 -83.0163 Detroit 9 0 0 0
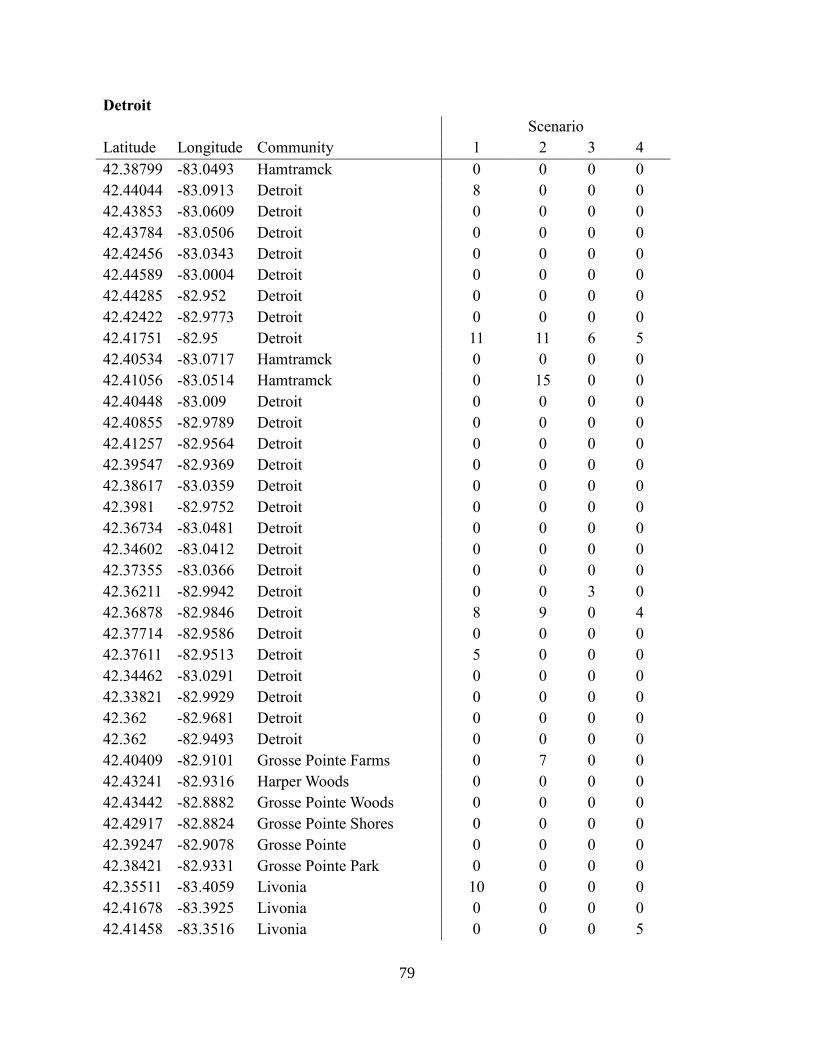
79
Detroit
Scenario
Latitude Longitude Community 1 2 3 4
42.38799 -83.0493 Hamtramck 0 0 0 0
42.44044 -83.0913 Detroit 8 0 0 0
42.43853 -83.0609 Detroit 0 0 0 0
42.43784 -83.0506 Detroit 0 0 0 0
42.42456 -83.0343 Detroit 0 0 0 0
42.44589 -83.0004 Detroit 0 0 0 0
42.44285 -82.952 Detroit 0 0 0 0
42.42422 -82.9773 Detroit 0 0 0 0
42.41751 -82.95 Detroit 11 11 6 5
42.40534 -83.0717 Hamtramck 0 0 0 0
42.41056 -83.0514 Hamtramck 0 15 0 0
42.40448 -83.009 Detroit 0 0 0 0
42.40855 -82.9789 Detroit 0 0 0 0
42.41257 -82.9564 Detroit 0 0 0 0
42.39547 -82.9369 Detroit 0 0 0 0
42.38617 -83.0359 Detroit 0 0 0 0
42.3981 -82.9752 Detroit 0 0 0 0
42.36734 -83.0481 Detroit 0 0 0 0
42.34602 -83.0412 Detroit 0 0 0 0
42.37355 -83.0366 Detroit 0 0 0 0
42.36211 -82.9942 Detroit 0 0 3 0
42.36878 -82.9846 Detroit 8 9 0 4
42.37714 -82.9586 Detroit 0 0 0 0
42.37611 -82.9513 Detroit 5 0 0 0
42.34462 -83.0291 Detroit 0 0 0 0
42.33821 -82.9929 Detroit 0 0 0 0
42.362 -82.9681 Detroit 0 0 0 0
42.362 -82.9493 Detroit 0 0 0 0
42.40409 -82.9101 Grosse Pointe Farms 0 7 0 0
42.43241 -82.9316 Harper Woods 0 0 0 0
42.43442 -82.8882 Grosse Pointe Woods 0 0 0 0
42.42917 -82.8824 Grosse Pointe Shores 0 0 0 0
42.39247 -82.9078 Grosse Pointe 0 0 0 0
42.38421 -82.9331 Grosse Pointe Park 0 0 0 0
42.35511 -83.4059 Livonia 10 0 0 0
42.41678 -83.3925 Livonia 0 0 0 0
42.41458 -83.3516 Livonia 0 0 0 5
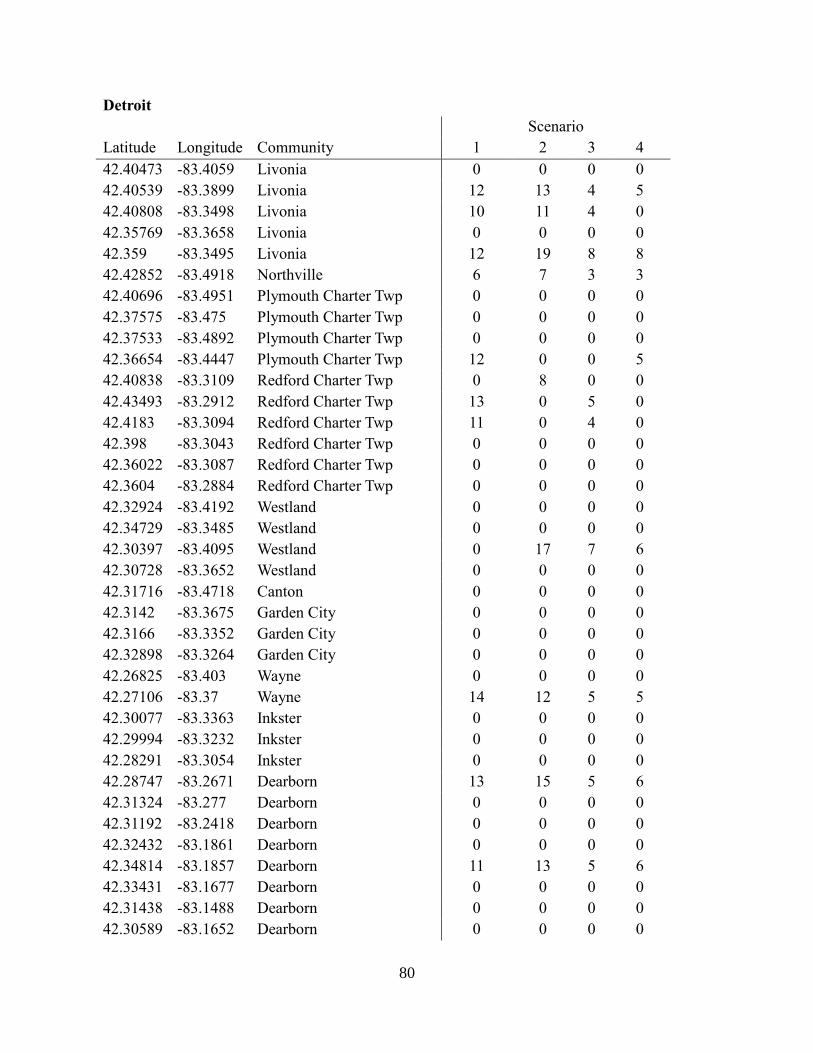
80
Detroit
Scenario
Latitude Longitude Community 1 2 3 4
42.40473 -83.4059 Livonia 0 0 0 0
42.40539 -83.3899 Livonia 12 13 4 5
42.40808 -83.3498 Livonia 10 11 4 0
42.35769 -83.3658 Livonia 0 0 0 0
42.359 -83.3495 Livonia 12 19 8 8
42.42852 -83.4918 Northville 6 7 3 3
42.40696 -83.4951 Plymouth Charter Twp 0 0 0 0
42.37575 -83.475 Plymouth Charter Twp 0 0 0 0
42.37533 -83.4892 Plymouth Charter Twp 0 0 0 0
42.36654 -83.4447 Plymouth Charter Twp 12 0 0 5
42.40838 -83.3109 Redford Charter Twp 0 8 0 0
42.43493 -83.2912 Redford Charter Twp 13 0 5 0
42.4183 -83.3094 Redford Charter Twp 11 0 4 0
42.398 -83.3043 Redford Charter Twp 0 0 0 0
42.36022 -83.3087 Redford Charter Twp 0 0 0 0
42.3604 -83.2884 Redford Charter Twp 0 0 0 0
42.32924 -83.4192 Westland 0 0 0 0
42.34729 -83.3485 Westland 0 0 0 0
42.30397 -83.4095 Westland 0 17 7 6
42.30728 -83.3652 Westland 0 0 0 0
42.31716 -83.4718 Canton 0 0 0 0
42.3142 -83.3675 Garden City 0 0 0 0
42.3166 -83.3352 Garden City 0 0 0 0
42.32898 -83.3264 Garden City 0 0 0 0
42.26825 -83.403 Wayne 0 0 0 0
42.27106 -83.37 Wayne 14 12 5 5
42.30077 -83.3363 Inkster 0 0 0 0
42.29994 -83.3232 Inkster 0 0 0 0
42.28291 -83.3054 Inkster 0 0 0 0
42.28747 -83.2671 Dearborn 13 15 5 6
42.31324 -83.277 Dearborn 0 0 0 0
42.31192 -83.2418 Dearborn 0 0 0 0
42.32432 -83.1861 Dearborn 0 0 0 0
42.34814 -83.1857 Dearborn 11 13 5 6
42.33431 -83.1677 Dearborn 0 0 0 0
42.31438 -83.1488 Dearborn 0 0 0 0
42.30589 -83.1652 Dearborn 0 0 0 0
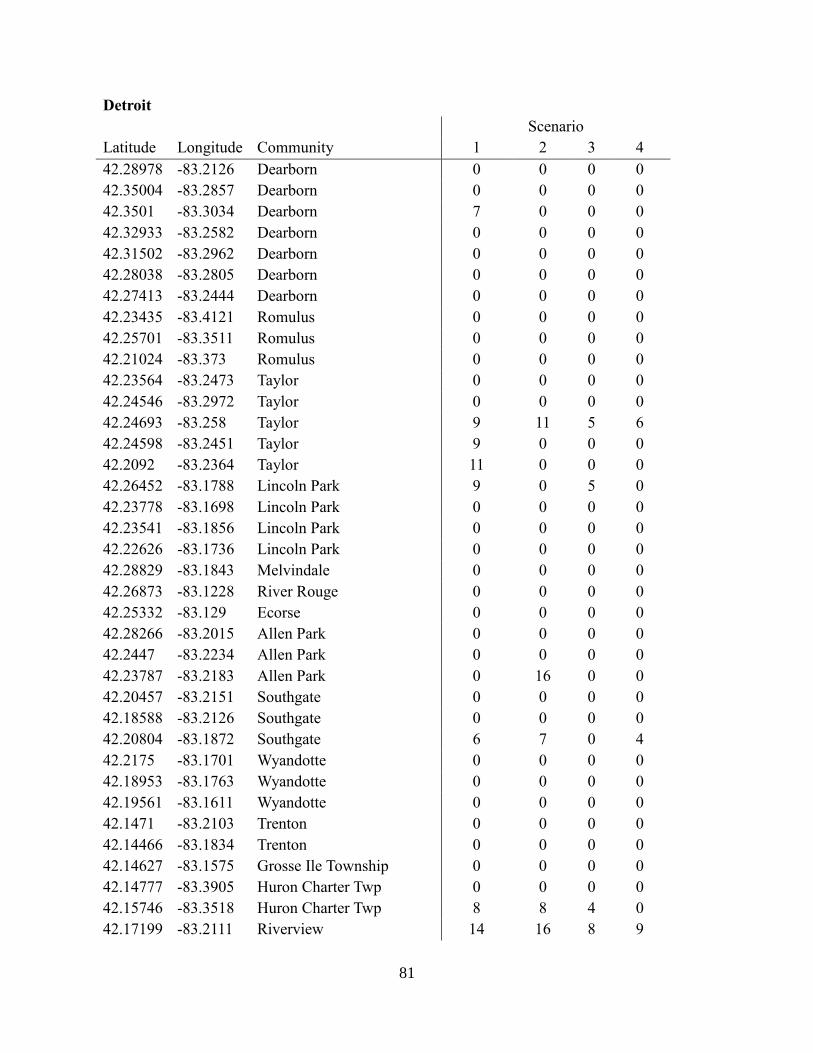
81
Detroit
Scenario
Latitude Longitude Community 1 2 3 4
42.28978 -83.2126 Dearborn 0 0 0 0
42.35004 -83.2857 Dearborn 0 0 0 0
42.3501 -83.3034 Dearborn 7 0 0 0
42.32933 -83.2582 Dearborn 0 0 0 0
42.31502 -83.2962 Dearborn 0 0 0 0
42.28038 -83.2805 Dearborn 0 0 0 0
42.27413 -83.2444 Dearborn 0 0 0 0
42.23435 -83.4121 Romulus 0 0 0 0
42.25701 -83.3511 Romulus 0 0 0 0
42.21024 -83.373 Romulus 0 0 0 0
42.23564 -83.2473 Taylor 0 0 0 0
42.24546 -83.2972 Taylor 0 0 0 0
42.24693 -83.258 Taylor 9 11 5 6
42.24598 -83.2451 Taylor 9 0 0 0
42.2092 -83.2364 Taylor 11 0 0 0
42.26452 -83.1788 Lincoln Park 9 0 5 0
42.23778 -83.1698 Lincoln Park 0 0 0 0
42.23541 -83.1856 Lincoln Park 0 0 0 0
42.22626 -83.1736 Lincoln Park 0 0 0 0
42.28829 -83.1843 Melvindale 0 0 0 0
42.26873 -83.1228 River Rouge 0 0 0 0
42.25332 -83.129 Ecorse 0 0 0 0
42.28266 -83.2015 Allen Park 0 0 0 0
42.2447 -83.2234 Allen Park 0 0 0 0
42.23787 -83.2183 Allen Park 0 16 0 0
42.20457 -83.2151 Southgate 0 0 0 0
42.18588 -83.2126 Southgate 0 0 0 0
42.20804 -83.1872 Southgate 6 7 0 4
42.2175 -83.1701 Wyandotte 0 0 0 0
42.18953 -83.1763 Wyandotte 0 0 0 0
42.19561 -83.1611 Wyandotte 0 0 0 0
42.1471 -83.2103 Trenton 0 0 0 0
42.14466 -83.1834 Trenton 0 0 0 0
42.14627 -83.1575 Grosse Ile Township 0 0 0 0
42.14777 -83.3905 Huron Charter Twp 0 0 0 0
42.15746 -83.3518 Huron Charter Twp 8 8 4 0
42.17199 -83.2111 Riverview 14 16 8 9

82
Detroit
Scenario
Latitude Longitude Community 1 2 3 4
42.12275 -83.2295 Woodhaven 0 0 0 0
42.14916 -83.296 Brownstown Charter Twp 0 0 0 0
42.05708 -83.1979 Brownstown Charter Twp 0 0 0 0
42.10348 -83.2667 Flat Rock 0 0 0 0
42.06904 -83.2351 Rockwood 0 0 0 0