electric vehicle preparedness: task 2, identification …...g11-2898k 2011 chevrolet impala sedan -...
TRANSCRIPT

The INL is a U.S. Department of Energy National Laboratory operated by Battelle Energy Alliance
INL/MIS-15-34855
Electric Vehicle Preparedness: Task 2, Identification of Vehicles for Installation of Data Loggers for Naval Air Station Whidbey Island
Stephen Schey Jim Francfort
March 2015

DISCLAIMER
This information was prepared as an account of work sponsored by an agency of the U.S. Government. Neither the U.S. Government nor any agency thereof, nor any of their employees, makes any warranty, expressed or implied, or assumes any legal liability or responsibility for the accuracy, completeness, or usefulness, of any information, apparatus, product, or process disclosed, or represents that its use would not infringe privately owned rights. References herein to any specific commercial product, process, or service by trade name, trade mark, manufacturer, or otherwise, does not necessarily constitute or imply its endorsement, recommendation, or favoring by the U.S. Government or any agency thereof. The views and opinions of authors expressed herein do not necessarily state or reflect those of the U.S. Government or any agency thereof.

INL/MIS-15-34855
Electric Vehicle Preparedness: Task 2, Identification of Vehicles for Installation of Data
Loggers for Naval Air Station Whidbey Island
Stephen Schey Jim Francfort2
1Stephen Schey, Project Manager, Infrastructure Planning and Analysis, Intertek Testing Services, North America, Phoenix, AZ
2Jim Francfort, Vehicle Systems Principal Investigator, Idaho National Laboratory operated by Battelle Energy Alliance, Idaho Falls, ID
March 2015
Idaho National Laboratory Idaho Falls, Idaho 83415
http://avt.inl.gov
Prepared for the U.S. Department of Energy Office of Nuclear Energy
Under DOE Idaho Operations Office Contract DE-AC07-05ID14517

iv
ABSTRACT
Battelle Energy Alliance, LLC, managing and operating contractor for the U.S. Department of Energy’s Idaho National Laboratory, is the lead laboratory for the U.S. Department of Energy’s advanced vehicle testing. Battelle Energy Alliance, LLC contracted with Intertek Testing Services, North America (Intertek) to conduct several U.S. Department of Defense-based studies to identify potential U.S. Department of Defense transportation systems that are strong candidates for introduction or expansion of plug-in electric vehicles (PEVs).
A survey of the inventory of non-tactical fleet vehicles at Naval Air Station Whidbey Island (NASWI) was completed in Task 1. This information and characterization were used to select vehicles for further monitoring, which involves data logging of vehicle movements in order to identify the vehicle’s mission and travel requirements. Individual observations of these selected vehicles provide the basis for recommendations related to PEV adoption. It also identifies whether a battery electric vehicle or plug-in hybrid electric vehicle (collectively referred to as PEVs) can fulfill the mission requirements and provides observations related to placement of PEV charging infrastructure.
This report provides the list of vehicles selected by NASWI and Intertek for further monitoring. This fulfills the Task 2 requirements.
Intertek acknowledges the support of Idaho National Laboratory, Naval Facilities Engineering Command Northwest, and the NASWI fleet managers and personnel for participation in this study.
Intertek is pleased to provide this report and is encouraged by enthusiasm and support from Naval Facilities Engineering Command personnel.

v
EXECUTIVE SUMMARY
Federal agencies are mandateda to purchase alternative fuel vehicles, increase consumption of alternative fuels, and reduce petroleum consumption. Available plug-in electric vehicles (PEVs) provide an attractive option in the selection of alternative fuel vehicles. PEVs, which consist of both battery electric vehicles and plug-in hybrid electric vehicles, have significant advantages over internal combustion engine vehicles in terms of energy efficiency, reduced petroleum consumption, and reduced production of greenhouse gas emissions, and they provide performance benefits with quieter, smoother operation. This study intended to evaluate the extent to which Naval Air Station Whidbey Island (NASWI) could convert part or all of their fleet of vehicles from petroleum-fueled vehicles to PEVs.
The Task 1 report provided the assessment of the existing non-tactical fleet of vehicles at NASWI to characterize its current components. From this characterization, the 60-vehicle subset of representative vehicles was selected for an in-depth assessment, leading to specific results for these selected vehicles and wider extrapolation to the full fleet of vehicles.
The NASWI non-tactical fleet contains 175 vehicles for which counterpart PEVs are currently available or which are expected to be available in the near future. Of the 175 vehicles, this report identifies a 60-vehicle subset that has been selected for further monitoring and evaluation.
a Energy Policy Act of 1992, Energy Policy Act of 2005, Executive Order 13423, and Energy Independence and Security Act of
2007.

vi
CONTENTS
ABSTRACT ................................................................................................................................................. iv
EXECUTIVE SUMMARY .......................................................................................................................... v
ACRONYMS .............................................................................................................................................. vii
1. INTRODUCTION .............................................................................................................................. 1
2. DATA LOGGERS .............................................................................................................................. 1
3. FLEET VEHICLE SELECTION ....................................................................................................... 2
3.1 All Vehicles .............................................................................................................................. 2
3.2 Sedans Only ............................................................................................................................. 7
4. OBSERVATIONS .............................................................................................................................. 8
FIGURES
1. InTouchMVC data logger ............................................................................................................. 2
2. Vehicle type distribution for vehicles with data loggers .............................................................. 4
3. Model year distribution for vehicles with data loggers ................................................................ 5
4. Annual mileage of monitored vehicles ......................................................................................... 5
5. Vehicle mission ............................................................................................................................ 6
6. Monthly mileage distribution for monitored vehicles .................................................................. 6
7. Model year of monitored sedans ................................................................................................... 7
8. Monthly mileage of monitored sedans ......................................................................................... 8
9. Mission assignment of monitored sedans ..................................................................................... 8
TABLES
1. Monitored vehicles at NASWI ..................................................................................................... 2
2. Monitored vehicles by assignment ............................................................................................... 7

vii
ACRONYMS
BEV battery electric vehicle
Intertek Intertek Testing Services, North America
NASWI Naval Air Station Whidbey Island
PEV plug-in electric vehicle (includes BEVs and PHEVs, but not hybrid electric vehicles)
PHEV plug-in hybrid electric vehicle
SUV sports utility vehicle
1
Electric Vehicle Preparedness: Task 2, Identification of Vehicles for Installation of Data
Loggers for Naval Air Station Whidbey Island
1. INTRODUCTION The U.S. Department of Energy and the U.S. Department of Defense signed a memorandum of
understanding on July 22, 2010, for strengthening the coordination of efforts to enhance national energy security and to demonstrate federal government leadership in transitioning the United States to a low-carbon economy. The memorandum of understanding included efforts in the areas of energy efficiency, fossil fuels, alternative fuels, efficient transportation technologies and fueling infrastructure, grid security, smart grid, and energy storage.
In support of the memorandum of understanding, the Idaho National Laboratory, with funding provided by the U.S. Department of Energy’s Vehicle Technologies Office and Federal Energy Management Program, directed Intertek Testing Services, North America (Intertek) to conduct several U.S. Department of Defense-base studies to identify potential transportation systems that are strong candidates for introduction or expansion of plug-in electric vehicles (PEVs). Intertek previously had conducted similar fleet, city, state, and countrywide studies using their EV Micro-Climate® assessment process, which consists of the following four main tasks:
Task 1, Conduct a non-tactical vehicle fleet assessment
Task 2, Identify vehicles for further mission and fleet characterizations
Task 3, Perform detailed assessment of selected vehicles and charging infrastructure needs
Task 4, Provide an implementation approach for adoption of electric vehicles.
An assessment of the potential for replacing the Naval Air Station Whidbey Island (NASWI) fleet vehicles with PEVs starts with characterization of the fleet vehicles’ missions and vehicle characteristics. The assessment was presented in the Task 1 report titled, Assessment of Fleet Inventory for Naval Air Station Whidbey Island.
PEVs generally are classified into two vehicle types: battery electric vehicles (BEVs) and plug-in hybrid electric vehicles (PHEVs). A BEV contains an onboard battery that provides all motive power. PHEVs also have an onboard battery that provides some motive power; however, there is also another motive power source (such as a gasoline engine). In general, PHEVs have two modes: (1) charge-depleting mode, where the battery provides all or most (depending on the PHEV design) of the motive power and the battery is being depleted, and (2) charge-sustaining mode, where the non-battery power source provides the majority of the motive power while being supplemented by the battery power. For charge-sustaining mode, the battery state of charge is maintained within a designed range. A BEV can be considered to operate solely in a charge-depleting mode. Collectively, BEVs and PHEVs are referred to as PEVs.
The Task 1 effort led to identification of fleet vehicles that appear to be good candidates for replacement by PEVs. To validate the survey results, 60 vehicles within the candidate groups are selected for further monitoring and analysis through addition of vehicle data loggers. The Task 2 results are presented in this document.
2. DATA LOGGERS Individual privacy concerns exist when monitoring vehicle movement with data loggers. Data
collection occurs by data logger number and vehicle identification number or agency-assigned vehicle number. Intertek receives no information related to the vehicle operator and provides no raw data to the fleet managers. In this manner, Intertek does not collect, analyze, or report on individual driving habits.

2
Data are collected using non-intrusive data loggers (Figure 1) that are placed into the vehicle’s onboard diagnostic port. Installation of the data loggers and manual recording of information about the vehicle that ties the logger and vehicle together, typically take less than 5 minutes and is completed by the fleet managers or designees. The data loggers transmit vehicle information by cellular means to a data center from which Intertek retrieves this information. Once installed and activated during vehicle use, the data loggers transmit vehicle information every minute during vehicle operation by cellular communication to the data center.
Figure 1. InTouchMVC data logger.2
Intertek maintains the data logger’s connectivity and verifies data transmission weekly. Missing data (reported as “null” values) are frequently the result of lost global positioning system reception, logger device removal, or extended periods in regions with insufficient cellular reception. Intertek filters the vehicle and data logger information if these null values present a significant impact on the data collected and no resolution is possible.
Data consist of key-on events, key-off events, and position updates logged every minute while the vehicle is keyed-on. InTouchMVC fleet reporting converts these data points into records of trip events, stop events, and idle events.
From these data points, the following information will be available for evaluation:
Trip start and stop time and location
Trip distance and duration
Idle start time, location, and duration
Typical vehicle operating schedule.
The data loggers are retained on a vehicle for approximately 6 to 8 weeks to gather sufficient movement information on the vehicle.
3. FLEET VEHICLE SELECTION
3.1 All Vehicles The 60 vehicles selected by NASWI and Intertek for further study are identified in Table 1.
Table 1. Monitored vehicles at NASWI. Fleet
Vehicle Id Year Make Model EPA Class Odometer Estimated
Annual Miles G10-0984N 2008 Dodge Avenger Sedan - Compact 29,008 4,015 G10-1137M 2012 Chevrolet Malibu Sedan - Midsize 11,215 3,434 G10-1138M 2012 Chevrolet Malibu Sedan - Midsize 17,215 5,024
2 www.intouchmvc.com [accessed July 30, 2014]

3
Fleet Vehicle Id Year Make Model EPA Class Odometer
Estimated Annual Miles
G10-1139M 2012 Chevrolet Malibu Sedan - Midsize 16,019 5,200 G10-1140M 2012 Chevrolet Malibu Sedan - Midsize 9,185 2,756 G10-1141M 2011 Chevrolet Malibu Sedan - Midsize 24,026 7,061 G10-2844L 2011 Chevrolet Malibu Sedan - Midsize 53,998 12,943 G103590P 2015 Chevrolet Malibu Sedan - Midsize 1,215 9,708 G10-2848L 2011 Chevrolet Malibu Sedan - Midsize 50,134 12,118 G10-2850L 2011 Chevrolet Malibu Sedan - Midsize 51,272 12,371 G10-2968L 2011 Chevrolet Malibu Sedan - Midsize 48,057 11,509 G10-3576P 2015 Chevrolet Malibu Sedan - Midsize 1,720 9,000 G10-5286H 2009 Pontiac G6 Sedan - Compact 31,548 5,103 G42-1940N 2014 Chevrolet G1300 Van - Pass 7,464 7,464 G10-7547F 2008 Dodge Avenger Sedan - Compact 17,566 2,464 G61-0245G 2008 Ford Escape SUV 8,655 8,655 G11-0472L 2014 Chevrolet Impala Sedan - Large 84,620 1,712 G11-1424L 2012 Chevrolet Impala Sedan - Large 72,580 20,109 G11-2898K 2011 Chevrolet Impala Sedan - Large 170 20,230 G41-1136K 2010 Dodge Grd Caravan SE Minivan 68,516 13,004 G41-1137K 2010 Dodge Grd Caravan SE Minivan 9,309 1,783 G41-1139K 2010 Dodge Grd Caravan SE Minivan 54,551 10,781 G41-1140K 2010 Dodge Grd Caravan SE Minivan 9,773 1,635 G41-1142K 2010 Dodge Grd Caravan SE Minivan 36,101 7,011 G41-1155K 2010 Dodge Grd Caravan SE Minivan 23,361 4,995 G41-1349G 2008 Dodge Dakota Pickup 16,956 2,337 G41-1350G 2008 Dodge Dakota Pickup 7,238 926 G41-1351G 2008 Dodge Dakota Pickup 26,112 3,634 G41-1536L 2011 Dodge Grd Caravan SE Minivan 6,901 1,364 G41-1597L 2011 Dodge Dakota Pickup 16,980 4,065 G41-1763H 2009 Ford Ranger Pickup 13,857 2,246 G41-1765H 2009 Ford Ranger Pickup 19,085 3,073 G41-1767H 2009 Ford Ranger Pickup 19,354 3,072 G41-1768H 2009 Ford Ranger Pickup 11,571 1,896 G41-2911M 2012 Chevrolet Colorado Pickup 4,925 1,184 G41-3153P 2014 Dodge Grd Caravan SE Minivan 683 744 G41-3159P 2014 Dodge Grd Caravan SE Minivan 2,245 1,921 G41-4334M 2012 Chevrolet Colorado Pickup 11,782 672 G42-0334G 2008 Chevrolet G1300 Van - Pass 51,997 7,170 G42-0335G 2008 Chevrolet G1300 Van - Pass 44,318 5,759 G42-0587K 2010 Chevrolet Silverado Pickup 14,415 2,798 G42-0590K 2010 Chevrolet Silverado Pickup 21,557 4,206 G42-0656K 2010 Chevrolet Silverado Pickup 10,695 2,074 G42-0766L 2011 Chevrolet Silverado Pickup 11,582 2,766 G42-0881H 2009 Ford F150 Pickup 50,830 8,243 G42-1222M 2012 Chevrolet G1300 Express Van - Pass 10,894 3,215 G42-1223M 2012 Chevrolet G1300 Express Van - Pass 3,179 988 G42-1232M 2012 Ford F150 Pickup 4,892 1,479
4
Fleet Vehicle Id Year Make Model EPA Class Odometer
Estimated Annual Miles
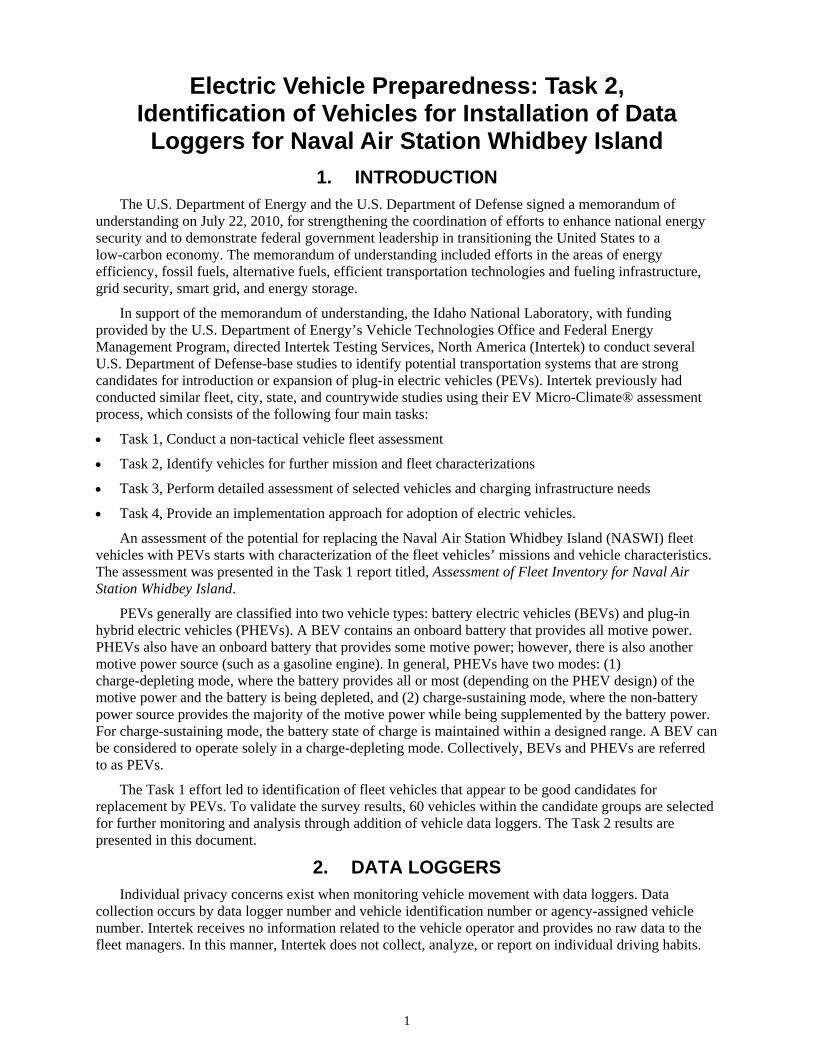
G42-1281M 2013 Ford E-350 Van - Pass 28,079 12,725 G42-2035L 2012 Chevrolet Tahoe SUV 11,320 3,680 G43-0895K 2010 Ford E-350 Van - Pass 24,610 4,842 G43-0896K 2010 Ford E-350 Van - Pass 7,212 1,401 G43-0936K 2011 Chevrolet C2500HD Van - Cargo 9,996 2,307 G43-2287M 2012 Chevrolet G2300 Van - Pass 4,896 1,441 G43-2288M 2012 Chevrolet G2300 Express Van - Pass 3,797 977 G43-3437B 2006 Ford E-350 Van - Cargo 9,095 986 G61-0513K 2010 Ford Explorer SUV 38,881 7,229 G62-0203H 2009 Ford F150 Van - Cargo 69,473 11,252 G62-0871K 2010 Ford Expedition SUV 101,291 18,874 G62-2420P 2014 Ford FI50 SSV Van - Cargo 15,980 4,752
Figure 2 shows the distribution of vehicle types monitored. It also compares the percent of vehicles monitored against the entire inventory of vehicles. This distribution is approximately representative of the fleet except for the cargo vans and minivans. The selection shifted the monitored vehicles toward a larger percentage of smaller vans, which are the more likely candidates for replacement by PEVs in the near future.
Figure 2. Vehicle type distribution for vehicles with data loggers.
Figure 3 provides distributions for model year and compares them to the full inventory of vehicles. The selected vehicles do not include many of the oldest vehicles, which are cargo vans and pickups, whose performances are better represented by newer models.

5
Figure 3. Model year distribution for vehicles with data loggers.
Figure 4 shows the annual mileage of the monitored vehicles and compares it to the full inventory of vehicles. The characteristics of monitored vehicles closely match the entire inventory.
Figure 4. Annual mileage of monitored vehicles.
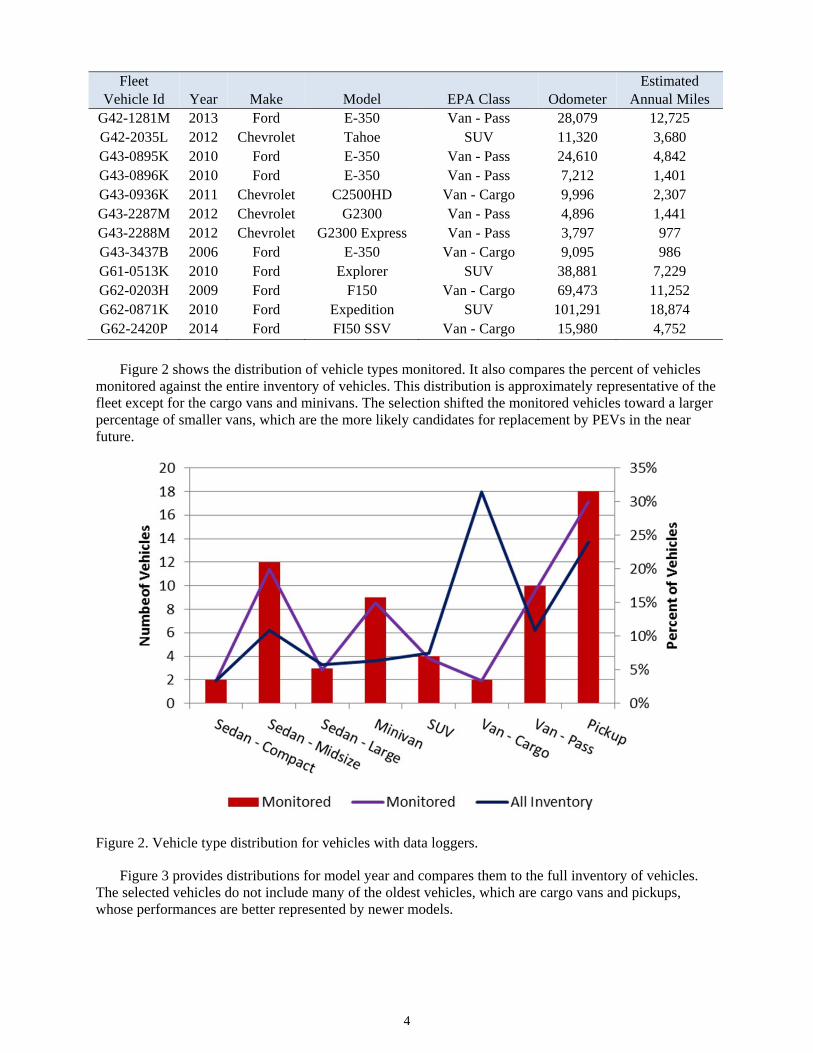
Figure 5 identifies the mission of the selected vehicles compared to the mission of the full inventory. The “transport” mission is typically used for heavier-duty vehicles, while cargo vans and pickups are more typically used in a “support” mission.
6
Figure 5. Vehicle mission.
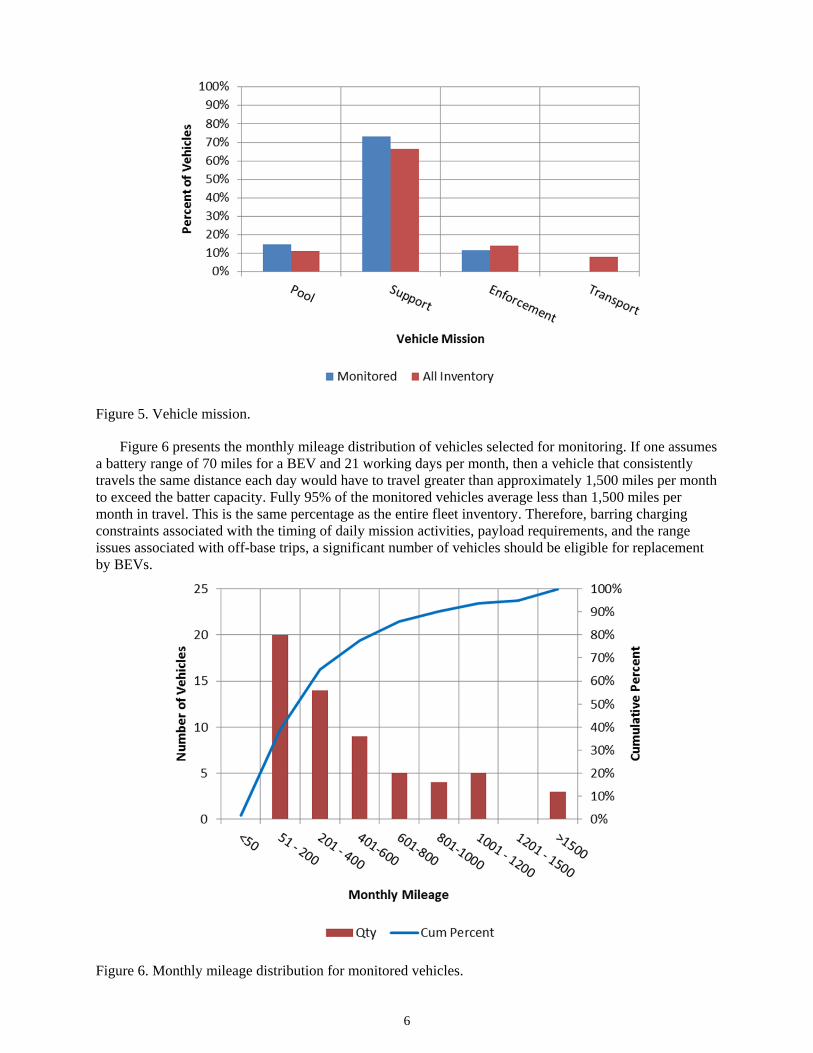
Figure 6 presents the monthly mileage distribution of vehicles selected for monitoring. If one assumes a battery range of 70 miles for a BEV and 21 working days per month, then a vehicle that consistently travels the same distance each day would have to travel greater than approximately 1,500 miles per month to exceed the batter capacity. Fully 95% of the monitored vehicles average less than 1,500 miles per month in travel. This is the same percentage as the entire fleet inventory. Therefore, barring charging constraints associated with the timing of daily mission activities, payload requirements, and the range issues associated with off-base trips, a significant number of vehicles should be eligible for replacement by BEVs.
Figure 6. Monthly mileage distribution for monitored vehicles.

7
Finally, the Task 1 report identified the 25 tenant commands (i.e., commands) and Naval Air Station departments and divisions (i.e., departments) to which the vehicles are assigned. The monitored vehicles also represent a cross section of these commands and departments (Table 2). For sedans, 68% of the monitored vehicles are assigned to departments compared to 61% of all vehicles.
Table 2. Monitored vehicles by assignment.
Sedan -
Compact Sedan - Midsize
Sedan- Large Minivan SUV
Van Cargo
Van Pass Pickup Total
Commands – 4 – 6 1 1 1 5 18
Departments 2 8 3 3 3 1 9 13 42
Total 2 12 3 9 4 2 10 18 60
3.2 Sedans Only The list of vehicles for monitoring contains 17 sedans. As identified in the Task 1 report, these sedans
are reviewed separately because, at the time of this writing, only sedan-type vehicles populate the General Services Administration list for PEVs.
Figure 2 shows the comparison of sedan types between those selected for monitoring and the whole sedan fleet. The model year comparison of selected sedans to the full sedan inventory is shown in Figure 7. Figure 8 shows the comparison of monthly mileage and Figure 9 shows the comparison of mission.
The vehicles selected for monitoring are slightly older than the full inventory of sedans. This will support replacement of vehicles in the near future as part of the implementation approach to be presented in Task 4.
Figure 7. Model year of monitored sedans.

8
Figure 8. Monthly mileage of monitored sedans.
Figure 9. Mission assignment of monitored sedans.
Selection of the sedans to be monitored closely matches that of the full sedan fleet in both the monthly mileage and in mission assignments.
4. OBSERVATIONS The 60-vehicle subset of the fleet inventory reflects the overall fleet inventory characteristics. Data
collection on these vehicles will commence and the results will be the focus of Task 3. A close match of the monitored vehicles to the full fleet allows extrapolation of data on the 60-vehicle subset to the full fleet.