electric vehicles and power plants · electric vehicles and ... hybrid and electric vehicles have...
TRANSCRIPT

ELECTRIC VEHICLES
AND
POWER PLANTS
Interactive Qualifying Project
Submission Date: 05/16/2014
From:
Khoa Nguyen ___________________________
Submitted to:
Professor Robert Thompson
___________________________
Advisor Signature
ABSTRACT
This study analyzed financial changes, emission reduction and social impacts in California 2040
if all automobiles on the roads are electric vehicles (EVs), which consist of pure electric vehicles (PEVs)
and plug-in hybrid vehicles (PHEVs). At the beginning, the current picture of California was researched,
including population, number of automobiles and their tailpipe emission, as well as electricity
generation and consumption. Data collected was analyzed and used to project the transformation of
above aspects in California from now until 2040. EVs are overall cheaper, require less maintenance
effort and provide flexibility in fueling. In general, they are much more environment-friendly, and they
also help the state depend less on petroleum usage.
Besides, results showed that electricity consumption of electric vehicles will only be 0.13% of
the predicted total consumption statewide. To accommodate the need of all electric vehicles,
approximately 673,543 of dual charging stations should be built until 2040. Also, California should
build several power plants to ensure enough electricity for statewide usage, but specific numbers and
types of power plants will be determined by various complex factors.

ACKNOWLEDGEMENTS
I would like to present my appreciation and respect to my advisor, Professor Robert Thompson,
who has spent a lot of time to help me reach the goals of this Interactive Qualifying Project. His
knowledge and experience helped me touch into the real impacts in the society. Without his support, I
am not able to finish this project completely.
Moreover, I do not forget assistance from Ms. Deborah Scott, who shared useful information and
experience about EVs, the market of EVs and her own PHEV. Next, I would like to thank Ms. Liz
Tomaszewski because I received many useful resources about charging station and electricity
consumption. Although that information was not mentioned in the report, it gave me a large view of
charging stations network and their electricity consumption in California. In addition, I would like to
thank Professor John Orr, who explained and gave me the knowledge of power plants, electricity
distribution and the emission rate from power plants. Besides, Prof. John Orr gave me many hints and
suggested me finding more important documents in the library. Finally, I’d like to acknowledge Mr.
John Swanton, a representative of California Air resources Board. He explained many questions
concerned about electricity consumption in California, zero emission plans and charging station.
TABLE OF CONTENTS
ABSTRACT ................................................................................................................................................ 1
ACKNOWLEDGEMENTS ........................................................................................................................ 2
TABLE OF CONTENTS ............................................................................................................................ 4
LIST OF TABLES ...................................................................................................................................... 6
LIST OF FIGURES .................................................................................................................................... 7
I. INTRODUCTION .............................................................................................................................. 8
II. BACKGROUND .............................................................................................................................. 10
2.1 Relevant statistics for California ................................................................................................ 10
2.1.1 Transportation statistics ...................................................................................................... 10
2.1.2 Electricity Generation & Consumption .............................................................................. 11
2.1.3 Power Plants........................................................................................................................ 12
2.1.4 Zero-emission goals and plans ............................................................................................ 14
2.2 Electric & Plug-in Hybrid Vehicles ........................................................................................... 14
2.2.1 Pure Electric Vehicle ............................................................................................................... 14
2.2.2 Plug-in Hybrid Electric Vehicle............................................................................................... 15
2.3 Charging Station Technology ......................................................................................................... 17
Types of Charging Stations ............................................................................................................... 17
III. METHODOLOGY ........................................................................................................................ 19
3.1 Background Research ..................................................................................................................... 19
3.2 Data analysis, results and discussion .............................................................................................. 19
IV. RESULTS ...................................................................................................................................... 19
4.1 Changes in number of vehicles and vehicle types .......................................................................... 20
4.2 Changes in light duty vehicles tailpipe emission rates ................................................................... 21
4.3 Changes in automobile costs of operation ...................................................................................... 22
V. DISCUSSION ................................................................................................................................... 24
5.1 Benefits ........................................................................................................................................... 24
5.1.1 Consumers’ personal benefits .................................................................................................. 24
5.1.2 Benefits for society and economy ............................................................................................ 25
5.2 Challenges ....................................................................................................................................... 25
5.2.1 Limitations of EVs ................................................................................................................... 26
5.2.2 Challenges of building charging stations ................................................................................. 26
5.2.3 Challenges in building additional power plants ....................................................................... 27
VI. CONCLUSIONS AND COMMENDATIONS ............................................................................. 30
Works Cited .............................................................................................................................................. 31
APPENDICES .......................................................................................................................................... 36
1. Interview with Ms. DEBORAH SCOTT ....................................................................................... 36
2. Interview with Prof. JOHN ORR ................................................................................................... 37
3. Interview with Ms. LIZ TOMASZEWSKI .................................................................................... 38
4. Feedback from California’s government ....................................................................................... 39

LIST OF TABLES
Table 1: Automobiles and driver licenses in California 2011 – 2013 ...................................................... 10
Table 2: Vehicles and driver licenses increase in California 2011 – 2013 .............................................. 10
Table 3: Projected increase in California in 2040 ..................................................................................... 10
Table 4: Electricity Consumption in California 2006- 2012 [9] and 2040 ............................................... 11
Table 5: California Generation plus Net Imports (Gigawatt Hours) [10] ................................................. 11
Table 6: Capacity Factor of Electricity Generation from 2001-2013 (Unit: Percentage) ......................... 13
Table 7: Average Capacity Factor of Electricity Generation 2001 – 2013 ............................................... 14
Table 8: Specifications of common light duty PEVs in US [19] .............................................................. 15
Table 9: Specifications of PHEVs in US [23] .......................................................................................... 16
Table 10: Charging Equipments [25] ........................................................................................................ 17
Table 11: Ratios of PEVs over PHEVs from 2015-2040 [26] .................................................................. 20
Table 12: Projected increase in California in 2040 ................................................................................... 21
Table 13: Light-duty gasoline vehicle emission in 2012 and 2040 .......................................................... 22
Table 14: Plug-in Hybrid Electric Vehicle emission in 2013 and 2040 ................................................... 22
Table 15: Annual Operational Cost of Gasoline Vehicles, PHEVs and EVs ........................................... 23
Table 16: Number of charging outlets and charging stations estimated in 2040 ...................................... 27
Table 17: Electric consumption of all EVs in 2040 (GWh)...................................................................... 28
Table 18: Electric consumption of California State in 2040 (GWh) ........................................................ 28
Table 19: Selected Electricity Generation Capacity (MW) [46] .............................................................. 29
Table 20: Net Selected Electricity Generation and Power Plants to be built............................................ 29

LIST OF FIGURES
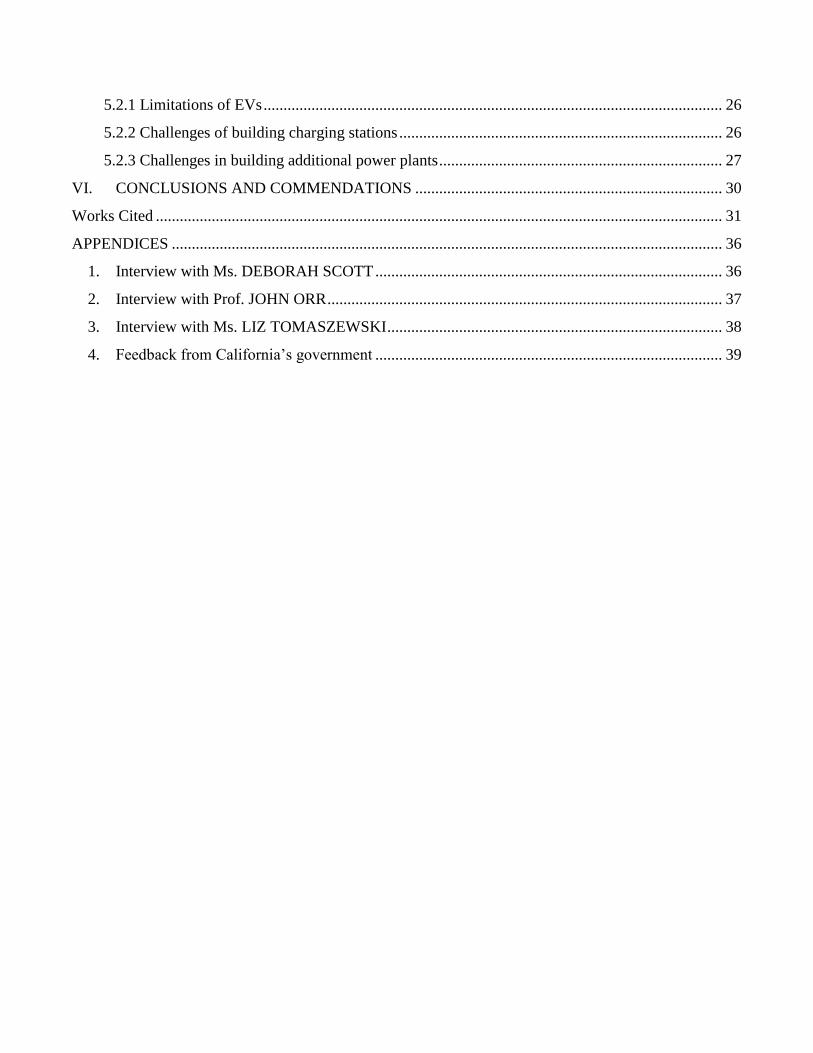
Figure 1: Can electrics rev up? [1] .............................................................................................................. 8
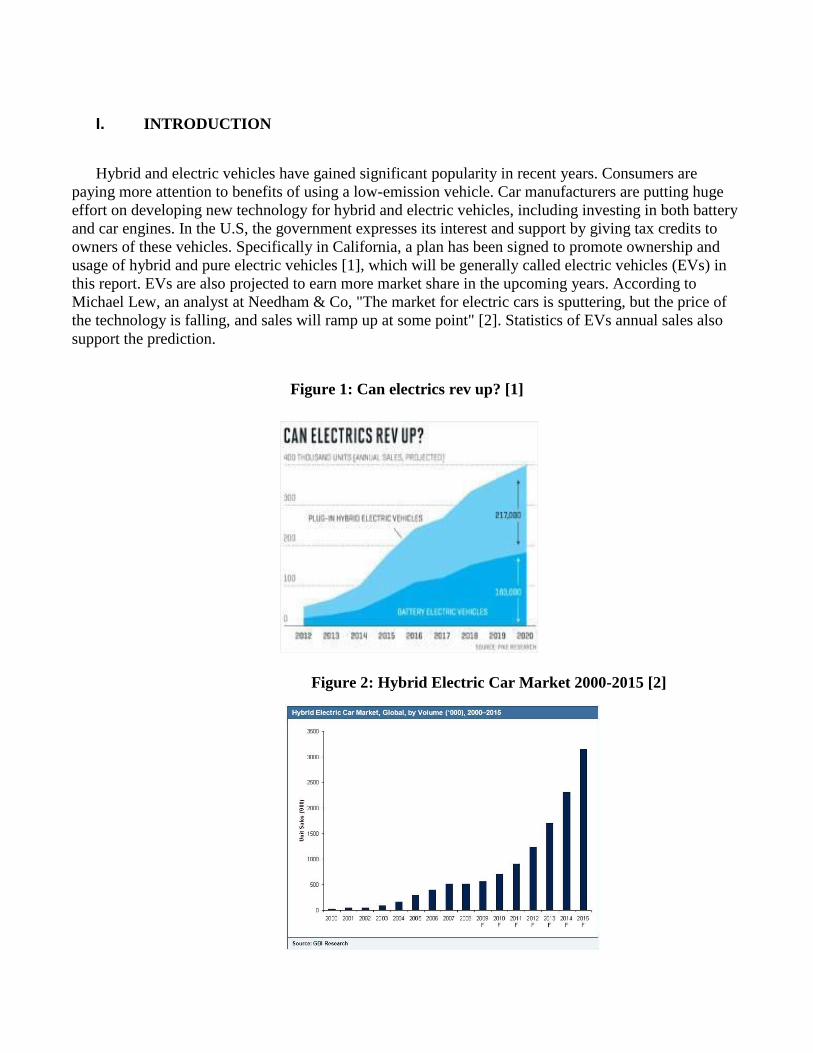
Figure 2: Hybrid Electric Car Market 2000-2015 [2] ................................................................................. 8
Figure 3: Electric Generation Capacity (MW) from 2001 – 2013 [14] .................................................... 12
Figure 4: Electric Generation in California (GWh) from 2001 - 2013 ..................................................... 13
Figure 5: Four models of PHEVs in 2013 [22] ......................................................................................... 15
Figure 6: Ratios of PEVs per PHEVs since 2015 in different scenario .................................................... 20
Figure 7: Auto – PEVs - PHEVs 2013 – 2040.......................................................................................... 21
I. INTRODUCTION
Hybrid and electric vehicles have gained significant popularity in recent years. Consumers are
paying more attention to benefits of using a low-emission vehicle. Car manufacturers are putting huge
effort on developing new technology for hybrid and electric vehicles, including investing in both battery
and car engines. In the U.S, the government expresses its interest and support by giving tax credits to
owners of these vehicles. Specifically in California, a plan has been signed to promote ownership and
usage of hybrid and pure electric vehicles [1], which will be generally called electric vehicles (EVs) in
this report. EVs are also projected to earn more market share in the upcoming years. According to
Michael Lew, an analyst at Needham & Co, "The market for electric cars is sputtering, but the price of
the technology is falling, and sales will ramp up at some point" [2]. Statistics of EVs annual sales also
support the prediction.
Figure 1: Can electrics rev up? [1]
Figure 2: Hybrid Electric Car Market 2000-2015 [2]

Meanwhile, a big question is still left unanswered, "when and how can low-emissions vehicles
replace traditional petroleum ones?" Current EV technology does not give the vehicles functionalities
comparable to their peers. A Nissan Leaf can run only 100 miles, but take 6-8 hours to be fully charged.
A Chevrolet Volt has shorter time, up to 4 hours, to charge full battery, but it only can run
approximately 50 miles in spring and up to 26 miles during winter [3]. Moreover, petroleum vehicles
have been so popular that at least one gas station is located in every town across the U.S. To provide
electricity to EVs, a considerable amount of charging stations might need to be built, let alone power
plants to support them. The current situation does not prevent CA governor Edmund G. Brown Jr. from
believing in the fate of EVs. He has ordered that 1.5 million zero-emission vehicles “be on California
roads” by 2025 [4]. This order may come true because Governor’s interagency working group has
prepared the zero-emission vehicle plan with a lot of details. And this document is signed by Governor
Edmund G. Brown Jr.
In this project, the current status of EV development was investigated, including technologies
being used, market data, potentially additional power plants to maintain electric capacities and
transportation statistics, to predict the future of EVs. Basic background of EVs and its development
history was provided. Actual data collected was presented and analyzed before giving results and
conclusions.

II. BACKGROUND
2.1 Relevant statistics for California
2.1.1 Transportation statistics
Table 1: Automobiles and driver licenses in California 2011 – 2013
2009 [5] 2011 [6] 2012 [7] 2013 [6]
CA Population [8] 36,961,664 37,668,000 37,966,000 38,332,521*
Automobiles 21,898,286 22,083,049 22,473,717 23,237,523
Total vehicles 31,779,398 31,802,483 31,946,422 32,903,847
Auto/Person 59.25% 58.63% 59.19% 60.62%
*Population in 2013 is estimated by US Census Bureau
California population and the number of vehicles give us an approximation of the current
transportation situation: a couple is likely to own at least one car, and around seven out of ten vehicles
on California roads are automobiles. Based on the average 2-year population change of 1.84% in 2009 –
2013, population may reach 49 million people and at least 29 million automobiles are needed provide
transportation to the entire state.
Table 2: Vehicles and driver licenses increase in California 2011 – 2013
2009-2011 2011-2013 2009-2013 Avg. 2-year change
Population 706,336 (1.91%) 664,521 (1.76%) 1,370,857 (3.71%) 685,429 (1.84%)
Automobiles 184,763 (0.84%) 1,154,474 (5.23%) 1,339,237 (6.12%) 669,619(3.04%)
Table 3: Projected increase in California in 2040
2040 Change from 2013-2040
Population 49,016,693 10,684,172 (27.87%)
Automobiles 29,126,536 5,889,013 (25.34%)
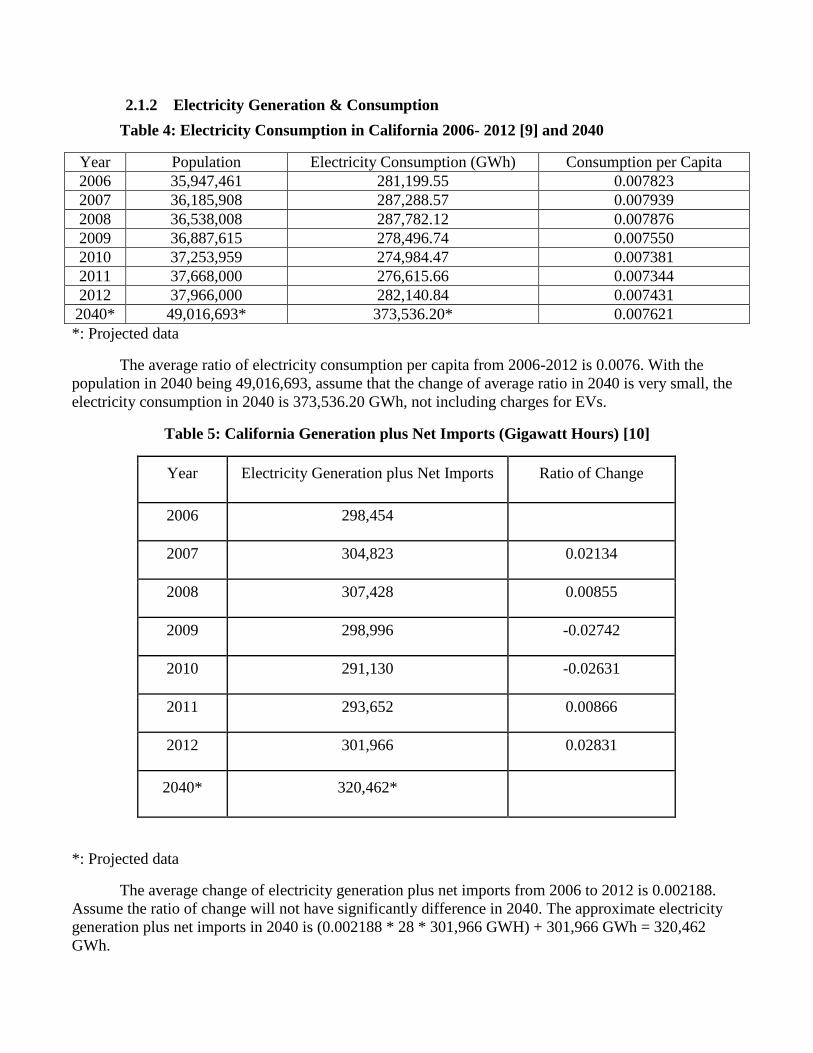
2.1.2 Electricity Generation & Consumption
Table 4: Electricity Consumption in California 2006- 2012 [9] and 2040
Year Population Electricity Consumption (GWh) Consumption per Capita
2006 35,947,461 281,199.55 0.007823
2007 36,185,908 287,288.57 0.007939
2008 36,538,008 287,782.12 0.007876
2009 36,887,615 278,496.74 0.007550
2010 37,253,959 274,984.47 0.007381
2011 37,668,000 276,615.66 0.007344
2012 37,966,000 282,140.84 0.007431
2040* 49,016,693* 373,536.20* 0.007621
*: Projected data
The average ratio of electricity consumption per capita from 2006-2012 is 0.0076. With the
population in 2040 being 49,016,693, assume that the change of average ratio in 2040 is very small, the
electricity consumption in 2040 is 373,536.20 GWh, not including charges for EVs.
Table 5: California Generation plus Net Imports (Gigawatt Hours) [10]
Year Electricity Generation plus Net Imports Ratio of Change
2006 298,454
2007 304,823 0.02134
2008 307,428 0.00855
2009 298,996 -0.02742
2010 291,130 -0.02631
2011 293,652 0.00866
2012 301,966 0.02831
2040* 320,462*
*: Projected data
The average change of electricity generation plus net imports from 2006 to 2012 is 0.002188.
Assume the ratio of change will not have significantly difference in 2040. The approximate electricity
generation plus net imports in 2040 is (0.002188 * 28 * 301,966 GWH) + 301,966 GWh = 320,462
GWh.
2.1.3 Power Plants
Ability of a power plant to produce electricity is measured by its capacity and capacity factor. In
general, capacity is the maximum electric output a generator can produce under specific conditions. It is
calculated by the generator’s manufacturer and indicates the maximum output a generator can produce
without exceeding design thermal limits [11]. Capacity factor is a measure of how often an electric
generator runs for a specific period of time. Capacity factor compares how much electric generator
actually produces with the maximum it could produce at continuous full power operation during the
same period [12]. Electric generation is the amount of gross generation less the electrical energy
consumed at the generating stations for station service or auxiliaries [13]. From those definitions, I
calculated capacity factor using a formula that will be used in Table 7.
( ( )
( ) )
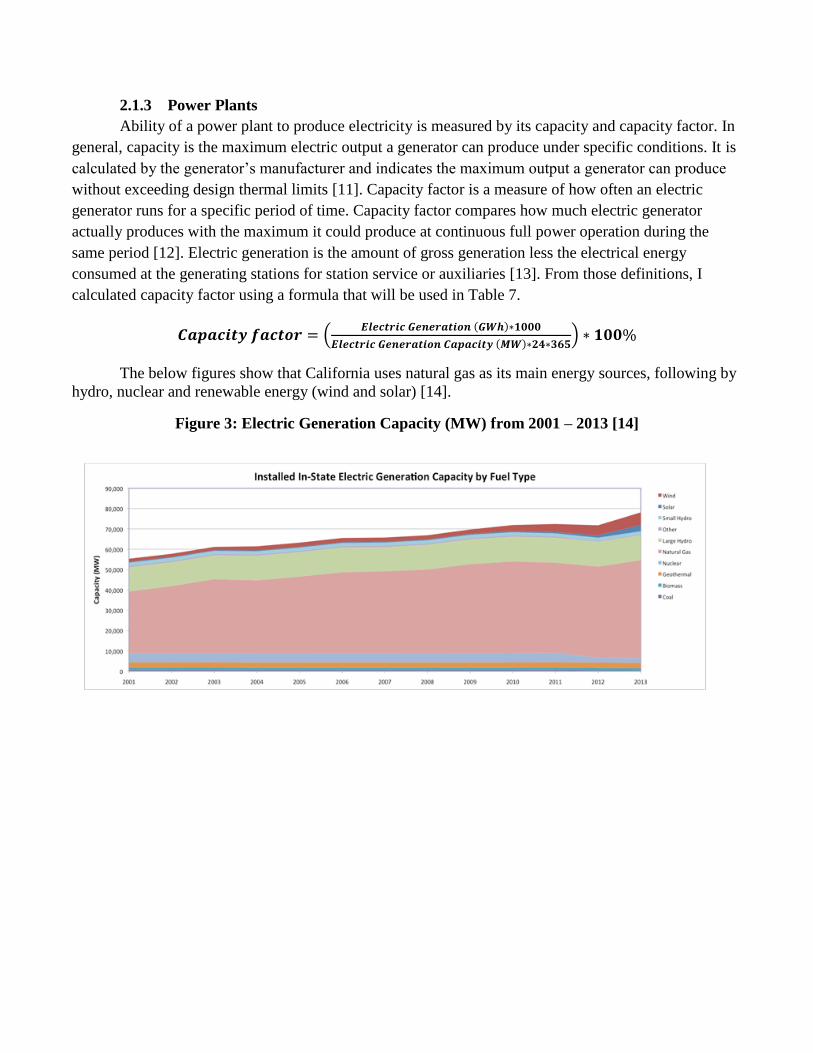
The below figures show that California uses natural gas as its main energy sources, following by
hydro, nuclear and renewable energy (wind and solar) [14].
Figure 3: Electric Generation Capacity (MW) from 2001 – 2013 [14]
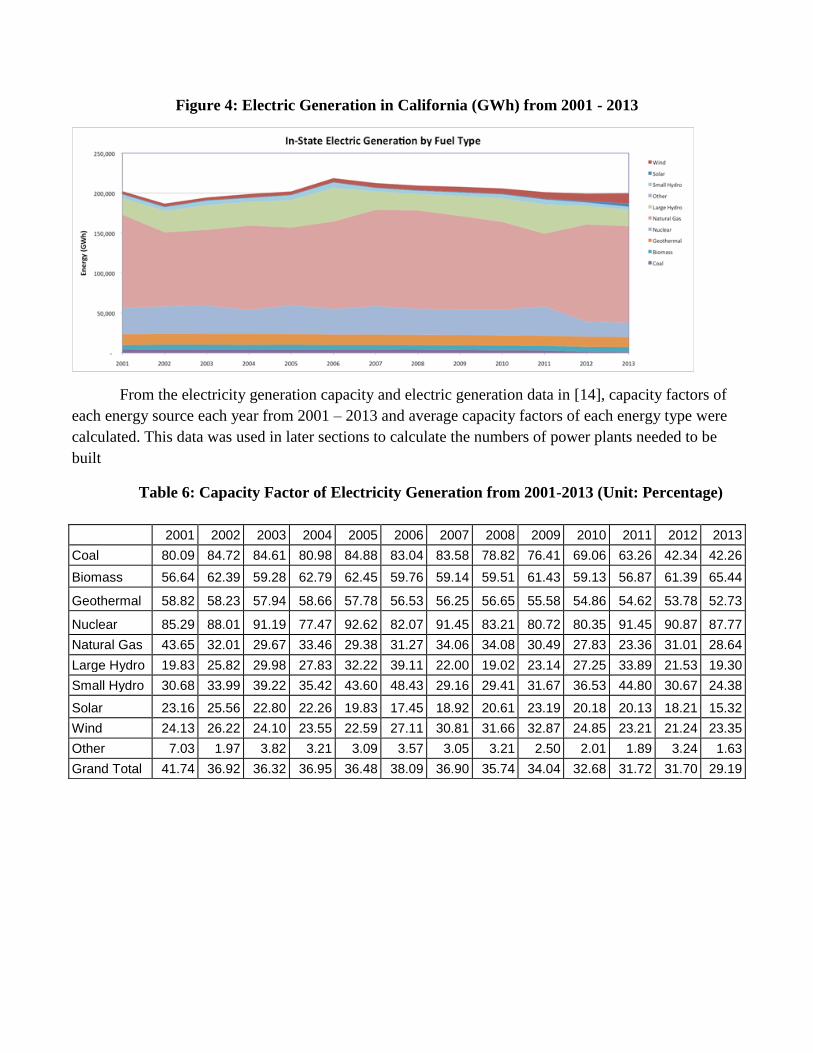
Figure 4: Electric Generation in California (GWh) from 2001 - 2013
From the electricity generation capacity and electric generation data in [14], capacity factors of
each energy source each year from 2001 – 2013 and average capacity factors of each energy type were
calculated. This data was used in later sections to calculate the numbers of power plants needed to be
built
Table 6: Capacity Factor of Electricity Generation from 2001-2013 (Unit: Percentage)
2001 2002 2003 2004 2005 2006 2007 2008 2009 2010 2011 2012 2013
Coal 80.09 84.72 84.61 80.98 84.88 83.04 83.58 78.82 76.41 69.06 63.26 42.34 42.26
Biomass 56.64 62.39 59.28 62.79 62.45 59.76 59.14 59.51 61.43 59.13 56.87 61.39 65.44
Geothermal 58.82 58.23 57.94 58.66 57.78 56.53 56.25 56.65 55.58 54.86 54.62 53.78 52.73
Nuclear 85.29 88.01 91.19 77.47 92.62 82.07 91.45 83.21 80.72 80.35 91.45 90.87 87.77
Natural Gas 43.65 32.01 29.67 33.46 29.38 31.27 34.06 34.08 30.49 27.83 23.36 31.01 28.64
Large Hydro 19.83 25.82 29.98 27.83 32.22 39.11 22.00 19.02 23.14 27.25 33.89 21.53 19.30
Small Hydro 30.68 33.99 39.22 35.42 43.60 48.43 29.16 29.41 31.67 36.53 44.80 30.67 24.38
Solar 23.16 25.56 22.80 22.26 19.83 17.45 18.92 20.61 23.19 20.18 20.13 18.21 15.32
Wind 24.13 26.22 24.10 23.55 22.59 27.11 30.81 31.66 32.87 24.85 23.21 21.24 23.35
Other 7.03 1.97 3.82 3.21 3.09 3.57 3.05 3.21 2.50 2.01 1.89 3.24 1.63
Grand Total 41.74 36.92 36.32 36.95 36.48 38.09 36.90 35.74 34.04 32.68 31.72 31.70 29.19
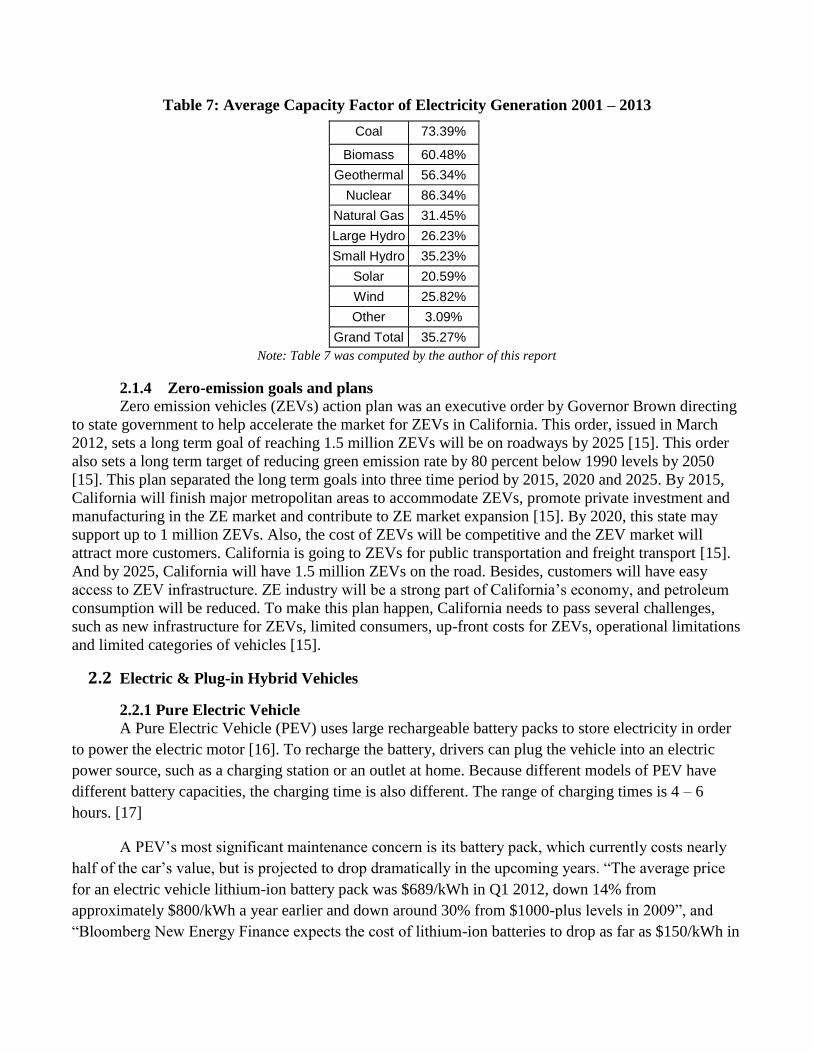
Table 7: Average Capacity Factor of Electricity Generation 2001 – 2013
Coal 73.39%
Biomass 60.48%
Geothermal 56.34%
Nuclear 86.34%
Natural Gas 31.45%
Large Hydro 26.23%
Small Hydro 35.23%
Solar 20.59%
Wind 25.82%
Other 3.09%
Grand Total 35.27%
Note: Table 7 was computed by the author of this report
2.1.4 Zero-emission goals and plans
Zero emission vehicles (ZEVs) action plan was an executive order by Governor Brown directing
to state government to help accelerate the market for ZEVs in California. This order, issued in March
2012, sets a long term goal of reaching 1.5 million ZEVs will be on roadways by 2025 [15]. This order
also sets a long term target of reducing green emission rate by 80 percent below 1990 levels by 2050
[15]. This plan separated the long term goals into three time period by 2015, 2020 and 2025. By 2015,
California will finish major metropolitan areas to accommodate ZEVs, promote private investment and
manufacturing in the ZE market and contribute to ZE market expansion [15]. By 2020, this state may
support up to 1 million ZEVs. Also, the cost of ZEVs will be competitive and the ZEV market will
attract more customers. California is going to ZEVs for public transportation and freight transport [15].
And by 2025, California will have 1.5 million ZEVs on the road. Besides, customers will have easy
access to ZEV infrastructure. ZE industry will be a strong part of California’s economy, and petroleum
consumption will be reduced. To make this plan happen, California needs to pass several challenges,
such as new infrastructure for ZEVs, limited consumers, up-front costs for ZEVs, operational limitations
and limited categories of vehicles [15].
2.2 Electric & Plug-in Hybrid Vehicles
2.2.1 Pure Electric Vehicle
A Pure Electric Vehicle (PEV) uses large rechargeable battery packs to store electricity in order
to power the electric motor [16]. To recharge the battery, drivers can plug the vehicle into an electric
power source, such as a charging station or an outlet at home. Because different models of PEV have
different battery capacities, the charging time is also different. The range of charging times is 4 – 6
hours. [17]
A PEV’s most significant maintenance concern is its battery pack, which currently costs nearly
half of the car’s value, but is projected to drop dramatically in the upcoming years. “The average price
for an electric vehicle lithium-ion battery pack was $689/kWh in Q1 2012, down 14% from
approximately $800/kWh a year earlier and down around 30% from $1000-plus levels in 2009”, and
“Bloomberg New Energy Finance expects the cost of lithium-ion batteries to drop as far as $150/kWh in

2030” [18].
Table 8: Specifications of common light duty PEVs in US [19]
Make/Model Approximate
Range (miles)
Battery
capacity
(kWH Li-ion)
MSRP Estimated cost -
2012 ($689/kWh)
Estimated cost -
2030 ($150/kWh)
[18]
Chevrolet Spark 82 20 $27,000 13780 3,000
Fiat 500e 87 24 $32,500 16,536 3,600
Ford Focus 76 23 $40,000 15,847 3,450
Mitsubishi i 62 16 $29,200 11,024 2,400
Nissan LEAF 73 24 $28,800 16,536 3,600
Smart ED 68 16.5 $25,000 11,369 2,475
Average* 74.6 20.6 30,420 $14,182 $3,088
*: calculated data
Based on Table 8, a typical battery replacement cost in 2012 is $14000, around 50% of the total
automobile cost. In California weather, a battery should last 10-15 years [20]. However, customers
buying electric cars at the mean time will not need to replace batteries until around 2028-2030, when the
cost is projected to drop to approximately $3100.
2.2.2 Plug-in Hybrid Electric Vehicle
Different from PEVs, a Plug-in Hybrid Electric Vehicle (PHEV) has a gasoline engine and an
electric motor. There are two basic plug-in hybrids on the market. Series plug-in hybrids only use motor
to turn the wheels and the gasoline engine generates electricity to power the electric motor [21]. On the
other hands, parallel or blended plug-in hybrids use both gasoline engine and electric motor to turn the
wheels [21]. Both kinds of hybrids can be recharged as drivers plug them into an electric power source.
The battery capacity of PHEV is often smaller than a PEV, so the charging time of PHEVs is shorter
than PEVs, around 1-4 hours [21].

Figure 5: Four models of PHEVs in 2013 [22]

Table 9: Specifications of PHEVs in US [23]
Make/Model Approximate Range
(miles) electric/total
range
Battery
capacity (kWH
Li-ion)
Gasoline Tank
Capacity
(Gallons)
Average MPG
(equivalent)
MSRP
Chevrolet Volt 38/380 16.5 9.3 39.5 $39,145
Ford C-Max
Energi
21/620 7.6 14 43.84 $32,950
Ford Fusion
Energi
21/620 7.6 14 43.84 $38,700
Toyota Plug-in
Prius
11/540 4.4 10.6 50.48 $32,000
Average* 22.75/534.75 9.03 11.98 44.42
*: Calculated data
From Figure 5, average mile per gallon equivalent was calculated in case the vehicles run at their
full capacity, including both electricity and gasoline. For an example, a 2013 Chevrolet Volt can run 380
miles if fully fueled. When operating with electricity, it has 98MPGe, which results in an equivalent of
0.33 gallons for 38 miles. In total, the model’s fuel economy is around 39.5MPGe. The same method is
applied for other models.
2.3 Charging Station Technology Based on updated daily station data of Energy Department of The United State, there are totally
8,091 electric charging stations, excluding private charging stations, which have approximately 19,634
charging outlets [24] in May 11th
, 2014.
Types of Charging Stations To re-charge a Plugin Electric Vehicle (PEV), equipment used to communicate to PEV from
charging stations is the electric vehicle supply equipment (EVSE). Its purpose is to ensure that an
appropriate and safe flow of electricity is supplied to the vehicle. Currently, there are three types of
charging stations. Two of them use alternating-current (AC) to charge the battery and the other uses
direct current (DC).
Table 10: Charging Equipments [25]
Input Voltage Charging rate
AC Level 1 120V AC 2 – 5 miles per hour of charging
AC Level 2 240V AC 10 – 20 miles per hour of charging
DC fast charging (DC Level 2) 480V AC 60 – 80 miles in 20 minutes of charging
AC Level 1 provides standard charging through 120 volts (V) AC to PEV via power cord. With
120V AC, customers can charge their vehicles easily from the household outlets. This type charges 2 – 5
miles of range per hour. The advantage of AC Level 1 is very convenient to use from home. However,
its disadvantage is the long charging time required. Users need to charge PEVs overnight to get a full
battery (in average more than 12 hours).
AC Level 2 charges PEV through a 240 volts (V) AC plug. Customers can reduce charging time
from 12 hours to 4 – 6 hours for a full charge (depended on various PEV models and battery capacity).
With AC Level 2, the charging station may generate 10 – 20 miles per hour. Almost all public charging
stations are using AC level 2 to help users charge their vehicles faster. Besides, users can build an AC
Level 2 charger at home. However, AC Level 2 EVSE requires installation of home charging or public
charging equipment and a dedicated circuit of 20 – 100 amps, depending on the EVSE requirements
[25]. Advantages of AC Level 2 are user can setup one EVSE at home to charge overnight from the
outlet 240V AC and can use same connector with AC Level 1. Both AC Level 1 and 2 use a standard
connector J1772 for PEVS.
DC fast charging or DC Level 2 is a superfast charger currently. This charger has input voltage
is 480V AC. The alternative current is converted to direct current (DC) at the charging station before the
current flows to the vehicle. This type may charge full battery within 20 minutes (depend on PEVs’
models). But, only limited PEVs can use DC fast charger because this type has a different connector.
III. METHODOLOGY
The purpose of this project was to forecast the future of California in 2040 where all automobiles
driven are pure and plug-in hybrid electric. The project analyzed changes in transportation cost,
electricity supply and consumption, emission level as well as impacts on the society and economy. The
project also discussed consequences and proposed solutions to negative side effects resulted from such
changes.
3.1 Background Research
To gain basic knowledge about EVs, charging stations and electric distribution, the author had
interviews with Professor John Orr of Electrical and Computer Engineering Department, Ms. Deborah
Scott and Ms. Liz Tomaszewski, faculties at Worcester Polytechnic Institute (WPI) to collect
information about charging stations, knowledge about power plant and its distribution to charging
station and experience from a real user.
Data about transportation, emissions, power plants and resources for power plants were
researched to support ideas and arguments in results and discussion section. In addition, EV’s
performance of different brands in terms of cost, travel distance, charging time and battery capacity
were also collected to examine the costs and benefits of constructing additional power plants and
charging stations. The data was also used to discuss advantages and drawbacks of using an electric
vehicle.
3.2 Data analysis, results and discussion
The following methods were used to predict and analyze aspects of the transformation:
Collect and analyze data about California population and registered vehicles in recent years.
Future data is inferred from present data, particularly the number of automobiles in 2040
and the number of traditional vehicles need to be replaced.
Collect and analyze current emission rates in California, including emission from vehicles.
Future data of the following two scenarios was calculated and compared against each other:
California 2040 where all automobiles are electric, and California 2040 where all
automobiles are petroleum engine-powered.
Collect and analyze current electricity generation and consumption, from which predict
electricity demand in 2040. The forecast also includes the number of power plants and the
number of charging stations to be built potentially. Power plants types such as coal, nuclear
and renewable kinds are also discussed and compared to estimate efficiency and pollution
level.
From current and future data reported, discuss and conclude positive impacts as well as
unexpected side effects of the transformation.

IV. RESULTS
4.1 Changes in number of vehicles and vehicle types
Table 11: Ratios of PEVs over PHEVs from 2015-2040 [26]
High Scenario Low
Scenario
Medium
Scenario
2015 0.029568 0.380614 0.205091
2018 0.029512 0.340962 0.185237
2020 0.04568 0.352003 0.198842
2022 0.068042 0.393672 0.230857
2024 0.089424 0.409411 0.249418
2040* 0.1941 0.4642 0.3291
*: Projected data
Figure 6: Ratios of PEVs per PHEVs since 2015 in different scenario
From Table 11, the medium scenario was calculated by taking average of the other two
scenarios. After that, a linear regression was used to draw three linear lines representing high, medium
and low scenarios, to estimate the ratio in 2040. The medium scenario was chosen to calculate in later
sections. In addition, amount of PHEVs and PEVs in 2040 were calculated by using system of linear
equations with the ratio 0.3291 in 2040 and the total vehicles in 2040 (29,126,536 vehicles)
{
The unknown variables in this system of linear equation were amount of PHEVs and PEVs. Solving the
linear in systems yielded 21,914,480 PHEVs and 7,212,056 PEVs.
y = 0.007x + 0.0191 R² = 0.8722
y = 0.0044x + 0.3542 R² = 0.2922
y = 0.0057x + 0.1866 R² = 0.5893
0
0.05
0.1
0.15
0.2
0.25
0.3
0.35
0.4
0.45
0 2 4 6 8 10
Rat
ios
of
EVs
pe
r P
HEV
s
Years since 2015
High Scenario
Low Scenario
Medium Scenario
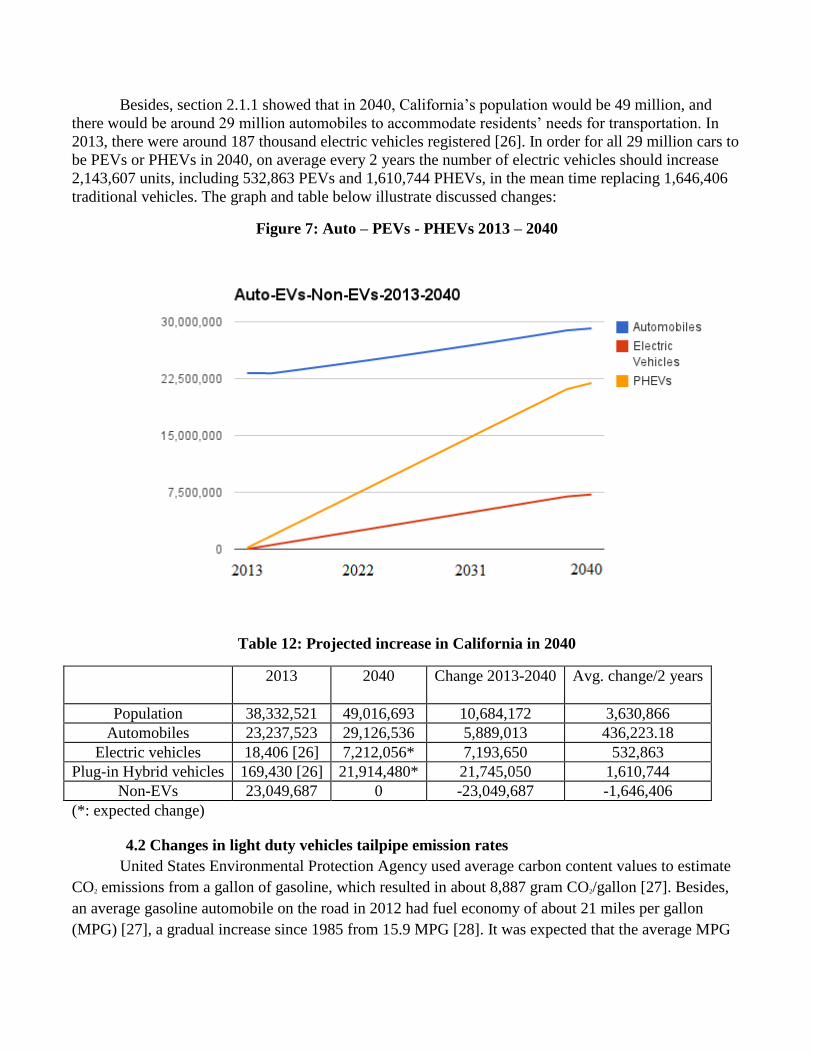
Besides, section 2.1.1 showed that in 2040, California’s population would be 49 million, and
there would be around 29 million automobiles to accommodate residents’ needs for transportation. In
2013, there were around 187 thousand electric vehicles registered [26]. In order for all 29 million cars to
be PEVs or PHEVs in 2040, on average every 2 years the number of electric vehicles should increase
2,143,607 units, including 532,863 PEVs and 1,610,744 PHEVs, in the mean time replacing 1,646,406
traditional vehicles. The graph and table below illustrate discussed changes:
Figure 7: Auto – PEVs - PHEVs 2013 – 2040
Table 12: Projected increase in California in 2040
2013 2040 Change 2013-2040 Avg. change/2 years
Population 38,332,521 49,016,693 10,684,172 3,630,866
Automobiles 23,237,523 29,126,536 5,889,013 436,223.18
Electric vehicles 18,406 [26] 7,212,056* 7,193,650 532,863
Plug-in Hybrid vehicles 169,430 [26] 21,914,480* 21,745,050 1,610,744
Non-EVs 23,049,687 0 -23,049,687 -1,646,406
(*: expected change)
4.2 Changes in light duty vehicles tailpipe emission rates
United States Environmental Protection Agency used average carbon content values to estimate
CO2 emissions from a gallon of gasoline, which resulted in about 8,887 gram CO2/gallon [27]. Besides,
an average gasoline automobile on the road in 2012 had fuel economy of about 21 miles per gallon
(MPG) [27], a gradual increase since 1985 from 15.9 MPG [28]. It was expected that the average MPG
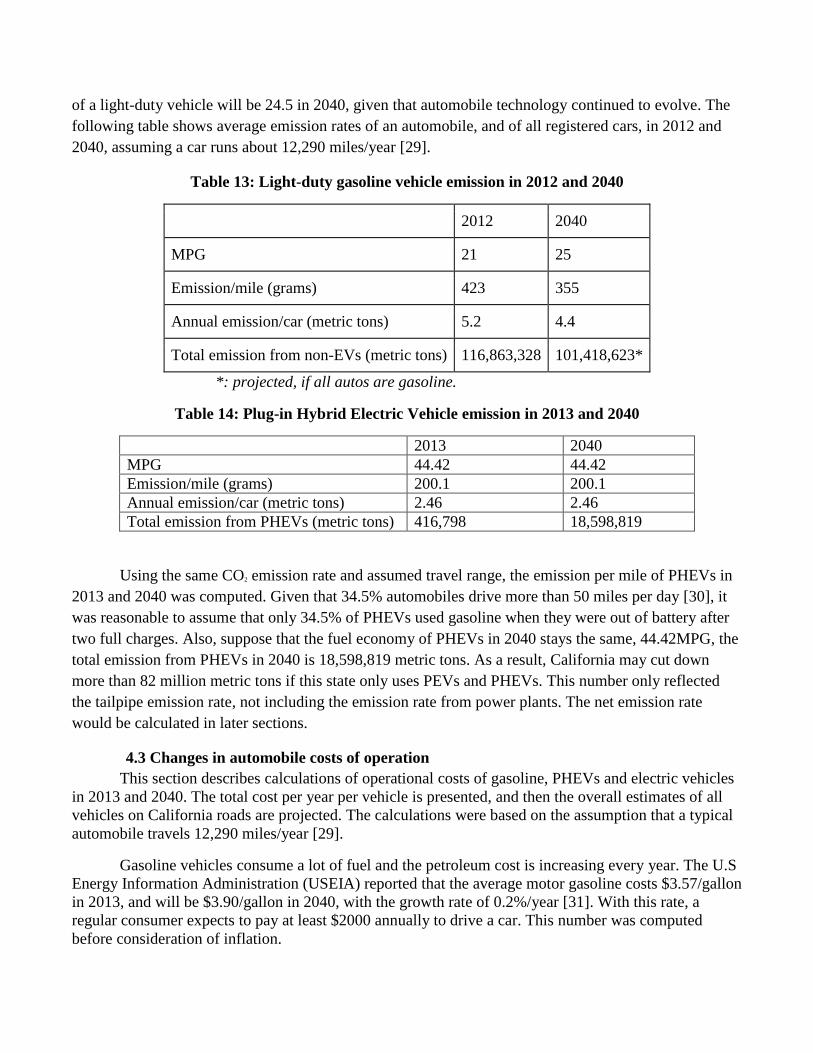
of a light-duty vehicle will be 24.5 in 2040, given that automobile technology continued to evolve. The
following table shows average emission rates of an automobile, and of all registered cars, in 2012 and
2040, assuming a car runs about 12,290 miles/year [29].
Table 13: Light-duty gasoline vehicle emission in 2012 and 2040
2012 2040
MPG 21 25
Emission/mile (grams) 423 355
Annual emission/car (metric tons) 5.2 4.4
Total emission from non-EVs (metric tons) 116,863,328 101,418,623*
*: projected, if all autos are gasoline.
Table 14: Plug-in Hybrid Electric Vehicle emission in 2013 and 2040
2013 2040
MPG 44.42 44.42
Emission/mile (grams) 200.1 200.1
Annual emission/car (metric tons) 2.46 2.46
Total emission from PHEVs (metric tons) 416,798 18,598,819
Using the same CO2 emission rate and assumed travel range, the emission per mile of PHEVs in
2013 and 2040 was computed. Given that 34.5% automobiles drive more than 50 miles per day [30], it
was reasonable to assume that only 34.5% of PHEVs used gasoline when they were out of battery after
two full charges. Also, suppose that the fuel economy of PHEVs in 2040 stays the same, 44.42MPG, the
total emission from PHEVs in 2040 is 18,598,819 metric tons. As a result, California may cut down
more than 82 million metric tons if this state only uses PEVs and PHEVs. This number only reflected
the tailpipe emission rate, not including the emission rate from power plants. The net emission rate
would be calculated in later sections.
4.3 Changes in automobile costs of operation
This section describes calculations of operational costs of gasoline, PHEVs and electric vehicles
in 2013 and 2040. The total cost per year per vehicle is presented, and then the overall estimates of all
vehicles on California roads are projected. The calculations were based on the assumption that a typical
automobile travels 12,290 miles/year [29].
Gasoline vehicles consume a lot of fuel and the petroleum cost is increasing every year. The U.S
Energy Information Administration (USEIA) reported that the average motor gasoline costs $3.57/gallon
in 2013, and will be $3.90/gallon in 2040, with the growth rate of 0.2%/year [31]. With this rate, a
regular consumer expects to pay at least $2000 annually to drive a car. This number was computed
before consideration of inflation.

Table 15: Annual Operational Cost of Gasoline Vehicles, PHEVs and EVs
MPG Cost per mile
($U.S)
Annual cost ($U.S)
2013 Gasoline Vehicles 21 0.170 2040
PHEVs 44.42 (MPGe) 0.080 983.2
PEVs 112.33 (MPGe) 0.032 393.28
2040 Gasoline Vehicles 25 0.160 1920
PHEVs 44.42 (MPGe) 0.088 1170.4
PEVs 112.33 (MPGe) 0.035 465.5
On the other hand, electric vehicles are very cost-efficient compared to their gasoline peers.
According to the Department of Energy, “today's light-duty PEVs (or PHEVs in electric mode) can
exceed 100 mpg and can achieve 30-40 kWh per 100 miles” [32]. Electricity price is significantly
cheaper than gasoline’s, with the California residential rate in 2013 being 11.6 cents/kwh, and is
expected to increase to 13.3 cents/kwh in 2040 [33]. The unit kWh per 100 miles of PEVs and PHEVs
was converted to MPGe (equivalent MPG) to compare with MPG of gasoline vehicles. It was assumed
that PEVs consumed 30kWh per 100 miles in 2013 and 2040, equivalent to 3370 [34] /30kWh = 112.33
MPGe.
From above calculations, it was clear that the annual operational cost of electric or plugin-
hybrid vehicles is significantly lower, around $500-$1,200 compared to $1,920 of gasoline cars in 2040.
Currently typical PEVs and PHEVs batteries can last 10-15 years [20], and battery prices are expected to
drop to $3,000-$4,000. Hence over a course of 12 years from 2014, the estimated cost of a PEV or
PHEV is around $18,000 compared to $24,000 of a gasoline vehicle, a saving of approximately $6,000
.
V. DISCUSSION
5.1 Benefits
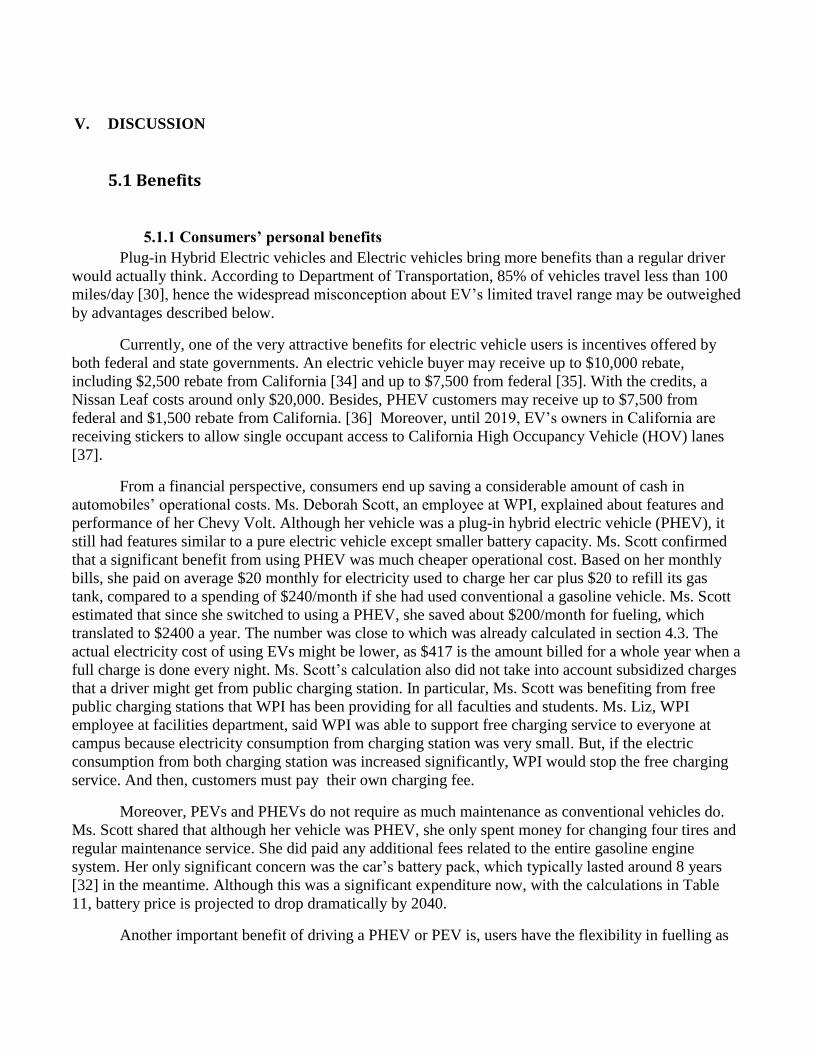
5.1.1 Consumers’ personal benefits
Plug-in Hybrid Electric vehicles and Electric vehicles bring more benefits than a regular driver
would actually think. According to Department of Transportation, 85% of vehicles travel less than 100
miles/day [30], hence the widespread misconception about EV’s limited travel range may be outweighed
by advantages described below.
Currently, one of the very attractive benefits for electric vehicle users is incentives offered by
both federal and state governments. An electric vehicle buyer may receive up to $10,000 rebate,
including $2,500 rebate from California [34] and up to $7,500 from federal [35]. With the credits, a
Nissan Leaf costs around only $20,000. Besides, PHEV customers may receive up to $7,500 from
federal and $1,500 rebate from California. [36] Moreover, until 2019, EV’s owners in California are
receiving stickers to allow single occupant access to California High Occupancy Vehicle (HOV) lanes
[37].
From a financial perspective, consumers end up saving a considerable amount of cash in
automobiles’ operational costs. Ms. Deborah Scott, an employee at WPI, explained about features and
performance of her Chevy Volt. Although her vehicle was a plug-in hybrid electric vehicle (PHEV), it
still had features similar to a pure electric vehicle except smaller battery capacity. Ms. Scott confirmed
that a significant benefit from using PHEV was much cheaper operational cost. Based on her monthly
bills, she paid on average $20 monthly for electricity used to charge her car plus $20 to refill its gas
tank, compared to a spending of $240/month if she had used conventional a gasoline vehicle. Ms. Scott
estimated that since she switched to using a PHEV, she saved about $200/month for fueling, which
translated to $2400 a year. The number was close to which was already calculated in section 4.3. The
actual electricity cost of using EVs might be lower, as $417 is the amount billed for a whole year when a
full charge is done every night. Ms. Scott’s calculation also did not take into account subsidized charges
that a driver might get from public charging station. In particular, Ms. Scott was benefiting from free
public charging stations that WPI has been providing for all faculties and students. Ms. Liz, WPI
employee at facilities department, said WPI was able to support free charging service to everyone at
campus because electricity consumption from charging station was very small. But, if the electric
consumption from both charging station was increased significantly, WPI would stop the free charging
service. And then, customers must pay their own charging fee.
Moreover, PEVs and PHEVs do not require as much maintenance as conventional vehicles do.
Ms. Scott shared that although her vehicle was PHEV, she only spent money for changing four tires and
regular maintenance service. She did paid any additional fees related to the entire gasoline engine
system. Her only significant concern was the car’s battery pack, which typically lasted around 8 years
[32] in the meantime. Although this was a significant expenditure now, with the calculations in Table
11, battery price is projected to drop dramatically by 2040.
Another important benefit of driving a PHEV or PEV is, users have the flexibility in fuelling as

PHEVs and EVs can be charged at home, and PHEVs can use gasoline as a backup plan to generate
power to electric motor as necessary. With a short travel range, PHEVs may not need to use gasoline at
all. For PEVs, there is no need to stop at a gas station to refill gasoline anymore. If a user uses a level 1
AC charger, he or she can plug PEVs or PHEVs into an electric power source in the evening, and the car
will be ready by the following morning. The charging time will reduce to only 4-6 hours for PEVs or 1-4
hours for PHEVs if the user uses a level 2 AC charger. Current EV technology is sufficient for regular
daily trips of most American, as around 80% of vehicles traveled less than 75 miles per day [30]. With
California’s population growing from year to year, the number of houses, schools, shopping places and
workplaces are also expected to grow; it is unlikely that the number of daily traveled miles will increase.
Assuming that the mentioned ratio does not grow in 2040, with the current capacity of battery pack of
around 70 miles, one full charge per day is typically enough for most drivers. On the other hand, for
long trips, PHEVs can achieve approximate 540 miles with battery and gasoline. And both PEVs and
PHEVs can always use public charging stations at their convenience when the infrastructure is more
widely available.
5.1.2 Benefits for society and economy
According to the Department of Energy, three quarters of total U.S. petroleum consumption was
spent for transportation [35], with 32% of which being used by automobiles [38]. Overall, automobiles
alone consumed nearly one quarter of all petroleum available in the U.S. From section 4.3’s results, the
estimated fuelling cost for 23 million autos in California 2014 was around US$55.77 billion annually.
Likewise, the same cost for 29 million autos in California 2040 was expected to be US$55.92 billion
annually. If California is going to replace 1,646,706 gasoline vehicles by at least the same amount of
either PEVs or PHEVs, where a single vehicle saves at least $1,000 compared to its gasoline peer, the
state may save US$1.65 billion of fuelling cost per year.
Using electric vehicles will dramatically reduce tailpipe emission level. Emission from gasoline
vehicles in California is an extremely important issue that its government has to resolve because more
than 95% of Californians live in areas that fail to meet federal or state air quality standards [39]. In
2010, carbon dioxide emission level in California was the second highest across U.S, around 370 million
metric tons, with nearly 65% of which comes from petroleum [40]. Section 4.2’s results showed that
automobile’s tailpipe emission in 2013 was around 116 million metric tons, 32% of total emission, and
was expected to decrease to 101 million in 2040 if no electric vehicles are used. With new technologies,
gasoline vehicles can reduce emission per mile, but not significantly. If PEVs and PHEVs are the only
kind of automobiles on California roads in 2040, carbon dioxide emission level can reduce to only
around 18 million metric tons, around 18% of the total emission, nearly half of the level in 2013.
5.2 Challenges
5.2.1 Limitations of EVs
Currently, the biggest limitation of electric vehicles is short travel distance compared to its
gasoline peers. As calculated in Table 11, a typical PEV can travel only 75 miles, just enough for a day
trip to places within 30 miles of a driver’s home; a PHEV can travel only 20-30 miles in electricity,
before it starts to use gasoline. Meanwhile, a conventional gasoline vehicle can travel around 300 miles
with a full gas tank. Electric vehicles also need to be charged in several hours, or in the best case several
minutes, while a conventional car can be fully fueled in 5 minutes at any gas station. Another
disadvantage is that while gas stations are very common to find across California streets and along
highways, charging stations are not, making it almost impossible for an electric vehicle to travel high
miles in the meantime. The issue will be resolved if more charging stations are built, and the battery
technology is improved to produce higher capacity battery packs.
Another drawback of electric vehicles is that their suggested retail prices are considerably higher
than gasoline vehicles’. EV technologies are too new to the market, and its annual sales statistics are not
high enough to motivate manufacturers’ to lower their prices. With its limitation in travel range, it is
understandable that a household owning an EV also owns gasoline vehicles. Current cash rebates and
tax incentives are not attractive enough for an average person with medium income to choose a PEV or a
PHEV over its gasoline peer, if he or she cannot afford to own both vehicles. In fact, EV buyers are
looking to take advantage of the parking and driving privileges that the state is offering. But the
privileges will expire 2019, suggesting that the California government needs to introduce other types of
incentives to boost EV purchases statewide.
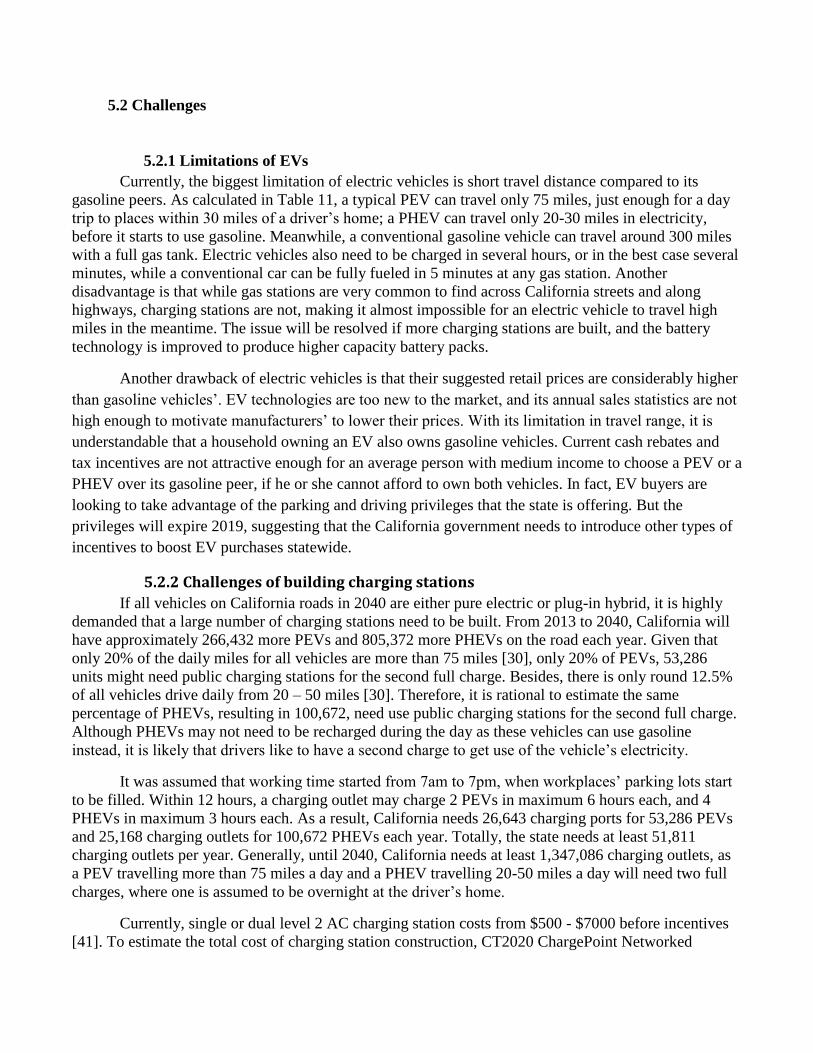
5.2.2 Challenges of building charging stations
If all vehicles on California roads in 2040 are either pure electric or plug-in hybrid, it is highly
demanded that a large number of charging stations need to be built. From 2013 to 2040, California will
have approximately 266,432 more PEVs and 805,372 more PHEVs on the road each year. Given that
only 20% of the daily miles for all vehicles are more than 75 miles [30], only 20% of PEVs, 53,286
units might need public charging stations for the second full charge. Besides, there is only round 12.5%
of all vehicles drive daily from 20 – 50 miles [30]. Therefore, it is rational to estimate the same
percentage of PHEVs, resulting in 100,672, need use public charging stations for the second full charge.
Although PHEVs may not need to be recharged during the day as these vehicles can use gasoline
instead, it is likely that drivers like to have a second charge to get use of the vehicle’s electricity.
It was assumed that working time started from 7am to 7pm, when workplaces’ parking lots start
to be filled. Within 12 hours, a charging outlet may charge 2 PEVs in maximum 6 hours each, and 4
PHEVs in maximum 3 hours each. As a result, California needs 26,643 charging ports for 53,286 PEVs
and 25,168 charging outlets for 100,672 PHEVs each year. Totally, the state needs at least 51,811
charging outlets per year. Generally, until 2040, California needs at least 1,347,086 charging outlets, as
a PEV travelling more than 75 miles a day and a PHEV travelling 20-50 miles a day will need two full
charges, where one is assumed to be overnight at the driver’s home.
Currently, single or dual level 2 AC charging station costs from $500 - $7000 before incentives
[41]. To estimate the total cost of charging station construction, CT2020 ChargePoint Networked

Charging Stations [42] was chosen as a model of a dual charging station. Priced around $7,300, it
supplies two 7.2 kW (240V at 30A) level 2 charging ports, and it has network connection to support
electronic payment and location services to help users in locating available charging stations via
smartphones or computers. If California is going to utilize this model, the total cost to build 673,543
charging stations from now until 2040 is $4,916,863,900, with approximately $189,110,150 needed to
build 25906 stations each year. As a suggestion, the targeted number can be reached if the state is able to
collect around $100 from each vehicle, given around additional one million PEVs and PHEVs are
registered with California DMV annually. There are various ways to achieve this by either raising
vehicle registration fees, sales tax, excise tax on gasoline or reducing the amount of tax incentives.
Another viable solution is to install stations that can accommodate up to four vehicles at the
same time [43]. Although the cost of such charging stations could not be found and they seem not to be
as popular as their dual plug-in peers, this type of stations are likely to be cheaper, since installation and
equipment costs can be reduced considerably compared to the number of dual stations needed to supply
electricity to the same amount of vehicles, let alone savings of physical spaces.
Table 16: Number of charging outlets and charging stations estimated in 2040
2014 (currently) To be added each year 2040
Charging outlets 5,137 [44] 51,811 1,347,086
Charging stations (2 connectors) 1,711 [44]
25,906 673,543
Charging stations (4 connectors) 12,953 336,772
The location and distance between charging stations depends on different geographic and
demographic situations. A dual EV charging station only takes up a small space between two parking
lots, unlike a gas station, where a lot more space is needed for temporary customers’ parking. The model
CT2020 is only 55.5 in x 11.8 in x 8.5 in dimension. Electric charging stations may be built along with
parking signs on streets that allow public parking. At shopping centers or companies’ campus, charging
stations can be built in parking lots, first as specific spots and later expands to a larger area. Among
available EV models, Mitsubishi i has the shortest range of 62 miles, hence it is suggested that the
longest distance between two stations should be 55 miles, considering that the vehicle needs to save the
last 10% of its battery for emergency. Moreover, on highways, charging stations can be built within
areas of current gas and services stations, with the number of stations varying depending on the
population density.
5.2.3 Challenges in building additional power plants
Using the same statistics as in the previous section where 80% of the vehicles drive less than 75
miles per day [30], it was assumed that 80% of PEVs only need one full charge per day, either
completed overnight at the drivers’ homes or at a charging station. The other 20% which travel more

than 75 miles would need one additional charge completed during daytime, most likely at a charging
station. Similarly, 53% of the vehicles drive less than 20 miles per day and 12.5% of the vehicles drive
25 – 50 miles per day [30]. Hence if 53% of PHEVs only need the one full charge, most likely at home,
then 12.5% of PHEVs need the second charge during daytime and the rest of PHEVs (34.5%) use
gasoline when they are out of battery for longer trips. From results in section 2.2.1 and 2.2.2, if in
average a PEV needs 20.6 kWh for one full charge, it needs 41.2 kWh for two full charges. Likewise, a
PHEV needs 9.03 kWh for one full charge and 18.06 kWh for two full charges.
Table 17: Electric consumption of all EVs in 2040 (GWh)
2040
1 full charge (80%) 480.005313
2 full charges (20%) 240.002657
Total 720.00797
Table 18: Electric consumption of California State in 2040 (GWh)
2040
without EVs 373,536
with EVs 374,256
In 2040, 29 million PEVs and PHEVs only consume approximate 493 GWh, equivalent to 0.13%
of the entire electric consumption. In fact, electric consumption of all PEVs and PHEVs is negligible
when considering the increasing total electric consumption of California from 2013 to 2040. Even if all
vehicles in 2040 need to take two full charges per day, the total electric consumption of EVs is around
693 GWh, around 0.19% of the statewide electric consumption.
In 2012, California generated 199,324 GWh of electricity, imported 102,000 GWh and
consumed 282,141 GWh, 93.5% of total available electricity. In 2040, assume that California will
consume the same percentage and save 6.5% remaining for other purposes, the projected net generation
is 399,094 GWh. Additionally, it is assumed that California 2040 also imports the same amount of
electricity as in 2012, 102,000 GWh. The rest of electricity generation, 297,094 GWh needs to be
produced in-state. After all, from 2012 to 2040, California needs to generate 97,770 GWh more.
The electric generation capacity of a California power plant database [45] was calculated to
estimate how many power plants need to be built in 2040. Since for a type of energy source, capacities
of different power plants varied greatly, the average capacity was computed and used along with the
largest capacity to compute results. For instance, if California builds additional natural gas power plants

that have maximum capacity as of right now, 2484 MW, it may need to build 15 more plants. Otherwise,
if the state aims to build smaller plants with the calculated average capacity, the number of added plants
raise to 313. In general, California needs to build a lot of power plants in the future if it chooses natural
gas, renewable energy and hydropower energy sources, as these types have low capacity factors, as
mentioned in section 2.1.2. However, if California is going to use only nuclear power to generate more
97,770 GWh in 2040, the state only needs to build 6 additional power plants because nuclear power
plant has large electric capacity factor, 86.34%. The below table contains projected results in 2040,
given that California continues to focus on its current top four energy sources [14].
Table 19: Selected Electricity Generation Capacity (MW) [46]
Quantity Min Max Average Standard Deviation
Natural gas 410 0.1 2484 113.5 278.9
Nuclear Energy 1 2323 0
Renewable Energy 271 0.2 550 32.08 59.44
Hydro 365 0.1 1331 37.14 115.95
Table 20: Net Selected Electricity Generation and Power Plants to be built
Net Electricity Generation
(GWh)
Power Plants to be built Emission from power
plants (metric ton)
Maximum Average Max Average
Natural Gas 6843.5 312.7 15 313 50,334,69
Nuclear Energy 17569.7 6 n/a
Renewable
Energy
1118.02 65.21 88 1500 n/a
Hydro 3582.98 99.98 28 978 n/a
Considering emission levels, while emissions from renewable, nuclear and hydropower power
plants are negligible, the average carbon dioxide emission rate of a natural gas power plant is 1135
lbs/MWh [47]. If California only builds this type of power plants to meet the state’s demand, carbon
dioxide emission will increase 50,334,669 metric tons more. Results from section 4.2 show that tailpipe
emission in 2040 will be around 101 million metric tons if all vehicles on the roads are gasoline.
However, it will only be 18 million metric tons if all vehicles are electric or plug-in hybrid. Overall, net
emission is reduced 33 million metric tons, with more than two thirds of the projected emission coming
from power plants to supply electricity to the entire California population. The state may consider
combinations of different energy sources to generate electricity efficiently and be more environment-
friendly, but decisions have to take into account various complex factors, including but not limited to
financial and demographic situation, available technologies and political effects.

VI. CONCLUSIONS AND RECOMMENDATIONS
Overall, PEVs and PHEVs are one of the popular solutions for the current fueling and emission
issues. Analyses and calculations were done based on an assumption that the entire California
population is switching to electric vehicles from now until 2040. At the end of this period, California is
projected to have around 29 million vehicles on its roads. With all of them being either electric or plug-
in hybrid, projected operational costs per vehicle may be reduced to $18,000, in which a single driver
may save $1,000 annually, not including battery replacement cost. Carbon dioxide emission level can be
cut at least 33 million metric ton from the current level. Moreover, the state can save around 1.65 billion
dollars annually from gasoline fueling cost, and electricity consumption of 29 million PEVs and PHEVs
is only 0.13% of the total statewide consumption, indicating EVs to be a promising future in using
alternative fueling.
Transforming into using PEVs and PHEVs does have two main challenges: building more
charging stations and power plants. Until 2040, 673,543 dual charging stations need to be built, costing
around $4.9 billion. Although EVs electricity consumption is trivial compared to the total consumption,
additional power plants need to be built to supply around 97,770 GWh for the entire state. The suggested
number of plants needed was listed, depending on different types of energy sources. However,
determining what types to build is a difficult task given that numerous factors need to be considered.
With limitations of EVs discussed in 5.2, the only solution is to invest in research and
development, to improve current battery technology. The largest drawback of current EVs is their
limited travel range, which is determined by battery technology. If a battery pack is able to provide
travel range equivalent to that of a gasoline vehicle, EVs sales are going to see significant growth. Other
limitations will soon be obsolete as technologies are evolving rapidly along with increasing average
annual income.
Although the cost of building additional charging stations and power plants, as well as the cost of
investing in EV technology may be significant, positive impacts of electric vehicles in general
outweighs their weaknesses. A saving of $1,000/year for a driver means he or she has more available
cash for other expenditures, which in turn helps the retail shopping and services sectors of the economy.
Cutting petroleum usage will help the country depend less on this limited energy source, a considerable
amount of which is being imported. Lower emission levels give fresher, cleaner air to the environment
and improve the overall population’s health. This is equivalent to lower expenses for healthcare, happier
lives, and more work productivity.

Works Cited
[1] B. Dumaine, "Can Coda's electric car survive?," 12 September 2012. [Online]. Available:
http://tech.fortune.cnn.com/2012/09/12/coda-electric-car/. [Accessed 30 03 2014].
[2] P. R. Log, "GBI: Power Discretes Market to 2020 on reports-research.com," PRLOG - Press
Release Distribution, 16 09 2010. [Online]. Available: http://www.prlog.org/10935371-gbi-power-
discretes-market-to-2020-on-reports-researchcom.html. [Accessed 02 04 2014].
[3] D. Scott, Interviewee, Experiences in using Chevrolet Volt. [Interview]. 11 2013.
[4] T. W. S. Journal, "A Green Car Named Desire," 17 09 2013. [Online]. Available:
http://online.wsj.com/news/articles/SB10001424127887323981304579079321154539590.
[Accessed 1 10 2013].
[5] C. D. o. M. Vehicles, "California DMV Statistics Year 2009," 01 01 2010. [Online]. Available:
http://apps.dmv.ca.gov/pubs/newsrel/media_center/california_dmv_statistics.htm. [Accessed 12 04
2014].
[6] S. o. C. -. D. o. M. Vehicles, "Statistics For Publication," March 2014. [Online]. Available:
http://apps.dmv.ca.gov/about/profile/official.pdf. [Accessed 30 03 2014].
[7] C. D. o. M. Vehicles, "California DMV Statistics 2012," 01 01 2013. [Online]. Available:
http://apps.dmv.ca.gov/about/profile/ca_dmv_stats.pdf. [Accessed 12 04 2014].
[8] U. S. C. Bureau, "Population in California 2010-2013," 2013. [Online]. Available:
http://www.census.gov/popest/data/state/totals/2013/. [Accessed 15 04 2014].
[9] E. C. D. M. System, "Electricity Consumption by County," [Online]. Available:
http://www.ecdms.energy.ca.gov/elecbycounty.aspx. [Accessed 19 04 2014].
[10] E. A. California, "Electricity Generation," [Online]. Available:
http://energyalmanac.ca.gov/electricity/electricity_generation.html. [Accessed 18 04 2014].
[11] U. E. I. Administration, "What is the difference between electricity generation capacity and
electricity generation?," [Online]. Available: http://www.eia.gov/tools/faqs/faq.cfm?id=101&t=3.
[Accessed 25 04 2014].
[12] U. E. I. Administration, "What is a capacity factor?," [Online]. Available:
http://www.eia.gov/tools/faqs/faq.cfm?id=187&t=3. [Accessed 25 04 2014].
[13] U. E. I. Administration, "Glossary," [Online]. Available:
http://www.eia.gov/tools/glossary/index.cfm?id=N. [Accessed 29 04 2014].
[14] E. A. California, "Electric Generation Capacity and Energy," [Online]. Available:
http://energyalmanac.ca.gov/electricity/electric_generation_capacity.html. [Accessed 19 04 2014].
[15] C. G. I. W. Group, "ZEV Action Plan," 02 2013. [Online]. Available:
http://opr.ca.gov/docs/Governor's_Office_ZEV_Action_Plan_(02-13).pdf. [Accessed 04 05 2014].
[16] U. D. o. Energy, "Hybrid and Plug-In Electric Vehicles," [Online]. Available:
http://www.afdc.energy.gov/vehicles/electric.html. [Accessed 08 05 2014].
[17] U. D. o. Energy, "All-Electric Vehicles (EVs)," [Online]. Available:
http://www.fueleconomy.gov/feg/evtech.shtml. [Accessed 07 05 2014].
[18] B. N. E. Finance, "Electric Vehicle Battery Prices Down 14% Year on Year," [Online]. Available:
http://www.newenergyfinance.com/PressReleases/view/210. [Accessed 19 04 2014].
[19] P. America, "Plug-in Vehicle Tracker - What's Comming, When," [Online]. Available:
http://www.pluginamerica.org/vehicles. [Accessed 11 04 2014].
[20] K. et.al, "Comparison of Battery Life Across Real-World Automotive Drive-Cycles," [Online].
Available: http://www.nrel.gov/docs/fy12osti/53470.pdf. [Accessed 18 04 2014].
[21] U. D. o. Energy, "Plug-in Hybrids," [Online]. Available:
http://www.fueleconomy.gov/feg/phevtech.shtml. [Accessed 08 05 2014].
[22] U. D. o. Energy, "PHEVs compare side-by-side," [Online]. Available:
http://www.fueleconomy.gov/feg/Find.do?action=sbs&id=32655&id=33336&id=33398&id=33335
. [Accessed 08 05 2014].
[23] F. Economy, "Finding a car," [Online]. Available: http://www.fueleconomy.gov/feg/findacar.shtml.
[Accessed 05 05 2014].
[24] U. D. o. Energy, "Alternative Fueling Station Counts by State," [Online]. Available:
http://www.afdc.energy.gov/locator/stations/results?utf8=%E2%9C%93&location=&filtered=true
&fuel=ELEC&owner=all&payment=all&ev_level1=true&ev_level2=true&ev_dc_fast=true&radiu
s_miles=5. [Accessed 29 03 2014].

[25] U. D. o. Energy, "Developing Infrastructure to Charge Plug-In Electric Vehicles," [Online].
Available: http://www.afdc.energy.gov/fuels/electricity_infrastructure.html. [Accessed 01 02
2013].
[26] C. E. Commission, "California Energy Demand 2014-2024 Revised Forecast," 09 2013. [Online].
Available: http://www.energy.ca.gov/2013publications/CEC-200-2013-004/CEC_200-2013-004-
SD-V1-REV.pdf. [Accessed 05 05 2014].
[27] U. S. E. P. O. o. T. a. A. Q. Agency, "Greenhouse Gas Emissions from a Typical Passenger
Vehicle," 2011. [Online]. Available: http://www.epa.gov/otaq/climate/documents/420f11041.pdf.
[Accessed 18 04 2014].
[28] U. E. I. Administration, "Motor Vehicle Mileage, Fuel Consumption, and Fuel Economy,"
[Online]. Available: http://www.eia.gov/totalenergy/data/monthly/pdf/sec1_17.pdf. [Accessed 18
01 2014].
[29] U. E. I. Administration, "Annual Energy Outlook 2014: Market Trends - Transportation sector
energy demand," [Online]. Available:
http://www.eia.gov/forecasts/aeo/MT_transportationdemand.cfm. [Accessed 19 04 2014].
[30] U. D. o. T. F. H. Administration, "Out Nation's Highways: 2008," [Online]. Available:
http://www.fhwa.dot.gov/policyinformation/pubs/pl08021/fig4_5.cfm. [Accessed 28 04 2014].
[31] U. E. I. Administration, "Petroleum and other Liquids," 04 07 2014. [Online]. Available:
http://www.eia.gov/petroleum/gasdiesel/. [Accessed 11 01 2014].
[32] U. D. o. Energy, "Benefits and Considerations of Electricity as a Vehicle Fuel," [Online].
Available: http://www.afdc.energy.gov/fuels/electricity_benefits.html. [Accessed 18 04 2014].
[33] U. E. I. Administration, "Annual Energy Outlook 2014," [Online]. Available:
http://www.eia.gov/forecasts/AEO/. [Accessed 18 04 2014].
[34] Edmunds, "Decoding Electric Car MPG," [Online]. Available: http://www.edmunds.com/fuel-
economy/decoding-electric-car-mpg.html. [Accessed 09 05 2014].
[35] IRS, "Plug-In Electric Drive Vehicle Credit (IRC30D)," 13 02 2014. [Online]. Available:
http://www.irs.gov/Businesses/Plug-In-Electric-Vehicle-Credit-%28IRC-30-and-IRC-30D%29.
[Accessed 29 04 2014].
[36] P. I. America, "State & Federal Incentives," [Online]. Available:
http://www.pluginamerica.org/incentives. [Accessed 08 05 2014].

[37] C. E. P. Agency, "California Clean Vehicle Incentives," [Online]. Available:
http://www.arb.ca.gov/msprog/zevprog/factsheets/clean_vehicle_incentives.pdf. [Accessed 28 04
2014].
[38] Wikidot, "US Energy Use," 28 10 2010. [Online]. Available: http://energyfuture.wikidot.com/us-
energy-use. [Accessed 29 04 2014].
[39] C. A. R. Board, "Air Pollution in California," [Online]. Available:
http://www.arb.ca.gov/msprog/zevprog/factsheets/driveclean.pdf. [Accessed 29 04 2014].
[40] U. E. I. Adminstration, "State-Level Energy- Related Carbon Dioxide Emissions, 2000 - 2010," 13
05 2013. [Online]. Available: http://www.eia.gov/environment/emissions/state/analysis/. [Accessed
29 04 2014].
[41] U. D. o. E. -. E. E. &. R. Energy, "Plug-In Electric Vehicle Handbook for Workplace Charging
Hosts," [Online]. Available:
http://www.afdc.energy.gov/uploads/publication/pev_workplace_charging_hosts.pdf. [Accessed 29
04 2014].
[42] L. GoSpace, "Our Electric Vehicle Charging Stations," [Online]. Available:
http://www.gospacego.com/Products.asp?type=cs&products=ChargePoint&selected=ChargePoint-
CT2020. [Accessed 29 04 2014].
[43] A. Aerovironment, "Charging for Multi-Unit Homes," [Online]. Available:
http://evsolutions.avinc.com/products/multi-unit/multi-station_charging. [Accessed 30 04 2014].
[44] U. D. o. E. -. E. E. &. R. Energy, "Alternative Fueling Station Locator," [Online]. Available:
http://www.afdc.energy.gov/locator/stations/#results?utf8=%E2%9C%93&location=california&filt
ered=true&fuel=ELEC&owner=all&payment=all&ev_level1=true&ev_level2=true&ev_dc_fast=tr
ue&radius_miles=5. [Accessed 29 04 2014].
[45] E. A. California, "California Power Plants," [Online]. Available:
http://energyalmanac.ca.gov/powerplants/index.html. [Accessed 08 05 2014].
[46] E. A. California, "California Electricity Statistics and Data," [Online]. Available:
http://energyalmanac.ca.gov/electricity/. [Accessed 29 04 2014].
[47] U. E. P. Agency, "Electricity from Natural Gas," [Online]. Available:
http://www.epa.gov/cleanenergy/energy-and-you/affect/natural-gas.html. [Accessed 29 04 2014].
[48] U. S. E. I. Administration, "California Electricity Profile 2010," U.S. Energy Information
Administration, 2012.

[49] U. E. P. Agency, "Energy and You," [Online]. Available: http://www.epa.gov/cleanenergy/energy-
and-you/. [Accessed 31 03 2014].
[50] U. E. P. Agency, "eGRID 9th edition Version 1.0 - Year 2010 Summary Tables," 02 2014.
[Online]. Available:
http://www.epa.gov/cleanenergy/documents/egridzips/eGRID_9th_edition_V1-
0_year_2010_Summary_Tables.pdf. [Accessed 05 03 2014].
[51] U. E. I. Administration, "Electric Power Monthly with Data for January 2014," [Online]. Available:
http://www.eia.gov/electricity/monthly/pdf/epm.pdf. [Accessed 07 03 2014].
[52] U. o. C. Scientists, "Environmental Impacts of Coal Power: Air Pollution," [Online]. Available:
http://www.ucsusa.org/clean_energy/coalvswind/c02c.html. [Accessed 31 03 2014].
[53] C. D. o. M. Vehicle, "Top Ten DMV Facts," 01 01 2010. [Online]. Available:
http://apps.dmv.ca.gov/pubs/newsrel/media_center/index.htm. [Accessed 12 04 2014].
[54] C. D. o. M. Vehicle, "Top Ten DMV Facts for 2012," 01 01 2013. [Online]. Available:
http://dmv.ca.gov/pubs/newsrel/media_center/index.htm. [Accessed 12 04 2014].

APPENDICES
All appendices below were the results of the cooperation between Khoa Nguyen and Aris Papaioannou.
1. Interview with Ms. DEBORAH SCOTT
Ms. Scott purchased her Chevy Volt (a 2012 model) in December of 2011 in California at a price
of $39,000. The Chevy volt is a hybrid car, which means that it can run using power both obtained from
its battery and its gas engine. However, the gas tank is not connected to the drivetrain, but is there to
provide extra power when the battery is running low or to completely take over when the battery is
empty. When the battery is running low the user can feel the vehicle’s response to be more sluggish.
After a full charge, the Chevy Volt has a range of 40 miles on average by just using its battery. After
attending the Seminar by the director of R&D at A123 systems, we recognized how temperature affects
the battery’s performance (very low and very high temperatures). That was the reason we specifically
asked Ms. Scott if she notices any difference in her vehicle’s performance and available mile range in
very cold days. She said that in very cold days (around 35 Fahrenheit degree or under) she would get 26
miles or maybe lower from the battery. During spring season, she can get approximately 50 miles. In
addition, extra energy was needed to be spent to keep her car’s interior warm, and as there was no
engine, the outside of the car remained very, very cold. Even when the car was charging or after it was
fully charged but not operating, under very cold weather the car would use power to keep the battery
warm.
We also asked Ms. Scott if she noticed any difference in her battery’s performance (range, life
cycles, charging time) since she first bought it compared to now, but since her battery is so new she said
that it has been the same. At WPI, and in various public places, she charges her vehicle at 240 Volts
output which translates up to 4 hours for the vehicle to be fully charged. At home, she uses 110 Volts
and therefore needs about 8 hours for full charge. So far she has not had any maintenance costs besides
the typical ones (change of tires).
On average she paid $20 dollars a month to charge her vehicle at home (as she can deduct from
her monthly electric bill). Ms. Scott believed that it was very important and beneficial for charging
stations to be located where she worked, as in that way she managed to commute from her house to
work using only the battery, and thus saving gas money and reducing emissions. She charged her vehicle
once at WPI and once at home overnight unless she had to travel where she would use one of the public
stations (which she could locate through a phone application) many of which she did not have to pay for
besides the normal parking fee for occupying the spot. When asked if she realized a difference in cost in
operating a hybrid vehicle compared to a gasoline vehicle, she said that she estimated that now she
saved approximately $200 dollars a month (which would go towards paying for gasoline) which
translated to the considerable amount of $2400 a year.
Her overall experience with the Chevy Volt hybrid was very satisfactory. She particularly liked
how the driving and performance feels (a very strong and responsive car), how the technology was so
well integrated allowing her to communicate with her car and do certain functions remotely using just
her smartphone (like turning the heating on prior to entering the car so that it was already warm when
she got there) and, of course, that she was being environmentally considerate. However, she did not like
that the car was a 4-seater since the battery occupied a lot of space in the back of the car and the car
remained very cold on the outside since there was no engine to keep it warm.

2. Interview with Prof. JOHN ORR
From our meeting with Professor Orr, we obtained some more technical information on the
specifics of how electricity transmits from the generator in the factory to the charging station that is
directly connected to the electric or hybrid vehicle. A mechanical (usually rotating) device, called the
generator, is used in the factory to generate the electricity and from there it passes through a transformer
and a transmitter where its voltage ranges between 69 and 500 kV. Then it passes through another
transformer which lowers the voltage somewhere between 6 and 50 kV, the typical value is 13.8 kV, to
end up to a distributor. From there it passes through another transformer which brings it down to 120V,
240V or 480V depending on the type of the charging station and then it is used to charge the vehicle.
Therefore, one very important consideration is how to minimize transmission losses while delivering
high power. They are estimated to be on average about 10% from end-to-end (so from the output voltage
value of the generator to the output transformer value of the charging station). The 480V, being at a
higher voltage, gives out more power than the rest of the voltage output values. Some other topics that
came up from our discussion with Professor Orr were the ‘Smart Grid’ which refers to the effort to
reduce generating stations and replacing them with distributors. How to store the energy efficiently
using a pump hydro and a reservoir located on a hill in which case the potential energy of the falling
water is used to generate electricity. Also environmental concerns arise with issues like producing the
battery, disposing of it, and, of course, generating the electricity for it. Professor Orr gave a hint about
power plant emission, such as if the electricity for the battery comes from a coal-powered plant then it is
‘dirtier’ than simply using gasoline vehicles. Besides, Professor John Orr recommended us to look up
more information in library to figure out his suggestion about electricity consumption and emissions.
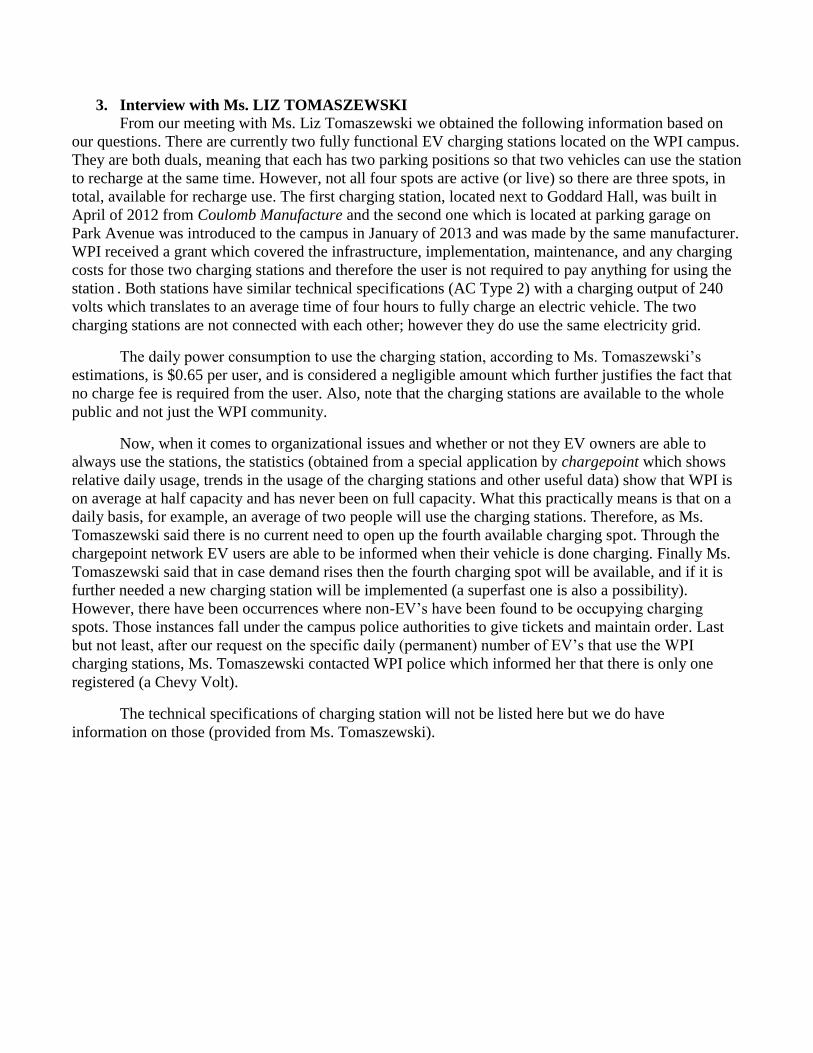
3. Interview with Ms. LIZ TOMASZEWSKI
From our meeting with Ms. Liz Tomaszewski we obtained the following information based on
our questions. There are currently two fully functional EV charging stations located on the WPI campus.
They are both duals, meaning that each has two parking positions so that two vehicles can use the station
to recharge at the same time. However, not all four spots are active (or live) so there are three spots, in
total, available for recharge use. The first charging station, located next to Goddard Hall, was built in
April of 2012 from Coulomb Manufacture and the second one which is located at parking garage on
Park Avenue was introduced to the campus in January of 2013 and was made by the same manufacturer.
WPI received a grant which covered the infrastructure, implementation, maintenance, and any charging
costs for those two charging stations and therefore the user is not required to pay anything for using the
station . Both stations have similar technical specifications (AC Type 2) with a charging output of 240
volts which translates to an average time of four hours to fully charge an electric vehicle. The two
charging stations are not connected with each other; however they do use the same electricity grid.
The daily power consumption to use the charging station, according to Ms. Tomaszewski’s
estimations, is $0.65 per user, and is considered a negligible amount which further justifies the fact that
no charge fee is required from the user. Also, note that the charging stations are available to the whole
public and not just the WPI community.
Now, when it comes to organizational issues and whether or not they EV owners are able to
always use the stations, the statistics (obtained from a special application by chargepoint which shows
relative daily usage, trends in the usage of the charging stations and other useful data) show that WPI is
on average at half capacity and has never been on full capacity. What this practically means is that on a
daily basis, for example, an average of two people will use the charging stations. Therefore, as Ms.
Tomaszewski said there is no current need to open up the fourth available charging spot. Through the
chargepoint network EV users are able to be informed when their vehicle is done charging. Finally Ms.
Tomaszewski said that in case demand rises then the fourth charging spot will be available, and if it is
further needed a new charging station will be implemented (a superfast one is also a possibility).
However, there have been occurrences where non-EV’s have been found to be occupying charging
spots. Those instances fall under the campus police authorities to give tickets and maintain order. Last
but not least, after our request on the specific daily (permanent) number of EV’s that use the WPI
charging stations, Ms. Tomaszewski contacted WPI police which informed her that there is only one
registered (a Chevy Volt).
The technical specifications of charging station will not be listed here but we do have
information on those (provided from Ms. Tomaszewski).
4. Feedback from California’s government
Mr. Swanton confirmed that California will not have troubles with off-peak electricity
consumption when the large amounts of EVs or PHEVs are charged at the same time. Next, California is
going to add several renewable power plants and upgrade the entire power plant system to be more
efficient and clean. Besides, Mr. Swanton said, “To many people, the single occupant access sticker for
California’s carpool lanes is a bigger deal than the rebates.” Finally, he shared that rebates and tax
credits helped bring the cost of early introduction vehicles down to a reasonable cost and the new
technology that will help build market share rapidly.