electric vehicles - environmental, economic and practical
TRANSCRIPT

TØI report 1329/2014
Erik Figenbaum
Marika Kolbenstvedt Beate Elvebakk
Electric vehicles - environmental, economic and practical aspects
As seen by current and potential users


TØI Report
1329/2014
Electric vehicles - environmental, economic
and practical aspects
As seen by current and potential users
Erik Figenbaum
Marika Kolbenstvedt
Beate Elvebakk
Front page photography: Michael W J Sørensen, TØI
This report is covered by the terms and conditions specified by the Norwegian Copyright Act. Contents of the report may be used for referencing or as a source of information. Quotations or references must be attributed to the Institute of Transport Economics (TØI) as the source with specific mention made to the author and report number. For other use, advance permission must be provided by TØI.
ISSN 0808-1190
ISBN 978-82-480-1556-7 Paper version
ISBN 978-82-480-1537-6 Electronic version Oslo, September 2014

Tittel: Elbiler - miljømessige, økonomiske og praktiske kjennetegn - vurdert av eksisterende og potensielle brukere
Electric Vehicles – environmental, economic and practical aspects. As seen by current and potential users
Title:
Forfattere: Erik Figenbaum Marika Kolbenstvedt Beate Elvebakk
Author(s): Erik Figenbaum Marika Kolbenstvedt Beate Elvebakk
TØI rapport:
Sider
TØI report:
Pages
Dato: Date: 09.2014 09.2014
1329/2014 1329/2014
141 141
978-82-480-1556-7 978-82-480-1556-7 ISBN Paper: ISBN Papir:
ISSN 0808-1190 ISSN 0808-1190
978-82-480-1537-6 ISBN Elektronisk: 978-82-480-1537-6 ISBN Electronic:
Finansieringskilde: Financed by: EU 7th FP (Electromobility+) The Research Council of Norway Transnova
EU 7th FP (Electromobility+) Norges forskningsråd Transnova
Project: Prosjekt: 3826 - Compett 3826 - Compett
Ronny Klæboe Kvalitetsansvarlig: Ronny Klæboe Quality manager:
Erik Figenbaum Prosjektleder: Erik Figenbaum Project manager:
Brukerevaluering EL-bil insentiver miljøulemper nytte Spørreundersøkelse på nett
Emneord: Benefits Costs Electric Vehicles Incentives Net surveys user evaluation
Key words:
En spørreundersøkelse blant 1 721 eiere av elektriske biler viser at de ikke ser store ulemper ved bilen, at husholdninger som bare har elbil er en voksende gruppe og at de aller fleste vil kjøpe elbil også neste gang. Elbilene brukes til daglige reiser, spesielt til arbeid, og den årlige kjørelengden for elbiler er lik kjørelengden for tradisjonelle biler. En elbil erstatter oftest en vanlig bensin/dieselbil. De som kjøper bilen som tilleggsbil kjører mer etter anskaffelsen enn de som bytter bil. De fleste elbileierne har høy inntekt, bor i store husholdninger i eller i nærheten av byer, og ligner i disse henseendene på andre flerbileiere. De verdsetter de økonomiske fordelene, miljøfordelene og at bilene fyller deres transportbehov. Media og sosiale nettverk ser ut til å være de viktigste kanalene for spredning av kunnskap om elibiler. En parallell undersøkelse blant 2 241 vanlige bileiere viser at en tredjedel vil vurdere elbil ved neste bilkjøp. Elbilenes markedsandel vil trolig fortsette å vokse dersom insentivene opprettholdes. En strategi for tilpasning og justering av virkemiddelbruken kan bli nødvendig for å håndtere eventuell uønskede økonomiske eller miljømessige effekter av økt elbilbruk.
Sammendrag: A survey among 1 721 Electric vehicle (EV) owners in Norway shows that they experience few disadvantages, that the number of EV-only households is growing, and that almost all plan to continue buying EVs. EVs are used for daily travel, especially to work, and the number of km driven annually is similar to the average car. The majority does not change travel pattern and most EVs replace a car with Internal Combustion Engine (ICE). When an EV is acquired as an additional vehicle, some respondents increase their driving. Many EV owners are people with high incomes living in large households in or around cities, and thus similar to other multicar owners. They value the economy of electric motoring, the environmental benefits, and that EVs meet their transport needs. Media and social networks seem to be the most important channels for the spread of knowledge of EVs. A parallel survey of 2 241 ICE car owners reveals a growing interest in electric motoring in this group, with one third considering buying an EV next time. With continuation of incentives, the market share of EVs will probably continue to increase. A strategy for adjustments could be needed for both economic and environmental reasons.
Summary:
Copyright © Transportøkonomisk Institutt Denne publikasjonen er vernet i henhold til Åndsverkloven av 1961
Ved gjengivelse av materiale fra publikasjonen, må fullstendig kilde oppgis
Transportøkonomisk Institutt Gaustadalleen 21, 0349 Oslo Telefon 22 57 38 00 - www.toi.no
Institute of Transport Economics Gaustadalleen 21, 0349 Oslo, Norway Telefon 22 57 38 00 - www.toi.no
Language of report: English

Electric Vehicles - environmental, economic and practical aspects
Preface
This report is a part of the COMPETT project (Competitive Electric Town Transport), financed by national funds which have been pooled together within the ERA-NET Electromobility+ programme. This pool has initiated twenty projects about electric vehicles concerning topics from the development of battery and charging technology to sociological investigations of the use of electric vehicles.
COMPETT is a co-operation between the Institute of Transport Economics (TØI) in Norway, The Austrian Energy Agency (AEA), the University College Buskerud and Vestfold in Norway, Kongsberg Innovation in Norway and the Danish Road Directorate (DRD). The COMPETT project is jointly financed by the EU’s 7th FP (Electromobility+ programme), Transnova, the Research Council of Norway (RCN), the Austrian Research Promotion Agency (FFG) of Austria and the Ministry of Science, Innovation and Higher Education in Denmark.
The objective of COMPETT is to promote the use of electric vehicles, particularly with focus on private passenger cars. The main question to be answered is: “How can electric vehicles come in to use to a greater degree?” Read more about the project on www.compett.org. Work Package 4 “Regional Electromobility” includes a review of the literature, developing an analytical scenario framework and local studies in Austria and Norway. The local studies use statistics, interviews with stakeholders and surveys of present and potential users’ attitudes, preferences and behaviour. This report presents results from the two Norwegian user studies among owners of electric vehicles and conventional vehicle owners respectively.
We want to express our gratitude to Snorre Sletvold at the Norwegian Electro-mobility Association and May Frøhaug at the Norwegian Automobile Association, for eminent support and distribution of the questionnaires to their members.
Erik Figenbaum, project manager, has been responsible for the data-analysis. He has cooperated with Marika Kolbenstvedt and Beate Elvebakk in writing the report. Trude Rømming has been responsible for the finishing. Following COMPETT’s quality assurance guidelines, COMPETT partners Bettina Emmerling, AEA and Lykke Møller Iversen, DRD have reviewed the report. Ronny Klæboe has been TØI’s quality assurer.
Oslo, September 2014 Institute of Transport Economics Gunnar Lindberg Michael Wøhlk Jæger Sørensen Managing director Research Director


Electric vehicles - environmental, economic and practical aspects
Content
Summary
Sammendrag
1 Introduction and approach .......................................................................... 1 1.1 Electrification and climate ................................................................................... 1 1.2 Competitive Electric Town Transport .............................................................. 2 1.3 The Oslo-Kongsberg region ............................................................................... 2 1.4 Diffusion of new technology .............................................................................. 3 1.5 Earlier studies as a basis for surveys .................................................................. 6 1.6 The structure of the report ................................................................................. 7
2 Samples and sociodemographics ................................................................. 8 2.1 Surveys of EV owners, potential EV owners and other car owners ............ 8 2.2 Response rate and representativeness ............................................................... 9 2.3 Regional distribution of the samples ............................................................... 10 2.4 Socio-demography .............................................................................................. 11 2.5 National Travel Surveys – a reference point .................................................. 13 2.6 Characteristics of early adopters....................................................................... 15
3 Vehicle ownership ...................................................................................... 16 3.1 Technical competence and interest .................................................................. 16 3.2 Interest in environmental issues ....................................................................... 17 3.3 Number of cars in the households .................................................................. 17 3.4 Pure and mixed EV households ....................................................................... 18 3.5 The types of EVs owned ................................................................................... 19 3.6 Length of ownership and experience .............................................................. 21 3.7 Competent decision makers .............................................................................. 22
4 The buying process .................................................................................... 23 4.1 The EV buyers moment of decision ............................................................... 23 4.2 Channels of information before buying an EV ............................................. 24 4.3 Factors influencing car choice .......................................................................... 26 4.4 Evaluation of the information provided by dealers ...................................... 27 4.5 Changes in number of vehicles in the household .......................................... 29 4.6 Needs, economy and environment .................................................................. 30
5 Travel behaviour and driving distances ..................................................... 32 5.1 New data on driving patterns and range ......................................................... 32 5.2 Insured driving distance .................................................................................... 32 5.3 Odometer readings ............................................................................................. 33 5.4 Trips the last weekday ........................................................................................ 35 5.5 Frequency in using EVs ..................................................................................... 36 5.6 Trip types frequencies ........................................................................................ 37 5.7 Distance to work/school................................................................................... 39 5.8 Changes in driving length .................................................................................. 40 5.9 Changes in travel patterns ................................................................................. 40
6 Charging behaviour ................................................................................... 43 6.1 Charging framework - and charging stations ................................................. 43 6.2 Charging solution and utilization of range...................................................... 44

Electric vehicles - environmental, economic and practical aspects
6.3 Usage frequency of various charging locations .............................................. 44 6.4 Adaption in case of range challenges............................................................... 47 6.5 Use of fast chargers in different groups .......................................................... 49 6.6 Range challenges ................................................................................................. 50 6.7 Access to free fast charging .............................................................................. 51
7 Role of incentives ....................................................................................... 54 7.1 Overview Norwegian incentives ...................................................................... 54 7.2 Important factors when buying an EV ........................................................... 54 7.3 Incentives affecting vehicle price ..................................................................... 57 7.4 Free toll-roads and access to bus lane in the Oslo-Kongsberg region ....... 58 7.5 Toll-road and buss lane access in other Norwegian areas ............................ 61 7.6 Value of local incentives .................................................................................... 63 7.7 Total economic value of local user incentives................................................ 65
8 EV-only households ................................................................................... 67 8.1 Different groups of EV owners ....................................................................... 67 8.2 Vehicle ownership .............................................................................................. 67 8.3 Socio-demographics of single-vehicle households ........................................ 68 8.4 Socio-demographics of multi-vehicle households ......................................... 70 8.5 Socio-demographics of EV-only households ................................................. 72 8.6 Usage of incentives............................................................................................. 74 8.7 Changes in number of vehicles ........................................................................ 75 8.8 Changes in travel length and pattern ............................................................... 76 8.9 Methods for handling range challenges ........................................................... 79 8.10 Environmental motivation ................................................................................ 80
9 Potential EV buyers ................................................................................... 83 9.1 Future buyers showing up at the EV dealers ................................................. 83 9.2 Socio-demographics of potential EV buyers .................................................. 83 9.3 Household characteristics of potential EV buyers ........................................ 87 9.4 Vehicles ownership among potential EV buyers ........................................... 89 9.5 Driving pattern and use of incentives ............................................................. 89 9.6 Potential buyers’ interest and competence ..................................................... 90 9.7 Diffusion channels - organisations and friends ............................................. 91 9.8 Period since of last bought car and new vs used car ..................................... 91 9.9 Relation to diffusion theory .............................................................................. 92
10 Attitudes to and experiences with EVs ...................................................... 94 10.1 EV owners and NAF members........................................................................ 94 10.2 EV owners and potential EV buyers ............................................................... 94 10.3 EV owners attitudes by brands ........................................................................ 97 10.4 Challenges with using EVs .............................................................................. 100 10.5 EVs and user needs .......................................................................................... 103
11 Future perspectives .................................................................................. 104 11.1 From innovators to laggards - where is Norway? ........................................ 104 11.2 Future buying plans .......................................................................................... 105 11.3 An effective communication process ............................................................ 107 11.4 Environmental aspects .................................................................................... 108 11.5 Prerequisites for further diffusion.................................................................. 109
12 References .................................................................................................110

Electric vehicles - environmental, economic and practical aspects
Appendix I: Overview Norwegian EV-incentives and market ............................... 115 Appendix II: Earlier studies of use and users ............................................................ 118 Appendix III Charging stations in Norway ................................................................ 123 Appendix IV Norwegian winter climate in 2014....................................................... 124 Appendix V: Questionnaire EV owners ..................................................................... 126 Appendix VI: Questionnaire NAF members
Acronyms used in the report
Acronym Explanation
ICE Internal Combustion Engine
EV Electric vehicle (Here used for full Battery Electric Vehicle, often called BEV)
HEV Hybrid Electric Vehicle
PHEV
PEV
Plug-in Hybrid Electric Vehicle
Plug-in Electric Vehicle (Includes both BEVs and PHEVs)
NAF Norwegian Automobile Association
NEVA Norwegian Electric Vehicle Association
NTS
OFV AS
COMPETT
National Transport Survey
The road traffic information agency
Competitive Electric Town Transport (Electromobility+ project)


Summary:
Electric Vehicles - environmental, economic and practical aspects As seen by current and potential users
TØI Report 1329/2014 Authors: Erik Figenbaum, Marika Kolbenstvedt, Beate Elvebakk
Oslo 2014, 141 pages English language
Electric propulsion is much more energy-efficient than internal combustion engine based propulsion (ICEs), and electric vehicles (EVs) emit neither local pollutants nor greenhouse gases. Norwegian authorities have introduced a number of incentives for EV diffusion, in order to support a transition to environmentally friendly transport. A survey among 1 721 EV owners shows that they experience few disadvantages and that the number of EV-only households is growing. EVs are mostly used for daily travel, especially to work, and the number of km driven annually by EVs is similar to that of the average car. The majority does not change their travel pattern when buying EVs and most EVs replace an ICE car. When an EV is acquired as an additional vehicle, some respondents increase their driving. Many EV owners are active people with high incomes living in large households in or around cities, and thus similar to other multicar owners. They value the economy of electric motoring, the environmental benefits, and most importantly; that EVs meet their transport needs. Almost all EV owners plan to continue buying EVs. Media and social networks seem to be the most important channels for the spread of knowledge of EVs. A parallel survey of 2 241 owners of ICE cars finds a growing interest in electric motoring, with one third of the respondents considering buying an EV. With the continuation of current incentives the market share of EVs will probably continue to increase.
Surveys among EV users and average car users The study is a part of COMPETT, an ERA-NET Electromobility+ project aiming at contributing to an increased use of EVs. To gain more knowledge about current and potential users, two internet surveys were conducted in February 2014:
1. One survey answered by 1 721 members of the Norwegian Electric Vehicle Association (NEVA). All buyers of EVs are offered a one-year complimentary membership in NEVA, and 40% of the EV owners in Norway are members. The respondents received a newsletter distributed to 9 051 members. The respondents represent 8% of EV owners in Norway.
2. One survey where 2 241 member of the Norwegian Automobile Association (NAF) responded to a letter of invitation sent to 10 000 randomly chosen NAF members representing average car owners. This survey contains 672 potential EV buyers, 929 average car owners that do not consider buying an EV next time, while the rest has not yet decidd.
Both surveys covered the Oslo-Kongsberg region, the most EV-dense region in Norway, with 40% of all EVs in Norway as compared to 20% of the country’s population. The NEVA member survey also covered the rest of the country. The respondents are persons 18 years and older belonging to car-owning households. These characteristics were also the basis for a special sample extracted from the
Telephone: +47 22 57 38 00 E-mail: [email protected] I
This report can be downloaded from www.toi.no

Electric Vehicles - environmental, economic and practical aspects
National Travel Survey (NTS 2009), which serves as a reference point for the average person in car owning households in the population.
Norwegian framework conditions favouring EV use In February 2014, at the time the survey was conducted, EVs made up slightly less than 1% of the total fleet of passenger vehicles in Norway. The market share for EVs for new cars sold in 2013 was 5%. However, in 2014 (January-May), this share increased to 13%.
Norway has access to clean, CO2 free and cheap electric power. EV engines are also more efficient than conventional engines, especially in urban settings. Norwegian speed limits are EV-friendly, with a maximum speed of 100-110 km/h on motorways and of 80 km/h on main roads. EV range is thus longer in Norway than in countries with higher speed limits, as energy consumption increases rapidly at higher speeds.
To profit from these advantages, the Norwegian Parliament and national and local authorities have developed incentives aimed at removing barriers for electromobility, like high purchase price and shorter range than Internal Combustion Vehicles (ICE). Exemptions from Value added tax (VAT), registration tax as well as a reduced annual vehicle licence fee have made EVs cheaper than similar ICE cars. Attractive local incentives are access to bus lanes, exemption from toll road charges (Norway has toll roads spread throughout the country), and cheaper ferry rides on the coastal main roads. To reduce possible range problems, Norway gives national, and in some places local, support to establishing charging infrastructure. 4 500 charging points were publicly available at the time of the survey.
EV owners are similar to other multicar owners The typical EV owner is male, 35-54 years old and working full-time. Compared to members of the car ssosiation (NAF) and the general population (studied in the National Travel Survey NTS), they are more likely to hold a five year university degree, and live in large, high-income, multicar households with children that are below 18 years old, located in and around big cities.
The share of multi-vehicle households amongst EV owners is 74%, and is larger than the nationwide average multivehicle ownership rate of 50% (among households with vehicles in NTS 2009). Comparing EV owners with other multicar owners who bought their last car less than two years ago, large socio-demographic similarities between the two groups are found. Figure S.1 illustrates this comparing household economy.
Figure S.1 Household income pr year (NOK) for persons belonging to multicar households owning a) ICEs only (National Travel Survey n = 801and NAF n = 145), b) a combination of ICE and EV (n = 192) or c) only EVs (n = 19) in Oslo-Kongsberg region who bought their last car less than two years ago. Percent
II Copyright © Institute of Transport Economics, 2014

Electric Vehicles - environmental, economic and practical aspects
One third of EV owners belong to EV-only households The study finds a higher percentage of EV-only households in the EV-fleet than earlier studies, see figure S2. This probably reflects the improved range, performance, larger size and reduced price of newer EVs.
Figure S2 Share of EV-only and mixed EV/ICE households among EV owners in Norway (n=1 721) in 2014. Percent
The share of respondents belonging to EV-only households was much larger in Oslo with 41%, than in the neighbouring municipalities, Bærum with 21% and Asker with 18%. This is probably related both to shorter distances and to the larger share of single-person households in Oslo. The EV-only households have equal shares of Nissan Leafs as households with EV and ICE(s), but higher shares of Tesla Model S.
The highest share of experienced EV owners are found among EV-only households owning more than one EV. Among the single vehicle EV-only households, 15% did not own a vehicle before, i.e. they bypassed owning an ICE vehicle. The majority (82%) of EV owners in the sample bought their cars less than two years ago, and most of them are first-time EV buyers. In the Oslo-Kongsberg region they bought new vehicles (81%) to a larger extent than NAF members (44%).
Information from several channels EV-owners rate their technical competence when it comes to cars higher than members in the Norwegian var oganisation (NAF) in general, also when compared to those members who bought their car less than two years ago and those who will consider an EV the next time they buy a car. 84% of the EV owners had already decided to buy an EV when visiting the dealer. The EV-incentives and the comprehensive media coverage (mentioned as an information source by 77%) seem to be the most important drivers in the acquisition process. The market pull also appears to be generated and influenced by friends and family. 28% had received their information about EVs from friends and family and 6% from organizations. 13% received the information from the dealer.
Motives related to economy, environment and needs The most important factors influencing EV owners’ purchase were lower operating costs, EVs being environmentally friendly, free toll roads, lower annual circulation tax, competitive price and that the car was “the best vehicle for my needs”, see figure S3. For average car owners here represented by NAF members, the most important factors when buying vehicles were safety, competitive price and “best vehicle for my needs”, followed by operating costs, see figure S4.
Copyright © Institute of Transport Economics, 2014 III

Electric Vehicles - environmental, economic and practical aspects
Figure S3 Important factors when buying an EV among EVowners in Norway (n = 1 721). Percent
Figure S4 Important factors when buying a car among members of the Norwegian Autombile Association (NAF) in Oslo Kongsberg region (n = 2 241). Percent
The use pattern is related to daily transport needs EVs in Norway drive 14 000-15 000 km/year on average, as assessed on the basis of a combination of responses to questions about insured driving distance and odometer readings. The annual average mileage of new ICE vehicles in Norway is 15 160 km the first year, 14 800 km the second and 13 400 km the third year. It can thus be concluded that the annual driving length for EVs with the latest technology is about the same as for new gasoline vehicles.
81% of EVs are driven daily, another 16% 3-5 days per week, i.e. they are used for everyday transport activities. They are used for trips to and from and at work, for shopping, for visits, for escorting children and for leisure activities, but less for vacation. The average number of trips undertaken the last weekday before the survey is about the same as the Norwegian average, but the total distance travelled is longer.
47%
39%
35%
33%
23%
26%
21%
19%
18%
8%
6%
10%
2%
2%
34%
27%
33%
31%
32%
27%
27%
21%
12%
21%
16%
8%
8%
6%
0% 10% 20% 30% 40% 50% 60% 70% 80% 90%
Low operating costsFree Toll Roads
Best vehicle for my needEVs are environmentally friendly
Competitive priceLower annual circulation tax
Interest in new techologyFree public parking
Bus lane accessThe EVs safetyEVs are trendy
Free ferriesAn EV dealer nearby
Preferred brand had an EV
Very large importance Large importance
24%
20%
11%
8%
5%
5%
4%
48%
43%
37%
31%
20%
17%
15%
0% 10% 20% 30% 40% 50% 60% 70% 80%
Best vehicle for my need
The cars safety
Competitive price
Low operating costs
The vehices environmental…
Interest in new techology
A car dealer nearby
ICE owner Very large ICE owner Large
IV Copyright © Institute of Transport Economics, 2014

Electric Vehicles - environmental, economic and practical aspects
The average distance to work for EV owners is 26 km, considerably longer than the Norwegian average of 15 km. First-time owners have longer distances to work, and those who have owned EVs for more than five years have the shortest distances, which probably reflects the technical development of EVs.
The majority has not changed their travel pattern 69% of respondents report that the EV replaced other vehicles, for 28% it was an additional car in the household and for 3% it was their first vehicle. The smallest EVs became to a larger extent an additional vehicle, while the Tesla Model S replaced an existing vehicle in 86% of households. 94% of the replaced vehicles were ICEs. 62% of the respondents did not change the household’s total insured driving distance when buying the EV, 18% increased it, 6% decreased it, and the rest had owned the car less than a year or did not know. The majority of respondents reported that they had not changed their travel pattern. From an environmental point of view we find both positive and negative changes, see figure S5.
Figure S5 Changes in the travel pattern among EV owners in Norway 2014 (n = 1 722). Percent
Single vehicle EV households underwent the largest changes to their transport patterns. This is also true for the work trip, where one in five drive more after buying an EV. It is not possible to know whether similar modal shifts would have occurred anyway, i.e. that they had bought an ICE if EVs was not available. It is however likely that part of the changes can be attributed to the availability of the EV incentives.
Most EV owners have satisfactory access to charging EV owners are comfortable using on average 85% of the vehicle’s range, and one in five are even comfortable using over 90%. This is a much higher rate than found in earlier studies, and indicates that the range meters probably function well and that EV owners in Norway have good access to public and private charging. Few (12%) have experienced running out of power when driving. Most EV owners had no problem choosing a charging solution, but around 10% (27% for Tesla) had experienced some problems selecting charge cable or home charging unit.
65% charge their vehicle daily at home in a garage, carport or outdoor, most in garages. Another 20% charge at home 3-5 days per week and another 15% 1-2 times per week. Public normal charging is used at least monthly by about half of the EV owners, and 7-14% use it weekly. This charging is usually free. Work place charging is more widely used than public charging.
The average annual number of fast charges per vehicle is about 14. 27% use fast chargers more than once per month, 6% are weekly users. EV-only owners use fast charging more than owners in multicar households. Half of the respondents do not pay for fast charging. There appears to be no difference between summer and winter,
23%
4%
5%
-7%
-16%
-7%
I D R I V E
I U S E P U B L I C T R A N S P O R T
I W A L K O R C Y C L E
More Less
Copyright © Institute of Transport Economics, 2014 V

Electric Vehicles - environmental, economic and practical aspects
even if the range is halved on cold winter days (except for Tesla), and one would expect owners to compensate by using fast charging more. However, fast charging speed is reduced to about half in winter, due to battery limitations, making it more cumbersome, and queues at fast charge stations potentially longer.
Opinions of EVs owners, EV buyers and others differ The EV owners’ opinions about the advantages and disadvantages of EVs differ widely from those of members om the Norwegian Automobile Association (NAF) in general. More than half of NAF members and only about 20% of EV owners rate vehicle range, access to charging stations and charging time as big disadvantages. Four out of five EV owners, but only two out of five NAF members rate operating costs as a big advantage. However, the potential EV buyers among NAF members are very similar to EV owners and rate the performance of EVs higher than other NAF members.
Challenges with EVs are mostly related to the range being shorter and the winter performance worse than expected. When the EV’s range is too short for the day’s driving, EV-owners employ a strategy of planning the trip better, driving more efficiently and turning off heaters and AC. When this is not sufficient, they visit a fast charging station. When longer trips need to be undertaken, multicar households use another vehicle or public transport. Single EV households borrow vehicles from family or friends, rent a vehicle, use public transport or may even give up doing the journey. The EV owners plan for about 25-30% shorter range in winter than in summer. It should be noted that the winter 2013/14 was unusually warm in Norway.
The EV owners are not a homogenous group, however, and safety is rated very highly by Tesla and Nissan Leaf owners while owners of other brands rate it lower. Tesla and Nissan owners are happy with the vehicles’ comfort and acceleration, the Tesla Model S is in a league of its own with 94% rating this as an advantage. The heating system is a component that divide EV owners. Tesla owners are very satisfied, and Mitsubishi/Peugeot/Citroen owners rather dissatisfied. For other factors the results do not differ much between vehicle makes and models.
Large regional differences There are large regional differences in the advantages the users report from the various incentives. Bus lane is more valued in the Oslo-region, where time savings are large (up to 30 minutes), whereas reduced ferry rates are more valued in the coastal regions in the west and mid parts of Norway. The share of EV owners using both free toll road and access to bus lane more than twice a week when driving to work is only 33%. In addition 26% uses toll roads only and 6% bus lanes only. It appears that EV owners live and work in areas where they to a larger extent can use these facilities than members of the Norwegian Automobile Association (NAF) who do not own EVs. Many NAF members being older and not working, can not take advantage of the bus lane and free toll road incentives.
The average annual value of free parking per EV is estimated to be 3 350 NOK. NAF members spend slightly less on parking than EV owners report that they save. The estimated value of all incentives per average EV in Norway are shown in figure S6. The total value for the fleet of 25 000 EVs in April 2014 was 400 million NOK.
VI Copyright © Institute of Transport Economics, 2014

Electric Vehicles - environmental, economic and practical aspects
Figure S6 Average calculated value of local incentives per EV. EV owners in Norway 2014. NOK pr year
EV customers in the future Almost all EV owners (87%) will continue to buy EVs in the future. Less than 1% will not and 12% are undecided. The motivations to buy again are related to economy and incentives, environment, and the joys of EV motoring (comfort, low noise), and that it fits the user needs. Some also state that it is the technology itself, believing it to be the future of motoring, that is important.
The study confirms findings from innovation studies, which show that three factors are important for the spread of environmental technologies:
• The technology's characteristics and possibilities for future improvement of the technology relative to user needs - and knowledge of the technology
• Communication technologies, where both media and social networks have played major roles
• Societal support in the form of various incentives, as environmental technologies often entail additional costs for users
Both EV owners and potential buyers are more interested in technology and have more knowledge about EVs’ properties than car owners who presently do not imagine buying an electric car. Increased knowledge of EV technology is thus a potential measures to increase the market share.
When it comes to communication, the surveys show that satisfied EV owners are of great importance for the further spread of EVs. A third of EV owners have friends who have bought an EV and a further third have friends who consider purchasing an EV. The importance of social networks can also be observed among the members of the Norwegian Automobil Association (NAF) hwho own ordinary cars. 30% of them would consider an EV the next time they buy a car. Among NAF members who have friends with EVs, the rate is higher (44%).
Norway has tried out a number of incentives to facilitate the purchase and use of EVs. With continued use of these incentives, the EVmarket will probably continue to grow. At the same time, it is also important to consider adjustments, based on economic as well as environmental arguments. The objective should be to avoid adverse effects and to diversify in the development towards a more environmentally-friendly transport encompassing several kinds of EVs (eg e-bikes, rechargeable hybrids, electric buses and electric vans) or other types of zero-emission vehicles (hydrogen cars).
3622
7832
3347
1195
Toll road Bus lane Parking Ferries
Copyright © Institute of Transport Economics, 2014 VII

Electric Vehicles - environmental, economic and practical aspects
The various groups in the study have been positioned in a market diffusion model, see figure S7. With successive groups of consumers adopting EVs (shown in blue), the market share (shown in red) will increase. The Norwegian Parliament has set a target of max 85 g CO2/km as an average for new cars which most likely requires 20-30% market share for EVs (all kind of EVs included) to be achieved. This target seems possible to reach. With the continuation of current incentives the market share of EVs will probably continue to increase, supporting the fullfillment of the target.
Figure S7 Owner groups on the road to market domination adapted to this study from Rogers (1962, 1995) diffusion model. NAF = Norwegian Automboil Association
A strategy for adjustments might be needed for both economic and environmental reasons, avoiding rebound effects. Future EV proliferation in Norway will be investigated in the COMPETT project using stakeholder interviews to find out what strategic paths authorities at different levels as well as industrial and other important actors are working along and by modelling different scenarios.
VIII Copyright © Institute of Transport Economics, 2014

Sammendrag:
Elbiler – miljømessige, økonomiske og praktiske kjennetegn Vurdert av eksisterende og potensielle brukere
TØI rapport 1329/2014 Forfattere: Erik Figenbaum, Marika Kolbenstvedt og Beate Elvebakk
Oslo 2014 141 sider
Elbiler er energieffektive og forurenser mindre lokalt enn biler drevet med fossilt drivstoff. For å utnytte dette har norske myndigheter utviklet en rekke insentiver for å øke andelen elbiler. En spørreundersøkelse blant 1 721 eiere av elektriske biler viser at de ikke ser store ulemper ved bilen, at husholdninger som bare har en eller flere elbiler er en voksende gruppe og at de aller fleste vil kjøpe elbil også neste gang. Elbilene brukes til daglige reiser, spesielt til arbeid, og den årlige kjørelengden for elbiler er lik kjørelengden for tradisjonelle biler. En elbil erstatter oftest en vanlig bensin- eller dieselbil. De som kjøper bilen som tilleggsbil kjører mer etter anskaffelsen enn de som bytter bil. Elbileierne ligner på andre som eier flere biler mht økonomi, utdanning, familiestørrelse og bosted. De verdsetter de økonomiske fordelene, miljøfordelene og at bilene fyller deres transportbehov. Media og sosiale nettverk er de viktigste kanalene for spredning av kunnskap om elbiler. En parallell spørreundersøkelse blant 2 241 vanlige bileiere viser voksende interesse for elbiler i denne gruppen, ved at en tredjedel vil vurdere elbil ved neste bilkjøp. Elbilenes markedsandel vil trolig fortsette å vokse dersom insentivene opprettholdes. En strategi for tilpasning og justering av virkemiddelbruken kan være nødvendig for å håndtere eventuelle uønskede effekter som følge av økende elbilisme, f eks problemer med trafikkflyt og reduserte avgiftsinntekter.
Spørreundersøkelse blant elbileiere og andre bileiere Elbiler er mer energieffektive – særlig i bytrafikk – enn bensin- og dieselbiler. Energibruken øker med farten. I Norge som har relativt lave fartsgrenser, kan elbiler derfor kjøre lengre på hver ladning enn i land med høyere fartsgrenser. Norge har også tilgang til ren og billig CO2 fri elektrisk kraft. For å utnytte disse fordelene har norske myndigheter iverksatt en rekke insentiver for å støtte spredning av elbiler som et bidrag til en overgang til mer klima- og miljøvennlig transport. En slik politikk er i tråd med forskning som viser at miljøinnovasjoner trenger støtte fra myndighetene siden de ofte medfører ekstra kostnader for brukerne. En diskusjon om nytten av insentiver, om mulige skjevheter og hvordan insentivene bør utvikles forutsetter bl a kunnskap om brukernes erfaringer og oppfatninger.
Rapporten presenterer resultater fra to undersøkelser utført i februar 2014 innenfor Electromobility+ prosjektet COMPETT (Competitive Electric Town Transport). Undersøkelsene omfattet personer over 18 år med førerkort og tilgang til bil, og ble gjennomført blant 1 721 medlemmer i Norsk Elbilforening, noe som representerer 8% av elbileierne i Norge på intervjutidspunktet, samt blant 2 241 medlemmer i Norges Automobilforbund (NAF). COMPETT har valgt Oslo-Kongsberg regionen som studieområde siden dette er det området i Norge som har høyest elbiltetthet. 542 av elbileierne og alle NAF-medlemmene kom fra Oslo-Kongsbergregionen. Blant NAF-medlemmene er det 672 personer som vurderer å kjøpe elbil neste gang. Disse brukes i analysene som et utvalg av potensielle bilkjøpere.
Telefon: 22 57 38 00 E-post: [email protected] I Rapporten kan lastes ned fra www.toi.no

Elbiler – miljømessige, økonomiske og praktiske kjennetegn
Økonomi, miljø og behov påvirker elbilkjøpet Elbileierne legger stor vekt på økonomiske faktorer når de velger bil, men også på bilens miljøegenskaper og på at den passer til deres behov, se figur S1. Vi ser også at flere av insentivene, slik som gratis bompenger, lavere engangsavgift, fritak fra MVA og lavere årsavgift har betydning. Redusert fergetakst, tilgang til å kjøre i kollektivfeltet og gratis parkering på offentlige plasser har forskjellig betydning etter hvor en bor. Medlemmer i Norges automobilforbund (NAF) legger også stor vekt på at bilen svarer til deres behov (72%) og på kostnader, men har bilens sikkerhet som nummer to på sin prioriteringsliste (63%).
Figur S1 Faktorer med meget stor eller stor betydning ved kjøp av elbil i Norge 2014 (n = 1 721). Prosent
De fleste endrer ikke sine reisevaner etter elbilkjøp Ca 60% endret ikke sine reisevaner etter elbilkjøpet. Blant de øvrige brukerne er det fra et miljøperspektiv både positive og negative endringer, se figur S2. 67% byttet ut en bensin- eller dieselbil da de kjøpte elbil. 28% kjøpte elbilen i tillegg til en annen bil og 3% kjøpte sin første bil. Det er i de to siste gruppene at en finner flest av de som nå kjører mer bil. Vi vet ikke hva folk hadde gjort hvis de ikke hadde kjøpt en elbil, f eks om endrede reisebehov hadde medført at de hadde kjøpt en vanlig bil.
Figur S2 Endring i reisemønster etter kjøp av elbil i Norge 2014. Elbileiere i Norge (n = 1 722). Prosent
0
47%
39%
35%
33%
26%
23%
21%
19%
8%
18%
6%
10%
2%
0
34%
27%
33%
31%
27%
32%
27%
21%
21%
12%
16%
8%
8%
0 0,1 0,2 0,3 0,4 0,5 0,6 0,7 0,8 0,9
Lave driftskostnader
Gratis bompenger
Beste bil for mitt behov
Elbilen (bilen) er miljøvennlig
Lav årsavgift
Konkurransedyktig pris
Interessert i ny teknologi
Gratis offentlig parkering
Elbilens (Bilens) sikkerhet
Tilgang til kollektivfelt
Elbiler er trendy
Billigere avgift på bilferge
Det fantes en elbilforhandler i nærheten
Meget stor Stor
23%
4%
5%
-7%
-16%
-7%
J E G K J Ø R E R B I L
J E G R E I S E R K O L L E K T I V T
J E G S Y K L E R / G Å R
Mer Mindre
II Copyright © Transportøkonomisk institutt, 2014
Denne publikasjonen er vernet i henhold til Åndsverkloven av 1961

Elbiler – miljømessige, økonomiske og praktiske kjennetegn
Elbiler kjører 14 000-15 000 km/år i snitt. Dette tilsvarer kjørelengden for konvensjonelle biler som kjøres vel 15 000 km første år, 14 800 km andre år og 13 400 tredje år. Bare ca 20% økte sin samlede forsikrede kjørelengde for husholdningens biler når de kjøpte elbil, mens 6% reduserte den.
En tredjedel av elbileierne greier seg med elbil Undersøkelsen finner en høyere andel rene elbileiere (32%) enn tidligere studier, se figur S3. Dette reflekterer trolig både teknologisk utvikling mht rekkevidde, kjøreegenskaper, størrelse og redusert pris på nyere elbiler. Andelen er større i Oslo (41%) der avstanden til viktige reisemål trolig er kortere enn andre steder.
Figur S3 Andel i rene elbilhusholdninger og husholdninger med en kombinasjon av elbil og annen bil blant norske elbileiere 2014 (n = 1 721). Prosent
Elbileiere har ikke store problemer med rekkevidde og lading. Få har opplevd at bilen har gått tom for strøm og nettet av ladestasjoner gir trygghet. I snitt er 85% komfortable med å bruke 80% av batteriets kapasitet. De fleste lader daglig bilen hjemme (65%) eller på jobben (15%). Vanlig lading på offentlig parkeringsplass brukes ukentlig av ca 20%, og hurtiglading av 6-7%.
Elbileiere likner andre bileiere Undersøkelsen viser at elbileiere i større grad enn gjennomsnittet er aktive personer (flest menn) i 35-54 årsalderen med høy utdanning og inntekt som bor i husholdninger med flere barn i eller nær byer. Men ser vi dem i forhold til andre eiere av flere biler som har kjøpt bil de siste to årene er det små forskjeller. Figur S4 illustrerer dette med fordeling etter husholdningsinntekt.
Figur S4 Husholdningsinntekt (NOK) for personer i husholdninger med flere biler som eier 1) vanlige biler (RVU n = 801og medlemmer i NAF n = 145), 2) en kombinasjon av elbil og vanlig bil (n = 192) eller 3) bare elbil (n = 19) i Norge hhv Oslo-Kongsberg regionen og som kjøpte siste bil for mindre enn to år siden. Prosent
26%
6%68%
Husholdning med kun 1 elbil
Husholdning med kun 2 elbiler
Husholdninger med både elbil ogkonvensjonell/e biler
9%
8%
18%
22%
27%
20%
15%
23%
64%
72%
67%
54%
0% 10% 20% 30% 40% 50% 60% 70% 80% 90% 100%
2 eller flere elbiler
Kombinasjon 1 elbil og 1/flere konvensjonellekjøretøy
NAF 2 eller flere kjøretøy
Nasjonal RVU, 2 eller flere kjøretøy
Under 200 000 200-800 000 800-1000 000 over 1000 000
Copyright © Transportøkonomisk institutt, 2014 III
Denne publikasjonen er vernet i henhold til Åndsverkloven av 1961

Elbiler – miljømessige, økonomiske og praktiske kjennetegn
Forskjeller i holdninger mellom elbileiere og andre Det er store forskjeller i vurderingen av fordeler og ulemper med elbil mellom de som har erfaring med denne biltypen og de som ikke har det. Mer enn halvparten av medlemmene i Norges automobilforbund (NAF) peker på manglende rekkevidde og dårlig tilgang til ladestasjoner som store ulemper, mens bare ca 20% av elbileierne mener det samme. Tilsvarende ser ca 80% av elbileierne lave driftskostnader som en stor fordel, mot bare 20% av NAF-medlemmene. Særlig interessant er at de 30% av NAF-medlemmene som vil vurdere å kjøpe en elbil neste gang gjør omtrent samme vurderinger som elbileierne.
Det er også store forskjeller mellom elbileierne, avhengig av hvilke type elbil de har eller av hvor de bor. Tilgang til kollektivfelt verdsettes høyest i Oslo-regionen der man kan spare opptil 30 minutter på dette, mens lavere fergetakst verdsettes mest på Vestlandet. Ut fra andel intervjupersoner som har mulighet for å benytte de ulike lokale insentiver kan verdien av disse for hele elbilflåten anslås til ca 400 mill NOK.
Nesten alle (87%) elbileiere vil kjøpe elbil neste gang, og av samme grunner som de kjøpte bilen, dvs bedre økonomi ved kjøp (fritak engangsavgift og MVA) og drift (gratis bompenger, parkering og redusert fergeavgift), miljøfordeler og at bilen er praktisk for dem f eks pga at de kan kjøre i kollektivfelt. Mindre enn 1% vil ikke kjøpe elbil neste gang og 12% vet ikke.
Spredning av elbilteknologien påvirkes av flere forhold Undersøkelsen støtter opp om innovasjonsstudier som viser at tre forhold er viktige for spredning av miljøteknologi:
• Selve teknologiens egenskaper og muligheter for fremtidig forbedring av teknologien i forhold til behov – og kunnskap om denne
• Kommunikasjonen av teknologien, der både media og sosiale nettverk har hatt stor betydning
• Samfunnsmessig støtte i form av ulike insentiver fordi miljøteknologi ofte medfører ekstra kostnader for brukerne
Både elbileiere og potensielle elbilkjøpere er mer teknologisk interessert og har mer kunnskap om elbilens egenskaper enn bileiere som ikke nå kan tenke seg en elbil. Økt kunnskap om elbilteknologi er dermed et mulig grep for å øke markedsandelen. Når det gjelder kommunikasjon, viser undersøkelsene at fornøyde elbileiere har stor betydning for den videre spredning av elbiler. En tredjedel av elbileierne har venner som har kjøpt elbil, og ytterlige en tredjedel har venner som vurderer elbilkjøp. Det sosiale nettverkets betydning ser vi også blant NAF-medlemmene som eier vanlige biler. 30% av disse vil vurdere en elbil neste gang de skal kjøpe bil. Blant de NAF-medlemmer som har venner med elbil er andelen høyere (44%).
Norge har prøvd ut en rekke insentiver for å legge til rette for elbiler. Med fortsatt bruk av disse insentivene vil elbilenes markedsandel trolig fortsatt øke. Samtidig er det viktig å vurdere justeringer både ut fra økonomiske og miljørelaterte argumenter for å unngå uønskede virkninger og for å få flere bein å stå på i utviklingen mot miljø- og klimavennlig transport med flere typer elektriske kjøretøy (ladbare hybrider, elsykler, elbusser, elvarebiler) eller andre typer nullutslippsbiler (hydrogenbiler m fl).
IV Copyright © Transportøkonomisk institutt, 2014
Denne publikasjonen er vernet i henhold til Åndsverkloven av 1961

Electric vehicles - environmental, economic and practical aspects
1 Introduction and approach
1.1 Electrification and climate
Electrification of vehicles is an important measure to reduce environmental impacts and climate gas emissions from transport. Electric propulsion is energy efficient, and electric vehicles emit no local pollutants and much less greenhouse gases well to wheel than internal combustion engine vehicles (ICEs) when electricity is produced from hydroelectric and wind power, which was the case for 96% of Norway’s electricity production in 2011 (Ministry of Petroleum and Energy 2013).
The 2012 Climate policy settlement made by the Norwegian Parliament sets a target of 85 g/km for average emission from new passenger vehicles. Figenbaum et al (2013) have shown that this target can be reached if Electric Vehicles (EV) or/and Plug-in Hybrid vehicles (PHEV) achieve significant (20 - 30% together) market shares. The importance of electrification is also shown in model analyses of measures to change the total car park over time (Fridstrøm and Alfsen 2014).
To support the national climate policy and targets for reducing CO2-emissions from passenger vehicles, Norway has introduced many EV incentives for consumers that aim to influence the technology diffusion process. The incentives in force in the beginning of 2014 are described in appendix I. Probably as a result of these incentives, the share of EVs in the new car market in Norway has been the largest in the world since 2012, cf figure 1.1 for data on European EV sales 2010-2013. This makes Norway a unique arena for testing incentives and establish knowledge on barriers and possibilities related to electromobility.
Figure 1.1 EV market share 2013 and number of vehicles sold 2010-2013 in selected European countries
Close to 80% of all EVs in Norway are owned by private citizens (www.gronnbil.no), a situation that is different from most other countries in Europe. This high market share for private consumers and the high market share in general, provide better opportunities to conduct consumer surveys among EV owners and learn from their experiences of incentives etc in Norway than in other countries.
Copyright © Transportøkonomisk institutt, 2014 1 Denne publikasjonen er vernet i henhold til Åndsverkloven av 1961

Electric vehicles - environmental, economic and practical aspects
1.2 Competitive Electric Town Transport Although several countries have set sales and stock targets for electrification as part of their climate policy, the number of such vehicles in use is very limited. A report from the Electric Vehicles Initiative (EVI 2013) shows that their 15 members have an EV-stock of 0.02% while having a target of 2%. This discrepancy is part of the background for ERA-nets Electromobility+ programme which funds 20 European projects on this topic, one being Competitive Electric Town Transport (COMPETT, Assum et al 2012). The “town”-concept in the title is not interpreted in a strict sense, since the project also comprises studies of regional differences.
COMPETT’s main objective is to contribute to reduction of CO2 emissions through producing better knowledge on the barriers against and potentials for electrified vehicles (EVs). COMPETT’s main question: How can EVs come into use to a greater degree? is decomposed into the following questions (Assum et al 2012):
• “What are the most likely niches for the use of EVs from a social-economic and spatial/regional point of view for households and businesses?
• What kind of EVs can easily become competitive alternatives to ICE vehicles and how can we bring about the social acceptability and travel-behaviour changes needed?
• What barriers and potentials exist for the use of EVs on the individual, the regional and the national level?
• How can these barriers be overcome and how can potential benefits be used to promote the use of EVs and strategic planning?
• Who will be the main actors involved and what facilities will be needed? • What is the economy of existing regulations and incentives for use of EVs and how should
innovative new measures be designed? • How can increased and research-based knowledge stimulate marketing related to e-vehicle
use?”
To shed light on some of these questions, COMPETT has surveyed users and interviewed stakeholders about their experiences with electrified transport in the Oslo-Kongsberg region and has also studied transport patterns and trip chains (see Hjorthol et al 2014). This report present the first results and data from the user surveys. It presents covariances rather than conclusions on complicated causal relations, and is meant to serve as a basis for later multivariate analyses as well as scenario development in the COMPETT project.
1.3 The Oslo-Kongsberg region The Oslo-Kongsberg region is defined as the Norwegian study area in COMPETT. The region is located in the southern part of Norway, to the south-west of the capital Oslo, see figure 1.2. The Oslo-Kongsberg region includes the following municipalities: Oslo, Bærum, Asker, Lier, Hurum, Røyken, Nedre Eiker, Øvre Eiker, Drammen, Kongsberg, Svelvik, Sande, Hof and Holmestrand.
The region contains 20% of the Norwegian population, 20% of the total vehicle fleet and 40% of the total number of EVs in Norway. The share of EVs in the total fleet in the Oslo-Kongsberg region was 1.6% in January 1st 2014 as compared to 0.8% in Norway as a whole. The region contains different types of living areas; city centres,
2 Copyright © Transportøkonomisk institutt, 2014 Denne publikasjonen er vernet i henhold til Åndsverkloven av 1961

Electric vehicles - environmental, economic and practical aspects
urban regions, smaller cities and countryside. Some characteristics of the region are found in table 1.1.
Figure 1.2 Map of the Oslo-Kongsberg region
Table 1.1 Population and vehicles in the Oslo-Kongsberg region and in each municipality. January 1st, 2014
Municipality Type of municipality
Population Total vehicle fleet
EV fleet EV share in total fleet
Oslo City 634 463 263 807 4 237 1.6% Bærum Suburb 118 588 81 839 1 255 1.5% Asker Suburb 58 338 28 282 1 454 5.2% Lier Rural and suburb 25 175 13 087 251 1.9% Hurum Rural 9 330 4 943 81 1.6% Røyken Rural 20 621 10 772 195 1.8% Nedre Eiker Rural 23 811 11 928 45 0.4% Øvre Eiker Rural 17 919 9 722 19 0.2% Drammen City 66 214 40 669 266 0.7% Kongsberg Town 26 406 13 606 30 0.2% Svelvik Rural 6 580 3 365 15 0.4% Sande Rural 9 036 4 736 33 0.7% Hof Rural 3 091 2 756 9 0.5% Holmestrand Town 10 456 5 327 19 0.4% Total 1 020 992 493 839 7 909 1.6%
(Source: Statistics Norway 2014. Population 1st January 2014, Total fleet of passenger vehicles and EVs 1st January 2014, EVs registrered as 4 wheel MCs added to both fleet of passenger vehicles and EVs, from the vehicle register of the Norwegian Public Roads Administration)
1.4 Diffusion of new technology
There are many theories on diffusion of technological innovations. Rogers (1962, 1995) and Axzen and Kurani (2012, 2013) stress that diffusion processes take place in a social system. A social system organises the units in relation to each other and gives norms for valid behaviour. Belonging to a social network giving the new technology a positive societal value will have significance for diffusion processes and how new ideas and products are received.
Rogers (1995) divides the diffusion process into five phases; knowledge, persuasion, decision, implementation and confirmation, see figure 1.3. Conditions influencing the EV diffusion process can be:
Copyright © Transportøkonomisk institutt, 2014 3 Denne publikasjonen er vernet i henhold til Åndsverkloven av 1961

Electric vehicles - environmental, economic and practical aspects
• The character of the innovation itself, the ability to change the product during the process to avoid possible weaknesses, e.g. better batteries or new technology for more effective driving for EVs.
• User related conditions such as previous practice of the field, understanding the technology and the degree to which the innovation responds to a need.
• The general economy in a country will influence car sales and the number of people that have the means to buy 1) a new car or 2) a second car.
• The economic framework and characteristics of car tax systems will influence the willingness and ability to introduce incentives to promote electromobility in the actual society.
Figure 1.3 A model of the different types of factors that affect the diffusion of innovations. Source: Figenbaum and Kolbenstvedt (2013) based on Rogers (1995)
Communication is the key issue in all five phases. Users, individuals or other decision-makers require different types of information in the various phases of the diffusion process:
1. Knowledge: In the initial phase, knowledge of the new technology (or the new organisation), and how it works, is required.
2. Persuasion: As a basis for a decision, users must acquire knowledge of the innovation and thus need to be exposed to arguments for using the innovation to create a positive or negative attitude to the innovation.
3. Decision: Making a decision implies choosing between adopting or rejecting the innovation. An opportunity to borrow an EV from friends, at work or at a ride and drive event, can be an important part of the communication process.
4. Implementation: In this phase there will still be a certain amount of uncertainty associated with practical use, and the consequences use will have. It may be easier to handle this information for organisations than for individuals.
5. Confirmation: During this phase, one needs reinforcing of arguments to continue to use an innovation and to further develop it. An innovation must
Communication stages with channels
Adoption
Rejection
Continued adoption Later adoption
Discontinuance Continued rejection
Characteristics of the Innovation:
Relative advantage Compatibility Complexity Triability Observability
Characteristics of the Decision Making Unit:
Socioeconomy Personality variables Communication behaviour
Framing Conditions for a Process of Innovation Previous practice, Felt needs/problems, Innovativeness,
Norms of the social system, Public Incentives
4 Copyright © Transportøkonomisk institutt, 2014 Denne publikasjonen er vernet i henhold til Åndsverkloven av 1961

Electric vehicles - environmental, economic and practical aspects
be modified in the course of the implementation phase. Whether one wishes to continue using the innovation or reject it, is related to the type of new knowledge provided by the first time use of the innovation.
Key elements in the early phases are how the new technology is perceived with respect to:
• Relative advantages concerns advantages the innovation has or is perceived to have relative to other technologies. Relative benefits can be financial, practical, environmental and personal, e.g. giving social status or satisfaction.
• Compatibility with the users’ needs and basic values and norms in the social system. Diffusion of innovations that cross norms and values take longer time, as initial values may need to be modified.
• Complexity relates both to how easy it is to understand and put the technology to use and its ability to accommodate more opportunities.
• Opportunity for trial applies to the possibility of testing. Innovations that can be tried out on a small scale are perceived as less uncertain and thus easier to implement quickly than those that require full implementation from the start.
• Observability/visibility for new users can increase the speed of implementation. This factor stresses the importance of network communication.
Different actors and decision makers will react differently to new products. It is therefore essential that there is someone who is willing to try out new things. Rogers (1995) distinguishes between five groups of users of innovations with different socio-economic and personal characteristics and communication behaviours:
• Early users (Innovators) are the first to adopt or utilise an innovation. They are young risk-takers with high education, good finances and are in contact with scientific environments, and other early users. Their risk tolerance allows them to try new technologies, which may eventually fail.
• Early adopters also have better finances, education and status, and are younger than those who adopt at a later date. They are often opinion leaders and important for the further introduction process. They are somewhat more cautious than the innovators, which gives them credibility when communicating with others.
• The early majority adopts an innovation later than the two former groups. Their social status is above average, and they are often in touch with the early adopters, but they themselves are not opinion leaders.
• The late majority comprises a group that adopts innovations later than the average population and meet innovations with scepticism. Their social status and finances are below average. They have contacts with others in the same group, but also members in the early majority group.
• Laggards are the last ones to adopt an innovation. They are often older, negative to change agents and have low social status and a poor economy. Their contact is directed towards the family and close friends.
Using new environmental technology can often have rebound effects and involve costs for the users. It seems like environmental innovations cannot develop into a large market without parallel public incentives, and fundamental changes in economic and wider social-cultural conditions (van den Bergh et al 2011, Jacobsson and Bergek 2011). A special challenge when evaluating technological innovations, is that their character is often changed during the process.
Copyright © Transportøkonomisk institutt, 2014 5 Denne publikasjonen er vernet i henhold til Åndsverkloven av 1961

Electric vehicles - environmental, economic and practical aspects
1.5 Earlier studies as a basis for surveys The COMPETT project will develop scenarios and models for the future potential and role of electromobility in the private vehicle market. In order to better understand the EV market in Norway, more information about present EV users, potential EV-buyers and users of regular ICE-vehicles and the population at large is needed. This can be achieved through a combination of surveys directed at different owner groups combined with literature reviews and various statistics. This report focuses on the surveys.
As a basis for developing the questionnaires and for formulating hypotheses, two reviews of international literature have been produced, focusing on attitudes to EVs, use of EVs and influencing factors (Hjorthol 2013, Figenbaum 2014). In addition Figenbaum and Kolbenstvedt (2013) studied 18 Norwegian surveys on EV experiences and opportunities. Appendix II summarizes some findings from this work, and the questions or hypotheses that could be derived from the studies.
Some hypotheses of relevance for scenarios were:
1. EV owners are more interested in environmental issues than ICE-car owners. 2. Innovators and early adopters are a) wealthier than and b) more technically
oriented than those buying EVs later. 3. The early majority among EV owners have a greater potential for benefitting
from incentives than other groups. 4. EV owners belong to multicar households. 5. Tesla buyers are more prone to be single-vehicle and multi EV owners than
owners of other makes of EVs. 6. EV owners walk or cycle less after buying the EV. 7. Information about EVs can reduce skepticism towards EVs. 8. The most challenging drawbacks of EVs are related to range, quality and
performance and uncertain second hand value.
Based on these hypotheses a questionnaire to EV owners being members of the Norwegian Electric Vehicle Association (NEVA), cf chapter 2.1 and 2.2, consisting of 94 questions and structured in nine parts, was developed:
1. Car ownership and car use for EVs and other cars, EV history. 2. Evaluation and use of incentives (toll-roads, bus lanes, parking spaces, charging
station), time and money savings. 3. Information channels on EVs and factors of importance for buying an EV. 4. Travels last weekday; purpose, mode, length in km for up to 12 travels. 5. Annual driving length, the EVs range in summer and winter respectively. 6. Experiences compared to expectations and car-dealers’ information, practical
challenges, strategies for adaption, disadvantages with EVs. 7. Information and knowledge diffusion. 8. Socio-demographic and personal information. 9. Changes in travel pattern and vehicle ownership.
A shorter questionnaire to average car users, in this study represented by members of the Norwegian Automobile Association (NAF), cf chapter 2.1 and 2.2, consisted of 46 questions. It was structured in the same way as the EV owner questionnaire, but did not contain questions about experiences with EVs. Print-outs of the Norwegian questionnaires are found in appendix V and VI.
6 Copyright © Transportøkonomisk institutt, 2014 Denne publikasjonen er vernet i henhold til Åndsverkloven av 1961

Electric vehicles - environmental, economic and practical aspects
An important point, necessary to have in mind when looking at earlier studies on electromobility, is that the EV technology and the essential characteristics of EVs are rapidly evolving. Thus the object the user evaluates in recent studies is not the same as in older studies. It can, however, be of interest to investigate whether attitudinal changes track technological development. The questions in the surveys were thus selected both to gain knowledge on topics that have not been treated in earlier studies and to make comparisons with earlier studies.
1.6 The structure of the report There are many factors influencing the diffusion process. COMPETT thus has a multidisciplinary approach to the research questions. In chapter 2 the samples and their socio-demographic characteristics are presented, and possible challenges with the samples discussed. Then vehicle-related characteristics of the samples are described in chapter 3, which deals with vehicle ownership as well as the respondents’ competence and interests in vehicle technologies. Chapters 1-3 constitute a background for the further analyses.
Chapter 4-7 mainly deals with EV owners, although with some references to NAF members and the population at large represented by a sample the National Transport Survey (NTS) 2009. Chapter 4 gives an overview of the EV buying process. Chapter 5 describes the actual use of the EVs, an area where there has been a marked lack of data and information, and presents data on travel distances, transport patterns and changes after buying an EV. This leads to chapter 6 on EV owners’ charging behaviour and on possible range challenges related to car types, number of cars owned and regional location as well as adaptions to such challenges. The respondents evaluation of the importance of different incentives supporting EVs is given in chapter 7.
Two very important groups when looking at EV diffusion are the new and growing group of EV-only car households and the potential EV buyers among NAF members who consider buying an EV the next time they buy a car. Data on these two groups are presented in chapters 8 and 9 respectively.
Chapter 10 presents the attitudes to EVs advantages and disadvantages among EV owners as well as among the two groups of NAF members, those who consider to buy an EV next time and those who don’t. The NAF members are supposed to represent the car owning population at large, which does not have experiences with EVs.
Finally, in chapter 11, the potential trends for buying EVs among both EV owners, NAF members considering buying an EV and NAF members who do not, are summarized and discussed in relation to diffusion theory. Possible environmental effects of EV use are also discussed.
Copyright © Transportøkonomisk institutt, 2014 7 Denne publikasjonen er vernet i henhold til Åndsverkloven av 1961

Electric vehicles - environmental, economic and practical aspects
2 Samples and sociodemographics
2.1 Surveys of EV owners, potential EV owners and other car owners
To be able to answer the research questions of COMPETT, cf chapter 1.2, the project will develop scenarios and models for the future potential and role of electromobility in the private vehicle market. To do so, one needs data on:
1) Actual EV owners and users 2) Potential EV buyers in a short perspective 3) The car using population at large.
Information about these groups can shed light on the barriers against and the possibilities for enlarging the EV-market. The three groups are populations that are of interest in themselves, and the crucial question is thus whether the samples are representative for these groups as a whole. The groups are not chosen as control groups for each other, but differences between the groups are of interest since they represent different stages in the EV diffusion process.
To get samples covering the three groups two internet-surveys were carried out: • 1 721 EV owners in Norway, approached through membership of the
Norwegian Electric Vehicle Association (NEVA), which provide more knowledge on all EV owners in Norway and EV owners in the study area Oslo-Kongsberg region (n = 542)
• 2 241 members of the Norwegian Automobile Federation (NAF) representing the car using population at large
• Questions to the NAF-sample was used do find a group of 672 persons that in 2014 says that they will consider buying an EV next time, in this study designated as potential EV buyers.
Invitations to both surveys were distributed to members of the organisations by e-mail. In the case of NEVA, the invitation was included in their regular newsletter (distributed to all members), which contained the organisation’s endorsement of the survey, an explanation of its background and objectives and a direct link. In the case of NAF, TØI was given a randomly drawn sample from their member pool in the Oslo-Kongsberg region. These members were sent an e-mail from TØI, which explained that they received the e-mail in their capacity as NAF members, and similarly contained an explanation of the background and objectives, and a direct link to the survey. Both studies were conducted online in February 2014.
This first report from the study mostly contains bivariate analyses in order to identify important variables to be included in later more advanced statistical analyses. The analyses of the three main samples are, however, often divided by dimensions such as; number of cars in the household, age of last car bought, EV-only vs multi-type car owners.
8 Copyright © Transportøkonomisk institutt, 2014 Denne publikasjonen er vernet i henhold til Åndsverkloven av 1961

Electric vehicles - environmental, economic and practical aspects
2.2 Response rate and representativeness
2.2.1 The EV owner survey Everyone who buys an EV in Norway, receives a one-year complimentary membership in NEVA. Since the number of EV owners in Norway increases rapidly, the selection of EV owners that received the survey should be fairly representative, even though some discontinue their membership after the complimentary first year. In addition, owners of new EVs are probably more representative of future EV-owners than EV owners with older cars. In January 2014, there were 21 021 private EV owners registered in Norway (OFV AS 2014) of which 9 051 persons or 43% were members of NEVA. At this time, Tesla buyers did not receive a free membership, but were able to join the organisation against a regular fee.
The newsletter with the invitation to the EV owner survey was distributed to the 9 051 NEVA members on January 29th, 2014. According to NEVA statistics, 4 517 receivers opened the newsletter. A reminder was distributed a few days later, and then 4 007 newsletters were opened. It is not known how many recipients opened the newsletter twice, which makes it difficult to calculate a response rate. 1 721 surveys were completed. Comprising 8% of all EV owners in Norway, the representativeness of the EV sample is fairly good. 128 of the respondents were users of business-owned EVs and were directed out of the survey, its focus was private consumers. This makes for a response rate between 22 – 41%, depending on how many receivers opened the newsletter.
2.2.2 NAF member survey 10 000 randomly selected NAF-members in the Oslo-Kongsberg region were invited to participate in the survey. Postcodes were used to identify the respondents’ municipality. The invitation was distributed through e-mail. Out of the 10 000 e-mails, 359 where non-deliverable. 2 241 persons answered the survey. The response rate was thus about 24%. The real response rate, however, is probably slightly higher, as some e-mail addresses are likely to be obsolete, or checked only at irregular intervals.
A number of EV owners may have received both surveys, as EV owners among NAF members could also be NEVA members. This may have reduced the number of EV owners in the NAF sample, as the NAF-survey was distributed a few days after the NEVA survey. On the other hand, the 61 EV owners in the NAF sample constitutes 2.7% of the sample, whereas the EV share in the total car fleet in the Oslo-Kongsberg region was 1.6%, in January 2014 c.f. table 1.1. This indicates that the sample is fairly representative.
NAF is the largest consumer organisation in the Nordic countries, with a total of one million members in Norway. According to the population and housing census from 2011, there are about 1.6 million vehicle owning households in Norway (SSB 2011). Some members are household members so as an estimate the organisation represents 50-60% of the car owning households. The persons in the Oslo-Kongsberg NAF sample are older than in the EV sample. This is in accordance with a high average age for the NAF member stock at large. The gender distribution with 70% men and 30% women is also representative for the total member stock (information from NAF).
Copyright © Transportøkonomisk institutt, 2014 9 Denne publikasjonen er vernet i henhold til Åndsverkloven av 1961

Electric vehicles - environmental, economic and practical aspects
2.2.3 Uncertainties related to response rates Low response rates pose a problem when interpreting survey results. One way to handle this is to conduct several studies with different methods to shed light on one’s research questions, so-called method triangulation. In the COMPETT project, survey results are supplemented with statistics on car sales, use of charging stations and toll roads, traffic counts, interviews with stakeholders, qualitative studies etc. The uncertainties are smaller the larger the share of the population the survey contains and the larger the number of respondents. Anyway, given the relatively low response rates – which also increases the risk of bias due to self-selection – this statistical uncertainty must be kept in mind when interpreting results.
2.3 Regional distribution of the samples
The geographical distribution of EV owner respondents compares well with the documented distribution of EV owners on January 1st 2014, which gives an indication of the representativeness of the sample. The respondents to the EV owner survey are spread around the country: All counties are represented, as shown in figure 2.1.
Figure 2.1 Geographical distribution of respondents (n = 1 659 with municipality information) to EV owner survey (left) compared to distribution of EV owners in January 2014 (right). Source EV owners: gronnbil.no/OFVAS, data per end of January 2014
The NAF member survey comprises a much larger share of respondents from Oslo than the EV owner sample. The NAF-members have, in this respect, a distribution more like the population distribution in region, cf table 1.1, than the EV owners.
10 Copyright © Transportøkonomisk institutt, 2014 Denne publikasjonen er vernet i henhold til Åndsverkloven av 1961

Electric vehicles - environmental, economic and practical aspects
This regional distribution is of importance when discussing incentives. We have, however, not checked this distribution in relation to the actual distribution of NEVA and NAF-members in the Oslo-Kongsberg region nor the actual prevalence of different local incentives in the region.
Figure 2.2 Geographical distribution in municipalities for EV owner (n = 542) and NAF-member (n = 2 241) respondents in the Oslo-Kongsberg region 2014. Percent
2.4 Socio-demography
To be able to identify socio-demographic and economic variables influencing EV adoption, the surveys included questions on type of occupation, occupational status, age, gender, education, living area, household size, number of persons below 18 years in the household, number of driving licences in the household, annual gross house-hold income and postcode (defines the living area). Table 2.1 shows the results for age, gender, education and occupational status for the different COMPETT samples, and from a comparable sample from NTS 2009. All respondents are persons over 18 year with a driving licence belonging to households owning one or more cars.
The NAF members are older and have a much higher share of retired people than the EV-owner sample as well as the NTS data, cf chapter 2.2.2. Figure 2.3 shows the age distribution of the respondents for the two surveys. The shares for occupational status is shown in figure 2.4 and for groups of occupations in figure 2.5.
Nine out of ten EV owners are working. The same is true for seven out of ten NAF members. EV owners in the Oslo-Kongsberg region have the highest level of education, but NAF members and EV owners in general are rather equal. Both COMPETT samples have higher education than the respondents from the NTS, and considerably higher education than the Norwegian average.
78%
49% 17%
4%
15%
9%
6%
2%
4% 4%
3%
2%
N A F
E V O W N E R S
Oslo Bærum Asker Drammen Holmestrand
Lier Røyken Kongsberg Øvre Eiker Nedre Eiker
Svelvik Hof Hurum Sande Others
Copyright © Transportøkonomisk institutt, 2014 11 Denne publikasjonen er vernet i henhold til Åndsverkloven av 1961

Electric vehicles - environmental, economic and practical aspects
Table 2.1 Age, gender, education and occupational status in the COMPETT samples from 2014 and respondents from the National Travel Survey 2009. All respondents included are over 18 years, have a driver’s licence and belong to households owning at least one car. Percent
EV owners Average Norway
EV owners Oslo-
Kongsberg
NAF Oslo-
Kongsberg
NTS 2009 Oslo-
Kongsberg
NTS 2009 Average Norway
Average age 47 47 54 NA NA
18-24 years 1% 0.4% 0.4% 9% 8%
25-34 years 13% 10% 8% 18% 16%
35-44 years 34% 36% 18% 23% 23%
45-54 years 29% 27% 22% 20% 20%
55-66 years 19% 21% 30% 17% 20%
67-74 years 4% 5% 18% 7% 7%
75 years + 1% 1% 5% 5% 6%
Men 76% 74% 71% 51% 53%
Women 24% 26% 29% 49% 47%
Highest education
Primary and lower secondary (1-10 grade) 2.1% 1.5% 2.8% 7% 12%
Upper secondary school/High school (11-13 grade)
19.2% 10% 19.6% 31% 42%
Higher education up to four years 38.2% 36% 36% 29% 24%
Higher education longer than 4 years 40.5% 53% 42% 33% 22%
Occupational status
Working 91% 91% 72% 71% 68%
Retired/Benefit recipient 7% 7% 25% 18% 23%
Student/other 2% 2% 3% 11% 9%
Sample size 1 721 542 2 241 3 560 20 680
Figure 2.3 Age distribution of EV owners and NAF members in Oslo-Kongsberg region. (n = 541 EV owners, n = 2 237 NAF)
0%
1%
2%
3%
4%
5%
6%
20 25 30 35 40 45 50 55 60 65 70 75 80 85 90Shar
e of
resp
onde
nts a
t tha
t ag
e
EV owners Oslo-Kongsberg NAF members Oslo-Kongsberg
12 Copyright © Transportøkonomisk institutt, 2014 Denne publikasjonen er vernet i henhold til Åndsverkloven av 1961

Electric vehicles - environmental, economic and practical aspects
Figure 2.4 Occupational status (n = 2 241 NAF members, n = 1722 EV owners in Norway, n = 542 and EV owners Oslo-Kongsberg). Percent
Figure 2.5 Occupations (n = 2 241 NAF members, n = 1 722 EV owners in Norway, n = 542 EV owners in Oslo-Kongsberg). Percent
Household characteristics are shown in table 2.2. Persons in the Oslo-Kongsberg –region live in urban areas to a greater extent than persons from the nationwide samples. The EV-owner households have a higher number of total members and a much higher number of children below 18 years. This is probably related to the age difference. Also, the household income of NAF members is lower, probably due to the much higher share of retired persons and smaller household sizes among the respondents.
2.5 National Travel Surveys – a reference point
In addition to the surveys, data from the National Travel Survey 2009 (NTS 2009) have been extracted to provide a point of reference for the travel patterns of persons, and characteristics of households. The Travel survey data only includes individuals over 18 years old belonging to a household owning at least one car. This makes the extract comparable to the EV owners and NAF members samples. NTS is based on telephone interviews with people randomly drawn from the telephone directory.
78%
79%
61%
4%
4%
4%
10%
7%
8%
5%
6%
22% 2%
0 % 10 % 20 % 30 % 40 % 50 % 60 % 70 % 80 % 90 % 100 %
E V O W N E R S O S L O - K O N G S B E R G
E V O W N E R S N O R W A Y
N A F M E M B E R S
Student Full time employee Part time employee Self employed
Retired Benefit recipient Other
9%
14%
8%
4%
4%
5%
8%
8%
8%
22%
17%
13%
4%
5%
8%
5%
6%
23%
26%
28%
3%
2%
3%
16%
15%
22%
0 % 10 % 20 % 30 % 40 % 50 % 60 % 70 % 80 % 90 % 100 %
E V O W N E R S O S L O K O N G S B E R G
E V O W N E R S N O R W A Y
N A F M E M B E R S
Agriculture, forestry, fishing Mining and quarrying
Industry Electricity, water, renovation
Construction and building Trade, transport, hotel, restaurant
Information and communication Finance and insurance
Commercial services, property management Public services, education, health
Personlal services Other
Copyright © Transportøkonomisk institutt, 2014 13 Denne publikasjonen er vernet i henhold til Åndsverkloven av 1961

Electric vehicles - environmental, economic and practical aspects
The EV-owner survey was conducted on a national level in order to secure sufficient sample size, to be able to investigate regional differences and because little knowledge exists on individual EV owners’ travel habits. The main study area of COMPETT is the Oslo-Kongsberg region. Data on EV owners and data from NTS 2009 will thus be presented both for this region and nationally, whereas the NAF member survey was only conducted in the Oslo-Kongsberg region.
The EV owner survey is primarily used to identify travel habits, characteristics of and experiences from EV owners, the NAF member sample to gain knowledge on a) potential EV buyers and b) other vehicle owners. The sample from NTS 2009 serves as a point of reference. The different sampling methods make direct comparisons difficult, but is not precluding the positioning of the various sampled groups in relation to diffusion theory of new technology presented in chapter 1.4. Table 2.2 Household characteristics for the different samples used in the COMPETT study 2014 and the National Transport Study from 2009. All respondents included are over 18 years, have a drivers licence and belong to households owning at least one car. *) Percent
EV owners Average Norway
EV owners Oslo-
Kongsberg
NAF members
Oslo- Kongsberg
NTS 2009 Oslo-
Kongsberg
NTS 2009 Average Norway
Living area
Big city 39% 58% 73% 55% 20%
City 21% 13% 19% 20% 34%
Densely populated 30% 27% 6% 25% 46%
Other 10% 2% 2%
Number of children below 18 years in household 1.17 1.16 0.5 0.7 0.8
Persons in household 3.24 3.2 2.4 2.8 2.8
Average number of driving licenses in household 2.0 2.0 1.7 1.9 1.9
Household income
Under 200 000 0.8% 0.9% 1.1% 2.9% 2.5%
200 000-400 000 2% 2% 16% (200-500’)
27% (500-800’)
8.4% 10.7%
400 000-600 000 10% 9% 13.7% 16.4%
600 000-800 000 14% 10% 11.9% 15.1%
800 000-1 000 000 24% 19% 15% 16.3% 17.8%
Over 1 000 000 43% 52% 33% 24.7% 15.8%
Unknown 7% 7% 9% 22.1% 21.7%
Sample size 1 721 542 2 241 3 560 20 680
*)Numbers in italics have been established by recalculating the income limits to 2009 level using the consumer price index between 2009 and 2013 (6.8% increase).
14 Copyright © Transportøkonomisk institutt, 2014 Denne publikasjonen er vernet i henhold til Åndsverkloven av 1961

Electric vehicles - environmental, economic and practical aspects
2.6 Characteristics of early adopters Earlier studies in Norway (Figenbaum and Kolbenstvedt 2013) as well as in other countries (Hjorthol 2013, Pierre et al 2011, Campbell et al 2012), show that the early adopters of EVs differ from the average population and users of conventional cars along a number of socio-demographic dimensions. The COMPETT user studies find the same pattern. EV owners in Norway are more frequently younger men, working full time and living in urban areas with a larger family, than the population at large. They are also better off in terms of economy and education. The same differences are found on the regional level, ie between the EV owners and both NAF members and the average population in Oslo-Kongsberg taken from the NTS.
But these differences are shrinking, thus indicating that the diffusion process in Norway is maturing. This goes especially for gender and for those considering buying an EV. Even if fewer females use EVs, they are now as motivated to purchase an EV as men (Skavhaug 2013, Michelin 2013). Changes are also related to geography. In 2006 Econ analyse found that 89% of EV owners lived in areas within commuting distance of the three biggest cities in Norway, Oslo, Bergen and Trondheim. In the present EV-owner survey, the figure is lower and the EV owners live all over the country, cf figure 7.3.
For more details on different types of EV owners, grouped by their number and type of car/s see chapter 8.
Copyright © Transportøkonomisk institutt, 2014 15 Denne publikasjonen er vernet i henhold til Åndsverkloven av 1961

Electric vehicles - environmental, economic and practical aspects
3 Vehicle ownership
3.1 Technical competence and interest
Competence of and interest in the new technology are key elements in the diffusion process. Earlier studies provide little information about these aspects, beyond questions on motives for buying or considering to buy an EV which can indicate competence and interest in EVs. Economy, environment and practical reasons are the main motives for buying EVs, however (Figenbaum and Kolbenstvedt 2013, Zelenkova 2013, Haugneland 2012). Only one study (Halsør et al 2010) used “technical interest” as a response category.
EVs represent a new technology which is relevant to climate and environment - one of the main challenges of our time. In the survey, respondents were asked how they would rate their interest in and competence relative to vehicle technologies. Table 3.1 indicates that more EV owners than NAF members report that they feel competent. These differences might, however, be related to the age and gender differences between the two samples. The expressed interest in technology does not differ much between the samples. However, as could be expected, those who have recently bought a new car, report a higher level of interest. NAF members who, like most EV owners, bought their car less than two years ago, report a similar level of interest. Table 3.1 Vehicle interest and self-rated technological competence among EV owners in Norway and EV owners and regular vehicle owners in Oslo-Kongsberg region 2014. Percent
EV owners Norway
EV owners Oslo-
Kongsberg
NAF Oslo- Kongsberg
NAF Oslo-Kongsberg, bought vehicle new last
2 years
How would you rate your technical competence in vehicles?
Good and rather good 50% 46% 33% 33%
Average 34% 35% 42% 47%
Bad and rather bad 16% 19% 25% 20%
How interested are you in vehicles?
Very 29% 28% 22% 27%
Somewhat 38% 36% 43% 45%
Neutral 17% 18% 18% 17%
Uninterested 16% 18% 17% 11%
Figures 3.1 and 3.2 shows interest and competence relative to EV brands. Tesla owners are the most pronounced tech geeks, which indicates that for many EV owners, technology interest is a driving force.
16 Copyright © Transportøkonomisk institutt, 2014 Denne publikasjonen er vernet i henhold til Åndsverkloven av 1961
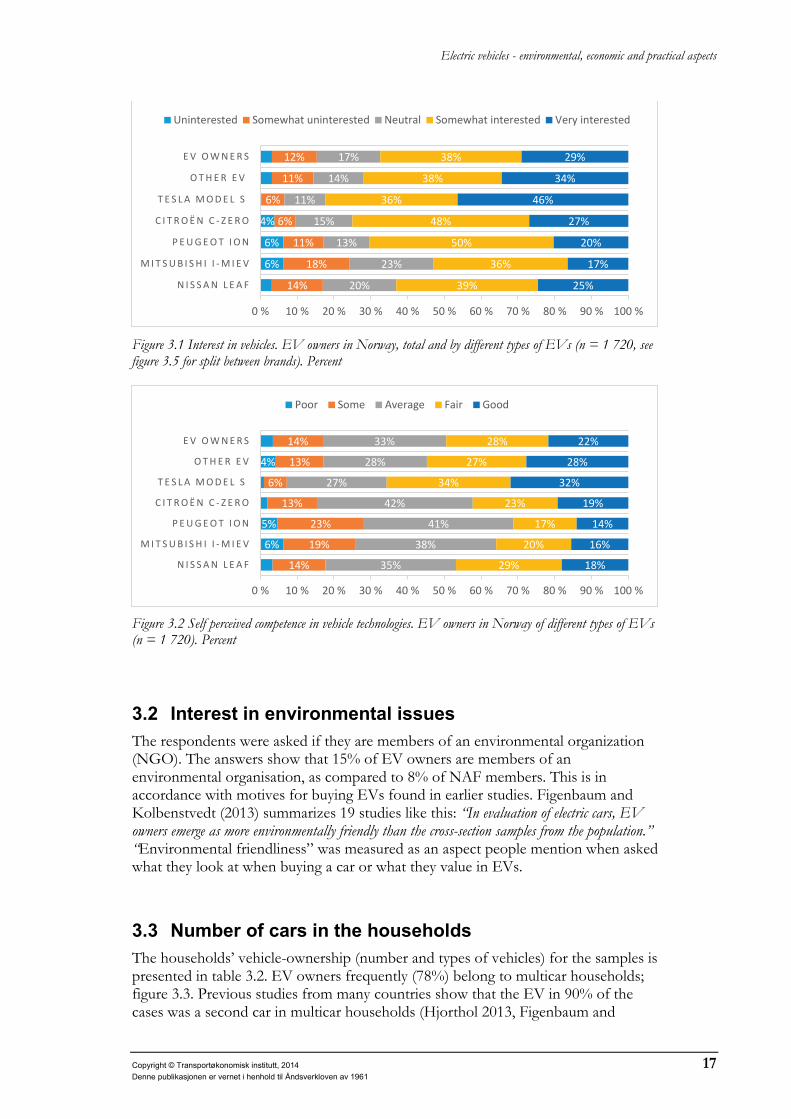
Electric vehicles - environmental, economic and practical aspects
Figure 3.1 Interest in vehicles. EV owners in Norway, total and by different types of EVs (n = 1 720, see figure 3.5 for split between brands). Percent
Figure 3.2 Self perceived competence in vehicle technologies. EV owners in Norway of different types of EVs (n = 1 720). Percent
3.2 Interest in environmental issues The respondents were asked if they are members of an environmental organization (NGO). The answers show that 15% of EV owners are members of an environmental organisation, as compared to 8% of NAF members. This is in accordance with motives for buying EVs found in earlier studies. Figenbaum and Kolbenstvedt (2013) summarizes 19 studies like this: “In evaluation of electric cars, EV owners emerge as more environmentally friendly than the cross-section samples from the population.” “Environmental friendliness” was measured as an aspect people mention when asked what they look at when buying a car or what they value in EVs.
3.3 Number of cars in the households The households’ vehicle-ownership (number and types of vehicles) for the samples is presented in table 3.2. EV owners frequently (78%) belong to multicar households; figure 3.3. Previous studies from many countries show that the EV in 90% of the cases was a second car in multicar households (Hjorthol 2013, Figenbaum and
6%
6%
4%
14%
18%
11%
6%
6%
11%
12%
20%
23%
13%
15%
11%
14%
17%
39%
36%
50%
48%
36%
38%
38%
25%
17%
20%
27%
46%
34%
29%
0 % 10 % 20 % 30 % 40 % 50 % 60 % 70 % 80 % 90 % 100 %
N I S S A N L E A F
M I T S U B I S H I I - M I E V
P E U G E O T I O N
C I T R O Ë N C - Z E R O
T E S L A M O D E L S
O T H E R E V
E V O W N E R S
Uninterested Somewhat uninterested Neutral Somewhat interested Very interested
6%
5%
4%
14%
19%
23%
13%
6%
13%
14%
35%
38%
41%
42%
27%
28%
33%
29%
20%
17%
23%
34%
27%
28%
18%
16%
14%
19%
32%
28%
22%
0 % 10 % 20 % 30 % 40 % 50 % 60 % 70 % 80 % 90 % 100 %
N I S S A N L E A F
M I T S U B I S H I I - M I E V
P E U G E O T I O N
C I T R O Ë N C - Z E R O
T E S L A M O D E L S
O T H E R E V
E V O W N E R S
Poor Some Average Fair Good
Copyright © Transportøkonomisk institutt, 2014 17 Denne publikasjonen er vernet i henhold til Åndsverkloven av 1961

Electric vehicles - environmental, economic and practical aspects
Kolbenstvedt 2013). EV owners in the NAF sample were fairly similar to the EV owners from NEVA, cf figure 3.3. Table 3.2 Vehicle ownership pattern among EV owners, respondents from NTS 2009 in Norway and Oslo-Kongsberg-region, and NAF members in the Oslo-Kongsberg region in 2014. All respondents were over 18 years, had a driver’s licence and belonged to households owning at least one car. Percent
Household types
Period of owning
EV owners Norway
EV owners Oslo-
Kongsberg
NAF Oslo-
Kongsberg
NTS 2009 Oslo-
Kongsberg
NTS 2009 Norway
Belonging to single-car households 22% 26% 65% 61% 50%
Belonging to EV-only households 25% 32% NA NA NA
Average time for owning the vehicle
<1 year 60% 53% 23%
1-2 year 22% 21% 20%
>2 year 18% 25% 57%
Sample Size 1 721 541 2 241 3 560 20 680
Figure 3.3 Share of single and multicar households (n = 2 234 NAF members, n = 1 698 EV owners in Norway, n = 533 EV owners Oslo-Kongsberg, n = 61 NAF EV owners). Percent
3.4 Pure and mixed EV households
The majority of EV owners belong to multicar households and share the socio-demographic characteristics of other multicar households, ie they are affluent, well educated, working men in their 40’s living in urban areas. This is found in most studies in recent Norwegian (Figenbaum and Kolbenstvedt 2013) and international (Hjorthol 2013, Figenbaum 2014, Emmerling 2014) literature reviews. In the COMPETT study, this is also the case, but a new trend in Norway is the advent of pure EV households, found for the first time in this survey, which indicates important behavioural changes among EV users. In the national EV owners sample, one in four households only own EVs, and in the Oslo-Kongsberg region, this share is one in three.
The households’ vehicle ownership profiles are shown in figure 3.4 for EV owners from Norway and different municipalities in the Oslo-Kongsberg region and NAF members from the Oslo-Kongsberg region. The households have been divided into various types of EV households which have only EVs or EV(s) and a PHEV. There
22%
26%
18%
65%
78%
74%
82%
35%
0 % 10 % 20 % 30 % 40 % 50 % 60 % 70 % 80 % 90 % 100 %
E V O W N E R S
E V O W N E R S O S L O - K O N G S B E R G
N A F E V O W N E R S
N A F
Single car Multi car
18 Copyright © Transportøkonomisk institutt, 2014 Denne publikasjonen er vernet i henhold til Åndsverkloven av 1961

Electric vehicles - environmental, economic and practical aspects
are also a handful of PHEV-only households. The mixed households have either one EV (or PHEV) and at least one ICE vehicle or are multicar households with more than two vehicles. The single car gas/diesel household type is only found among NAF members. The mixed, more than two car household type, contains one EV or PHEV in the EV owner sample, but only ICE vehicles in the NAF sample. The split for EV owners is shown also for the various municipalities in the Oslo-Kongsberg region. It is worth noting that the highest share of EV-households is found in the city of Oslo. Asker and Bærum have the highest share of multicar households.
Figure 3.4 Share of respondents belonging to households with different profiles of vehicle ownership among EV owners in Norway (n = 1 698) and NAF members in Oslo-Kongsberg 2014 (n = 2 239) and NAF EV owners (n = 61). Percent
3.5 The types of EVs owned
Figure 3.5 presents the respondents’ EV brands and models, and the shares are compared to the total fleet in figure 3.6. The models represented are representative of the Norwegian EV-fleet, with the exception that Tesla is over-represented, and Peugeot, Citroen and others are under-represented.
The shares of brands of EVs in different types of areas are shown in figure 3.7. Tesla owners have a higher tendency to be located in cities than owners of other vehicle types (Peugeot has a low number of respondents). This could be due to higher incomes in big cities, as one would expect this type of EV to be equally suitable in rural areas.
19%
20%
22%
30%
12%
12%
36%
26%
21%
18%
3%
7%
5%
6%
9%
5%
6%
4%
7%
58%
60%
50%
60%
59%
59%
46%
52%
55%
52%
19%
10%
28%
5%
23%
19%
13%
16%
18%
23%
65% 33%
0 % 10 % 20 % 30 % 40 % 50 % 60 % 70 % 80 % 90 %100 %
O T H E R I N O S L O - K O N G S B E R G R E G I O N
D R A M M E N
L I E R
R Ø Y K E N
A S K E R
B Æ R U M
O S L O
E V O W N E R S O S L O - K O N G S B E R G
E V O W N E R S N A T I O N
N A F E V O W N E R S
N A F
EV household 1 EV EV household >1 EV
EV household 1 EV, 1 or 2 PHEV Mixed 1 EV, 1 gas/diesel
PHEV household 1 PHEV Mixed 1 PHEV, 1 gas/diesel
Mixed >2 car EV/PHEV/gas/diesel 1 gas/diesel
>1 gas/diesel
Copyright © Transportøkonomisk institutt, 2014 19 Denne publikasjonen er vernet i henhold til Åndsverkloven av 1961

Electric vehicles - environmental, economic and practical aspects
Figure 3.5 Respondents most used vehicle by EV brands and models. EV owners in Norway 2014. (n = 1 720). Number
Figure 3.6 EV brands and models among the COMPETT survey respondents (left, n = 1 721), and in the total Norwegian fleet (right). Percent
Figure 3.7 Brand of vehicle in different areas. Among EV owners in Norway 2014 (n = 1 720). Percent
807
206
64
52
306
285
0 200 400 600 800 1000
Nissan Leaf
Mitsubishi I-miev
Peugeot Ion
Citroën c-zero
Tesla Model S
Other
35%
38%
50%
35%
43%
46%
39%
21%
17%
16%
21%
27%
16%
21%
32%
33%
25%
40%
25%
29%
30%
12%
12%
9%
4%
5%
8%
10%
0 % 10 % 20 % 30 % 40 % 50 % 60 % 70 % 80 % 90 % 100 %
N I S S A N L E A F
M I T S U B I S H I I - M I E V
P E U G E O T I O N
C I T R O Ë N C - Z E R O
T E S L A M O D E L S
O T H E R
T O T A L
Big city (Oslo, Bergen Stavanger, Trondheim) City
Densely populated area / Community Other
20 Copyright © Transportøkonomisk institutt, 2014 Denne publikasjonen er vernet i henhold til Åndsverkloven av 1961

Electric vehicles - environmental, economic and practical aspects
The most popular EV brands and models are shown in figure 3.8. The Tesla Model S is an expensive vehicle. Most of the Model S vehicles in Norway have the biggest battery pack, 85 kWh, and early deliveries of the vehicle which could potentially be overrepresented among the owners, was of the top version, Signature series. The EV-only households have a higher share of Tesla Model S and less of all other EVs than mixed EV and ICE-households. The Nissan Leaf is equally popular in both household types.
Figure 3.8 Share of brands in pure EV-only and mixed EV and ICE households among EV owners in Norway 2014 (n = 427 pure EV, n = 1292 mixed EV). Percent
3.6 Length of ownership and experience
Most EVs in the sample have been in their owners’ possession less than a year. More than 82% have been in their possession less than two years, and the majority (71%) were bought new. In the NAF sample only 43% of the vehicles have been in the owners possession for up to two years and less than half of these (18%) were bought new. As a conclusion it is clear that the EV owners have a much more modern fleet of vehicles, which is natural since EVs have taken off in the market the last 2-3 years. It could also be an effect of the way the EV owner respondents were recruited through NEVA’s membership register, due to the complimentary one-year membership.
Figure 3.9 shows the length of ownership for vehicles bought new and second hand, while the respondents’ total ownership length is shown in figure 3.10. From these data, however, it cannot be concluded that EV owners predominantly buy new vehicle out of preference; they may be buying new vehicles because second hand EVs are in short supply in the market. For those second hand EVs that have been and are available, there exists no independent assessment method of the technical conditions, and customers have no knowledge on the remaining lifetime of the battery. EV owners have thus largely been forced to buy new vehicles, but may adopt a buying pattern similar to that of NAF members when these issues are resolved.
47%
47%
13%
8%
4%
4%
15%
26%
18%
12%
0 % 10 % 20 % 30 % 40 % 50 % 60 % 70 % 80 % 90 % 100 %
M I X E D E V / I C E H O U S E H O L D
P U R E E V H O U S E H O L D
Nissan Leaf Mitsubishi I-miev Peugeot Ion Citroën c-zero Tesla Model S Other EV
Copyright © Transportøkonomisk institutt, 2014 21 Denne publikasjonen er vernet i henhold til Åndsverkloven av 1961

Electric vehicles - environmental, economic and practical aspects
Figure 3.9 Length of ownership period for vehicles bought new and second hand for EV owners in Norway and members of NAF in the Oslo-Kongsberg region (n = 1 720 EV owners, n = 2 237 NAF). Percent
Figure 3.10 The length (years) of EV ownership in Norway and the Oslo-Kongsberg region in 2014. (n = 1 721). Percent
3.7 Competent decision makers EV owners belong to larger households with higher income and a higher number of children than the NAF sample, as shown in chapter 2.4. They will therefore need efficient transport and have the resources necessary to acquire it. It is therefore no big surprise that there are many multicar owners in this group compared to NAF members and respondents of the NTS 2009.
Those groups that acquire and use the EVs perceive themselves as more competent relative to technology than average vehicle users. Thus they will have more knowledge about this new type of vehicles, an essential factor to be able to make decisions related to EV buying and using.
Furthermore EV owners are likely to be more environmentally minded than the other car owner group, members of NAF. In this study this is reflected in that:
• EV owners stress environmental characteristics when they buy a car more often than NAF members (33% vs 5%)
• EV owners are more frequently members of environmental NGOs than NAF members (15% vs 8%).
These two interests (new technology and environment) together definitely give the early EV owners a relevant competence basis for decisions about electromobility.
52%
10%
19%
8%
14%
25%
8%
13%
3%
11%
5%
32%
0 % 10 % 20 % 30 % 40 % 50 % 60 % 70 % 80 % 90 % 100 %
E V O W N E R S
N A F
New <1 year New 1-2 year New>2 year Used <1 year Used 1-2 year Used >2 year
73%
81%
13%
10%
11%
7%
0 % 10 % 20 % 30 % 40 % 50 % 60 % 70 % 80 % 90 % 100 %
E V O W N E R S O S L O K O N G S B E R G
E V O W N E R S N O R W A Y
This EV is my first 2-5 years 5-10 years > 10 years
22 Copyright © Transportøkonomisk institutt, 2014 Denne publikasjonen er vernet i henhold til Åndsverkloven av 1961

Electric vehicles - environmental, economic and practical aspects
4 The buying process
4.1 The EV buyers moment of decision
Knowledge of the buying process is of interest to find out more about how and why EVs proliferate on the Norwegian market. Do the customers decide that they want an EV beforehand? What is the role of friends and family, the dealer and salesperson in the decision making? Most EV owners buy new vehicles, whereas the majority of NAF members buy second-hand vehicles, cf table 4.1. It is not known if this is related to the lack of second hand EVs in the market, or if it is a real behavioural difference between the two groups. Table 4.1 Characteristics and evaluation of the buying process among different groups of car-owners in Norway and in the Oslo-Kongsberg region 2014. Percent
EV owners Average Norway
EV owners Oslo-Kongsberg
NAF members Oslo-Kongsberg
New car share 84% 82% 44%
Second hand car share 16% 18% 56% Share bought at dealer 91% 91% NA Intent to buy EV from the start
Yes 88% 88% NA No 10% 10% NA Don’t know 2% 2% NA
Considered buying an EV last time Yes NA NA 22% No NA NA 78%
Intent to buy gasoline/diesel vehicle Yes NA NA 78% No NA NA 11% Don’t know NA NA 11%
EV available at dealer Yes NA NA 22% No NA NA 56% Don’t know NA NA 22%
Satisfaction with dealers information 85% 87% NA
Sample size 1 721 541 2 241
Nine out of ten bought their EV at a dealer and an almost equally high share intended to buy an EV when the buying process started. To understand future potential it is thus crucial to learn more about communication channels before the decision was taken.
22% of NAF members considered buying an EV the last time they bought a car, and 22% was aware that the dealer had EVs for sale. 78% of them had on the other hand decided beforehand to buy a gasoline or diesel vehicle. On average, it is a longer time since NAF members where in a buying position, since they have possessed their last vehicle longer, cf chapter 3.6. The second-hand EV market has been very limited in
Copyright © Transportøkonomisk institutt, 2014 23 Denne publikasjonen er vernet i henhold til Åndsverkloven av 1961

Electric vehicles - environmental, economic and practical aspects
Norway, and more than half of the NAF members buy second hand vehicles. This fact could, in combination with the longer vehicle possession, partly explain the lower level of expressed interest in EVs among NAF members compared to the EV owners.
4.2 Channels of information before buying an EV
Media was by far the most important information source about EVs among the owners, followed by family and friends as shown in figure 4.1. There was little difference between the brands apart from Tesla where media was even more pronounced as the most important source, and Citroën where the dealer had a little bit higher influence.
Figure 4.1 Information sources about EVs before the EV was bought among EV owners in Norway 2014. Several sources could be mentioned (n = 1 721). Percent
In figure 4.2 the information sources are added together and the shares shown for each information source. With this method, it seems that media accounts for around 50% of the information, dealers less than 10%, family and friends 20%, organizations 5% and other sources 15%.
77%
79%
78%
78%
71%
83%
65%
13%
16%
10%
11%
23%
7%
13%
28%
33%
26%
31%
31%
18%
27%
6%
6%
6%
5%
4%
5%
6%
12%
11%
9%
16%
19%
10%
19%
0% 10% 20% 30% 40% 50% 60% 70% 80% 90%
Total
Nissan Leaf
Mitsubishi I-miev
Peugeot Ion
Citroën c-zero
Tesla Model S
Other EV
Other Organization Family or friends Car dealer Media
24 Copyright © Transportøkonomisk institutt, 2014 Denne publikasjonen er vernet i henhold til Åndsverkloven av 1961

Electric vehicles - environmental, economic and practical aspects
Figure 4.2 Where EV owners in Norway 2014 first got their information about EVs. More than one answers could be given (n = 1 721). Percent The organizations that EV owners mentioned as information sources are shown in figure 4.3. Not surprisingly, the EV association comes out on top and the technology discussion forum they run, Elbilforum, is also a source. Environmental NGOs as well as other organizations, such as political parties also play a part.
Figure 4.3 Organizations mentioned as sources of information for the EV owners in Norway (n = 65). Percent
The connection between media coverage and the EV owners’ buying behaviour can be illustrated by the parallel curves for media exposure and sales numbers in Norway from 2000 - 2013, see figure 4.4.
Figure 4.4 The press coverage (articles per year mentioning EVs) and growth in EV fleet. Numbers
77%
79%
78%
78%
71%
83%
65%
13%
16%
10%
11%
23%
7%
13%
28%
33%
26%
31%
31%
18%
27%
6%
6%
6%
5%
4%
5%
6%
12%
11%
9%
16%
19%
10%
19%
0 % 10 % 20 % 30 % 40 % 50 % 60 % 70 % 80 % 90 % 100 %
T O T A L
N I S S A N L E A F
M I T S U B I S H I I - M I E V
P E U G E O T I O N
C I T R O Ë N C - Z E R O
T E S L A M O D E L S
O T H E R E V
Media Car dealer Family or friends Organization Other
51% 22% 8% 20%
0 % 10 % 20 % 30 % 40 % 50 % 60 % 70 % 80 % 90 % 100 %
EV association Environment NGOs EV forum Others
0
2000
4000
6000
8000
10000
0
5000
10000
15000
20000
25000
Num
ber o
f art
icle
s in
pres
s
Num
ber o
f EVs
in fl
eet
EVs in fleet Press coverage Sources: Retriever search: 09.03.2014, elbil or el-bilBook: Elbil på norsk, Asphjell et al 2013, OFVAS
Copyright © Transportøkonomisk institutt, 2014 25 Denne publikasjonen er vernet i henhold til Åndsverkloven av 1961

Electric vehicles - environmental, economic and practical aspects
4.3 Factors influencing car choice
Both EV owners and NAF members were asked to what degree different factors influenced their car choice. The factors were chosen among those used in earlier studies, cf literature surveys, see appendix 2. No other study has used the same complete set of factors, but for individual factors, comparisons with older data could be possible. Since the EVs’ characteristics have changed profoundly, this is not done here. The focus is on identifying what factors are significant to groups representing different stages in an EV-diffusion process when choosing a car.
Contributing factors are shown in figure 4.5. It is clear that lower variable costs is the most important aspect, as lower operating costs and free toll-roads come out as the two most important factors. The environmental aspect is also important. Many simply state that it is the best vehicle for their needs. Among the local incentives, free ferries emerged as the least important at the national level, but on a regional level, it is likely to be more important. Free parking also scored lower than other incentives. The option “other” was followed by an open question about what other factors that were important. Most of the open answers were related to personal preferences and that they bought a vehicle that gives them pleasure, but also factors related to economy and environment were mentioned.
The importance of incentives is further discussed in chapter 7, 8.5 and 9.5.
Figure 4.5 Degree of importance of factors that influenced the choice of an EV as perceived by EV owners in Norway in 2014 (n = 1 721). Percent
9%
14%
21%
5%
41%
10%
44%
72%
31%
68%
8%
17%
26%
9%
12%
15%
3%
29%
9%
25%
22%
27%
16%
24%
13%
20%
26%
31%
23%
30%
28%
15%
19%
20%
16%
29%
18%
6%
23%
9%
33%
27%
21%
31%
32%
27%
34%
12%
27%
8%
21%
8%
16%
5%
35%
21%
8%
33%
23%
26%
47%
18%
39%
10%
19%
6%
5%
0 % 10 % 20 % 30 % 40 % 50 % 60 % 70 % 80 % 90 %100 %
B E S T V E H I C L E F O R M Y N E E D
I A M I N T E R E S T E D I N N E W T E C H N O L O G Y
T H E E V S S A F E T Y
E V S A R E E N V I R O N M E N T F R I E N D L Y
C O M P E T I T I V E P R I C E
L O W E R A N N U A L C I R C U L A T I O N T A X
L O W E R O P E R A T I N G C O S T S
B U S L A N E A C C E S S
F R E E T O L L R O A D S
F R E E F E R R I E S
F R E E P U B L I C P A R K I N G
A N E V D E A L E R W A S N E A R B Y
M Y P R E F E R E D B R A N D H A D A N E V
E V S A R E T R E N D Y
O T H E R
No significance Minor significance Some signification
Large significance Very large significance
26 Copyright © Transportøkonomisk institutt, 2014 Denne publikasjonen er vernet i henhold til Åndsverkloven av 1961

Electric vehicles - environmental, economic and practical aspects
NAF members were also asked what influenced their choice of vehicle. The alternatives were fewer than for the EV owners as shown in figure 4.6. Best vehicle for my need, safety, competitive price and low operating costs came out on top.
Figure 4.6 Degree of importance of factors influencing the choice of vehicles as perceived by NAF members in the Oslo-Kongsberg region in 2014 (n = 2 241). Percent The questions asked to both groups are compared in figure 4.7. It is apparent that EV owners put larger emphasis on lower operating costs, environment and technology whereas the NAF members are very safety oriented. Both groups rate purchase price about equally important and agree to the same extent to the statement, “Best vehicle for my need”. Without this element in place there might not have been a purchase, cf the diffusion model in section 1.4. One crucial factor for diffusion of new technology is that it must fill a felt need among potential users.
4.4 Evaluation of the information provided by dealers To further study how the car dealers are doing the job of selling the EVs, the EV owners were asked how the dealer information about the vehicles characteristics fits with reality. In figure 4.8, the answers are split by brand of vehicles to see if some are doing better than others. It seems that the brand with the best fit between dealer information and actual on-the-road performance is Tesla, followed by “other EVs”. The somewhat larger difference between expectations and reality seen for Nissan could be related to the much broader customer base for this vehicle, leading to a possible higher share of customers unfamiliar with EV technologies.
16%
9%
4%
5%
29%
28%
5%
29%
5%
24%
11%
15%
29%
20%
20%
33%
28%
42%
37%
42%
23%
25%
48%
17%
43%
20%
37%
31%
15%
17%
24%
5%
20%
5%
11%
8%
4%
10%
0 % 10 % 20 % 30 % 40 % 50 % 60 % 70 % 80 % 90 %100 %
B E S T V E H I C L E F O R M Y N E E D
I A M I N T E R E S T E D I N N E W T E C H N O L O G Y
T H E V E H I C L E S S A F E T Y
T H E V E H I C L E S E N V I R O N M E N T A L C H A R A C T E R I S T I C S
C O M P E T I T I V E P R I C E
T H E V E H I C L E S O P E R A T I N G C O S T S
A D E A L E R W I T H T H I S B R A N D W A S N E A R B Y
O T H E R
No significance Minor significance Some signification
Large significance Very large significance
Copyright © Transportøkonomisk institutt, 2014 27 Denne publikasjonen er vernet i henhold til Åndsverkloven av 1961

Electric vehicles - environmental, economic and practical aspects
Figure 4.7 Degree of importance factors when buying vehicles as perceived by EV owners (left figure) in Norway (n = 1 721) vs NAF members (right figure) in Oslo-Kongsberg region (n = 2 241) 2014. Percent
Figure 4.8 Satisfaction of dealer info among EV owners in Norway by brand in 2014 (n = 1 719). Percent
The follow up questions were in what way it works worse than the dealer said, figure 4.9, and in what ways better, figure 4.10. It appears that the dealer info on range has not been the best to those that are not satisfied. The other items are minor and seem to be related to specific vehicles (charging problems are mostly related to Tesla Model S, heater to the small Mitsubishi, Peugeots and Citroens, quality to the older and simpler pre 2010 vehicles and vehicles registered as 4-wheel MCs).
78%83%86%
73%84%87%
81%
20%16%13%
19%6%
9%15%
2%
2%8%
10%5%4%
0 % 10 % 20 % 30 % 40 % 50 % 60 % 70 % 80 % 90 % 100 %
N I S S A N L E A F
M I T S U B I S H I I - M I E V
P E U G E O T I O N
C I T R O Ë N C - Z E R O
T E S L A M O D E L S
O T H E R
T O T A L
Works as depicted by dealer Functions worse than depicted by dealer
Functions better than depicted by dealer
28 Copyright © Transportøkonomisk institutt, 2014 Denne publikasjonen er vernet i henhold til Åndsverkloven av 1961

Electric vehicles - environmental, economic and practical aspects
Figure 4.9 Ways in which the vehicle is doing worse than expected. Answers given by members of the EV owners in Norway (n = 202). Percent
On the positive side most are enthusiastic about the driving experience and comfort and some just state “it’s better”. Some also state that the range and battery is better, cf figure 4.10. The other categories have few respondents.
Figure 4.10 Ways in which the vehicle performs better than expected? Answers given by members of the EV owners in Norway (n = 57). Percent
4.5 Changes in number of vehicles in the household
There is much debate about whether EVs replace an old combustion engine vehicle, or whether and to what extent they become additional vehicles driving additional kilometres. This was studied through several questions:
1. Has the number of vehicles in the household changed? 2. What type of vehicle was replaced? 3. Has the combined insured kilometres of the households insurances changed? 4. Has the EV led to changes in the travel pattern? 5. How did they travel to work/school prior to buying the EV?
For the majority (2/3) of EV owners, the acquisition of the EV did not lead to a change in number of household vehicles, see figure 4.11, as the EV replaced another vehicle. For the majority of the rest, the vehicle became an additional vehicle. For 3% of the respondents, it was their first vehicle. 85% of Tesla Model S owners replaced one or more vehicles. The category ”Other EV” has the largest share of EVs as additional vehicles. The reason for this could be that this category contains some of the oldest EVs with simpler technology. The Mitsubishi I-Miev and its Peugeot and Citroën siblings, to a greater extent become additional vehicles than the larger Nissan
81%8%12%
6%9%7%
R A N G E
H E A T I N G
Q U A L I T Y
P E R F O R M A N C E / C O N S U M P T I O N
C H A R G I N G
D E A L E R / S E R V I C E
4%26%
47%7%
5%18%
5%5%
0% 10% 20% 30% 40% 50%
D E A L E R T O O C A U T I O U SJ U S T B E T T E R
D R I V I N G / A C C E L E R A T I O N / C O M F O R TN O P R O B L E M S
B A T T E R Y B E T T E R T H A N E X P E C T E DR A N G E B E T T E R
B E T T E R H E A T E RC H E A P E R
C H A R G I N G
Copyright © Transportøkonomisk institutt, 2014 29 Denne publikasjonen er vernet i henhold til Åndsverkloven av 1961

Electric vehicles - environmental, economic and practical aspects
Leaf do. Citroën has the largest share of owners stating that this is their first vehicle but the number of respondents was only 52, so this could be incidental.
The respondents also reported what type of vehicle was replaced. The results are shown in figure 4.12 for Norway, for the Oslo-Kongsberg region and the rest of the country. 94% replaced vehicles were ICE vehicles. As Oslo-Kongsberg has been the EV pioneering region in Norway, it was expected that a larger share of EV owners in that region had replaced an EV. This turned out to be the case, but even here, only 6% replaced an older EV, reflecting the rapid growth of the EV market. Owning a hybrid does not seem to be a factor that influences the EV buying process in Norway. But it could of course be that in multicar households one of the other vehicles is a hybrid, as this was not asked.
Figure 4.11 Change in number of vehicles in the household after buying the EV by brand, among EV owners in Norway 2014 (n = 1 721). Percent
Figure 4.12 Type of vehicle that was replaced when the EV was bought. EV owners in Norway 2014 (n = 1 153). Percent
4.6 Needs, economy and environment
The factors of importance and the sources of information in the buying process, illustrate the importance of some of the factors Rogers (1962, 1995) included in his diffusion model.
Approximately two thirds of the respondents in both groups report that the fact that the vehicle was “the best car for their needs”, was a factor of large or very large significance. Economy is also a factor related to “needs”. EV owners more frequently, than the average car owner, list competitive price and low operating costs as important factors than NAF members do. The incentives seem to be an
71%
62%
61%
65%
81%
45%
67%
2%
2%
2%
5%
2%
-25%
-35%
-36%
-25%
-12%
-47%
-28%
-8%
-6%
-3%
-100 % -50 % 0 % 50 % 100 %
N I S S A N L E A F
M I T S U B I S H I I - M I E V
P E U G E O T I O N
C I T R O Ë N C - Z E R O
T E S L A M O D E L S
O T H E R E V
T O T A L
Yes, the EV replaced another car Yes the EV replaced two or more vehicles
No, the EV came in addition to other vehicles. No, did not have a vehicle before
95%
92%
94%
2%
2%
2%
3%
6%
4%
86 % 88 % 90 % 92 % 94 % 96 % 98 % 100 %
E V O W N E R S R E S T O F C O U N T R Y
E V O W N E R S O S L O K O N G S B E R G
E V O W N E R S N O R W A Y
Gasoline/diesel vehicle Hybrid vehicle EV
30 Copyright © Transportøkonomisk institutt, 2014 Denne publikasjonen er vernet i henhold til Åndsverkloven av 1961

Electric vehicles - environmental, economic and practical aspects
appropriate measure given the consumer’s practical and financial needs. More data on this is found in chapter 9.
From a diffusion theory perspective, it is interesting that the new characteristics of EVs attract the buyers. EVs have a new technology and they are more environmentally friendly. The majority (67%) made a choice with possible beneficial environmental consequences when replacing another car, of which 94% were ICE cars. On the other hand, the cars that were bought in addition to existing cars represent a possible environmental challenge, depending on what the respondents would have done if they had not bought an EV. The questionnaire did not include hypothetical questions, and the conclusion is not given. However, the following chapter 5 on travel behaviour and driving distances gives some relevant information.
Copyright © Transportøkonomisk institutt, 2014 31 Denne publikasjonen er vernet i henhold til Åndsverkloven av 1961

Electric vehicles - environmental, economic and practical aspects
5 Travel behaviour and driving distances
5.1 New data on driving patterns and range
Very little European data exists on travel behaviour and annual driving distance of privately owned EVs. Most EVs in Europa are owned and operated by companies, municipalities and other entities, while the situation is the opposite in Norway, where most EVs are privately owned. It was thus of particular importance to capture these types of data in the survey. It was decided to approach these topics from different angles. For example, the EV users were asked about annual driving distance in their car insurance and whether the combined driving distance of all household vehicles had been changed when buying the EV. Further, the vehicle’s odometer count and first time registration date was requested.
The NAF members were asked about the driving distance in the insurance of their vehicles.
5.2 Insured driving distance
The annual insurance distance was calculated based on intervals selected for the question: What is the annual driving length the vehicles is insured for? The categories were:
• <8 000 km interpreted as 8 000 km • 8 000 - 12 000 km interpreted as 10 000 km • 12 000 - 16 000 km interpreted as 14 000 km • 16 000 - 20 000 km interpreted as 18 000 km • >20 000 km interpreted as 22 000 km
Average driving distances are shown in table 5.1. The driving distance is lower for the second, third and fourth car among NAF owners than for the first one, cf table 5.2. When comparing the first vehicle of NAF members with the EV owners in Oslo-Kongsberg, the difference in driving distance becomes quite small.
32 Copyright © Transportøkonomisk institutt, 2014 Denne publikasjonen er vernet i henhold til Åndsverkloven av 1961

Electric vehicles - environmental, economic and practical aspects
Table 5.1 Average annual driving distance in 2014 by insurance for EV owners in Norway and Oslo-Kongsberg region, NAF members from Oslo-Kongsberg region and by information from respondents to the NTS 2009. Km
EV owners Norway
EV owners Oslo-
Kongsberg
NAF Oslo-
Kongsberg
NTS 2009 Oslo-
Kongsberg
NTS 2009 Norway
Average annual distance insurance 14 500 km 13 800 km 12 900 km 13 654 km* 13 843 km*
*Not from insurance, Oslo-Kongsberg includes all of Akershus and Oslo. Source: OFVAS (2012), Vågane (2014).
Table 5.2 Insured annual average driving distance by number of vehicles, NAF members in Oslo-Kongsberg region 2014. N = sample size
n Km
Average all 12 884
Vehicle 1 2 188 13 388
Vehicle 2 757 11 799
Vehicle 3 131 11 221
Vehicle 4 35 11 086
The variation between the EV brands and models is shown in figure 5.1. Tesla has the longest insured driving distance as would be expected, followed by Nissan Leaf. The average is 14 500 km for EVs in Norway.
Figure 5.1 Average annual distance insurance among NAF members in Oslo-Kongsberg region and EV owners in Norway by vehicle model (blue). Number of respondents to the right
5.3 Odometer readings
The EV owners were also asked about the odometer reading and the date of first time registration. These data contained a lot of noise and some of the data had to be
11741
12588
11429
13648
17196
14903
14462
12884
270
51
63
199
306
786
1675
2188
0 2000 4000 6000 8000 10000 12000 14000 16000 18000 20000
Other EVs
Citroën c-zero
Peugeot Ion
Mitsubishi I-miev
Tesla Model S
Nissan Leaf
EV Norway
NAF/population
Km insured
Copyright © Transportøkonomisk institutt, 2014 33 Denne publikasjonen er vernet i henhold til Åndsverkloven av 1961

Electric vehicles - environmental, economic and practical aspects
discarded due to the respondents using a wrong format for the first time registration date. Also odometer readings that were obviously incorrect were discarded. In the end, a total of 990 respondents’ data could be used. This method underestimates the newest vehicles’ range.
There is also a change of technology in the vehicle sample that occurred at around month 34, the month where the established car producers started selling EVs with Li-Ion batteries in Norway. Prior to this date almost all EVs had Ni-Cd or lead-acid batteries. Figure 5.2 shows data for the last 34 months, corresponding to the new generation of vehicles coming from the established automakers using Li-Ion batteries.
Figure 5.2 Odometer reading for EVs newer than 34 months old, ie the time period were EVs with Li-Ion batteries have been available in the market (n = 901). Km
The correlation between odometer reading and the vehicle age in months was best for a power function: 1454,6*a0,9036 where a is age in months. A one year old vehicle (from the time of the survey) would then have an odometer reading of 13 740 km. This method underestimates the driving length of the newest vehicles somewhat.
The newest vehicles (less than 12 months old) consist of a broader sample of vehicle types including the long range Tesla Model S and one would expect to see an increase in driving length. To investigate this effect, the average odometer reading was calculated for each half month. This gave the result for annual driving distance shown in figure 5.3. It is a trend that the newest vehicles have longer driving distances. This could be a Tesla effect. When using this approach the odometer reading after a year is much higher; 15 890 km.
ICE vehicles’ average driving length during the first year is 15 160 km, the second year 14 800 km and the third year about 13 400 km (Fridstrøm 2014). It can thus be concluded that the annual driving length for EVs with the latest technology is about the same as for new ICE vehicles. This is also supported by the fact that EV owners, NAF members and NTS respondents in the Oslo-Kongsberg region all report similar annual driving distances.
y = 1454,6x0,9036
R² = 0,7112
y = 1140,1xR² = 0,5891
0
10000
20000
30000
40000
50000
60000
0 5 10 15 20 25 30
Odo
met
er re
adin
g km
Vehicle age in months
Odometer reading
34 Copyright © Transportøkonomisk institutt, 2014 Denne publikasjonen er vernet i henhold til Åndsverkloven av 1961

Electric vehicles - environmental, economic and practical aspects
Figure 5.3 Average driving distance per year based on half month averages for all vehicles in sample. EV owners in Norway 2014 (n = 90). Km
5.4 Trips the last weekday
The EV owners and the NAF members were asked to report their travel the previous weekday. The questions where designed to enable comparisons with data from the national travel survey. The national travel survey is conducted by telephone interviews, whereas the EV owner and NAF surveys were net-based surveys. The questions are also asked in a different context. In the travel survey, the focus is on the travel behaviour of the person being interviewed, whereas in the COMPETT surveys, the travel questions are part of a wide array of questions related to other topics, and it is directed at the vehicle owner. These differences and the differences in sample selections imply that the results are not directly comparable, but should serve as an indication of EV owners’ travel behaviour compared to the rest of the population. Results for EV owners are shown in figure 5.4.
Figure 5.4 Trips (red line) and driving distance (blue line) per day per EV owner in Norway 2014 (n = 1 721). Number and km
y = 18802e-0,014x
R² = 0,3324
0
5000
10000
15000
20000
25000
0 5 10 15 20 25 30 35 40Annu
al d
rivin
g di
stan
ce
km
Vehicle age in months
0
10
20
30
40
50
60
70
80
0,00
0,50
1,00
1,50
2,00
2,50
3,00
3,50
0 6 12 18 24 30 37 43 49 56 65 72 82 90 105
122
135
160
240
360
535
1500
Accu
mul
ated
ave
rage
dist
ance
per
per
son
Accu
mul
ated
num
ber o
f trip
s per
per
son
Trip distance
Copyright © Transportøkonomisk institutt, 2014 35 Denne publikasjonen er vernet i henhold til Åndsverkloven av 1961

Electric vehicles - environmental, economic and practical aspects
5.5 Frequency in using EVs
There are no good travel behaviour data on EV use in earlier studies. The COMPETT studies and the forthcoming NTS for 2013-2014 (which contains questions related to EVs) will change this picture. Comparing with older Norwegian studies, we see that daily use increases. This is a natural part of the diffusion process. With better technology, ie better EVs and users who become more experienced and learn to adapt to the new technology and to handle challenges, cf chapter 6.4, it is expected that EV use increases.
About 80% of the respondents drive the EVs daily, a further 16% 3-5 days a week, see figure 5.5. In 2006, 67% of the EVs were used daily (ECON 2006). The EVs are thus a mobility tool for everyday life. About 2/3 of the vehicles have multiple users, see figure 5.6. 60% of the respondents use the vehicles more than other users, 12% less than another users, and 28% equally much as other users, see figure 5.7.
Figure 5.5. Frequency of EV-use among EV owners in Norway (n = 1 721) and Oslo-Kongsberg region (n = 542) 2014. Percent
Figure 5.6 EV owners in Norway and Oslo-Kongsberg region 2014 by sharing the car with others or not, ie being the only user (n = 1 721). Percent
Figure 5.7 EV owners in Norway and Oslo-Kongsberg region 2014 who share their car with others, by degree of sharing (n = 1 183). Percent
80%
81%
17%
16%
2%
2%
0 % 10 % 20 % 30 % 40 % 50 % 60 % 70 % 80 % 90 % 100 %
E V O W N E R S O S L O - K O N G S B E R G
E V O W N E R S N O R W A Y
Daily (6-7 days per wek) 3-5 days per week 1-2 days per week
less than 1 day per week Never
32%
31%
68%
69%
0 % 10 % 20 % 30 % 40 % 50 % 60 % 70 % 80 % 90 % 100 %
E V O W N E R S O S L O - K O N G S B E R G
E V O W N E R S N O R W A Y
Yes No
8%12%
63%60%
29%28%
0 % 10 % 20 % 30 % 40 % 50 % 60 % 70 % 80 % 90 % 100 %
E V O W N E R S O S L O - K O N G S B E R G
E V O W N E R S N O R W A Y
The EV is used more by others than by me The EV is mostly used by me
The EV is used equally much by me and others Don't know
36 Copyright © Transportøkonomisk institutt, 2014 Denne publikasjonen er vernet i henhold til Åndsverkloven av 1961

Electric vehicles - environmental, economic and practical aspects
5.6 Trip types frequencies
The most frequent travel purpose for EV owners is trips to and from work, see figure 5.8. Other frequent destinations are shops, leisure activities, escorting children and on visits. NAF members on the other hand use their cars more on vacation. Most of these differences are expected and can easily be explained by the differences in socio-demographics, ie age (NAF members having a high share 55+ years of age), employment rate, household size and number of children below 18 years. Difference in vacation travel could be related to the vehicle type, however.
The EV owners have longer average driving distances to work than NAF members and respondents of the NTS. This length has increased over the years as the most experienced EV-drivers in the survey have the shortest distances to work. At the time they started using EVs, the driving range of the EVs available in the market was not sufficient for longer commutes. It may also be that as the market moves into the early majority the new buyers are the ones with longer driving distances, since this gives the best overall vehicle economy, given the low variable costs of EV motoring.
Copyright © Transportøkonomisk institutt, 2014 37 Denne publikasjonen er vernet i henhold til Åndsverkloven av 1961

Electric vehicles - environmental, economic and practical aspects
Figure 5.8. Trip type frequencies, EV owners (n = 542) to the left and NAF members (n = 2 241) to the right, both Oslo-Kongsberg region 2014. Percent
38%
15%
16%
10%
21%
11%
46%
31%
23%
12%
37%
14%
35%
15%
49%
36%
16%
5%
13%
13%
29%
33%
5%
35%
7%
6%
34%
59%
24%
0 % 20 % 40 % 60 % 80 % 100 %
T O F R O M W O R K S C H O O L
L E I S U R E
E S C O R T C H I L D R E N
V I S I T S
V A C A T I O N
S H O P P I N G
T R I P S A T W O R K
Daily (6-7 days per wek) 3-5 days per week 1-2 days per week
less than 1 day per week Never
27%
21%
9%
5%
7%
23%
11%
8%
39%
10%
41%
14%
45%
9%
14%
26%
16%
50%
62%
24%
27%
33%
9%
62%
12%
3%
47%
0 % 20 % 40 % 60 % 80 % 100 %
T O F R O M W O R K S C H O O L
L E I S U R E
E S C O R T C H I L D R E N
V I S I T S
V A C A T I O N
S H O P P I N G
T R I P S A T W O R K
Daily (6-7 days per wek) 3-5 days per week 1-2 days per week
less than 1 day per week Never
38 Copyright © Transportøkonomisk institutt, 2014 Denne publikasjonen er vernet i henhold til Åndsverkloven av 1961

Electric vehicles - environmental, economic and practical aspects
5.7 Distance to work/school
EV owners in Norway have an average distance to work of 26 km and 22 km in the Oslo-Kongsberg region, as compared to about 15 km among NAF members and respondents of the NTS (Vågane 2014). Figure 5.9 shows the accumulated share of the samples as a function of distance to work. Note that a high share of NAF members have 0 km to work indicating that they work from home or a potential misunderstanding of the questionnaire. Figure 5.10 shows that the most experienced EV owners have shorter distances to work.
Figure 5.9 Accumulated share of respondents by distance to work vs make and type of EV among EV owners in Norway and NAF members in Oslo-Kongsberg region 2014. Km and percent
Figure 5.10 Accumulated share of respondents, distance to work by years as EV driver, among EV owners in Norway 2014 (n = 1 721). Km, years and percent
0%
20%
40%
60%
80%
100%
0 4 8 12 16 20 24 28 32 36 40 44 48 52 56 60 64 68 72 76 80 84 88 92 96 100Ac
cum
ulat
ed sh
are
Distance km
NAF/population EV owners Oslo-Akershus EV ownersNissan Leaf Mitsubishi I-miev Peugeot Ion
0%
20%
40%
60%
80%
100%
0 20 40 60 80 100
ACCU
MU
LATE
D SH
ARE
%
DISTANCE IN KM
First 2-5 years 5-10 years >10 years Total
Copyright © Transportøkonomisk institutt, 2014 39 Denne publikasjonen er vernet i henhold til Åndsverkloven av 1961

Electric vehicles - environmental, economic and practical aspects
5.8 Changes in driving length Two thirds of the respondents reported that the households’ total insurance driving length was unchanged. The same percentage stated that the vehicle replaced another vehicle, see figure 5.11. Only about 12% say that the total insured driving length has increased. Some of these could be the households that have bought the EV as an additional vehicle, but they could also be in the “have owned the vehicle less than a year” category.
Figure 5.11 Change in the total driving length (insurances) after buying EV. EV owners in Norway 2014 (total n = 1 721), Oslo-Kongsberg region (n = 527) and rest of the country(n = 1 194). Percent In figure 5.12 the results for those who indicated an increase or decrease are shown. Those who reported a decreased driving length could be some of the EV-only households, given that the EV will not be used on longer vacation trips.
Figure 5.12 Changes in insured driving length after buying an EV. EV owners in Norway 2014 (total n = 1 721), in Oslo-Kongsberg region (n = 527) and rest of the country (n = 1 194). Percent The figures cannot be interpreted as the net increase for the households being 12% (18%-6%) in the driving length of the average vehicle, as it is not known what has happened with the driving length of the “owned the vehicle less than a year” category. The point that some drive their vehicles less after buying an EV is however valid.
5.9 Changes in travel patterns
The EV owners were asked how their travel pattern has changed after buying the EV. At a national level, 60% report that there is no change. The figure is lower (52%) in the Oslo-Kongsberg region, see figure 5.13. It is expected that EV owners cycle, walk and use public transport less and drive more, due to the fact that the marginal cost per km is lower than for other vehicles and the local user incentives makes EVs even more attractive to use. Figure 5.14 and figure 5.15 proves that this is the case
63%59%62%
17%20%18%
6%7%6%
11%12%12%
2%2%2%
0 % 10 % 20 % 30 % 40 % 50 % 60 % 70 % 80 % 90 % 100 %
E V O W N E R S R E S T O F C O U N T R Y
E V O W N E R S O S L O - K O N G S B E R G
E V O W N E R S N O R W A Y
No the driving length is unchanged Yes the driving length has increased
Yes the driving length is reduced Have owned the vehicle less than a year
Don't know
17%
20%
18%
-6%
-7%
-6%
E V O W N E R S R E S T O F C O U N T R Y
E V O W N E R S O S L O - K O N G S B E R G
E V O W N E R S N O R W A Y
Yes the driving length has increased Yes the driving length is reduced
40 Copyright © Transportøkonomisk institutt, 2014 Denne publikasjonen er vernet i henhold til Åndsverkloven av 1961

Electric vehicles - environmental, economic and practical aspects
but also shows that some EV owners have had a positive modal shift, walking and cycling more, using public transport more and driving less.
Figure 5.13 Changes in the travel pattern among EV owners in Norway 2014 (n = 1 722). Percent
Figure 5.14 Changes to walking, cycling, public transport use and driving after buying the EV. EV owners in Norway 2014 (n = 1 721). Percent
Figure 5.15 Changes to walking, cycling, public transport use and driving after buying the EV. EV owners in Oslo-Kongsberg region 2014 (n = 527). Percent
The journey to work prior to buying the EV was most frequently done by a normal ICE vehicle, see figure 5.16. Tesla owners and Nissan Leaf owners show the lowest shares of other transport modes prior to buying the EV. In figure 5.17 the results for other modes is studied further. It can be seen that for 2% of the total respondents the work trip was not done prior to buying the EV. It is thus likely that the EV in these cases was bought because of a changed workplace location.
28%
23%
7%
7%
24%
16%
9%
7%
6%
5%
53%
60%
4%
3%
0 % 10 % 20 % 30 % 40 % 50 % 60 % 70 % 80 % 90 % 100 %
E V O W N E R S O S L O K O N G S B E R G
E V O W N E R S N O R W A Y
I drive more than before I drive less than before
I use public transport less than before I use public transport more than before
I walk or cycle less I walk or cycle more
I have done other changes No change
Do not know/no answer
23%
4%
5%
-7%
-16%
-7%
I D R I V E
I U S E P U B L I C T R A N S P O R T
I W A L K O R C Y C L E
More Less
29%
4%
6%
-6%
-24%
-10%
I D R I V E
I U S E P U B L I C T R A N S P O R T
I W A L K O R C Y C L E
More Less
Copyright © Transportøkonomisk institutt, 2014 41 Denne publikasjonen er vernet i henhold til Åndsverkloven av 1961

Electric vehicles - environmental, economic and practical aspects
Figure 5.16 Travel mode to work prior to buying the EV, by bran. EV owners in Norway 2014 (n= 1 721). Percent
Figure 5.17 Travel mode to work, apart from driving, prior to buying the EV by brand. EV owners in Norway 2014 (n = 1 721). Percent
A modal shift away from public transport for the work trip is seen for 11% of the respondents. 2% walk less and 2% cycle less. In general, the Tesla owners show the lowest generated extra vehicles, extra kilometres travelled, and the lowest modal shift, The smallest EVs are on the other side of the spectre, more inclined to be additional vehicles generating additional transport.
The owners were merely asked what they were doing, not why they were doing it, so it is not possible to know with certainty whether the tendencies towards added number of vehicles and driving is due to changed travel needs, but buying an EV because it was the best choice. It is however likely that buying an EV results in a negative modal shift towards car travel and an increase in vehicle kilometres travelled, but the net effects are not large. The increase in insured distances for the households insurances is lower than the increase in the number of vehicles.
83%
75%
69%
71%
87%
68%
80%
1%
2%
2%
4%
10%
3%
3%
2%
9%
17%
17%
10%
6%
18%
11%
2%
2%
2%
3%
2%
2%
2%
4%
5%
3%
0 % 10 % 20 % 30 % 40 % 50 % 60 % 70 % 80 % 90 % 100 %
N I S S A N L E A F
M I T S U B I S H I I - M I E V
P E U G E O T I O N
C I T R O Ë N C - Z E R O
T E S L A M O D E L S
O T H E R E V
T O T A L
By normal car as driver By normal car as passenger
By other EV as driver By other EV as passenger
By public transport Cycling
Walking This trip was not done prior to buying the EV
9%17%17%
10%6%
18%11%
1%1%2%
2%2%
3%2%
2%
2%2%
4%5%
1%3%
2%
1%
2%0%
3%1%
0% 5% 10% 15% 20% 25% 30%
N I S S A N L E A F
M I T S U B I S H I I - M I E V
P E U G E O T I O N
C I T R O Ë N C - Z E R O
T E S L A M O D E L S
O T H E R E V
T O T A L
By public transport Cycling
Walking This trip was not done prior to buying the EV
Other
42 Copyright © Transportøkonomisk institutt, 2014 Denne publikasjonen er vernet i henhold til Åndsverkloven av 1961

Electric vehicles - environmental, economic and practical aspects
6 Charging behaviour
6.1 Charging framework - and charging stations
Norway started developing a network of charging stations early. In the early years of Electromobility, the initiatives were local in the municipalities. Since 2009, charging station deployment has been financially supported by Transnova (a national government agency tasked with assisting market launch of transport related technologies and concepts aiming at reducing greenhouse gas emissions). There are also possibilities for support in some of the counties, ie Akershus county can provide each charging point with 10 000 NOK. In Oslo, the municipality deploys charging stations that are accessible to users free of charge.
Fast charging was available at zero costs to users many places at the time the surveys were conducted. Payment is gradually introduced in the entire fast charge network, and free fast charging will probably not be available in the future. It is evident that a major part of the EV owners did not pay for fast charging, according to the answers to one of the questions in the survey. It is thus likely that their average usage of fast charge stations is higher than it would have been if it had not been free.
Norway has 4 756 charging stations in 2014, se Appendix III.
6.1.1 Winter temperatures The results in the survey may have been influenced by the abnormal winter conditions in Norway in the winter of 2013-2014. In the areas where most EV owners live, the winter was unusually mild and with limited snow cover. This may lead to an overestimation of the vehicles’ range in the users perception of EVs, and an underestimation of the challenges of winter driving. 53% of the EV respondents had owned the vehicle less than a year and were at the same time first time buyers, thus had experience only with the ongoing winter. The deviations from the normal seasonal air temperature from December 2013 to February 2014 and detailed weather charts for Norway’s three biggest cities, Oslo, Bergen and Trondheim are shown in Appendix IV.
6.1.2 Speed limits Speed limits in Norway are EV-friendly. The normal speed limit on main roads is 80 km/h, on four lane motorways 100 km/h and on two lane motorways 90 km/h. These low speed limits means that the range of EVs when driving on main roads will be longer than in countries with higher speed limits, a fact that might influence the owners’ attitudes to EVs.
Copyright © Transportøkonomisk institutt, 2014 43 Denne publikasjonen er vernet i henhold til Åndsverkloven av 1961

Electric vehicles - environmental, economic and practical aspects
6.2 Charging solution and utilization of range
The charging behaviour was surveyed with several questions. A first question was about how to get started, ie choosing the charging solution. For most owners this had not been a big issue, but Tesla owners struggled more than others, see figure 10.11. This could be related to the large battery pack causing issues with the domestic charge sockets’ available power, but also related to purchase of extra cables to access different types of existing charging networks.
A crucial question when studying charging behaviour is the range the respondent feels comfortable utilizing, figure 6.1. Surprisingly many feel confident using more than 80%, the average is about 85%. This might be due to the fact that Norway has many publicly accessible charging stations and potentially that range meters in most EVs predict remaining range reliably.
Figure 6.1 The share of the range that EV owners in Norway are comfortable with utilizing in 2014 (n = 1 719). Percent
6.3 Usage frequency of various charging locations
The usage frequency of different types of charging infrastructure is shown in figure 6.2. The use of home charging in garage and carport and outdoors must be seen together as you do either one or the other, not both at the same time.
44 Copyright © Transportøkonomisk institutt, 2014 Denne publikasjonen er vernet i henhold til Åndsverkloven av 1961

Electric vehicles - environmental, economic and practical aspects
Figure 6.2 Charging behaviour, frequency of use among EV owners in Norway 2014 (n = 1 721). Percent The split of charging at home is shown in a combined way in figure 6.3 (the sum of the last two lines in figure 6.2). It can be concluded that a majority of EV owners have a garage and almost everyone can charge at home. About half of the vehicles use a public charging station monthly (figure 6.2), 20% weekly, while shopping centre charging is used less frequently. About half of the respondents regularly use work place charging. This is high and implies that many employers are installing charging stations.
Figure 6.3 Home charging locations for EV owners in Norway 2014 (n = 1 721). Percent
39%
26%
15%
12%
8%
25%
7%
7%
8%
11%
14%
12%
5%
5%
6%
8%
31%
31%
22%
21%
4%
8%
9%
31%
32%
31%
32%
36%
44%
33%
15%
23%
40%
41%
0 % 10 %20 %30 %40 %50 %60 %70 %80 %90 %100 %
H O M E C H A R G I N G G A R A G E
H O M E C H A R G I N G C A R P O R T O R O U T D O O R S
W O R K
P U B L I C
S H O P P I N G C E N T R E S & S I M I L A R
F A S T C H A R G I N G S U M M E R
F A S T C H A R G I N G W I N T E R
Daily (6-7 days per wek) 3-5 days per week 1-2 days per week
1-2 days per month Infrequent Never
Copyright © Transportøkonomisk institutt, 2014 45 Denne publikasjonen er vernet i henhold til Åndsverkloven av 1961

Electric vehicles - environmental, economic and practical aspects
The use of fast charge stations differs little between seasons. It turned out that 87% of the EV owners reported the same pattern for summer and winter, see figure 6.4.
Figure 6.4 Difference of fast charging summer vs winter by frequency of charging among EV owners in Norway 2014 (n = 1 721). Percent
It is not known if this means that the charging pattern is identical or if they did not know and just reported the same values. It is a surprise that fast charging is not used more in winter than in summer. There is no obvious explanation for this. Range is much shorter in winter and thus fast charging should be used more, if the travel pattern is the same in winter as in summer. It could be related to fast charging being less practical in winter with up to twice as long charging times, as the batteries cannot accept high charge power when it is cold.
Figure 6.5 shows the seasonal variation in the usage of fast chargers measured by how often the fast chargers that have online status data is occupied in Norway. Also here it is evident that the seasonal variations are small, strengthening the likelihood that the usage frequency indeed is almost the same summer and winter.
Figure 6.5 Variation of use of fast chargers from June 2013 to January 2014. Green is average use time for free fast chargers and blue is for those that are available at a cost to the user. Percent of time the chargers are occupied by a vehicle charging. Source: gronnbil.no
68%
79%
76%
86%
96%
87%
0%
6%
4%
9%
4%
6%
32%
15%
19%
6%
7%
0 % 10 % 20 % 30 % 40 % 50 % 60 % 70 % 80 % 90 % 100 %
D A I L Y A N D 3 - 5 T I M E S / W E E K
1 - 2 T I M E S / W E E K
1 - 2 T I M E S / M O N T H
R A R E R
N E V E R
T O T A L
Same both seasons Higher winter Lower winter
46 Copyright © Transportøkonomisk institutt, 2014 Denne publikasjonen er vernet i henhold til Åndsverkloven av 1961

Electric vehicles - environmental, economic and practical aspects
6.4 Adaption in case of range challenges
The low rate of use of fast charge stations raises the question of what EV owners do when the EVs range is too short. The EV owners were asked how they adapt when the range of the EV is too short. Figure 6.6 shows the results separately for EV-only households and multicar households with a mix of EV(s) and at least one ICE vehicle (also includes PHEV households, there were only a few respondents). It seems that both types of respondents use a common strategy for coping with the range challenge; employing better planning, the EV-only households being the planning champions, reducing the energy consumption of the vehicle by using eco-driving techniques, and turning off climate control and heating systems. Then they revert to fast charging. These methods are probably used while on the go and when the planning ahead concludes that the trip is doable.
When these techniques are no longer sufficient, the multicar mixed EV/ICE household respondents mainly borrow another vehicle in the household, some revert to public transport and very few of the trips are cancelled. Some of the EV-only household respondents have the option of using another vehicle, as the household has more than one EV. The others have two main strategies, using public transport or borrow a vehicle from friends or family. A higher share of trips are cancelled in EV-only households than in the mixed EV/ICE vehicle households.
Vehicle rental and car sharing schemes are also used. Nissan has sold its Leaf model with “Norgespakken”, a package of benefits including vehicle rental 20 times over the first three years of vehicle ownership. It seems that few have used this offer. The EV owners were asked how much they used other vehicles, the ICE vehicles, in the household. The results are shown with the EV usage in figure 6.7.
Copyright © Transportøkonomisk institutt, 2014 47 Denne publikasjonen er vernet i henhold til Åndsverkloven av 1961

Electric vehicles - environmental, economic and practical aspects
Figure 6.6 Adaptation of travel behaviour when range is insufficient among all EV-only households (n = 527) vs households with both an EV and other cars (n = 1 292) in Norway 2014. Percent
Figure 6.7 Frequency of EV owners use of ICE-vehicles and EVs in multicar EV households (n = 1 721 EV, n = 1 262 ICE 1, n = 253 ICE 2). Percent
19%
3%
33%
13%
33%
3%
17%
54%
48%
38%
47%
4%
90%
1%
4%
2%
19%
0%
7%
37%
41%
40%
33%
4%
0% 20% 40% 60% 80% 100%
Use other vehicle in household
Vehicle rental deal with dealer
Loan vehicle from family/friends
Rents a vehicle
Use public transport
Use vehicle from car sharing
The trip is not done
Use fast charge stations
Ecodriving
Turns off heater/AC
Plan better
Other
Multicar EV/ICE households EV-only households
81%
6%
3%
16%
15%
4%
2%
30%
12%
45%
58%
0 % 10 % 20 % 30 % 40 % 50 % 60 % 70 % 80 % 90 % 100 %
E V
I C E 1
I C E 2
Daily 3-5 days per week 1-2 days per week Less than once per week
48 Copyright © Transportøkonomisk institutt, 2014 Denne publikasjonen er vernet i henhold til Åndsverkloven av 1961

Electric vehicles - environmental, economic and practical aspects
6.5 Use of fast chargers in different groups
It is seen in figure 6.8 that drivers with the largest range anxiety, ie the lowest reported comfortable range utilization, use fast charging less frequently than other drivers. This seems surprising. It could be speculated that they may be less familiar with the EV technology and thus reluctant to test out fast charging on the go, or they could be fearing that the stations are not available when they need them. Or their travel needs are met also when not utilizing the full range. It might also be due to regional differences, ie where they live. Those living in areas with few charging stations will use fast charging less and might also experience increased range anxiety.
Figure 6.8 Frequency of use of fast charge stations for drivers with different comfortable range utilization limit among EV owners in Norway 2014 (n = 1 721). Percent
In figure 6.9 it is demonstrated that pure EV households use fast charging more often than households that have a mix of EV and at least one vehicle with an engine running on gasoline or diesel.
Figure 6.9. Share of fast charging usage for pure EV households and mixed EV/ICE households among EV owners in Norway 2014 (n = 1 721). Percent
Figure 6.10 shows how often fast charging is used by owners of vehicles of different brands, and the estimated average number of fast charges per year. Nissan Leaf owners use fast charging much more often than owners of other brands. Nissan has a strategy of installing fast chargers at all dealers selling EVs. This gives the salesperson the opportunity to teach the customer how to use a fast charger and may have influenced this result. On the other hand, the other fast chargeable vehicles
2%
4%
5%
5%
6%
10%
16%
23%
24%
24%
22%
25%
29%
34%
35%
63%
54%
42%
36%
34%
0 % 20 % 40 % 60 % 80 % 100 %
U P T O 6 0 %
U P T O 7 0 %
U P T O 8 0 %
U P T O 9 0 %
O V E R 9 0 %
COM
FORT
ABLE
RAN
GE
UTI
LIZA
TIO
N
Daily 3-5 times/week 1-2 times/week 1- times/month Infrequent Never
2%
2%
4%
7%
5%
7%
20%
29%
19%
27%
31%
32%
31%
33%
43%
29%
44%
30%
0 % 10 % 20 % 30 % 40 % 50 % 60 % 70 % 80 % 90 % 100 %
M I X E V / I C E H O U S E H O L D
P U R E E V H O U S E H O L D
M I X E V / I C E H O U S E H O L D
P U R E E V H O U S E H O L D
SUM
ME
RW
INT
ER
Daily 3-5 days timer per week 1-2 times per week
1-2 times per month infrequent never
Copyright © Transportøkonomisk institutt, 2014 49 Denne publikasjonen er vernet i henhold til Åndsverkloven av 1961

Electric vehicles - environmental, economic and practical aspects
singled out in the sample, the Mitsubishi I-Miev, Peugeot Ion and Citroën C-zero, are much smaller vehicles and less prone to be used on longer distances. Tesla is a special case with its proprietary system of free super chargers only available to Tesla owners, and the vehicle has so long range that fast charging should not be needed in every day traffic.
Figure 6.10 Frequency in use of fast charge stations (percent, left section) and average number of fast charges (right section) per year by brand, among EV owners in Norway 2014 (n = 1 721). Percent and average number of times per year.
The annual number of fast charges per vehicle is 14 per year when excluding Teslas. This can be multiplied with the number of EVs on the road at the time of the survey, 21 000, to get the total number of fast charges expected over a year. For the total EV fleet in February 2014 this would give about 283 500 charges.
According to statistics (gronnbil.no) on the usage of fast chargers, on average about 14 000 fast charges were performed per month per fast charger in the period the survey was conducted, in total for the 47 fast chargers that where online, i.e. 168 000 fast charges. In reality about 80 fast chargers were operational at that time, the balance being offline, so the number can be adjusted to about 285 000 fast charges per year which compares well with the numbers from the survey.
6.6 Range challenges
Sometimes planning can go wrong. About one in ten have experienced that the vehicle ran out of energy while on the go, see figure 6.11. Other EVs than the brands listed have a higher share. This could be related to some of these vehicles being older with less reliable range meters.
8%
4%
3%
5%
26%
13%
17%
19%
37%
4%
22%
35%
28%
33%
40%
44%
8%
31%
29%
56%
50%
35%
14%
85%
40%
18
10
5
13
15
5
14
0 % 20 % 40 % 60 % 80 % 100 % 120 % 140 % 160 % 180 % 200 %
Nissan Leaf
Mitsubishi I-miev
Peugeot Ion
Citroën c-zero
Tesla Model S
Annet
Total
Daily 3-5 times/week 1-2 times/week 1-2 times/month
Rarer Never Average per car
Average number of fast charges per year
50 Copyright © Transportøkonomisk institutt, 2014 Denne publikasjonen er vernet i henhold til Åndsverkloven av 1961

Electric vehicles - environmental, economic and practical aspects
Figure 6.11 The share of Norwegian EV owners that have experienced running out of power in the battery while driving, by brand (n = 1 722). Percent
In the end these characteristics of the EV owners translate into a range they plan for when driving the vehicle. This is shown in figure 6.12 where the question was simply: Which range are you comfortable with planning to use, when planning trips in the winter and in the summer? The huge difference between summer and winter can clearly be read from the figure. The users in general are daring in the summer and more conservative in the winter. The results may have been influenced by the mild winter in the 2013/2014 season, c.f. appendix IV.
6.7 Access to free fast charging
Figure 6.13 shows how the owners pay for fast charging. The big difference is between Tesla owners and the other owners. Almost all Tesla owners get fast charging for free, indicating that they have a version of the Model S that can use the Tesla Superchargers free of charge, ie the 85 kWh battery pack, or the option for fast charging included in the 60 kWh version. Those who do not have it included can still use the superchargers but have to pay. Free fast charging is available to over 50% of the EV owners.
Users with access to free fast chargers probably use them more than they would have if they had to pay, as suggested by data showing that the use of fast chargers go down when payment is introduced, see figure 6.14. The usage rate of fast chargers is thus overstated in the survey and cannot be interpreted as the total demand for paid fast charging.
90%
92%
91%
92%
95%
68%
88%
8%
7%
9%
8%
5%
20%
9%
2%
1%
12%
3%
0 % 10 % 20 % 30 % 40 % 50 % 60 % 70 % 80 % 90 % 100 %
N I S S A N L E A F
M I T S U B I S H I I - M I E V
P E U G E O T I O N
C I T R O Ë N C - Z E R O
T E S L A M O D E L S
O T H E R E V S
T O T A L
Never Once Several times
Copyright © Transportøkonomisk institutt, 2014 51 Denne publikasjonen er vernet i henhold til Åndsverkloven av 1961

Electric vehicles - environmental, economic and practical aspects
Figure 6.12 Planned range, the range the respondents feels confident using when planning trips by EV brands in summer and winter periods. EV owners in Norway 2014 n Nissan Leaf = 807, n Mitsubishi/Peugeot/Citroen = 322, n Tesla = 306). Percent
1%6%
27%49%
16%0%0%
11%45%
36%8%
0%0%0%
0%50%100%150%200%
0% 50% 100% 150% 200%
<75 km75-100 km
101-125 km126-150 km151-250 km251-400 km
>400 km
Winter
Summer
Nissan Leaf summer Nissan Leaf winter
2%18%
61%18%
0%0%0%
40%54%
5%0%0%0%0%
0%50%100%150%200%
0% 50% 100% 150% 200%
<75 km
101-125 km
151-250 km
>400 km
Winter
Summer
Mitsubishis+Citroen+Peugeot summer Mitsubishis+Citroen+Peugeot winter
0%0%0%0%1%
37%63%
0%0%0%0%
7%90%
3%
0%50%100%150%200%
0% 50% 100% 150% 200%
<75 km75-100 km
101-125 km126-150 km151-250 km251-400 km
>400 km
Winter
Summer
Tesla Model S summer Tesla Model S winter
52 Copyright © Transportøkonomisk institutt, 2014 Denne publikasjonen er vernet i henhold til Åndsverkloven av 1961

Electric vehicles - environmental, economic and practical aspects
Figure 6.13 Payment for fast charging among EV owners in Norway 2014 who use fast charging at least every month. Percent
Figure 6.14 Use of three ABB fast chargers, June 2013 - January 2014. Payment introduced on Alnabru and Billingstad at the end of year 2013, Fyllingsdalen remained free of Charge. Source: gronnbil.no). Percent of time in use
13%
6%
8%
33%
43%
50%
46%
4%
40%
32%
46%
52%
35%
50%
93%
53%
54%
9%
2%
9%
3%
6%
0 % 20 % 40 % 60 % 80 % 100 %
N I S S A N L E A F
M I T S U B I S H I I - M I E V
P E U G E O T I O N
C I T R O Ë N C - Z E R O
T E S L A M O D E L S
O T H E R E V S
T O T A L Subscription
Payment per time
Fast charge is free
With punch card
Copyright © Transportøkonomisk institutt, 2014 53 Denne publikasjonen er vernet i henhold til Åndsverkloven av 1961

Electric vehicles - environmental, economic and practical aspects
7 Role of incentives
7.1 Overview Norwegian incentives
Public incentives obviously play an important role in the diffusion process, cf chapter 1.4, from the purchase decision when buying EVs, given their higher manufacturing costs, to following use. In Norway, there are more incentives directed at coping with the many different barriers against EV diffusion than in other European countries (ACEA 2013). Norway has incentives lowering the price of the vehicle, the costs of owning and using the vehicle, as well as incentives that make it easier and more attractive to use and recharge the vehicle. The list of incentives in table 7.1 describe the primary purposes of the incentives. For details see appendix I and Figenbaum and Kolbenstvedt (2013). Table 7.1 EV incentives in Norway 2014 and their purpose
Incentive Type
VAT exemption buying Reduce purchase price
Exemption from registration tax Reduce purchase price
Access to bus lanes Reduce time cost, make EVs more practical to use
Free parking Reduce usage cost (and time cost)
Free toll-roads Reduce usage cost
Reduced rates on ferries Reduce usage cost
Reduced annual vehicle license fee Reduce ownership cost
Reduced company car tax Reduce ownership cost
Financial support for charging stations
Accessible charging, reducing range anxiety
Financial support for fast charge stations
Accessible charging and reduced user costs
Reserved EL number plates Make it easy to control the eligibility of incentives, and make EVs visible
7.2 Important factors when buying an EV One of the questions in the survey of the EV owners was which factors were of importance when buying the EV. The results that are related to incentives are shown in figure 7.1 for all EV owners in Norway. Figure 7.2 shows the answers to the two comparable questions to NAF members.
Lower operating costs is by far the most important factor for EV owners when buying a new vehicle, much more so than for the NAF members. Lower energy cost per km is an essential part of this, but also free toll-roads and free parking could be part of this parameter. EV owners also place a higher significance on competitive
54 Copyright © Transportøkonomisk institutt, 2014 Denne publikasjonen er vernet i henhold til Åndsverkloven av 1961

Electric vehicles - environmental, economic and practical aspects
price than NAF members do. The reduced annual circulation tax is also important for EV owners.
Figure 7.1 Degree of importance of factors and incentives related to buying EVs, as seen by EV owners in Norway (n = 1 721). Percent
Figure 7.2 Degree of importance of factors and incentives related to buying a new vehicles, as seen by NAF members in Oslo-Kongsberg region (n = 2 241). Percent
Free toll-roads stands out as the most important local EV incentive, followed by free parking and bus lane access. The importance of these incentives will vary according to region. The same argument goes for free ferries. This is a more recent incentive most important on the west coast of Norway where the market has been booming since it came, see figure 7.3, indicating an the importance of this incentive.
A new trend is that the EV market is spreading out from the big cities to the neighbouring counties and further into the population in smaller cities as seen in figure 7.3. Thus EVs are found also in areas where no local incentives are at work. This fact illustrates that incentives is not the only factor influencing the EV-buyers choice.
21%5%
41%10%
12%15%
3%29%
9%25%
22%
30%28%
15%19%
20%16%
29%
32%27%
34%12%
27%8%
21%
23%26%
47%18%
39%10%
19%
0 % 10 % 20 % 30 % 40 % 50 % 60 % 70 % 80 % 90 % 100 %
C O M P E T I T I V E P R I C E
L O W E R A N N U A L C I R C U L A T I O N T A X
L O W E R O P E R A T I N G C O S T S
B U S L A N E A C C E S S
F R E E T O L L R O A D S
F R E E F E R R I E S
F R E E P U B L I C P A R K I N G
No significance Minor significance Some significance
Large significance Very large significance
4%
5%
11%
15%
37%
42%
37%
31%
11%
8%
0 % 10 % 20 % 30 % 40 % 50 % 60 % 70 % 80 % 90 % 100 %
C O M P E T I T I V E P R I C E
T H E V E H I C L E S O P E R A T I N G C O S T S
No significance Minor significance Some signification
Large significance Very large significance
Copyright © Transportøkonomisk institutt, 2014 55 Denne publikasjonen er vernet i henhold til Åndsverkloven av 1961

Electric vehicles - environmental, economic and practical aspects
Figure 7.3 EV market penetration by municipality from 2008-2014. Share of EVs in fleet. Sources: Map: Kartverket. EV sales: NEVA, OFV AS and The Norwegian Public roads administration
To see if there are regional differences, the region of Oslo-Kongsberg was compared to Bergen-Hordaland, when it comes to attitudes towards some of the incentives. Oslo-Kongsberg inhabitants are more interested in bus lane access, Bergen-Hordaland in ferries. There are smaller differences for free parking and toll-roads, although both are somewhat more important in Bergen-Hordaland, see figure 7.4.
Figure 7.4 Degree of importance of incentives for EV owners in Oslo-Kongsberg region (n = 542) and Bergen-Hordaland region (n = 211) respectively. Percent
25%
8%
23%
58%
10%
8%
30%
24%
9%
8%
25%
26%
13%
21%
22%
23%
15%
25%
22%
9%
28%
31%
10%
15%
26%
29%
12%
23%
22%
13%
29%
48%
36%
19%
26%
18%
0 % 20 % 40 % 60 % 80 % 100 %
B E R G E N H O R D A L A N D
O S L O K O N G S B E R G
B E R G E N H O R D A L A N D
O S L O K O N G S B E R G
B E R G E N H O R D A L A N D
O S L O K O N G S B E R G
B E R G E N H O R D A L A N D
O S L O K O N G S B E R G
BU
S LA
NE
TO
LL
RO
AD
FER
RIE
S
FRE
E
PA
RK
ING
No importance Minor importance Importance
Large importance Very large importance
56 Copyright © Transportøkonomisk institutt, 2014 Denne publikasjonen er vernet i henhold til Åndsverkloven av 1961

Electric vehicles - environmental, economic and practical aspects
7.3 Incentives affecting vehicle price
One of the questions in the survey was how important a competitive price is when buying a vehicle. The survey shows that the share that place a very large significance on purchase price is twice as high for EV owners as for NAF members.
EV owners are also much more interested in lower operating costs when buying a vehicle than NAF members. Lower operating costs is not a direct EV incentive but a result of the other usage incentives and the low energy cost of EVs per km compared with ICE vehicles.
The value added tax (VAT) has a flat rate of 25% in Norway and is imposed on all ICE vehicles, whereas EVs are exempt.
The registration tax is progressive and is the sum of the four elements shown in figure 7.5. The CO2 tax is negative below 105 g/km the others are positive. If the sum is negative the tax is set at a minimum level (2 400 NOK).
Figure 7.5 Registration tax system in Norway 2014: The total tax is the sum of the four partial taxes, Egenvekt = curb weight, Motoreffect = Engine power, Kroner = NOK. Source: Fridstrøm (2014), Fridstrøm and Alfsen (2014)
For a compact car competing with the compact EV Nissan Leaf, the registration tax is typically around 5 000-10 000 Euros, and lower for hybrid vehicles. The sum of the VAT and the registration tax can thus be 10 000-15 000 Euros for a compact car.
The combined effect of the purchase incentives can be summarized to:
• Small EVs are about as expensive as comparable ICE-vehicles • Compact EVs are less expensive than comparable ICE-vehicles • Large EVs (Tesla Model S) are about as expensive as large ICEs • Luxury (Tesla Model S) and sports EVs are much cheaper than luxury ICEs
Tesla Model S is attracting customers both in the large vehicle and luxury vehicle segments, and hence used as example vehicle in both categories.
Copyright © Transportøkonomisk institutt, 2014 57 Denne publikasjonen er vernet i henhold til Åndsverkloven av 1961

Electric vehicles - environmental, economic and practical aspects
7.4 Free toll-roads and access to bus lane in the Oslo-Kongsberg region
The EV owner survey also contained questions about the usage of the toll-roads and bus lanes. The questions posed to those driving to work or school more than two times per week, were:
• Can you use the bus lane on the way to work or school? • Do you pass a toll station on the way to work or school?
The same questions were also asked NAF members. There is a possibility that some of the NAF owners could misunderstand, as regular cars are not allowed in the bus lane, only EVs. So the term “can you use….” may be misinterpreted. In that case, the share among NAF owners that could have used the bus lane, had they bought an EV, may be underestimated. The results are shown in table 7.2 and 7.3 and figure 7.6.
Table 7.2 Number of EV owners in Norway 2014 that pass a tool station on their way to work/school by accessibility to using a bus lane (n = 1 450)
Do you pass a toll station when travelling to work or school?
Can you use the bus lane when travelling to work or school?
Yes No Total
Yes 562 449 1 011
No 105 277 382
Occasionally 22 35 57
Total 689 761 1 450
Table 7.3 Number of NAF members in Oslo-Kongsberg region 2014 that pass a tool station on their way to work/school by accessibility to using a bus lane (n = 2 236)
Do you pass a toll station when travelling to work or school?
Can you use the bus lane when travelling to work or school?
Yes No Not applicable
Total
Yes 176 509 81 766
No 185 603 145 933
Not applicable 15 57 23 95
Occasionally 19 29 394 442
Total 395 1 198 643 2 236
The two surveys are not directly comparable as the NAF members had an additional category, “not applicable” not used for EV owners. Most important is that they answer with different “frame of reference”, ie when it comes to the bus lanes, EV owners answered what they actually do, whereas NAF members answered about a theoretical potential prospect of using bus lanes.
The results are compared in figure 7.6, where results for EV owners in Oslo-Kongsberg region are also presented. It is clear that EV owners can use bus lanes
58 Copyright © Transportøkonomisk institutt, 2014 Denne publikasjonen er vernet i henhold til Åndsverkloven av 1961

Electric vehicles - environmental, economic and practical aspects
and toll-roads much more often than NAF members in this region. In figure 7.7 the use of toll-roads and bus lanes in the Oslo-Kongsberg region is broken down by municipality.
Figure 7.6 Toll-road and bus lane usage, usage possibility among EV owners in Norway (n = 1 721) and Oslo-Kongsberg region (n = 542), NAF members in Oslo-Kongsberg region in total (n = 2 236) and owning EVs (n = 61). NAF not relevant grouped as No toll-road, no bus lane. Percent
Figure 7.7 Bus lane and toll-road access in different municipalities in the Oslo-Kongsberg region. (Others include Øvre Eiker, Nedre Eiker, Kongsberg, Hurum, Sande, Hof, Svelvik and Holmestrand). Percent
33%
49%
51%
8%
26%
13%
16%
26%
6%
10%2%
10%
9%
2%
3%
4%
16%
10%
20%
52%
16%
16%
0 % 10 % 20 % 30 % 40 % 50 % 60 % 70 % 80 % 90 % 100 %
E V O W N E R S N A T I O N
E V O W N E R S O S L O - K O N G S B E R G
N A F E V O W N E R S
N A F / P O P U L A T I O N
Toll road and bus lane Toll road only
Bus lane only Toll road occasionally and bus lane
Toll road occasionally no bus lane No toll road, no bus lane
Drive to work <3 times/week
34%
27%
65%
58%
66%
57%
43%
49%
8%
7%
4%
8%
23%
13%
26%
5%
4%
5%
2%
9%
37%
15%
21%
16%
8%
6%
11%
9%
3%
4%
38%
23%
10%
8%
11%
6%
10%
52%
16%
7%
5%
4%
11%
14%
20%
15%
0 % 20 % 40 % 60 % 80 % 100 %
O T H E R S
D R A M M E N
R Ø Y K E N
L I E R
A S K E R
B Æ R U M
O S L O
E V O W N E R S O S L O - K O N G S B E R G
N A F M E M B E R S
Toll road and bus laneToll road onlyToll road sometimes and bus laneBus lane onlyToll road sometimes not bus laneNo toll road no bus laneDrive to work <3 times/week
Copyright © Transportøkonomisk institutt, 2014 59 Denne publikasjonen er vernet i henhold til Åndsverkloven av 1961

Electric vehicles - environmental, economic and practical aspects
It is no surprise that the suburb of Asker comes out on top when it comes to bus lane access, of those driving to work more often than twice per week, 97% can use this incentive on their work trip. The road between Asker and Oslo, a stretch of 23 km, faces the largest rush hour delays in Norway, 36 minutes on average for those that travel the complete distance to Oslo central station (PROSAM, 2012). Inhabitants of Lier and Røyken can use the same bus lanes to Oslo as the Asker inhabitants. Bærum citizens can use part of the same stretch. The bus lane is unidirectional, there is no bus lane out of the city.
It is, however, somewhat surprising that Oslo’s inhabitants to such a large extent use the bus lanes and toll-roads to and from work. It seems that those who buy EVs in Oslo use the vehicle to commute across the toll-road boarder, which on the east side of the city goes across the municipality whereas in the west it is one border with Bærum municipality and another closer to Oslo centre. The people in Oslo will benefit less from the bus lane, if they commute to Bærum or Asker, as they will drive against the main direction of commute, and thus will save less time when using the bus lane driving back to Oslo in the afternoon. It seems that most of the inhabitants of Drammen (43 km from Oslo) use the car locally, as the incentive usage pattern differs so much from Lier which lies between Asker and Drammen on the road to Oslo.
These results has been checked against the number of EVs passing through the toll gates around Oslo centre and the toll gates between the municipalities of Bærum and Oslo, see figure 7.8. The EVs are coming from all main traffic directions into Oslo. The growth of EVs passing the toll gates from 2011 is shown in figure 7.9. The dips in the curve are related to summer and other holidays.
Figure 7.8 Average number of EVs passing Oslo-Bærum border toll gates (in red) and Oslo toll ring (in blue) in March 2014. Sources: Fjellinjen (2014), map: finn.no
Most drivers that pass the Oslo-Bærum border toll gates will also pass the toll ring around Oslo, given the structure of where employers are located in Oslo. From figure 7.8 it is apparent that about 2 500 passed the toll gates between Oslo and Bærum, ie about 6 000 passed the toll ring around Oslo since the total number was around 8 500 (March 2014 number from figure 7.9).
60 Copyright © Transportøkonomisk institutt, 2014 Denne publikasjonen er vernet i henhold til Åndsverkloven av 1961

Electric vehicles - environmental, economic and practical aspects
In March 2014, about 11 000 EVs were located in municipalities within reach of the toll ring around Oslo, ie about 55% of the EV fleet passed the toll ring on an average day (averaged over 7 days). The municipalities were Oslo, Asker, Bærum, Vestby, Ski, Ås, Frogn, Nesodden, Oppegård, Lørenskog, Skedsmo, Nittedal, Ullensaker, Lier, Røyken and Hurum. In the user survey, 68% of the users in the same municipalities say they pass a toll gate on the way to work (of those driving to work 3-5 days/week). There is no inconsistency between the numbers as the spread over the week through the toll gates is not known and one number relates to the five day work week, the other the full seven day week.
Figure 7.9 Growth of the average number of EVs passing the toll gates between Oslo-Bærum and the Oslo toll ring (sum of the two) each day. Sources: Fjellinjen (2013) and Fjellinjen (2014). EVs/day
7.5 Toll-road and buss lane access in other Norwegian areas
Results from other municipalities with more than 10 respondents are shown in figure 7.10 to provide an indication of the relative importance of incentives in different parts of the country (caution should be used when interpreting data from municipalities with less than 20 respondents). It is evident that also in other municipalities/regions the bus lanes and toll-roads are important EV incentives. Oppegård, Ski and Frogn are located south east of Oslo and their inhabitants can use a bus lane to Oslo on Mosseveien and pass the Oslo toll-road ring. Skedsmo and Lørenskog is north of Oslo and many commute to Oslo passing the toll ring around Oslo and are able to use bus lanes on some stretches.
Finnøy is a special case, a small municipality but with a very expensive underwater tunnel (toll-road). Malvik, Stjørdal and Melhus house people commuting to Norway’s third biggest city, Trondheim. Sola and Sandnes inhabitants may commute on toll-roads to the city of Stavanger. Some small cities have a higher share of EV owners not using incentives, Sandefjord with 50%, Fredrikstad 36%, Bodø 41% and Moss
Copyright © Transportøkonomisk institutt, 2014 61 Denne publikasjonen er vernet i henhold til Åndsverkloven av 1961

Electric vehicles - environmental, economic and practical aspects
33%. The latter two may have EV owners taking advantage of the free ferry incentive.
Figure 7.10 Bus lane and toll-road access for EV owners in municipalities in Norway in 2014 with 10 or more respondents. The Oslo-Kongsberg region is not included and is shown in figure 7.7. Respondents numbers exclude those that travel less than three times per week. Percent
31 %
29 %
16 %
36 %
52 %
10 %
57 %
67 %
70 %
70 %
6 %
13 %
60 %
15 %
38 %
25 %
42 %
9 %
27 %
55 %
9 %
9 %
60 %
40 %
50 %
20 %
10 %
35 %
26 %
18 %
38 %
15 %
62 %
14 %
14 %
20 %
5 %
78 %
31 %
13 %
69 %
62 %
38 %
62 %
33 %
58 %
50 %
50 %
73 %
27 %
36 %
36 %
30 %
20 %
20 %
60 %
10 %
3 %
3 %
4 %
5 %
7 %
6 %
13 %
19 %
3 %
4 %
5 %
9 %
9 %
10 %
2 %
7 %
5 %
5 %
13 %
8 %
8 %
4 %
6 %
16 %
10 %
9 %
11 %
10 %
15 %
11 %
13 %
20 %
23 %
8 %
8 %
33 %
33 %
33 %
9 %
9 %
9 %
27 %
18 %
10 %
30 %
10 %
10 %
19 %
21 %
26 %
13 %
24 %
21 %
14 %
5 %
5 %
6 %
31 %
8 %
15 %
23 %
31 %
8 %
17 %
9 %
27 %
27 %
27 %
36 %
10 %
20 %
20 %
60 %
0 % 20 % 40 % 60 % 80 % 100 %
B E R G E N
T R O N D H E I M
S T A V A N G E R
K R I S T I A N S A N D
F R O G N
S A N D N E S
S K I
S K E D S M O
O P P E G Å R D
L Ø R E N S K O G
T Ø N S B E R G
F J E L L
N I T T E D A L
F I N N Ø Y
S O L A
S T J Ø R D A L
A S K Ø Y
M O S S
M A L V I K
B O D Ø
S A N D E F J O R D
B Ø M B L O
F R E D R I K S T A D
Å S
L A R V I K
T I M E
M E L H U S
R I S S A
V E S T B Y
L I L L E S A N D
O S
SHARE OF RESPONDENTS
Toll road and bus laneToll roadBus lane and toll road sometimesBus laneToll road sometimesNo toll road no bus laneDrive to work < 3 times/week
62 Copyright © Transportøkonomisk institutt, 2014 Denne publikasjonen er vernet i henhold til Åndsverkloven av 1961

Electric vehicles - environmental, economic and practical aspects
7.6 Value of local incentives
7.6.1 Value of time saving by using bus lane The access to bus lanes is not the main thing, it is the time savings that really counts. Those who used bus lanes were asked how much time they saved per trip to work. The answers are shown in figure 7.11. It is clear that the regional differences are large. Inhabitants in the Bergen-Hordaland region benefit much less from bus lane access than the inhabitants of the Oslo-Kongsberg region.
Figure 7.11 Time savings using bus lanes among EV owners in Bergen-Hordaland (n = 63), Oslo-Kongsberg (n = 329) and in Norway as a whole (n = 689). Percent The total value of the time savings for bus lane access can be calculated using the time savings multiplied with the value of time. Time as driver in a vehicle for short distance driving in queues is valued at 280 NOK/hour (Thune-Larsen 2014). It can be assumed that drivers use the bus lane up to 235 days per year. It is not possible to know how many times they use it per day. In the Oslo area most of the bus lanes are in the direction of the city centre, not in the outgoing direction. It is assumed that the bus lane is used 1.25 times per day on average nationally. Based on these numbers, the average value of time saved using the bus lane can be calculated per vehicle in the survey, and for Norway when assuming the same relative usage for the total EV fleet. The average value per vehicle is thus about 7 800 NOK and for Norway’s fleet of 21 000 EVs in February 2014, 165 million NOK, see table 7.4.
Table 7.4 The EV owners timesaving in minutes, assumed savings pr year and savings pr user per year for the COMPETT sample and for the total EV fleet in Norway 2014. NOK
n users Interpreted saving minutes
Assumed savings per year kr
Savings per user per year
10 minutes or less 270 5 1850625 6854
11-20 minutes 141 15 2899313 20563
21-30 minutes 102 25 3495625 34271
>30 minutes 109 32 4781467 43867
Don't know 67 5 459229 6854
Total users 689 13486258 19574
Total survey 1722
Total EV fleet 21000 164466565 7832
10%
7%
17%
39%
30%
60%
20%
21%
13%
15%
21%
16%
22%
8%
0 % 10 % 20 % 30 % 40 % 50 % 60 % 70 % 80 % 90 % 100 %
N O R W A Y
O S L O - K O N G S B E R G
B E R G E N - H O R D A L A N D
Don't know 10 minutes or less 11-20 minutes 21-30 minutes more than 30 minutes
Copyright © Transportøkonomisk institutt, 2014 63 Denne publikasjonen er vernet i henhold til Åndsverkloven av 1961

Electric vehicles - environmental, economic and practical aspects
7.6.2 The value of free toll-roads The value of the toll-road exemption can be estimated by combining the information about usage of toll-road with the municipality, and the cost of the toll-road that they could be using. This approach will have uncertainties related to how often they pass the toll-road, which toll-road they use (if they could be using more than one), and the actual cost they face (what rebate they have, how many toll gates they pass). The estimate obtained with this calculation is that the average toll-road user will save about 6 200 NOK per year.
The assumption is that those who report that they pass a toll-road daily or 3-5 times per week, pass once per day (two times assumed if the toll is in both traffic directions) five times per week. The total value for the respondents (1 011 out of 1 722 pass a toll-road) thus amounts to the total saving of 6.2 million NOK per year, scaled up to 76 million NOK per year for the entire EV fleet of 21 000. Per EV in the fleet the saving is calculated to 3 600 NOK per year, when also those that do not use the toll-road incentive are included. A small number say they use the toll-road occasionally and the estimate is thus on the low side.
The regional differences are huge as the toll-road cost varies between less than 3 000 NOK per year to 30 000 NOK per year in extreme cases.
7.6.3 Use and value of free parking The EV owners were asked how often they use the free public parking incentive. The result is shown in figure 7.12. 96% of owners use the incentive, and more than half use it weekly. 27% use it daily or more than twice a week.
Figure 7.12 Frequency if using a free parking incentive among EV owners in Norway 2014 (n = 1 722). Percent
They were also asked how much they save per week on this incentive. The results are shown in figure 7.13. The NAF members were asked how much they spend on parking per week.
The average value of the free parking incentive can be calculated per EV and the total value for the Norwegian EV fleet. The results in table 7.5 shows that the average value per EV is about 3 350 NOK and the total value about 70 million NOK.
Daily10 %
3-5 times per week
17 %
1-2 times per week
26 %
Less than once per
week27 %
Rarer16 %
Never4 %
64 Copyright © Transportøkonomisk institutt, 2014 Denne publikasjonen er vernet i henhold til Åndsverkloven av 1961

Electric vehicles - environmental, economic and practical aspects
Figure 7.13 Parking cost savings among EV owners Norway (n = 904 using the incentive) and Oslo- Kongsberg (n = 318) and NAF members (n = 2 236) in 2014. Percent
Table 7.5 The EV owners saving in NOK pr week and total savings pr year in NOK in Norway 2014. NOK
n users Assumed savings kr/week Total savings kr/year Less than 50 NOK/week 304 25 357200 50-100 NOK/week 267 75 941175 101-200 NOK/week 83 150 585150 201-300 NOK/week 56 250 658000 301-400 NOK/week 33 350 542850 401-500 kNOK/week 30 450 634500 Over 500 NOK/week 54 501 1271538 Do not know 77 25 90475 Use less than once per week 470 25 552250 Infrequent 279 10 131130 Never 70 0 0 Total 1723 5764268 Total fleet 21000 70255153 Per EV in fleet 3345
7.6.4 Value of free ferries The EV owners were not asked how often they use the free ferries or how much this saves them. A very crude estimate can be made by using the fact that the incentive on average is rated about 1/3 as important as the toll-road incentive, which could be interpreted as being used 1/3 as often. Again assuming that the daily savings could be comparable to toll-road savings per vehicle that uses the incentive, the estimate for total savings per year is 25 million NOK per year for the EV fleet, equivalent to about 1 200 NOK per EV in the fleet.
7.7 Total economic value of local user incentives It is possible to calculate the average economic value of the local incentives for the average EV driver based on the estimates for each incentive. In table 7.6 the results have been scaled up to the size of the EV fleet in April 2014, 25 000 EVs. The economic value is 16 000 NOK per EV and 400 million NOK for the total fleet.
75%
31%
65%
14%
32%
15%
4%
9%
5%
5% 3%
2%
11%
4%
0 % 10 % 20 % 30 % 40 % 50 % 60 % 70 % 80 % 90 % 100 %
N A F
E V O W N E R S O S L O - K O N G S B E R G
E V O W N E R S
Less than 50 NOK/week 50-100 NOK/week 101-200 NOK/week
201-300 NOK/week 301-400 NOK/week 401-500 kNOK/week
Over 500 NOK/week Do not know
Copyright © Transportøkonomisk institutt, 2014 65 Denne publikasjonen er vernet i henhold til Åndsverkloven av 1961

Electric vehicles - environmental, economic and practical aspects
Table 7.6 Calculated average values per year of different local incentives per car and for total fleet in Norway Total fleet in Norway = 25 000 EV’s in April 2014. NOK and Euros/year
Incentive Value per car NOK/year
Value for EV fleet million NOK/year
Value per car Euros/year
Value for EV fleet million Euros/year
Toll-road 3 622 91 434 11
Bus lane 7 832 196 940 24
Free parking 3 347 84 398 10
Free ferries 1 195 30 145 4
Total 15 996 400 1 928 48
There will be huge differences between EV owners when it comes to how much they benefit from incentives. In extreme cases, the owner could save up to 70 000 NOK per year, whereas others might save nothing.
Bus lane access will be a benefit to society as long as spare capacity is used without delaying buses. The toll-road incentive leads to lower income for the toll-road company. This company has a loan that was used to build roads. When income is reduced, either the rate per paying vehicle must be increased, or the period of payment is prolonged. Free ferries are different from free toll-roads. The ferry cost should cover the marginal cost of transporting the vehicle and persons in the vehicle. If fewer pay, the rate per paying vehicle is increased or the subsidy from the province or government must increase. Free parking means that municipal income per parking space is reduced and that fewer parking spaces are available to other paying users. The cost of the free parking incentive for municipalities may thus exceed the value of the incentive for the EV owner.
66 Copyright © Transportøkonomisk institutt, 2014 Denne publikasjonen er vernet i henhold til Åndsverkloven av 1961

Electric vehicles - environmental, economic and practical aspects
8 EV-only households
8.1 Different groups of EV owners
The number and types of cars in the household are important dimensions when looking at the possibilities for electrification. It is obviously easier to cope with range challenges if you can choose between an EV with short range and an ICE car, a plug in hybrid or a Tesla S model, than if you only own a small EV.
In this chapter, single-vehicle households and multi-vehicle households from the various samples will be compared separately to gain more insight of which socio-demographic and economic factors that are important in a vehicle selection process.
The analysis will then proceed to investigate differences between single-EV households, multi-EV households and those that have a mix of EVs and ICE cars in the household. The purpose is to identify factors that can motivate users to make the move to become EV-only households.
8.2 Vehicle ownership In the survey, the owners were asked how much they use the “newest” EV. It is assumed that they referred to the same car through the survey.
427 of the responding EV owners belong to EV-only households. 358 of these only have one EV in the household, ie are single-vehicle households (EV household 1 EV), 58 have two EVs and 11 have more than two EVs. The last two groups have been grouped together to increase sample size (EV household 2+ EV). Finally households with one or more EVs and at least one ICE vehicle have been grouped together as these households (mixed EV/ICE) should have possibilities to swap vehicles to solve range problems. Figure 8.1 shows the distribution of EV models in the three different EV household types.
Figure 8.1 Share of EV models /brands in single-EV households (n = 358), multi-EV households (n = 69) and mixed EV/ICE households (n = 1 261). EV owners in Norway 2014. Percent
Tesla Model S has a 43% share of respondents in EV households with more than one EV, indicating that many may have taken the extra step of going fully electric, maybe as a result of Tesla Model S making it possible to replace the households’ ICE
52%22%
47%
7%14%
13%
3%4%
4%
23%43%
15%
11%16%
18%
0 % 10 % 20 % 30 % 40 % 50 % 60 % 70 % 80 % 90 % 100 %
E V H O U S E H O L D 1 E V
E V H O U S E H O L D 2 + E V
M I X E D E V / I C E
Nissan Leaf Mitsubishi I-miev Peugeot Ion Citroën c-zero Tesla Model S Other EVs
Copyright © Transportøkonomisk institutt, 2014 67 Denne publikasjonen er vernet i henhold til Åndsverkloven av 1961

Electric vehicles - environmental, economic and practical aspects
vehicles. One would have expected that the single EV households would have a higher percentage of Tesla Model S, as this vehicle covers a much broader range of transport needs. Insights into the socio-demographic differences gives indications on why this is not the case. The household income level is lower in these households, see chapter 8.3 and 8.4, and the Tesla Model S is an expensive vehicle.
8.3 Socio-demographics of single-vehicle households The socio-demographics and economic status of single-vehicle EV households that have bought new EVs during the last two years, is presented together with data from the NTS 2009 (Vågane 2014) as a point of reference, see table 8.1. There is a much higher share of men in the EV-only sample, and more EV owners are in the 35-44 year group, and to some extent also in the 45-54 year group. There are more persons in the EV households, as a result of the number of children.
A much higher share in this group is working, and the higher employment rate explains to some extent the higher household income of EV owners. Longer education of EV owners should also influence the household income. The EV owners’ average distance to work in this user survey is almost twice that of the population in the NTS 2009, which could indicate that they are more dependent on private vehicle transportation.
In the Oslo-Kongsberg region, it is possible to compare EV owners and NAF members that have bought new vehicles during the last two years. In addition, data from NTS 2009 provides a point of reference. NAF members are older than the EV owners, with a three times higher share above 55 years, whereas EV owners have three times higher share in the 25-44 year groups. The NAF members have fewer children and belong to smaller households. The level of employment and distance to work of NAF members is close to that of the NTS respondents. The income level of NAF members is comparable to EV owners, both having higher household income than NTS respondents. EV owners have a higher educational level, higher percentage who are working, and longer distances to work than the other groups from comparable areas. It is thus evident that the Norwegian EV owners fit well in to the socio-demographic characteristics of the early innovators and early adopters of the diffusion theory, cf section 1.4.
When those working full time in the two samples are compared, the income differences between EV owners and NTS respondents became much smaller, see figure 8.2, whereas NAF owners turns out to include the most affluent single-vehicle households.
Figure 8.2 Single-vehicle household income for persons in Oslo-Kongsberg region with full-time jobs who have bought a new vehicle last 2 years. Note: In NTS full time is defined as working more than 30 hours per week (n NTS = 1 171, n EV = 83, n NAF = 134). NOK (and percent)
41%
33%
45%
22%
16%
24%
37%
52%
28%
0 % 10 % 20 % 30 % 40 % 50 % 60 % 70 % 80 % 90 % 100 %
E V O N L Y 1 E V
N A F 1 V E H I C L E
N T S O N E V E H I C L E
Under 200 000 200-800 000 800 000- 1000 000 Over 1000 000
68 Copyright © Transportøkonomisk institutt, 2014 Denne publikasjonen er vernet i henhold til Åndsverkloven av 1961

Electric vehicles - environmental, economic and practical aspects
Table 8.1 Socio-demographic and economic parameters of single-vehicle households in Norway and the Kongsberg Oslo region in 2009 and 2014. Percent
Single-vehicle households
Norway Oslo Kongsberg
New vehicle buyers last 2
years
Persons >18 years in vehicle owning
households
New vehicle buyers last 2 years Persons >18 years in vehicle owning
households
Factor EV-only 2014
NTS 2009
EV-only 2014
NAF 2014
NTS 2009
Respondents n 268 10 295 97 213 2 158
Gender
Men 75% 52% 75% 75% 51%
Women 25% 48% 25% 25% 49%
Age years
18-24 0% 6% 1% 0% 8%
25-34 18% 16% 13% 4% 21%
35-44 40% 20% 44% 15% 21%
45-54 21% 16% 15% 20% 17%
55-66 12% 21% 13% 31% 17%
67-74 6% 11% 7% 22% 8%
75+ 3% 10% 5% 8% 7%
Average persons in household 2.6 2.3 2.5 2.1 2.4
Children below 18 years 1.0 0.6 0.9 0.4 0.6
Persons with driving licence 1.6 1.6 1.6 1.6 1.7
Household income NOK
<200 000 2% 5% 0% 1% 5%
200 000 - 800 000 48% 64% 46% 46% 53%
800 000 - 1 000 000 23% 18% 21% 16% 20%
>1 000 000 27% 13% 34% 37% 22%
Education
Primary and lower secondary (1-10 grade) 4% 14% 3% 3% 7%
Upper secondary school/High school (11-13 grade) 25% 39% 20% 24% 29%
Higher education up to four years 34% 24% 34% 37% 30% Higher education longer than four years 37% 23% 43% 36% 34%
Employment
Working 89% 60% 89% 66% 67%
Retired/Benefit recipient 9% 32% 11% 33% 24%
Student/other 2% 8% 0% 1% 9%
Distance to work km 23.1 11.6 21.6 12.8 12.4
Copyright © Transportøkonomisk institutt, 2014 69 Denne publikasjonen er vernet i henhold til Åndsverkloven av 1961
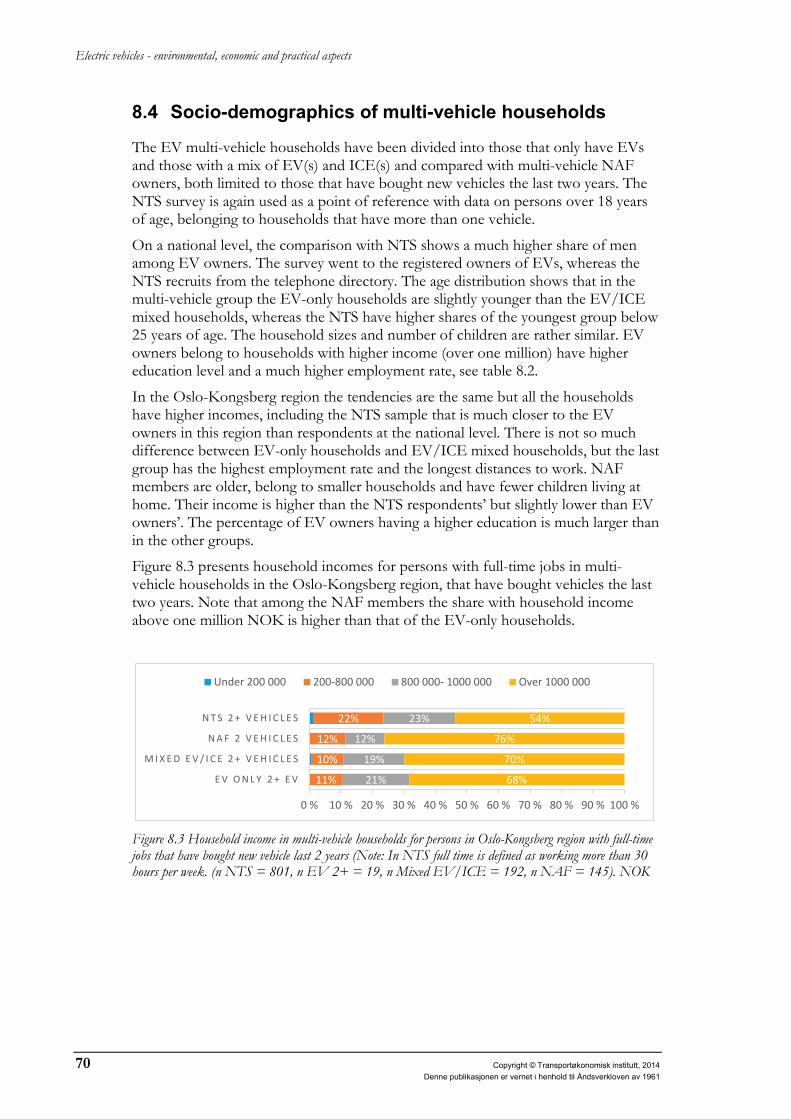
Electric vehicles - environmental, economic and practical aspects
8.4 Socio-demographics of multi-vehicle households
The EV multi-vehicle households have been divided into those that only have EVs and those with a mix of EV(s) and ICE(s) and compared with multi-vehicle NAF owners, both limited to those that have bought new vehicles the last two years. The NTS survey is again used as a point of reference with data on persons over 18 years of age, belonging to households that have more than one vehicle.
On a national level, the comparison with NTS shows a much higher share of men among EV owners. The survey went to the registered owners of EVs, whereas the NTS recruits from the telephone directory. The age distribution shows that in the multi-vehicle group the EV-only households are slightly younger than the EV/ICE mixed households, whereas the NTS have higher shares of the youngest group below 25 years of age. The household sizes and number of children are rather similar. EV owners belong to households with higher income (over one million) have higher education level and a much higher employment rate, see table 8.2.
In the Oslo-Kongsberg region the tendencies are the same but all the households have higher incomes, including the NTS sample that is much closer to the EV owners in this region than respondents at the national level. There is not so much difference between EV-only households and EV/ICE mixed households, but the last group has the highest employment rate and the longest distances to work. NAF members are older, belong to smaller households and have fewer children living at home. Their income is higher than the NTS respondents’ but slightly lower than EV owners’. The percentage of EV owners having a higher education is much larger than in the other groups.
Figure 8.3 presents household incomes for persons with full-time jobs in multi-vehicle households in the Oslo-Kongsberg region, that have bought vehicles the last two years. Note that among the NAF members the share with household income above one million NOK is higher than that of the EV-only households.
Figure 8.3 Household income in multi-vehicle households for persons in Oslo-Kongsberg region with full-time jobs that have bought new vehicle last 2 years (Note: In NTS full time is defined as working more than 30 hours per week. (n NTS = 801, n EV 2+ = 19, n Mixed EV/ICE = 192, n NAF = 145). NOK
11%
10%
12%
22%
21%
19%
12%
23%
68%
70%
76%
54%
0 % 10 % 20 % 30 % 40 % 50 % 60 % 70 % 80 % 90 % 100 %
E V O N L Y 2 + E V
M I X E D E V / I C E 2 + V E H I C L E S
N A F 2 V E H I C L E S
N T S 2 + V E H I C L E S
Under 200 000 200-800 000 800 000- 1000 000 Over 1000 000
70 Copyright © Transportøkonomisk institutt, 2014 Denne publikasjonen er vernet i henhold til Åndsverkloven av 1961

Electric vehicles - environmental, economic and practical aspects
Table 8.2 Socio-demographic and economic parameters of multi-vehicle households in Norway and the Oslo-Kongsberg region in 2009 and 2014. Percent
Multi-vehicle households
Norway Oslo Kongsberg
New vehicle buyers last 2 years
Persons >18 years in vehicle owning
households
New vehicle buyers last 2 years Persons >18 years in vehicle owning
households
Factor EV-only 2014
EV/ICE Mixed 2014
NTS 2009
EV Only 2014
EV/ICE Mixed 2014
NAF 2014
NTS 2009
Respondents n 49 875 10 284 23 217 192 1 359
Gender
Men 79% 78% 54% 74% 76% 76% 52%
Women 21% 22% 46% 26% 24% 24% 48%
Age years
18-24 0% 1% 10% 0% 0% 1% 12%
25-34 10% 12% 15% 4% 9% 3% 14%
35-44 41% 34% 25% 34% 36% 16% 26%
45-54 31% 31% 25% 34% 31% 26% 25%
55-66 18% 18% 20% 26% 21% 36% 18%
67-74 0% 3% 4% 0% 3% 17% 4%
75+ 0% 1% 2% 0% 0% 3% 1%
Average persons in household
3.3 3.5 3.3 3.3 3.5 2.8 3.3
Children below 18 years 1.3 1.3 1.0 1.3 1.4 0.8 1.0
Persons with driving licence
2.0 2.1 2.2 2.0 2.1 2.1 2.2
Household income NOK
<200 000 0% 1% 1% 0% 1% 1% 1%
200 000 - 800 000 18% 21% 43% 10% 14% 18% 29%
800 000 - 1 000 000 18% 26% 28% 20% 17% 14% 22%
>1 000 000 64% 54% 28% 70% 68% 68% 48%
Education
Primary and lower secondary (1-10 grade) 2% 2% 11% 0% 2% 3% 6%
Upper secondary school/High school (11-13 grade)
12% 20% 44% 4% 10% 18% 34%
Higher education up to four years 37% 39% 24% 35% 35% 35% 27%
Higher education longer than four years 49% 39% 21% 61% 53% 44% 33%
Employment
Working 90% 93% 77% 91% 94% 80% 77%
Retired/Benefit recipient 6% 5% 14% 0% 5% 19% 10%
Student/other 4% 1% 10% 9% 1% 1% 13%
Distance to work km 24.5 29.1 14.9 18.4 26.8 17.4 14.5
Copyright © Transportøkonomisk institutt, 2014 71 Denne publikasjonen er vernet i henhold til Åndsverkloven av 1961

Electric vehicles - environmental, economic and practical aspects
8.5 Socio-demographics of EV-only households The EV-owner households with only one EV are smaller and have fewer children below 18 years of age, and fewer persons with driving licences, compared to other EV households, see figures 8.4, 8.5 and 8.6. The average number of persons in the households are 2.6 in EV households with one EV and 3.2 in EV households with more than one EV and 3.4 in households with a mix of EV and ICEs. The average number of persons with driving licences is 1.6 in EV households with one EV, 2.0 in EV households with more than one EV and 2.1 in households with a mix of EV and ICEs. The average number of persons below 18 year of age is 0.9 in EV households with one EV and 1.2 in EV households with more than one EV and 1.2 in households with a mix of EV and ICEs.
Figure 8.4 Number of persons in different EV households. Norway 2014 (n = 1 721). Percent
Figure 8.5 Number of persons with driving licence in the different EV households. EV owners in Norway 2014 (n = 1 721). Percent
Figure 8.6 Number of persons below 18 years of age in the different EV households. EV owners in Norway 2014 (n = 1 721). Percent
The household income of the EV-only households with one EV is lower than other EV households, see figure 8.7. The differences in employment status are small, but EV households with one EV have a higher share of retired persons, see figure 8.8.
21%
7%
4%
35%
26%
26%
16%
19%
17%
18%
35%
34%
8%
12%
14%
2%
1%
5%
E V H O U S E H O L D 1 E V
E V H O U S E H O L D 2 + E V
M I X E D E V / I C E H O U S E H O L D
1 2 3 4 5 6+
42%12%
7%
56%78%
78%
2%10%
11% 3%
0 % 10 % 20 % 30 % 40 % 50 % 60 % 70 % 80 % 90 % 100 %
E V H O U S E H O L D 1 E V
E V H O U S E H O L D 2 + E V
M I X E D E V / I C E H O U S E H O L D
1 person 2 persons 3 persons 4+ persons
52%41%
38%
18%12%17%
21%39%
30%
8%7%
11% 3%
E V H O U S E H O L D 1 E V
E V H O U S E H O L D 2 + E V
M I X E D E V / I C E H O U S E H O L D
0 1 2 3 4+
72 Copyright © Transportøkonomisk institutt, 2014 Denne publikasjonen er vernet i henhold til Åndsverkloven av 1961

Electric vehicles - environmental, economic and practical aspects
Figure 8.7 Household income in the different EV households. Norway 2014 (n = 1 721). Percent
Figure 8.8 Employment status for respondents belonging to the different EV households. EV owners in Norway 2014 (n = 1 721). Percent Also the education level differences between EV household types are small, see figure 8.9. The EV owners in EV-only households are slightly younger than other EV owners, see figure 8.10. Slightly higher shares are women in the EV-only households, see figure 8.11.
Figure 8.9 Education level for respondents belonging to the different EV households. EV owners in Norway 2014 (n = 1 721). Percent
7% 23%
10%
7%
18%
14%
14%
23%
24%
26%
27%
51%
51%
0 % 10 % 20 % 30 % 40 % 50 % 60 % 70 % 80 % 90 % 100 %
E V H O U S E H O L D 1 E V
E V H O U S E H O L D 2 + E V
M I X E D E V / I C E H O U S E H O L D
Under 200 000 200-400 000 400-600 000
600-800 000 800 000- 1000 000 Over 1000 000
77%
75%
80%
4%
5%
8%
7%
7%
9%
6%
5%
4%
0 % 10 % 20 % 30 % 40 % 50 % 60 % 70 % 80 % 90 % 100 %
E V H O U S E H O L D 1 E V
E V H O U S E H O L D 2 + E V
M I X E D E V / I C E H O U S E H O L D
Student Full time employee Part time employee Self employed
Retired Benefit recipient Other
4%
22%
13%
19%
34%
42%
39%
41%
41%
40%
E V H O U S E H O L D 1 E V
E V H O U S E H O L D 2 + E V
M I X E D E V / I C E H O U S E H O L D
Primary and lower secondary (1-10) Upper secondary school/High school (11-13)
Higher education up to four years Higher education longer than four years
Copyright © Transportøkonomisk institutt, 2014 73 Denne publikasjonen er vernet i henhold til Åndsverkloven av 1961

Electric vehicles - environmental, economic and practical aspects
Figure 8.10 Age of respondents in the different EV households. EV owners in Norway 2014 (n = 1 721). Percent
Figure 8.11 Gender in the different EV households. EV owners in Norway 2014 (n = 1 721). Percent
8.6 Usage of incentives
Looking at different EV owners use of incentives is very important in order to understand what kind of consequences one can expect if the incentives are changed. Figure 8.12 shows the EV owners’ usage of the free parking incentive, ie average savings per week using the incentive. There is not much differences between household types. More EV-only households use free parking than the others.
Figure 8.13 shows the usage of the free toll-roads incentive. The main difference is the higher usage among multi-EV/ICE households and the lower share that do not use the vehicle to drive to work every day for the EV-only households. (The questions on toll-road and bus lane usage was only posed to those that say they use the EV to go to work or school more often than twice per week.)
Figure 8.12 Free parking estimated savings per week (n EV household 1EV = 358, n EV household 2+ EVs = 69, n Multi EV/ICE household = 1 263). EV owners in Norway 2014. Percent
44,7
45,6
46,9
40 41 42 43 44 45 46 47 48
E V H O U S E H O L D 1 E V
E V H O U S E H O L D 2 + E V
M I X E D E V / I C E H O U S E H O L D
27%
25%
23%
73%
75%
77%
E V H O U S E H O L D 1 E V
E V H O U S E H O L D 2 + E V
M I X E D E V / I C E H O U S E H O L D
Woman Man
17%17%18%
18%20%
15%
6%4%
5%
4%4%
4%3%
5%
4%
43%45%
49%
0 % 10 % 20 % 30 % 40 % 50 % 60 % 70 % 80 % 90 % 100 %
E V H O U S E H O L D 1 E V
E V H O U S E H O L D 2 + E V
M I X E D E V / I C E H O U S E H O L D
Less than 50 NOK/week 50-100 NOK/week 101-200 NOK/week
201-300 NOK/week 301-400 NOK/week 401-500 NOK/week
Over 500 NOK/week Do not know Do not use
74 Copyright © Transportøkonomisk institutt, 2014 Denne publikasjonen er vernet i henhold til Åndsverkloven av 1961

Electric vehicles - environmental, economic and practical aspects
Figure 8.13 Usage of free toll-road incentive on daily (three or more times per week) trip to work (n EV household 1 EV = 358, n EV household 2 + EVs = 69, n multi-EV/ICE household = 1 263). EV owners in Norway 2014. Percent
Figure 8.14 shows the usage of the bus lane, again the difference is mostly related to the share not going to work every day, as well as a higher share in the EV households with more than one EV.
Figure 8.14 Usage of bus lane for those EV owners having worktrips at least two days pr week (n EV household 1 EV = 358, n EV household 2 + EVs = 69, n multi-EV/ICE household = 1 263). EV wners in Norway 2014. Percent
8.7 Changes in number of vehicles
The most striking differences when it comes to the vehicle ownership in the households, are the high share of additional vehicles in the mixed EV/ICE households, and the 15% share that did not own a vehicle before in the EV households with only one vehicle, the EV, see figure 8.15.
Figure 8.15 Share replacing other car/s and buying an additional/new car among different EV households. EV owners in Norway 2014. Percent
53%
54%
61%
20%
23%
23%
3%
4%
3%
23%
19%
13%
0 % 10 % 20 % 30 % 40 % 50 % 60 % 70 % 80 % 90 % 100 %
E V H O U S E H O L D 1 E V
E V H O U S E H O L D 2 + E V S
M U L T I E V / I C E H O U S E H O L D
Yes No Sometimes Do not drive to work more than 2 times per week
40%48%
40%
36%33%
47%
23%19%
13%
0 % 10 % 20 % 30 % 40 % 50 % 60 % 70 % 80 % 90 % 100 %
E V H O U S E H O L D 1 E VE V H O U S E H O L D 2 + E V S
M U L T I E V / I C E H O U S E H O L D
Yes No Do not drive to work more than 2 times per week
74%
77%
64%
3%
7%
2%
8%
13%
34%
15%
3%
0 % 10 % 20 % 30 % 40 % 50 % 60 % 70 % 80 % 90 % 100 %
E V H O U S E H O L D 1 E V
E V H O U S E H O L D 2 E V
M I X E D E V / I C E H O U S E H O L D
Yes the EV replaced another car Yes the EV replaced 2 or more cars
No the EV came in addition to other cars No did not own a car before
Copyright © Transportøkonomisk institutt, 2014 75 Denne publikasjonen er vernet i henhold til Åndsverkloven av 1961

Electric vehicles - environmental, economic and practical aspects
8.8 Changes in travel length and pattern
The EV owners in EV-only households have shorter travel distances to work than the mixed EV/ICE households, with those that only have one EV having the shortest distances, see figure 8.16. In figure 8.17, the annual insurance driving length is shown for the EVs owner groups, with EV households with 2+ EV having the longest driving distances and those with only one EV the shortest. In figure 8.18 the changes to the households’ driving length is shown, and it is seen that the changes are biggest for the EV households with one EV. This is partly related to a higher share of first time vehicle buyers in this household type.
Figure 8.16 Distance to work for respondents belonging to different EV groups/households. EV owners in Norway 2014. Km
Figure 8.17 Annual driving distance (given by insurance) among EV owners in Norway belonging to different types of car owning households in 2014. Percent
Figure 8.18 Changes in annual insured driving length among EV owners in Norway 2014 belonging to different types of car owning households. Percent
22,8
24,2
27,4
- 5,0 10,0 15,0 20,0 25,0 30,0
EV household 1 EV
EV household 2+ EV
Mixed EV/ICE
Distance in km
18%
12%
12%
25%
17%
23%
20%
23%
24%
20%
23%
19%
15%
23%
19%
2%
1%
3%
0 % 10 % 20 % 30 % 40 % 50 % 60 % 70 % 80 % 90 % 100 %
E V H O U S E H O L D 1 E V
E V H O U S E H O L D 2 E V
M I X E D E V / I C E H O U S E H O L D
8000 km and less 8-12 000 km 12-16 000 km
16-20 000 km More than 20 000 km Don't know
50%
70%
65%
17%
17%
18%
11%
7%
5%
18%
6%
10%
3%
0 % 10 % 20 % 30 % 40 % 50 % 60 % 70 % 80 % 90 % 100 %
E V H O U S E H O L D 1 E V
E V H O U S E H O L D 2 E V
M I X E D E V / I C E H O U S E H O L D
No the driving length has not changed Yes the driving length has increased
Yes the driving length has been reduced Have owned the vehicle less than a year
Don't know
76 Copyright © Transportøkonomisk institutt, 2014 Denne publikasjonen er vernet i henhold til Åndsverkloven av 1961

Electric vehicles - environmental, economic and practical aspects
The changes in the travel patterns were also analysed for members of the different types of EV households. In figure 8.19, the changes to the transport pattern in general is shown. As expected, the changes are largest for persons belonging to the EV households with one EV and least for the mixed EV/ICE households.
Figure 8.19 Changes in travel pattern in general for respondents belonging to various EV households. EV owners in Norway 2014 (n = 1 721). Percent
In figures 8.20 and 8.21, the changes in the Nissan Leaf and Tesla Model S households are shown for EV-only households and mixed EV/ICE households. The EV households could not be split into single and multi-vehicle due to sample size. There are clear differences in the changes that the owners of these two types of EVs have undertaken. For the Leaf households the changes to all transport modes are larger than for the Tesla households apart from Tesla households driving more. Again the results are expected, as in 86% of the Tesla households, the Tesla replaced another vehicle, whereas 12% became additional vehicles. In 71% of the Leaf households, the Leaf replaced another vehicle, and 25% bought it as an additional vehicle. For Tesla households, it seems that on average they drive more even after correcting for the additional vehicles.
31%
14%
20%
8%
8%
7%
8%
47%
2%
28%
6%
14%
3%
12%
7%
3%
61%
4%
20%
5%
15%
3%
6%
4%
5%
63%
2%
0% 10% 20% 30% 40% 50% 60% 70%
I drive more
I drive less
I use public transport less
I use public transport more
I cycle/walk less
I cycle/walk more
I have done other changes
There are no changes
I don't know
Mixed EV/ICE household EV household 2+ EV household 1
Copyright © Transportøkonomisk institutt, 2014 77 Denne publikasjonen er vernet i henhold til Åndsverkloven av 1961

Electric vehicles - environmental, economic and practical aspects
Figure 8.20 Changes to travel for persons in households owning a Nissan Leaf (where Nissan Leaf is their latest bought EV). EV owners in Norway 2014 (n = 807). Percent
Figure 8.21 Changes in travel modes in households owning a Tesla Model S (where Tesla Model S is their latest bought EV). EV owners in Norway 2014 (n = 306). Percent
Work and school is the most frequent trip purpose of EVs, cf chapter 5.6. Changes of work trip mode done after buying the EV, does not differ much between the household types, see figure 8.22. A higher share have switched from public transport in the EV households with one EV, and a higher share used another EV in the EV households with more than one EV. The latter is not unexpected as the respondents were asked about information on the “newest” EV in the household.
Some households have moved from mixed EV/ICE households into multi EV households, many of these own a Tesla, as can be seen in figure 8.1. This is also supported by figure 8.23 where one can see that it is the most experienced EV owners that have taken the step of becoming EV-only households owning more than one EV. On the other hand, the EV-only households with only one EV are the least experienced.
17%
5%
14%
3%
5%
4%
27%
19%
19%
9%
9%
7%
0% 5% 10% 15% 20% 25% 30% 35%
Drive more
Drive less
Less public transport
More public transport
Cycle/walk less
Cycle/walk more
Nissan Leaf EV household Nissan Leaf mixed EV/ICE household
25%
4%
7%
1%
2%
3%
31%
4%
8%
3%
4%
4%
0% 5% 10% 15% 20% 25% 30% 35%
Drive more
Drive less
Less public transport
More public transport
Cycle/walk less
Cycle/walk more
Tesla EV household Tesla mixed EV/ICE household
78 Copyright © Transportøkonomisk institutt, 2014 Denne publikasjonen er vernet i henhold til Åndsverkloven av 1961

Electric vehicles - environmental, economic and practical aspects
Figure 8.22 How the work trip was done prior to buying the EV for respondents in different EV households. EV owners in Norway 2014 (n = 1 721). Percent
Figure 8.23 EV experience in different types of EV households. EV owners in Norway 2014 (n = 1 721). Percent
8.9 Methods for handling range challenges
As expected, the EV households that only have one vehicle, have the largest difficulties with coping with everyday travel needs, see figure 8.24. They depend more on borrowing vehicles from others and using public transport than the other EV household types. They have the highest share reporting that the planned trip is cancelled (three times more often than the other EV household types). EV households with two or more EVs can only to a certain degree get by with using the other EV in the household, and must partly rely on borrowing vehicles from others, renting, or using public transport.
73%
1%
1%
0%
18%
3%
1%
3%
0%
77%
0%
9%
0%
9%
2%
0%
4%
0%
81%
2%
2%
0%
10%
2%
0%
2%
1%
0% 10% 20% 30% 40% 50% 60% 70% 80% 90%
Regular car as driver
Regular car as passenger
Other EV as driver
Other EV as passenger
By public transport
Cycled
Walked
Was not done prior to buying Ev
Other
EV/ICE households EV household 2+ EVs EV household 1 EV
88%28%
82%
7%43%
9%
4%17%
7%12%
0 % 10 % 20 % 30 % 40 % 50 % 60 % 70 % 80 % 90 % 100 %
E V H O U S E H O L D 1E V H O U S E H O L D 2 +
M I X E D E V / I C E H O U S E H O L D S
My first EV 2-5 years 5-10 years >10 years
Copyright © Transportøkonomisk institutt, 2014 79 Denne publikasjonen er vernet i henhold til Åndsverkloven av 1961

Electric vehicles - environmental, economic and practical aspects
Figure 8.24 The methods the different types of EV owners take into use to fulfil the travel requirement when the EV range is insufficient for the planned trip. Several methods could be mentioned. EV owners in Norway 2014 (n = 1 721). Percent
8.10 Environmental motivation
EV households with two EVs have the highest share of members in environment organizations, see figure 8.25. This is a bit surprising, as one would expect those living in EV households with one EV only, to be the most idealistic. Figures 8.26 and 8.27 shows the interest in vehicle technologies and the competence in different EV household types and regions. There are no clear trends, but it seems that members of EV households with only one EV are less interested than others, but on the other hand a higher share of these persons rate their competence as good.
18%
4%
37%
13%
37%
4%
20%
55%
50%
41%
48%
4%
32%
0%
22%
14%
20%
3%
6%
68%
57%
39%
57%
6%
87%
1%
4%
2%
18%
0%
7%
36%
39%
38%
32%
3%
0% 10% 20% 30% 40% 50% 60% 70% 80% 90% 100%
Use other car in household
Use rental car through dealer
Loan car from friend/family
Rents a car
Use public transport
Use car sharing car
The trip is not done
Use fast chargers
Drives more economically
Turns off heater/AC
Plan the trip better
Other adaptions
EV/ICE households EV household 2+ EVs EV household 1 EV
80 Copyright © Transportøkonomisk institutt, 2014 Denne publikasjonen er vernet i henhold til Åndsverkloven av 1961

Electric vehicles - environmental, economic and practical aspects
Figure 8.25 EV Membership in environmental organizations in by type of EV ownership. EV owners in Norway 2014. (n = 1 721). Percent
Figure 8.26 Degree of interest in vehicle technologies among members from different EV households in the Oslo-Kongsberg region (n = 542) and the rest of Norway (n = 1 179). Percent
Figure 8.27 Degree of competence in vehicle technologies among members from different EV households in the Oslo-Kongsberg region (n = 542) and the rest of Norway (n = 1 179). Percent
The EV-only households are the most positive to buy an EV again, those with more than one EV have no doubts, 99% will buy an EV again versus 86% for the Mixed EV/ICE households, see figure 11.2.
21%29%
13%
79%71%
87%
0 % 20 % 40 % 60 % 80 % 100 %
E V H O U S E H O L D 1 E V
E V H O U S E H O L D 2 + E V S
M I X E D E V / I C E H O U S E H O L D S
Yes No
13%
22%
19%
12%
14%
16%
10%
18%
6%
18%
16%
8%
18%
39%
35%
35%
42%
34%
38%
19%
26%
31%
24%
37%
31%
0 % 10 % 20 % 30 % 40 % 50 % 60 % 70 % 80 % 90 %100 %
E V H O U S E H O L D 1 E V
E V H O U S E L H O L D 2 + E V
M I X E D E V
E V H O U S E H O L D 1 E V
E V H O U S E L H O L D 2 + E V S
M I X E D E V / I C E H O U S E H O L D
OSL
O
KO
NG
SBE
RG
RE
ST O
F N
OR
WA
Y
Completely uninterested Rather uninterested Neither nor
Somewhat interested Very interested
6%10%
19%13%
13%18%
3%12%
35%35%
34%36%
32%32%
27%19%
28%26%
24%29%
13%23%21%17%
39%24%
0 % 10 % 20 % 30 % 40 % 50 % 60 % 70 % 80 % 90 %100 %
E V H O U S E H O L D 1 E V
E V H O U S E L H O L D 2 + E V
M I X E D E V
E V H O U S E H O L D 1 E V
E V H O U S E L H O L D 2 + E V S
M I X E D E V / I C E H O U S E H O L D
OSL
O
KO
NG
SBE
RG
RE
ST O
F N
OR
WA
Y
Poor Rather poor Average Rather good Good
Copyright © Transportøkonomisk institutt, 2014 81 Denne publikasjonen er vernet i henhold til Åndsverkloven av 1961

Electric vehicles - environmental, economic and practical aspects
Figure 8.28 Rating of factors influencing the purchase of the EV among persons belonging to different EV household types in Norway 2014 (n = 1 720). Percent
82 Copyright © Transportøkonomisk institutt, 2014 Denne publikasjonen er vernet i henhold til Åndsverkloven av 1961

Electric vehicles - environmental, economic and practical aspects
9 Potential EV buyers
9.1 Future buyers showing up at the EV dealers
As mentioned in chapter 2, one of the purposes with the study among NAF members was to gain insight on the characteristics of future EV buyers. Figure 9.1 shows that 30% of NAF members in Oslo-Kongsberg region are considering buying an EV, 42% are negative and 28% don’t know. Those who consider buying and have not already done so are an important group, as they are the potential customers. In this chapter, their characteristics have been compared with the group that does not consider buying.
Figure 9.1 The share among NAF members in Oslo-Kongsberg region in 2014 who will consider buying an EV the next time they buy a vehicle (n = 2 241). Percent It is well known that intentions often differ from peoples’ real choices and behaviour, a fact that makes it difficult to arrive at firm conclusions on future number of buyers based on surveys. It is, however, possible to compare with earlier studies in the same group. In a study among NAF members in Norway from 2012 9% could consider an EV (NAF 2012). Compared to this, 30% potential buyers seems like a big step forward in the EV diffusion process.
It is interesting that the group of “not knowing” respondents is much larger than usual in survey-questions. This indicates that there could also be some possible EV byers in this group.
9.2 Socio-demographics of potential EV buyers
The prospective buyers are on average six years younger, richer, have longer education, a higher share of women and higher levels of employment than those that will not consider buying an EV, cf table 9.1 and figures 9.2, 9.3, 9.4 and 9.5. The two groups are compared with EV owners in the same region as a point of reference. It turns out that the NAF members that considers buying an EV, have socio-demographic characteristics that lie between those of other NAF members and EV owners, indicating that these factors play a role in the diffusion process. The higher
30 %
42 %
28 %
Yes No Don't know
Copyright © Transportøkonomisk institutt, 2014 83 Denne publikasjonen er vernet i henhold til Åndsverkloven av 1961

Electric vehicles - environmental, economic and practical aspects
the level of education, the higher the willingness to consider buying an EV, see figure 9.4.
Those working are somewhat more willing to consider an EV, especially among self-employed persons, see figure 9.5. The interest differs between professions. EV owners working in technology oriented occupations, in commercial services and in the public sector are more positive than those who work as craftsmen, in primary industries, in construction or in finance, cf figure 9.6. Women are more positive than men, see figure 9.7. They have also a higher share of uncertain persons. Table 9.1 Age, gender, education and occupational status of NAF members in Oslo-Kongsberg region by willingness to consider an EV next time they should buy a car, and EV owners in the same region 2014. Percent
NAF members that will not consider buying EV
next time
NAF members that will consider buying EV
next time
EV owners Oslo Kongsberg
NAF members surveyed 42% 30% NA
Average age 56 50 47
18-24 years 1% 0% 0.4%
25-34 years 7% 11% 10%
35-44 years 13% 25% 36%
45-54 years 20% 25% 27%
55-66 years 34% 24% 21%
67-74 years 21% 11% 5%
75 years + 5% 3% 1%
Gender
Men 75% 70% 74%
Women 25% 30% 26%
Highest education
Primary and lower secondary (1-10 grade) 3% 1% 1.5%
Upper secondary school/High school (11-13 grade)
23% 13% 10%
Higher education up to four years 37% 33% 36%
Higher education longer than four years 36% 53% 53%
Occupational status
Working 67% 84% 91%
Retired/Benefit recipient 30% 13% 7%
Student/other 3% 3% 2%
Number n 929 672 542
84 Copyright © Transportøkonomisk institutt, 2014 Denne publikasjonen er vernet i henhold til Åndsverkloven av 1961

Electric vehicles - environmental, economic and practical aspects
Figure 9.2 Age profile of prospective (Yes) and non-prospective (No) EV buyers among NAF members in Oslo-Kongsberg region 2014 (n = 2 241). Percent
Figure 9.3 Willingness to consider EVs when buying next vehicle by education level. NAF members in Oslo-Kongsberg region 2014 (n = 2 241). Percent
Figure 9.4 Employment status of those that are willing/not willing to consider buying EVs. NAF members in Oslo-Kongsberg region 2014 (n = 2 241). Percent
It is interesting to note that the share replying “Don’t know” is almost the same for all occupations (figure 9.6). One might have expected a smaller share among workers in technology oriented occupations.
05
101520253035404550
20 25 30 35 40 45 50 55 60 65 70 75 80 85 90
Num
ber o
f res
pond
ents
Age in years
Yes No
11%
20%
27%
38%
52%
49%
43%
37%
37%
31%
30%
25%
0 % 10 % 20 % 30 % 40 % 50 % 60 % 70 % 80 % 90 %100 %
P R I M A R Y A N D L O W E R S E C O N D A R Y ( 1 - 1 0 )
U P P E R S E C O N D A R Y S C H O O L / H I G H S C H O O L ( 1 1 - 1 3 )
H I G H E R E D U C A T I O N U P T O F O U R Y E A R S
H I G H E R E D U C A T I O N L O N G E R T H A N F O U R Y E A R S
Yes will consider buying No will not consider buying Don't know
71%
56%
57%
3%
4%
4%
10%
7%
6%
12%
27%
26%
2%
3%
3%
0 % 10 % 20 % 30 % 40 % 50 % 60 % 70 % 80 % 90 % 100 %
Y E S W I L L C O N S I D E R B U Y I N G
N O W I L L N O T C O N S I D E R B U Y I N G
D O N ' T K N O W
Student Full time employee Part time employee Self employed
Retired Benefit recipient Other
Copyright © Transportøkonomisk institutt, 2014 85 Denne publikasjonen er vernet i henhold til Åndsverkloven av 1961

Electric vehicles - environmental, economic and practical aspects
Figure 9.5 Willingness to consider buying EVs by occupational status. NAF members in Oslo-Kongsberg region 2014 (n = 2 241). Percent
Figure 9.6 Willingness to consider EVs in different professions. NAF members in Oslo-Kongsberg region 2014 (n = 2 241). Percent
Figure 9.7 Willingness to consider buying EV vs. respondents gender. NAF members in Oslo-Kongsberg gion 2014 (n = 2 241). Percent
36%35%
23%38%
16%20%
33%39%
43%40%
51%44%
30%26%
33%21%
33%35%
0 % 10 % 20 % 30 % 40 % 50 % 60 % 70 % 80 % 90 % 100 %
S T U D E N T
F U L L T I M E E M P L O Y E E
P A R T T I M E E M P L O Y E E
S E L F E M P L O Y E D
R E T I R E D
B E N E F I T R E C I P I E N T
Yes will consider buying No will not consider buying Don't know
22%
13%
33%
38%
23%
24%
38%
26%
34%
33%
28%
25%
56%
63%
43%
38%
50%
48%
36%
51%
40%
39%
48%
42%
22%
25%
24%
24%
27%
28%
27%
23%
26%
29%
23%
33%
0 % 50 % 100 %
A G R I C U L T U R E , F O R E S T R Y , F I S H I N G
M I N I N G A N D Q U A R R Y I N G
I N D U S T R Y
E L E C T R I C I T Y , W A T E R , R E N O V A T I O N
C O N S T R U C T I O N A N D B U I L D I N G
T R A D E , T R A N S P O R T , H O T E L , R E S T A U R A N T
I N F O R M A T I O N A N D C O M M U N I C A T I O N
F I N A N C E A N D I N S U R A N C E
C O M M E R C I A L S E R V I C E S , P R O P E R T Y …
P U B L I C S E R V I C E S , E D U C A T I O N , H E A L T H
P E R S O N A L S E R V I C E S
O T H E R
Yes will consider buying No will not consider buying Don't know
32%
29%
36%
44%
32%
27%
0 % 10 % 20 % 30 % 40 % 50 % 60 % 70 % 80 % 90 % 100 %
F E M A L E
M A L E
Yes will consider buying No will not consider buying Don't know
86 Copyright © Transportøkonomisk institutt, 2014 Denne publikasjonen er vernet i henhold til Åndsverkloven av 1961

Electric vehicles - environmental, economic and practical aspects
9.3 Household characteristics of potential EV buyers
Potential EV buyers belong to bigger households with more children, more persons with driving licenses, more vehicles, living in larger cities than those who will not consider buying an EV, see table 9.2, figure 9.8, 9.9 and 9.10.
Table 9.2 Household characteristics of NAF members in Oslo-Kongsberg region by willingness to consider an EV next time they should buy a car and of EV owners in the same region 2014. Percent
NAF members that will not consider buying EV next
time
NAF members that will consider buying
EV next time
EV owners Oslo-Kongsberg
Share of NAF members surveyed 42% 30% NA
Living area
Big city 71% 76% 58%
City 21% 17% 13%
Densely populated 6% 6% 27%
Other 3% 2% 2%
Number of children below 18 years in household 0.38 0.76 1.16
Persons in household 2.2 2.7 3.2
Average number of driving licenses in household 1.7 1.8 2.0
Household income
Under 200 000 1% 1% 0.9%
200 000-400 000 18% (200-500’)
29% (500-800’)
10% (200-500’)
21% (500-800’)
2%
400 000-600 000 9%
600 000-800 000 10%
800 000-1000 000 13% 17% 19%
Over 1000 000 30% 43% 52%
Unknown 8% 8% 7%
Share belonging to single car households
68% 58% 26%
Average insured driving distance 13 700 km (vehicle 1) 13 400 km (vehicle 1) 13 800 km (EV)
Number n 929 672 542
Rather big differences between the respondents from our three samples from the Oslo-Kongsberg region can have various explanations. The respondents might perceive the categories in different ways, they might actually live in very different places in the region or it can be coincidence.
The interest in buying EVs increases with number of persons and children in the household up to five persons/three children, bigger households are less interested, see figure 9.9 and figure 9.10. The higher the level of income, the higher the willingness to consider buying an EV, see figure 9.11.
Copyright © Transportøkonomisk institutt, 2014 87 Denne publikasjonen er vernet i henhold til Åndsverkloven av 1961

Electric vehicles - environmental, economic and practical aspects
Figure 9.8 Willingness to consider EVs by living area. NAF members in Oslo-Kongsberg region 2014 (n = 2 241). Percent
Figure 9.9 Willingness to consider EVs when buying next vehicle by number of persons in the respondents household. NAF members in Oslo-Kongsberg region 2014 (n = 2 241). Percent
Figure 9.10 Willingness to consider EVs when buying next vehicle by number of children in the respondents household. NAF members in Oslo-Kongsberg region 2014 (n = 2 241). Percent
Figure 9.11 Willingness to consider EVs by household income level. NAF members in Oslo-Kongsberg region 2014 (n = 2 241). Percent
31%
27%
30%
24%
40%
45%
46%
52%
29%
28%
24%
24%
0 % 10 % 20 % 30 % 40 % 50 % 60 % 70 % 80 % 90 %100 %
B I G C I T Y ( O S L O , B E R G E N S T A V A N G E R , T R O N D H E I M )
C I T Y
D E N S E L Y P O P U L A T E D A R E A / C O M M U N I T Y
O T H E R
Yes will consider buying No will not consider buying Don't know
25%23%
35%49%
52%39%
45%47%
38%29%
21%50%
31%30%
27%22%
27%11%
0 % 10 % 20 % 30 % 40 % 50 % 60 % 70 % 80 % 90 % 100 %
12345
> 5
NU
MBE
R O
F PE
OPL
E IN
HO
USE
HOLD
Yes will consider buying No will not consider buying Don't know
24%39%
49%51%
18%
46%36%
30%21%
64%
30%26%
20%28%
18%
0 % 10 % 20 % 30 % 40 % 50 % 60 % 70 % 80 % 90 % 100 %
0123
> 3
NU
MBE
R O
F CH
ILDR
EN
Yes will consider buying No will not consider buying Don't know
20%18%
24%35%
40%28%
52%46%
45%37%
39%41%
28%36%
30%29%
22%31%
0 % 10 % 20 % 30 % 40 % 50 % 60 % 70 % 80 % 90 % 100 %
U N D E R 2 0 0 0 0 0
2 0 0 - 5 0 0 0 0 0
5 0 0 - 8 0 0 0 0 0
8 0 0 - 1 . 0 0 0 0 0 0
O V E R 1 . 0 0 0 0 0 0
D O N ' T W A N T T O T E L L
Yes will consider buying No will not consider buying Don't know
88 Copyright © Transportøkonomisk institutt, 2014 Denne publikasjonen er vernet i henhold til Åndsverkloven av 1961

Electric vehicles - environmental, economic and practical aspects
9.4 Vehicles ownership among potential EV buyers
The number of vehicles is not an important factor apart from the difference between single-vehicle and multi-vehicle households, see figure 9.12 Also, increased number of driving licences increase willingness to consider EV, see figure 9.13.
Figure 9.12 Willingness to consider buying EV by number of vehicles in the household of the respondent. NAF members in Oslo-Kongsberg region 2014 (n = 2 241). Percent
Figure 9.13 Willingness to consider EV by the number of persons with driving licences in the respondents household. NAF members in Oslo-Kongsberg region 2014 (n = 2 241). Percent
9.5 Driving pattern and use of incentives The annual driving distance for the vehicles in the households shows no significant correlation with willingness to consider an EV, cf figure 9.14. Figure 9.15 shows that there is a higher share of persons who pass a toll-road daily or could use a bus lane among those who will consider buying an EV than among those that do not.
Figure 9.14 Insured driving distance for NAF members considering respectively not considering to buy an EV next time buying a vehicle. NAF members in Oslo-Kongsberg region 2014 (n = 2 241). Percent
27%
37%
32%
33%
43%
38%
43%
45%
30%
25%
25%
23%
0 % 10 % 20 % 30 % 40 % 50 % 60 % 70 % 80 % 90 % 100 %
O N E V E H I C L E
T W O V E H I C L E S
T H R E E V E H I C L E S
M O R E T H A N T H R E E
Yes will consider buying No will not consider buying Don't know
24%
33%
37%
27%
43%
41%
38%
36%
33%
26%
25%
36%
0 % 10 % 20 % 30 % 40 % 50 % 60 % 70 % 80 % 90 % 100 %
1
2
3
M O R E T H A N 3
Yes will consider buying No will not consider buying Don't know
17%
16%
20%
28%
26%
28%
26%
26%
25%
17%
18%
15%
10%
12%
9%
3%
2%
2%
0 % 10 % 20 % 30 % 40 % 50 % 60 % 70 % 80 % 90 % 100 %
Y E S W I L L C O N S I D E R
N O W I L L N O T C O N S I D E R
D O N ' T K N O W
8000 km or less 8-12 000 km 12-16 000 km
16-20 000 km over 20 000 km Don't know
Copyright © Transportøkonomisk institutt, 2014 89 Denne publikasjonen er vernet i henhold til Åndsverkloven av 1961

Electric vehicles - environmental, economic and practical aspects
Figure 9.15 How degree of access to bus lane and free toll-roads correlates with willingness to consider buying EVs. NAF members in Oslo-Kongsberg region 2014 (n = 2 241). Percent
9.6 Potential buyers’ interest and competence In general, EV owners rate their technological competence higher than NAF members do, see chapter 3.1. But looking at self-defined competence of vehicle technology among the different NAF-members reveals no correlation between competence and the willingness to considering an EV, cf figure 9.16.
When it comes to interest in vehicle technology, there is an opposite pattern. While no difference between EV owners and NAF members in general can be found, cf table 3.1, there seems to be a negative correlation between technology interest and willingness to consider buying and EV, see figure 9.17. This can be related to different knowledge on EVs and the earlier EVs not being technological interesting.
Figure 9.16 Correlation between competence in vehicle technologies and willingness to consider buying an EV. NAF members in Oslo-Kongsberg region 2014 (n = 2 241). Percent
Figure 9.17 Correlation between interest in vehicle technologies and willingness to consider buying EVs. NAF members in Oslo-Kongsberg region 2014 (n = 2 241). Percent
43%
32%
29%
23%
15%
16%
4%
4%
4%
42%
41%
42%
57%
54%
50%
12%
22%
24%
19%
32%
34%
0 % 50 % 100 %
Y E S W I L L C O N S I D E R B U Y I N G
N O W I L L N O T C O N S I D E R B U Y I N G
D O N ' T K N O W
Y E S W I L L C O N S I D E R B U Y I N G
N O W I L L N O T C O N S I D E R B U Y I N G
D O N ' T K N O WD
O Y
OU
P
ASS
A
TO
LL R
OA
D
ON
TH
E
WA
Y T
O
WO
RK
OR
SC
HO
OL?
CA
N Y
OU
U
SE A
BU
S LA
NE
ON
T
HE
TR
AV
EL
TO
WO
RK
O
R S
CH
OO
L
Yes Occasionally No Not applicable
6%
5%
7%
21%
19%
19%
42%
39%
46%
22%
26%
21%
10%
11%
6%
0 % 10 % 20 % 30 % 40 % 50 % 60 % 70 % 80 % 90 % 100 %
Y E S W I L L C O N S I D E R B U Y I N G
N O W I L L N O T C O N S I D E R B U Y I N G
D O N ' T K N O W
Bad Rather bad Average Rather good Good
5% 15%9%15%
17%16%
22%
43%43%
43%
20%28%
16%
0 % 10 % 20 % 30 % 40 % 50 % 60 % 70 % 80 % 90 % 100 %
Y E S W I L L C O N S I D E R B U Y I N G
N O W I L L N O T C O N S I D E R B U Y I N G
D O N ' T K N O W
Completely uninterested Rather uninterested Neither nor
Somewhat interested Very interested
90 Copyright © Transportøkonomisk institutt, 2014 Denne publikasjonen er vernet i henhold til Åndsverkloven av 1961

Electric vehicles - environmental, economic and practical aspects
9.7 Diffusion channels - organisations and friends
Membership in environmental organisations is used as an indicator of environmental interest in this study. It is not surprising that there is a considerably higher share of NAF members considering buying EVs among persons who are members of an environmental organization than among NAF members who are not, see figure 9.18.
Figure 9.18 Willingness to consider buying an EV next time by membership of an environmental organisation. NAF members in Oslo-Kongsberg region 2014 (n = 2 241). Percent
Observability is an important factor in the diffusion process cf chapter 1.4. Possible buyers must get an opportunity to observe the new technology in real life. This can be done at dealers, by seeing the cars in the streets and by having friends owning EVs. Friends or family having bought or considering buying seem to have a positive influence on the willingness to consider EVs. Figure 9.19 shows that nearly half of those who report that they know someone who have bought or consider buying an EV will consider buying an EV. Among those that do not report having such friends, only 14% consider buying an EV.
Figure 9.19 Willingness to consider buying an EV next time by having or not having friend that or consider buying an EV. NAF members in Oslo-Kongsberg region 2014 (n = 2 241). Percent
9.8 Period since of last bought car and new vs used car
There is not much difference in attitude to buying an EV among buyers of new or used vehicles or vehicles bought last two years or longer ago among NAF members, see figure 9.20. Those who bought new vehicles during the last two years are slightly more positive than those that did so longer ago. This is important as it points to the future prospects of an expanding second hand market for EVs.
52%
28%
28%
43%
21%
29%
0 % 10 % 20 % 30 % 40 % 50 % 60 % 70 % 80 % 90 % 100 %
Y E S I A M M E M B E R
N O I A M N O T M E M B E R
Yes will consider buying No will not consider buying Don't know
46%
43%
14%
20%
32%
28%
61%
38%
21%
29%
25%
42%
0 % 10 % 20 % 30 % 40 % 50 % 60 % 70 % 80 % 90 % 100 %
Y E S , F R I E N D S H A V E B O U G H T
Y E S , F R I E N D S C O N S I D E R B U Y I N G
N O
D O N ' T K N O W
Yes I will consider buying No I will not consider buying Don't know
Copyright © Transportøkonomisk institutt, 2014 91 Denne publikasjonen er vernet i henhold til Åndsverkloven av 1961

Electric vehicles - environmental, economic and practical aspects
Figure 9.20 NAF members willingness to consider buying an EV next time by when they bought their newest car (within last two years or longer than two years ago) and if it was a new or used car. (n total = 2 235). Percent.
9.9 Relation to diffusion theory
The non-interested group has a much higher percentage of retired people and people living in small households, groups that one would not expect to be early adopters of EVs.
Figure 9.21 shows how those who are positive to consider an EVs responded to the factors of importance when buying the last vehicle vs those who do not consider buying an EV. There is little difference between the two groups, which indicates that they look for the same qualities in vehicles. When it comes to the two groups’ perception of EV technology and qualities, they have totally different opinions on virtually all aspects, see chapter 10. Those who are willing to consider EVs rate them much more positively on all aspects than the others. It is an interesting question whether this is related to the level of knowledge of the technology or to their needs being different.
The results in this chapter fits well with the diffusion theory characteristics, cf chapter 1.4, where the prospective NAF EV buyers have characteristics resembling ”Early Adopters”/”Early Majority” and those that will not consider buying EVs have characteristics pertaining to “Late Majority”. The factors that were important when buying a vehicle last time reveal little difference between the two groups, apart from when it comes to environmental characteristics, which are more interesting for potential buyers and they are also more sensitive to operating cost and purchase price. They are less occupied with having a dealer nearby.
It seems that the main differences do not only relate to what people look for when buying a new car, but to how they evaluate the EV technology, ie to the innovation itself. When prospective buyers of EVs are more positive than those that are not considering buying one, it can probably be related to their knowledge of this type of cars. In accordance with the social dimensions of diffusion theory, cf chapter 1.4, it turns out those who are interested in buying more often report having friends that have done so than those who do not consider to buy an EV.
The fact that those who do not consider EVs as an option, show a lower level of knowledge of the technology, gives rise to some optimism. More knowledge may turn parts of this group around. The prospective buyers are also more aware of EVs
30%
31%
26%
33%
41%
39%
45%
41%
29%
30%
29%
26%
0 % 10 % 20 % 30 % 40 % 50 % 60 % 70 % 80 % 90 % 100 %
N E W
U S E D
N E W
U S E DB
OU
GH
T
LAST
2
YE
AR
S
BO
UG
HT
>
2 Y
EA
RS
AG
O
Yes will consider EV No will not consider EV Don't know
92 Copyright © Transportøkonomisk institutt, 2014 Denne publikasjonen er vernet i henhold til Åndsverkloven av 1961

Electric vehicles - environmental, economic and practical aspects
than those that are negative, as can be seen by a much lower percentage answering “don’t know” on EV specific questions.
Figure 9.21 Degree of importance of factors that can influence buying an EV, as evaluated by those who consider and not consider buying an EV next time. NAF members in Oslo-Kongsberg region 2014 (n = 2 241). Percent
15%
16%
18%
13%
8%
5%
27%
31%
26%
4%
5%
5%
29%
29%
29%
5%
6%
5%
24%
24%
22%
14%
16%
13%
10%
12%
10%
35%
28%
26%
21%
19%
22%
34%
33%
33%
32%
27%
27%
39%
41%
46%
40%
43%
43%
36%
37%
38%
23%
21%
26%
47%
48%
48%
17%
17%
16%
43%
43%
43%
24%
18%
20%
33%
28%
35%
38%
35%
40%
12%
16%
17%
27%
25%
21%
6%
5%
4%
18%
20%
21%
8%
4%
4%
10%
8%
5%
13%
11%
9%
4%
4%
0 % 20 % 40 % 60 % 80 % 100 %
Y E S W I L L C O N S I D E R B U Y I N G
N O W I L L N O T C O N S I D E R B U Y I N G
D O N ' T K N O W
Y E S W I L L C O N S I D E R B U Y I N G
N O W I L L N O T C O N S I D E R B U Y I N G
D O N ' T K N O W
Y E S W I L L C O N S I D E R B U Y I N G
N O W I L L N O T C O N S I D E R B U Y I N G
D O N ' T K N O W
Y E S W I L L C O N S I D E R B U Y I N G
N O W I L L N O T C O N S I D E R B U Y I N G
D O N ' T K N O W
Y E S W I L L C O N S I D E R B U Y I N G
N O W I L L N O T C O N S I D E R B U Y I N G
D O N ' T K N O W
Y E S W I L L C O N S I D E R B U Y I N G
N O W I L L N O T C O N S I D E R B U Y I N G
D O N ' T K N O W
Y E S W I L L C O N S I D E R B U Y I N G
N O W I L L N O T C O N S I D E R B U Y I N G
D O N ' T K N O W
BE
ST V
EH
ICLE
FO
R M
Y N
EE
D
I'M
IN
TE
RE
STE
D
IN N
EW
T
EC
HN
OLO
GY
TH
E V
EH
ICLE
S SA
FET
Y
TH
E V
EH
ICLE
S E
NV
IRO
NM
EN
TA
L C
HA
RA
CT
ER
ISTI
CS
TH
E
VE
HIC
LES
OP
ER
AT
ING
CO
STC
OM
PE
TIT
IVE
P
UR
CH
ASE
PR
ICE
TH
ER
E W
AS
A
DE
ALE
R W
ITH
T
HE
BR
AN
D
NE
AR
BY
No importance Minor importance Importance
Large importance Very large importance
Copyright © Transportøkonomisk institutt, 2014 93 Denne publikasjonen er vernet i henhold til Åndsverkloven av 1961

Electric vehicles - environmental, economic and practical aspects
10 Attitudes to and experiences with EVs
10.1 EV owners and NAF members
In the surveys, the participants were asked about their attitudes to EVs and if they saw various aspects of EVs as advantages or disadvantages. The answers from the two main surveys, EV owners and NAF members, are shown together in figure 10.1. The “don’t know” answers are not shown for the NAF members, so only those that had an opinion are compared with answers from the EV owners. EV owners did not have the option of answering “don’t know”. The high percentage of “don’t know” answers indicate that a substantial part of NAF members have little knowledge about EVs.
The responses from the two groups differs considerably. EV owners have a completely different view of EVs than NAF members. Roughly three times as many NAF members as EV owners rate range, access to charging stations and time to charge as big disadvantages. When looking at the combined result for big and small disadvantage, however, the gap is not large. Twice as many EV owners as NAF members rate low operating costs as an advantage of EVs. EV size, safety, acceleration and comfort are also factors rated much more positively by EV owners.
10.2 EV owners and potential EV buyers
As discussed in chapter 9, NAF members are not a homogeneous group and 30% of them consider buying an EV. The potential buyers are more similar to EV-owners than to the rest of the NAF members. Figure 10.2 shows the different attitudes to advantages and disadvantages of EVs between the potential EV buyers and the rest.
94 Copyright © Transportøkonomisk institutt, 2014 Denne publikasjonen er vernet i henhold til Åndsverkloven av 1961

Electric vehicles - environmental, economic and practical aspects
Figure 10.1 Degree of advantages and disadvantages with EVs as expressed by EV owners in Norway (left, n = 1 721) and NAF members in Oslo-Kongsberg region (right, n = 2 241). Those that replied “Do not know have been deducted” (4-37% in the various questions)
30%
14%
46%
34%
31%
80%
39%
9%
19%
14%
4%
22%
22%
27%
16%
31%
13%
19%
41%
12%
30%
22%
59%
23%
35%
27%
25%
69%
26%
41%
28%
13%
50%
45%
56%
36%
7%
8%
12%
3%
8%
25%
41%
38%
21%
22%
18%
3%
10%
15%
31%
0 % 20 % 40 % 60 % 80 % 100 %
V E H I C L E S I Z E
V E H I C L E R A N G E
A C C E S S T O C H A R G I N G S T A T I O N S
T I M E T O C H A R G E
I M P R A C T I C A L W I T H C A B L E S
D R I V I N G C O M F O R T
V E H I C L E S A F E T Y
P U R C H A S E P R I C E
O P E R A T I N G C O S T S
A C C E L E R A T I O N
T O P S P E E D
V E H I C L E S H E A T I N G S Y S T E M
S E C O N D H A N D V A L U E U N C E R T A I N T Y
U N C E R T A I N T Y A B O U T I N C E N T I V E S
Big advantage Small advantage Neither nor
Small disadvantage Big disadvantage
5%
6%
8%
6%
8%
6%
18%
41%
13%
4%
5%
8%
17%
19%
16%
7%
34%
6%
31%
38%
35%
18%
12%
33%
45%
23%
16%
13%
22%
12%
18%
25%
36%
13%
17%
16%
5%
9%
16%
20%
24%
24%
25%
74%
62%
51%
20%
6%
14%
15%
4%
5%
12%
26%
37%
0 % 20 % 40 % 60 % 80 % 100 %
V E H I C L E S I Z E
V E H I C L E R A N G E
A C C E S S T O C H A R G I N G S T A T I O N S
T I M E T O C H A R G E
I M P R A C T I C A L W I T H C A B L E S
D R I V I N G C O M F O R T
V E H I C L E S A F E T Y
P U R C H A S E P R I C E
O P E R A T I N G C O S T S
A C C E L E R A T I O N
T O P S P E E D
V E H I C L E S H E A T I N G S Y S T E M
S E C O N D H A N D V A L U E U N C E R T A I N T Y
U N C E R T A I N T Y A B O U T I N C E N T I V E S
Big advantage Small advantage Neither nor
Small disadvantage Big disadvantage
Copyright © Transportøkonomisk institutt, 2014 95 Denne publikasjonen er vernet i henhold til Åndsverkloven av 1961

Electric vehicles - environmental, economic and practical aspects
Figure 10.2 Degree of importance of advantages and disadvantages of EVs as seen by potential buyers among NAF members (n = 762) considering buying an EV and NAF members who do not consider buying an EV (n = 929) in Oslo-Kongsberg region 2014. Percent
8%
5%
8%
7%
11%
11%
7%
9%
14%
6%
9%
6%
28%
12%
16%
60%
30%
38%
20%
9%
13%
7%
6%
5%
4%
6%
12%
5%
7%
6%
22%
16%
14%
18%
19%
19%
22%
14%
14%
9%
5%
6%
5%
40%
30%
34%
7%
10%
5%
5%
40%
27%
26%
44%
36%
35%
43%
32%
30%
16%
20%
17%
8%
15%
10%
35%
34%
30%
54%
42%
41%
29%
22%
19%
19%
14%
16%
14%
13%
13%
24%
20%
23%
22%
5%
13%
29%
11%
14%
35%
17%
25%
41%
30%
38%
13%
14%
13%
19%
17%
17%
17%
15%
16%
4%
6%
5%
7%
10%
8%
16%
17%
13%
24%
18%
17%
32%
19%
22%
30%
21%
23%
19%
32%
20%
64%
85%
71%
48%
73%
63%
41%
64%
45%
11%
30%
17%
3%
10%
5%
9%
19%
11%
10%
18%
15%
6%
2%
6%
3%
9%
3%
10%
15%
9%
25%
32%
19%
40%
39%
31%
4%
12%
12%
1%
5%
5%
3%
8%
8%
4%
11%
15%
6%
12%
15%
15%
31%
34%
14%
27%
34%
7%
19%
23%
8%
24%
26%
15%
27%
33%
14%
26%
32%
25%
41%
46%
21%
34%
40%
13%
25%
30%
0 % 20 % 40 % 60 % 80 % 100 %
Y E S W I L L C O N S I D E R B U Y I N G
N O W I L L N O T C O N S I D E R B U Y I N G
D O N ' T K N O W
Y E S W I L L C O N S I D E R B U Y I N G
N O W I L L N O T C O N S I D E R B U Y I N G
D O N ' T K N O W
Y E S W I L L C O N S I D E R B U Y I N G
N O W I L L N O T C O N S I D E R B U Y I N G
D O N ' T K N O W
Y E S W I L L C O N S I D E R B U Y I N G
N O W I L L N O T C O N S I D E R B U Y I N G
D O N ' T K N O W
Y E S W I L L C O N S I D E R B U Y I N G
N O W I L L N O T C O N S I D E R B U Y I N G
D O N ' T K N O W
Y E S W I L L C O N S I D E R B U Y I N G
N O W I L L N O T C O N S I D E R B U Y I N G
D O N ' T K N O W
Y E S W I L L C O N S I D E R B U Y I N G
N O W I L L N O T C O N S I D E R B U Y I N G
D O N ' T K N O W
Y E S W I L L C O N S I D E R B U Y I N G
N O W I L L N O T C O N S I D E R B U Y I N G
D O N ' T K N O W
Y E S W I L L C O N S I D E R B U Y I N G
N O W I L L N O T C O N S I D E R B U Y I N G
D O N ' T K N O W
Y E S W I L L C O N S I D E R B U Y I N G
N O W I L L N O T C O N S I D E R B U Y I N G
D O N ' T K N O W
Y E S W I L L C O N S I D E R B U Y I N G
N O W I L L N O T C O N S I D E R B U Y I N G
D O N ' T K N O W
Y E S W I L L C O N S I D E R B U Y I N G
N O W I L L N O T C O N S I D E R B U Y I N G
D O N ' T K N O W
Y E S W I L L C O N S I D E R B U Y I N G
N O W I L L N O T C O N S I D E R B U Y I N G
D O N ' T K N O W
Y E S W I L L C O N S I D E R B U Y I N G
N O W I L L N O T C O N S I D E R B U Y I N G
D O N ' T K N O W
EV
SIZ
EE
V
RA
NG
E
AC
CE
SS
TO
C
HA
RG
ING
ST
AT
ION
S
TIM
E I
T
TA
KE
S T
O
CH
AR
GE
CA
BLE
S A
RE
IM
PR
AC
TIC
AL
EV
C
OM
FOR
TE
V
SAFE
TY
EV
P
UR
CH
ASE
PR
ICE
EV
O
PE
RA
TI
NG
C
OST
S
EV
A
CC
ELE
RA
TIO
N
PE
RFO
RM
AN
CE
EV
TO
P
SPE
ED
EV
H
EA
TIN
G
SYST
EM
UN
CE
RT
AIN
TY
SE
CO
ND
H
AN
D
VA
LUE
UN
CE
RT
AIN
TY
A
BO
UT
IN
CE
NT
IV
ES
IN
TH
E
FUT
UR
E
Big advantage Small advantage Neither nor Small disadvantage Big disadvantage Don't know
96 Copyright © Transportøkonomisk institutt, 2014 Denne publikasjonen er vernet i henhold til Åndsverkloven av 1961

Electric vehicles - environmental, economic and practical aspects
10.3 EV owners attitudes by brands
To see if there are interesting differences between the owners of the various EVs, some of the results related to vehicle functions are broken down by vehicle model.
10.3.1 Safety The vehicle’s safety level was rated as a big advantage by Tesla Model S owners and also Leaf owners rated the safety level as good, see figure 10.3. The other EVs received lower scores, which could be attributed to the much smaller size of these vehicles rather than a rating of the technical level of the impact protection systems employed.
Figure 10.3 EV owners opinion on safety level by brand. Norway 2014 (n = 1 721). Percent
10.3.2 Purchase price The purchase price was most favourably rated by Tesla Model S owners, followed by Nissan with Mitsubishis. I-Mievs rated lowest, see figure 10.4. A large percentage of these I-Mievs were however sold at a much higher price than they sell at today, so this could be partly attributed to the early buyers’ disappointment.
Figure 10.4 EV owners opinion about the purchase price by brand in Norway 2014 (n = 1 721). Percent
36%
5%
6%
79%
10%
34%
30%
7%
14%
13%
18%
16%
22%
32%
61%
61%
48%
4%
48%
35%
1%
24%
14%
27%
19%
8%
3%
8%
6%
7%
2%
0 % 10 % 20 % 30 % 40 % 50 % 60 % 70 % 80 % 90 % 100 %
N I S S A N L E A F
M I T S U B I S H I I - M I E V
P E U G E O T I O N
C I T R O Ë N C - Z E R O
T E S L A M O D E L S
O T H E R E V S
T O T A L
Big advantage Small advantage Neutral Small disadvantage Big disadvantage
32%10%
17%27%
52%23%
31%
31%24%
27%23%
21%26%
27%
28%30%
30%40%
16%32%
27%
9%27%
23%8%8%
14%12%
9%3%2%2%
5%3%
0 % 10 % 20 % 30 % 40 % 50 % 60 % 70 % 80 % 90 % 100 %
N I S S A N L E A F
M I T S U B I S H I I - M I E V
P E U G E O T I O N
C I T R O Ë N C - Z E R O
T E S L A M O D E L S
O T H E R E V S
T O T A L
Big advantage Small advantage Neutral Small disadvantage Big disadvantage
Copyright © Transportøkonomisk institutt, 2014 97 Denne publikasjonen er vernet i henhold til Åndsverkloven av 1961

Electric vehicles - environmental, economic and practical aspects
10.3.3 Comfort The comfort of the Tesla Model S and the Nissan Leaf stands out among the other EVs, see figure 10.5. The small Mitsubishis, Citroens and Peugeots are rated less favourably, which is probably partly related to the poor heating system.
Figure 10.5 EV owners opinion of the EVs level of comfort by brand in Norway 2014 (n = 1 721). Percent
10.3.4 Acceleration The acceleration is rated as a big advantage by most Tesla owners, see figure 10.6. In general, people are fairly satisfied with the other EVs’ acceleration performance, with Nissan Leaf a little bit ahead of the others.
Figure 10.6 The EV owners opinion of the vehicles acceleration by brand. EV owners in Norway 2014 (n = 1 721). Percent
10.3.5 Uncertainty of second hand value On average, 56% of the EV owners are worried about second hand value, but Tesla owners are slightly less worried, see figure 10.7.
57%9%9%10%
84%18%
46%
26%19%
22%31%
12%22%
22%
15%48%
47%40%
4%40%
23%
1%21%
20%19%
17%7%
3%
3%
0 % 10 % 20 % 30 % 40 % 50 % 60 % 70 % 80 % 90 % 100 %
N I S S A N L E A F
M I T S U B I S H I I - M I E V
P E U G E O T I O N
C I T R O Ë N C - Z E R O
T E S L A M O D E L S
O T H E R E V S
T O T A L
Big advantage Small advantage Neutral Small disadvantage Big disadvantage
36%25%
16%23%
80%24%
39%
36%41%
39%40%
14%26%
31%
26%31%
41%31%
6%35%
25%
1%4%5%6%
0%11%
3%
0%0%0%0%
4%
0 % 10 % 20 % 30 % 40 % 50 % 60 % 70 % 80 % 90 % 100 %
N I S S A N L E A FM I T S U B I S H I I - M I E V
P E U G E O T I O NC I T R O Ë N C - Z E R OT E S L A M O D E L S
O T H E R E V ST O T A L
Big advantage Small advantage Neutral Small disadvantage Big disadvantage
98 Copyright © Transportøkonomisk institutt, 2014 Denne publikasjonen er vernet i henhold til Åndsverkloven av 1961

Electric vehicles - environmental, economic and practical aspects
Figure 10.7 The owners opinion about the EVs second hand value by brand. EV owners in Norway 2014 (n = 1 721). Percent
10.3.6 Time to recharge the battery The time it takes to recharge the battery is rated least favourable by Nissan Leaf and Peugeot Ion owners, and highest by Tesla owners, but the differences are not large, as seen in figure 10.8. It is a bit surprising that Tesla owners do not experience challenges with charging the bigger battery, but they may have secured powerful charging at home. On longer trips, they have access to the world’s fastest fast charging stations (Tesla Super Chargers), charging at powers of 90-120 kW with other EVs limited to 50 kW. These super chargers were available on the main roads between the biggest cities in southern Norway at the time of the survey.
Figure 10.8 The owners opinion of the time it takes to charge the vehicles battery by brand. EV owners in Norway 2014 (n = 1 721). Percent
10.3.7 Heating system The heating system of the small Mitsubishis, Citroens and Peugeot is considered to be a disadvantage by most owners, see figure 10.9. Tesla owners on the other hand enjoy a heating system that is considered to be an advantage.
4%2%2%
37%33%33%
40%48%52%
41%
43%47%50%40%
41%31%
41%
18%18%16%
19%6%
15%15%
0 % 10 % 20 % 30 % 40 % 50 % 60 % 70 % 80 % 90 % 100 %
N I S S A N L E A F
M I T S U B I S H I I - M I E V
P E U G E O T I O N
C I T R O Ë N C - Z E R O
T E S L A M O D E L S
O T H E R E V S
T O T A L
Big advantage Small advantage Neutral Small disadvantage Big disadvantage
0%
0%
4%
2%
2%
2%
18%
30%
19%
23%
23%
26%
22%
56%
56%
61%
63%
60%
49%
56%
22%
13%
20%
13%
11%
21%
18%
0 % 10 % 20 % 30 % 40 % 50 % 60 % 70 % 80 % 90 % 100 %
N I S S A N L E A F
M I T S U B I S H I I - M I E V
P E U G E O T I O N
C I T R O Ë N C - Z E R O
T E S L A M O D E L S
O T H E R E V S
T O T A L
Big advantage Small advantage Neutral Small disadvantage Big disadvantage
Copyright © Transportøkonomisk institutt, 2014 99 Denne publikasjonen er vernet i henhold til Åndsverkloven av 1961

Electric vehicles - environmental, economic and practical aspects
Figure 10.9 The owners opinion about the vehicles heater by brand. EV owners in Norway 2014 (n = 1 721). Percent
10.3.8 Uncertainty about incentives The EV owners were also asked if the uncertainty pertaining to future incentives is a disadvantage or advantage, see figure 10.10. It appears that Tesla owners are less worried than other EV owners.
Figure 10.10 The owners opinion about the uncertainty of the future of the incentives by brand. EV owners in Norway 2014 (n = 1 721). Percent
10.4 Challenges with using EVs
The EV owners were asked about challenges experienced when using their EVs. In general, the EV owners were not indifferent to these issues. The “don’t know” alternative was rarely used, which indicates that all had a firm opinion on these matters.
10.4.1 Understanding instruments The first question was about understanding the instruments in the vehicle. It appears that very few had problems with this, see figure 10.11, but the instrumentation in Nissan Leaf seems to be more difficult than in other vehicles.
17%
51%
10%
21%
6%
4%
29%
20%
29%
17%
25%
15%
19%
36%
26%
50%
44%
46%
2%
25%
8%
26%
30%
33%
8%
0 % 10 % 20 % 30 % 40 % 50 % 60 % 70 % 80 % 90 % 100 %
N I S S A N L E A F
M I T S U B I S H I I - M I E V
P E U G E O T I O N
C I T R O Ë N C - Z E R O
T E S L A M O D E L S
O T H E R E V S
Big advantage Small advantageNeither advantage nor disadvantage Small disadvantageBig disadvantage
2%
25%
29%
17%
25%
38%
28%
28%
38%
32%
50%
37%
37%
38%
38%
33%
38%
30%
37%
20%
31%
31%
0 % 10 % 20 % 30 % 40 % 50 % 60 % 70 % 80 % 90 % 100 %
N I S S A N L E A F
M I T S U B I S H I I - M I E V
P E U G E O T I O N
C I T R O Ë N C - Z E R O
T E S L A M O D E L S
O T H E R E V S
T O T A L
Big advantage Small advantage Neutral Small disadvantage Big disadvantage
100 Copyright © Transportøkonomisk institutt, 2014 Denne publikasjonen er vernet i henhold til Åndsverkloven av 1961

Electric vehicles - environmental, economic and practical aspects
Figure 10.11 Problems with understanding the instrumentation in the vehicle by brand. EV owners in Norway 2014 (n = 1 721). Percent
10.4.2 Choosing the charging solution The next question was about challenges when choosing the charging solution for the vehicle, see figure 10.12. Tesla Model S stands out as the most problematic in this sense. This vehicle has a large battery and available charge power will be an issue for the owners. Tesla also offers various adapters for connection to different infrastructure. For the other vehicles it can be speculated that the issue was related to having to choose to install a wall box or use existing “Schuco” domestic sockets to charge at home.
Figure 10.12 Problems with choosing charging solution by brand. EV owners in Norway 2014 (n = 1 721). Percent
10.4.3 The EV performance in real traffic How the vehicle performed in real traffic was also surveyed. The first question was about shorter range than expected in general, see figure 10.13, the second about whether the vehicle performed worse in winter, see figure 10.14, and the third about whether EVs require more planning, see figure 10.15. The three questions are of course interrelated. The issues taken up in the first and the second question lead to the need for better planning, given that EVs have a range that is much more limited than other vehicles. The most striking difference between the vehicles, is that Tesla Model S to a large extent performs as expected, even in winter, whereas the other vehicles perform much worse, especially during winter time. Tesla Model S also has much longer range than the other vehicles, yet owners still say that the use of the vehicle requires more planning (implicitly compared to an ICE vehicle).
7%4%
5%
92%96%
98%98%99%
95%
1%0%0%0%0%0%
0 % 10 % 20 % 30 % 40 % 50 % 60 % 70 % 80 % 90 % 100 %
N I S S A N L E A F
M I T S U B I S H I I - M I E V
P E U G E O T I O N
C I T R O Ë N C - Z E R O
T E S L A M O D E L S
O T T H E R E V
Yes No Don't know
11%
5%
14%
10%
27%
7%
88%
94%
86%
90%
73%
93%
0 % 10 % 20 % 30 % 40 % 50 % 60 % 70 % 80 % 90 % 100 %
N I S S A N L E A F
M I T S U B I S H I I - M I E V
P E U G E O T I O N
C I T R O Ë N C - Z E R O
T E S L A M O D E L S
O T T H E R E V
Yes No Don't know
Copyright © Transportøkonomisk institutt, 2014 101 Denne publikasjonen er vernet i henhold til Åndsverkloven av 1961

Electric vehicles - environmental, economic and practical aspects
Figure 10.13 Problems with shorter range than expected by brand. EV owners in Norway 2014 (n = 1 721). Percent
Figure 10.14 Problems related to the EV performsing worse in winter by brand. EV owners in Norway 2014 (n = 1 721). Percent
The owners of other EVs are between the Tesla Model S and the other models, when it comes to how expectations of range and winter performance are met. Some of these are the very earliest buyers of EVs in Norway. They probably have more realistic expectations than other EV owners.
Figure 10.15. Perception of the EVs requiring more planning by brand. EV owners in Norway 2014 (n = 1 721). Percent
45%38%
47%42%
14%22%
52%60%
53%58%
85%75%
2%2%
2%
0 % 10 % 20 % 30 % 40 % 50 % 60 % 70 % 80 % 90 % 100 %
N I S S A N L E A F
M I T S U B I S H I I - M I E V
P E U G E O T I O N
C I T R O Ë N C - Z E R O
T E S L A M O D E L S
O T T H E R E V
Yes No Don't know
54%59%
70%58%
18%39%
43%39%
28%40%
79%59%
2%1%2%2%3%2%
0 % 10 % 20 % 30 % 40 % 50 % 60 % 70 % 80 % 90 % 100 %
N I S S A N L E A F
M I T S U B I S H I I - M I E V
P E U G E O T I O N
C I T R O Ë N C - Z E R O
T E S L A M O D E L S
O T H E R
Yes No Don't know
77%
67%
80%
65%
67%
61%
22%
33%
19%
33%
33%
39%
1%
0%
2%
2%
0%
0%
0 % 10 % 20 % 30 % 40 % 50 % 60 % 70 % 80 % 90 % 100 %
N I S S A N L E A F
M I T S U B I S H I I - M I E V
P E U G E O T I O N
C I T R O Ë N C - Z E R O
T E S L A M O D E L S
O T H E R E V
Yes No Don't know
102 Copyright © Transportøkonomisk institutt, 2014 Denne publikasjonen er vernet i henhold til Åndsverkloven av 1961

Electric vehicles - environmental, economic and practical aspects
10.5 EVs and user needs
As mentioned in chapter 1.4, the characteristics of an innovation is of course of utmost importance for success. Owners of EVs have definitely found enough advantages with these cars to buy them and also characteristics where they have relative advantages compared to ICE cars. Lower operating costs is a winner, but one can also find relatively high shares that appreciate the EVs special driving characteristics related to comfort and acceleration. There are also disadvantages, but these are rated by fewer respondents.
Especially interesting from a diffusion theory perspective is the fact that NAF members have an opposite rating, ie advantages are mentioned by less persons and disadvantages by more persons than is found with EV owners. Though the groups might not be directly commensurable, these difference are of such magnitude that they point to a need for further information on EV to possible buyers.
Copyright © Transportøkonomisk institutt, 2014 103 Denne publikasjonen er vernet i henhold til Åndsverkloven av 1961

Electric vehicles - environmental, economic and practical aspects
11 Future perspectives
11.1 From innovators to laggards - where is Norway?
The COMPETT surveys were intended to provide a basis for scenarios of future diffusion of EVs to be developed by COMPETTs WP5. This is done by two types of approaches:
• Establishing samples and subsamples for groups that constitute different “steps” of the diffusion acceptance/spread dimension.
• Including questions related to the different factors that can influence a diffusion process and elements of importance in the different communicative stages of the process, cf figure 1.3 in chapter 1.
In figure 11.1, the different groups that were studied are positioned in relation to Rogers’ (1962, 1995) scheme of roles in diffusion process, ie from innovators to laggards. This has been done on the basis of the actual EV-market share in Norway, the socio-demographic status of the groups, the groups’ attitudes and competence when it comes to EV technologies, and how many people the respondents in the groups know that have adopted or are positive to adopting EVs in the future.
Figure 11.1 Vehicle purchase groups in Norway and market share, according to Rogers diffusion theory (1965). Successive groups of consumers adopting EVs (blue line), market share of EVs in the total vehicle market (red line)
104 Copyright © Transportøkonomisk institutt, 2014 Denne publikasjonen er vernet i henhold til Åndsverkloven av 1961

Electric vehicles - environmental, economic and practical aspects
With successive groups of consumers adopting EVs (shown in blue), the market share (shown in red) will eventually reach the saturation level. It will probably take decades to reach the saturation level. The different groups are defined as follows:
• “Innovators” are estimated to be the group that have become EV only households in Norway. In the EV owner survey 25% of the respondents belonged to this group. Applying this share to the 13% EV market share in 2014 (January to May) gives 3% early users among the total purchasers of vehicles in Norway.
• “Early Adopters” are most likely to be the mixed EV/ICE households that own both EVs and ICEs. This group then constitutes 75% of the EV market, ie 10% of the total purchasers of vehicles in Norway in 2014.
• “Laggards” are not represented in the study as all the groups investigated are above average income groups. Laggards are in Rogers theory considered to be below average income groups and are representing 16% of the total market.
• The “Early Majority” can be thought of as being represented by the NAF members considering buying an EV, ie 30% of NAF members. In addition some persons answering “Don’t know” might end up as buyers as they in many characteristics and attitudes could be found between the consider and do not consider buying groups. If one distributes the persons in the “Don’t know” category following the 30%/42% pattern (share saying yes of no to consider an EV), then the Early Majority group will be 42% of the buyers not places in the Innovators/Early Adopters/Laggards groups. This equals 30% of the total vehicle market in Norway.
• The “Late Majority” is estimated to be the NAF owners not considering buying an EV, and the other half of the “Don’t know” category, ie 41% of total purchasers when deducting the other purchase groups from the total vehicle market in Norway.
This suggested positioning of the groups studied in COMPETT suggests a continuing positive diffusion process in Norway. Other important facts are related to the characteristics of the innovation, cf chapter 11.2 and the different supporting mechanisms, cf chapter 11.4.
11.2 Future buying plans
Norwegian EV owners are very positive to buying an EV again, 87% say they will do so, and the share is even higher in the Oslo-Kongsberg region. Less than 1% will not buy again, and the rest are undecided, see table 11.2. All EV owners are very positive regardless of the type of EV they own, with Tesla owners the most determined, see figure 11.2.
The figures on car-type faithfulness are much higher than found in earlier Norwegian studies (Figenbaum and Kolbenstvedt 2013). NAF members, having little experience and knowledge of EV, cf chapter 3.1, are more reluctant than EV owners. However, 30% considering to buy an EV in this group, cf chapter 9.1, is a big step forward in
Copyright © Transportøkonomisk institutt, 2014 105 Denne publikasjonen er vernet i henhold til Åndsverkloven av 1961

Electric vehicles - environmental, economic and practical aspects
the diffusion process. Even if it is well known that people do not necessarily act as they say – the figures outlines further possibilities for EV diffusion. Table 11.1 Willingness to buy an EV again (EV owners in Norway and Oslo-Kongsberg) and share among ordinary car owners (NAF members in Oslo-Kongsberg) who will consider buying an EV next time they buy a vehicle. Percent
EV owners Average Norway
EV owners Oslo-Kongsberg
NAF Oslo- Kongsberg
Number n 1 721 542 2 241
Will you buy an EV again
Yes 87% 91% NA
No 1% 0% NA
Don’t know 12% 9% NA
Will consider buying an EV next time
Yes NA NA 30%
No NA NA 42%
Don’t know NA NA 28%
Figure 11.2 Willingness to consider buying an EV again amongers in Norway 2014 (n = 1 721). Percent
The reasons they have for buying an EV again, see figure 11.3, are mostly financial, second comes environment. Other reasons are related to comfort and performance and the fact that the vehicles meet their needs. Some are also fascinated by the technology and consider EVs to be the future of motoring.
Relatively few mention the bus lane and parking incentives in particular. The latter is most important in the sense that they can get parking, the fact that it is free seems to be subordinate. Of course the cost element of free parking could be valued by those that list economy as a motivation in line with free toll-roads. Since only 1% would not buy an EV again it is no point in analysing the responses to why they will not do it.
85%
84%
91%
85%
95%
88%
87%
1%
2%
1%
14%
16%
9%
13%
5%
11%
12%
0 % 10 % 20 % 30 % 40 % 50 % 60 % 70 % 80 % 90 % 100 %
N I S S A N L E A F
M I T S U B I S H I I - M I E V
P E U G E O T I O N
C I T R O Ë N C - Z E R O
T E S L A M O D E L S
O T H E R
T O T A L
Yes No Don't know
106 Copyright © Transportøkonomisk institutt, 2014 Denne publikasjonen er vernet i henhold til Åndsverkloven av 1961

Electric vehicles - environmental, economic and practical aspects
Figure 11.3 The most important factor for buying an EV again. EV owners in Norway 2014 (n = 1 436, 285 blank). Percent
11.3 An effective communication process
Technological diffusion is a process taking place in a social system where communication is a crucial element to get knowledge of the new technology and on this basis make decisions of buying, cf figure 1.3. Key elements in a communication process are:
• How the new technology is perceived with respect to relative advantages and compatibility with user needs and societal norms.
• Observability and visibility, ie opportunity for trial and to experience the products complexity and possible challenges.
• By which “media” the message is communicated.
According to the answers to the survey, it is evident that most EV owners find the EV to be the best car for their needs, cf chapter 4.3, and also find that the new car matches their expectations. The possible range challenges are met by better planning, using other cars etc. and do not represent a big problem, cf chapter 6.4 and 10.3. Charging itself is not a problem. The EV is for many EV owners an answer to a social norm for more environmentally friendly travelling.
The importance of experiences and observability is clearly shown by the fact that those not having an EV have quite a different view of the new technology and definitely find it more challenging, cf chapter 9. This underline the importance of effective communication to get the diffusion process further.
It was also found that media and personal network had been the most effective information channels for current EV owners, cf chapter 4. Looking at the future, it is thus very promising that the EV owners positivity extends into their social network. They were asked if they have friends or family that have bought or will buy EVs as a result of their own experience with EVs. The results are in accordance with diffusion theory (cf Rogers 1995, Axzen and Kurani 2012) and illustrate ways of EV penetration into Norway, 36% having friends that have bought, 38% friends that consider buying, see figure 11.4. It should also be mentioned that NAF members themselves considering to buy an EV knows many that have bought or considers buying an EV, cf chapter 9.
64%
39%
25%
10%
15%
8%
0% 10% 20% 30% 40% 50% 60% 70% 80% 90% 100%
E C O N O M I C M O T I V A T I O N , I N C L F R E E T O L L S
E N V I R O N M E N T
B E S T C A R M Y N E E D S , H A P P Y , C O M F O R T
P E R F O R M A N C E
T E C H N O L O G Y , F U T U R E
B U S L A N E , F R E E P A R K I N G
Copyright © Transportøkonomisk institutt, 2014 107 Denne publikasjonen er vernet i henhold til Åndsverkloven av 1961

Electric vehicles - environmental, economic and practical aspects
Figure 11.4 Share of EV owners having friends or family having bought or considering buying an EV as a result of the EV owners sharing their experience, by brand. EV owners in Norway 2014 (n = 1 721). Percent
11.4 Environmental aspects EVs in Norway on average drive 14 000-15 000 km/year, a driving length for EVs with the latest technology at the same level as for new ICE vehicles. 81% of EVs are driven daily, another 16% 3-5 days per week, i.e. they are tools in everyday transport activities. Compared to cars used by NAF members, EVs are more frequently used for trips to and from and at work, for shopping, for visits, for escorting children and for leisure activities, and less for vacations. This can be explained by socio-demographic differences between the groups, and that the range of most EVs makes them unsuitable for vacation trips.
69% of EVs purchased replaced another vehicle, 28% became additional cars in the households and 3% were bought as a first vehicle. The smallest EVs were more likely to become additional vehicles, while the Tesla Model S replaced an existing vehicle in 86% of households. 94% of the replaced vehicles were ICEs. 62% of households did not change the total household vehicle insurances driving distance when buying the EV, 18% increased it, while 6% decreased it, while the rest had owned the car less than a year or did not know it. The majority did not change their modal split, after buying the EV, and among the rest, both increased and decreased use of different transport modes are found.
From an environmental perspective, it is evident that replacing ICE vehicles with EVs (BEVs of PHEVs) is beneficial, due to more effective propulsion and less noise. The effects on climate will, however, be influenced by use of CO2 in the energy and battery production. When it comes to the local environment, EVs take up the same amount of space, but EVs emit less local pollutants than fossil fuel cars, though some newer ICE vehicles may be more or less like EVs.
It is thus of importance to develop the incentives in such a way that possible rebound effects could be eliminated and different types of environmental effects can be managed.
34%37%
31%37%
42%37%36%
39%32%
30%37%
47%35%38%
14%14%
25%17%
5%13%
13%
14%17%14%
10%6%
15%13%
0 % 10 % 20 % 30 % 40 % 50 % 60 % 70 % 80 % 90 % 100 %
N I S S A N L E A F
M I T S U B I S H I I - M I E V
P E U G E O T I O N
C I T R O Ë N C - Z E R O
T E S L A M O D E L S
O T H E R E V S
T O T A L
Yes, have bought Yes, consider buying No Don't know
108 Copyright © Transportøkonomisk institutt, 2014 Denne publikasjonen er vernet i henhold til Åndsverkloven av 1961

Electric vehicles - environmental, economic and practical aspects
11.5 Prerequisites for further diffusion
The positive attitudes and experiences among Norwegian EV owners, and the high rate of potential EV byers among NAF members, is not strange given all the incentives at national and local levels that Norway has developed the last decades, cf appendix 1 and chapter 7. These incentives has supported and framed the EV diffusion in many ways:
• Elimination of crucial barriers like initially high prices and range problems by supporting establishment of an adequate charging infrastructure.
• Providing EV owners with relative advantages compared to ICEs, like free parking and charging, using the bus lane to save time in larger cities rush hours.
• Public support to NGOs that can give EV owners and buyers relevant information on EVs, prices, charging points and also supply media with material.
• Paving the way for transport behaviour compatible with the society’s norm of environmental sustainability, among socio-demographic groups that normally function as role models for others.
• Demonstrating practical evidence on the possibility to match practical user need with environmental innovation.
In addition a massive flow of information in media has prepared and followed the diffusion of EVs. The importance of which is seen by the fact that 77% got information from media before buying their EV car.
The very key questions looking at the future of electromobility in Norway are:
• What will happen with the incentives, will they be taken away or changed? • Can they be developed to avoid environmental rebound effects? • How will such changes be communicated? • Which time frames will be given for adaption?
Answers to such questions are of great importance for the future EV proliferation in Norway and will be investigated in the COMPETT project using stakeholder interviews to find out what strategic paths authorities at different levels as well as industrial and others important actors, are working along.
What is known for the time being from the Parliament’s Climate Policy Settlement from 2012, and the recently accepted National Transport Plan (2014 - 2023), is that no major changes will be made until 2017, or until the number of EVs in Norway reach 50 000, ie 2% of the total fleet of passenger vehicles. What happens after this is up for discussion. Local incentives such as bus-lane access could be changed before this time if special problems occur and local and central authorities agree. The Ministry of Finance in the summer of 2014 started a process of reviewing the tax and incentive structure for all types of vehicle technologies.
Copyright © Transportøkonomisk institutt, 2014 109 Denne publikasjonen er vernet i henhold til Åndsverkloven av 1961

Electric vehicles - environmental, economic and practical aspects
12 References
ACEA 2013 Overview of Purchase and tax incentives for Electric vehicles in EU. European Automobile Manufacturers Association (ACEA). 4.4.2013. www.asea.be.
Anegawa, T undated Development of Quick recharging system for Electric vehicle. Tokyo Electric power company.
Asphjell, A, Asphjell, Ø and Kvisle HH 2013 Elbil på norsk 2013. ISBN 978-82-7704-142-1. Trondheim, Transnova.
Assum, T et al 2012 Competitive Electric Town Transport, COMPETT. Proposal to the EU, ERA-Net + Electromobility. Transportøkonomisk institutt, Austrian Energy Agency, Vejdirektoratet Denmark.
Axsen, J and Kurani, KS 2011 Interpersonal influence in the early plug-in hybrid market: Observing social interactions with an exploratory multi-method approach. Transportation Research Part D 16 (2011) 150-159.
Axsen, J and Kurani, KS 2012 Inter-personal influence within car buyer’s social networks: applying five perspectives to plug-in hybrid vehicle drivers. Environment and Planning A, 44,5, 1047-1065.
Axsen, J and Kurani, KS 2013 Developing sustainability oriented values: Insights from households in a trial of plug-in hybrid electric vehicles. Global Environmental Change (2013) 70-80.
Browne, D, O’Mahony, M and Caulfield, B 2012 How should barriers to alternative fuels and vehicles be classified and potential policies to promote innovative technologies be evaluated?, Journal of Cleaner Production 35 (2012) 140-151.
Burgess, M et al 2013 Electric vehicle drivers reported interactions with the public: Driving stereotype change?. Transportation Research Part F 17 (2013) 33-44.
Campbell, AR, Ryley, T and Thring, R 2012 Identifying the early adopters of alternative fuel vehicles: A case study of Birmingham, United Kingdom. Transportation Research Part A, 46, 1318-1327.
Climate policy settlement 2012 Innst. 390 S (2011-2012) To the Norwegian parliament from the Energy- and environment committee.
Climate Proposition 2012 Norwegian Climate Policy. Meld. St. Nr. 21 (2011-2012).
110 Copyright © Transportøkonomisk institutt, 2014 Denne publikasjonen er vernet i henhold til Åndsverkloven av 1961

Electric vehicles - environmental, economic and practical aspects
Daziano, RA 2013 Conditional-logit Bayes estimators for consumer evaluation of electric vehicle driving range. Resource and Energy Economics 35 (2013) 429-450.
Dimitropoulos, A, Rietveld, P and van Ommeren, JN 2011 Consumer Valuation of Driving range: A Meta-Analysis, Tinbergen Institute Discussion Paper, TI 2011-133/3,VU University Amsterdam.
Econ Analyse 2006 Elbileiernes reisevaner (Travel behaviour of EV owners). Rapport 2006-040. Oslo, Econ.
Egbue, O and Long, S 2012 Barriers to widespread adoption of electric vehicles: An analysis of consumer attitudes and perceptions. Energy Policy 48 (2012) 717-729.
Emmerling, B 2014 Austrian survey on use of EV. Austrian Energy Agency. Work in progress.
Electric Vehicles Initiative (EVI) 2013 Global EV Outlook. Understanding the Electric Vehicle Landscape to 2020. Aptil, 2013, Clean Energy Ministerial.org/EVI and International Energy Agency IEA.org/Topics/Transport/ElectricVehiclesInitiativ.
EV project 2013 Q1 2013 report, The EV project. http://www.theevproject.com/cmsassets/documents/11377-646795.q1-2013-rpt.pdf.
Figenbaum, E 2014 Scenario framework. COMPETT WP 4, task 1. Coming TØI report.
Figenbaum, E and Kolbenstvedt, M 2013 Electromobility in Norway - experiences and opportunities with Electric vehicles. TØI report 1281/2013. Oslo, Transportøkonomisk institutt.
Figenbaum, E, Eskeland, GS, Leonardsen, J and Hagman, R 2013 85g pr kilometer i 2010. Er det mulig? TØI rapport 1264/2013. Oslo, Transportøkonomisk institutt.
Fjellinjen 2013 Statistics on vehicles passing Oslo and Bærum toll gates May 2011 to July 2013. E-mail from Fjellinjen, courtesy of Christensen, H.F., 20.08.2013.
Fjellinjen 2014 Statistics on vehicles passing Oslo and Bærum toll gates January 2013 to April 2014. E-mail from Fjellinjen, courtesy of Frantzvåg, O.C., 17.06.2014.
Franke, T et al 2012 Enhancing sustainability of electric vehicles: A field study approach to understanding user acceptance and behavior. In Sullman, M., Dorn. L. (Eds.). Advances in Traffic Psychology. Farnham, UK: Ashgate.
Franke, T and Krems, JF 2012 Interacting with limited mobility resources: Psychological range levels in electric vehicle use. Transportations Research Part A 48 (2013) 109-122
Fridstrøm, L 2014 Data from BIG vehicle penetration model 2014. Internal TØI model, from which some results can be fine in Fridstrøm and Alfsen 2014.
Copyright © Transportøkonomisk institutt, 2014 111 Denne publikasjonen er vernet i henhold til Åndsverkloven av 1961

Electric vehicles - environmental, economic and practical aspects
Fridstrøm, L and Alfsen, K red 2014 Norways path to sustainable transport. TØI Report 1321/2014. Oslo, Institute of transport economic and CICERO, Centre of climate research. (Norwegian language).
Graham-Rowe, E, Gardner, B, Abraham, C, Skippon, S., Dittmar, H, Hutchins, R and Stannard, J 2012 Mainstream consumers driving plug-in battery-electric and plug-in hybrid electric cars: A qualitative analysis of responses and evaluations. Transportation Research Part A , 46, 140-153.
Hagman, R, Assum, T and Amundsen, A 2011 Strøm til biler (Electriciy for car). TØI Report 1160/2011. Oslo, Transportøkonomisk institutt.
Hagman, R and Assum, T 2012 Plug-in Hybrid vehicles. Exhaust emissions and user barriers for a Plug-in Toyota Prius. TØI Report 1226/2012. Oslo, Transportøkonomisk institutt.
Haugneland, P 2012 Medlemsundersøkelse elbilforeningen august 2012. Foredrag på WEVS 2013, 14 - 15th May. Oslo, Norsk elbilforening (www.elbil.no, 4. sept. 2012).
Halsør, TS Myklebust, B and Andreassen, GL 2010 Norges satsing på Elbiler, hydrogenbiler og ladbare hybrider. Oslo, Zero, Tekna.
Hidrue, MK et al 2011 Willingness to pay for electric vehicles and their attributes. Resource and Energy Economics 33 (2011) 686-705.
Hjorthol, R 2013 Attitudes, ownership and use of Electric Vehicles - a review of literature. TØI Report 1261/2013. COMPETT, Work Package 2 Report. Transportøkonomisk institutt, Austrian Energy Agency, Vejdirektoratet Denmark.
Hjorthol, R, Vågane, L and Emmerling, B and Foller, J 2013 Potential use of Electric Vehicles TØI Report xxxx/2014 forthcoming. COMPETT, Work Package 2 Report. Transportøkonomisk institutt, Austrian Energy Agency, Vejdirektoratet Denmark.
Jacobsen, S and Bergek, A 2011 Innovation system analysis and sustainability transitions: Contributions and suggestions for research. Environmental Innovation and Societal Transitions, 1(1), 41-57.
Jensen, AF et al 2013 On the stability of preferences an attitudes before and after experiencing a electric vehicle. Transportation Research Part D25 (2013), 24 -32.
Karlsson, S and Kullingsjø, L-H 2013 GPS measurement of Swedish car movements for assessment of possible electrification. IN: Proceedings to EVS, Barcelona Nov 17-20, 2013. Chalmers, section of energy and environment. Gotheburg.
Kahn, M and Kockelman, KM 2012 Predicting the market potential of plug-in electric vehicles using multiday GPS data. Energy Policy 46 (2012) 225-233.
112 Copyright © Transportøkonomisk institutt, 2014 Denne publikasjonen er vernet i henhold til Åndsverkloven av 1961

Electric vehicles - environmental, economic and practical aspects
Lieven, T et al 2011 Who will buy electric cars? An empirical study in Germany. Transportation Research Part D16 (2011), 236 -243.
Michelin 2013 Survey on deck and caruse. Data from PFM Research, Michelin Nordic, Oslo.
Ministry of Petroleum and Energy 2013 Energi og vannressurser i Norge, Fakta 2013.
Ministry of Transport 2013 National Transport Plan (2014 - 2023).
NAF 2012 Gallup undersøkelser blant 1640 NAF-medlemmer 2012. Internal material.
OFV AS 2012 Kjøretøy og samfunn 2012. Opplysningsrådet for vegtrafikken.
Pearre, N S et al 2011 Electric vehicles: How much battery life range is required for a day´s driving?, Transportation Research Part C 19 (2011) 1171-1184.
Pierre, M, Jemelin, C and Louvet, N 2011 Driving an electric vehicle. A sociological analysis on pioneer users. Energy Efficiency, 4, 511-522.
PROSAM 2012 Fremkommelighetsundersøkelser for bil i Oslo og Akershus 2011-2012. Prosam rapport 200, Oslo kommune, Bymiljøetaten, og Statens vegvesen Region øst, Desember 2012.
Rogers, EM 1962 Diffusion of Innovations. ISBN 0-612-62843-4. Glencoe Free Press.
Rogers, EM 1995 Diffusion of Innovations. ISBN 0-7432-2209-1. New York, Free Press.
Saarenpää, J et al 2013 Geodemographic analysis and estimation of early plug-in hybrid electric vehicle adoption. Applied Energy 107 (2013) 456-464.
Schroeder, A and Traber, T 2012 The economics of fast charging infrastructure for electric vehicles. Energy Policy 43 (2012) 136-144.
Schuitema, G, Anable, J, Skippon, S and Kinnear, N 2013 The role of instrumental, hedonic and symbolic attributes in the intention to adopt electric vehicles. Transportations Research Part A 48 (2013) 39-49.
Skavhaug, G K 2013 Elbil og dekning av transportbehov. Spørreundersøkelse for Transnova. Rapport 05.09.2013. Trondheim, Sentio Research AS.
SSB 2011 Population and housing census from 2011, Statistics Norway.
Tamor, MA et al 2013 A statistical approach to estimating the acceptance of electric vehicles and electrification of personal transportation. Transport Research Part C 26 (2013) 125-134.
Copyright © Transportøkonomisk institutt, 2014 113 Denne publikasjonen er vernet i henhold til Åndsverkloven av 1961

Electric vehicles - environmental, economic and practical aspects
Thune-Larsen, H, Viesten, K, Rødseth, KL, Klæboe, R 2014 External Marginal Costs of Road Traffic. TØI report 1307/2014. Oslo, Transportøkonomisk institutt. (Norwegian language). In print.
van den Bergh, J C, Truffer, B, and Kallis, G 2011 Environmental innovation and societal transitions: Introduction and overview. Environmental Innovation and Societal Transitions, 1(1), 1-23.
Vågane, L, Brechan, I and Hjorthol, R 2011 Den nasjonale reisevaneundersøkelse 2009 - nøkkelrapport, TØI rapport 1130/2011. Oslo, Transportøkonomisk institutt.
Vågane, L, Hjorthol, R, Brechan, I, Denstadli, J M and Fyhri, A 2012 Reisevaneundersøkelsen 2009 - Faktaark. Oslo, Transportøkonomisk institutt.
Vågane, L 2014 Den nasjonale reisevaneundersøkelse 2009 - Egne kjøringer for reiselengder flerbileiere 2013. Oslo, Transportøkonomisk institutt.
Zelenkova, N 2013 What are the motives for Owning an Electrical Car for an Individual in Oslo? SUM Dissertations Theses. Oslo, Center for Utvikling og Miljø, Univ. i Oslo.
Zubaryeva, A et al 2012a Assessing factors for the identification of potential lead markets for electrified vehicles in Europe: expert opinion elicitation. Technological Forecasting & Social Change 79 (2012) 1622-1637.
Zubaryeva, A et al 2012b Spatial multi-criteria assessment of potential lead markets for electrified vehicles in Europe. Transportation Research Part A 46 (2012) 1477-1489.
114 Copyright © Transportøkonomisk institutt, 2014 Denne publikasjonen er vernet i henhold til Åndsverkloven av 1961

Electric vehicles - environmental, economic and practical aspects
Appendix I: Overview Norwegian EV-incentives and market
EV Incentives Figenbaum and Kolbenstvedt (2013) concludes that the Norwegian EV policy, with its many incentives, long history and the establishment of Transnova, a government body giving financial support to the establishment of public charging facilities, have reduced the barriers for E-mobility and made it possible for consumers to buy EVs. Norwegians were ready to buy EVs when the big automakers launched their models in the Norway from 2011.
For readers not familiar with the EV situation in Norway it may be beneficial to provide a brief overview of the EV market and history, see table V.I.1.
Table V.I.1 EV incentives in Norway. Source: Figenbaum and Kolbenstvedt (2013) Incentive Introduced Importance Evaluation
VAT exemption when buying EVs
2001 ++ EV's are more expensive to produce than traditional vehicles causing VAT to be higher. A 12 500 € price increase of the vehicle results in a 3125 € increase in VAT making the vehicle 15 625 € more expensive to the consumer. This would actually increase government income unless the VAT is exempted. The Exemption in Norway has evened out the price difference between EV's and conventional cars.
Access to bus lanes
2003/2005 ++ Very efficient in regions with large rush-hour delays in the traffic. The disadvantage is that only a limited number of vehicles can use the bus lane before buses are delayed. There is a risk of increased vehicle ownership if people drive an EV in the bus lane rather than taking the bus. Minibuses were banned from the bus lanes in 2009, leaving EV's as the only vehicle type consumers can buy to get access to bus lanes.
Exemption from registration tax
1990/1996 + The exemption from the registration tax was introduced temporarily in 1990, and permanently from 1996. It was based on the value of the car and the exemption was very important to initiate test programs in the 1990s. Today this tax is totally changed and most EV's with a weight below about 1540 kg would anyway get a zero tax, given the way the tax system works. Examples of tax on gasoline vehicles: VW Up: 2 600 -3 600 €. VW Golf typical taxes: 5 600-9 400 €. The tax on these competing vehicles makes the EV's more competitive.
Free parking 1999 + Effective where parking space is limited. A limited number of places are available and many have a time limit. Little influence on the total number of EV's unless parking spaces are converted to EV parking on a larger scale.
Free toll roads 1997 ++ This measure has a large impact when the toll roads are expensive. This is the case many places in Norway. In the Oslo-area the costs are 600-1 000 €/year for commuters. Some places in Norway there are tolls exceeding 2 500 €/year, resulting in EV sales in unexpected areas such as small Islands with underwater tunnels to the mainland.
Reduced annual vehicle license fee
1996/2004 + Three rates apply for private cars. EV's and hydrogen vehicles have the lowest rate of 52 € (2013-figures). Conventional vehicle rates: 360-420 €.
Reduced rates on ferries
2009 0 Not important up to now, few use it and the value of the incentive is limited.
Reduced imposed taxable benefit on company cars
2000 0 This incentive had little impact up to 2012 but might be more important from 2013 for the sales of Tesla Model S. This should be an attractive company car, given its long range and the free of charge supercharger network put in place by Tesla in Norway.
Financial support for charging stations
2009 + Reduce the economic risk for investors establishing charging stations, and the range issue for EV owners is alleviated as they can charge the vehicles during a longer trip. Contributes to expansion of the EV market, and aids in get more EV miles out of every EV. The EV alternative becomes more visible to the population.
Fast charge stations
2011 + Fast charging increases the EV miles driven and the total EV market. It becomes easier for fleets to use EV's and is a premise for using EV's as Taxis.
Reserved EL number plates
1999 + Increases visibility and makes other incentives easier to control, i.e. free parking, exemption from toll road charges.
The exemption from toll-roads is a very powerful incentive in Norway, as there are toll-roads on a large number of main roads between cities and many cities have toll rings around their outer perimeter. The cost to the commuters varies from 3 000 NOK per year to over 30 000
Copyright © Transportøkonomisk institutt, 2014 115 Denne publikasjonen er vernet i henhold til Åndsverkloven av 1961

Electric vehicles - environmental, economic and practical aspects
NOK per year in more extreme cases. The answers in the survey must be understood in this context. Figure V.I.1 shows a map of all toll-roads in Norway where EVs are exempted. Note that some ferries have “road tolls” to finance a future road to replace the ferry.
Figure V.I.1 Toll-roads in Norway. Source: The Norwegian Public roads administration Based on the user surveys that have been conducted, it seems likely that EV drivers will continue to use EVs in the future. It seems that range is less of an issue for the existing drivers than expected. Most daily trips are within the range capability of modern EVs. Modifying the extensive Norwegian EV owners as E-mobility enters the market expansion phase will however be a major challenge.
When EV owners answers questions about how they use the EV and how satisfied they are with the EV, it is the combined experience of E-mobility they are sharing. That includes the pleasures of using local incentives, such as the free toll-roads, driving in the bus lane and parking free of charge, as well as the impression they have of the EV itself. It is not possible to know exactly how much each factor weighs in on the total satisfaction they have with E-mobility, but the survey of the EV owners has been designed to capture their attitudes to, and use of, local incentives.
Tests of EVs started in the early 1990s and from the mid-1990s the small Kewet EV was marketed together with a few Citroën EVs. The development of the early EV incentives focused on removing barriers to adoption and making the expensive first few vehicles possible to buy. A Norwegian company, Think, developed and started marketing the Think City in the year 2000. Think was by then owned by Ford Motor company. More industry initiatives commenced in the area Grenland south of Oslo and Kewet became a Norwegian made EV. This prompted politicians to expand the incentives and the market started slowly growing from the year 2000 to 2010, mostly with domestic production. The Evolvement of the EV fleet is shown in figure V.I.2 and V.I.3. The market boom from 2010 when the regular car makers started selling EVs is clearly seen.
116 Copyright © Transportøkonomisk institutt, 2014 Denne publikasjonen er vernet i henhold til Åndsverkloven av 1961

Electric vehicles - environmental, economic and practical aspects
Figure V.I.2 Evolvement of EV fleet in Norway 1997-2013. Sources: Asphjell et al (2013) and Norwegian public roads administration
Figure V.1.3 EV passenger car monthly market share 2010-2014. Source: OFVAS The long EV history in Norway may have had an impact on the EV market after 2010 as more than 3 000 Norwegians were EV owners already in 2010. From around 2009 the focus of the EV policy is mostly on the environmental benefits of taking EVs into use, as the earlier Norwegian industrial initiatives faded out. In late 2013 and early 2014, the EV models Nissan Leaf and Tesla Model S have been among the top selling vehicles in Norway, even topping the sales charts some months. In April 2014 the number of EVs in the fleet was about 25 000. More in depth information on the Norwegian EV story can be found in Figenbaum and Kolbenstvedt (2013).
0
5000
10000
15000
20000
25000
1997
1998
1999
2000
2001
2002
2003
2004
2005
2006
2007
2008
2009
2010
2011
2012
2013
Num
ber o
f veh
icle
s in
fleet
Think Buddy/Kewet Peugeot Citroën RenaultMitsubishi Nissan Tesla Ford Reva
0,0 %
5,0 %
10,0 %
15,0 %
20,0 %
25,0 %
1 3 5 7 9 11 1 3 5 7 9 11 1 3 5 7 9 11 1 3 5 7 9 11 1 3 5 7 9 11
2010 2011 2012 2013 2014
EV market share total market
Copyright © Transportøkonomisk institutt, 2014 117 Denne publikasjonen er vernet i henhold til Åndsverkloven av 1961

Electric vehicles - environmental, economic and practical aspects
Appendix II: Earlier studies of use and users
Elements where some data exist The literature studies provide data on several key elements (in italic below) in Rogers (1995) theory of diffusion of innovations, cf figure 1:
• Data on previous practise shows that most EV users, earlier used an ICE car. Some studies show that the EV replaced previous trips by public transport. The studies show that the EV trips in general replace trips with ICE-vehicles but also in some cases public transport. This is especially typical for Norway where there are many favourable incentives.
• Questions on advantages with EVs give a picture of the degree to which the innovation responds to felt needs and problems.
• Concerning the innovativeness of EVs, questions on challenges with the technology can illuminate parts of the theme. Additional technical data is necessary to catch the possibility to change and modify the new technology.
• The norms of the social system is not explicitly studied in the referred works. But the studies give data on the users’ evaluation of incentives offered to support electromobility, and thus of some aspect of norms and values.
• User characteristics are definitely a part of the surveys. Early EV adopters differ from other groups when it comes to age, sex, education level, income, living area and number of cars. The early adopters of EVs are middle aged men, 30-50 years (PHEVs 40-60 years), have high education and income, live in urban areas and belong to households with more than one car.
• Evaluations of characteristics of the innovation are also given, and connected to this also of adoption and rejection in the future.
Aspects that are not covered Some aspects that have not been sufficiently covered in earlier surveys with private EV users and potential EV users are:
• Their actual travel habits (km length, purpose, modes, chains etc.) before and after EV-purchase; crucial information when considering the potential of different types of EVs.
• What transport mode different users would have chosen if they had not bought an EV or if incentives were changed.
• Differences between owners of different brands. • The communication behaviour and channels used for information among groups of
users and possible buyers in different phases.
Review of EV-use in everyday life As a part of WP2, COMPETT has made a literature review of EV-use in everyday life (Hjorthol 2013), and analysed daily travel patterns using data form the Norwegian National Travel Survey (Vågane 2014).
The main findings from the report on attitudes, ownership and use of EVs in Hjorthol (2013) are:
• Early adopters of EVs are middle aged, between 30 and 50 years of age. A majority are men, they have high education and income, live in the vicinity of cities and belong to households with more than one car.
• Early adopters of HEVs are also men, in the age range 50-60 years old. • Travelling from one’s home to the place of work is the most often cited reason for
buying and using EVs in most countries.
118 Copyright © Transportøkonomisk institutt, 2014 Denne publikasjonen er vernet i henhold til Åndsverkloven av 1961

Electric vehicles - environmental, economic and practical aspects
• Drivers have to make adjustments when driving an EV, i.e better planning of journeys - due to battery limitations leading to range issues - and adopt a smooth driving style.
• Motives behind the purchase are the special regulatory advantages (such as in Norway), environmental considerations, lower operation costs and simply the convenience and fun it is to drive these vehicles.
• This is especially the case in Norway where favourable incentives include: no VAT, free parking, permitted driving in bus lanes, free driving on toll-roads, reduced annual road tax and reduced tax on company cars, cf appendix I.
• Negative aspects of the EV mentioned in many studies are range and battery charging. “Range anxiety”, ie the fear of being stranded due to a depleted battery, is not uncommon. Size, price, safety and distrust of the technology are also mentioned as negative factors.
• Praiseworthy aspects of the EV found in several studies are, that it is environmentally friendly, easy to park, low on noise, have a positive image and can be economically advantageous.
Figenbaum and Kolbenstvedts (2013) review of Norwegian history, incentives and experiences and behavioural adaption related to electromobility, showed the same pattern of pro’s and con’s and the same socio-demographic characteristics of EV owners. And so does the Austrian COMPETT survey (Emmerling 2014). These earlier works, however, does not mean that sufficient knowledge of EV owners attitudes and experiences is available. On the contrary, they provide a good basis to follow changes in these aspects as the vehicles range, comfort and safety develops. So questions on all these aspects should also be included in the COMPETT surveys.
From an environmental perspective it is especially important to establish more knowledge on the travel habits for EV owners before they got their EV. On this theme there are large differences between the studies. Hjorthol (2013) finds that: “Some studies show that EV drivers are, for the most part, former public transport commuters.” while Figenbaum and Kolbenstvedt (2013) found that the percentage of earlier public transport users that bought an EV decreased from 20% in 2009 to 10% in 2012. It’s important to find out what people would have done if they hadn’t bought an EV. Had they continued as public transport user or had they bought an ICE car?
Basis for regional scenarios - a literature review A literature review was done in COMPETT WP4 to identify factors that are essential to cover in the regional analysis and surveys (Figenbaum 2014). The literature review of EV owner studies reported in the previous chapter was done separately and the two surveys are partly overlapping. The review resulted in a set of questions that should be included in the owner survey. These are presented below. For each new theme only additional questions are shown, not questions that have already been presented under another theme. The here listed studies is not meant to be an exhaustive list, but selected since they give relevant input on which questions should be focused in the surveys of users and non-users.
Data logging of how vehicles are used Studies of how vehicles are used employing data-loggers following vehicles over time (weeks, months or a year), Pearre et al (2011), Kahn and Kockelman (2012), Tamor et al (2013) and Karlsson and Kullingsjø (2013), show how varied vehicle usage is, and the spread of usage patterns. The main conclusion from these studies is that single car households, when buying EVs with limited range, need to have an alternative means to get their long haul transport done. All drivers occasionally drive long distances but a small percentage of drivers do this only a few times per year and could more easily adapt by renting or loaning long range vehicles, than those that do these trips more often. In multicar households the ability to pool the vehicles could largely solve the issue of limited range, as the household members can use
Copyright © Transportøkonomisk institutt, 2014 119 Denne publikasjonen er vernet i henhold til Åndsverkloven av 1961

Electric vehicles - environmental, economic and practical aspects
the ICE vehicle whenever the EV range is too short. Of course an issue could still occur if more than one person in the household needs to go on a long trip.
The ability to charge on the go, while making a break could be a means to reduce the number of days where the range is insufficient and should does be addressed in the survey.
The ability to utilize the vehicle’s range is also of importance according to Franke et al (2012) and Franke and Krems (2012), who found that users in general do not utilize more than about 75-80% of total range available.
Questions to be included in the owner survey: 1. How many vehicles, driving licences and persons are there in the household? 2. How do the user cope with situations when the EVs range is too short? 3. How often do the user use different types of charging infrastructure at various
locations? 4. How much of the vehicles range is the user comfortable with utilizing? 5. What range do the user take into account when planning a trip?
Studies of how EVs are perceived Experience with EVs is a crucial factor in the EV diffusion process, and interpersonal influence is an important information source. Those that do not have knowledge of or experience with EVs, are sceptical and have stereotypical views of how EVs are and perform (Burgess et al 2013). Those that get information from people that are very close to them (friends, family), or those that get information from people with a lot of experience, are more influenced by the information they receive than others (Axsen and Kurani 2011).
Questions to be included in the owner survey: 1. Where did the user first get the information that made him/her consider buying an
EV? 2. Do the user have friends or family that have bought or will buy EVs as a result of
the user having bought one? 3. Various questions about the perception of EV technology, their safety, range, charge
times etc. and how EVs function.
Questions in the non-owner survey: 1. Do the user have friends or family that have bought an EV? 2. Various questions about the perception of EV technology, their safety, range, charge
times etc. and how EVs function.
The annual driving distance of EVs Little or no data exist on how much EVs are driven each year. Older data from Norway (Econ 2006) indicated a driving length of EVs in 2006 of 10 400 km for privately owned EVs in Norway and about 7 600 km for those owned by companies. New data from the US, The EV project (2013), shows that Nissan Leafs on average are driven about 11 500 km per year.
Questions to be included in the owner survey: 1. What annual driving distance is the EV insured for? 2. What is the odometer reading of the EV now, and what was the date of first time
registration of the vehicle?
Surveys of prospective buyers The likelihood of single car households buying EVs, except some innovators, is low unless the range is comparable to ICE vehicles, or the sum of the incentives makes up for both the cost consumers put on the reduced range and the added cost of the vehicles, according to Dimitropoulos et al (2011). Consumers are myopic, ie the only take into account energy cost saving the first 3-5 years.
120 Copyright © Transportøkonomisk institutt, 2014 Denne publikasjonen er vernet i henhold til Åndsverkloven av 1961

Electric vehicles - environmental, economic and practical aspects
The pleasure of driving and the symbolic features of EVs are important factors for early adopters, more so when considering EVs for primary vehicles according to Schuitema et al (2013). Pro-environment identity can be enough to generate a positive perception of EVs.
Daziano (2013) found that HEVs can be a competitor to EVs. When consumers compare EVs to HEVs, they want more range from the EV than when they compare with regular ICE vehicles.
Hidrue et al (2011) investigated what consumers are willing to pay extra to get EVs with higher acceleration, longer range, shorter charge times and the value they put on the benefit of lower pollution. The latter proved to have the lowest willingness to pay.
Egbue and Long (2012) found that range and cost was on top of the concern list among students and staff at a technological university, when considering EVs.
Lieven et al (2010) found that the range expectation could best be met in the mini/micro car segment, but the price sensitivity is very large in this segment. The segments with the second lowest range expectation is the sports car /SUV segment, where performance is much more important.
Jensen et al (2013) found that the willingness to pay for extra range increased when testing EVs in Danish households. They also found that consumers like the low running cost after having the experience of driving an EV. The attitude to pay for carbon emission reduction was not altered by the test. Top speed must be adequate for the market and availability of charging infrastructure is important.
Graham-Rove et al (2011) found that low running costs was important for people testing EVs, but they were sceptical to this advantage being enough to compensate the higher purchase cost. They also found that EV owners would preserve range by shutting off heaters, stereos etc. to increase range, lowering the perceived quality of the ride.
Questions to be included in the owner survey: 1. How often do the user use the different types of incentives; bus lane, free toll-road,
free parking, charging stations? 2. How important are different types of incentives; toll-road, bus lane, free parking,
lower taxes, free ferries etc? 3. How important is low running costs? 4. What is the users level of interest and competence when it comes to vehicle
technologies? 5. Is the user member of an environmental organization? 6. What were the factors that were important when buying the EV? 7. What type of EV do the user have (make and model)?
Questions in the non-owner survey: 1. Questions 2, 3, 4 and 5 to owners should also be addressed to non-owners. 2. Hybrid vehicle should be one of the vehicle types in the survey of the households
vehicles. 3. Attitudes to EVs when it comes to range, charge times, acceleration, environment
and cost. 4. What factors could make them buy an EV? 5. Will they consider buying an EV next time they buy a vehicle?
Socio-demographic and socio-economic factors
Most studies highlight that socio-demographic and economic factors influencing vehicle buying behaviour and ownership. Saarenpää et al (2013) found that socio-demographic and socio-economic factors played a role in HEV adoption in Finland, ie age, income, share of high income households, education and number of children.
Copyright © Transportøkonomisk institutt, 2014 121 Denne publikasjonen er vernet i henhold til Åndsverkloven av 1961

Electric vehicles - environmental, economic and practical aspects
Zubaryeva et al (2012a, 2012b) found that lead national markets can be identified by analyzing economic factors as this is the most important one, followed by energy systems characteristics of the country. They also found that most EV sales will be in cities.
Questions to be included in the owner and non-owner surveys: 1. What is the persons age? 2. What education do the person have? 3. How many children are there in the household? 4. What is the household income? 5. What type of area do the person live in (rural, city, built up)?
Importance of charging infrastructure Anegawa (undated) found that the availability of fast charging increases the range utilization of vehicles due to the users feeling safer. In a fleet of cars the vehicles state of charge was lower after driving when the fast chargers was installed than before installing fast chargers.
Schroeder and Traber (2012) found that it is difficult to recoup the investment and operating costs of fast chargers and that it is essential to have a high use rate of the chargers.
Questions to be included in the owner survey: 1. How often are fast-chargers used? 2. How are fast-charges paid for? 3. Attitudes to charging in general. 4. Knowledge of charging possibilities.
Barriers to EV usage Browne et al (2012) found that significant barriers for EV adoption included various aspects of vehicle price, infrastructure costs, availability and other infrastructure challenges, cost of the competing options and sunk cost in petroleum related infrastructure, awareness and visibility of EVs, inertia and scepticism in the population, EVs unsuitability for long distance travels, perceived reduction in comfort and safety.
Questions to be included in the non-owner survey: 1. Attitudes to EVs. 2. Awareness of EVs. 3. Attitudes to infrastructure. 4. Knowledge of charging possibilities.
EVs and modal changes Franke et al (2012) tracked how the use of public transport, walking and cycling changed for people using EVs for a test period (Mini-E test) in Berlin. They found that the use of public transport and walking and cycling all decreased in households with EVs.
Questions to be included in the owner survey:
1. How did they transport themselves to work prior to buying the EV? 2. Have the total driving length of the household increased after buying the EV? 3. Is the EV an additional vehicle or did it replace another vehicle? 4. Has the travel pattern changed after buying the EV, ie unchanged. Is the EV owner
walking, cycling, driving or using public transport more or less than before?
122 Copyright © Transportøkonomisk institutt, 2014 Denne publikasjonen er vernet i henhold til Åndsverkloven av 1961
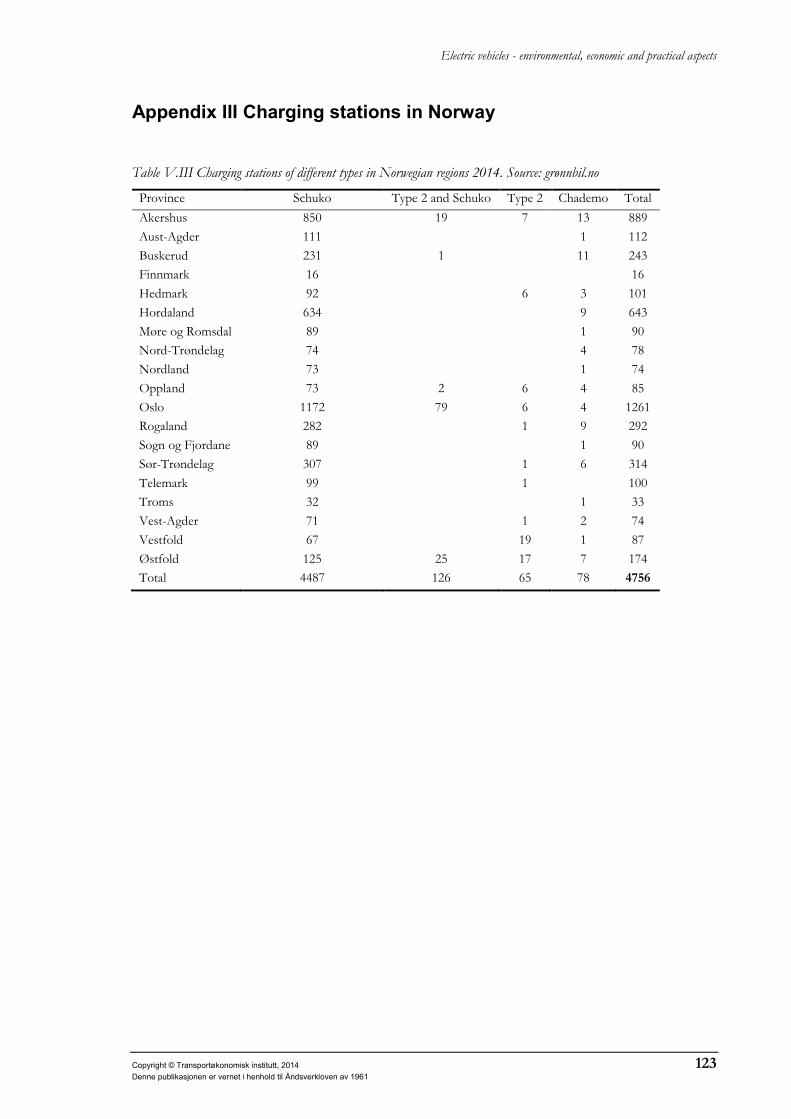
Electric vehicles - environmental, economic and practical aspects
Appendix III Charging stations in Norway
Table V.III Charging stations of different types in Norwegian regions 2014. Source: grønnbil.no
Province Schuko Type 2 and Schuko Type 2 Chademo Total Akershus 850 19 7 13 889 Aust-Agder 111 1 112 Buskerud 231 1 11 243 Finnmark 16 16 Hedmark 92 6 3 101 Hordaland 634 9 643 Møre og Romsdal 89 1 90 Nord-Trøndelag 74 4 78 Nordland 73 1 74 Oppland 73 2 6 4 85 Oslo 1172 79 6 4 1261 Rogaland 282 1 9 292 Sogn og Fjordane 89 1 90 Sør-Trøndelag 307 1 6 314 Telemark 99 1 100 Troms 32 1 33 Vest-Agder 71 1 2 74 Vestfold 67 19 1 87 Østfold 125 25 17 7 174 Total 4487 126 65 78 4756
Copyright © Transportøkonomisk institutt, 2014 123 Denne publikasjonen er vernet i henhold til Åndsverkloven av 1961

Electric vehicles - environmental, economic and practical aspects
Appendix IV Norwegian winter climate in 2014
The results in the survey may have been influenced by the abnormal winter conditions in Norway in the winter of 2013-2014. In the areas where most EV owners live, the winter has been unusually mild and with limited snow cover. This may lead to an overestimation of the vehicles’ range in the users perception of EVs, and an underestimation of the challenges of winter driving. 53% of the EV respondents had owned the vehicle less than a year and were at the same time first time buyers, thus had experience only with the ongoing winter. The deviations from the normal seasonal air temperature from December 2013 to February 2014 and detailed weather charts for Norway’s three biggest cities, Oslo, Bergen and Trondheim are shown in figure V.IV.1.
Figure V.IV.1 Winter temperature deviations from normal 2013-2014. Source: Meteorologisk institutt
Figure V.IV.2 shows detailed weather charts for the last year for Norway’s three biggest cities, Oslo, Bergen and Trondheim. The extent of the weather anomalies in south-eastern Norway is clearly seen in the chart for Oslo. The minimum temperature is far above the average normal temperature on most days in February, most of December and almost half of January. The rest of January was fairly cold but by no means extreme, and the average temperature was higher than the average normal temperature all days. Similar tendencies are seen for Bergen whereas the winter in Trondheim was also mild, but with a colder January. About half of the days the average temperature in January dropped below the average normal temperature in Trondheim.
124 Copyright © Transportøkonomisk institutt, 2014Denne publikasjonen er vernet i henhold til Åndsverkloven av 1961

Electric vehicles - environmental, economic and practical aspects
Figure V.IV.2 Daily weather statistics; Oslo, Bergen and Trondheim. The red line is the average (over 30 days) daily temperature for April 2013-March 2014, the black line is the normal average temperature. The fluctuating red fields shows the actual max temperature that day, the blue the minimum temperature. The precipitation is shown at the bottom. Source: yr.no
Copyright © Transportøkonomisk institutt, 2014 125 Denne publikasjonen er vernet i henhold til Åndsverkloven av 1961

Elbil
Preview of version 8.0
Preview of 'Elbil', version 8.0. Created 28.03.2014, 09:16
Table of contents
TOC
Preview of 'Elbil', version 8.0. Created 28.03.2014, 09:16
ID:Eierskap
Information
Vi vil først stille noen spørsmål om hvordan elbilen brukes. Dersom du i tillegg til elbil også har én eller flere konvensjonelle biler, vil vi gjerne også vite litt om bruken av denne (eller disse).
Privat Er du en privat eier av elbil, inngår elibilen i en bilflåte?
range:*
Jeg er privat eier av elbil 1
skip:exit
Elbilen er del av bilflåte i privat firma 2
skip:exit
Elbilen er del av bilflåte i offentlig virksomhet 3
Antallbiler Hvor mange biler eier/disponerer husstanden (inkludert ev. firmabil)?
1 2 Flere enn 21 2 3
Elbil 1
Ladbar hybridbil 2
Bensin/dieselbil 3
Bruker Er du den eneste som bruker (den nyeste) elbilen?
range:*
Ja 1
Nei 2
Andrebrukere Hvor mye bruker andre elbilen?
filter:\Bruker.a=2 range:*
Elbilen brukes mer av andre enn av meg 1
Elbilen brukes mest av meg 2
Elbilen brukes omtrent like mye av meg og andre 3
Vet ikke 4
Brukshyppighet
Hvor ofte bruker du elbilen?
range:*
Daglig (6-7 dager per uke) 1
3-5 dager per uke 2
1-2 dager per uke 3
Mindre enn én dag per uke 4
Preview of 'Elbil', version 8.0. Created 28.03.2014, 09:16
Brukshyppighet
Hvor ofte bruker du elbilen?
Aldri 5
TYpeturer Hvilke typer reiser benytter du elbilen til?
range:*
Daglig (6-7 dager per
uke)
3-5 dager per uke
1-2 dager per uke
Mindre enn én dag per
ukeAldri
1 2 3 4 5
Reise til jobb/skole 1
Kjøring til fritidsaktiviteter 2
Henting/følging av barn 3
Besøk 4
Ferier 5
Innkjøp/shopping 6
Kjøring i jobbsammenheng 7
distansejobb Hvor mange kilometer (ca) er reiseveien til jobb/utdanningssted (én vei)?
filter:\TYpeturer.a.1=1;2;3 range:*
1
altjobbreise Hvordan reiste du vanligvis til jobb/utdanningssted før elbilen ble anskaffet?
filter:\TYpeturer.a.1=1;2 range:*
Med vanlig bil som sjåfør 1
Med vanlig bil som passasjer 2
Med (annen) elbil som sjåfør 3
Med (annen) elbil som passasjer 4
Med kollektivtransport 5
Syklet 6
Gikk 7
Denne reisen ble ikke gjennomført før elbilen ble anskaffet 8
Annet 9
Bom8 Passerer du bomstasjon på reise til jobb/skole?
filter:\TYpeturer.a.1=1;2 range:*
Ja 1
Nei 2
Appendix V: Questionnaire EV owners

Preview of 'Elbil', version 8.0. Created 28.03.2014, 09:16
Bom8 Passerer du bomstasjon på reise til jobb/skole?
Noen ganger 3
Kollektivfelt Kan du benytte kollektivfelt på reise til jobb/skole?
filter:\TYpeturer.a.1=1;2 range:*
Ja 1
skip:Gratispark
Nei 2
Kolltidsbesparelse
Ca hvor mye tid sparer du vanligvis per reise ved å bruke kollektivfelt?
filter:\Kollektivfelt.a=1 range:*
10 minutter eller mindre 1
11-20 minutter 2
21-30 minutter 3
Mer enn 30 minutter 4
Vet ikke 5
Gratispark Hvor ofte bruker du gratis offentlig parkering for elbiler?
range:*
Daglig 1
3-5 ganger i uka 2
1-2 ganger i uka 3
skip:Ladefasilitet
Mindre enn én gang per uke 4
skip:Ladefasilitet
Sjeldnere 5
skip:Ladefasilitet
Aldri 6
parkspar Hvor mye vil du anslå at du sparer per uke på å bruke gratis parkering?
range:*
50-100 kr per uke 1
Mindre enn 50 kr per uke 2
50-100 kr per uke 3
101-200 kr per uke 4
201-300 kr per uke 5
301-400 kr per uke 6
401-500 kr per uke 7
Preview of 'Elbil', version 8.0. Created 28.03.2014, 09:16
parkspar Hvor mye vil du anslå at du sparer per uke på å bruke gratis parkering?
Over 500 kr per uke 8
Vet ikke 9
Ladefasilitet Hvordan lader du elbilen?
range:*
Daglig 3-5 ganger i
uka 1-2 ganger i
uka 1-2 ganger i
måneden Sjeldnere Aldri
1 2 3 4 5 6Hjemmelading i garasje 1
Hjemmelading i carport eller utendørs parkering
2
Arbeidsplasslading 3
Offentlige ladestasjoner 4
Ladestasjoner på kjøpesenter e.l. 5
Hurtigladestasjon om sommeren 6
Hurtigladestasjon om vinteren 7
Betalinghurtig Hvordan betaler du for hurtiglading?
filter:\Ladefasilitet.a.5=1;2;3;4 range:*
Gjennom abonnement 1
Betaling per gang 2
Hurtigladingen er gratis 3
Med klippekort 4
Tomstrom Har du opplevd at elbilen har stoppet underveis fordi den gikk tom for strøm?
range:*
Aldri 1
Én gang 2
Flere ganger 3
Mindre enn én gang årlig 4
Margin Hvor mye av rekkevidden på bilen er du komfortabel med å utnytte?
range:*
Inntil 50% 1
Inntil 60% 2
Inntil 70% 3
Preview of 'Elbil', version 8.0. Created 28.03.2014, 09:16
Margin Hvor mye av rekkevidden på bilen er du komfortabel med å utnytte?
Inntil 80% 4
Inntil 90% 5
Over 90% 6
Brukbil Hvor ofte bruker du bensin/dieselbilen(e)?
filter:\Antallbiler.a.3=1;2;3
Daglig 3-5 dager i
uka 1-2 dager i
uka
Mindre enn én dag per
uke Aldri
1 2 3 4 5
Bensin/dieselbil 1 1
filter:\Antallbiler.a.3=2;3
Bensin/dieselbil 2 2
filter:\Privat.a=3
Øvrig(e) bensin/dieselbil(er) 3
Jobbbil Bruker du bensin/dieselbilene på reise til jobb/utdanningssted?
filter:\TYpeturer.a.1=2;3;4;5
Ja Nei Av og til1 2 3
filter:\Antallbiler.a.3=1;2;3
Bensin/dieselbil 1 1
filter:\Antallbiler.a.3=2:3
Bensin/dieselbil 2 2
filter:\Antallbiler.a.3=3
Øvrig(e) bensin/dieselbil(er) 3
Distansejobbbil
Hvor mange kilometer er reiseveien til arbeids-/utdanningsstedet én vei?
filter:\distansejobb.a.1=!? range:*
filter:\Jobbbil.a.1=1;3
Bensin/dieselbil 1 1
filter:\Jobbbil.a.2=1;3
Bensin/dieselbil 2 2
filter:\Jobbbil.a.3=1;3
Øvrig(e) bensin/dieselbiler 3
Information
I denne seksjonen vil vi stille noen spørsmål om hvordan og hvorfor du valgte å kjøpe elbil.
narkjopt Hvor lenge har du hatt din nyeste elbil?
range:*
< 1 år 1
Preview of 'Elbil', version 8.0. Created 28.03.2014, 09:16
narkjopt Hvor lenge har du hatt din nyeste elbil?
1-2 år 2
> 2 år 3
Nybrukt Kjøpte du elbilen ny eller brukt?
range:*
skip:Forhandler
Ny 1
Brukt 2
Forhandler Ble bilen kjøpt av bilforhandler eller privatperson?
range:*
Bilforhandler 1
Privatperson 2
HVorlengeel Hvor lenge har du hatt elbil
range:*
Denne elbilen er min første 1
2-5 år 2
5-10 år 3
> 10 år 4
Informasjon Hvor fikk du først informasjon som gjorde at du vurderte å kjøpe elbil? Det er mulig å velge flere alternativer.
range:*
Media 1
Jobb 2
Bilforhandler 3
Bekjente/familie med elbil 4
Organisasjon 5
Open
HVilkenorg Hvilken organisasjon fikk du informasjonen fra?
filter:\Informasjon.a=5
Open
Faktorerforkjop
Hvilke faktorer hadde betydning for at du valgte å kjøpe elbil?
range:*
Ingen betydning
Liten betydning
En del betydning
Stor betydning
Svært stor betydning
1 2 3 4 5

Preview of 'Elbil', version 8.0. Created 28.03.2014, 09:16
Faktorerforkjop
Hvilke faktorer hadde betydning for at du valgte å kjøpe elbil?
Det var beste bil for mitt behov 1
Jeg er interessert i ny teknologi 2
Elibilens sikkerhet 3
Elbil er miljøvennlig 4
Konkurransedyktig pris 5
Lavere årsavgift 6
Lavere driftskostnader 7
Adgang til å kjøre i kollektivfelt 8
Gratis bompassering 9
Gratis ferge 10
Gratis parkering på offentlige parkeringsplasser 11
Det fantes en elbilforhandler i nærheten 12
Mitt foretrukne bilmerke førte elbil 13
Elbil er i tiden 14
Annet 15
andrefaktorer Hvilke andre faktorer var det snakk om?
filter:\Faktorerforkjop.a.15=3;4;5
Open
avgjorelse Hadde du bestemt deg for å kjøpe elbil før du oppsøkte bilforhandler?
filter:\Forhandler.a=1 range:*
Ja 1
Nei 2
Vet ikke 3
Elbiligjen Vil du kjøpe elbil igjen?
range:*
Ja 1
Nei 2
skip:nextsection
Vet ikke 3
Hvorforelbiligjen
Hva er den viktigste årsaken til at du vil kjøpe elbil igjen?
filter:\Elbiligjen.a=1
Open
Preview of 'Elbil', version 8.0. Created 28.03.2014, 09:16
Hvorforikkeelbil
Hva er hovedårsaken til at du ikke vil kjøpe elbil igjen?
filter:\Elbiligjen.a=2
Open
Information
Vi ønsker å vite hvordan du beveget deg utenfor hjemmet siste tilbakelagte HVERDAG (altså i går, eller tidligere, dersom gårsdagen var helg/helligdag). Med turer mener vi alle slags turer utenfor egen tomt/gårdsrom, også korte gang- eller sykkelturer. Hver gang du stoppet for å utføre et ærend eller gjøremål, anser vi en tur for avsluttet, slik at hvis du f.eks. reiste for å handle på en butikk, og deretter hjem igjen, var dette to turer, eller hvis du leverte barn i barnehage/skole på vei til jobb, var dette to turer, ikke én. Hvis du derimot bare stopper kort på veien - f.eks. stikker innom en kiosk for å kjøpe kaffe på veien til et annet bestemmelsessted - regnes dette bare som én tur.
Forstereis Vi begynner med den første turen:Hva var turens bestemmelsessted/formål?
range:*
skip:nextsection
Foretok ingen turer den aktuelle dagen 1
Jobb/utdanningssted 2
Barns skole/barnehage 3
Hjem 4
Hytte/feriehus 5
Dagligvarehandel 6
Annen butikk/forretning 7
Transportterminal (stasjon, flyplass, fergeterminal, o.l.) 8
Reise i arbeidet 9
Barns fritidsaktivitet 10
Egen fritidsaktivitet 11
Café, kino, teater, e.l. 12
Besøk hos familie/venner 13
Annet 14
Forstereis_1 Hvor lang var denne turen (ca) i kilometer?
range:*
Distanse 1
Preview of 'Elbil', version 8.0. Created 28.03.2014, 09:16
Forstereis_2 Og hvilket transportmiddel brukte du? Du kan velge mer enn ett transportmiddel, dersom turen innebar en kombinasjon av flere
Transportmiddel
range:*
Elbil (som sjåfør) 1
Elbil (som passasjer) 2
Bensin/dieselbil (som sjåfør) 3
Bensin/dieselbil (som passasjer) 4
Tog 5
T-bane 6
Fly 7
Båt/ferge 8
Buss 9
Trikk 10
Motorsykkel/moped/scooter 11
Sykkel 12
Elsykkel 13
Gange/løping 14
Annet 15
Andrereise Nå vil vi gjerne ha samme informasjon for den neste turen du foretok den aktuelle dagen.
Bestemmelsessted/formål
range:*
skip:nextsection
Foretok ikke flere turer den aktuelle dagen 1
Jobb/utdanningssted 2
Barns skole/barnehage 3
Hjem 4
Hytte/feriehus 5
Dagligvarehandel 6
Annen butikk/forretning 7
Transportterminal (stasjon, flyplass, fergeterminal, o.l.) 8
Reise i arbeidet 9
Annet jobbformål (møte, e.l.) 10
Barns fritidsaktivitet 11
Preview of 'Elbil', version 8.0. Created 28.03.2014, 09:16
Andrereise Nå vil vi gjerne ha samme informasjon for den neste turen du foretok den aktuelle dagen.
Bestemmelsessted/formål
Egen fritidsaktivitet 12
Café, kino, teater, e.l. 13
Besøk hos familie/venner 14
Annet 15
Andrereise1 Hvor lang var denne turen (ca) i kilometer?
range:*
Distanse 1
Andrereise2 Du kan velge mer enn ett transportmiddel, dersom turen innebar en kombinasjon av flere
Transportmiddel
range:*
Elbil (som sjåfør) 1
Elbil (som passasjer) 2
Bensin/dieselbil (som sjåfør) 3
Bensin/dieselbil (som passasjer) 4
Tog 5
Fly 6
Båt/ferge 7
T-bane 8
Buss 9
Trikk 10
Motorsykkel/moped/scooter 11
Sykkel 12
Elsykkel 13
Gange/løping 14
Annet 15
Tredjereise Neste tur?
Bestemmelsessted/formål
range:*
skip:nextsection
Foretok ikke flere turer den aktuelle dagen 1

Preview of 'Elbil', version 8.0. Created 28.03.2014, 09:16
Tredjereise Neste tur?
Bestemmelsessted/formål
Jobb/utdanningssted 2
Barns skole/barnehage 3
Hjem 4
Hytte/feriehus 5
Dagligvarehandel 6
Annen butikk/forretning 7
Transportterminal (stasjon, flyplass, fergeterminal, o.l.) 8
Reise i arbeidet 9
Annet jobbformål (møte, e.l.) 10
Barns fritidsaktivitet 11
Egen fritidsaktivitet 12
Café, kino, teater, e.l. 13
Besøk hos familie/venner 14
Annet 15
Tredjereise1 Hvor lang var denne turen (ca) i kilometer?
range:*
Distanse
1
Tredjereise2 Du kan velge mer enn ett transportmiddel, dersom turen innebar en kombinasjon av flere
Transportmiddel
range:*
Elbil (som sjåfør) 1
Elbil (som passasjer) 2
Bensin/dieselbil (som sjåfør) 3
Bensin/dieselbil (som passasjer) 4
Tog 5
Fly 6
Båt/ferge 7
T-bane 8
Buss 9
Trikk 10
Preview of 'Elbil', version 8.0. Created 28.03.2014, 09:16
Tredjereise2 Du kan velge mer enn ett transportmiddel, dersom turen innebar en kombinasjon av flere
Transportmiddel
Motorsykkel/moped/scooter 11
Sykkel 12
Elsykkel 13
Gange/løping 14
Annet 15
Fjerdereise Neste tur?
Bestemmelsessted/formål
range:*
skip:nextsection
Foretok ikke flere reiser den aktuelle dagen
1
Jobb/utdanningssted 2
Barns skole/barnehage 3
Hjem 4
Hytte/feriehus 5
Dagligvarehandel 6
Annen butikk/forretning 7
Transportterminal (stasjon, flyplass, fergeterminal, o.l.) 8
Reise i arbeidet 9
Annet jobbformål (møte, e.l.) 10
Barns fritidsaktivitet 11
Egen fritidsaktivitet 12
Café, kino, teater, e.l. 13
Besøk hos familie/venner 14
Annet 15
Fjerdereise1 Hvor lang var denne turen (ca) i kilometer?
range:*
Distanse 1
Fjerdereise2 Du kan velge mer enn ett transportmiddel, dersom turen innebar en kombinasjon av flere
Transportmiddel
range:*
Preview of 'Elbil', version 8.0. Created 28.03.2014, 09:16
Fjerdereise2 Du kan velge mer enn ett transportmiddel, dersom turen innebar en kombinasjon av flere
Transportmiddel
Elbil (som sjåfør) 1
Elbil (som passasjer) 2
Bensin/dieselbil (som sjåfør) 3
Bensin/dieselbil (som passasjer) 4
Tog 5
Fly 6
Båt/ferge 7
T-bane 8
Buss 9
Trikk 10
Motorsykkel/moped/scooter 11
Sykkel 12
Gange/løping 13
Annet 14
Femtereise Neste tur?
Bestemmelsessted/formål
range:*
skip:nextsection
Foretok ikke flere turer den aktuelle dagen
1
Jobb/utdanningssted 2
Barns skole/barnehage 3
Hjem 4
Hytte/feriehus 5
Dagligvarehandel 6
Annen butikk/forretning 7
Transportterminal (stasjon, flyplass, fergeterminal, o.l.) 8
Reise i arbeidet 9
Annet jobbformål (møte, e.l.) 10
Barns fritidsaktivitet 11
Egen fritidsaktivitet 12
Café, kino, teater, e.l. 13
Preview of 'Elbil', version 8.0. Created 28.03.2014, 09:16
Femtereise Neste tur?
Bestemmelsessted/formål
Besøk hos familie/venner 14
Annet 15
Femtereise1 Hvor lang var denne turen (ca) i kilometer?
range:*
Distanse 1
Femtereise2 Du kan velge mer enn ett transportmiddel, dersom turen innebar en kombinasjon av flere
Transportmiddel
range:*
Elbil (som sjåfør) 1
Elbil (som passasjer) 2
Bensin/dieselbil (som sjåfør) 3
Bensin/dieselbil (som passasjer) 4
Tog 5
Fly 6
Båt/ferge 7
T-bane 8
Buss 9
Trikk 10
Motorsykkel/moped/scooter 11
Sykkel 12
Gange/løping 13
Annet 14
Sjettereise Neste tur?
Bestemmelsessted/formål
range:*
skip:nextsection
Foretok ikke flere turer den aktuelle dagen
1
Jobb/utdanningssted 2
Barns skole/barnehage 3
Hjem 4

Preview of 'Elbil', version 8.0. Created 28.03.2014, 09:16
Sjettereise Neste tur?
Bestemmelsessted/formål
Hytte/feriehus 5
Dagligvarehandel 6
Annen butikk/forretning 7
Transportterminal (stasjon, flyplass, fergeterminal, o.l.) 8
Reise i arbeidet 9
Annet jobbformål (møte, e.l.) 10
Barns fritidsaktivitet 11
Egen fritidsaktivitet 12
Café, kino, teater, e.l. 13
Besøk hos familie/venner 14
Annet 15
Sjettereise1 Hvor lang var denne turen (ca) i kilometer?
range:*
Distanse
1
Sjettereise2 Du kan velge mer enn ett transportmiddel, dersom turen innebar en kombinasjon av flere
Transportmiddel
range:*
Elbil (som sjåfør) 1
Elbil (som passasjer) 2
Bensin/dieselbil (som sjåfør) 3
Bensin/diesebil (som passasjer) 4
Tog 5
Fly 6
Båt/ferge 7
T-bane 8
Buss 9
Trikk 10
Motorsykkel/moped/scooter 11
Sykkel 12
Gange/løping 13
Preview of 'Elbil', version 8.0. Created 28.03.2014, 09:16
Sjettereise2 Du kan velge mer enn ett transportmiddel, dersom turen innebar en kombinasjon av flere
Transportmiddel
Annet 14
Sjuendereise Neste tur?
Bestemmelsessted/formål
range:*
skip:nextsection
Foretok ikke flere reiser den aktuelle dagen
1
Jobb/utdanningssted 2
Barns skole/barnehage 3
Hjem 4
Hytte/feriehus 5
Dagligvarehandel 6
Annen butikk/forretning 7
Transportterminal (stasjon, flyplass, fergeterminal, o.l.) 8
Reise i arbeidet 9
Annet jobbformål (møte, e.l.) 10
Barns fritidsaktivitet 11
Egen fritidsaktivitet 12
Café, kino, teater, e.l. 13
Besøk hos familie/venner 14
Annet 15
Sjuendereise1 Hvor lang var denne turen (ca) i kilometer?
range:*
Distanse 1
Sjuendereise2 Du kan velge mer enn ett transportmiddel, dersom turen innebar en kombinasjon av flere
Transportmiddel
range:*
Elbil (som sjåfør) 1
Elbil (som passasjer) 2
Bensin/dieselbil (som sjåfør) 3
Bensin/dieselbil (som passasjer) 4
Preview of 'Elbil', version 8.0. Created 28.03.2014, 09:16
Sjuendereise2 Du kan velge mer enn ett transportmiddel, dersom turen innebar en kombinasjon av flere
Transportmiddel
Tog 5
Fly 6
Båt/ferge 7
T-bane 8
Buss 9
Trikk 10
Motorsykkel/moped/scooter 11
Sykkel 12
Gange/løping 13
Annet 14
Aattendereise Neste tur?
Bestemmelsessted/formål
range:*
skip:nextsection
Foretok ikke flere turer den aktuelle dagen
1
Jobb/utdanningssted 2
Barns skole/barnehage 3
Hjem 4
Hytte/feriehus 5
Dagligvarehandel 6
Annen butikk/forretning 7
Transportterminal (stasjon, flyplass, fergeterminal, o.l.) 8
Annet jobbformål (møte, e.l.) 9
Barns fritidsaktivitet 10
Egen fritidsaktivitet 11
Café, kino, teater, e.l. 12
Besøk hos familie/venner 13
Annet 14
Aattendereise1 Hvor lang var denne turen (ca) i kilometer?
range:*
Preview of 'Elbil', version 8.0. Created 28.03.2014, 09:16
Aattendereise1 Hvor lang var denne turen (ca) i kilometer?
Distanse 1
Aattendereise2 Du kan velge mer enn ett transportmiddel, dersom turen innebar en kombinasjon av flere
Transportmiddel
range:*
Elbil (som sjåfør) 1
Elbil (som passasjer) 2
Bensin/dieselbil (som sjåfør) 3
Bensin/dieselbil (som passasjer) 4
Tog 5
Fly 6
Båt/ferge 7
T-bane 8
Buss 9
Trikk 10
Motorsykkel/moped/scooter 11
Sykkel 12
Gange/løping 13
Annet 14
Niendereise Neste tur?
Bestemmelsessted/formål
range:*
skip:nextsection
Foretok ikke flere turer den aktuelle dagen
1
Jobb/utdanningssted 2
Barns skole/barnehage 3
Hjem 4
Hytte/feriehus 5
Dagligvarehandel 6
Annen butikk/forretning 7
Transportterminal (stasjon, flyplass, fergeterminal, o.l.) 8
Reise i arbeidet 9

Preview of 'Elbil', version 8.0. Created 28.03.2014, 09:16
Niendereise Neste tur?
Bestemmelsessted/formål
Annet jobbformål (møte, e.l.) 10
Barns fritidsaktivitet 11
Egen fritidsaktivitet 12
Café, kino, teater, e.l. 13
Besøk hos familie/venner 14
Annet 15
Niendereise1 Hvor lang var denne turen (ca) i kilometer?
range:*
Distanse 1
Niendereise2 Du kan velge mer enn ett transportmiddel, dersom turen innebar en kombinasjon av flere
Transportmiddel
range:*
Elbil (som sjåfør) 1
Elbil (som passasjer) 2
Bensin/dieselbil (som sjåfør) 3
Bensin/dieselbil (som passasjer) 4
Tog 5
Fly 6
Båt/ferge 7
T-bane 8
Buss 9
Trikk 10
Motorsykkel/moped/scooter 11
Sykkel 12
Gange/løping 13
Annet 14
Tiendereise Neste tur?
Bestemmelsessted/formål
range:*
Preview of 'Elbil', version 8.0. Created 28.03.2014, 09:16
Tiendereise Neste tur?
Bestemmelsessted/formål
skip:nextsection
Foretok ikke flere turer den aktuelle dagen 1
Jobb/utdanningssted 2
Barns skole/barnehage 3
Hjem 4
Hytte/feriehus 5
Dagligvarehandel 6
Annen butikk/forretning 7
Transportterminal (stasjon, flyplass, fergeterminal, o.l.) 8
Reise i arbeidet 9
Annet jobbformål (møte, e.l.) 10
Barns fritidsaktivitet 11
Egen fritidsaktivitet 12
Café, kino, teater, e.l. 13
Besøk hos familie/venner 14
Annet 15
Tiendereise1 Hvor lang var denne turen (ca) i kilometer?
range:*
Distanse 1
Tiendereise2 Du kan velge mer enn ett transportmiddel, dersom turen innebar en kombinasjon av flere
Transportmiddel
range:*
Elbil (som sjåfør) 1
Elbil (som passasjer) 2
Bensin/dieselbil (som sjåfør) 3
Bensin/dieselbil (som passasjer) 4
Tog 5
Fly 6
Båt/ferge 7
T-bane 8
Preview of 'Elbil', version 8.0. Created 28.03.2014, 09:16
Tiendereise2 Du kan velge mer enn ett transportmiddel, dersom turen innebar en kombinasjon av flere
Transportmiddel
Buss 9
Trikk 10
Motorsykkel/moped/scooter 11
Sykkel 12
Gange/løping 13
Annet 14
Ellevtereise Neste tur?
Bestemmelsessted/formål
range:*
skip:nextsection
Foretok ikke flere turer den aktuelle dagen 1
Jobb/utdanningssted 2
Barns skole/barnehage 3
Hjem 4
Hytte/feriehus 5
Dagligvarehandel 6
Annen butikk/forretning 7
Transportterminal (stasjon, flyplass, fergeterminal, o.l.) 8
Reise i arbeidet 9
Annet jobbformål (møte, e.l.) 10
Barns fritidsaktivitet 11
Egen fritidsaktivitet 12
Café, kino, teater, e.l. 13
Ellevtereise1 Hvor lang var denne turen (ca) i kilometer?
range:*
Distanse 1
Ellevtereise2 Du kan velge mer enn ett transportmiddel, dersom turen innebar en kombinasjon av flere
Transportmiddel
range:*
Elbil (som sjåfør) 1
Preview of 'Elbil', version 8.0. Created 28.03.2014, 09:16
Ellevtereise2 Du kan velge mer enn ett transportmiddel, dersom turen innebar en kombinasjon av flere
Transportmiddel
Elbil (som passasjer) 2
Bensin/dieselbil (som sjåfør) 3
Bensin/dieselbil (som passasjer) 4
Tog 5
Fly 6
Båt/ferge 7
T-bane 8
Buss 9
Trikk 10
Motorsykkel/moped/scooter 11
Sykkel 12
Gange/løping 13
Annet 14
Tolvtereise Neste tur?
Bestemmelsessted/formål
range:*
skip:nextsection
Foretok ikke flere turer den aktuelle dagen 1
Jobb/utdanningssted 2
Barns skole/barnehage 3
Hjem 4
Hytte/feriehus 5
Dagligvarehandel 6
Annen butikk/forretning 7
Transportterminal (stasjon, flyplass, fergeterminal, o.l.) 8
Reise i arbeidet 9
Annet jobbformål (møte, e.l.) 10
Barns fritidsaktivitet 11
Egen fritidsaktivitet 12
Café, kino, teater, e.l. 13

Preview of 'Elbil', version 8.0. Created 28.03.2014, 09:16
Tolvtereise1 Hvor lang var denne turen (ca) i kilometer?
range:*
Distanse
1
Tolvtereise2 Du kan velge mer enn ett transportmiddel, dersom turen innebar en kombinasjon av flere
Transportmiddel
range:*
Elbil (som sjåfør) 1
Elbil (som passasjer) 2
Bensin/dieselbil (som sjåfør) 3
Bensin/dieselbil (som passasjer) 4
Tog 5
Fly 6
Båt/ferge 7
T-bane 8
Buss 9
Trikk 10
Motorsykkel/moped/scooter 11
Sykkel 12
Gange/løping 13
Annet 14
Say
Så noen tekniske opplysninger om elbilen din:
Merke Hvilket merke er elbilen din?
range:*
Nissan Leaf 1
Mitsubishi I-miev 2
Peugeot Ion 3
Citroën c-zero 4
Tesla Model S 5
Annet 6
Husker ikke 7
Preview of 'Elbil', version 8.0. Created 28.03.2014, 09:16
Kjorelengde Hvilken årlig kjørelengde er elbilen din forsikret for?
range:*
8000 km eller mindre 1
8-12 000 km 2
12-16 000 km 3
16-20 000 km 4
Mer enn 20 000 km 5
Vet ikke 6
sommerrekkevidde
Hvilken rekkevidde regner du med at bilen har når du planlegger å bruke den i sommerhalvåret?
range:*
Under 75 km 1
75-100 km 2
101-125 km 3
126-150 km 4
151-250 km 5
251-400 km 6
Over 400 km 7
Vet ikke 8
vinterrekkevidde
Hvilken rekkevidde regner du med at bilen har når du planlegger å bruke den i vinterhalvåret?
range:*
Under 75 km 1
75-100 km 2
101-125 km 3
126-150 km 4
151-250 km 5
251-400 km 6
Over 400 km 7
Vet ikke 8
Information
Denne delen av undersøkelsen handler om dine erfaringer med bruk av elbil; om generell tilfredshet, og om den lever opp til forventningene.
Preview of 'Elbil', version 8.0. Created 28.03.2014, 09:16
Rettinfo Hvordan stemmer informasjonen du fikk fra forhandler/selger med dine egne erfaringer?
range:*
Stemmer godt 1
Bilen fungerer dårligere enn forhandler forespeilet 2
Bilen fungerer bedre enn forhandler forespeilet 3
Hvordanverre På hvilken måte fungerer den dårligere?
filter:\Rettinfo.a=2
Open
hvordanbedre På hvilken måte fungerer den bedre?
filter:\Rettinfo.a=3
Open
utfordinger Var det utfordrende å ta elbilen i bruk når det gjelder noen av disse områdene?
range:*
Ja Nei Vet ikke 1 2 3
Å velge ladeløsning
1
Å forstå elbilens instrumenter
2
Bilen gikk kortere enn forventet
3
Å ha elbil krever mer planlegging
4
Elbilen fungerer dårligere om vinteren
5
Annet
6
Andreutfordringer
På hvilket annet område var det utfordrende?
filter:\utfordinger.a.6=1
Open
Tilpasning Hvordan tilpasser du deg i situasjoner der bilens rekkevidde er for kort? (du kan velge flere alternativer)
range:*
Benytter annen bil i husholdningen 1
Benytter leiebilavtale gjennom forhandler 2
Låner bil av venner/familie 3
Leier bil 4
Benytter kollektivtransport 5
Benytter bil fra bilkollektiv 6
Turene gjennomføres ikke 7
Preview of 'Elbil', version 8.0. Created 28.03.2014, 09:16
Tilpasning Hvordan tilpasser du deg i situasjoner der bilens rekkevidde er for kort? (du kan velge flere alternativer)
Benytter hurtigladestasjoner 8
Kjører mer økonomisk 9
Bruker ikke varmepparat/klimaanlegg 10
Planlegger reiser bedre 11
Annet 12
reisemonster Har elbilen ført til noen av disse endringene i ditt reisemønster (Du kan velge flere alternativer)?
Jeg kjører mer enn tidligere 1
Jeg kjører mindre enn tidligere 2
Jeg kjører kortere turer enn tidligere 3
Jeg kjører lengre turer enn tidligere 4
Jeg benytter kollektivtransport mindre 5
Jeg benytter kollektivtransport mer 6
Jeg går/sykler mindre 7
Jeg går/sykler mer 8
Jeg har gjort andre endringer 9
Det er ingen endringer i mitt reisemønster 10
Vet ikke 11
erstatning Er antallet biler i husstanden det samme etter at du kjøpte elbil?
range:*
Ja, elbilen erstattet annen bil 1
Ja, elbilen erstattet to eller flere biler 2
Nei, elbilen kom i tillegg til annen bil/andre biler 3
Nei, hadde ikke bil før 4
Label54a Hvilken type bil ble erstattet av elbilen? filter:\erstatning.a=1;2 range:*
Bensin/dieselbil 1
Hybridbil 2
Elbil 3
endretforsikring
Har du endret samlet årlig kjørelengde i husholdningens bilforsikringer etter at du skaffet elbil?
range:*

Preview of 'Elbil', version 8.0. Created 28.03.2014, 09:16
endretforsikring
Har du endret samlet årlig kjørelengde i husholdningens bilforsikringer etter at du skaffet elbil?
Nei, har samme kjørelengde som før 1
Ja, har økt kjørelengden 2
Ja, har kuttet ned på kjørelengden 3
Har hatt bilen mindre enn ett år 4
Vet ikke 5
vennerfamilie Har du venner eller familie som har kjøpt eller vurderer å kjøpe elbil som følge av at du har fortalt dem om dine erfaringer?
range:*
Ja, som har kjøpt 1
Ja, som vurderer å kjøpe 2
Nei 3
Vet ikke 4
fordelerulemper
Er noen av disse faktorene fordeler eller ulemper ved elbilen?
range:*
Stor fordel Liten fordel
Verken fordel eller ulempe
Liten ulempe Stor ulempe
1 2 3 4 5
Bilens størrelse
1
Bilens rekkevidde
2
Dårlig tilgang til ladestasjoner
3
Tiden det tar å lade batteriet
4
Upraktisk med ledninger
5
Bilens kjørekomfort
6
Bilens sikkerhet
7
Anskaffelsespris
8
Driftskostnader
9
Akselerasjonsegenskaper
10
Bilens toppfart
11
Bilens varmeapparat
12
Usikkerhet når det gjelder bruktmarkedet
13
Usikkerhet om hvorvidt insentivene vil bli opprettholdt
14
Annet
15
Preview of 'Elbil', version 8.0. Created 28.03.2014, 09:16
Information
Til slutt vil vi stille noen spørsmål om deg selv, for å kunne sammenligne elbileiere med befolkningen forøvrig.
Kjonn Kjønn
range:*
Kvinne 1
Mann 2
Alder Alder
range:*
1
Utd Høyeste fullførte utdannelse range:*
Grunnskole 1
Videregående skole 2
Høyere utdanning av inntil fire års lengde 3
Høyere utdanning over fire års lengde 4
Yrkesstatus Yrkesstatus (hovedbeskjeftigelse) range:*
Student 1
Fulltidsansatt 2
Deltidsansatt 3
Selvstendig næringsdrivende 4
Pensjonist 5
Trygdet 6
Annet 7
Yrke Type yrke
range:*
Jordbruk, skogbruk, fiske 1
Bergverksdrift og utvinning 2
Industri 3
Elektrisitet, vann og renovasjon 4
Bygg og anlegg 5
Varehandel, transport, hotell og restaurant 6
Informasjon og kommunikasjon 7
Preview of 'Elbil', version 8.0. Created 28.03.2014, 09:16
Yrke Type yrke
Finansiering og forsikring 8
Forretningsmessig tjenesteyting, eiendomsdrift 9
Offentlige tjenester, undervisning og helse 10
Personlig tjenesteyting ellers 11
Annet 12
Hustandsstr Antall personer i husstanden
range:*
1
Barn Antall personer i husstanden under 18 år
range:*
1
Antforerkort Hvor mange personer i husstanden har førerkort for bil?
range:*
1 person 1
2 personer 2
3 personer 3
Flere enn 3 personer 4
Arsinntekt Husstandens samlede brutto årsinntekt
range:*
Under 200 000 1
200-400 000 2
400-600 000 3
600-800 000 4
5
800 000- 1000 000 6
Over 1000 000 7
Ønsker ikke å oppgi 8
Boligomrade Boligområde
range:*
Storby (Oslo, Bergen Stavanger, Trondheim) 1
By 2
Tettsted 3
Preview of 'Elbil', version 8.0. Created 28.03.2014, 09:16
Boligomrade Boligområde
Annet 4
Postnummer Hva er ditt postnummer? range:*
1
Miljororganisasjon
Er du medlem av en miljøorganisasjon?
range:*
Ja 1
Nei 2
Bilinteresse Hvor interessert er du i biler? range:*
Helt uinteressert
Ganske uinteressert
Verken/eller Litt interessertVeldig
interessert
1 2 3 4 5
1
Bilkompetanse Hvordan ville du rangere din tekniske kompetanse når det gjelder bil?
range:*
Dårlig Ganske dårlig
Gjennomsnittlig
Ganske god God
1 2 3 4 5
1
dagens_dato
afilla:sys_date c
Dagens dato (ååååmmdd)
1
speedometer Hva er kilometerstanden på bilen din? Dersom du ikke husker, kan du la dette spørsmålet bli stående ubesvart
Speedometerstand (antall kilometer) 1
registrert Når ble bilen først registrert? Dersom du ikke husker, kan du la spørsmålet stå ubesvart
Registreringsdato (ååååmmdd) 1
Information
Tusen takk for svar. Alle som svarer, deltar i en trekning av tre gavekort á 2000,- kroner. For å delta i trekningen må du legge igjen din epostadresse (dette er selvsagt frivilllig).
epost_2 Skriv inn din epostadresse her: Open

Preview of 'Elbil', version 8.0. Created 28.03.2014, 09:16
epost_2 Skriv inn din epostadresse her:
Open
Information
Tusen takk for hjelpen!
Vi setter stor pris på tilbakemeldinger om undersøkelsen, som kan sendes til [email protected]

ConventionalPreview of version 8.0
Preview of 'Conventional', version 8.0. Created 28.03.2014, 09:15
Table of contents
TOC
Preview of 'Conventional', version 8.0. Created 28.03.2014, 09:15
ID:Eierskap
Information
Tusen takk for at du vil delta i undersøkelsen! Vi begynner med noen spørsmål om husstandens biler og bilbruk.
starttid_1
range:*
afilla:sys_timenowf c 1
startdato_1
range:*
afilla:sys_date c 1
Label0 Hvor mange biler disponerer husstanden (inkludert ev. firmabil)?
range:*
En bil 1
To biler 2
Tre biler 3
Flere enn tre biler 4
Label3a Hvilken type drivstoff bruker bilen(e)?
range:*
Bensin Diesel Elektrisitet/strøm (elbil)
Elektrisitet/bensin
(hybridbil)
Elektrisitet/diesel (hybridbil)
Annet
1 2 3 4 5 6
Bil 1 1
filter:\Label0.a=2;3;4
Bil 2
2
filter:\Label0.a=3;4
Bil 3
3
filter:\Label0.a=4
Øvrige biler i husstanden
4
Label3b Hvor ofte bruker du bilen(e)?
range:*
Daglig (6-7 dager per
uke)
3-5 dager per uke
1-2 dager per uke
Mindre enn én dag per
uke Aldri
Preview of 'Conventional', version 8.0. Created 28.03.2014, 09:15
Label3b Hvor ofte bruker du bilen(e)?1 2 3 4 5
Bil 1 1
filter:\Label0.a=2;3;4
Bil 2 2
filter:\Label0.a=3;4
Bil 3 3
filter:\Label0.a=4
Øvrig(e) bil(er) 4
Label3c Hvillken årlig kjørelengde er bilen(e) forsikret for
range:*
8000 km eller mindre
8-12 000 km
12-16 000 km
16-20 000 km
over 20 000 km Vet ikke
1 2 3 4 5 6
Bil 1 1
filter:\Label0.a=2;3;4
Bil 2
2
filter:\Label0.a=3;4
Bil 3
3
filter:\Label0.a=4
Øvrig(e) bil(er) 4
Typeturer1 Hvilke typer reiser benytter du bil 1 til?
range:*
Daglig (6-7 dager per
uke)
3-5 dager per uke
1-2 dager per uke
Mindre enn én dag per
ukeAldri
1 2 3 4 5
Reise til jobb/skole 1
Kjøring til fritidsaktiviteter 2
Henting/følging av barn 3
Besøk 4
Ferier 5
Innkjøp/shopping 6
Kjøring i jobbsammenheng 7
Typeturer2 Hvilke typer reiser benytter du bil 2 til?
filter:\Label0.a=2;3;4 range:*
Appendix VI: Questionnaire NAF members

Preview of 'Conventional', version 8.0. Created 28.03.2014, 09:15
Typeturer2 Hvilke typer reiser benytter du bil 2 til?
Daglig (6-7 dager per
uke)
3-5 dager per uke
1-2 dager per uke
Mindre enn én dag per
uke Aldri
1 2 3 4 5
Reise til jobb/skole
1
Kjøring til fritidsaktiviteter
2
Henting/følging av barn
3
Besøk
4
Ferier
5
Innkjøp/shopping
6
Kjøring i jobbsammenheng
7
Typeturer3 Hvilke typer reiser benytter du bil 3 til?
filter:\Label0.a=3;4 range:*
Daglig (6-7 dager per
uke)
3-5 dager per uke
1-2 dager per uke
Mindre enn én dag per
uke Aldri
1 2 3 4 5
Reise til jobb/skole
1
Kjøring til fritidsaktiviteter
2
Henting/følging av barn
3
Besøk
4
Ferier
5
Innkjøp/shopping
6
Kjøring i jobbsammenheng
7
Typeturer4 Hvilke typer reiser benytter du øvrig(e) bil(er) til?
filter:\Label0.a=4 range:*
Daglig (6-7 dager per
uke)
3-5 dager per uke
1-2 dager per uke
Mindre enn én dag per
uke Aldri
1 2 3 4 5
Reise til jobb/skole
1
Kjøring til fritidsaktiviteter
2
Henting/følging av barn
3
Besøk
4
Ferier
5
Innkjøp/shopping
6
Kjøring i jobbsammenheng
7
Preview of 'Conventional', version 8.0. Created 28.03.2014, 09:15
Distansejobbbil
Hvis relevant: hvor mange kilometer er reiseveien til jobb/utdanningssted én vei?
Antall kilometer til jobb/skole 1
filter:\Typeturer2.a.1=1;2;3
Bil 2
2
filter:\Typeturer3.a.1=1;2;3
Bil 3
3
filter:\Typeturer4.a.1=1;2;3
Øvrig(e) lbil(er)
4
Bomstasjon Passerer du bomstasjon på reise til jobb/skole?
range:*
Ja 1
Nei 2
Noen ganger 3
Ikke relevant 4
Kollektivfelt Kan du benytte kollektivfelt på reise til jobb/skole?
range:*
Ja 1
Nei 2
Ikke aktuelt 3
parkspar Hvor mye vil du anslå at du bruker på parkering per uke?
range:*
Mindre enn 50 kr per uke 1
50-100 kr per uke 2
50-100 kr per uke 3
101-200 kr per uke 4
201-300 kr per uke 5
301-400 kr per uke 6
401-500 kr per uke 7
Over 500 kr per uke 8
Vet ikke 9
Information
Vi vil nå stille noe spørsmål om den SISTE bilen som er blitt innkjøpt i husstanden.
Preview of 'Conventional', version 8.0. Created 28.03.2014, 09:15
Label4b Er denne bilen en elbil?
filter:\Label3a.a.1:4=3 range:*
Ja 1
Nei 2
Label4a Hvor lenge har du hatt denne bilen?
range:*
< 1 år 1
1-2 år 2
> 2 år 3
Label30a Kjøpte du bilen ny eller brukt?
range:*
Ny 1
Brukt 2
Label4 Hvilket merke og modell er bilen?
Open
Faktorer Hvilke faktorer hadde betydning for at du valgte å kjøpe denne bilen?
range:*
Ingen betydning
Liten betydning
En del betydning
Stor betydning
Svært stor betydning
1 2 3 4 5
Det var beste bil for mitt behov
1
Jeg er interessert i ny teknologi
2
Bilens sikkerhet
3
Bilens miljøegenskaper
4
Bilens driftskostnader
5
Konkurransedyktig pris
6
Det fantes en merkeforhandler i nærheten
7
Annet
8
Annet Hvilke andre faktorer var det snakk om?
filter:\Faktorer.a.7=4;5
Open
Label4c Da du kjøpte bilen, vurderte du på noe tidspunkt å kjøpe en elbil?
filter:\Label4b.a=2 range:*
Preview of 'Conventional', version 8.0. Created 28.03.2014, 09:15
Label4c Da du kjøpte bilen, vurderte du på noe tidspunkt å kjøpe en elbil?
Ja 1
Nei 2
Vet ikke 3
Label4d Hadde du bestemt deg for å kjøpe bensin/dieselbil før du oppsøkte bilforhandler?
filter:\Label4b.a=2 range:*
Ja 1
Nei 2
Vet ikke 3
Label4e Solgte forhandleren der du kjøpte bilen din også elbiler?
filter:\Label4b.a=2 range:*
Ja 1
Nei 2
Vet ikke 3
Label4h Vil du vurdere å kjøpe elbil neste gang du kjøper bil?
range:*
skip:Label9a
Ja
1
skip:Label9b
Nei
2
skip:Label9h
Vet ikke
3
Label9a Hva er hovedårsakene til at du vil vurdere å kjøpe elbil?
filter:\Label4h.a=2
Open
Label9b Hva er hovedårsakene til at du ikke vil kjøpe elbil?
filter:\Label4h.a=2
Open
Label9h Har du venner eller familie som har eller vurderer å kjøpe elbil?
range:*
Ja, som har kjøpt 1
Ja, som vurderer å kjøpe 2
Nei 3

Preview of 'Conventional', version 8.0. Created 28.03.2014, 09:15
Label9h Har du venner eller familie som har eller vurderer å kjøpe elbil?
Vet ikke 4
Label66 Hva tror du skal til for at flere skal velge å kjøpe elbil?
Open
fordelerulemper
Tenker du på disse faktorene som fordeler eller ulemper ved elbiler?
range:*
Stor fordel Liten fordel
Verken fordel eller
ulempe
Liten ulempe
Stor ulempe Vet ikke
1 2 3 4 5 6
Elbilers størrelse
1
Elbilers rekkevidde
2
Tilgang til ladestasjoner
3
Tiden det tar å lade batterier
4
Upraktisk med ledninger
5
Elbilers kjørekomfort
6
Elbilers sikkerhet
7
Elbilers anskaffelsespris
8
Elbilers driftskostnader
9
Elbilers aksellerasjonsegenskaper
10
Elbilers toppfart
11
Elbilers varmeapparat
12
Usikkerhet når det gjelder bruktmarkedet
13
Usikkerhet om hvorvidt insentivene vil bli opprettholdt
14
Information
Vi ønsker å vite hvordan du beveget deg utenfor hjemmet siste tilbakelagte HVERDAG (altså i går, eller tidligere, dersom gårsdagen var helg/helligdag). Med dette mener vi alle slags turer utenfor egen tomt/gårdsrom, også korte gang- eller sykkelturer.
Hver gang du stoppet for å utføre et ærend eller gjøremål, anser vi en reise for avsluttet, slik at hvis du f.eks. reiste for å handle på en butikk, og deretter hjem igjen, var dette to reiser, eller hvis du leverte barn i barnehage/skole på vei til jobb, var dette to reiser, ikke én. Hvis du derimot bare stopper kort på veien - f.eks. stikker innom en kiosk for å kjøpe noe på veien til et annet bestemmelsessted - regnes dette bare som én reise.
Preview of 'Conventional', version 8.0. Created 28.03.2014, 09:15
Forstereis For hver av turene vil vi gjerne vite hvilket formål/bestemmelsessted den hadde, omtrent hvor lang den var, og hvilket transportmiddel som ble brukt. Vi begynner med den første reisen:
Hva var turens bestemmelsessted/formål?
range:*
skip:nextsection
Foretok ingen turer den aktuelle dagen
1
Jobb/utdanningssted 2
Barns skole/barnehage 3
Hjem 4
Hytte/feriehus 5
Dagligvarehandel 6
Annen butikk/forretning 7
Transportterminal (stasjon, flyplass, fergeterminal, o.l.) 8
Reise i arbeidet 9
Barns fritidsaktivitet 10
Egen fritidsaktivitet 11
Café, kino, teater, e.l. 12
Besøk hos familie/venner 13
Annet 14
Forstereis_1 Hvor lang var denne turen (ca) i kilometer?
range:*
Distanse 1
Forstereis_2 Og hvilket transportmiddel brukte du? Du kan velge mer enn ett transportmiddel, dersom turen innebar en kombinasjon av flere
range:*
Elbil (som sjåfør) 1
Elbil (som passasjer) 2
Bensin/dieselbil (som sjåfør) 3
Bensin/dieselbil (som passasjer) 4
Tog 5
T-bane 6
Fly 7
Båt/ferge 8
Buss 9
Preview of 'Conventional', version 8.0. Created 28.03.2014, 09:15
Forstereis_2 Og hvilket transportmiddel brukte du? Du kan velge mer enn ett transportmiddel, dersom turen innebar en kombinasjon av flere
Trikk 10
Motorsykkel/moped/scooter 11
Sykkel 12
Elsykkel 13
Gange/løping 14
Annet 15
Andrereise Nå vil vi gjerne ha samme informasjon for den neste turen du foretok den aktuelle dagen.
range:*
skip:nextsection
Foretok ikke flere turer den aktuelle dagen
1
Jobb/utdanningssted 2
Barns skole/barnehage 3
Hjem 4
Hytte/feriehus 5
Dagligvarehandel 6
Annen butikk/forretning 7
Transportterminal (stasjon, flyplass, fergeterminal, o.l.) 8
Reise i arbeidet 9
Annet jobbformål (møte, e.l.) 10
Barns fritidsaktivitet 11
Egen fritidsaktivitet 12
Café, kino, teater, e.l. 13
Besøk hos familie/venner 14
Annet 15
Andrereise1 Hvor lang var denne turen (ca) i kilometer?
range:*
Distanse
1
Andrereise2 Og hvilket transportmiddel brukte du? Du kan velge mer enn ett transportmiddel, dersom turen innebar en kombinasjon av flere
range:*
Elbil (som sjåfør) 1
Elbil (som passasjer) 2
Preview of 'Conventional', version 8.0. Created 28.03.2014, 09:15
Andrereise2 Og hvilket transportmiddel brukte du? Du kan velge mer enn ett transportmiddel, dersom turen innebar en kombinasjon av flere
Bensin/dieselbil (som sjåfør) 3
Bensin/dieselbil (som passasjer) 4
Tog 5
Fly 6
Båt/ferge 7
T-bane 8
Buss 9
Trikk 10
Motorsykkel/moped/scooter 11
Sykkel 12
Elsykkel 13
Gange/løping 14
Annet 15
Tredjereise Neste tur?
range:*
skip:nextsection
Foretok ikke flere turer den aktuelle dagen
1
Jobb/utdanningssted 2
Barns skole/barnehage 3
Hjem 4
Hytte/feriehus 5
Dagligvarehandel 6
Annen butikk/forretning 7
Transportterminal (stasjon, flyplass, fergeterminal, o.l.) 8
Reise i arbeidet 9
Annet jobbformål (møte, e.l.) 10
Barns fritidsaktivitet 11
Egen fritidsaktivitet 12
Café, kino, teater, e.l. 13
Besøk hos familie/venner 14
Annet 15

Preview of 'Conventional', version 8.0. Created 28.03.2014, 09:15
Tredjereise1 Hvor lang var denne turen (ca) i kilometer?
range:*
Distanse
1
Tredjereise2 Du kan velge mer enn ett transportmiddel, dersom turen innebar en kombinasjon av flere
range:*
Elbil (som sjåfør) 1
Elbil (som passasjer) 2
Bensin/dieselbil (som sjåfør) 3
Bensin/dieselbil (som passasjer) 4
Tog 5
Fly 6
Båt/ferge 7
T-bane 8
Buss 9
Trikk 10
Motorsykkel/moped/scooter 11
Sykkel 12
Elsykkel 13
Gange/løping 14
Annet 15
Fjerdereise Neste tur?
range:*
skip:nextsection
Foretok ikke flere turer den aktuelle dagen
1
Jobb/utdanningssted 2
Barns skole/barnehage 3
Hjem 4
Hytte/feriehus 5
Dagligvarehandel 6
Annen butikk/forretning 7
Transportterminal (stasjon, flyplass, fergeterminal, o.l.) 8
Reise i arbeidet 9
Annet jobbformål (møte, e.l.) 10
Preview of 'Conventional', version 8.0. Created 28.03.2014, 09:15
Fjerdereise Neste tur?
Barns fritidsaktivitet 11
Egen fritidsaktivitet 12
Café, kino, teater, e.l. 13
Besøk hos familie/venner 14
Annet 15
Fjerdereise1 Hvor lang var denne turen (ca) i kilometer?
range:*
Distanse 1
Fjerdereise2 Du kan velge mer enn ett transportmiddel, dersom turen innebar en kombinasjon av flere
range:*
Elbil (som sjåfør) 1
Elbil (som passasjer) 2
Bensin/dieselbil (som sjåfør) 3
Bensin/dieselbil (som passasjer) 4
Tog 5
Fly 6
Båt/ferge 7
T-bane 8
Buss 9
Trikk 10
Motorsykkel/moped/scooter 11
Sykkel 12
Gange/løping 13
Annet 14
Femtereise Neste tur?
Bestemmelsessted/formål
range:*
skip:nextsection
Foretok ikke flere turer den aktuelle dagen
1
Jobb/utdanningssted 2
Barns skole/barnehage 3
Preview of 'Conventional', version 8.0. Created 28.03.2014, 09:15
Femtereise Neste tur?
Bestemmelsessted/formål
Hjem 4
Hytte/feriehus 5
Dagligvarehandel 6
Annen butikk/forretning 7
Transportterminal (stasjon, flyplass, fergeterminal, o.l.) 8
Reise i arbeidet 9
Annet jobbformål (møte, e.l.) 10
Barns fritidsaktivitet 11
Egen fritidsaktivitet 12
Café, kino, teater, e.l. 13
Besøk hos familie/venner 14
Annet 15
Femtereise1 Hvor lang var denne turen (ca) i kilometer?
range:*
Distanse
1
Femtereise2 Du kan velge mer enn ett transportmiddel, dersom turen innebar en kombinasjon av flere
range:*
Elbil (som sjåfør) 1
Elbil (som passasjer) 2
Bensin/dieselbil (som sjåfør) 3
Bensin/dieselbil (som passasjer) 4
Tog 5
Fly 6
Båt/ferge 7
T-bane 8
Buss 9
Trikk 10
Motorsykkel/moped/scooter 11
Sykkel 12
Gange/løping 13
Preview of 'Conventional', version 8.0. Created 28.03.2014, 09:15
Femtereise2 Du kan velge mer enn ett transportmiddel, dersom turen innebar en kombinasjon av flere
Annet 14
Sjettereise Neste tur?
range:*
skip:nextsection
Foretok ikke flere reiser den aktuelle dagen
1
Jobb/utdanningssted 2
Barns skole/barnehage 3
Hjem 4
Hytte/feriehus 5
Dagligvarehandel 6
Annen butikk/forretning 7
Transportterminal (stasjon, flyplass, fergeterminal, o.l.) 8
Reise i arbeidet 9
Annet jobbformål (møte, e.l.) 10
Barns fritidsaktivitet 11
Egen fritidsaktivitet 12
Café, kino, teater, e.l. 13
Besøk hos familie/venner 14
Annet 15
Sjettereise1 Hvor lang var denne turen (ca) i kilometer?
range:*
Distanse 1
Sjettereise2 Du kan velge mer enn ett transportmiddel, dersom turen innebar en kombinasjon av flere
range:*
Elbil (som sjåfør) 1
Elbil (som passasjer) 2
Bensin/dieselbil (som sjåfør) 3
Bensin/diesebil (som passasjer) 4
Tog 5
Fly 6
Båt/ferge 7

Preview of 'Conventional', version 8.0. Created 28.03.2014, 09:15
Sjettereise2 Du kan velge mer enn ett transportmiddel, dersom turen innebar en kombinasjon av flere
T-bane 8
Buss 9
Trikk 10
Motorsykkel/moped/scooter 11
Sykkel 12
Gange/løping 13
Annet 14
Sjuendereise Neste tur?
range:*
skip:nextsection
Foretok ikke flere turer den aktuelle dagen 1
Jobb/utdanningssted 2
Barns skole/barnehage 3
Hjem 4
Hytte/feriehus 5
Dagligvarehandel 6
Annen butikk/forretning 7
Transportterminal (stasjon, flyplass, fergeterminal, o.l.) 8
Reise i arbeidet 9
Annet jobbformål (møte, e.l.) 10
Barns fritidsaktivitet 11
Egen fritidsaktivitet 12
Café, kino, teater, e.l. 13
Besøk hos familie/venner 14
Annet 15
Sjuendereise1 Hvor lang var denne turen (ca) i kilometer?
range:*
Distanse 1
Sjuendereise2 Du kan velge mer enn ett transportmiddel, dersom turen innebar en kombinasjon av flere
range:*
Elbil (som sjåfør) 1
Preview of 'Conventional', version 8.0. Created 28.03.2014, 09:15
Sjuendereise2 Du kan velge mer enn ett transportmiddel, dersom turen innebar en kombinasjon av flere
Elbil (som passasjer) 2
Bensin/dieselbil (som sjåfør) 3
Bensin/dieselbil (som passasjer) 4
Tog 5
Fly 6
Båt/ferge 7
T-bane 8
Buss 9
Trikk 10
Motorsykkel/moped/scooter 11
Sykkel 12
Gange/løping 13
Annet 14
Aattendereise Neste tur?
range:*
skip:nextsection
Foretok ikke flere turer den aktuelle dagen 1
Jobb/utdanningssted 2
Barns skole/barnehage 3
Hjem 4
Hytte/feriehus 5
Dagligvarehandel 6
Annen butikk/forretning 7
Transportterminal (stasjon, flyplass, fergeterminal, o.l.) 8
Annet jobbformål (møte, e.l.) 9
Barns fritidsaktivitet 10
Egen fritidsaktivitet 11
Café, kino, teater, e.l. 12
Besøk hos familie/venner 13
Annet 14
Aattendereise1 Hvor lang var denne turen (ca) i kilometer?
range:*
Preview of 'Conventional', version 8.0. Created 28.03.2014, 09:15
Aattendereise1 Hvor lang var denne turen (ca) i kilometer?
Distanse 1
Aattendereise2 Du kan velge mer enn ett transportmiddel, dersom turen innebar en kombinasjon av flere
range:*
Elbil (som sjåfør) 1
Elbil (som passasjer) 2
Bensin/dieselbil (som sjåfør) 3
Bensin/dieselbil (som passasjer) 4
Tog 5
Fly 6
Båt/ferge 7
T-bane 8
Buss 9
Trikk 10
Motorsykkel/moped/scooter 11
Sykkel 12
Gange/løping 13
Annet 14
Niendereise Neste tur?
range:*
skip:nextsection
Foretok ikke flere turer den aktuelle dagen 1
Jobb/utdanningssted 2
Barns skole/barnehage 3
Hjem 4
Hytte/feriehus 5
Dagligvarehandel 6
Annen butikk/forretning 7
Transportterminal (stasjon, flyplass, fergeterminal, o.l.) 8
Reise i arbeidet 9
Annet jobbformål (møte, e.l.) 10
Barns fritidsaktivitet 11
Egen fritidsaktivitet 12
Preview of 'Conventional', version 8.0. Created 28.03.2014, 09:15
Niendereise Neste tur?
Café, kino, teater, e.l. 13
Besøk hos familie/venner 14
Annet 15
Niendereise1 Hvor lang var denne turen (ca) i kilometer?
range:*
Distanse 1
Niendereise2 Du kan velge mer enn ett transportmiddel, dersom turen innebar en kombinasjon av flere
range:*
Elbil (som sjåfør) 1
Elbil (som passasjer) 2
Bensin/dieselbil (som sjåfør) 3
Bensin/dieselbil (som passasjer) 4
Tog 5
Fly 6
Båt/ferge 7
T-bane 8
Buss 9
Trikk 10
Motorsykkel/moped/scooter 11
Sykkel 12
Gange/løping 13
Annet 14
Tiendereise Neste tur?
range:*
skip:nextsection
Foretok ikke flere turer den aktuelle dagen 1
Jobb/utdanningssted 2
Barns skole/barnehage 3
Hjem 4
Hytte/feriehus 5
Dagligvarehandel 6

Preview of 'Conventional', version 8.0. Created 28.03.2014, 09:15
Tiendereise Neste tur?
Annen butikk/forretning 7
Transportterminal (stasjon, flyplass, fergeterminal, o.l.) 8
Reise i arbeidet 9
Annet jobbformål (møte, e.l.) 10
Barns fritidsaktivitet 11
Egen fritidsaktivitet 12
Café, kino, teater, e.l. 13
Besøk hos familie/venner 14
Annet 15
Tiendereise1 Hvor lang var denne turen (ca) i kilometer?
range:*
Distanse
1
Tiendereise2 Du kan velge mer enn ett transportmiddel, dersom turen innebar en kombinasjon av flere
range:*
Elbil (som sjåfør) 1
Elbil (som passasjer) 2
Bensin/dieselbil (som sjåfør) 3
Bensin/dieselbil (som passasjer) 4
Tog 5
Fly 6
Båt/ferge 7
T-bane 8
Buss 9
Trikk 10
Motorsykkel/moped/scooter 11
Sykkel 12
Gange/løping 13
Annet 14
Ellevtereise Neste tur?
range:*
skip:nextsection 1
Preview of 'Conventional', version 8.0. Created 28.03.2014, 09:15
Ellevtereise Neste tur?
Foretok ikke flere turer den aktuelle dagen
Jobb/utdanningssted 2
Barns skole/barnehage 3
Hjem 4
Hytte/feriehus 5
Dagligvarehandel 6
Annen butikk/forretning 7
Transportterminal (stasjon, flyplass, fergeterminal, o.l.) 8
Reise i arbeidet 9
Annet jobbformål (møte, e.l.) 10
Barns fritidsaktivitet 11
Egen fritidsaktivitet 12
Café, kino, teater, e.l. 13
Ellevtereise1 Hvor lang var denne turen (ca) i kilometer?
range:*
Distanse 1
Ellevtereise2 Du kan velge mer enn ett transportmiddel, dersom turen innebar en kombinasjon av flere
range:*
Elbil (som sjåfør) 1
Elbil (som passasjer) 2
Bensin/dieselbil (som sjåfør) 3
Bensin/dieselbil (som passasjer) 4
Tog 5
Fly 6
Båt/ferge 7
T-bane 8
Buss 9
Trikk 10
Motorsykkel/moped/scooter 11
Sykkel 12
Gange/løping 13
Annet 14
Preview of 'Conventional', version 8.0. Created 28.03.2014, 09:15
Tolvtereise Neste tur?
range:*
skip:nextsection
Foretok ikke flere turer den aktuelle dagen
1
Jobb/utdanningssted 2
Barns skole/barnehage 3
Hjem 4
Hytte/feriehus 5
Dagligvarehandel 6
Annen butikk/forretning 7
Transportterminal (stasjon, flyplass, fergeterminal, o.l.) 8
Reise i arbeidet 9
Annet jobbformål (møte, e.l.) 10
Barns fritidsaktivitet 11
Egen fritidsaktivitet 12
Café, kino, teater, e.l. 13
Tolvtereise1 Hvor lang var denne turen (ca) i kilometer?
range:*
Distanse
1
Tolvtereise2 Du kan velge mer enn ett transportmiddel, dersom turen innebar en kombinasjon av flere
range:*
Elbil (som sjåfør) 1
Elbil (som passasjer) 2
Bensin/dieselbil (som sjåfør) 3
Bensin/dieselbil (som passasjer) 4
Tog 5
Fly 6
Båt/ferge 7
T-bane 8
Buss 9
Trikk 10
Motorsykkel/moped/scooter 11
Sykkel 12
Preview of 'Conventional', version 8.0. Created 28.03.2014, 09:15
Tolvtereise2 Du kan velge mer enn ett transportmiddel, dersom turen innebar en kombinasjon av flere
Gange/løping 13
Annet 14
Information
Til slutt vil vi stille noen spørsmål om deg selv.
Label81 Til slutt har vi noen spørsmål om deg selv
Kjønn
range:*
Kvinne 1
Mann 2
Kvinne
3
Mann
4
Label82 Alder
range:*
1
Label83 Høyeste fullførte utdannelse range:*
Grunnskole 1
Videregående skole 2
Høyere utdanning av inntil fire års lengde 3
Høyere utdanning over fire års lengde 4
Label84 Yrkesstatus (hovedbeskjeftigelse) range:*
Student 1
Fulltidsansatt 2
Deltidsansatt 3
Selvstendig næringsdrivende 4

Preview of 'Conventional', version 8.0. Created 28.03.2014, 09:15
Label84 Yrkesstatus (hovedbeskjeftigelse)
Pensjonist 5
Trygdet 6
Annet 7
Yrke Type yrke
range:*
Jordbruk, skogbruk, fiske 1
Bergverksdrift og utvinning 2
Industri 3
Elektrisitet, vann og renovasjon 4
Bygg og anlegg 5
Varehandel, transport, hotell og restaurant 6
Informasjon og kommunikasjon 7
Finansiering og forsikring 8
Forretningsmessig tjenesteyting, eiendomsdrift 9
Offentlige tjenester, undervisning og helse 10
Personlig tjenesteyting ellers 11
Annet 12
Label86 Antall personer i husstanden
range:*
1
Label87 Antall personer i husstanden under 18 år
range:*
1
Label88_1 Hvor mange personer i husstanden har førerkort for bil?
range:*
1 person 1
2 personer 2
3 personer 3
Fler enn 3 personer 4
Label88 Husstandens samlede brutto årsinntekt
range:*
Under 200 000 1
Preview of 'Conventional', version 8.0. Created 28.03.2014, 09:15
Label88 Husstandens samlede brutto årsinntekt 200-500 000 2
500-800 000 3
800-1.000 000 4
Over 1.000 000 5
6
Ønsker ikke å oppgi 7
Label89 Boligområde
range:*
Storby (Oslo, Bergen, Trondheim, Stavanger) 1
By 2
Tettsted 3
Annet 4
Label50 Hva er postnummeret der du bor? Open
Label90 Er du medlem av en miljøorganisasjon? range:*
Ja 1
Nei 2
Label91 Hvor interessert er du i biler? range:*
Helt uninteressert
Ganske uinteressert
Verken/eller Litt interessertVeldig
interessert
1 2 3 4 5
Interesse
1
Label92 Hvordan ville du rangere din tekniske kompetanse når det gjelder bil?
range:*
Dårlig Ganske dårlig
Gjennomsnittlig
Ganske god God
1 2 3 4 5
Kompetanse
1
sluttid
range:*
afilla:sys_timenowf c
1
Preview of 'Conventional', version 8.0. Created 28.03.2014, 09:15
brukttid
range:*
afilla:sys_elapsedtime c
1
Information
Tusen takk for besvarelsen! Alle som svarer, kan delta i en trekning av tre gavekort á 2000,- kroner. For å delta i trekningen må du legge igjen din epostadresse (dette er selvsagt frivilllig).
epost_2 Skriv inn din epostadresse her:
Open
Open


Institute of Transport Economics (TØI) Norwegian Centre for Transport Research Established in 1964, the Institute of Transport Economics is an interdisciplinary, applied research centre with approximately 70 professionals. Its mission is to develop and disseminate transportation knowledge that has scientific quality and practical application. A private, non-profit foundation, TØI receives basic funding from the Research Council of Norway. However, the greater part of its revenue is generated through contract research. An important part of its activity is international research cooperation, mostly in the form of projects under the Framework Programmes of the European Commission.
Visiting and postal address: Institute of Transport Economics + 47 22 57 38 00 Gaustadalléen 21 [email protected] NO-0349 Oslo www.toi.no
TØI participates in the Oslo Centre for Interdisciplinary Environmental and Social Research (CIENS) located near the University of Oslo. See www.ciens.no
TØI covers all modes of transport and virtually all topics in transportation, including road safety, public transport, climate change and the environment, travel behaviour, tourism, land use and urban planning, decision-making processes, freight and travel demand, as well as general transport economics. Claiming copyright to its products, TØI acts independently of its clients in matters of scientific approach, professional judgment and evaluation. TØI reports are generally downloadable for free at www.toi.no.