electrical engineering digitalization
TRANSCRIPT

THE HONG KONG
INSTITUTION OF ENGINEERS
ELECTRICAL DIVISION
The 36th Annual Symposium
Tuesday
23rd October 2018
ELECTRICAL ENGINEERING
DIGITALIZATION – A, B & C (A, B & C stand for Artificial Intelligence, Big Data & Cloud Services)
at
Ballroom
Sheraton Hotel
Nathan Road
Kowloon
Hong Kong

- 1 -
SYMPOSIUM PROGRAMME
08.30 Registration and Coffee
09.00 Welcome Address
- Ir T.K. Chiang
Chairman, Electrical Division, The HKIE
09.05 Opening Address
- Ir Thomas K.C. Chan
Immediate Past President, The HKIE
09.10 Keynote Speech
- Mr Donald C.K. Mak
Assistant Government Chief Information Officer
Innovation and Technology Bureau
The Government of the HKSAR
1. Digital Grid
09.40 Airbone LiDAR Scanning for Overhead Line Vegetation Management
- Ir Brian C.F. Tsui, Deputy Director, Asset Development
- Mr Chris C.K. Cheung, Asset Development Engineer
- Mr K.L. Chan, Engineer I
CLP Power Hong Kong Limited
10.00 Digital Grid – Power Asset Management
- Mr Norbert Kaiser, Senior Asset Management Consultant
Siemens AG, Germany
- Mr Keith T.M. Wong, Digitalization Manager
Siemens Ltd., Hong Kong
10.20 Discussion
10.40 Coffee Break
2. Smart Transportation
11.10 Use of Bluetooth and Wifi for Monitoring Traffic and Pedestrian
- Professor Edward C.S. Chung
Professor
Department of Electrical Engineering
Hong Kong Polytechnic University
11.30 Smart Railway
- Ir C.L. Leung, Head of E&M Construction
- Ir Sha Wong, Head of E&M Engineering
MTR Corporation Ltd.

- 2 -
11.50 Development of Elevator Drives - Ir Dr Albert T.P. So, Honorary Lecturer
- Ir Dr Bryan M.H. Pong, Associate Professor
- Ir W.K. Lee, Principal Lecturer
- Dr K.H. Lam, Lecturer
Department of Electrical & Electronic Engineering
University of Hong Kong
12.10 Discussion
12.30 Lunch
3. Digitalization
14.15 BIM in respect of Digitalization - Ir C.K. Lee, Chief Engineer
- Ir Steve H.Y. Chan, Senior Engineer
- Ir Christy C.Y. Poon, Engineer
- Ir Grace K.M. Yip, Engineer
- Mr Francis P.H. Yuen, Assistant Engineer
Electrical & Mechanical Services Department
The Government of the HKSAR
14.35 Embrace the Power of Digitalization for a
Sustainable Hyper-Scale Data Centre
- Ir George K.C. Or, Director, Infrastructure Development
- Mr Dikson Choi, Technical Manager
Data Centre Business
NTT Com Asia Limited
14.55 Discussion
15.15 Coffee Break
4. Machine Intelligence & Data Mining
15.45 Deep Learning Technology & Applications with Big Data
- Professor Francis Y.L. Chin
Emeritus Professor & Honorary Professor
- Dr Bethany M.Y. Chan
Honorary Associate Professor
Department of Computer Science
University of Hong Kong

- 3 -
16.05 Preventive Maintenance by using Connected IoT Devices in
Electrical System - Mr Markus Hirschbold
EcoStruxure Power L&C Future Offer Director
Strategy and Innovation, Building & IT Business
Schneider Electric Ltd.
- Ir Ian Y.L. Lee
Solution Director
Schneider Electric (HK) Ltd.
16.25 Discussion
16.45 Summing Up
- Ir Dr Edward W.C. Lo
Symposium Chairman
Electrical Division, The HKIE
Closing Address
- Ir Professor Christopher Y.H. Chao
Dean
Faculty of Engineering
University of Hong Kong

- 4 -
Acknowledgement
The Electrical Division of The Hong Kong Institution of Engineers would like to express its
sincere appreciation and gratitude to the following persons and organizations for their
contributions to the Symposium.
Speakers/Authors
Mr Donald C.K. Mak
Ir Prof. Christopher Y.H. Chao
Ir Brian C.F. Tsui
Mr Chris C.K. Cheung
Mr K.L. Chan
Mr Norbert Kaiser
Mr Keith T.M. Wong
Prof. Edward C.S. Chung
Ir C.L. Leung
Ir Sha Wong
Ir Dr Albert T.P. So
Ir Dr Bryan M.H. Pong
Ir W.K. Lee
Dr K.H. Lam
Ir C.K. Lee
Ir Steve H.Y. Chan
Ir Christy C.Y. Poon
Ir Grace K.M. Yip
Mr Francis P.H. Yuen
Ir George K.C. Or
Mr Dikson Choi
Prof. Francis Y.L. Chin
Dr Bethany M.Y. Chan
Mr Markus Hirschbold
Ir Ian Y.L. Lee
Sponsors
Siemens Ltd.
CLP Power Hong Kong Ltd.
The Hongkong Electric Co., Ltd.
The Jardine Engineering Corporation Ltd.
Junefair Engineering Co. Ltd.
Elibo Engineering Ltd.
Keystone Electric Wire & Cable Co. Ltd.
Netsphere Solution Ltd.
MTR Corporation Ltd.
Kum Shing Group
C&K Instrument (HK) Ltd.
Greenland Engineering Co., Ltd.
Schneider Electric (Hong Kong) Limited
Mitsubishi Electric (Hong Kong) Ltd.
TE Connectivity Hong Kong Ltd.
Gammon E&M Limited
Metrix Engineering Co. Ltd.
Chat Horn Engineering Ltd.
FSE Engineering Group Ltd.
S.G.H. Electric Wire & Cable Co. Ltd.
The Hong Kong & Kowloon Electric Trade Association
Hong Kong Electrical Contractors’ Association Ltd.

- 5 -
36TH ANNUAL SYMPOSIUM ORGANIZING COMMITTEE
Symposium Chairman:
Members:
Hon. Secretary and Treasurer:
Ir Dr Edward C.W. Lo
Ir T.K. Chiang
Ir Tony K.T. Yeung
Ir Y.H. Chan
Ir Steve K.K. Chan
Ir Joseph C.W. Leung
Ir S.S. Tang
Ir Raymond K.M. Sze
Ms Candy H.M. Leung
Ms Yani Y.Y. Ko
Ir Y.K. Chu
Note:
All material in this booklet is copyright and may not be reproduced in whole or in part without written permission from The Hong Kong Institution of Engineers. All information and views expressed by speakers and in their conference materials do not reflect the
official opinion and position of the HKIE. No responsibility is accepted by the HKIE or their publisher for such information and
views including their accuracy, correctness and veracity.

Paper No. 1
AIRBORNE LiDAR SCANNING FOR
OVERHEAD LINE VEGETATION MANAGEMENT
Speakers: Ir Brian C.F. Tsui, Deputy Director, Asset Development
Mr Chris C.K. Cheung, Asset Development Engineer Mr K.L. Chan, Engineer I CLP Power Hong Kong Limited

- 1.1 -
AIRBORNE LiDAR SCANNING FOR
OVERHEAD LINE VEGETATION MANAGEMENT Ir Brian C.F. Tsui, Deputy Director, Asset Development
Mr Chris C.K. Cheung, Asset Development Engineer
Mr K.L. Chan, Engineer I
CLP Power Hong Kong Limited
ABSTRACT
CLP Power Hong Kong Limited (CLP Power) operates
a transmission network consisting of 400kV and 132kV
overhead line and cable which transmit electricity from
power stations to the bulk substations in the company’s
service area. Vegetation interference to overhead line is
a major cause of unplanned outages for the overhead
line system. It is therefore crucial to maintain effective
overhead line vegetation management in order to ensure
highly reliable electricity supply to customers.
The traditional overhead line vegetation inspection and
patrol are conducted by human visual observation.
However, there are certain limitations of this ground-
based and labour-intensive inspection method, such as
potential risks for patrolling at mountainous areas and
difficult terrain, as well as low accuracy of vegetation
clearance measurement due to blockage of visibility by
massive vegetation. With the objective to perform
proactive vegetation management planning, CLP Power
initiated a pilot project to assess the airborne remote
sensing technique and application on the vegetation
management to accurately evaluate the clearance
between overhead line conductors and nearby
vegetation, thus to enhance safety, efficiency and
effectiveness of vegetation inspection and management.
The key deliverables include vegetation risk
identification; accurate 3D spatial information of
overhead line structures and the surroundings;
implementation of Vegetation Management System to
visualise 3D models of the overhead line system and the
surrounding terrains.
This paper shares CLP Power’s experience of the first
Airborne LiDAR Scanning for transmission overhead
line vegetation management, which covers the project
approach, deliverables and benefits, and the way
forward to facilitate future regular scanning for
transmission overhead line to further enhance the
electricity supply reliability.
1. INTRODUCTION
CLP Power has been serving Hong Kong for over 116
years. It operates a vertically integrated electricity
supply business in Hong Kong, and provides a highly
reliable supply of electricity and excellent customer
services to six million people in its supply area.
LiDAR, which stands for Light Detection and Ranging,
is a remote aerial laser survey technology using remote
sensing technique based on light detection and ranging
measurements for collecting data to create 3D models
and maps of objects and environments. Airborne
scanning is commonly used for acquiring LiDAR data.
Onboard sensors can capture accurate positions and
orientation from the Global Navigation Satellite System
while measurements are taken from an Inertial
Measurement Unit (IMU). The resultant data is a
collection of point cloud LiDAR measurements which
provide accurate spatial data for the transmission
overhead line network and its surroundings. These data
would help display a precise overview of the assets of
the overhead line network with a terrain view using
accurate Digital Elevation Models (DEM), Digital
Surface Model (DSM), and Digital Object Models
(DOM).
The LiDAR data can be used for vegetation
encroachment analysis and assist in determining tree
trimming requirements based on the blowout or grow-in
conditions. It also allows operators to measure ground
to line safety clearances based on terrain data, and
analyse high risk overhead line sections susceptible to
high temperatures and strong winds.
Fig. 1 – Airborne LiDAR Scanning Point Cloud Model
2. THE LiDAR CONCEPT
LiDAR is an optical remote-sensing technique that uses
laser light to obtain accurate data of the surface terrain
and ground objects such as buildings, roads, electrical
tower structures and overhead line. During data
collection, each data point has a GPS coordinate
measurement tag to indicate location. For the airborne

- 1.2 -
LiDAR approach, the data accuracy was further
enhanced by combining with information obtained from
the synchronous observation survey points which work
concurrently at ground level during the airborne
scanning operations. The measurements then go through
a data analytics process and are summarized in a
database under different layers to distinguish them into
data classifications such as conductor, tower, and
buildings for user visualization.
Fig. 2 – Airborne LiDAR Scanning with Synchronous
Observation Ground Survey
3. ISSUES ON THE OVERHEAD LINE
NETWORK
One common cause of unplanned outages on overhead
line system is interference by overgrown trees or
vegetation. Thus, effective overhead line vegetation
management is crucial to ensure highly reliable
electricity supply, as well as to maintain the upkeep of
vegetation nearby. The current overhead line vegetation
inspection and patrol require human visual observation
which is labour-intensive. Some overhead lines are
located in remote areas of difficult terrain that are hard
to access. In addition, the accuracy of the vegetation
clearance measurements will be affected by different
factors such as poor weather conditions and blocked
visibility due to overgrown vegetation.
Airborne LiDAR scanning can improve the efficiency
of line inspection while reducing the risks involved and
virtually eliminates tower climbing. The 3D geospatial
models generated from LiDAR sensing results would
facilitate better decision making and optimise of human
resources allocation for site inspections. With the help
of the LiDAR data, vegetation management teams could
accurately locate areas with vegetation risks in the
overhead line system and develop a time schedule for
vegetation management that could maintain the
compliance for clearance requirements and upkeep of
surrounding vegetations. In November 2017, CLP
Power commenced a pilot project to assess the LiDAR
technology.
4. AIRBORNE LiDAR APPROACH
This project involved several challenges including
meeting a tight schedule, achieving quality standards,
whilst fulfilling flight operation requirements by the
Civil Aviation Department (CAD). The project sought a
balance among resources allocation, quality control and
project costs and time management. Execution
strategies which incorporated written plans to determine
flight routes, ground survey methods, and verification
of data quality were well defined beforehand with the
service provider. Regular feedbacks from frontline staff
and business intelligence were also collected and
relayed to the project team for continuous improvement.
Fig. 3 – LiDAR Scanning Equipment Attached to the
Helicopter
The project work comprised of three main components:
Helicopter Flight Operations, Data Processing and
Analysis, and Data Visualisation.
4.1 Flight Operations Plan
Prior to the commencement of airborne scanning, a
Flight Plan was developed to map out an efficient
helicopter route. The main concern was the reliability of
the collected data due to its dependence on whether the
existing Hong Kong Continuously Operating Reference
Stations (CORS) ground base station signal is
interrupted and reliance on static Ground Control Points
(GCP) to provide backup coverage. Other external
factors that needed to be considered include sensitive
flight areas and No-Fly-Zones defined by the CAD; as
well as changes in weather conditions that might
hamper flight progress, such as thunderstorms, haze,
and high wind speeds.
To ensure the survey coverage was sufficient, the
LiDAR operator determined a number of tailor-made
specifications for the airborne survey, which include the
output of two sets of coordinated data (WGS84 and
HK80), a targeted point cloud density level of 65 points
per square metre (ppsm), and the minimum horizontal
and vertical point cloud accuracy requirements. The
actual point density achieved was higher than specified
at approximately 125 ppsm. A fixed transmission
corridor width for the aerial survey was also specified.

- 1.3 -
For the pilot project implementation, a corridor width of
50m and 36m (with a 10m margin on both sides) was
specified for the 400kV and 132kV transmission lines
respectively. The captured LiDAR aerial images with an
orthophotography resolution of 2.6cm were then
embedded onto this corridor section at the DOM layer.
The entire flight plan took a total of 37 hours of actual
flight time to complete.
4.2 Data Processing and Analysis
Data processing is comprised of three main sub-
processes: (1) Data Layer Classification, (2) Danger and
Crossing Points, and (3) Data Analytics and Results.
(1) Data Layer Classification
The point cloud data is classified into specific layers in
the system for calculations and data analysis. For this
project, the vegetation management system requires
classification of the point cloud data into different layers
such as overhead wires, structures, roads, buildings,
vegetation, railways, rivers etc. After the primary
classification, some data will be further categorised into
sublayers, for example, roads would be divided into
highway, driveways, and walkways.
(2) Danger Point and Crossing Points
This part refers to determining which classified point
cloud data indicates significant risk to vegetation
management operators. The concerned data is
categorised into two different types: (a) vegetation
danger points, and (b) object crossing points.
Vegetation danger points indicate areas of vegetation
which are deemed to be within proximity from the
safety clearances of the overhead line system. This
information is important to a network operator as it
helps prioritise tree trimming works. The 3D visual
interface allows a network operator to very quickly
determine the areas of higher vegetation risks before site
inspection, and allocate vegetation management
resources more efficiently.
Fig. 4 – Line Profile Analysis for 400kV Overhead Line
The object crossing points refer to LiDAR data points
indicating objects directly underneath the overhead line
and deemed to be within minimum clearance
requirements. The analysis involves an investigation of
all crossing points showed in the model to calculate the
vertical distances between the object and the overhead
line. This database of crossing points can be used to
identify those potential risk points with insufficient
clearance and enable better overhead line corridor
management.
(3) Data Analytics and Results
After data collection and processing, in-depth analysis
was performed on the data set to obtain a summary of
the results in the form of inspection reports. The result
findings provide critical information and valuable
insight, such as the location of vegetation danger points
and crossing points, to assist vegetation operators in
making decisions for remedial action. There are seven
types of inspection data available:
a. Object Safety Distance provides a summary of the
vegetation danger points and clearance information.
b. Falling Tree Safety Distance provides a summary of
clearances for anticipated fallen tree objects.
c. Cross-over provides a summary of clearances and
information of objects which cross underneath the
overhead line.
d. Tower/Pole Inclination is a summary of the
transmission tower conditions on site, showing
details regarding tower tilt/gradient and bearing of
the inclination.
e. Safe Distance under High Temperature Simulated
Conditions provides a summary of increased
conductor sag due to high temperature.
f. Safe Distance under High Load Simulated
Conditions provides a summary of increased
conductor sag due to high load.
g. Safe Distance under High Wind Simulated
Conditions provides a summary of conductor swing
due to high wind conditions.
The inspection data provides detailed information on
point cloud data clearances of vegetation danger points
and crossing points, location coordinates of asset
structures, as well as a ranking of hazard levels. The
results from the data analytics enable operators to better
understand site conditions prior to allocating site
resources and assist in vegetation management.
4.3 Data Visualization
Upon completion of the data processing and analysis
phase, the classification layers for point cloud data,
danger points and crossing points are assembled and
distributed to the three separated platforms, namely the
Client Server, the Browser Server and the Mobile
Server, of the vegetation management system (VMS).
(1) Client Server
The Client Server (C/S) can display point cloud and
geographic data in KML format in a 3D panorama,
perform data query functions, and generate clearance

- 1.4 -
statistics. It retains its own data set including point cloud
data and KML models, DEM, image tiles, and video
files. Access to the VMS interface is performed locally,
with local administrative control. The user can perform
functions such as danger point and crossing point
analysis, horizontal, vertical and spatial measurements,
and locate tower and pole structures with navigation
tools. The C/S platform has advantages in processing
speed with its inherent local retention of data, but lacks
an online access portal.
Fig. 5 – Client Server (C/S) Vegetation Management
System
(2) Browser Server
Browser Server (B/S) operates as a client-to-host
platform and supports multiple clients access at the
same time. The functions and features of B/S are
basically similar to that of the C/S. The major difference
is that B/S operates online through the web. The Server
runs Microsoft Windows Server 2016 Standard and is
linked with a SQL database server. The B/S vegetation
management system then accesses this database for
displaying the point cloud and KML data.
The advantages of the B/S platform are that multiple
users can simultaneously access a same set of data (from
Server), and updates to the data set are completed once
at a centralised location. However, the operation speed
of the software platform might be constrained by the
bandwidth of online connection speeds, in particular
during periods of heavy user congestion. A high level of
administrative control is also required to meet cyber
security requirements.
(3) Mobile Server
Mobile Server (M/S) is a portable application that runs
on the mobile iOS operating system. The application is
not as powerful as C/S and B/S due to limited CPU
speeds. Although the M/S platform can display 3D
KML models and generate danger point and crossing
point statistics, it cannot show point cloud data nor
allow users to measure horizontal, vertical, or spatial
distances. However, the M/S has other special features
including live photo capturing and real-time upload to a
Picture Server. It provides frontline staff with a tool to
capture maintenance related conditions on tower and
pole structures. The portable mapping function and
navigation tools of the M/S would help frontline staff to
find the travel routes and access to structures.
5. BENEFITS OF THE LiDAR TECHNOLOGY
The introduction of LiDAR technology to the vegetation
management system brings direct benefits to power
system operators and the customers through improving
power system reliability, enhancing customer services,
and streamlining internal processes. There were several
tangible benefits realised upon completion of the
project.
5.1 Accurate Geospatial Information
As part of the project deliverables, the set of reports
generated by the vegetation management system can
highlight clearance from objects, crossover of objects
(such as line-object, line-line), tree to line clearances,
and safe clearance distances based on conductor
working conditions under high temperature, high load,
or high wind. These functions, which once required
lengthy site visits and cumbersome calculations, can
now be performed very quickly on the VMS interface
on a desktop computer.
Mitigating risks such as outages caused by vegetation
interference is a key benefit of the project which
provides up-to-date geospatial information of the
surrounding environment of the overhead line system.
These information and data enable the operator to
conduct vegetation management with enhanced
efficiency and reduced risks.
Fig. 6 – Overhead Line Safety Clearance Analysis
5.2 Identify Vegetation Risks
Overgrown vegetation is a major cause of unplanned
overhead line outages that undermine power quality.
The LiDAR data helps operators to make more effective
plans for line inspection and improve resources
utilisation for vegetation clearance by prioritising tree
trimming according to the risk levels. This results in
fewer line outages caused by overgrown trees and
falling branches, and a direct reduction in overall
network downtime.

- 1.5 -
Fig. 7 – Identification of Vegetation Risks or “Danger
Points”
A particular area of the project with development
potential is the ability to monitor trends in vegetation
growth and forecast hazards ahead of time. This can be
achieved by categorising areas of particular tree species
with similar growth rates to project the growing trends
for formulating pro-active vegetation management plan
and optimise work packages. This application of the
technology will facilitate smart and efficient vegetation
management.
5.3 Improved Safety and Sustainable Vegetation
Management
The project has a direct impact on improving personnel
safety as airborne scanning enable faster and safer
inspections for crews by greatly reduce the need for
unnecessary line patrols, in particular in areas with
potential hazards and risks. The scanning results enable
operators to better manage the allocation of human
resources for efficient and sustainable vegetation
management and minimise environmental harm.
6. POTENTIAL APPLICATIONS
The results and findings from the pilot project have
opened the door for other potential applications.
6.1 Geological Hazard Analysis
With the LiDAR data, the vegetation management
system enables operators to conduct analysis on slope
stability and how it may affect transmission tower
foundations. For example, the high-resolution photos
taken by airborne scanning can be used for detailed
analysis of geotechnical related issues such as
landslides, soil erosion, or failure of the ground surface.
Fig. 8 – Geological Hazard Analysis - Landslide
6.2 Overhead Line (OHL) Corridor and Asset Condition
Assessment
After completion of data analysis and processing, the
system generates a suite of geospatial models and a
comprehensive asset database with high-resolution
photos. This enables the user to view and manage
individual structures and line circuits, as well as track
the locate assets according to the GPS coordinate
system on a 3-D platform. The high-resolution photos
enable operators to conduct quick corridor inspections,
as well as identifying missing or broken insulators, or
damaged equipment on the overhead line and tower
structures.
Fig. 9 – Insulator Condition Assessment – Broken
Insulator Identified
6.3 Route Planning for Line Patrol
One critical element in the vegetation management life
cycle is the ability for the operator to conduct route
planning for line patrol staff. While previously,
vegetation management teams would rely on 2D
topographic maps and site experiences to plan their line
visits; the LiDAR scanning results produce a thorough
and 3-D view of the terrain which assists site staff to
plan and allocate their resources more efficiently. The
navigation feature of the Mobile Server (M/S) platform
interface allows users to plot and generate travel routes.
In the future, CLP Power plans to further develop the
mobile app together with the existing company’s Geo
Information Portal (PGIP) hiking trail to provide a more
efficient path for vegetation management teams to plan
their travel routes.
7. THE WAY FORWARD
It is with no doubt that collecting accurate data on
vegetation clearances forms a critical part of the overall
vegetation management strategy. Without an intelligent
solution such as LiDAR to collect accurate information,
a considerable amount of resource is needed for
planning and execution of vegetation management
tasks. Looking ahead, there is a need to review possible
options for conducting regular remote aerial scanning in
the future. CLP Power is exploring several technologies
including Unmanned Aerial Vehicles (UAVs) to
conduct airborne scanning, data collection by
photogrammetric methods, and the use of satellite
imagery.

- 1.6 -
7.1 Unmanned Aerial Vehicles (UAV)
Unmanned Aerial Vehicles (UAV) is an emerging trend
of airborne scanning as a cost-effective way to
supplement LiDAR scanning conducted by helicopter.
UAVs, which are able to hover in close proximity to the
electrical assets, can obtain high resolution photos and
data on overhead lines and structures with significantly
lower cost when compares to helicopters. Although
application of UAVs is limited to localised inspections,
UAVs can be dispatched to no-fly-zones and locations
that are not traversable by helicopters. The UAVs can
obtain detailed asset information from these areas and
provide a more intricate view of structure components
which require special attention. Additionally, the
advancements in drone technologies in recent years
have seen the battery life extended well enough for
industrial applications requiring robust performance
including the monitoring of power assets [1].
7.2 Photogrammetry
Photogrammetric method provides permanent, accurate
and measurable photographic records of the site
conditions for clearance measurements and analyses.
This method is also attractive as the existing DEM and
topographic data developed from the first LiDAR
scanning may be reused, resulting in both work and cost
savings.
7.3 Satellite Imagery
Satellite data collection inherently has a time delay and
do not provide the level of details which LiDAR
scanning can capture because satellite data is only 2D
and does not support measurement of clearances.
Satellite imagery however, does provide a good
overview of the surrounding environment around the
electrical power assets. The satellite imagery method
uses short-wave infra-red bands that can detect objects
even obstructed by cloud cover and water vapor. The
latest commercial satellites also provide automatic
correction for environmental interferences such as
clouds, aerosols, water vapor, ice and snow [2]. This
technology can obtain good resolution images in all
weather conditions with a relatively lower cost, and can
provide an overview of the overhead line network
quickly and efficiently.
8. CONCLUSION
Overall, the result from the first LiDAR airborne
scanning project has provided an excellent database for
CLP Power to further improve the existing vegetation
management practices. The project is also a big step
forward towards building a complete 3D asset
management system that incorporates geospatial models
for CLP Power’s overhead line network. There is a need
to review the current data attained from the project and
determine which parts could be reused for future
scanning. This will ensure best use of resources for
effective vegetation management and facilitate a pro-
active approach for vegetation management planning.
REFERENCES
1. “The Rise of Drones – Analysis of Current and
Future Applications of Drones in Terrestrial Remote
Sensing”, International Space University, 2017
2. “DigitalGlobe – WorldView-3” website
Web link: http://worldview3.digitalglobe.com/

Paper No. 2
DIGITAL GRID – POWER ASSET MANAGEMENT
Speakers: Mr Norbert Kaiser, Senior Asset Management Consultant
Siemens AG, Germany Mr Keith T.M. Wong, Digitalization Manager Siemens Ltd., Hong Kong

- 2.1 -
DIGITAL GRID – POWER ASSET MANAGEMENT Mr Norbert Kaiser, Senior Asset Management Consultant
Siemens AG, Germany
Mr Keith T.M. Wong, Digitalization Manager
Siemens Ltd., Hong Kong
ABSTRACT
Digitalization is the use of digital technologies to
change business models and to lever value-producing
opportunities, which usually also implies a wide use of
data. The modern digital substations will provide a
dramatically increasing amount of data (huge amount of
data), once new intelligent electronic devices and
sensors will be added to substation automation system
which ideally designed with an open architecture.
Benefits in reliability, efficiency and sustainability can
be taken from these data.
Typically, one of the core elements for the electrical
grid – the substation, consists of various complex assets
– things that may be connected to the Internet of Things
(IoT). Important use cases, including the connectivity,
lie in the field of the management of these assets
including visualization of analytics results e.g. on
importance for the grid and consequence of failures. A
general distinction needs to be made between primary
assets (i.e. transformers, gas-insulated switchgears,
circuit breakers, overhead lines, cables, surge
arresters, …) and secondary assets (i.e. electronic
components like protection relays, bay controllers,
merging units, RTUs, switches, routers, computers,
including the software components running on these
devices).
In this paper, we deal with the subject of assessing the
condition of a given asset by gathering and interpreting
data derived from the digital systems. We also discuss
how this data can be converted to information and used
together with other operational parameters – like the
above mentioned importance – to provide actionable
asset management recommendations on asset as well as
on grid level.
1. DIGITAL SUBSTATION
Electrical Substations are one of the core elements in
power grids. Its operational efficiency includes the tasks
of maintenance, service restoration and asset
productivity. And the core mission of the Utilities is to
ensure the availability and reliability of the power grid
in their geographical area of responsibility. To achieve
these missions, other than conventional time based
maintenance, the operator shall apply digital and
sensing technology to assess the asset performance and
condition to enable an improvement of the efficiency,
in-service life and to minimize both planned and
unplanned outages.
Substations with the digitalized station level have been
introduced far more than one decade, In general, a
digital substation usually refers to the implementation
of substation automation system, including protection
relays, bay controllers, remote terminal units (RTUs)
and substation controllers, which all usually named as
Intelligent Electronic Devices (IED), whereas the data
exchange through an Ethernet-based, digital station bus,
commonly Modbus TCP/IP and IEC 61850 has become
the interoperable worldwide substation automation
communication standard. The IEC61850 commun-
ication protocol, in addition to the vertical
communication for monitoring and control, supports
also communication between bay devices on the same
level and enables flexible solutions. These devices
allow the implementation of individual continuous
function charts (CFCs) and the availability of data in the
digital station bus enable distributed logics throughout
devices and bays. And the latest generation of devices
applied the more recent innovations in this field include
modularity and scalability throughout their lifetime and
the more advanced dissociation of the device hardware
and its firmware (i.e. functionality). Extension modules
enabling for instance new communication possibilities
can be added to existing devices even years after
commissioning. Using new protection functions in an
existing relay is just a question of configuration. And
powerful automation devices may host de-centralized,
evolving applications that help to master complex
challenges in a dynamically changing environment.
Nowadays, in addition to the digitalization in station
level, the industry is also implementing the
digitalization in process level. The concept of a fully
digitalized process level includes so-called non-
conventional instrument transformers (NCITs) that
replace conventional current transformers (CTs) and

- 2.2 -
voltage transformers (VTs), using new, low-power
measurement principles that are illustrated in Figure 1.
Fig. 1 – Digitalization in Process Level
The NCITs show an improved measurement
performance, namely avoiding ferro-resonance effects
and cover a very wide measuring range, as there is no
ratio to be considered. This innovation also significantly
reduces the size and weight compared with conventional
CTs and VTs.
On the secondary side, the Merging Units (MU) are
installed very close to the switchyard and transform the
output signals of (depending on their type conventional
or dedicated non-conventional) CTs and VTs into
digital data points, so called sampled measured values
(SMVs). The measurements are thus available –
practically from the switchyard on – in a digital format.
This reduces cost-ineffective hardwiring significantly,
especially in the substations with long distances. Safety
is improved, as NCIT sensors provide low-power
signals and the risk of an internal arc is minimized. The
sampled measured values that are provided by the
Merging Unit according to IEC 61850-9-2 in the
process bus can be used by IEDs of different vendors
for various applications, such as different protection
functions/relays and metering. One protection relay is
not necessarily linked to only one measuring point. This
provides many functional possibilities and a maximum
of flexibility and scalability.
These digital technologies involve real expenses and
modifications as well as established procedures in the
design, engineering, operation and maintenance of the
critical power transmission grid. The IEDs and NCITs
are usually equipped with multi-functioning, such as
condition monitoring of circuit breakers by contact
wearing and/or integrated temperature sensor to further
lever tangible benefits. The technologies enable
Integrated Substation Condition Monitoring (ISCM).
By using an integrated data model for primary and
secondary engineering, device and software
configuration and testing, the level of automation
throughout this value chain, can be significantly
increased, and will lead to important time and quality
improvements. By maintaining this data model
throughout the substation life time, also later
adaptations or enhancements of the existing system are
easily made possible.
2. INTEGRATED SUBSTATION CONDITION
MONITORING
Monitoring (e.g. temperature at transformers) is known
for more than decades; however, monitoring has
become increasingly more advanced over the years. The
development of condition monitoring took place for
each type of asset on its own. This resulted in no or
limited synergy at condition monitoring. With
Integrated Substation Condition Monitoring a leading
role has been taken to establish a platform which is
suitable for connecting different types of T&D
monitoring systems. With this platform standard
modules can be offered very efficiently and are proven
in the market. On the other hand, the platform is open to
customer specific solutions for optimal integration.
The Integrated Substation Condition Monitoring is a
modularized approach, surveying all relevant
Substation components. It can be implemented in the
existing substation communication and visualization
infrastructure. Starting from simple asset embedded
value monitors up to fully integrated condition
monitoring – with generation of recommendations. It
includes
One central system (single platform)
One look and feel
Implementation in Central Monitoring System
(SCADA likes)
Asset specific “Knowledge Modules”
Available for various standards (e.g. IEC, ANSI)
Sensors for all types of monitored assets
Nowadays, Utilities face a number of unique challenges:
expenditure is being cut, knowledge and expertise is
being lost when people retire or through downsizing.
Furthermore, operating aging equipment at higher levels
impacts on lifespan and reliability. Yet, utilities are
expected to maintain continually levels of performance.
Application of Condition Monitoring can provide
answers. It is an important element of both asset
management and operation support providing
recommendations based diagnostics of measured values.
The implementation of Digital Substation technology
can provide the visibility of primary equipment like
circuit breaker in terms of condition and power quality.
The additional condition monitoring modules such as
partial discharge and gas purity have to be implemented
in a way that complete asset-related condition
information is available to the operator and the asset
manager in a common format.

- 2.3 -
The ISCM is based on expert knowledge modules for
every asset family. By carrying unique competence and
manufacturer experience, the sophisticated modeling
techniques, Knowledge Modules, cover all primary
asset types, and each module focuses on improving the
reliability of the equipment as well as on the reduction
of unscheduled downtime by monitoring and predicting
equipment health. A typical knowledge module for a
circuit breaker monitoring is shown in Figure 2. The
data acquisition units or IEDs for the standard available
modules are predefined. Knowledge modules diagnose
and evaluate condition information for visualization and
furthermore for recommendations. The availability of
asset condition status is the prerequisite for generation
of actionable recommendations. The knowledge
modules are hosted in a ‘software frame’ which is
designed to communicate system internally via data-
interfaces protocol with the ISCM HMI (Human
Machine Interface) or Central Monitoring system.
Fig. 2 – Typical Knowledge Module for a Circuit
Breaker Monitoring
The knowledge modules are independent from an
existing hardware platform and can be implemented in
the different Condition Monitoring level from
substation control system up to the Central Data
Acquisition Units or to the Control Center. For some
monitoring modules a selection can be made between
different kinds of knowledge modules. The knowledge
modules, and thereby their evaluation, vary due to
different norms (e.g. IEC / ANSI), standards or used
best practices (e.g. Manufacturer’s experience). The
different modules offer different information of all the
various important network assets. The customer decides
which knowledge module to implement. Diagnosis and
prognosis is an essential need for Operators and Asset
Managers of complex systems to optimize equipment
performance and to reduce unscheduled downtime.
With predefined data acquisition units, Utilities save
engineering costs, deliver well proved units and
minimize customer specific solution with their
relatively high maintenance costs.
Another innovation of Integrated Substation Condition
Monitoring is the evaluation of the logged data with
centrally administrated knowledge modules on
substation or preferably control centre level. Centrally,
with one look and feel for the user. This means that the
visualization and operation of transformer monitoring is
aligned (e.g. alarm levels) with high voltage monitoring
modules. The HMI can be installed at substation level,
control center level or at company level.
The ISCM is NOT a new Condition Monitoring System;
it is an approach which enables Utilities to supervise
various condition monitoring systems for an integrated
substation approach for substation’s primary asset types
including connections with overhead lines, cables and
Balance of Plant assets. It offers internal synergies,
significant price/cost reduction potential if more asset /
asset clusters (e.g. Transformers and Gas Insulated
Switchgear) are implemented. Connecting the ISCM at
company level, with integration in the business
architecture with Reliability Centered Asset
Management (RCAM) suite, which will be discussed in
next Section, is the ‘on top’ solution from sensor up to
ERP, i.e. enterprise resource planning systems, provides
reliable information about the health and ageing state of
the devices in operation. The RCAM suite supplies a
consistent asset data model, where all commercial,
technical and geographical figures are persistently
stored. The information analyses functions support the
decision making process for the asset manager (replace,
repair and invest). It is a modular and SOA-based
solution, boosting the efficiency, transparency, and
flexibility of grid asset management, and helps to
control risks and balances technical necessities and
economic feasibility. The combination of these systems,
within a Smart Grid structure, helps to minimize
downtimes, maximize asset performance through
integrated maintenance planning and pave the way for
reduced lifecycle costs and an extended service life of
the assets.
3. RELIABILITY CENTERED ASSET
MANAGEMENT
Many traditional asset management strategies (such as
time-based maintenance schemes) often ignore the
actual condition of the equipment. These strategies as
Incidental / Basic Asset Management strategies, which
essentially involve performing isolated reactive/
corrective interventions on the assets (such as
preventive maintenance, replacement, refurbishment,
etc.) based on elapsed time or some measure of
equipment utilization (e.g., number of breaker trips).
This Section describes a modular approach for a
Reliability Centered Asset Management process. Figure
3 gives an overview of the modular structure of the
RCAM process. The goal of this process is to analyze
and evaluate relevant technical and economical aspects
of network operation, and to derive improved asset
management strategies for the considered component
classes – i.e. strategies for both content and time
intervals of preventive maintenance actions, as well as
for the technical lifetime specification. The technical

- 2.4 -
and economical effects of such measures are very
complex and even temporally decoupled, but can be
bridged by the use of innovative Asset Management
methodologies.
In the definition of the component classes (e.g. only one
class switchgear, or separated into circuit breakers /
isolators / other), the benefit of more detailed results has
to be weighed against the availability of suitable input
data and against the increasing effort of data acquisition.
Fig. 3 – Reliability Centered Asset Management
Process
The RCAM process is structured into three basic steps:
1) Analysis the current asset reliability of network
components
The asset condition parameter values can be collected
from online and offline information such as
maintenance and operational records, sensor signals.
As mentioned in the previous Section, the ISCM allows
a comprehensive way to collect and diagnosis the data
to useful information via the knowledge modules. The
reliability of components, both in the present and
projected into the future can be estimated from the
diagnosis results. A simple and effective way to
manage this complexity is the use of a composite
indicator generally known as Condition Index or, more
commonly, Health Index (HI).
Fig. 4 – Generic Workflow to determine Health Index
The HI is a numerical representation of the estimated
condition of a given asset. In principle, HI should: i) be
indicative of the suitability of the asset for continued
service, ii) contain objective and verifiable measures of
asset condition, iii) be understandable, iv) be readily
interpreted, and v) be correlated with the asset risk of
failure and remaining useful life. The development of
the Health Index metric is quite a complex matter, as it
is usually customized (tailor made) for every asset type
and for every system/utility.
Figure 4 shows the generic work flow of how HI
determined.
2) Systematic analysis of the network (Criticality and
Risk Assessment)
The second element required for the determination of
effective asset management strategies is the importance
of the assets. Importance can be measured in terms of
Importance Indices, Criticality Indices, and/or
probabilistic assumptions like ‘Energy not supplied in
time’. Importance is brought together with asset
condition to generate actionable recommendations on
the individual asset level. Importance indices can be
qualitative or quantitative. Quantitative methods are: i)
the use of Failure Modes and Effects Analysis (FMEA)
and/or Failure Mode, Effects, and Criticality Analyses
(FMECA) to obtain e.g. a Risk Priority Number (RPN)
and a Criticality Index, and/or, ii) power system
simulations. RPN and Criticality Indices can be used as
a numerical estimate of asset importance, and
contingency analysis, as part of system simulations,
could reveal how important an asset is from the
standpoint of network operation and/or reliability.
The risk associated with an asset is the sum of all the
consequences of potential/future outages, usually
expressed in monetary terms. The risk is linked to a
failure rate or failure frequency, which is assumed to be
affected by the asset condition. Figure 5 shows the
typical factors that are considered in the estimation of
the asset risks. These factors are combined together to
derive a Criticality (or Importance) Index. Monetary
cost of failure of an asset encompasses OpEx and
CapEx for foreseen interventions besides expenditure
estimates for each of the factors listed in Figure 5.
Fig. 5 – Typical Factors are considered in the
Estimation of the Asset Risks
- 2.5 -
3) Synthesis of optimized asset management
strategies
The final stage is to combine the results of asset
condition assessment and importance to produce more
effective asset management actions, strategies, and
plans. These outputs should provide an adequate
balance of risk mitigation, expected network
performance, and maintenance/intervention costs.
Reliability Centered Asset Management (RCAM® ) is a
proven Siemens methodology for linking asset
condition (in terms of Health Indices which are based
on aging, deterioration, wear and tear) and asset
importance (priority in the grid, usually obtained from
FMEA analysis or system simulations) to develop,
continuously improve, and optimize operational
maintenance strategies. The RCAM methodology
includes a Condition-Importance diagram where the
Condition is based on the HI and Importance is
classified according to the necessity of the asset towards
an effective, reliable and safe grid operation.
Based on such a diagram shown in Figure 6, optimized
maintenance strategies can be charted out combining
corrective and condition based maintenance ranging
from extended time interval to OEM interval to annual
or periodic monthly inspections.
Fig. 6 – Condition – Importance Diagram
One of the main goals of the RCAM methodology is
also to find the strategic intervention type and moment
in time that minimizes the Present Value of the sum of
Risk and Intervention costs.
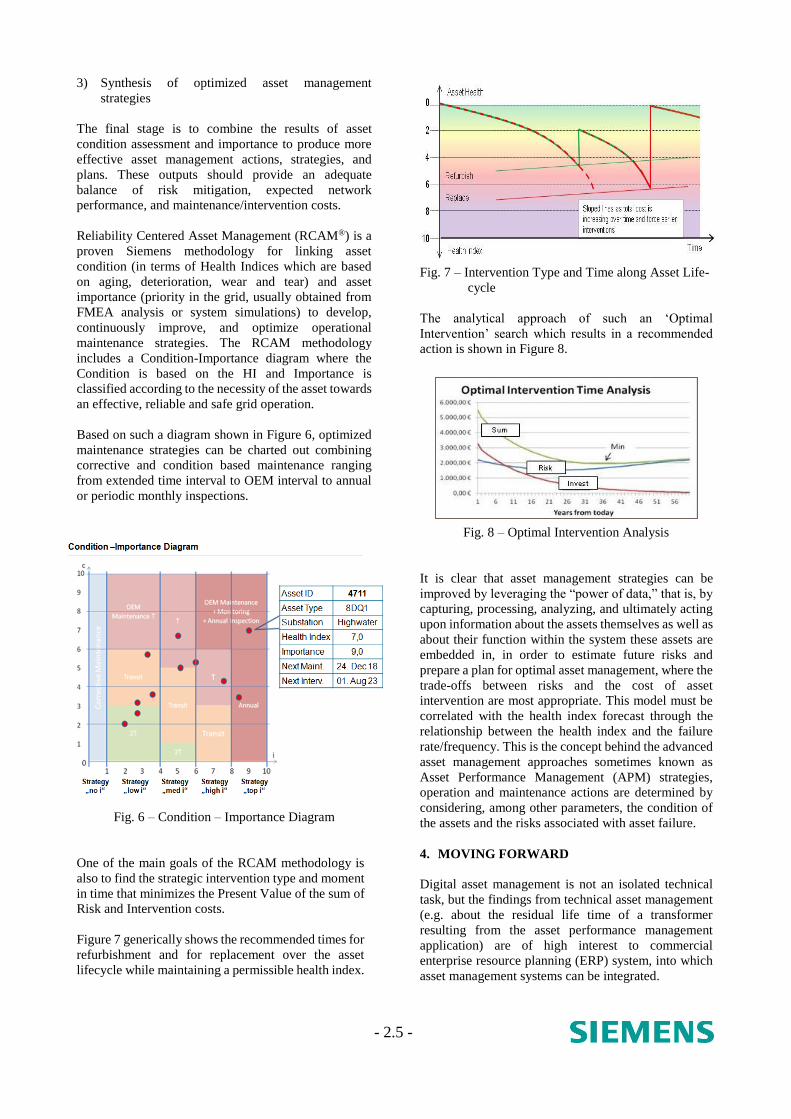
Figure 7 generically shows the recommended times for
refurbishment and for replacement over the asset
lifecycle while maintaining a permissible health index.
Fig. 7 – Intervention Type and Time along Asset Life-
cycle
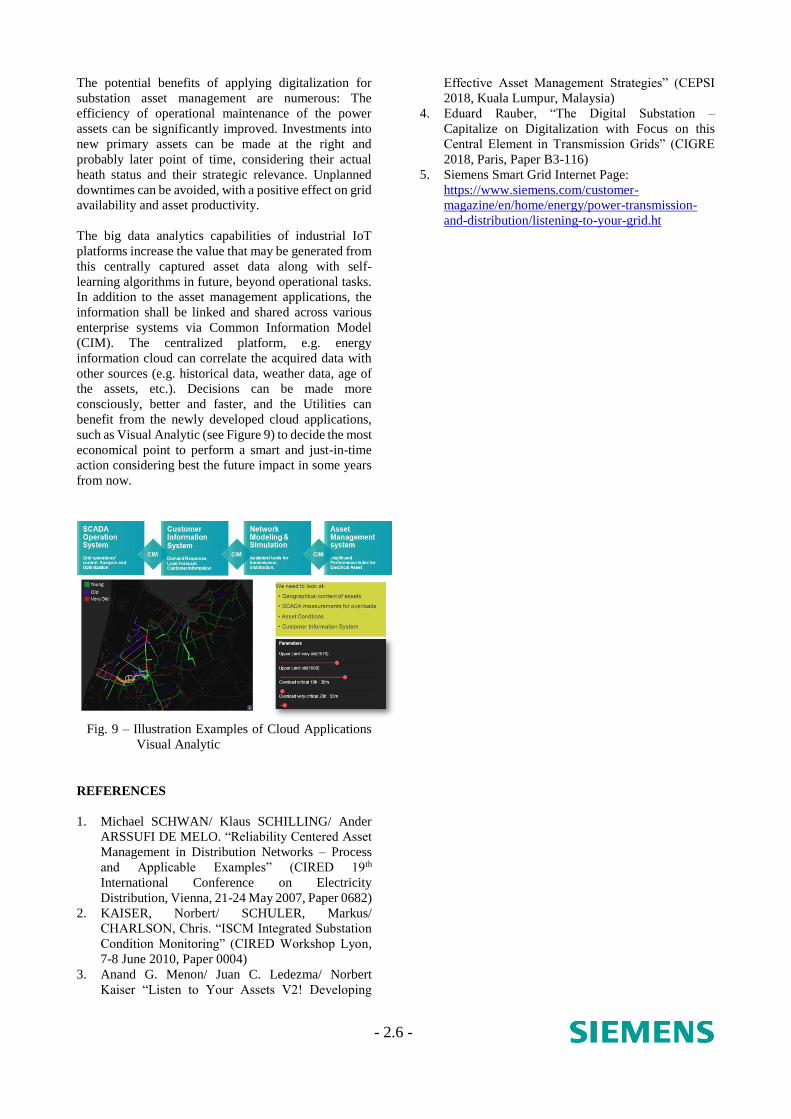
The analytical approach of such an ‘Optimal
Intervention’ search which results in a recommended
action is shown in Figure 8.
Fig. 8 – Optimal Intervention Analysis
It is clear that asset management strategies can be
improved by leveraging the “power of data,” that is, by
capturing, processing, analyzing, and ultimately acting
upon information about the assets themselves as well as
about their function within the system these assets are
embedded in, in order to estimate future risks and
prepare a plan for optimal asset management, where the
trade-offs between risks and the cost of asset
intervention are most appropriate. This model must be
correlated with the health index forecast through the
relationship between the health index and the failure
rate/frequency. This is the concept behind the advanced
asset management approaches sometimes known as
Asset Performance Management (APM) strategies,
operation and maintenance actions are determined by
considering, among other parameters, the condition of
the assets and the risks associated with asset failure.
4. MOVING FORWARD
Digital asset management is not an isolated technical
task, but the findings from technical asset management
(e.g. about the residual life time of a transformer
resulting from the asset performance management
application) are of high interest to commercial
enterprise resource planning (ERP) system, into which
asset management systems can be integrated.
- 2.6 -
The potential benefits of applying digitalization for
substation asset management are numerous: The
efficiency of operational maintenance of the power
assets can be significantly improved. Investments into
new primary assets can be made at the right and
probably later point of time, considering their actual
heath status and their strategic relevance. Unplanned
downtimes can be avoided, with a positive effect on grid
availability and asset productivity.
The big data analytics capabilities of industrial IoT
platforms increase the value that may be generated from
this centrally captured asset data along with self-
learning algorithms in future, beyond operational tasks.
In addition to the asset management applications, the
information shall be linked and shared across various
enterprise systems via Common Information Model
(CIM). The centralized platform, e.g. energy
information cloud can correlate the acquired data with
other sources (e.g. historical data, weather data, age of
the assets, etc.). Decisions can be made more
consciously, better and faster, and the Utilities can
benefit from the newly developed cloud applications,
such as Visual Analytic (see Figure 9) to decide the most
economical point to perform a smart and just-in-time
action considering best the future impact in some years
from now.
Fig. 9 – Illustration Examples of Cloud Applications
Visual Analytic
REFERENCES
1. Michael SCHWAN/ Klaus SCHILLING/ Ander
ARSSUFI DE MELO. “Reliability Centered Asset
Management in Distribution Networks – Process
and Applicable Examples” (CIRED 19th
International Conference on Electricity
Distribution, Vienna, 21-24 May 2007, Paper 0682)
2. KAISER, Norbert/ SCHULER, Markus/
CHARLSON, Chris. “ISCM Integrated Substation
Condition Monitoring” (CIRED Workshop Lyon,
7-8 June 2010, Paper 0004)
3. Anand G. Menon/ Juan C. Ledezma/ Norbert
Kaiser “Listen to Your Assets V2! Developing
Effective Asset Management Strategies” (CEPSI
2018, Kuala Lumpur, Malaysia)
4. Eduard Rauber, “The Digital Substation –
Capitalize on Digitalization with Focus on this
Central Element in Transmission Grids” (CIGRE
2018, Paris, Paper B3-116)
5. Siemens Smart Grid Internet Page:
https://www.siemens.com/customer-
magazine/en/home/energy/power-transmission-
and-distribution/listening-to-your-grid.ht

Paper No. 3
USE OF BLUETOOTH & WIFI FOR
MONITORING TRAFFIC AND PEDESTRIAN
Speaker: Professor Edward C.S. Chung
Professor
Department of Electrical Engineering
Hong Kong Polytechnic University

- 3.1 -
USE OF BLUETOOTH & WIFI FOR
MONITORING TRAFFIC AND PEDESTRIAN† Professor Edward C.S. Chung
Professor
Department of Electrical Engineering
Hong Kong Polytechnic University
ABSTRACT
This paper presents a review of the research on the use
of Bluetooth and Wifi for monitoring traffic and
pedestrian movement. This in an excerpt of the past
publications of the author and his co-authors. For details
of past research, readers are recommended to read
references [2-4, 9-13, 21, 29, 37-38].
1. INTRODUCTION
Transport agencies collect data to monitor, manage and
control traffic, and to plan for future infrastructure.
There are two broad categories of sensors used in these
data collection. Fixed sensors such as loop detectors that
provide traffic information at the location where the
sensors are installed and mobile sensors such as GPS
equipped vehicles that provide data for the entire
journey of the vehicle equipped with such sensors.
In early 2000, researchers explored the use of Bluetooth
(BT) technology for the automotive industry. Nusser
and Plez (2000) presented the architecture of the
Bluetooth network as an integral part of in-car
communication and information systems. Researchers
(Sawant et al., 2004, Murphy et al., 2002 , Pasolini and
Verdone, 2002) have tested the proof-of-concept for the
use of BT for Intelligent Transport System services, and
have verified that the BT equipped devices in moving
vehicles could be discovered.
Recently, there has been significant interest from
transport agencies in exploiting the Bluetooth Media
Access Control Scanner (BMS) as a complementary
transport data source. The concept behind BMS is rather
simple. A BMS scanner has a communication range (say
around 100 meters in radius) that we term as zone. The
zone is scanned to read the Media Access Control
addresses (MAC-ID) of the discoverable BT devices
transiting within the zone.
The MAC-ID is a unique, alpha-numeric string, that is
communicated by the discoverable BT device.
According to ABI Research, in 2018, 86% of all new
vehicles will include Bluetooth connectivity (Bluetooth
SIG, 2018). Bluetooth is behind in-car infotainment
systems that enable hands-free calling and audio
streaming.
† This paper is an excerpt of published papers by the author.
2. THE BIRTH OF THE BLUETOOTH TRAFFIC
DATA SENSING
The usage of Bluetooth in transport has passed its first
decade, and though it has come a long way, its full
potential is still to be explored. In the early days,
Murphy et al. (2002) investigated the utilization of
Bluetooth for short-term ad hoc connections between
moving vehicles, while it was still a new wireless
technology. The findings were promising. They showed
that even fast vehicles - driving 100 km/h – could be
detected by a Class 1 (20dB) Bluetooth. Although the
experiments were performed for vehicle-to-vehicle
communication, the same issues apply to monitoring
traffic through Bluetooth scanners. In the same year,
Sergio Luciani, submitted an application to the United
States Patent office that described, though as a fall back
option, exactly that: The usage of Bluetooth scanners for
traffic monitoring. In his application, Luciani (2003)
described that tracking the MAC address of a device
along the road through matching sighting with paths
through the road network, one would be able to
determine travel times that, when compared to a
baseline, could be used to determine the traffic state of
the road. The patent was issued one year later in 2003.
While the described setup is similar to what is used
today, it took years to see it established on the road.
Though the idea of using Bluetooth, among other
mobile sensors, for traffic monitoring manifested itself
in various sensor network based traffic information
service systems (SNTISS), such as the three-tiered
architecture proposed by Zhang et al. (2005). By that
time it was clear that intelligent transport systems (ITS)
would require networks of smart sensors embedded in
the traffic area, performing automated continual and
pervasive monitoring to enhance the quality of traffic
information collection and services.
It took another three years before Ahmed et al. (2008)
introduced a prototypical implementation and test
deployment of a Bluetooth and wireless mesh networks
platform for traffic network monitoring. The platform
used cars as mobile sensors and used wireless municipal
mesh networks to transport the sensed data. The
assumption was that drivers carry mobile devices
equipped with the widely adopted low-cost Bluetooth
wireless technology. The platform was able to track cars
travelling at speeds of 0 to 70 km/hour. In addition to
tracking vehicles, the study was able to approximate car

- 3.2 -
speeds with an accuracy of ± 15%. A similar study was
performed by Mohan, et al. (2008) who suggested the
system as a cost effective solution for developing
countries. One year later, and with large sample sizes of
5% to 7% of the overall traffic stream, Tarnoff et al.
(2009) introduced a system claiming accurate
measurement of travel times as well as origin-
destination data for freeway and arterial roadway
networks. The paper points out that the major benefits
are that the cost of Bluetooth scanning are a factor of
100 less than equivalent floating car runs, and that
privacy is less of an issue with the Bluetooth equipment
due to the absence of databases that can relate addresses
to specific individuals (owners). Another system was
developed to ease the path for road authorities to enter
the travel time measurement market by Puckett and
Vickich (2010), who took a practitioners’ approach. The
accuracy of travel time measurement, and the ease on
the privacy issue, that made the usage of mobile phone
data nearly impossible, might have been the turning
point, as from then on Bluetooth gained a lot more
interest from the research community.
3. EXPERIENCES AND CASE STUDIES
Over the past few years, the Bluetooth data source has
been used for large-scale behaviour studies, across
different domains. It has been used to characterize
pedestrian environments and walking behaviour, by
using the distributions of device type, dwell time and
travel time (Delafontaine et al., 2012; Malinovskiy and
Wang, 2012). These endeavours have been directed
towards the analysis of the effect of the environment on
the signal strength of the scanners, and the relationship
between the signal strength and type and frequency of
detection road users such as walkers, runners and
cyclists (Abedi et al., 2013). Recently, researchers have
used the Bluetooth-based tracking strategy to measure
the time it takes for passengers to move through the
various airport areas (Bullock et al., 2010). Currently,
Bluetooth finds its widest application within the
Intelligent Transport System and Road Management
domains. Here, the Bluetooth data are often fused with
other data sources – such as WiFi, GPS and loop
detectors (Abbott-Jard et al., 2013) – in order to enhance
the estimation of the traffic state or to identify the causes
of congestion outbreaks (Nantes et al., 2013). Finally,
the Bluetooth technology has also been recently
employed for improving the estimation of Origin-
Destination patterns (Barcelo et al., 2013) and route
choice analysis (Hainen et al., 2011; Carpenter et al.,
2012).
Fig. 1 – Travel Time Estimation Mechanism
4. THE BLUETOOTH-BASED
ESTIMATION OF TRAVEL TIME
The Travel Time is an important traffic indicator of the
status of the network and may be used to minimize the
level of congestion. It has long been a topic of research
and numerous models have been proposed for both
motorways (Bhaskar et al. 2014; Khoei et al., 2013; van
Lint, 2008; Li and Rose, 2011; Fei et al., 2011; Khosravi
et al., 2011) and arterial (Bhaskar et al. 2009, 2010,
2011, 2012) networks. The relationship between the
level of congestion and travel time has been studied
theoretically by a number of researchers (Tsubota et al.,
2011, 2013) and has led to the conclusion that, if the vast
majority of drivers were informed on the actual travel
time for their trips, congestion would be reduced
significantly, provided that these drivers made the right
decision at the right time, in a cooperative fashion
(Monteil et al., 2012).
It is one thing, however, to assume that the output from
a traffic simulator is realistic, and quite another thing
trying to determine how realistic this output is, when the
parameters of the simulator are numerous and the data
available for validation are very limited and noisy. A
very important validation data seemed to become
available at a low cost when it was shown by Murphy et
al. (2002) that pairing Bluetooth sensors together could
produce travel time data. Simply put, given a pair of
locations, 𝑂 and D, both covered by Bluetooth scanners,
the time it takes for a Bluetooth discoverable traveller to
go from 𝑂 to 𝐷 is given by the time difference between
the matching identifiers (Figure 1). Therefore, if a
vehicle is first detected at 𝑂 at time 𝑡O, and later at 𝐷 at
time 𝑡D, the travel time (𝑂, 𝐷) for this device will simply
be
(𝑂, 𝐷) = 𝑡D − 𝑡
O (1)
By plotting these values over some period of time
(Figure 2, left), the travel time stands out, from what is
seems like feeble background noise. Since the early
promising reports on the use of the Bluetooth
technology for traffic monitoring, researchers and
practitioners have been debating about the actual value
of this relatively new data source.
Fig. 2 – Travel Time De-noising and Parameterization

- 3.3 -
Strictly speaking, although the mechanisms for
measuring the travel time seems simple and does
produce large datasets, it is still not clear how much
noise is actually ‘lurking’ in the data and how this noise
ought to be isolated and reduced.
Common travel time measures for a corridor are
produced from the aggregation of per-vehicle travel
times over a given time window, e.g. 1 day (left). Data
cleansing is often achieved by separating high-density
regions from the regions of low density. From the
cleansed data (black region on the left picture),
sufficient statistics (e.g. mean and standard deviation)
are computed and used as indicators of road
performance (right). The filtered data in this example
was clustered into 144 time bins of equal length. Mean
and standard deviation were then computed for each
time bin. In the graph on the left, the grey region
indicates the ± 2 ∙ sdev (standard deviation) interval
around the mean.
5. MONITORING PEDESTRIAN AND CYCLISTS
Monitoring, simulating and predicting human’s
dynamic patterns of movement through space is
becoming an increasingly important target of urban and
transport planners interested in designing effective
urban spaces for pedestrians (Batty, 2003). It is also an
interesting area for studying and understanding human
behaviour in terms of moving through pedestrian
pathway environments such as corridors, urban and
bridge pathways. However, such research and pattern
extraction are complex due to a large number of
variables related to pedestrian, situations and
environments.
Analysis of massive distributed movement data has
been recently presented by new technologies as the
popularity of using mobile devices has been increased
(Jankowski et al., 2010, Andrienko and Andrienko,
2007). Tracking mobile-devices and intercoms has
motivated researches and scientist to collect movement
information from individuals. Recent research has been
focused on the analysis of individuals’ travelling
behaviour in various applications such as the tourism
industry (Jankowski et al., 2010), public transport
utilisation in Graz, movement behaviour assessment in
shared areas (Abedi, 2014) and shopping malls and
pedestrian’s density distribution during seasons.
Discovering Bluetooth enabled-devices has recently
become an effective tool for human’s movement
monitoring purposes (Stange et al., 2011). Some
research has been done on recording flows movements
using Bluetooth and WiFi in outdoors and indoors. Pels
et al. (2005) implemented various BMSs at Dutch train
stations in order to track transit travellers. Weinzerl and
Hagemann (2007) collected information from transit
travellers and also tracked public transport busses by
locating sensors inside buses. Abedi et al.
(2014) analysed human behaviour in terms of shared
space utilisation based on MAC address data. They
presented MAC address data as effective information to
extract features from human’s spatio-temporal
movement such as time spending, frequency of
utilisation and group gathering.
6. CONCLUSION
BMS is an inexpensive sources of data and has the
potential for providing rich information for area-wide
traffic monitoring such as “live reporting” of the travel
activity of the road users who carry BT-equipped
devices.
After matching and filtering the BT data points, a good
graphical representation of travel time patterns can be
easily visualised. However, utilising the travel time
estimates for real time applications such as signal
control and traveller information system, should
consider the accuracy and reliability of the estimates.
REFERENCES
1. M. Abbott-Jard, H. Shah, and A. Bhaskar,
"Empirical evaluation of Bluetooth and Wifi
scanning for road transport 36th Australasian
Transport Research Forum (ATRF)," presented at
the 36th Australasian Transport Research Forum
(ATRF), Brisbane, Australia, 2013.
2. N. Abedi, A. Bhaskar, and E. Chung, "Bluetooth
and Wi-Fi MAC Address Based Crowd Data
Collection and Monitoring: Benefits, Challenges
and Enhancement," presented at the 36th
Australasian Transport Research Forum (ATRF),
Brisbane, Australia, 2013.
3. N. Abedi, “Monitoring Spatiotemporal Dynamics
of Human Movement based on MAC Address Data”
Masters of Engineering Thesis, Queensland
University of Technology (2014)
4. N. Abedi, A. Bhaskar, and E. Chung, "Tracking
spatio-temporal movement of human in terms of
space utilization using media-access-control
address data”, Applied Geography., 51 (2014), pp.
72-81
5. H. Ahmed, EL-Darieby, M., Abdulhai, B., Morgan,
Y., "Bluetooth- and Wi-Fi-Based Mesh Network
Platform for Traffic Monitoring," presented at the
Transportation Research Board 87th Annual
Meeting, Washington DC, 2008.
6. G. Andrienko, and N. Andrienko, “ Extracting
patterns of individual movement behaviour from a
massive collection of tracked positions”. In:
Workshop on Behaviour Modelling and
Interpretation (BMI), Bremen, pp. 1–16, 2007.
7. J. Barcelo, L. Montero, M. Bullejos, M. Linares,
and O. Serch, "Robustness and Computational
Efficiency of Kalman Filter Estimator of Time-
Dependent Origin-Destination Matrices,"
Transportation Research Record: Journal of the
Transportation Research Board, vol. 2344, pp. 31-
39, 2013.

- 3.4 -
8. M. Batty, “Agent-based pedestrian modelling.
Advanced Spatial Analysis: The CASA Book of
GIS, pp. 81–106.
9. A. Bhaskar, E. Chung, and A.-G. Dumont,
"Estimation of Travel Time on Urban Networks
with Midlink Sources and Sinks," Transportation
Research Record: Journal of the Transportation
Research Board, vol. 2121, pp. 41-54, 2009.
10. A. Bhaskar, E. Chung, and A.-G. Dumont,
"Analysis for the Use of Cumulative Plots for
Travel Time Estimation on Signalized Network,"
International Journal of Intelligent Transportation
Systems Research, vol. 8, pp. 151-163, 2010.
11. A. Bhaskar, E. Chung, and A.-G. Dumont,
"Average Travel Time Estimations for Urban
Routes That Consider Exit Turning Movements,"
Transportation Research Record: Journal of the
Transportation Research Board, vol. 2308, pp. 47-
60, 2012.
12. A. Bhaskar, E. Chung, and A.-G. Dumont, "Fusing
Loop Detector and Probe Vehicle Data to Estimate
Travel Time Statistics on Signalized Urban
Networks," Computer-Aided Civil and
Infrastructure Engineering, vol. 26, pp. 433-450,
2011.
13. A. Bhaskar, M. QU, and E. Chung, "A Hybrid
Model for Motorway Travel Time Estimation-
Considering Increased Detector Spacing," in
Transportation Research Board 93nd Annual
Meeting, Washington, D.C., 2014.
14. Bluetooth SIG (2018). 2018 Bluetooth Market
Update.
https://www.bluetooth.com/markets/automotive
15. D. M. Bullock, R. Haseman, J. S. Wasson, and R.
Spitler, "Automated Measurement of Wait Times at
Airport Security: Deployment at Indianapolis
International Airport, Indiana," in Transportation
Research Record: Journal of the Transportation
Research Board, Washington DC, USA, vol.
2177(1), pp. 60—68, January 2010.
16. C. Carpenter, M. Fowler, and T. J. Adler,
"Generating Route Specific Origin-Destination
Tables Using Bluetooth Technology," presented at
the Transportation Research Board 91st Annual
Meeting 2012.
17. M. Delafontaine, M. Versichele, T. Neutens, and N.
Van de Weghe, "Analysing spatiotemporal
sequences in Bluetooth tracking data," Applied
Geography, vol. 34, pp. 659- 668, 2012.
18. X. Fei, C.-C. Lu, and K. Liu, "A bayesian dynamic
linear model approach for real-time short- term
freeway travel time prediction," Transportation
Research Part C: Emerging Technologies, vol. 19,
pp. 1306–1318, 2011.
19. A. Hainen, J. Wasson, S. Hubbard, S. Remias, G.
Farnsworth, and D. Bullock, "Estimating Route
Choice and Travel Time Reliability with Field
Observations of Bluetooth Probe Vehicles,"
Transportation Research Record: Journal of the
Transportation Research Board, vol. 2256, pp. 43-
50, 2011.
20. P. Jankowski, N. Andrienko, G. Andrienko, S. Kisi
levich, “Discovering landmark preferences and
movement patterns from photo postings”, Trans.
GIS, 14 (2010), pp. 833-852
21. A. M. Khoei, A. Bhaskar, and E. Chung, "Travel
time prediction on signalised urban arterials by
applying SARIMA modelling on Bluetooth data,"
in 36th Australasian Transport Research Forum
(ATRF), Brisbane, Australia, 2013.
22. A. Khosravi, E. Mazloumi, S. Nahavandi, D.
Creighton, and J. W. C. Van Lint, "A genetic
algorithm-based method for improving quality of
travel time prediction intervals," Transportation
Research Part C: Emerging Technologies, 2011.
23. R. Li and G. Rose, "Incorporating uncertainty into
short-term travel time predictions," Transportation
Research Part C: Emerging Technologies, vol. 19,
pp. 1006-1018, 2011.
24. S. Luciani, "Traffic monitoring system and method",
Patent number: 6505114 7, Jan 2003.
25. Y. Malinovskiy and Y. Wang, "Pedestrian Travel
Pattern Discovery Using Mobile Bluetooth
Sensors," in Transportation Research Board 91st
Annual Meeting, Washington DC, USA, pp. 1-16,
2012.
26. P. Mohan, V. N. Padmanabhan, and R. Ramjee,
"Nericell: rich monitoring of road and traffic
conditions using mobile smartphones," presented at
the Proceedings of the 6th ACM conference on
Embedded network sensor systems, Raleigh, NC,
USA, 2008.
27. J. Monteil, A. Nantes, R. Billot, and N.-E. El Faouzi,
"Microscopic Cooperative Vehicular Traffic Flow
Modelling: Analytical Considerations and
Calibration Issues Based NGSIM Data," presented
at the 19th ITS World Congress, Vienna, Austria,
2012.
28. P. Murphy, Welsh, E., Frantz, P., "Using Bluetooth
for Short-Term Ad-Hoc Connections Between
Moving Vehicles: A Feasibility Study," in IEEE
Vehicular Technology Conference Birmingham,
AL, 2002, pp. 414-418.
29. A. Nantes, M. P. Miska, A. Bhaskar, and E. Chung,
"Noisy Bluetooth traffic data?," in Road and
Transport Research, vol. 23(1), pp. 33 – 43, 2014.
30. R. Nusser, and R. M. Pelz, “Bluetooth-based
wireless connectivity in an automotive environment”
in Vehicular Technology Conference, 2000. IEEE
VTS-Fall VTC 2000. 52nd, 2000. vol.4, pp. 1935-
1942.
31. G. Pasolini and R. Verdone, “Bluetooth for ITS?
Wireless Personal Multimedia Communications”,
The 5th International Symposium on, 27-30 Oct.
2002, vol. 1, pp. 315-319.
32. Pels, M., Barhorst, J., Michels, M., Hobo, R.,
Barendse, J., 2005. Tracking People using
Bluetooth: Implications of Enabling Bluetooth
Discoverable Mode. Final Report, University of
Amsterdam.
33. D. Puckett and M. Vickich, "Bluetooth® -Based
Travel Time/Speed Measuring Systems

- 3.5 -
Development," University Transportation Center
for Mobility, 2010.
34. H. Sawant, T. Jindong, Y. Qingyan, and W. Qizhi,
“Using Bluetooth and sensor networks for
intelligent transportation systems”. Intelligent
Transportation Systems, 2004. Proceedings. The
7th International IEEE Conference on, 3-6 Oct.
2004, pp. 767- 772.
35. H. Stange, T. Liebig, D. Hecker, G. Andrienko, and
N. Andrienko, “Analytical workflow of monitoring
human mobility in big event settings using
Bluetooth”, in Proceedings of the 3rd ACM
SIGSPATIAL International Workshop on Indoor
Spatial Awareness, ACM (2011), pp. 51-58.
36. P. J. Tarnoff, Bullock, D.M., Young, S.E., Wasson,
J., Ganig, N., Sturdevant, J.R., "Continuing
Evolution of Travel Time Data Information
Collection and Processing," presented at the
Transportation Research Board 88th Annual
Meeting, Washington DC, 2009.
37. T. Tsubota, A. Bhaskar, E. Chung, and R. Billot,
"Arterial traffic congestion analysis using
Bluetooth duration data," presented at the 34th
Australasian Transport Research Forum (ATRF),
Adelaide, South Australia, Australia 2011.
38. T. Tsubota, A. Bhaskar, E. Chung, and G. Nikolas,
"Information provision and network performance
represented by Macroscopic Fundamental
Diagram," presented at the Transportation Research
Board 92nd Annual Meeting, Washington DC,
USA, 2013.
39. J. W. C. Van Lint, "Online learning solutions for
freeway travel time prediction," IEEE Transactions
on Intelligent Transportation Systems, vol. 9, pp.
38-47, 2008.
40. J. Weinzerl and W. Hagemann, “Automatische
Erfassung von Umsteigern per Bluetooth-
Technologie”, Nahverkehrspraxis, 3 (2007), pp. 18-
19
41. M. Zhang, J. Song, and Y. Zhang, "Three-tiered
sensor networks architecture for traffic information
monitoring and processing," in Intelligent Robots
and Systems, 2005. (IROS 2005). 2005 IEEE/RSJ
International Conference on, 2005, pp. 2291-2296.

Paper No. 4
SMART RAILWAY
Speakers:
Ir C.L. Leung, Head of E&M Construction
Ir Sha Wong, Head of E&M Engineering
MTR Corporation Ltd.

- 4.1 -
SMART RAILWAY Ir C L Leung, Head of E&M Construction
Ir Sha Wong, Head of E&M Engineering
MTR Corporation Ltd
ABSTRACT
The extension of existing lines and opening of new rail
lines will be knitted together to form a more superior
railway network that will provide enhanced
connectivity and accessibility to more areas. Major
upgrades of infrastructure and facilities are underway
alongside the new lines in order to construct a better
railway network. A more caring and personalized
experience can be provided by continuously enhancing
various functions which provides a new customer
experience.
With the Internet of Things (IoT) and industrial
digitalization, the existing asset management capability
can be changed and improved, as well as to shape future
direction. This paper will introduce new technologies
adopted/to-be adopted in MTR including asset
condition monitoring systems, new generation train to
track communication, whole-life/system cost efficiency
and optimisation and other various innovative systems
to enhance safety and customer experience.
1. INTRODUCTION
With the extension of the Island Line to the Western
District, the extension of the Kwun Tong Line to Ho
Man Tin and Whampoa, the opening of the South Island
Line and Express Rail Link, and the upcoming Shatin to
Central Link, the existing and new rail lines will be
knitted together to form a more superior railway
network that will provide enhanced connectivity and
accessibility to more areas and additional cross-harbour
options.
Major upgrades of infrastructure and facilities are
underway alongside the new lines in order to construct
a better railway network for our future. Overall
customer experience will be improved through the
provision of new trains and new light rail vehicles,
conversion of the West Rail and Ma On Shan Lines
from seven-car into eight-car trains and from four-car
into eight-car trains, and an upgrading of the signalling
system and station facilities, such as installation of
automatic platform gates, station modification works at
major interchange stations, and the replacement of air-
cooled chillers.
Meanwhile, it is hope that a more caring and
personalized experience can be provide to customers by
continuously enhancing MTR Mobile functions under
the initiatives of Rail Gen 2.0.
2. RAIL GEN 2.0
2.1 Challenges
After operating for 30 some years, a good portion of
MTR railway assets is now up for replacement. The
upgrading of the existing E&M systems for many of the
operating rail lines is now in full swing. Upgrading of
the assets under day-to-day operation is no easier than
carrying out immensely complex and technical
neurosurgery. In order not to affect normal passenger
service and nearby residents, whilst routine
maintenance works are still required, the project teams
could only share the use of the few hours after train
services to conduct the upgrade works, whilst it is
critical to minimise the impact on the passengers.
2.2 Objectives & Key Focuses
Whilst it is very challenging to replace the railway
assets with minimum impact to daily operations, these
major replacements do actually provide opportunities to
change and improve the railway capability.
Under the Rail Gen 2.0 initiatives, there is strategy
focusing on effectiveness and efficiency enhancements,
for instance asset management optimization,
maintenance efficiency, operational efficiency, and
safety and better customer experiences. A few
innovative technologies adopted or to-be adopted will
be briefly described in this Paper as demonstration of
transformation for Smart Railway.
3. INNOVATION TECHNOLOGIES
3.1 Safety Enhancement
The rail network in Hong Kong is regarded as one of the
world’s leading railways for safety, reliability, customer
service and cost efficiency. Safety is the first priority of
operating railway, it is important to explore various
technologies to continuously enhance railway safety.
3.1.1 Fallen tree detection system (FTDS)
In sections with open area, there were reported cases of
trees falling onto EAL (East Rail Line) tracks, a FTDS
will thus be helpful to mitigate the risk.

- 4.2 -
After studies and trials on a number of technologies, it
is found that the fallen tree detection by laser scanning
technology provides the most optimal result so far.
LASER scanners can detect objects and measure their
sizes and distances by continuously emitting LASER
beams and monitoring the reflections. Measurement
profiles can be plotted according to the reflected
LASER beams (Figure 1) and software detection
algorithms can then be developed to identify the target
objects. The technology allows flexibility to re-define
the detection areas through software configurations. A
trial project was conducted to investigate the feasibility
of using the technology for fallen tree detections.
Fig. 1 – Typical LASER Measurement Plot by a
Vertical LASER Scanning Plan
LASER scanners with sufficiently strong LASER
beams were selected to enhance detection accuracy and
achieve reasonable detection range. At least 5
consecutive reflections from the target object were
taken to confirm its existence so as to get rid of false
detection due to rain drops while maintaining the
detection accuracy. Generally, rain drops will not give
consecutive reflections at the same point, see Figure 2.
Fig. 2 – True Object is confirmed by having received
the 5th Echo
Through repeated site tests and refinement on system
design, the latest trial setup using LASER technology
can achieve a successful detection rate of >99.9% in dry
conditions and >98% in wet conditions respectively,
with a reliable detection range of 30m per LASER
scanner-pair.
Fig. 3 – Fallen Tree Sample was detected by the LASER
Detection Setup under Simulated Rains
Apart from detection accuracy, the suppression of
nuisance alarms is also critical because it will adversely
affect train operation. The trial system achieved a false
detection rate (alarms triggered by nuisance objects
such as flying newspapers and plastic bags) of <0.1%
both in dry and wet conditions, in both temporary
testing setup in Kowloon Bay Depot and 1-year trial
testing near University Station.
However, LASER scanning cannot provide real-time
images of the track sections and need relatively great
software programming effort to set up initially to
simulate sufficient detection scenarios.
3.2 Customer Experience Improvement
Lifts form part of the integrated pedestrian network of
all-weather walkways. Lifts and escalators are
considered as community facilities built especially in
the West Island Line project, which has the first station
in the rail network to feature “Lift-only-Entrances”. For
future deep stations requiring lifts as the only means of
vertical transportation serving between platform and
concourse, rapid transfer of a group of passengers from
the platform level to the concourse is crucial to station
operation and customer satisfaction.
3.2.1 Crowd control by using CCTV
By using Video Content Analysis (VCA) built into the
CCTV system, the number of passengers and the crowd
flow direction can be detected and analyzed and hence
the flow and volume of the crowds are heading to the

- 4.3 -
lift lobby can be made known, in a recent study. With
proper modifications on the system, appropriate number
of lifts can then be automatically assigned to arrive at
the platform level, depending on the crowd size, to serve
passengers hence reduce the lift waiting time. Footages
of existing long adits were used for the preliminary
study of the application. Two methods of passenger
counting were adopted:
a) Accumulation of crowd in the defined boundary
and assign appropriate number of lifts based on
the length of the queue
b) Counting of passenger flow within a defined
boundary and assign appropriate number of lifts
before passengers arrive at the lift lobby
VCA is considered as an appropriate technology to
detect incoming passengers and number of serving lifts
can then be assigned automatically to relieve the traffic
demand.
Fig. 4 – Working Mechanism of CCTV VCA
Station crowd management is vital for big interchange
station. Based on the queuing platform captured from
the CCTV cameras and the newly installed cameras at
platform levels, divert passenger queuing can fully
utilize the platform space. Inflow control action applied
to selected stations for slowing down passengers going
down to platform.
3.3 Asset Condition Monitoring
The existing railway network in Hong Kong has a total
route length of over 256 kilometres, MTR trains run
about 19 hours a day, 7 days a week, from early morning
to 1:00 am the next morning. There is only limited time
after services operation for maintenance works. After
rail and overhead line inspection, there are labour
intensive follow up works for handling tremendous data
and post inspection recording. Therefore, there is a real
urge to automate the rail and overhead line inspection
works as much as possible during normal travel hours
in order to allow flexibility in optimizing the use of non-
traffic hours for tasks with urgent needs.
3.3.1 Onboard Railway Inspection System (ORIS)
ORIS is a system previously designed to be installed on
maintenance vehicles with technical personnel, its
analysing algorithm caters for off-line analysis and little
project application for real time application until it was
firstly installed by MTR on passenger trains as an
automation rail inspection / monitoring system. Images
of rail could be captured by high-speed line scan camera,
with measurement with laser and algorithm to recognise
defects in mainline.
Fig. 5 – High-speed Line Scan Cameras installed at
Underframe/Bogie and Samples of Rail Images
Different types of rail failures can be recognised,
including:
a) Shelling
b) Squats and wheel burn
c) Rolling contact fatigue/ spalling
d) Rail corrugation
e) Missing fasteners/ bolts
f) Broken rail
These are common rail failures on the rail network and
detecting them could fit general rail maintenance
purposes.
ORIS is a mature technology, whilst there is
customisation for MTR – categorising rail failures
based on necessary action to be taken, for example send
alarm for urgent inspection, send email with photo to
alert potential issue of concern, or keep in log as minor
anomalies.

- 4.4 -
Fig. 6 – Configuration of ORIS
Apart from transmission of the real time alarm and
defect information, the system also provides full details
of track condition data for maintenance staff and regular
backend review. This could not only facilitate the
existing manual work of rail inspection, but also as a
tool to enhance the analysis of rail fault development
and prediction in future. However, effort is still required
to reduce the level of nuisance alarm for a more efficient
and effective system, which involves the use of data
analytic and machine learning techniques.
3.3.2 Overhead Line Inspection System
Likewise, study has been done to automate the
inspection of overhead line system on passenger train.
Combination of technologies such as laser technology,
infrared thermography and image processing
technology with data analytics, the system could
monitor deviation and staggering of contact wires,
detect high temperature point, arcing and defect on
catenary, and compare the contact wire geometry and
shifting of hanger wire. Different technologies in the
market was evaluated with support from professional
industry experts, integrated solution which could suit
MTR’s operation is developed so as to achieve real-time
overhead line condition monitoring.
Fig. 7 – OHL Condition Monitoring using Passenger
Train Rooftop Equipment
3.3.3 Mobile Apps
Customers are looking for not only accurate and
comprehensive information, but also integrated and
personalized service experience. “Next Train” was one
of the first Apps in MTR that provides real-time update
of train information, with ability to display the
estimated arrival time of next 4 trains. With the
enhanced “Traffic News” function, new “In-station
Finder” as well as “Fast Exit” functions, MTR Mobile
provides comprehensive information for better planning
of your journey.
Fig. 8 – Intelligent Mobile Apps
4. CONCLUSION
Safety and reliability are vital to the railway in Hong
Kong as the system is carrying an average weekday
patronage of about 5.8 million passengers. MTR is
striving to enhance the existing railway network to Rail
Gen 2.0, a new generation rail that brings superior
connectivity, better facilities and enhanced services to
the general public.
Exploration on Big Data Analysis is also triggered.
Combining various innovative applications going
through Cloud computing or any analytics platform can
provide meaningful traffic information and analyse
impacts of system changes with simulations. More
effective and efficient ways are required to maintain the
assets by adopting different innovation technologies.
Instead of focusing on one single technology, integration of various systems with support of
digitalization could not only enhance the predictive and
preventive maintenance, but also improve the response
and recovery during service disruption. It enables us to
make E&M systems and infrastructure more intelligent,
increase value sustainably over the entire lifecycle as
well as enhance passenger experience.

Paper No. 5
DEVELOPMENT OF ELEVATOR DRIVES
Speakers: Ir Dr Albert T.P. So, Honorary Lecturer
Ir Dr Bryan M.H. Pong, Associate Professor Ir W.K. Lee, Principal Lecturer Dr K.H. Lam, Lecturer Department of Electrical & Electronic Engineering University of Hong Kong

- 5.1 -
DEVELOPMENT OF ELEVATOR DRIVES Ir Dr Albert T.P. So, Honorary Lecturer
Ir Dr Bryan M.H. Pong, Associate Professor
Ir W.K. Lee, Principal Lecturer
Dr K.H. Lam, Lecturer
Department of Electrical & Electronic Engineering
University of Hong Kong
ABSTRACT
According to the Skyscraper Center, Hong Kong is
ranked the champion around the world in terms of the
highest number of skyscrapers with a height of at least
150 m. All skyscrapers must be served by elevators.
Conventionally, induction motors driven by ACVV and
ACVVVF technologies account for the standard drives
of elevators. As buildings are getting taller, say 400
m or higher, the power-to-weight ratio of such
induction motors is no longer adequate when the rated
speed goes beyond 10 m/s. Permanent magnet
synchronous motors thus become the appropriate
candidate. In this paper, a review of the development
of elevator drives is made. Two issues are addressed,
namely a big wastage of space to have only one car in
the hoistway, and the requirement of both vertical and
horizontal movement of the car for tall and wide
buildings. Both issues for the application of ropeless
elevators driven by linear permanent magnet
synchronous motors. In this paper, a review on the
development of such technology in elevator systems is
also made. Potential problems with these two types
of motors are also highlighted.
1. INTRODUCTION
The Hong Kong Special Administrative Region has
over 7,840 high-rise buildings, 1,303 of which are
skyscrapers standing taller than 100 m (328 ft) with
316 buildings over 150 m (492 ft). The tallest building
in Hong Kong is the 108-storey International
Commerce Centre, which stands 484 m (1,588 ft) and
is currently the ninth tallest building in the world. The
total built-up height (combined heights) of these
skyscrapers is approximately 333.8 km (207 miles),
making Hong Kong the world's tallest urban
agglomeration. By the way, Hong Kong has more
inhabitants living at the 15th floor or higher, and more
buildings of at least 100 m (328 ft) and 150 m (492 ft)
in height, than any other city in the world.
First of all, let us look at a list of super high-rise
buildings around the world [1]. By the turn of the
century, the Petronas Towers at Kuala Lumpur,
Malaysia was considered “The World’s Tallest” with a
height of 452 m. Then, in 2004, the Taipei 101 at
Taipei, Taiwan became the tallest with a height of 508
m. In 2009, the champion went to Burj Khalifa at
Dubai, United Arab Emirates with a height of 830 m.
The next world record may go to the Jeddah Tower
(previously named Kingdom Tower) at Jeddah, Saudi
Arabia, which is still under construction. As planned,
if it can be completed by the year 2020, it may reach a
height of 1,600 m (almost 1 mile), thus named the
Mile-High Tower in the past. Besides these world
records, others at the top of the 2020 list may include
Wuhan Greenland Center at Wuhan, China to be
completed next year with a height of 636 m, Shanghai
Tower at Shanghai, China with a height of 632 m, the
Makkah Royal Clock Tower at Mecca, Saudi Arabia
with a height of 601 m, and the Ping An Finance
Center at Shenzhen, China with a height of 599 m. It
can be seen that each of the top five by the year of
2020 is at least 600 m tall or higher. At the same time,
the world's biggest building, called the New Century
Global Center (500 m (L) x 400 m (W) x 100 m (H))
was opened in Chengdu, China in 2013. All these
buildings demand a very efficient elevator system
where the drive is one key component.
2. THE HISTORY OF ELEVATOR DRIVES [2]
More than half a century ago, there were basically two
types of elevator drives, namely the AC-2 (AC 2
speed) for low speed operation and the DC-WL (DC
Ward Leonard) for high speed operation. An AC-2
drive motor consists of two sets of windings with
different pole numbers, the 4-6 poles for normal speed
operation and the 16-24 poles for maintenance speed
operation and leveling. It is well known that the rated
speed of an AC motor is inversely proportional to the
number of poles. The DC-WL drive consists of a 3-
phase induction motor mechanically driving a DC
generator which further energizes a DC motor which is
mechanically coupled with the brake and sheave for
ropes. A DC motor has much higher start-up torque

- 5.2 -
and good speed regulation, thus employed for high-
speed elevators. At that time, 1.5 m/s - 2 m/s was
already considered high speed operation.
In the 70's of the last century, AC-2 drives were
replaced by ACVV (variable voltage) drives while DC-
WL drives were replaced by DC-TL (thyristor
Leonard) drives for better speed control. There is no
speed control of AC-2 drives while ACVV drives could
provide limited speed control, still for relatively low
speed operation. By DC-TL drives, the motor-
generator set was replaced by a power electronic
thyristor based AC-DC converter. Similar to the DC
generator in the DC-WL drive, variable DC voltage
could be produced by the converter to control the
motor speed. In building applications like pumps,
fans and compressors etc., motors always rotate in the
same direction under a more or less constant speed.
But in an elevator system, the direction of rotation has
to be changed from time to time. For ACVV drives, a
change in direction can be realized by swapping two
phases while for DC-WL or DC-TL drives, a change in
direction can be realized by changing the direction of
the field current while maintaining the same polarity of
the armature current.
3. THE POPULARITY OF ACVVVF DRIVES
ACVV drives are not energy efficient [3] and owing to
the energy crisis of the 70's of the last century, energy
efficient drives became demanding. At the same time,
good speed control of elevator drive was also
imperative due to the comfort requirements of
passengers. In the 80's, ACVVVF (variable voltage
and variable frequency) drives were developed and
became popular in the early 90's of the last century.
As discussed in the last section, frequent changes in
the direction of rotation is one distinct feature of
elevator drives versus other drives used in buildings.
Furthermore, the emphasis is on rated speed operation
for most motor drives in buildings whereas the
acceleration/deceleration profiles of elevator drives
draw much attention in operational control. In a
typical brake-to-brake journey, the kinematics [4,5] of
the elevator car must obey some rules as shown in
Figure 1 and equation set (1).
It can be seen that the rated speed may not be achieved
for short jumps, like 1-floor jump. And the control of
every step, namely jerk (j), acceleration (a), jerk (-j),
rated speed operation (v), jerk (-j), deceleration (-a),
and jerk (j), throughout the journey must be precise for
high quality passenger comfort. Equation set (1) shows
the requirements. Normally, jerk is limited to around
1.5 - 2.0 m/s3 and acceleration or deceleration is
limited to around 1.0 - 1.5 m/s2 which is around one
sixth of the gravitational constant.
The rated speed is given by V, rated acceleration or
deceleration given by ±A, rated jerk given by ±J.
Then, for a long jump, i.e. rated speed achieved, the
total time to travel a whole journey with a distance, D,
is given by equation (2) while the validity of such
equation is given by the constraint in equation (3).
In order to accomplish such precise speed control,
ACVVVF drives were developed because the torque /
speed control was much better than the ACVV drives
while energy consumption was much lower. There
were basically two kinds of ACVVVF drives in
elevator systems, the scalar type and the vectored type.
The scalar type is working on the standard T-
equivalent circuit of an AC induction motor. The
standard torque-speed curve of an AC induction motor
provides a fixed torque-slip relationship around the
operating point when the slip, s, is less than 10%. A
speed encoder attached to the motor shaft is used to
measure the instantaneous speed of the motor, ωr,
which is added to the slip frequency command (i.e.
Fig. 1 – Typical Elevator Velocity-Time Profiles for
(a) 1-floor jump, (b) 2-floor jump and (c) 4-
floor jump [4]
(1) ;; Jdt
dajA
dt
dva
dt
dxv
(3) 22
AJ
VAJVD
J
A
A
V
V
D
Total time to travel a distance ( )
(2)
D
D A V
V J A

- 5.3 -
from the torque command) based on a constant V/F
relationship to produce the desirable and instantaneous
synchronous speed, ωs. On the other hand, the
desirable torque command governs the desirable rotor
current as reflected to the stator circuit, Ir, because the
driving torque, Td, is given by equation (4) and Rr is
the rotor resistance as reflected to the stator circuit.
By adding the desirable Ir to the desirable magnetising
current, Im, through the magnetizing branch, the
desirable stator current, Is, is obtained. An I/V
converter is used to produce the desirable voltage, V.
With V and ωs in hand, the 3-phase inverter bridge can
be controlled accordingly. The desirable Td is first
obtained by equation (5) where TL is the load torque
including friction and total weight of the car and ropes
etc. and J is the moment of inertia of the whole system.
And TL is obtained by a strain gauge or linear
transformer attached between the elevator car cage and
the sling which is attached to hoisting ropes.
Although the torque-speed control and energy
performance of scalar control are not bad, the dynamic
transient performance is unsatisfactory. Therefore, in
the mid 90's of the last century, vectored control was
developed for elevator drives [6].
By vectored control, the stationery three phase
components, a, b, c (b leading a and c leading b, and a
is at 0o) are converted into stationery components, α
and β (β leading α and α is also at 0o), which are
further converted into rotating components, d and q (q
leading d) while d is making an instantaneous angle
+θ(t) with α where the sinusoidal feature, ωt, is
absorbed into θ(t). The conversion is shown in
equation set (6) where g could generally mean v
(voltage), i (current), ψ (flux) or anything.
For vectored control applied to an induction motor,
only two of the three phase currents, ia and ib, are
monitored and converted to id and iq, according to
equation (7) because ic = - ia - ib.
(7)
cos3
2cos
3
1sin
sin3
2cossin
3
1
b
a
q
d
i
i
i
i
id is related to the magnetizing current of the T-
equivalent circuit of the induction motor while iq is
related to the torque, i.e. Ir of equation (4). Two
ACRs (automatic current regulators) are used to
control id by vd and iq by vq accordingly because the
two are de-coupled by such conversion. Similar to
scalar control, the instantaneous motor speed, ωr, is
measured and added to the desirable slip frequency
based on the desirable torque to produce the desirable
synchronous speed ωs*. At the same time, the
desirable torque is used to estimate the desirable
current, iq* and further the desirable vq*. The desirable
magnetizing current, id*, is more or less maintained
constant by the associated vd*. Together with the ωs*,
the 3-phase inverter bridge is switched by means of the
space vector method.
Each of the three phases of the inverter bridge has two
switches, normally in the form of IGBTs (insulated
gate bipolar transistors) in elevator application. The
one attached to the positive line is denoted by "1"
while the other attached to the negative line is denoted
by "0". "1" means the upper switch is "on" while "0"
means the lower switch is "on". There are six modes of
operation, namely a+, a-, b+, b-, c+, c-. a+ is actually
(1 0 0), b+ (0 1 0), c+(0 0 1), a- (0 1 1), b- (1 0 1) and c-
(1 1 0). There is a zero vector 0 represented by either
(0 0 0) or (1 1 1) where no current is fed to the motor.
From vd* and vq*, two parameters can be obtained, V*
and δ*, which resemble a rotating vector with variable
magnitude, phase angle and speed ωs*. The circular
path of the rotating vector is created by sequentially
switching between the six modes, e.g. from b+ to c- to
b+ etc. The dynamic response is acceptable while the
magnitude of the voltage is realized by proper pulse
width modulation.
4. UTILIZATION of PERMANENT
MAGNETS
Induction motors had been used in the elevator
industry for decades because they are almost
maintenance free and robust in nature. However, the
torque-to-size ratio or power-to-weight ratio is
(4) 3
2
s
rr
ds
IRT
(5) dt
dJTT r
Ld
g
g
g
g
g
g
g
g
g
q
d
c
b
a
cossin
sincos
(6)
2
3
2
30
2
1
2
11
3
2

- 5.4 -
relatively small. Also, the dynamic response is not
desirable enough when dealing with high speed high
capacity elevators. The motor used in Taipei 101 for
the two 1010 m/min elevators has a rating of 650 kW [7]. By the turn of the current century, research and
development on the utilization of permanent magnet
synchronous motors (PMSMs) was actively conducted
in the elevator industry. PMSMs are famous of their
high torque-to-size or torque-to-weight ratios.
Traditionally, synchronous motors have not been used
in elevator drives as they are not robust enough and
they need an additional controllable DC supply at the
rotor to produce the rotor magnetic field.
In a PMSM, no additional DC supply is needed as the
rotor magnetic flux is automatically produced by the
permanent magnets. Again, like the normal vectored
control of induction motors, current control is executed
in the rotor d-q reference frame. In this frame, the
armature inductances and magnetic flux linkage are
constant if the back EMF and variation of inductances
are sinusoidal [8]. The motor used to drive the 1010
m/min elevator at Taipei 101 is a PMSM. In the d-q
reference frame, the equivalent circuits between the d-
axis and the q-axis are de-coupled from one another
and the following equation set (8) is valid. Here, L is
the leakage inductance of the stator winding, Rs the
resistance of the stator winding, p the number of pole
pairs, ψ the flux linkage, ψf the magnetic flux linkage
produced by the permanent magnets, v the stator
voltage, i the stator current, T the electromechanical
torque, and ωr the rotor speed.
Let ψs be the resultant of ψd and ψq and δ be the angle
between ψs and ψd, the torque equation can be
expressed by equation set (9) when there is no saliency
between the stator and the rotor, i.e. Ld = Lq = Ls.
Since ψf is constant as it is produced by the permanent
magnets, the torque can be solely controlled by varying
ψq which is produced by iq. In section 3 of this paper
when vectored control of induction motors was
discussed, id needs to be controlled as it represents the
magnetizing current. Now, only iq needs to be
controlled in order to control the torque, more
convenient and quick. It should be noted that the
final production of the voltage waveform is still
according to the space vector method discussed in
section 3 with the consideration of ωs* as well.
5. UTILIZATION OF LINEAR PMSMs
As buildings are getting taller and taller, wider and
wider, as mentioned in the introduction of this paper. it
is a big wastage of the hoistway space by allowing
only one elevator car to occupy the whole hoistway all
the time. It is analogous to running just one train on a
railway tens or hundreds of km long. One solution is to
put more hoistways in one building. However, tall
buildings tend to be slim. The existence of too many
hoistways means the majority of the footprint is
occupied by the elevator system, which is
unreasonable and not practical. Double decker
elevators and TWINTM of the German manufacturer's,
Thyssekkrupp, elevators allow up to two cars move
along the hoistway all the time, the former one
dependent of while the latter one independent of one
another. That is still a wastage. To serve a building
hundreds of metres tall, as many elevator cars as
possible should be allowed to run in the same hoistway.
Conventional systems, even the machine roomless,
rely on the hoisting ropes to suspend the cars, which at
the same time prevent too many cars to run in the same
hoistway.
The technology of ropeless elevators is certainly the
trend to go. Ropeless elevators also allow an elevator
system to be upgraded from 1-dimensional to 2-
dimensional so that both tall and wide buildings can be
served appropriately [9]. The drive of such ropeless
elevators has to be changed from the rotary PMSMs to
linear PMSMs.
Conceptually, it is straight forward to imagine cutting
the stator of a rotary PMSM along the axle and
flattening it into a planar shape. The rotary rotor is
manipulated by the same way to make it planar. Most
electromagnetic equations can be reused with minor
modification. The same d-q reference frame is used
but ωr is changed into linear velocity, vs with the
consideration of pole pitch, τ, as shown in equation set
(10) [10].
dqqd
dr
q
qsq
qrd
dsd
qqq
fddd
iipT
dt
diRv
dt
diRv
iL
iL
2
3
(8)
(9) sin1
2
3
sin
fs
s
s
q
pL
T

- 5.5 -
Here, F is the linear force exerted on the rotor from the
stator, and p is also the number of pole pairs. Again,
if no saliency is involved, Ld = Lq = Ls, F is directly
controlled by iq or ψq.
The world's first 2-dimensional elevator system driven
by linear PMSMs was developed by Thyssenkrupp,
called MULTITM [11]. The linear rotor is attached to
the back of the elevator car and it can be rotated 90o to
make it move either vertically and horizontally. Since
the car is physically detached from the building, the
only points of contact being between the rollers and the
guide rails, it is expected that the permanent magnets
are on the car side while the coils that are to be
energized from time to time are on the guide rail side.
In a super-tall building, the hoistway will be in the
form of a closed loop. One side of the loop is for
upward movement while the other side is for
downward movement. In this way, tens of elevator
cars can move around the loop to serve passengers,
like the Ferris wheel in an amusement park.
6. WHAT’S NEXT?
It is for certain that 2-dimensional elevators utilizing
linear PMSMs will become more and more popular in
the near future once the real installation of MULTITM is
completed hopefully in 2018. However, since the
whole installation is ropeless, stationery braking and
the triggering of the safety gear are to be further
developed for 100% risk-free safety.
Another consideration is with the permanent magnets.
It is well aware that permanent magnets are artificially
produced, which are gradually demagnetized and have
a limited life. Furthermore, the production of high
quality permanent magnets relies on the adequate
supply of rare earthed materials which are also limited
in supply.
Some researchers are looking into the development of
linear reluctance motors for use by such 2-dimensional
elevators so that no permanent magnet is needed [12].
However, the adequacy of torque is still an issue.
Finally, conventionally, the power consumed inside the
elevator car, including lighting, ventilation, display,
control and door operation etc., is fed via travelling
cables. In the case of ropeless elevators, travelling
cables certainly do not exist. The effective way to
energize the elevator car has to be studied and such
power must be available for certain time after a full
power breakdown of the building throughout the
rescuing process.
7. CONCLUSION
The global trend of the construction of super-tall and
super-wide buildings was first highlighted in the
introduction. And it was argued that all these
buildings need an advanced and efficient elevator
system. Conventional drives of elevator systems
were briefly reviewed in this paper. The modern
trend of applying permanent magnet synchronous
motors was discussed, involving both rotary PMSMs
and linear PMSMs. The discussion led to the view
that linear PMSMs would dominate the elevator
industry where a 2-dimensional design will certainly
be the norm. Further development would be in the
direction of perfecting the safety features and less
reliance on the supply of permanent magnets.
REFERENCES
1. Hollister N. and Wood A. (2012), “The 20 tallest in
2020: entering the era of the megatall”, Elevator
World, March, pp. 38-44.
2. So A.T.P. and Chan W.L. "Computer simulation
based analysis of elevator drive systems", HKIE
Transactions, H.K.I.E., 1992, pp. 13-22.
3. So A.T.P. and Li T.K.L., "Energy performance
assessment of lifts and escalators", Building
Services Engineering Research and Technology,
Vol. 21, No. 2, 2000, pp. 107-115.
4. Peters R.D., "Ideal lift kinematics: complete
equations for plotting optimum motion", Elevator
Technology 6, Proc. Elevcon 95, Hong Kong,
March, 1995, pp. 175-184.
5. Barney G. and Al-Sharif L., Elevator Traffic
Handbook - Theory and Practice, 2nd Edition,
Routledge, Oxon, 2016.
6. Mine T., "New technology for elevator drive
system", Elevator Technology 4, Proc. Elevcon'92,
2sin)(sin21
4
3
2
3
2
3
(10)
qdsqfs
qd
qdqdf
dqqds
ds
q
qsq
qsd
dsd
qqq
fddd
LLLLL
p
iiLLpF
iivP
vdt
diRv
vdt
diRv
iL
iL

- 5.6 -
Amsterdam, May, 1992, pp. 182-191.
7. Munakata T., Kohara H., Takai K., Sekimoto Y.,
Ootsubo R., and Nakagaki S., "The world’s fastest
elevator", Elevator World, September, 2003, pp.
97-101.
8. Zhong L., Rahman M.F., Hu W.Y. and Lim K.W.,
"Analysis of direct torque control in permanent
magnet synchronous motor drives", IEEE Trans.
Power Electronics, Vol. 12, No. 3, May, 1997, pp
528-536.
9. So A., Al-Sharif L. and Hammoudeh A., "Traffic
analysis of a simplified two-dimensional elevator
system", Building Services Engineering Research
and Technology, Vol. 36, No. 5, 2015, pp. 567-579.
10. Cui J., Wang C., Yang J., and Liu L., "Analysis of
direct thrust force control for permanent linear
synchronous motor", Proc. 5th World Congress on
Int. Control and Automation, June, 2004, Hangzhou,
pp. 4418-4421.
11. https://multi.thyssenkrupp-elevator.com/en/.
12. Lim H. and Krishan R., "Ropeless elevator with
linear switched reluctance motor drive actuation
systems", IEEE Tran. Industrial Electronics, Vol.
54, No. 4, 2007, pp. 2209-2218.

Paper No. 6
BIM IN RESPECT OF DIGITALIZATION
Speakers: Ir C.K. Lee, Chief Engineer
Ir Steve H.Y. Chan, Senior Engineer Ir Christy C.Y. Poon, Engineer Ir Grace K.M. Yip, Engineer Mr Francis P.H. Yuen, Assistant Engineer Electrical & Mechanical Services Department The Government of the HKSAR

- 6.1 -
BIM IN RESPECT OF DIGITALIZATION Ir C.K. Lee, Chief Engineer
Ir Steve H.Y. Chan, Senior Engineer
Ir Christy C.Y. Poon, Engineer
Ir Grace K.M. Yip, Engineer
Mr Francis P.H. Yuen, Assistant Engineer
Electrical & Mechanical Services Department
The Government of the HKSAR
ABSTRACT
The Smart City Blueprint for Hong Kong was released
in December 2017 with the vision to transform Hong
Kong into a world class ‘smart’ cosmopolitan city. To
embrace the new era of innovation and technology in
this highly dense ‘concrete jungle’, digitalized E&M
engineering solutions play a significant role towards
smart buildings. Electrical and Mechanical Services
Department (EMSD) is responsible for managing
substantial amount of E&M assets in more than 8,000
government buildings. EMSD has developed a BIM-
AM System which integrated Building Information
Modelling (BIM) and the digitalized E&M asset
management (AM) towards smart operation and
maintenance (O&M) workflow. To ensure smooth
handover of as-built BIM models for digitalized asset
management, EMSD launched BIM-AM Standards and
Guidelines in November 2017. Our development on
integrated building management system (iBMS),
Internet of Things (IoT) Hubs and the possible
applications leveraging data analytics will be discussed
in this paper with a view to achieving intelligent E&M
asset management to support Government’s initiative of
transforming Hong Kong into a Smart City.
1. INTRODUCTION
Hong Kong is a densely populated city in which the
urbanized areas take a significant portion. The city is
characterized by sophisticated infrastructure systems
and high-rise buildings, both of which rely on reliable
operation of electrical and mechanical (E&M) systems.
EMSD provides operation and maintenance engineering
services for massive amounts of E&M systems in
thousands of government venues and public transport
infrastructures.
Nowadays, it is an era of rapid advancement of
Innovation and Technology (I&T), many new
technologies are available for managing the building
E&M systems. That not only helps improve the E&M
system availability and reliability, but also leads to
transform Hong Kong into a smart city. It is an echo
in the Smart City Blueprint for Hong Kong launched in
last year and this paper will illustrate how EMSD, as a
promotor and facilitator, utilizes the I&T technologies
in our E&M asset management and the potential
benefits.
2. BUILDING INFORMATION MODELLING
FOR ASSET MANAGEMENT (BIM-AM)
To streamline and enhance fault localization workflow
during corrective maintenance, EMSD has developed a
novel architecture of an integrated BIM-AM System for
asset management. The system offers smart O&M
working tools for providing an intuitive way to access
heterogeneous assets information such as photos,
attributes, equipment relationships, manuals, e-forms,
drawings, maintenance records, live view of Closed
Circuit Television (CCTV) System, real-time sensing
data from Building Management System (BMS) and
wireless ad-hoc sensors, as well as location information
of moving asset from a Real Time Location System
(RTLS) in one single integrated mobile platform (see
Figure 1 for the BIM-AM System architecture). All the
information is readily accessible simply by asset
repository, manoeuvring throughout a BIM model, or
even triggered from a handheld Radio Frequency
Identification (RFID) scanning tool [1].
Fig. 1 - The Novel Architecture for BIM-AM System

- 6.2 -
EMSD started a pilot project at its Headquarters in 2014
and it demonstrated BIM-AM System has great benefits
and long-term cost savings in the O&M building
lifecycle.
The BIM-AM system can be further explored for the
handover of E&M systems before the project
completion. It can provide a single online platform for
document and workflow management, handover of
O&M as well as reporting defects with proper track
record.
3. BUILDING INFORMATION MODELLING
FOR ASSET MANAGEMENT (BIM-AM) –
STANDARDS & GUIDELINES
To ensure smooth handover of as-
built BIM models for digitalized asset
management, the BIM-AM Standards
and Guidelines was officially
launched on 24 November 2017 and
uploaded to the EMSD Internet webpage (see QR code)
for reference by the trade. The standard covers three
major aspects including (i) modelling requirement, (ii)
asset information requirement and (iii) interfacing
requirement.
3.1 Modelling Requirement
The guideline is based on the asset templates developed
by EMSD, which is a summary of information
requirement for more than 19 types of E&M systems.
Building individual BIM model for each E&M system
in separate file is required for the ease of operation.
The requirement on asset naming convention and RFID
coding is also elaborated in the guideline that is crucial
in data migration between BIM models and AM system.
3.2 Asset Information Requirement
Asset information requirement is the key of BIM-AM
System. In the massive amount of E&M assets,
detailed asset information of over 230 types of
important assets is identified to be input to BIM models
for O&M. For the sake of easy understanding, each
important asset is assigned with an Asset Data Template
(ADT), which explicitly tabulates the information
requirement of that particular asset.
Asset information is divided into two categories which
are (i) general information and (ii) equipment specific
information. For the general information, it is
common for all E&M assets, for example, asset code,
warranty, make, model, asset relationship, and
documentation link (to O&M manual), etc. For the
equipment specific information, it covers equipment
operational data, for example, flow rate, set point,
efficiency, power, etc.
Another important informative feature of BIM-AM
System is the display of “System Topology” which can
be interpreted as “E&M asset relationship diagram” for
visualising the relationships between assets within a
particular system and for cross-referencing among
assets. Figure 2 shows a graphical view of the asset
relationships of an air-handling unit (AHU). A logical
parent-child relationship is represented by a “dependent”
arrow pointing from a parent asset to its child asset
whereas a logical associated relationship is represented
by an “associated” arrow pointing from an asset to its
associated asset, indicating that an asset relates to its
associated asset but has no dependence on it. This
System Topology is found useful and effective for fault
locating.
Fig. 2 – System Topology of AHU
3.3 Interface and Integration Requirement of Electronic
Systems to BIM-AM System
Technical requirement on system interface between
BIM-AM System and other electronic systems is
explicitly elaborated in the guideline. The interface of
BIM-AM with real time systems should be by means of
web links (e.g. for CCTV cameras) or web services (e.g.
for BMS) which are accessible by iOS and / or Android
browser.
For the RFID scanning system, each major E&M
equipment should be provided with RFID asset tag.
Whilst other E&M assets with massive numbers of
quantity, such as lighting fixtures and cameras etc., a
single zone tag by means of QR codes could be assigned
to a group of assets based on their spatial proximity (e.g.
zone, area or room). Figure 3 illustrates the examples

- 6.3 -
of the installation of RFID asset tag and zonal QR codes.
Fig. 3 – Examples of the Installation of RFID Asset Tag
and Zonal QR Code
4. E&M DIGITALIZATION
Apart from the BIM-AM System, EMSD has formed a
number of working groups to develop digitalized E&M
asset management solutions in order to enhance
operational efficiency through real-time monitoring and
data analysis.
4.1 Internet of Things (IoT) Hubs
As mentioned in Section 3.3, the interface between
BIM-AM System and real time BMS is by means of
web services, such as SOAP and RESTful protocols.
It may be costly and time consuming to implement the
interfacing works at individual sites with different
protocols of BMS, including BACnet, Modbus and Dry
Contact. Thus, a “universal BMS Adaptor”, namely
IoT Hub, is established in EMSD Headquarters for
further interfacing with the AM system. Figure 4
illustrates the IoT Hub System architecture.
Fig. 4 – IoT Hub System Architecture
Figure 5 shows that the IoT Hub acts as a “message
broker” which sends and receives messages from/to
BMS Interface Servers. The IoT Hub is capable to
support several message protocols, including web
services (e.g. SOAP / RESTful), message queue
telemetry transport (MQTT) and Advanced Message
Queuing Protocol (AMQP) in order to provide BIM-
AM System a standardized interface to communicate
with BMS Interface Servers in different buildings.
Fig. 5 – The Functions of IoT Hub
4.1.1 The features of IoT Hub
(a) The IoT Hub runs on “Server Cluster” which is a
group of independent servers working together for
storing messages received from BMS Interface
Servers to provide auto-failover and increased
availability of application by avoiding message loss
due to singe server failure.
(b) Each IoT Hub server can support more than 20
remote sites. With the cluster feature, the IoT
Hub is scalable to support more than 8,000 site
locations in which at least 3,000 BMS input / output
points can be supported for each site.
(c) The IoT Hub is designed to monitor the healthiness
of remote sites such as data link connectivity, data
throughput, alarms and heartbeat to be sent from
the remote sites.
4.1.2 The interface of IoT Hub and BIM-AM System
Through this unified interface platform, BIM-AM
System supports visualizing BMS sensor values by
colour overlay on the BIM model and plot change in
sensor values. The System is also able to monitor and
control the set points of BMS via the mobile BIM-AM
platform.
4.2 The Integrated Building Management System
(iBMS)
In addition to the IoT Hub, EMSD also developed an
integrated BMS (iBMS) in order to enhance the
efficiency of O&M work as well as to relieve staff work
load. The iBMS is also capable to monitor and control
the E&M systems of multiple buildings via a single

- 6.4 -
platform using either computer, tablet, smart phone at
any locations. The central iBMS server with the
connections to the BMSs has been established in 2015.
With the smart city initiatives, the iBMS is currently
integrated with a geographic information system (GIS)
platform for map-based asset management.
4.2.1 The integration with iBMS and GIS
Live equipment status from iBMS is now integrated
under a single GIS platform. Different types of
systems or infrastructures are displayed in different
layers of the GIS. Staff responsible for a specific system
can select the individual layer of interest, while
management staff or staff in the fault call centre can
select multiple layers for territory-wide overview of the
infrastructure conditions. The integrated platform
enables real time monitoring of system healthiness, and
sending pre-fault alerts to maintenance staff. All these
help reduce the fault response time and fault
rectification time, and improve the reliability of critical
infrastructure systems [2].
4.2.2 The proven benefits of iBMS
Since the implementation of iBMS, the operation and
maintenance work has become more effective. As the
control and monitoring of the E&M equipment can be
carried out through one central console, it minimises the
need for maintenance team to travel between buildings.
Manpower is saved and staff can carry out maintenance
work more efficiently and effectively.
Fault alarms are now not only shown in iBMS, but also
sent to management staff and maintenance team via
SMS that saves a lot of reporting time and leads to a
faster response to equipment faults[2].
5. E&M DIGITALIZATION APPLICATION
With the E&M digitalization, system operational and
maintenance data can be properly recorded and kept
track in the central service centre for data analysis that
turns data into actions.
5.1 Data Analysis for Enhanced Maintenance
Performance
5.1.1 From scheduled preventive maintenance to
predictive maintenance
The system performance and the associated energy
consumption can be kept track in the central console.
Any abnormal energy consumption, such as improper
energy usage pattern, caused by faulty equipment could
be easily identified. The analysis of historical and real
time data leads to the next level of maintenance model
for “predictive maintenance”. For example, the
maintenance agent may adjust the preventive
maintenance schedule for checking the high-risk
equipment with an abnormal profile at a higher
frequency to suit the actual system needs [3].
5.1.2 Off-site pre-diagnosis
The application of BIM for asset management allows
the maintenance team to carry out pre-diagnosis of the
root cause remotely and to streamline the fault location
process before attendance on-site [4]. We can further
complement the visualization and communication
element of BIM with Augmented Reality. For
complex incident, maintenance staff can call and
virtually share the live situation with the off-site experts
for step-by-step assistance, adding a new dimension of
mobility and agility to maintenance work [5].
5.1.3 Prioritization of massive maintenance works
The remote monitoring provided by the iBMS facilitates
the routine or ad-hoc maintenance management. With
the data of the system performance, management team
can suitably mobilize the workforce and prioritize the
work in a more efficient manner.
5.2 Data Analysis for Energy Optimization
E&M digitalization helps in energy saving. With the
iBMS, energy consumption is monitored and recorded
in real time. The trend analysis provides data-driven
insight to optimize E&M system operation. On the other
hand, the energy consumption data can help identify
abnormal energy consumption pattern due to equipment
failure, e.g., a faulty control valve which cannot be
properly closed wastes energy and causes overcooling.
5.2.1 Energy benchmarking
With the exponential growth of O&M data collected,
operational data analysis not only helps diagnose
anomalies, but also helps benchmark the energy
efficiency across the same type of plant, equipment or
even similar types of buildings. The maintenance
team can easily unveil hidden energy patterns and
unseen equipment faults, and rank the recommendations
on energy cost saving opportunities [5].
5.2.2 Optimized operation based on building and
occupant behaviour
The building operational data can help conduct
occupant behaviour analysis which can quantify the
impact of occupant behaviour on building energy
performance. With big data analytics, machine
learning can be adopted to learn the historical data and
the underlying correlation between the occupant

- 6.5 -
behaviour and total building energy consumption for the
prediction of optimal setting to achieve energy saving.
6. CONCLUSION
E&M digitalization brings I&T to E&M systems with a
view to achieving high building performance. It has
brought drastic changes from traditional preventive
maintenance and post-fault rectification to predictive
maintenance and pre-fault rectification. The iBMS
enables the maintenance staff to monitor and control the
E&M systems anytime, anywhere. With the application
of big data analytics, building energy performance can
be visualized in real-time, energy end-used data can be
audited efficiently, and E&M systems can continuously
be operated at optimal condition.
To implement the smart O&M workflow in buildings,
BIM-AM System provides a single platform to
centralize all the building information and manage
E&M assets effectively.
With the collaboration of all stakeholders towards E&M
digitalization, smart building solutions will be the trend
to transform Hong Kong into a Smart City.
REFERENCES
1. CHAN H.Y, LEE C.K., YUEN P.H., 2017.
“Pioneering BIM-AM Application for Green and
Sustainable Building Operation and Maintenance”,
conference paper of HKIE Electrical Symposium
2017.
2. LEE C.K., YEUNG S.K., HU Jinshan, CHAN K.H.,
FUNG K.Y. “Enhanced Engineering Services for
Electrical & Mechanical System via Integrated
Building Management System, Remote Monitoring
Unit, and Geographic Information System”,
conference paper of World Sustainable Built
Environment Conference 2017 Hong Kong
3. CHEUNG M.C., CHAN T.C., YIU C.M,
“Transforming Data into Action – Building Energy
Management System to Actualize a Sustainable
Built Environment”, conference paper of World
Sustainable Built Environment Conference 2017
Hong Kong
4. CHAN P.S., CHAN H.Y., YUEN P.H., 2016,
“BIM-Enabled Streamlined Fault Localization with
System Topology, RFID Technology and Real-
Time Data Acquisition Interfaces, IEEE
International Conference on Automation Science
and Engineering (CASE)
5. TAI T.H., “Intelligent E&M Asset Management in
Building for Smart City”, conference paper of IET
2018 Symposium on Intelligent Asset Management
for Smart Cities.

Paper No. 7
EMBRACE THE POWER OF DIGITALIZATION
FOR A SUSTAINABLE HYPER-SCALE DATA CENTER
Speakers: Ir George K.C. Or, Director, Infrastructure Development
Mr Dikson Choi, Technical Manager Data Center Business NTT Com Asia Limited

- 7.1 -
EMBRACE THE POWER OF DIGITALIZATION
FOR A SUSTAINABLE HYPER-SCALE DATA CENTER Ir George K.C. Or, Director, Infrastructure Development
Mr Dikson Choi, Technical Manager
Data Center Business
NTT Com Asia Limited
ABSTRACT The modern IT environment is constantly evolving, as
IT infrastructure rapidly expands in pace with cloud
computing, big data, AI, and other new digital
technologies. The ever shifting infrastructure landscape
drives enterprises to revolutionize their data center
strategy, transforming their digital ecosystem.
Demand for digital transformation is constantly on the
rise, and data centers must operate at the hyper-scale to
stay competitive. Implementing a hyper-scale data
center is one of the most critical success factors to
economizing digital resources. Supporting massively
scalable computing architectures is crucial to
optimization and automated delivery. Designing a
hyper-scale data center that is sustainable is equally
critical; designed to be energy efficient, it reduces of
energy consumption and the carbon footprint,
minimizing environmental impact and lowering TCO.
Adopting a hyper-scale data center enables enterprises
to embrace digital transformation and deliver business
success.
This paper shares the experiences and insights NTT
Communications has had in embracing the power of
digitalization to achieve sustainability that meets the
LEED-CS 2009 (Platinum Grading) standard. It focuses
on how NTT Communications has spearheaded the
development of digital infrastructure in its hyper-scale
data center in Hong Kong, pioneering a world-class
infrastructure across the digital lifecycle from design, to
construction, and to operation.
1. INTRODUCTION
The digital economy has changed the structure of
industries and how we model our businesses. Uber, the
world’s largest taxi company, owns no vehicles.
Facebook creates no content. Alibaba has no inventory.
Airbnb owns no real estate. Nevertheless, all those
companies own a lot of customer’s data, including
behaviors, preferences, activities, and more.
Most companies turn to dedicated service providers to
manage growing data and execute sophisticated
algorithms in the back-end – so they can be free to focus
on their core business. The demand for hyper-scale data
center services providing co-location, hosting, cloud
computing, Software-as-a-Service (SaaS), Platform-as-
a-Service (PaaS), and Infrastructure-as-a-Service (IaaS)
therefore will continue to increase.
Creating a hyper-scale data center is one of the most
critical factors to successfully economizing digital
resources. Building a sustainable hyper-scale data
center is equally critical; designed to be energy efficient,
a sustainable data center reduces energy consumption
and its carbon footprint, minimizing environmental
impact and lowering the total cost of ownership (TCO).
A hyper-scale data center enables enterprises to
embrace digital transformation and deliver business
success.
This paper shares NTT Communications’ experiences
in embracing the power of digitalization to achieve
sustainability that meets the LEED-CS 2009 (Platinum
Grading) standard [1] and the insights we have gained in
our journey. It focuses on how our Hong Kong hyper-
scale digital data center has been a leader in digital
infrastructure development, pioneering world-class
infrastructure across the digital lifecycle, from design,
to construction, and to operation.
2. BACKGROUND OF
NTT COMMUNICATIONS HONG KONG
FDC2 HYPER-SCALE DATA CENTER
Data centers are power-hungry facilities, due primarily
to the large number of servers running around the clock,
all in need of constant cooling. Hong Kong has a
scarcity of land, and data centers generally are designed
with high-power densities at an exceptional level –
reliable cooling is therefore a challenge.
Businesses demand state-of-the-art IT infrastructure
performance and technology that can continuously
evolve to meet rising demand. These demands only
increase as new technologies emerge. As a result, new
cooling system designs are playing an increasingly
critical role in ensuring the reliability of high-density IT
equipment. Equally important is that the design to be
able to deliver enough space, power, and cooling – and
be cost effective – all while providing the flexibility
needed to meet current and future IT requirements.
Financial services, IT, e-Commerce, and other sectors
typically use High Performance Computing (HPC) to
satisfy their speed and performance needs. HPCs are
denser than standard IT hardware, placing added
importance on suppling the higher density power and

- 7.2 -
efficiently needed to cool HPC systems. The cooling
system must also be able to meet peak cooling demands
while performing under lower average loads efficiently.
Traditional cooling systems are not well suited to meet
these challenges, so a modern data center must
incorporate leading-edge technologies to overcome the
limits of older conventional designs. These
requirements increase the need for best-in-class data
center design, flexibility, and ample capacity to meet
business growth.
Fig. 1 – A Practical Example of Cooling Battery System
Imagine an energy heat map of Hong Kong. Parts of
Hong Kong would certainly be swathed in red. NTT
Communications’ Financial Data Center Tower 2
(FDC2) however contributes a large green swath, the
first data center in Hong Kong as well as greater China
to achieve LEED2009 for Core and Shell Development
(LEED-CS 2009) certification at the highest level,
platinum, a demonstration of its sustainable design. It
uses green engineering measures, in particular those
related to reducing energy consumption, environmental
impact, and carbon footprint. FDC2 is also the first data
center in Hong Kong as well as greater China to have
achieved the highest Platinum level under LEED-CS
2009, accomplished through a balanced approach using
sustainable design and best practices without
compromising operations or reliability.
FDC2’s cooling wall and cooling battery – first among
Hong Kong data centers – are two remarkable designs
enabling it to meet the Tier IV Standard Continuous
Cooling requirement as defined by the Uptime Institute [2]. They have the ability to increase energy efficiency
by more than 20% compared with traditional data center
cooling systems.
3. HYPER-SCALE DATA CENTERS
Hyper-scale data centers are massively scalable
computer architectures. They optimize server use,
energy efficiency, cooling, and their space footprint
through the economy of scale to meet their demanding
scale and density needs.
Hyper-scale data centers need to support a hundred
thousand physical servers and millions of virtual
machines. Ever-rising computing loads demand
increased IT hardware to meet their needs, and we have
seen power requirements increased significantly overall
in recent years. Each generation of IT hardware delivers
increase, resulting in a corresponding rise in heat
density. This engenders more concerns over how
flexibly data centers can adjust power, as well as the
optimization of cooling systems – both resulting in
long-term power savings.
NTT’s hyper-scale data centers optimize server use,
energy efficiency, cooling, and space footprints to meet
their scale and density requirements.
4. INNOVATIVE DESIGN
4.1 New High Density Design Standard
Data center TCO is comprised of many factors, which
can be categorized into upfront capital investment –
land, building shell, and facility infrastructure
equipment – and recurring operating costs. While there
are many operating cost factors including energy,
equipment maintenance, and labor, a substantial portion
of TCO is energy usage and power costs.
Fig. 2 – Benefit of High Density Design with TCO
Optimization [3]
Compact cities such as Hong Kong, Singapore, and
Tokyo have high building costs, and density also
becomes a significant part of TCO. To maximize the use
of space, NTT’s Hong Kong hyper-scale data center
FDC2 is a multi-story building. This lowered the initial
land acquisition cost and optimized the number of
cabinets per square metre. Financial services, IT, and e-
Commerce have an insatiable need for power, and
generally adopt High Performance Computing (HPC)
requiring less consumption of floor space. FDC2
therefore packs a power density of more than 100MW
within a 15,000 sqm site. It also can accommodate ultra-
high power density, up to 24 kVA per IT cabinet, which
are ultra-tall racks 54U high.
In 2007, the Green Grid Association released the Power
Usage Effectiveness (PUE) energy efficiency metric [4].
PUE is measured by dividing the amount of power

- 7.3 -
entering a data center by the power used to run its IT
infrastructure. It is expressed as a ratio, with overall
efficiency improving as it approaches one. Hyper-scale
data centers are designed for improved PUE, but
supporting higher densities requires special focus on
making cooling energy optimized and efficient. A lower
PUE results in lower initial capital investment and
operating costs per kilowatt of IT payload by improving
and optimizing cooling efficiency for higher density
racks and reducing recurring energy costs.
4.2 Cooling Wall
Cooling systems represent the largest facility-related
energy use in a data center. Optimizing efficiency while
operating effectively under a range of conditions is
therefore key for hyper-scale data centers.
Fig. 3 – Cooling Wall
Traditional down-flow cooling designs are limited in
how sufficient of air flow they can provide to high
power density racks, and they cause excessive energy
loss due to pressure drops at raised floor plenum and air
tiles. NTT Communications therefore partnered with
Vertiv (formerly Emerson Network Power) to develop
a new type of front-flow cooling method with hot aisle
containment. We call it the Cooling Wall.
The Cooling Wall has multiple benefits. Its design for
laminar airflow, ensuring equal supply distribution to
every rack from top to bottom. Compared to the more
common 42U racks, it effectively uses space as its lower
raised floor allows effective use of vertical space and is
able to accommodate more IT equipment in ultra-tall
54U racks. It also provides cooling of up to 24kVA per
rack, all while preventing overcooling of low-density
racks.
Fig. 4 – Front Flow Cooling System [3]
Its ventilation fans are controlled to maintain a slight
positive static pressure, ensuring ample airflow to every
IT intake regardless of load condition. The low fan
speeds are coupled with low static pressure as the room
itself is the plenum, significantly reducing fan power
needs. The custom control system regulates computer
air room handler (CRAH) supply temperatures by
measuring temperatures in cold aisles, ensuring proper
and stable environmental conditions, even with mixed
rack densities. This sophisticated combination of design
factors meets the cooling challenges of modern and
future IT hardware and delivers substantial
improvement in energy efficiency.
4.3 Cooling Battery
Continuous cooling is crucial to enable the thermal
environment bridge to remain stable until the cooling
system resumes full normal condition. Maintaining a
stable thermal environment using continuous cooling
helps mitigate elevation in temperatures within the data
center, which could damage IT hardware or critical
equipment, and provides thermal stability to IT
environments during interruptions in the cooling system,
such as the transition to a diesel generator during an
outage.
FDC2 has constructed the first stratified thermal energy
storage system in Hong Kong, termed the Cooling
Battery. It contains 3,600,000 litres of chilled water held
in two 25m high concrete cylinders with well thermal
insulation for 42 mins backup time, and its Continuous
Cooling features override up to six cycles of chiller
system restart due to utility power unitability. Water
density is inversely proportional to temperature, so the
chilled water is fully separated from the hotter water
which rises to the top on a thermocline. The chilled
water temperature and volume can be secured during
operation at all times and scenarios to feed the data
center cooling system, while the return hot water is
trapped in the upper layer.
Fig. 5 – Cooling Battery [3]
This is an essential feature enabling FDC2 to meet the
continuous cooling requirements of the Uptime
Institute’s Tier IV design parameters. It also allows
FDC2 to achieve better cooling performance by
leveraging the potential of server room temperature
elevation, all without excessive waste of cooling energy
to overcool the temperature in the server room.
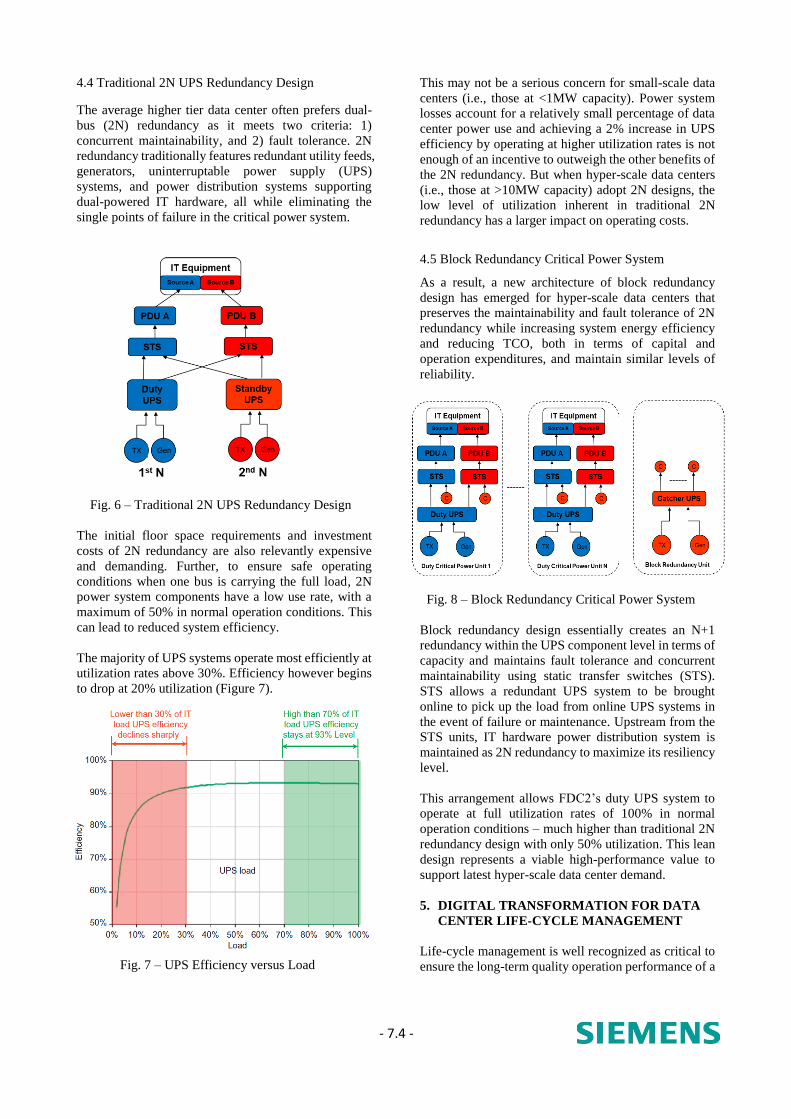
- 7.4 -
4.4 Traditional 2N UPS Redundancy Design
The average higher tier data center often prefers dual-
bus (2N) redundancy as it meets two criteria: 1)
concurrent maintainability, and 2) fault tolerance. 2N
redundancy traditionally features redundant utility feeds,
generators, uninterruptable power supply (UPS)
systems, and power distribution systems supporting
dual-powered IT hardware, all while eliminating the
single points of failure in the critical power system.
Fig. 6 – Traditional 2N UPS Redundancy Design
The initial floor space requirements and investment
costs of 2N redundancy are also relevantly expensive
and demanding. Further, to ensure safe operating
conditions when one bus is carrying the full load, 2N
power system components have a low use rate, with a
maximum of 50% in normal operation conditions. This
can lead to reduced system efficiency.
The majority of UPS systems operate most efficiently at
utilization rates above 30%. Efficiency however begins
to drop at 20% utilization (Figure 7).
Fig. 7 – UPS Efficiency versus Load
This may not be a serious concern for small-scale data
centers (i.e., those at <1MW capacity). Power system
losses account for a relatively small percentage of data
center power use and achieving a 2% increase in UPS
efficiency by operating at higher utilization rates is not
enough of an incentive to outweigh the other benefits of
the 2N redundancy. But when hyper-scale data centers
(i.e., those at >10MW capacity) adopt 2N designs, the
low level of utilization inherent in traditional 2N
redundancy has a larger impact on operating costs.
4.5 Block Redundancy Critical Power System
As a result, a new architecture of block redundancy
design has emerged for hyper-scale data centers that
preserves the maintainability and fault tolerance of 2N
redundancy while increasing system energy efficiency
and reducing TCO, both in terms of capital and
operation expenditures, and maintain similar levels of
reliability.
Fig. 8 – Block Redundancy Critical Power System
Block redundancy design essentially creates an N+1
redundancy within the UPS component level in terms of
capacity and maintains fault tolerance and concurrent
maintainability using static transfer switches (STS).
STS allows a redundant UPS system to be brought
online to pick up the load from online UPS systems in
the event of failure or maintenance. Upstream from the
STS units, IT hardware power distribution system is
maintained as 2N redundancy to maximize its resiliency
level.
This arrangement allows FDC2’s duty UPS system to
operate at full utilization rates of 100% in normal
operation conditions – much higher than traditional 2N
redundancy design with only 50% utilization. This lean
design represents a viable high-performance value to
support latest hyper-scale data center demand.
5. DIGITAL TRANSFORMATION FOR DATA
CENTER LIFE-CYCLE MANAGEMENT
Life-cycle management is well recognized as critical to
ensure the long-term quality operation performance of a

- 7.5 -
data center. NTT created NTT Communications' data
center infrastructure management (DCIM), its own
digitization platform, for end-to-end visibility
management, integrating digital construction, digital
operation, and digital service.
Fig. 9 – Integrated Cloud-based Digital Platform
End-to-end visibility adds value in four areas:
• Faster, enhanced communication between the
operator, designer, construction team, suppliers,
and clients;
• Faster, enhanced decision-making processes using
big data and advanced analysis techniques;
• Automation of manual tasks through technology;
and
• Eliminating human error through technology.
Thanks to careful planning of system integration,
workflow, and data requirements, FDC2’s integrated
digital platform has successfully integrated building
information modelling (BIM), data center infrastructure
management (DCIM), and facility systems (e.g.
building management systems, CCTV, security) with its
internal workflow, performance analytics, and fault
prediction framework.
NTT Communications' DCIM enables performance
tracking of all critical system data throughout the life
cycle, from design, construction, commissioning,
transition, operation, maintenance, improvement, to
disposal. This end-to-end visibility is crucial to enable
the data center team to continuously improve FDC2’s
performance, including in energy efficiency, reliability,
security, and response time.
5.1 Digital Construction
Building information modelling (BIM) involves the
generation and management of digital representations of
the physical and functional characteristics of a build
asset at the design stage. A BIM model contains
information on design, construction, logistics,
equipment’s technical data, and more. The data in a
BIM enables richer analysis, and it has the potential to
integrate large quantities of data across several
disciplines throughout the building’s lifecycle.
Fig. 10 – Digital Construction by BIM
NTT Communications has deployed BIM for
mechanical, electrical, and plumbing (MEP) detail
design, clash detection, multi-disciplines coordination,
and quality control since 2014. With the help of BIM
360 Field and BIM 360 Glue, NTT Communications
and contractors can use 3D models to coordinate
construction works and perform quality checking on-
site, effectively reducing abortive works and cost
overruns.
All design information and hardware data from BIM are
exported to NTT Communications’ DCIM seamlessly
without duplicate data entry.
Fig. 11 – Enhanced Construction QA/QC by BIM
5.2 Digital Operation
NTT Communications' DCIM services enhance system
operations and reduce operation workload. The
customer can monitor the data center system operation
status as well as manage the equipment and wiring
seamlessly, all from NTT Communications’ Nexcenter
client portal. Clients can visualize the real-time status of
server room temperature and humidity, hardware status,
power use, and air-conditioning workload. In the event
of any trouble, clients and data center staff can monitor
the same screen, enabling swift and smooth resolution
of the issue.

- 7.6 -
DCIM will be a strong part of the software-defined
operational and services strategy envisaged by NTT
Communications. Deploying DCIM enables NTT
Communications to tightly couple demand for
virtualized resources at the top layer of its digital stack
– IT and networking – with its underlying physical
datacenter resource supply – power, cooling, and space.
This results in cost efficiencies and reduces the risk of
service interruptions due to under-provisioning. By
integrating data from DCIM with a range of other
management systems, NTT Communications can make
more informed decisions around best-execution venues,
both internally and for client, all while taking into
account the cost and availability of IT, connectivity, and
data center resources.
The new dimension of visibility from accurate,
transparent, and responsive data provides a better
guarantee and increases confidence in the commitment
of service-level agreements (SLAs) and service quality.
This helps clients reduce risk through informative
decision-making, and it enables effective IT
infrastructure planning in the long run. DCIM collects,
normalizes, and reports data about NTT
Communications’ data center operating status. Included
in the report are power use, availability, redundancy,
and quality, as well as environmental conditions such as
temperature, humidity, and airflow pressure. Data is
pulled from a variety of sources within NTT
Communications’ data centers, including sensors,
power metres and clamps, branch circuits, batteries, and
UPSs, as well as hardware ranging from generators and
chillers to power distribution units and cooling systems.
The data streams are normalized into standard formats
so they can be readily analyzed and made available to
end-user clients where applicable. Customizable reports
plot data over time, such as power consumption and
operating environments at the room, row, and rack level.
Configurable alerts notify our operator when preset
thresholds are exceeded, and alerts are prioritized for
those needing an immediate response, such as an issue
in power quality or supply, or hot spots in the data hall.
Fig. 12 – NTT DCIM – Configurable Alert Setting
Real-time alarms empower the end-user to proactively
manage and mitigate risks by avoiding issues before
they happen. Enabling new efficiencies is also a key part
of DCIM’s value proposition. By identifying stranded
capacity, such as power, cooling, or space, NTT
Communications has been able to adjust its data centers’
layouts to enhance the use of key resources. DCIM also
provides the insight needed to better manage and plan
data center capacity overall.
Fig. 13 – NTT DCIM – Asset Capacity for Better
Business Planning
5.3 Next Step: Automation
NTT Communications’ DCIM acts as a middle point to
convert protocols between hardware and data collection,
and it supports distributed real-time (or near real-time)
control. The second phase, pending deployment, will
use DCIM to control devices and systems, including
power systems and cooling units. NTT Comm-
unications aims to replace the traditional building
management systems (BMS) functionality in its data
centers with DCIM.
BMS commonly are used for environmental control in
data centers and tend to be a data center’s the largest
proprietary control system. There are overlaps between
a BMS and DCIM, especially with monitoring.
However, BMS are not intended to measure moving
workloads or heat loads or make sense of them, nor do
they link IT operating information.
By standardizing DCIM and develop its own internet-
of-things platform, NTT Communications streamlines
monitoring by eliminating duplicate functionality and
enables more granular monitoring, including tracking
temperatures at a local level and tracking IT power
consumption. We envisage adopting DCIM to manage
key data center devices and systems in real-time on a
standard web browser. Select data will also be available
to data center staff via an HTML5 version of DCIM for
mobile devices.
The third phase aims to exploit the software as the real-
time control and automation framework for NTT
Communications’ data centers. At the heart of this effort
will be deep analysis of an array of data from various
sources, such as weather conditions and power costs.
Using historical data, DCIM will enable predictive
forecasting and scenario planning for IT moves, adds,
and changes, and machine-learning algorithms will
facilitate cost-optimized operations. For example, NTT

- 7.7 -
Communications aims to use DCIM for machine-
learning-driven automation of its data center cooling
equipment. When conditions are optimal, as determined
by DCIM and a combination of other data, the set-point
temperature and fan speeds on cooling units will
automatically adjust. In time, DCIM may enable NTT
Communications’ data centers to be operated closer to
their design peaks, augmenting facility use and,
ultimately, enabling substantial cost savings.
5.4 First LEED Platinum for Best Sustainability
FDC2 showcases green engineering excellence in
design, construction, and operation. FDC2 is the first
data center in Hong Kong as well as greater China to
achieve LEED2009 for Core and Shell Development
(LEED-CS 2009) certification at the highest level,
platinum, and its roadmap to achieve this rating was
borne with pioneering digital transformation as the
driving force behind data center and sustainable
development best practices.
According to USGBC LEED-2009 Rating System
Selection Guidance [5], LEED 2009 for Core and Shell
Development (LEED-CS 2009) addresses the design
and construction activities for projects. As such, LEED-
CS 2009 is the most appropriate for the LEED
certification of FDC2, addressing seven categories:
Sustainable Sites (max 28 points), Water Efficiency
(max 10 points), Energy and Atmosphere (max 37
points), Materials and Resources (max 13 points),
Indoor Environmental Quality (max 12 points),
Innovation in Design (max 6 points), and Regional
Priority (max 4 points).
LEED-CS 2009 certifications are awarded according to
the following benchmarks: Certified: 40 to 49 points;
Silver: 50 to 59 points; Gold: 60 to 79 points; Platinum:
80 points and above. In February 2017, USGBC
announced that FDC2 attained an overall 82 points
under the LEED-CS 2009 system, ranking it at Platinum
level – the FIRST in Hong Kong. FDC2’s evaluation
score is displayed below.
Fig. 14 – NTT FDC2 Evaluation Score – LEED 2009
Core and Shell Development
The FDC2’s LEED-CS 2009 score distribution across is
illustrated in Figure 15, which shows the score in each
individual category. It demonstrates that FDC2 has
comprehensively complied with LEED-CS 2009, a
benchmark of environmentally sustainable building
performance:
Sustainable Sites: 17 out of 28 points (61%)
Water Efficiency: 10 out of 10 points (100%)
Energy and Atmosphere: 31 out of 37 points
(84%)
Materials and Resources: 6 out of 13 points (46%)
Indoor Environmental Quality: 9 out of 12 points
(75%)
Innovation in Design: 5 out of 6 points (83%)
Regional Priority: 4 out of 4 points (100%)
Fig. 15 - NTT FDC2 The spider diagram of LEED-CS
2009 among various categories of credits
The categories with the most outstanding environmental
performance are Water Efficiency, Energy and
Atmosphere, Indoor Environmental Quality, Innovation
in Design, and Regional Priority. FDC2 in particular
successfully obtaining the full 21 points under Optimize
Energy Performance, a subcategory of Energy and
Atmosphere, demonstrating the excellence in its
innovative Cooling Wall, Cooling Battery and effective
Block Redundancy Critical Power System designs as
well as our digitalization operation.
FDC2 is a world-class green data center, and its
sustainable operation will continue its pioneering,
innovative, and excellent environmental performance to
contribute to improve the environment. In this, FDC2
will serve as a role model for sustainable development
in data center and IT.
6. CONCLUSION
The digitalization of the new economy drives
continuous advancement in hardware technology,
which is refreshed every 3-5 years. As a result, the
physical structure and critical infrastructure supporting

- 7.8 -
this new economy must be flexible enough to remain
technically viable and cost effective for 12-15 years or
more. Businesses can no longer afford the power density
restrictions of older designs that represented the status
quo of the past decade, much less the previous half
century. Going forward, they must be able to deliver
high efficiency and levels of availability under virtually
any operating conditions while providing low TCO.
Ultimately, hyper-scale data centers must become an
extension of the evolving IT philosophy – supporting
change and not being a limit to future innovation.
REFERENCES
1. U.S. Green Building Council (2009). LEED
Reference Guide for Green Building Design and
Construction, 2009 Edition.
2. Uptime Institute Accredited Tier Designer
Technical Paper Series: Continuous Cooling
3. NTT Communications (2015). Evolving Data
Center Designs in Digital Era. Whitepaper.
November.
4. PUE™: A Comprehensive Examination of the
Metric – The Green Grid 2012.
5. U.S. Green Building Council (2011). LEED 2009
Rating System Selection Guidance.

Paper No. 8
DEEP LEARNING TECHNOLOGY
& APPLICATIONS WITH BIG DATA
Speakers: Professor Francis Y.L. Chin
Emeritus Professor & Honorary Professor Dr Bethany M.Y. Chan Honorary Associate Professor Department of Computer Science University of Hong Kong

- 8.1 -
DEEP LEARNING TECHNOLOGY
& APPLICATIONS WITH BIG DATA Professor Francis Y.L. Chin
Emeritus Professor & Honorary Professor
Dr Bethany M.Y. Chan
Honorary Associate Professor
Department of Computer Science
University of Hong Kong
ABSTRACT
In this paper, we walk through the development of Deep
Learning and Neural Networks. The success of Deep
Learning technology has relied very much on having a
large amount of training data (Big Data), which allows
the capturing of hidden information in the data (through
embeddings or deep representations). Natural Language
Processing (NLP) and Image Processing are two
applications discussed as examples for Deep Learning
with Big Data.
1. INTRODUCTION
Over the past few years, Google and many major IT
companies have invested significantly in Machine
Learning technology, in particular, so-called “Deep
Learning” using very-large-scale multi-layer neural
networks, in order to enhance their services with, for
example, better image searching and machine
translation capabilities. Deep Learning has already
demonstrated great success in applications across many
domains such as object detection, image classification,
speech recognition, natural language and text
processing, and medical diagnosis and drug discovery.
We envision that Deep Learning will have great
potential in many other areas of research and
applications.
2. ARTIFICIAL INTELLIGENCE, MACHINE
LEARNING, DEEP LEARNING: PROGRESS
THROUGH TIME
What is Deep Learning? Within the field of computer
science, there is an area called Artificial Intelligence
(AI), which began in the 1950s when Alan Turing wrote
the paper titled “Computing machinery and intelligence” [1] in which he introduced the famous Turing Test
(sometimes referred to as the “Imitation Game” [2]). The
Turing Test was essentially a test of whether a computer
could fool a person, over the course of a conversation
between the person and the computer, into believing it
was a human being. Passing the Turing Test would be
evidence that a computer could exhibit human
intelligence. The human intelligence that a computer
was capable of exhibiting was “artificial intelligence”.
Whilst pioneering Artificial Intelligence (and indeed
Computing), Alan Turing made an important
observation: “Instead of trying to produce a programme
to simulate the adult mind, why not rather try to produce
one which simulates the child’s? If this were then
subjected to an appropriate course of education one
would obtain the adult brain.” The implication of his
observation was that learning (a course of education)
was the basis of intelligence. Some 30 years later,
Machine Learning – the idea of learning from past
experience or data to make accurate predictions –
became the focus of Artificial Intelligence, and Deep
Learning followed some 20 years later.
Why did it take so long to get to where we are now? The
journey toward Deep Learning was affected by the
stalled development of the Artificial Neural Network
(NN). The Perceptron [3], the building block of the NN,
was inspired by neurobiology and was invented in the
1950’s as a tool for learning. In the late 1960s, Marvin
Minsky, an MIT professor, published a very influential
book, Perceptrons [4], which discredited the capabilities
of the NN, and this caused a significant decline in
research funding for NN for many years. So it was not
until the 1980s that interest in NN research resurged on
the back of promising experimental results which
showed the multi-layer NN’s ability to compute any
logical function and approximate any function using
nonlinear activation functions.
In recent years, we have had the benefit of more and
more data – to the point of having Big Data – to learn
from, and this has affected the way in which Machine
Learning could be accomplished. New techniques for
learning from Big Data have resulted in Deep Learning,
where very-large-scale multi-layer neural networks are
used to learn from plentiful raw data.
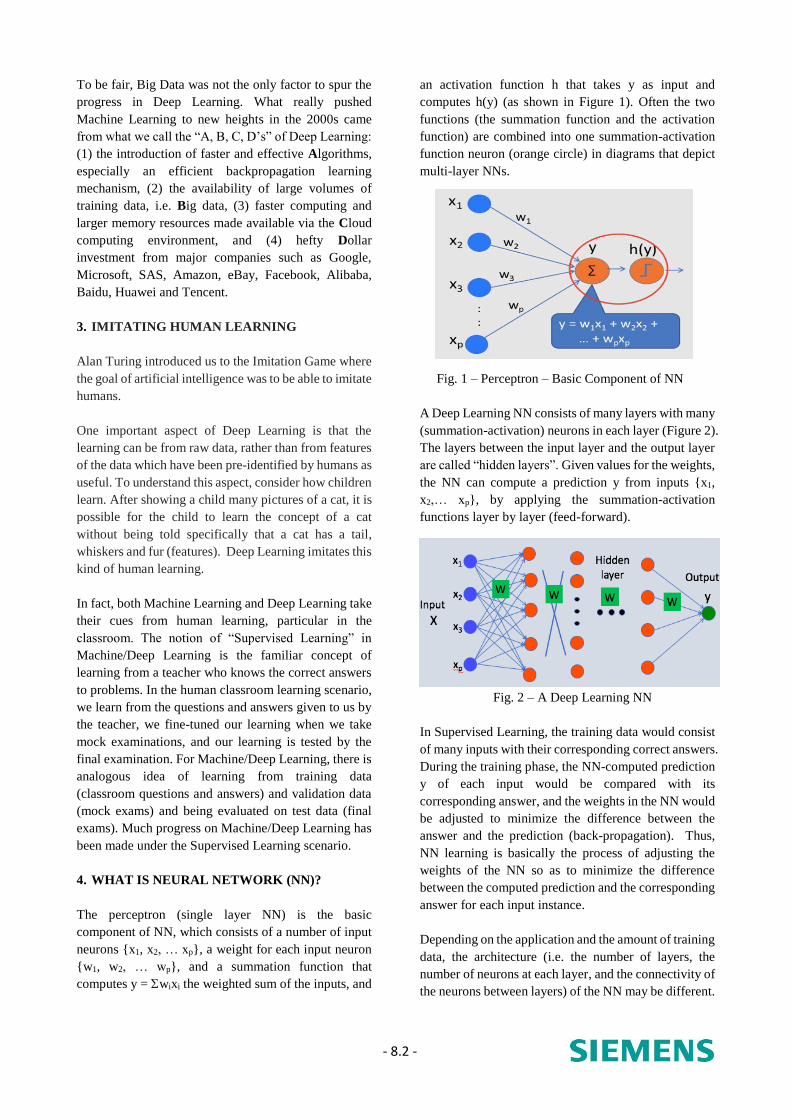
- 8.2 -
To be fair, Big Data was not the only factor to spur the
progress in Deep Learning. What really pushed
Machine Learning to new heights in the 2000s came
from what we call the “A, B, C, D’s” of Deep Learning:
(1) the introduction of faster and effective Algorithms,
especially an efficient backpropagation learning
mechanism, (2) the availability of large volumes of
training data, i.e. Big data, (3) faster computing and
larger memory resources made available via the Cloud
computing environment, and (4) hefty Dollar
investment from major companies such as Google,
Microsoft, SAS, Amazon, eBay, Facebook, Alibaba,
Baidu, Huawei and Tencent.
3. IMITATING HUMAN LEARNING
Alan Turing introduced us to the Imitation Game where
the goal of artificial intelligence was to be able to imitate
humans.
One important aspect of Deep Learning is that the
learning can be from raw data, rather than from features
of the data which have been pre-identified by humans as
useful. To understand this aspect, consider how children
learn. After showing a child many pictures of a cat, it is
possible for the child to learn the concept of a cat
without being told specifically that a cat has a tail,
whiskers and fur (features). Deep Learning imitates this
kind of human learning.
In fact, both Machine Learning and Deep Learning take
their cues from human learning, particular in the
classroom. The notion of “Supervised Learning” in
Machine/Deep Learning is the familiar concept of
learning from a teacher who knows the correct answers
to problems. In the human classroom learning scenario,
we learn from the questions and answers given to us by
the teacher, we fine-tuned our learning when we take
mock examinations, and our learning is tested by the
final examination. For Machine/Deep Learning, there is
analogous idea of learning from training data
(classroom questions and answers) and validation data
(mock exams) and being evaluated on test data (final
exams). Much progress on Machine/Deep Learning has
been made under the Supervised Learning scenario.
4. WHAT IS NEURAL NETWORK (NN)?
The perceptron (single layer NN) is the basic
component of NN, which consists of a number of input
neurons {x1, x2, … xp}, a weight for each input neuron
{w1, w2, … wp}, and a summation function that
computes y = wixi the weighted sum of the inputs, and
an activation function h that takes y as input and
computes h(y) (as shown in Figure 1). Often the two
functions (the summation function and the activation
function) are combined into one summation-activation
function neuron (orange circle) in diagrams that depict
multi-layer NNs.
Fig. 1 – Perceptron – Basic Component of NN
A Deep Learning NN consists of many layers with many
(summation-activation) neurons in each layer (Figure 2).
The layers between the input layer and the output layer
are called “hidden layers”. Given values for the weights,
the NN can compute a prediction y from inputs {x1,
x2,… xp}, by applying the summation-activation
functions layer by layer (feed-forward).
Fig. 2 – A Deep Learning NN
In Supervised Learning, the training data would consist
of many inputs with their corresponding correct answers.
During the training phase, the NN-computed prediction
y of each input would be compared with its
corresponding answer, and the weights in the NN would
be adjusted to minimize the difference between the
answer and the prediction (back-propagation). Thus,
NN learning is basically the process of adjusting the
weights of the NN so as to minimize the difference
between the computed prediction and the corresponding
answer for each input instance.
Depending on the application and the amount of training
data, the architecture (i.e. the number of layers, the
number of neurons at each layer, and the connectivity of
the neurons between layers) of the NN may be different.

- 8.3 -
Usually, more data will allow a NN to yield better
predictions. However, more layers and more neurons
might not ensure better performance because of the
problem of overfitting (i.e. getting very accurate
predictions for the training data but very inaccurate
predictions on the test data because of a certain degree
of “memorization” of answers during the training stage).
Larger networks also take more time to train. In the
following we shall present two most common types of
NN, each of which can serve different applications.
5. CONVOLUTIONAL NEURAL NETWORKS
(CNN) & IMAGE PROCESSING
Convolutional Neural Networks (CNN) (Figure 3) are
special kinds of NNs, particularly well-suited for image
processing. Images are usually stored as 2D pixels
(usually of a large size with neighboring pixels being
related). To cater for image data, the CNN has two types
of hidden layers: convolutional and pooling. The
convolutional layer applies small-size “masks” or
“filters” (these are the weights to be learned) to the
whole image to capture different local features of the
image, such as lines, corners, small/larger objects (for
higher layers), while the pooling layer reduces the size
of data or compresses the data using the maximum or
average of neighboring pixels to represent a patch of the
image.
Fig. 3 – Convolutional Neural Networks
We mentioned Supervised Learning earlier. The
bottleneck with Supervised Learning is the need to have
the “correct answers”. The boost to progress in image
processing came from ImageNet’s huge database of
around 15 million labeled high-resolution images
collected from internet and its annual competition on
image classification [5]. Fifteen million images are
unremarkable by themselves, but the fact that they were
labeled into roughly 22,000 categories was.
In 2012, there was a breakthrough when AlexNet [6], a
7-layer CNN, won the competition by a wide margin. In
the successive years, deeper and deeper CNNs entered
the competition, and by 2015, super-human
performance for image classification was achieved by a
152-layer CNN.
The development of CNNs for image processing led to
new discoveries. Researchers were interested in what
was happening in the hidden layers (in between the
input layer and the output layer) of the CNNs and
discovered that the hidden layers were capturing
features from the image, i.e. feature learning.
Researchers then began to realize that the CNNs, which
had achieved super-human performance in image
classification, may be mapping images into some kind
of meaningful deep representation (aka embedding) of
the image and that this meaningful embedding could be
used as the starting input for other image processing
applications (other than image classification), such as
image captioning, image segmentation and even the
generation of new images by making small changes to
an embedding of an image.
6. RECURRENT NEURAL NETWOKS (RNN) &
NATURAL LANGUAGE PROCESSING
Recurrent Neural Networks (RNN) (Figure 4) are
special kinds of NN, particularly well-suited for
sequences of data such as texts and speech.
Fig. 4 – Recurrent Neural Networks
The data for language processing is usually represented
by a sequence of input data, which is 1-D (and tends to
be relatively much smaller in size than image data which
is 2-D). However, the sequences can be long and each
input in the sequence is related to its neighboring input.
A RNN consists of a hidden layer representing the state
of the RNN when processing the sequence of input data.
Conceptually, the number of hidden layers (states)
equals to the length of the sequence and each state
depends on its previous state as modified by each input
data in the sequence. As the sequence can be long, there
are intrinsic problems with RNN, e.g., the output can be

- 8.4 -
related to an input processed many time steps earlier, so
mechanisms, such as Long Short Term Memory (LSTM)
and attention, have been devised to handle this problem,
which is called the “vanishing gradient” problem.
Just as the concept of embedding arose with image
processing, the concept of embedding also arose in the
Natural Language Processing (NLP). The mapping of
words to vectors that somehow captures the meaning of
the word was made possible through two clever
algorithms, one of which is known as Continuous Bag
of Words (CBOW) [7]. The principle behind CBOW was
an observation made (again) in the 1950s: “You shall
know a word by the company it keeps.” [8] In solving the
task of predicting a word when given the words
surrounding it, the NN’s hidden layer effectively give a
very good embedding of the word.
7. CONCLUDING – BIG DATA or NOT?
Much of the public interest in Deep Learning arose from
AlphaGo [9], Google Mind’s Deep Learning programme
which beat human champion players of Go. AlphaGo
trained on 30 million board positions taken from Go
games played by human experts. We have mentioned
the importance of Big Data for the training of Deep
Learning NNs. However, there is now a new piece to the
story: the creators of AlphaGo created another version
of AlphaGo called AlphaGo Zero [10].
What is significant about AlphaGo Zero is that it was
trained without any human data! AlphaGo Zero lends
support to tabula rasa – the idea that people are born
without any built-in mental content and all knowledge
has to be learnt from scratch. In commenting on
AlphaGo Zero, David Silver (one of AlphaGo and
AlphaGo Zero’s key developers) posed an important
question: Is data really important in learning? Before
AlphaGo Zero, the answer was clearly “yes”. But after
AlphaGo Zero, we are not so sure. Time will tell us
more.
REFERENCES
1. A.M. Turing. Computing machinery and
intelligence. Mind, 59(236): 433-460, 1950.
2. There was a Hollywood movie called “The
Imitation Game” (2014) based on the biography of
Alan Turing.
3. Frank Rosenblatt. The perceptron: A probabilistic
model for information storage and organization in
the brain. Psychological Review. 65 (6): 386–408,
1958.
4. Marvin Minsky and Seymour Papert. Perceptrons:
An introduction to computational geometry. The
MIT Press. 1969.
5. www.image-net.org
6. Alex Krizhevsky, Ilya Sutskever, and Geoffrey E.
Hinton. ImageNet classification with deep
convolutional neural networks. 2012.
7. Tomas Mikolov, Kai Chen, Greg Corrado and
Jeffrey Dean. Efficient estimation of word
representations in vector space. 2013.
8. John Ruppert Firth, 1957.
9. David Silver, et.al. . Mastering the game of Go with
deep neural networks and tree search. Nature. 529
(7587): 484–489. January 2016.
10. David Silver, et. al. Mastering the game of Go
without human knowledge. Nature. 550 (7676):
354–359. October 2017.

Paper No. 9
PREVENTIVE MAINTENANCE BY USING
CONNECTED IoT DEVICES IN ELECTRICAL SYSTEM
Speakers: - Mr Markus Hirschbold
EcoStruxure Power L&C Future Offer Director
Strategy and Innovation, Building & IT Business
Schneider Electric Ltd.
- Ir Ian Y.L. Lee
Solution Director
Schneider Electric (HK) Ltd.

- 9.1 -
PREVENTIVE MAINTENANCE BY USING
CONNECTED IoT DEVICES IN ELECTRICAL SYSTEM Mr Markus Hirschbold
EcoStruxure Power L&C Future Office Director
Strategy and Innovation, Building & IT Business
Schneider Electric Ltd.
Ir Ian Y.L. Lee
Solution Director
Schneider Electric (HK) Ltd.
ABSTRACT
Proven technologies exist today that can fully digitize
the electrical distribution infrastructure of large and
critical buildings and facilities. These are helping
improve safety for people and assets, increase power
reliability and business continuity, optimize operational
and energy efficiency, achieve sustainability goals, and
meet regulatory compliance. Yet, most organizations
are still not taking advantage of these latest advances in
power distribution connectivity and intelligence, some
of which may already be in place in their facilities.
Without this crucial last step, facility teams are working
blind, unaware of many hidden risks and opportunities.
1. INTRODUCTION
The pressures on organizations have never been greater.
Businesses routinely face tough competition, while the
boards of businesses and institutions are expecting
improvements in efficiency – often with fewer resources
– to help reduce costs and protect profits. At the core of
keeping operations running smoothly is a steady flow of
electrical energy, the most important input to critical
operations.
This is why operations and maintenance teams of large
and critical power facilities – such as hospitals, data
centers, and continuous industrial processes – have four
primary goals regarding their electrical infrastructure:
safety, reliability, efficiency, and compliance. Each of
these goals continues to present serious challenges as
well as great opportunities:
Risks to safety: Electrical system issues are
recognized as the cause of 22% of workplace fires [1],
while an estimated 25% of electrical failures are
attributed to loose or faulty connections, according to
a major insurance carrier [2]. This points to a need for
more vigilance in finding sources of overheating. And
while today’s breakers reliably protect from
overloads and short circuit conditions, hospital
operating theatres are particularly sensitive to
insulation faults, which can put lives at risk. Finally,
if a facility-wide or localized outage occurs, it’s
crucial that power be restored immediately to ensure
the safety of occupants, as well as re-establishing
operations.
Risks to uptime: Studies have shown that 30 to 40%
of business downtime is caused by power quality
disturbances, and that 70% of those disturbances
originate within the premises [3]. Any amount of
power interruption can be devastating to an
organization’s operations. Given that the average
outage in mission critical facilities lasts 90 minutes [4],
these incidents represent a massive cost to businesses
and institutions. Beyond lost productivity is the cost
of replacing expensive equipment such as a failed
transformer. To put this in perspective, a study by
Lawrence Berkeley National Laboratory found that
power interruptions cost the US economy
approximately $59 billion in 2015, which was an
increase of more than 68% since an earlier 2004
study. Commercial and industrial businesses account
for more than 97% of these costs [5]. Preventing
downtime requires ‘seeing into the future’, or rather
being able to identify when conditions on your power
network are deviating outside of safe parameters, or
when protection settings have deviated from their
original design.
Risks to energy efficiency: Beyond the costs of
power-related interruptions, there are also the
economic costs of inefficiency. The US Department
of Energy estimates that “with the application of new
and existing technologies, buildings can be made up
to 80 percent more efficient or even become ‘net zero’
energy buildings with the incorporation of on-site
renewable generation.” [6] This is a huge opportunity
for organizations to reduce energy consumption,
which for data centers and industrial processes can
represent a large percentage of operating costs. Doing
so requires gaining visibility into every aspect of
energy, from billing, to consumption, to onsite energy
production.
Risks to operational efficiency: Another big part of
operational costs is the time and money facility teams
spend maintaining power and buildings systems,
often with limited staff. Maintenance represents 35%
of a building’s lifetime costs (IFMA, 2009) [7], so any

- 9.2 -
improvements to team efficiency and equipment
lifespan can represent a significant bottom line
savings. In fact, another Department of Energy study
revealed that by implementing a programme of
condition-based predictive maintenance, a building
can save up to 20% per year on maintenance and
energy costs, while increasing the projected lifetime
of the building by several years [8]. However,
predictive maintenance requires a new level of
analytic capabilities that can help predict equipment
needs and enable collaboration with experts when
needed.
Risks to compliance: Emissions regulations are
becoming common in most countries, while many
corporations are implementing their own
sustainability goals. Meeting these objectives is
challenging without the necessary energy
consumption data. Regarding maintaining reliability,
healthcare facilities are often required to regularly test
backup power systems. It’s also important to ensure
energy providers are complying with power quality
requirements of energy contracts. These processes
can be onerous without the appropriate analysis and
reporting tools. Finally, to acquire the data necessary
to manage electrical safety, reliability, and efficiency
means depending more on connected systems. This
brings more risk of cyber-attacks, requiring
cybersecurity best practices to be adhered to.
This is a demanding set of challenges. What is even
more concerning is that facility management teams in
most large buildings and plants are still unaware of these
risks and opportunities. The reason: a lack of visibility
to enterprise-wide power and equipment conditions.
Though the consequences of a power outage are severe,
and the costs of energy and maintenance are high, most
new and legacy facilities still use only a rudimentary
level of technology to help prevent power system
failures and minimize operational costs. When problems
arise, the response is usually on a reactive rather than
proactive basis.
Fig. 1 – Facility Teams for Large and Critical Buildings
need to Maintain the Safety, Reliability, Efficiency, and
Compliance of their Electrical Infrastructures
1.1 Intelligent Power has Arrived
Facility teams should be taking full advantage of the
many applications and benefits that digitization now
enables. Without a fully connected and intelligent
power management system, facility teams are ‘working
blind,’ unaware of the many risks that may be
threatening business continuity and efficiency. And
risks progressively increase as new loads are added that
could affect power quality, especially non-linear loads
often used to improve energy efficiency such as LED
lighting, VSDs, switching power supplies, etc.
Like advances in vehicle-based intelligence in the
automotive industry, power distribution systems now
include a complete network of smart, connected
devices. These deliver timely, actionable information to
facility teams through powerful software applications,
either at the desktop or on their mobile devices
anywhere they are. The newest tools are making it
simpler than ever to understand power and energy
conditions and manage complex power systems. The
steps to implementing such a solution can be extremely
cost-effective considering all the dimensions of ROI
that can be achieved in a very short payback period.
Many of the pieces may already be in place in most
facilities, such as smart meters and breakers. Once
connected, facility teams will immediately benefit from:
1. early warning of risks
2. faster recovery from problems
3. time and cost-saving opportunities being revealed
4. streamlined maintenance
5. enhanced equipment performance and lifespan
This paper will show how a nominal investment in a
digitized electrical distribution infrastructure can help
large and critical facilities to more easily meet core
operational, sustainability, and regulatory goals while
gaining additional unexpected benefits.
CASE STUDY 1:
Wastewater plant averts disaster
One of the largest wastewater treatment plants in the world was in the process of expanding their power management system.
When the final metering devices were connected, the system
immediately detected a serious problem. At one of the main substations feeding the plant, the tie breaker between the two
incoming transmission lines was unexpectedly closed. Worse, a
fuse was blown on one of the incomers, meaning dual incomer redundancy was lost. If there had been a grid outage on the
remaining incomer, an entire section of the plant could have
experienced a disastrous failure. Fortunately, this risk was detected and corrected, highlighting the critical importance of
24/7 electrical system monitoring.

- 9.3 -
Fig. 2 – Smart, Connected Devices are the First Step in
a Completely Digitalized Power Distribution System
2. THE DIGITIZATION OF POWER
DISTRIBUTION
Digitization is all around us. Consider the automotive
industry. Cars today are some of the most digitized
machines in our lives, yet we all take for granted the
incredible advances that have taken place in recent
years.
Every aspect of operation is monitored, displayed, and,
in some cases, controlled automatically. These
capabilities have vastly improved the safety, reliability,
efficiency, and compliance of every kind of vehicle,
while improving ease-of-use and driving experience for
owners. For example, vehicles routinely provide:
Oil pressure, temperature, battery voltage, fuel level,
coolant level, etc. sensors: make sure you are alerted
in case of any malfunction before you get stranded on
the side of the road.
Anti-lock braking system (ABS): prevent un-
controlled skidding.
Stability controls: prevent loss of traction (by sharing
the same brake actuator and sensors with ABS).
Automatic air bags: to protect driver and passengers
in the event of a collision.
Emission sensing and control: to meet regulatory
standards.
More advanced capabilities might include:
Tire pressure monitoring sensors: improve fuel
economy and alerting the driver to a potential flat.
Backup cameras with proximity sensors: guide the
driver into a parking spot.
Blind-spot monitoring: increase safety of lane
changes.
Lane departure warning: help avoid collisions due to
driver error, distractions, and drowsiness.
Look-ahead radar: starts braking before a collision
can occur.
Fig. 3 – Advancements in Automobile Technology
provide as Standard Equipment a Vast Array of Sensors
and Intelligence in Every Vehicle
2.1 Smarter Power Distribution
It is now unthinkable to deal with the extreme
complexity found in cars without sophisticated
digitization. Imagine being an auto mechanic and
having to troubleshoot a modern car without a
diagnostic scanner.
The same is true for modern electrical distribution
systems. Systems are larger and typically evolve over
time to accommodate more loads, many of which are
increasingly power sensitive (e.g. automation systems).
Many types of loads, such as variable speed drives, can
also be the source of potential power quality (PQ)
issues. Beyond energy-consuming loads, larger sites
will often include onsite generation and storage, either
for power backup, ‘peak shaving’ to avoid demand
penalties, or to consume self-generated renewable
energy when it’s most economical.
As the complexity and sophistication of our electrical
distribution infrastructure increases, it becomes more
important to have the appropriate digital sensors,
advanced controls, and analytic capabilities to detect,
diagnose, and correct issues before they cause mission-
critical systems to fail. Touching every corner of a
facility’s electrical network, the latest ‘edge control’
software and mobile apps connect to smart devices to
keep facility teams informed and reveal deep insights.
Like digitized vehicles, digitized power distribution
optimizes safety for people and assets, while improving
reliability and business continuity. It provides the data
that is converted by analytic software to actionable
information to help facility teams maximize energy
efficiency as well as life cycle efficiency. As an
alternative to interval-based maintenance, digitization
enables condition-based maintenance, enabling
equipment servicing to be performed at the right times
to improve reliability and avoid unnecessary time and
costs.

- 9.4 -
A digitized power network also simplifies energy and
emissions tracking and reporting for regulatory
compliance, to support participation in carbon markets,
or to publicly showcase energy performance.
Finally, data from distributed devices can be
automatically and continuously uploaded to cloud-
based platforms, enabling 24-hour support from expert
services. This can be especially valuable for facilities
that do not have adequate in-house resources or
expertise.
3. SIMPLE STEPS TO GETTING CONNECTED
Unlike today’s vehicles, power distribution systems do
not come ‘stock’ with complete digitization. However,
the technology is available, proven, and operating
successfully in thousands of facilities worldwide.
Currently, the required devices, communication
networking, and software applications need to be
specified. It is expected that in future all of this will
become a standard and ubiquitous part of every power
distribution installation.
The good news is that most newer power distribution
systems may already have the connectivity available but
may not have it implemented yet. Installed devices
simply need to be networked together. Even legacy
systems have simple retrofit possibilities to add the
appropriate devices and sensors. These upgrades are
extremely cost-effective when considering the long list
of benefits to the facility and the organization.
Let’s take a look at the type of devices, commun-
ications, and architectures that make a digitized power
distribution system possible.
3.1 Smart, Connected Devices
Digitization of power distribution has been enabled by
the increasing connectivity of devices, aided by the
global trend in the Internet-of-Things (IoT). More and
more devices and sensors are becoming digitized, with
new kinds being introduced all the time. Table 1 lists
some common types.
Table 1 - Typical Types of Smart, Connected Devices
within a Power Distribution System
Device / Equipment
Data / control provided
Protection devices
Circuit breakers Trip units with embedded
power and energy metering,
breaker condition
monitoring, diagnostics,
alarms, data logs
Protective relays Trip units with diagnostics,
network status, alarms, data
Logs
Meters, monitors, sensors
Energy meters Basic single or multiphase
energy consumption, data
logs
Power quality
monitors
Energy, power, demand,
advanced power quality
capture and analysis,
equipment status, alarms,
data and event logs
Environmental sensors Temperature, humidity,
gas, and pollution (e.g. to
help avoid corrosion,
reduced performance, etc.)
Arc-flash sensors and
relays
Alarm on arcing condition
Vibration sensors Vibration readings
Voltage, current
sensors
Single measurements on
each phase
Busbar temperature
sensors
Temperature, alarm on
exceeding threshold
Embedded equipment sensors, controllers
UPSs, DC inverters,
battery chargers
UPS status, battery levels,
control functions
Gensets Genset status, voltage,
current, power, fuel level,
temperature, control
functions
Transformers Temperature sensors,
voltage, current
Automatic Transfer
Switch
Switch status, control
functions
Automation equipment
PLC Data from connected
devices, control functions
RTU Analog and digital input
measurements
CASE STUDY 2:
University improves safety and reliability
For a large university, unpredicted power outages carry a high
cost, both financially and potentially in lost lives at its medical
center. After suffering a major transformer failure, the university
built its own substation and installed a complete power management system.
The intelligent power quality meters and analytic software perform automated alarm monitoring, breaker status monitoring
and control, and transformer temperature monitoring.
The system helps schedule preventative maintenance, correct
transient anomalies, and enables quick response to emergencies
such as power outages and weather-related incidents.

- 9.5 -
Devices can be integrated into a communications
network in several ways. Wireless can be used for ease
of installation, especially for simpler measurement or
sensing requirements. Serial communications can make
a good choice in some cases, especially as serial ports
are common on many types of devices. Ethernet is the
best choice where large amount of data and fast data
transfer are requirements, such as for more advanced
power quality monitors and for communications hubs
that aggregate data from many downstream devices.
Standards, such as the IEC61850 standard, and
communications data models are emerging for more
effective universal and non-proprietary communi-
cations. Most smart devices offer a choice of
communication protocols for system compatibility,
while some provide modular hardware designs that
enable communication ports to be installed in the field
for devices not already connected. Some more advanced
devices also offer modular firmware architectures that
allow functionality to be customized. This kind of
flexibility allows devices to adapt to current and future
needs.
IoT-enablement means smart devices can upload data
directly to Cloud-based data storage and applications,
making for simpler data sharing and collaboration
across one or more facility’s operations and
maintenance teams. Many devices also offer direct
browser-based access to real-time and logged data using
mobile devices.
An example of what an IoT-enabled electrical
distribution architecture can look like is shown in Figure
4. This illustrates a simplified architecture for a hospital,
highlighting devices at the medium voltage, low
voltage, and final distribution levels.
Fig. 4 – A Typical Digitalized Power Distribution
Monitoring Network showing Smart Devices located at
Each Level of the Electrical System
3.2 Powerful Supervisory Applications
In a digitized power distribution system, a software
application acts as the central collection point where all
digital real-time and historical data is aggregated and
made available to all stakeholders that oversee the
electrical infrastructure.
The combination of software and device network is
often referred to as an energy and power monitoring
systems (EPMS). For large and mission-critical
systems, supervisory control and data acquisition
(SCADA) systems designed for power distribution are
available. These have built-in redundancy that supports
fail-safe operation, reliable control actions, and highest-
accuracy timing.
With central software, the benefits of digitization come
to fruition. Using connectivity to all the devices and
equipment mentioned previously, the software makes it
possible to supervise electrical processes such as power
transfers and network automation. This is commonly
done with the help of ‘single-line’ diagrams that display
power and energy conditions throughout the facility, as
well as equipment status (Figure 5).
Fig. 5 – A Typical ‘One-Line’ Diagram showing
Electrical Conditions and Equipment Status throughout
a Power Distribution System
Event data is captured and stored on board each device
with precise timestamping, then automatically uploaded
to the software. The software sends automatic email or
SMS notifications for alarms and events to designated
recipients. It will also provide extensive analytic
capabilities to help diagnose and isolate sources of
problems, as well as reveal opportunities to improve
power, energy, and equipment performance. The next
sections describe how these tools simplify each process.

- 9.6 -
3.3 Power Management Made Easy
With a fully digitized power system, facility teams can
take advantage of a vast number of applications to help
meet safety, reliability, efficiency, and compliance
goals. Desktop edge-control software and mobile apps
enable access to devices distributed across the entire
electrical infrastructure, while analytic tools make it
simpler than ever to gain deep insights, enable
decisions, reduce response time, and make operations
and maintenance workflows more efficient. Further,
cloudbased advisor services, with experts helping
perform analytic and advisory functions, can take the
burden off the onsite facility team by assisting with
preventive or predictive maintenance.
However, it is important to make sure the data received
by analytic applications is accurate and reliable.
Experience has shown that many systems are prone to
wiring, configuration, and commissioning mistakes. It
is vital to have an error checking algorithm that detects
all of these errors so they can be eliminated. Without
this important step, incorrect decisions can result from
unreliable data.
3.4 Optimizing Safety
Preventing electrical fires: Up to now, electrical fire
prevention has involved using infrared (IR) scanning.
An IR camera is used to detect hot spots in busbar
junctions, transformer connections, or breaker contacts.
This procedure is quite expensive and, therefore, is only
performed at specific intervals, from twice a year to
once every two years. The problem is that electrical fires
are often caused by incorrectly performed maintenance
procedures; therefore, the issue can be missed if the
maintenance is done after the regular IR scanning has
been performed.
Fortunately, digitization brings a more sophisticated and
continuous approach to thermal monitoring. Wireless
sensors installed in strategic locations detect abnormal
temperature rises due to high impedance connections on
busbars or in conductors, transformers, or breakers.
Temperature data is wirelessly transmitted to the
software or to an asset monitoring service bureau. This
allows for near real-time alarming in case of a thermal
problem before it results in an electrical fire destroying
equipment or injuring people. Thermal monitoring is
effective at the medium voltage and low voltage levels.
Specifically, it also brings great value in busway
applications to detect improperly tightened junctions.
Preventing electrical shock: Operating rooms and
intensive care units in hospitals rely on isolated power
to keep patients safe. Sensors in isolated power panels
are connected to the power management network so that
electricians can be remotely alerted to an insulation
failure and, in turn, provide immediate assistance to
surgical staff.
Recovering fast from outages: Responding effectively
to an outage requires access to the right information
when and where it is needed. In a digitized power
network, an intelligent relay or circuit breaker trip unit
delivers this information directly to mobile smart
devices. Mobile devices can also be used to perform
remote breaker control to restore power safely from a
distance.
At a workstation, sophisticated software tools allow for
advanced power forensics, speeding up the diagnosis of
power incidents. Due to the high accuracy time-
stamping of events that occurs onboard smart devices –
e.g. distributed meters, relays, data loggers, etc. – a
visual timeline can be automatically created that shows
related events, waveforms, and trends (Figure 6).
Custom filters can be used to show only what is most
relevant.
Additionally, a patented diagnostic capability from
Schneider Electric named Disturbance Direction
Detection makes it easier than ever before to determine
where disturbances are coming from. Power meters
automatically analyze every captured waveform,
indicating the direction that a disturbance was
travelling. With many meters connected to central
power management software, it is possible to see how a
disturbance flowed through the electrical distribution
system, revealing if it was coming into a facility from
the grid or originating from inside the building. This
capability saves a tremendous amount of time in
diagnosing problems.
Precise time synchronization, cross-system correlation,
and Disturbance Direction Detection all help to
reconstruct event sequences before, during, and after an
incident. This helps operations personnel gain an
understanding of how incidents cascaded through the
system, quickly find the root cause of the event, and
enable steps to be taken to restore power speedily.
CASE STUDY 3:
Soap factory solves production stoppages A soap making factory was experiencing mysterious production
line stoppages about once a month. Each caused a four to eight-
hour delay costing $20,000 (USD) per hour and $120,000 (USD) every month.
A networked power management system was installed. Smart power quality meters and analytic software determined the
problem was power sags, swells, and transients coming from the
utility grid.
The utility determined the problem was coming from a heavy equipment operator close by that was generating disturbances
back onto the grid. The utility installed new lines that isolated the
plant from the problem, which resolved the downtime issue.

- 9.7 -
Analytic results can be annotated and saved for later
consideration.
Fig. 6 – Advanced Event Analysis shows Related
Incidents on a Visual Timeline, Revealing How an
Event Cascades through the System and Enabling the
Facility Team to Quickly Isolate the Source of the
Problem
3.5 Improving Reliability
Avoiding downtime: By staying connected 24/7 to
every point in the electrical distribution network, the
real-time state and conditions of the network can be
monitored for any deviations from normal operating
conditions. If this occurs, the right people can be
notified automatically, who will have detailed alarm
data to determine the problem and respond before an
outage can occur. Chronic power system events can be
analyzed using the root cause analysis tools mentioned
above, to help in preventing future occurrences.
By constantly monitoring load trends through a facility,
active load management can be used to prevent
overloads and, in turn, business disruptions. This
information can also be used to uncover unused capacity
and for capacity planning for new facility expansions,
avoiding overbuilding and minimizing CAPEX.
Large and critical facilities have a hierarchy of
protective devices, typically starting with molded case
circuit breakers at the medium voltage level, then
compact circuit breakers at the final distribution level.
To properly isolate faults it is important that a circuit
breaker trips just upstream of a fault. This is referred to
as breaker selectivity or co-ordination. During the
commissioning of a facility, a co-ordination specialist
makes sure that all breakers are configured such that a
downstream breaker always operates before an
upstream breaker. This minimizes the impact of a fault
on the overall electrical system.
In recently commissioned facilities, breaker co-
ordination is typically intact and configured as
designed. However, over the life of a facility
electricians and operators tend to ‘tinker’ with breaker
settings in response to nuisance trips or expansion of
loads. This compromises selectivity and can result in
trips for a much larger part of the network than intended.
Thanks to digitization and connectivity to edge-control
software or cloud-based analytics, it is now possible to
dynamically and continuously analyze breaker co-
ordination, generating an alarm in case of any co-
ordination violations. A ‘digital twin’ captures and
stores the original co-ordination settings of each
breaker, detecting any deviation that will result in
undesired consequences. This added level of
intelligence will help maximize breaker performance
and reliability of the overall electrical system over the
longer term.
Increasing asset reliability and lifespan: A recent
trend in facilities has been the replacement of linear
electrical loads with non-linear loads such as LED
lighting, variable speed drives, and switching power
supplies. This is typically done to conserve energy.
However, non-linear loads introduce harmonics that can
affect sensitive electrical equipment. As a facility starts
to transition to these alternatives they may not, at first,
appear to be causing any problems. But, as the number
of non-linear devices increases, the level of harmonics
can get to a point where sensitive equipment is being
affected.
This situation is typical of most power quality problems.
Many facility managers may be heard saying, “We have
never had problems with harmonics or power quality. It
is not something we are concerned about.” Then, one
day, their mission critical machine starts to fail.
Having all the relevant information needed to identify
power quality issues will help manage their impact and
keep them from disrupting business operations or
damaging critical loads and equipment. Sensitive
equipment needs to be protected from issues such as
harmonics, voltage sags and swells, flicker, transient
voltages, or brief interruptions. A fully digitized power
distribution system helps prevent these by providing
CASE STUDY 4:
Airport maximizes use of infrastructure
A large international airport digitized their electrical distribution
system with automatic data collection from key points throughout.
The goal was to improve the overall reliability and efficiency.
The system identified peak loading on all distribution equipment, as
well as helping determine when non-critical loads could be shed, helping avoid overloading that could cause outages and equipment
damage.
Trending capabilities also helped maximize equipment utilization by
identifying areas of excess capacity.

- 9.8 -
early detection of conditions before they exceed levels
that harm equipment.
Another threat to reliability is high temperatures and
humidity. These can prematurely age the components in
power distribution switchgear, especially when
operating in extreme or outdoor environments, and
when pollutants are present such as salt. Compact,
affordable sensors are now available that measure both
temperature and relative humidity [9]. Sensors are
battery-operated and transmit data wirelessly to the
analytic software for analysis. If environmental
conditions exceed defined thresholds and durations,
maintenance teams can perform required maintenance
to help avoid corrosion, equipment failure, and
downtime.
Depending on available in-house skills, temperature,
humidity, and power quality issues can be analyzed and
evaluated on-site by the local facility team.
Alternatively, this can be outsourced to a cloud-based
advisory service.
3.6 Boosting Efficiency
Managing energy consumption and costs: Since
energy represents a significant line item for any facility,
especially energy-intensive ones like data centers,
finding ways to reduce energy spend can make a big
impact on the corporate bottom line. The first step that
can achieve a massive payback, is to use accurate
‘shadow metering’ and energy analytics to verify that a
facility’s utility bill is accurate, both from a metering
and bill calculation perspective.
The next step is to encourage energy efficient behavior
and support cost accounting by accurately allocating
direct and indirect energy costs to departments or
processes. Software can also be used to benchmark and
compare the energy usage across buildings, plants, or
process lines to uncover inefficiency and waste. The
energy performance of a facility or building can be
analyzed against a modeled baseline which considers
relevant energy drivers, such as weather, production
levels, etc. (Figure 7)
Fig. 7 – Energy Analysis Tools allow Import of
Contextual Data (e.g. weather) for Tracking Energy
Performance, Conducting Energy Analysis and
Calculating Important KPIs. Analytics clearly reveal the
Difference between Modelled (pre-retrofit) and Actual
(post-retrofit) Data, Helping Weigh the Results of
Energy Conservation Measures against Targets
Then, drilling down to see how much energy is
consumed by the various load types and/or areas in a
facility will help to determine where to focus energy
conservation initiatives. Before and after analysis will
help verify the energy savings from an energy retrofit or
energy savings programme. Some of these initiatives
might include eliminating power factor penalties (e.g.
by installing appropriate PF management equipment)
and, as noted previously, avoiding demand penalties
using peak shaving or active load management.
Managing multiple energy sources: A digitized power
distribution system helps leverage onsite energy
production and consumption to boost energy cost
savings and uptime. Energy sources might include solar,
combined heat and power system, or gas or diesel-
fueled backup generators. It could also include an
energy storage system. Such integrated systems are
typically referred to as microgrids. They can be operated
in parallel with the main utility grid or can sometimes
be operated in an off-grid islanded mode in the case of
a grid blackout.
CASE STUDY 5:
Hospital reveals source of dialysis machine failures
A large hospital was experiencing failures of their blood dialysis
machines due to an unknown source.
A power management system was installed and used to analyzing
system-wide power quality. It was determined that the dialysis machines were sensitive to an increased level of harmonics in the electrical
system, coincident with the recent installation of variable frequency
drives.
Appropriate harmonic filtering was installed which solved the problem.
CASE STUDY 6:
Children’s hospital uncovers energy saving opportunities
With an intelligent power and energy management system in place, a
hospital was able to allocate energy costs to different sections, with alarms set for excessive consumption.
The system analyzes consumption patterns for individual equipment. This supports load-shedding operations to avoid peak demand
penalties, and load management to reduce base energy costs. This
has also identified areas to improve energy efficiency.

- 9.9 -
Digitization also enables access to value-added services
on the ‘smart grid’, helping a facility team optimize
when to consume, store, or to sell back energy to the
grid. Advanced onsite or cloud-based microgrid control
systems can provide predictive source management
with inputs such as weather, energy cost, and other
parameters to drive energy source control decisions.
Many solutions are modular in design, offering
scalability to manage smaller commercial microgrids up
to large-scale, islanding-capable systems.
Optimizing maintenance: A digitized electrical
network gives a voice to critical energy assets. It enables
equipment to provide the relevant condition-based
information to maintenance teams to identify when they
require servicing. This is a more proactive approach, in
contrast to servicing only at regular intervals, which can
save time and money while also catching risk conditions
that might otherwise be missed.
An example of condition-based monitoring is breaker
aging analysis. This is an innovative new capability
provided by some of the most advanced circuit breakers
and power management software. Breakers report on
the condition of their contacts, as well as many other
operational parameters, while other sensor inputs report
on environmental conditions that can affect breaker
health, such as temperature, humidity, and corrosive
gases. In combination, a more accurate picture of the
aging of a breaker can be determined to help drive the
appropriate maintenance protocol. This can help
enhance the performance, reliability, and lifespan of
each breaker.
Outsourcing facility management functions: Today,
many facilities are struggling with the ‘brain drain’
dilemma when experienced electrical engineers and
electricians are retiring and it is difficult to find new
young talent. It is becoming more and more common for
facilities to outsource some or all their facility
management tasks.
Digitization is a wonderful enabler for this, since it
enables third party facility management companies to
offer competitive analytic and advisory services,
including monitoring multiple facilities from a central
operations center. Many of the newest cloud-based
power and energy management solutions allow for data
sharing with outsourced expert services. These services
facilitate condition based maintenance, ensuring
maintenance is focused where it is needed, the right
maintenance is performed at the right time, and
maintenance spend is optimized.
3.7 Simplifying Compliance
Committing to sustainability: Energy analytic
platforms enable facility teams to benchmark energy
consumption with respect to national or international
energy efficiency certifications bodies and to share
energy reduction success with the public.
Systems will help track and report on carbon emissions
for public disclosure and transparency, to boost green
image, meet regulatory compliance, or participate in
carbon markets. Many applications also provide simple
ways to showcase energy performance to stakeholders
via public dashboard displays, which can also
encourage energy awareness and energy-efficient
behaviors.
Testing backup systems: Organizations like hospitals
are required to regularly test and report on their backup
power systems (generators, UPS, etc.). This process can
be onerous; however, the newest power management
systems can help simplify this process by automatically
generating compliance, test, and maintenance reports to
save time and reduce human error.
Ensuring supplier power quality: It is critical to
validate that power quality inside the facility meets
required standards for reliability of sensitive equipment.
This includes ensuring that a facility’s power provider
is meeting contract obligations regarding power quality.
Power management systems provide a range of
capabilities to help simplify this.
Advanced power quality meters provide on-board PQ
compliance monitoring and analysis, while analytic
software aggregates PQ compliance data from across
the facility. Combined reports can be generated that help
facility teams track PQ trends and identify the source of
risks, including problems coming from outside the
facility on the utility grid. These reports can be used as
evidence when bringing issues to the power provider.
Gaining cybersecurity peace of mind: Attacks on
critical infrastructure in general have been on the rise,
with a recent survey conducted by McAfee revealing
that in “one year’s time one in four have been the
victims of cyber extortion or threatened cyber extortion;
denial of service attacks had increased from 50% to 80%
of respondents; and approximately two-thirds have
found malware designed to sabotage their systems.” [10]
CASE STUDY 7:
Shoe factory achieves LEED certification
A large shoe factory sought to achieve LEED certification using a
number of steps including installing a system to monitor and modify
the energy use of the factory.
Using distributed metering, web dashboards, and reporting tools, the
factory was able to reduce energy usage by 18%, which helped achieve LEED certification. The system also allocates costs to 11 different
sections of the factory to help measure and balance energy use.
Return on investment has been $US 5k per month in energy savings,
with a payback period of 20 months.

- 9.10 -
Just like the corporate IT network, digitized power
distribution systems are one of the critical and
vulnerable infrastructures that needs protection. Any
choice of digitized solution should adhere to
cybersecurity best practices, such as IEC 62443. These
should include security training to developers, adhering
to security regulations, conducting threat modeling and
architectural reviews, ensuring secure code practices,
and executing extensive security testing. For more
information on mitigating cyberattack risks, see the
white paper “Securing Power Monitoring and Control
Systems.” [11]
3.8 Fast Payback
Clearly, the extensive (yet, not exhaustive) list of
applications and benefits presented above make a good
case for digitizing facility electrical distribution
networks. Such an investment is extremely cost
effective, representing tangible ROI. A single solution
offers a complete network of smart devices and multiple
analytic desktop and mobile applications. The optimal
architecture can achieve many different functions with
the right mix of meters, monitors, sensors, transducers,
and software.
Once in place, the facility can expect monitoring,
alarming, and reporting tools that enable enhanced
safety and reliability, real energy and operational
savings, optimized use of the power infrastructure, and
simpler workflows. As such, a digitized power system
will optimize both CAPEX and OPEX. Though
digitization increases installation cost by 10 to 20%, it
results in significantly lower operating costs over the
long term. The increase in CAPEX is typically paid for
in less than 2 years.
Advances in technology have enabled a nominal
incremental investment in digitalization of the electrical
distribution infrastructure to reap a very large and fast
return on investment.
Also, a powerful single solution with multiple
capabilities can pave the way to the future, allowing for
new challenges to be addressed, sometimes with
unexpected additional benefits. For example, consider
how vehicle wheel speed sensors first designed for ABS
functionality also spawned traction control capabilities.
Similarly, having temperature sensors on conductors
and connections can help avoid overheating, fire, and
equipment failures. But those same sensors can also be
used to track humidity cycles which can help avoid dust
build up that can cause arcing, fires, and failures.
4. CONCLUSION
The benefits of digitization of the electrical distribution
infrastructure in critical buildings and facilities are
almost limitless. The categories of benefit are analogous
to the advances that have occurred in the automotive
industry, bringing improved safety, reliability, and
efficiency, as well as simplification in areas such as
regulatory compliance.
However, due to the aging infrastructures of facilities
such as hospitals, airports, waste water treatment plants,
etc., electrical distribution has not been keeping up with
the latest digitization technology trends. As such, most
facility teams are still working ‘in the dark’ by not
leveraging available, proven IoT-enabled power
management technology to its fullest to achieve optimal
performance. Digitization brings insight to costs and
risks that are otherwise unmanageable or unforeseen.
Fully digitized electrical distribution systems are
becoming the standard with preinstalled transducers and
sensors. Digitization occurs in three layers, from
connected products, to onsite supervisory applications,
to cloud-based analytics and advisory services that offer
support for facilities without the required skills and
resources. It is important to have digitization in mind
when designing, building, or upgrading facilities. It is
more cost-effective to have electrical distribution
equipment come already digitized from the factory;
however, digitizing existing installations will equally
result in huge benefits and savings.
The payback from digitization retrofits, or the added
cost of a completely digitized infrastructure in new
construction, can occur in many different ways. For
example, in the case of a critical facility like a data
center or hospital, avoiding a major power outage can
deliver instantaneous payback. In the case of energy-
related costs savings (e.g. optimized energy bill, energy
usage reduction) or maintenance cost savings (e.g.
predictive practices, extended equipment life), payback
is usually within 2 years. Clearly, the benefits outweigh
the costs.
REFERENCES
1. Electrical Contractor Magazine, “Fire in the
Workplace”, 2004
2. NETA World magazine, “Top Five Switchgear
Failure Causes and how to avoid them”, 2010
3. A. E. Emanuel and J. McNeill, "Electric Power
Quality”, Annual Review of Energy and the
Environment, vol. 22, pp. 263-304, December, 1997
4. Emerson Network Power, “Understanding the Cost
of Data Center Downtime”, 2011
5. Lawrence Berkeley National Laboratory, “The
National Cost of Power Interruptions to Electricity
Customers - A Revised Update”, January 2017
6. Next10, ‘Untapped Potential of Commercial
Buildings: Energy Use and Emissions’

- 9.11 -
7. Schneider Electric, “Predictive Maintenance
Strategy for Building Operations: A Better
Approach”
8. Operations & Maintenance Best Practices: A Guide
to Achieving Operational Efficiency,” Federal
Energy Management Program, U.S. Department of
Energy
9. Schneider Electric, “How To Control The Impact of
Severe Environments Surrounding Medium Voltage
Switchgear”
10. James Christopher Foreman, Dheeraj Gurugubelli,
"Cyber Attack Surface Analysis of Advanced
Metering Infrastructure", July 2016
11. Schneider Electric White Paper, “Securing Power
Monitoring and Control Systems”