electrical machinery, apparatus, and · pdf filechapter title: electrical machinery,...
TRANSCRIPT
This PDF is a selection from an out-of-print volume from the NationalBureau of Economic Research
Volume Title: Price Competitiveness in World Trade
Volume Author/Editor: Irving B. Kravis and Robert E. Lipsey
Volume Publisher: NBER
Volume ISBN: 0-870-14227-5
Volume URL: http://www.nber.org/books/krav71-1
Publication Date: 1971
Chapter Title: Electrical Machinery, Apparatus, and Appliances
Chapter Author: Irving B. Kravis, Robert E. Lipsey
Chapter URL: http://www.nber.org/chapters/c3407
Chapter pages in book: (p. 362 - 421)

13ELECTRICAL MACHINERY, APPARATUS,
AND APPLIANCES
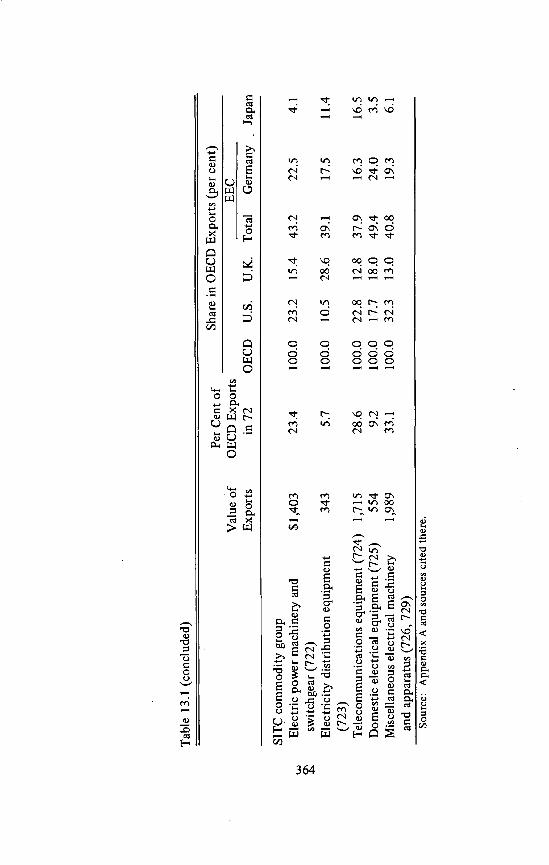
THE UNITED STATES was the leading exporter of electrical machineryand apparatus, followed by Germany, the United Kingdom, and Japan(Table 13.1). The EEC countries accounted for two-thirds of the EECmarket, while the United States dominated the Canadian, Japanese, andLatin American trade. The United Kingdom led all the other sellers bya wide margin in sales to other countries, and Japan was the major out-side source for the U.S. market. All these statements are subject to animportant reservation: More than $340 million in exports, mainly fromthe United States, were not identified by destination. These were over20 per cent of U.S. exports and more than 5 per cent of OECDexports in this division.
The major shifts in export shares in this division took place between1953 and 1961 (Table 13.2). The U.S. share was cut by fifteen per-centage points (more than a third) and the smaller U.K. share by sixpercentage points (over a quarter). The main beneficiary was Japan,whose share was less than 1 per cent in 1953 and rose to more than 7per cent in 1961. Germany's share gained by nine percentage points, anincrease of 70 per cent over its initial share of exports. France and theother EEC countries also improved their position substantially.
After 1961 the U.S. share changed little but the U.K. position con-tinued to deteriorate. Germany's share, which had risen so rapidlybefore 1961, declined in the next few years. The shares of Japan and of
Note: SITC 72. Value of OECD exports in 1963: $6,005 million; 13.5 per cent ofstudy total. Coverage: Equipment for producing and transmitting electricity, telecom-munications apparatus, domestic electrical equipment, and all other electrical machineryand appliances.

Tabl
e 13
.1O
ECD
Exp
orts
of E
lect
rical
Mac
hine
iy, A
ppar
atus
, and
App
lianc
es (S
ITC
72)
,by
Orig
in, D
estin
atio
n, a
nd C
omm
odity
Gro
up, 1
963
(dol
lars
in m
illio
ns)
Val
ue o
fPe
r Cen
t of
OEC
D E
xpor
tsSh
are
in O
ECD
Expo
rts (
per c
ent)
EEC
Expo
rtsin
72
OEC
DU
.S.
U.K
.To
tal
Ger
man
yJa
pan
Tota
l, al
l des
tinat
ions
and
gro
ups
$6,0
0510
0.0
100.
024
.814
.841
.219
.58.
6D
estin
atio
nU
.S.
397
6.6
100.
010
.622
.211
.647
.1O
ECD
Eur
ope
2,66
044
.310
0.0
13.8
10.2
61.8
30.5
2.1
U.K
.17
32.
910
0.0
33.5
45.7
17.3
2.9
EEC
tota
l1,
535
25.6
100.
013
.98.
965
.227
.81.
6G
erm
any
344
5.7
100.
015
.19.
653
.83.
5C
anad
a33
85.
610
0.0
78.1
13.0
4.4
2.4
3.0
Japa
n67
1.1
100.
070
.17.
516
.49.
0La
tin A
mer
ica
490
8.2
100.
040
.87.
830
.212
.210
.6O
ther
1,70
828
.510
0.0
15.9
28.8
33.4
14.1
12.5
Una
ccou
nted
for b
y de
stin
atio
n34
45.
710
0.0
100.
0
(con
tinue
d)
Tabl
e 13
.1 (c
oncl
uded
)
Val
ue o
fPe
r Cen
t of
OEC
D E
xpor
tsSh
are
in O
ECD
Expo
rts (
per c
ent)
EEC
Expo
rtsin
72
OEC
DU
.S.
U.K
.To
tal
Ger
man
yJa
pan
S1TC
com
mod
ity g
roup
Elec
tric
pow
er m
achi
nery
and
$1,4
0323
.410
0.0
23.2
15.4
43.2
22.5
4.1
switc
hgea
r (72
2)El
ectri
city
dis
tribu
tion
equi
pmen
t34
35.
710
0.0
10.5
28.6
39.1
17.5
11.4
(723
)Te
leco
mm
unic
atio
ns e
quip
men
t (72
4)1,
715
28.6
100.
022
.812
.837
.916
.316
.5D
omes
tic e
lect
rical
equ
ipm
ent (
725)
554
9.2
100.
017
.718
.049
.424
.03.
5M
isce
llane
ous e
lect
rical
mac
hine
ry1,
989
33.1
100.
032
.313
.040
.819
.36.
1an
d ap
para
tus (
726,
729
)So
urce
: App
endi
x A
and
sour
ces c
ited
ther
e.

Electrical• Machinery 365
Table 13.2OECD Exports of Electrical Machinery, Apparatus, and Appliances,
1953, 1957, 1961—64(dollars in millions)
Value ofOECD Exports
Share in OECD Exports (per cent)
OECD U.S.EEC
U.K. Total Germany Japan
INCLU DING SWITZERLAND AND SPAIN1964 $6,836 100.0 24.4 12.9 42.6 19.2 9.31963 6,005 100.0 24.9 14.8 41.2 19.5 8.61962 5,312 100.0 25.6 15.1 40.7 20.4 8.1
1961 4,748 100.0 24.9 16.0 41.8 21.5 7.1
1961 4,599EXCLUDING
100.0 25.7SWITZERLAND AND SPAIN16.5 43.2 22.2 7.4
1957 3,063 100.0 32.8 20.8 37.5 21.0 2.51953 2,112 100.0 40.4 22.8 29.5 13.1 0.7
Source: Appendix B.
EEC countries outside of Germany and France also increased between1961 and 1964.
The rapid growth in Japan's exports before 1961 was associated witha great increase in Japanese price competitiveness, at least during 1957—61, and the continued gains after that matched a favorable relative pricemovement until 1963 (Table 13.3). During 1953—57, export shares ofthe United States and the United Kingdom and their price competitive-ness declined. After that, U.S. price performance improved steadily butits export share continued to fall until 1961.
Price increases in this division were smaller than in most others cov-ered by the study. Japanese prices in 1964 were far lower than in thefirst year shown, and U.S. prices ended somewhat below the initial level.Only the United Kingdom had a price increase of over 5 per cent.
The U.S. price position in SITC 72 was relatively favorable at theend of the period, as compared with that in other products. Even theJapanese price level was only 10 per cent lower. German prices wereslightly below those of the United States, and British prices were higher.

366 Product Reports
Table 13.3International Prices, Price Competitiveness, and Price Levels, Electrical
Machinery, Apparatus, and Appliances, 1953, 1957, 1961—64
1953 1957 1961 1962 1963 1964
INTERNATIONAL PRICE INDEXES (1962 = 100)U.s. 102 108 104 100 97 97U.K. 96 98 103 100 101 101
EEC 98 100 102 100 100 99
Germany 96 98 101 100 99 98Japan NA 124 106 100 97 99
INDEXES OF U.S. PRICE COMPETITIVENESS(1962 = 100)
Relative to
U.K. 94 91 .. 99 100 105 .103
EEC 96 92 97 100 103 101
Germany 94 91 97 100 102 1,01
Japan NA 115 102 100 100 102
INTERNATIONAL PRICE LEVELS (U.S. FOR EACH YEAR = 100)U.s. 100 100 100 100.. 100 100
U.K. 97 94 102 103 108 .106
EEC 90 86 91 94 97 95Germany 90 87 93 96 98 97
Japan NA 103 91 89 90 91
Source: International price indexes from Appendix C; price competitiveness indexes,Appendix D; price levels, Appendix E.
In the following sections four specific groups in the electrical machinery
division—electric power machinery and switchgear, electricity distribu-tion equipment, telecommunications equipment, and domestic electricalequipment—are discussed in detail. These groups account for over $4billion in OECD exports, more than two-thirds of the total for thedivision. The most important group not covered is miscellaneous elec-trical machinery and apparatus (SITC 729), which is a collection ofheterogeneous subgroups not appropriately treated as one group.

Electrical Machinery 367
Electric Power Machinery and Switchgear1
TradeIn 1963, the United States was the leading exporter of electric power
machinery and switchgear (SITC 722) by a narrow margin over Ger-many, and the United Kingdom ranked third, a considerable distancebehind (Table 13.4). Germany was the dominant exporter to Europe,but the United States exported almost twice as much or more to theother areas shown in the table. Among the countries not listed separately,France was a major exporter, along with Sweden and Switzerland.
The two large subgroups which make up this group are electric powermachinery (57 per cent), in which the United States was the largestexporter, and switchgear (43 per cent), in which Germany was moreimportant. For the United States and the United Kingdom it is possibleto break the electric power machinery down into its main components.Generators were the largest item, and the one in which the U.S. leadwas greatest. Electric motors were the next most important in both theUnited States and the United Kingdom, followed by transformers, inwhich the United Kingdom had a. slight lead as an exporter.
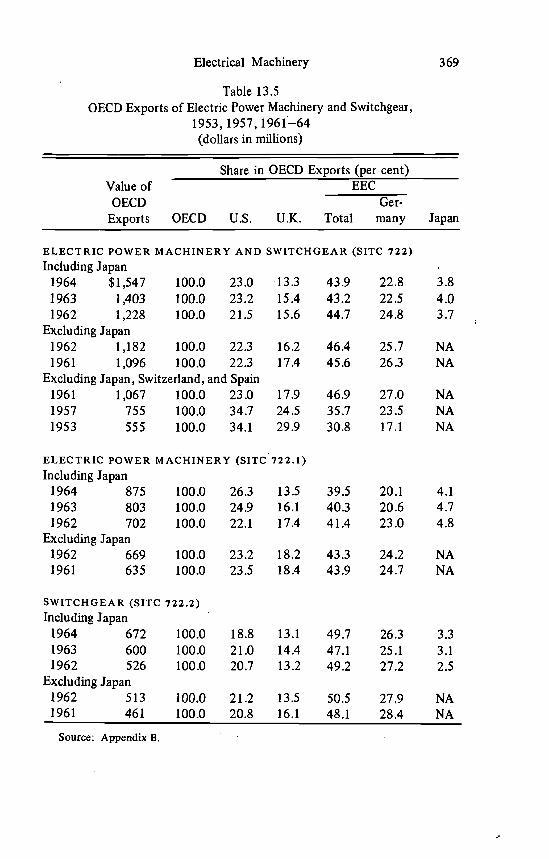
The U.S. share of OECD exports of electric power machinery andswitchgear fell sharply between 1957 and 1961 but then remainedstable and even increased slightly (Table 13.5). The share of the UnitedKingdom, on the other hand, fell steadily—from 30 per cent in 1953,which was close to the U.S. share, to less than 15 per cent at the endof the period. The EEC countries as a whole, and Germany in particular,made rapid gains between 1953 and 1961, but after that the Germanshare fell back and France's remained approximately constant. Otherlarge increases, amounting almost to a tripling of their share between1953 and 1962, were made by other OECD countries, particularlySweden.
Within the electric power machinery subgroup, the United States hasbeen a leader in the movement toward larger units and has tended to bean exporter at the upper end of the size scale for generators and trans-formers. It has also led in the development of atomic power generating
1 SITC 722. Value of OECD exports in 1963: $1.4 billion; 3.1 per cent of study total.Coverage: Generators, transformers, electric motors, circuit breakers and other appa-ratus for making, breaking, or protecting electrical circuits.

Tabl
e 13
.4O
ECD
Exp
orts
of E
lect
ric P
ower
Mac
hine
ry a
nd S
witc
hgea
r (SI
TC .7
22)
by O
rigin
, Des
tinat
ion,
and
Com
mod
ity S
ubgr
oup,
196
3(d
olla
rs in
mill
ions
)
Val
ue o
fEx
ports
Per C
ent o
fO
ECD
Exp
orts
in 7
22
Shar
e in
OEC
D'E
xpor
ts (p
er c
ent)
OEC
DU
.S.
U.K
.EE
CTo
tal
Ger
man
yJa
pan
Tota
l, al
l des
tinat
ions
and
subg
roup
s$1
,403
100.
010
0.0
23.2
15.4
43.2
22.5
4.1
Des
tinat
ion
U.S
.31
2.2
100.
019
.419
.412
.922
.6O
ECD
Eur
ope
584
40.8
100.
013
.26.
063
.037
.80.
3U
.K.
282.
010
0.0
25.0
50.0
25.0
a
EEC
tota
l32
923
.410
0.0
12.8
4.2
67.2
35.6
0.3
Ger
man
y62
4.4
100.
011
.33.
251
.6a
Can
ada
654.
610
0.0
81.5
12.3
3.1
1.5
a
Japa
n19
1.4
100.
073
.75.
310
.510
.5La
tin A
mer
ica
171
12.2
100.
039
.88.
832
.29.
98.
2O
ther
531
.38
.710
0.0
21.5
28.2
32.2
13.6
6.3
Una
ccou
nted
for b
y de
stin
atio
n2
0.1
100.
010
0.0
SITC
com
mod
ity su
bgro
upEl
ectri
c po
wer
mac
hine
ry80
357
.210
0.0
24.9
16.1
40.2
20.7
4.7
(SIT
C 7
22.1
).S
witc
hgea
r(SI
TC 7
22.2
)60
042
.810
0.0
21.0
14.5
47.0
25.0
3.2
Sour
ce: A
ppen
dix
A a
nd so
urce
s cite
d th
ere
aLes
s tha
n 0.
05 p
er c
ent.
00
Electrical Machinery 369
Table 13.5OECD Exports of Electric Power Machinery and Switchgear,
1953, 1957, 1961—64(dollars in millions)
Value ofOECD
Share in OECD Exports (per cent)EEC
Ger-Exports OECD U.S. U.K. Total many Japan
ELECTRIC POWER MACHINERY AND SWITCHGEAR (SITC 722)Including Japan
1964 $1,547 100.0 23.0 13.3 43.9 22.8 3.8
1963 1,403 100.0 23.2 15.4 43.2 22.5 4.0
1962 1,228 100.0 21.5 15.6 44.7 24.8 3.7Excluding Japan
1962 1,182 100.0 22.3 16.2 46.4 25.7 NA1961 1,096 100.0 22.3 17.4 45.6 26.3 NA
Excluding Japan, Switzerland, and Spain1961 1,067 100.0 23.0 17.9 46.9 27.0 NA1957 755 100.0 34.7 24.5 35.7 23.5 NA1953 555 100.0 34.1 29.9 30.8 17.1 NA
ELECTRIC POWER MACHINERY (SITC 722.1)Including Japan
1964 875 100.0 26.3 13.5 39.5 20.1 4.1
1963 803 100.0 24.9 16.1 40.3 20.6 4.71962 702 100.0 22.1 17.4 41.4 23.0 4.8
Excluding Japan1962 669 100.0 23.2 18.2 43.3 24.2 NA1961 635 100.0 23.5 18.4 43.9 24.7 NA
SWITCHGEAR (SITC 722.2)Including Japan
1964 672 100.0 18.8 13.1 49.7 26.3 3.31963 600 100.0 21.0 14.4 47.1 25.1 3.11962 526 100.0 20.7 13.2 49.2 27.2 2.5
Excluding Japan1962 513 100.0 21.2 13.5 50.5 27.9 NA1961 461 100.0 20.8 16.1 48.1 28.4 NA
Source: Appendix B.

370 Product Reports
systems. Bids on these are not included in our indexes, however, partlybecause most of the development came after the period covered by thestudy. Although the United Kingdom was a leader in the earlier develop-ment of atomic power, it later fell behind, particularly when U.S. com-panies, anticipating the gains from the larger scale of production of com-ponents, cut prices in 1963 and after. In early 1967 it was reportedthat the United Kingdom had received no export orders for nuclearplants for several years; France received its first export order in 1966.The American companies had, in the meantime, won a substantial num-ber of contracts for atomic power generating stations in several dillerentforeign countries. The success of U.S. companies in bidding does notnecessarily imply that the full amount of the bid was purchased in theUnited States, because some foreign purchasers insisted on producing asmany of the components as they could, even at the expense of raisingthe cost considerably by foregoing the economies of scale available inU.S. component production.2
Sweden's technological leadership in high-voltage direct current trans-mission systems was responsible for some of its successes in the AmeEicanand Canadian markets after 1964, and probably accounted for some ofthe increases in its share of exports in this group before that date.8
Nonprice Influences on TradeTrade in heavy electrical equipment of the type bought mainly by
utilities, such as large generators, transformers, and circuit breakers, isboth restricted and promoted by governmental actions, and has beeninfluenced also by various private arrangements among companies within
2 "The Atomic Flood-Tide," Economist, September 24, 1966; "GE to Publish Prices ofAtomic Power Plants up to Million Kilowatts," Wall Street Journal, February 28, 1964;"Atomic Power: Wide of Target," Economist, May 6, 1967; "Atomic Power: Bargainand Barter," ibid., October 22, 1966; "GE Plant in Japan," Wall Street Journal, Decem-ber 12, 1963; "Westinghouse to Build Swiss Atomic Plant," ibid., July 19, 1965; "U.S.Firms Seek to Win Atomic Power Order," Journal of Commerce, April 11, 1966;"Spain Will Get Its Second Nuclear Power Plant; GE Shares in $61-million Contract,"Business Week, May 14, 1966; "GE Wins Contract: Swiss Opt for Nuclear Power,"Journal of Commerce, September 9, 1966; "Atomic Push Abroad: Growing WorldMarket in Nuclear Power Field Attracts U.S. Firms," Wall Street Journal, September13, 1966; "Atomic Energy: Bidding," Economist, September 10, 1966.
3 "Swedish Electrical Producer Spreads Its Production and World Facilities," Journalof Commerce, February 19, 1964; "Swedish Firm Has High Hopes for System of Long-Distance Transmission of Power," Wall Street Journal, June 11, 1964; "Swedish Pro-ducer Receives Electric Transmission Order," New York Times, January 31, 1965; "GEWins Order in Power Project," ibid., May 1, 1965; "GE, Swedish Firm Get $52 Mil-lion in Pacts for Two Terminals on Pacific Power Intertie," Wall Street Journal,. May 3,1965; "Swedish Electrical Firm Seeks U.S. Sales," Journal of Commerce, May 24, 1965;"Power Lines Get Higher Voltage," New York Times, July 4, 1965.
Electrical Machinery 371
and among different countries. In many countries the production anddistribution of electricity are governmental functions, and the electricityauthorities consider themselves obliged to purchase their equipment fromdomestic producers without inviting offers from foreign firms.4 Therelation of government enterprises to foreign suppliers was the oppositein the United States. Privately owned utilities, far more important thangovernment-owned ones, were reluctant to purchase abroad, and theratio of imports to domestic output was very low.5 However, govern-ment-owned authorities, both federal and local, took the lead in encourag-ing foreign producers to enter bids and at times purchased substantialfractions—as much as a quarter or a third—of some types of equipmentfrom overseas despite "buy-American" differentials of 6 per cent ormore (up to 50 per cent for the Defense Department) •6
Governmental actions affecting trade in electric power and relatedmachinery are n'ot confined to imports but include also the encourage-ment of exports through tied loans. Some international aid is not tied,particularly loans by the IBRD and IDA, which lent almost $3 billionfor electric power projects during 195 Total exports of electricpower machinery and switchgear by OECD countries during these yearscame to over $10 billion.
Most U.S. government loans under the Agency for InternationalDevelopment (AID) have been tied in recent years and Export-ImportBank loans have always been tied to procurement in the United States.
4 Imports of electric power and related equipment were about 2 per cent of homeconsumption in the United Kingdom in 1951 (Report on the Supply and Exports ofElectrical and Allied Machinery and Plant, Monopolies and Restrictive Practices Com-mission, London, 1957, p. 337). The Central Electricity Authority considered any at-tempt ". . . to stimulate competition and obtain a check on price levels . . . by import-ing . . . impracticable for political reasons" (ibid., pp. 222—223). In 1961, however,the Central Electricity Generating Board, which had previously purchased only thoseforeign products not available at home, did buy transformers from Canada ("Electric-ity: Buying Abroad," Economist, November 18, 1961).
s U.S. imports of motors, generators, and transformers in the early 1960s were about1 per cent of the new supply, that is, output plus imports (U.S. Commodity Exportsand imports as Related to Output, 1964 and 1963, U.S. Bureau of the Census, SeriesES 2, No. 7, 1966). After 1964 the attitudes of private utilities showed signs of change.The most notable of these was a purchase of turbine generators, in 1967, but that wasoniy one of a number of recent private orders ("American Electric Buys 2 Turbinesfrom Swiss Firm," Wall Street Journal, Dec. 12, 1967; "Switzerland's New Peak,"Economist, Dec. 16, 1967; "Edison Buys Huge Turbine Generator," Journal of Com-merce, Aug. 31, 1967; "AEI Awarded Contract for Generators," ibid., Jan. 18, 1968;"Utilities Looking Abroad for Quality," New York Times, March 2, 1969).
6 "Electrifying Surrender," Economist, December 10, 1960; "English Electric PushesExport Drive," Journal of Commerce, August 4, 1965.
Annual Report, International Bank for Reconstruction and Development and Inter-national Development Association, 1952—53 and 1964—65.

372 Product Reports
These two agencies lent over $1.25 billion on projects related to electricpower during the decade of this study, of which only about $200 millionwas in AID loans before the period when they were tied to purchasesin the United States.8 Other countries have frequently insisted on tyingtheir aid loans and grants, and these measures have influenced the direc-tion of trade in this commodity group.
In addition to governmental restriction and encouragement of export-ing there have been, at times at least, private agreements which allocatedmarkets, often as part of licensing arrangements. The British report,cited earlier, mentions two agreements on generators, one . . a tech-nical aid agreement with an associated foreign company. . . . Eachparty also agrees not to supply in the other's specified exclusive territorywithout the other's consent"; and the second ". . . an agreement betweena United Kingdom manufacturer and a foreign manufacturer under whichthe British company receives the right to the use of certain designs, testand manufacturing data . . . and undertakes . . . not to exportmachinery of the types concerned without the foreign manufacturer'sconsent. . ."
The antitrust cases against the U.S. electrical equipment manufactur-ers did not involve prices charged to foreign buyers; and we do notknow, therefore, whether the collusion among the U.S. companiesextended to foreign sales (see the appendix to this chapter). The steepdrop in export prices after 1957, parallel to that in domestic sales,suggests that similar agreements might have been keeping export pricesartificially high. The high prices and the decline are particularly notablebecause our indexes exclude prices under tied aid, which we might haveexpected to be, most strongly affected by collusion among domesticcompanies.
Price CompetitivenessThe price competitiveness of the United States in electric power
machinery and switchgear rose through most of the period from 19578 Over $830 million in Eximbank credits were extended for electric power projects
(not all for equipment in this group) during fiscal 1957—64 (Report to the Congress,Export-Import Bank of Washington, various years), and over $530 million in AIDprocurement expenditures for electrical apparatus in fiscal 1956—65, of which about $360million were disbursed during fiscal 1962—65 (Operations Report, ICA and AID, variousissues). The proportion procured in the United States doubled after 1962, from 36 percent in fiscal 195.6—61 to 76 per cent in 1962—65.
9 Report on the Supply and Exports of Electrical and Allied Machinery and Plant,p. 104.

Electrical Machinery 373
Table 13.6U.S. Price Competitiveness, Electric Power Machinery and Switchgear,
1957, 1961—64(1962= 100)
1957 1961 1962 1963 1964
ELECTRIC POWER MACHINERY AND SWITCHGEAR (SITC 722)Relative to
U.K. 84 102 100 110 107EEC 86 96 100 105 105
Germany 82 94 100 104 106
Japan NA 97 100 102 113
ELECTRIC POWER MACHINERY (SITC 722.1)Relative to
U.K. 75 91 100 109 101EEC 81 92 100 108 109
Germany 76 90 100 105 111
Japan NA 100 100 106 128
Sweden NA 82 100 102 87
Switzerland 72 91 .100 112 104
SWITCHGEAR (SITC 722.2)Relative to
EEC NA 101 100 101 100Germany NA 101 100 101 100
Source: Appendix D.
through 1964 (Table 13.6). Foreign prices, in other words, increased
relative to U.S. prices, and the highest levels of U.S. price competitive-ness were reached in 1963 or 1964.
The improvement in U.S. price competitiveness through 1963 is evenstronger in the major subgroup, electric power machinery. The data hereare more reliable, and some additional countries could be included inthe comparison. The number of reversals in direction in 1964 is alsogreater, and the declines in U.S. price competitiveness were sharperthan in the group as a whole. Sweden showed the outstanding gain thatyear, almost back to the 1961 level relative to the United States. With

374 Product Reports
this one exception, however, the peak in the U.S. position relative toeach country was in 1963 or 1964, as it was for the whole group.
Only fragmentary data, insufficient for the calculation of indexes, areavailable before 1957. The best series, that for the U.K., shows a verylarge decline in U.S. price competitiveness between 1953 and 1957.
The indexes of price competitiveness for electric power machinery andswitchgear, unlike most of the others in this study, have been calculatedmainly from place-to-place price comparisons for contract bids on largeinstallations. Price competitiveness measured from place-to-place datatends to be more volatile than that from the time series data used inmost other commodity groups; consequently, the year-to-year fluctuationsmay not be very significant. The trends, however, seem unmistakabledespite the wide fluctuations.
The gains in U.S. price competitiveness after 1957 are partly due tothe high U.S. price level in that year, as we point out below, in the dis-cussion of international price indexes. The sharp declines in U.S. domes-tic prices are frequently attributed to governmental attacks on collusivebidding practices within the United States, culminating in the Philadel-phia indictments against twenty-nine electrical equipment manufacturersin July 1960 and, their pleas of guilty or no contest in December ofthat year.'° Reductions in prices offered to foreign countries apparentlyreflect the collapse of those domestic price arrangements. The large gainsin U.S. price competitiveness after 1957 were exceptional among thecommodity groups covered in thô study.
It is difficult to compare movements in price competitiveness withchanges in export shares for this group because the lag between orderand delivery is so long for at least the major equipment. The U.S.export share did not decline between 1953 and 1957, when, we believe,U.S. price competitiveness greatly deteriorated. However, the U.S. sharefell sharply from 1957 to 1961, perhaps in consequence of the earlierhigh prices exemplified by those of 1957, the effects of which may wellhave been felt in most of the 1961 deliveries. After 1962 U.S. andSwedish shares rose a little and U.K. and EEC shares declined, move-ments which appear consistent with changes in prices.
The price movements, as we have mentioned, were both sharper andmore reliably measured for electric power machinery alone, but the exportdata are unfortunately available only back to 1961. In this period, how-
10 See discussion in chapter appendix, below.

Electrical Machinery 375
ever, the gains in U.S. and Swedish exports were much more markedthan for the group as a whole, and U.K. and German shares clearlydeclined, as one would expect from the changes in price competitiveness.EEC countries other than Germany, with a more favorable price record,also increased their export shares, and the Japanese decline in pricecompetitiveness was matched by a decline in exports relative to othercountries. Thus, in the electric power machinery subgroup at least, thedegree of consistency between price movements and export shares wassubstantial.
Since changes in international price competitiveness are often inferredfrom comparisons of wholesale price series, in the absence of interna-tional price data, we compared the indexes so derived, as given in Appen-dix F, with our indexes. Some of the differences between the twomeasures are quite large, particularly in electric power machinery (SITC722.1). Both indexes for Germany in that subgroup show an improve-ment in U.S. price competitiveness from 1961 to 1962, but the indexfrom wholesale prices shows little gain after that, while the NBERindexes show an improvement of more than 10 per cent. toJapan, the wholesale price data suggest only a small gain in U.S. pricecompetitiveness in 1964; the NBER indexes, a very large one. On thewhole, if the NBER data are correct, the wholesale price series seriouslyunderstate the gains in U.S. price competitiveness in this group in thelater years. -
Price LevelsMost countries' prices of electric power machinery and switchgear
were close to the U.S. price level In 1964, after a long period ofimprovement in U.S. price competitiveness (Table 13.7). The U.S.price level was lowest in switchgear, but in the more important electricpower machinery subgroup, its level was higher than that of all but theUnited Kingdom.
From the point of view of U.S. competitiveness, the earliest pricerelationships, for 1957, were the most unfavorable. For the total group,European prices were more than 20 per cent lower than U.S. prices,and for. electric power machinery the foreign price levels ranged between25 and 40 per cent lower.
We have not shown separate price level indexes by type of machinerywithin electric power machinery, but the data indicate that for the United

376 Product Reports
Table 13.7Price Levels, Electric Power Machinery and Switchgear, 1957, 1961—64
(U.S. for each year = 100)
1957 1961 1962 1963 1964
ELECTRIC POWER MACHINERY AND SWITCHGEAR (SITC 722)U.S. 100 100 100 100 100
U.K. 79 96 94 103 101
EEC 77 86 90 94 94
Germany 79 90 95 99 101
Japan NA 85 88 90 99
ELECTRIC POWER MACHINERY (SITC 722.1)U.S. 100 100 100 100 100
U.K. 74 90 99 108 100EEC 64 73 79 85 86Germany 60 71 79 83 87
Japan NA 73 73 77 93Sweden NA 67 82 83 71Switzerland 59 76 83 93 87
SWITCHGEAR (SITC 722.2)U.S. NA 100 100 100 100
U.K. NA NA NA NA 102
EEC NA 106 105 106 105
Germany NA 118 117 119 117
Japan NA NA NA NA 101
Source: Appendix E and the appendix to this chapter.
Kingdom, prices of electric motors were lower relative to the U.S. levelthan prices of generators and transformers. Among the latter two groupsU.K. offers were quite commonly above those from U.S. companies in1962 and 1963, on jobs both inside and outside the United States.
The German relationship was in the opposite direction. Generatorsand transformers were priced considerably lower, relative to the UnitedStates, than electric motors. For other EEC countries, and for Swedenand Switzerland, the data are insufficient to permit this comparison.
Among the transformers and generators the U.S. price level was par-

Electrical Machinery 377
ticularly high relative to Germany, Sweden, and Switzerland on instru-ment transformers. Foreign offers that were a third below or even half ofU.S. bids were not uncommon. Between generators and power trans-formers the relationship was not so regular, but the U.S. position in thelast year was at least slightly more favorable for generators. Most of theforeign countries were offering bids on generators in 1964 that wereabove the corresponding U.S. bids.
These price level indexes are based mainly on comparisons of bids.For some of the bids, data were available on quality differences amongthe individual offers, usually in the form of adjustments, calculated bythe purchaser, to take account of differences in efficiency. The basisfor the purchase decision was the offer price adjusted for quality dif-ferences. In cases where the number of adjusted bid prices was ade-quate, only these were used to calculate the price level indexes. Thequality-adjusted data were used for most generator and transformerprice level indexes other than those for the United Kingdom.
It has been said that U.S. electrical equipment is superior to foreignmakes and that published comparisons for equipment of specific sizesor capacity are often biased against the United States on this account.To test whether such biases might have affected place-to-place com-parisons from non-quality-adjusted bids we compared place-to-placeindexes from adjusted and unadjusted data. The results did not sug-gest very large or consistent relationships between the two sets of in-dexes, but on the whole the adjusted indexes were more favorable tothe United States than the unadjusted onçs through 1962 and lessfavorable after that. A defect of these comparisons is that the unad-justed data included many bids not covered by the adjusted data andthe price relationships may thus have been affected by the character-istics of the items not in both samples. For part of the collection com-parisons were made between adjusted and unadjusted prices on identicalbids from 1961 through 1964. The price level indexes for adjusteddata in 11 of 12 cases fell within 10 per cent of those from unadjusteddata, the one exception being a price level estimate for Japan which wasmore than 20 per cent higher relative to the United States in the ad-justed data. However, eight of the twelve adjusted indexes were lessfavorable to the United States than the corresponding unadjusted ones.From these tests we infer that quality differences are not uniformly
378 Product Reports
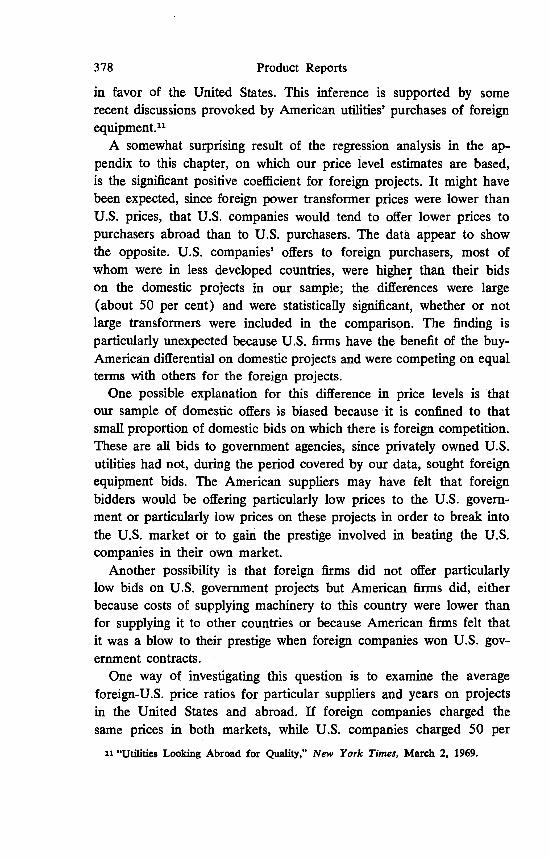
in favor of the United States. This inference is supported by somerecent discussions provoked by American utilities' purchases of foreignequipment.1'
A somewhat surprising result of the regression analysis in the ap-pendix to this chapter, on which our price level estimates are based,is the significant positive coefficient for foreign projects. It might havebeen expected, since foreign power transformer prices were lower thanU.S. prices, that U.S. companies would tend to offer lower prices topurchasers abroad than to U.S. purchasers. The data appear to showthe opposite. U.S. companies' offers to foreign purchasers, most ofwhom were in less developed countries, were higher than their bidson the domestic projects in our sample; the differences were large(about 50 per cent) and were statistically significant, whether or notlarge transformers were included in the comparison. The finding isparticularly unexpected because U.S. firms have the benefit of the buy-American differential on domestic projects and were competing on equalterms with others for the foreign projects.
One possible explanation for this difference in price levels is 'thatour sample of domestic offers is biased because it is confined to thatsmall proportion of domestic bids on which there is foreign competition.These are all bids to government agencies, since privately owned U.S.utilities had not, during the period covered by our data, sought foreignequipment bids. The American suppliers may have felt that foreignbidders would be offering particularly low prices to the U.S. govern-ment or particularly low prices on these projects in order to break intothe U.S. market or to gain the prestige involved in beating the U.S.companies in their own market.
Another possibility is that foreign firms did not offer particularlylow bids on U.S. government projects but American firms did, eitherbecause costs of supplying machinery to this country were lower thanfor supplying it to other countries or because American firms felt thatit was a blow to their prestige when foreign companies won U.S. gov-ernment contracts.
One way of investigating this question is to examine the averageforeign-U.S. price ratios for particular suppliers and years on projectsin the United States and abroad. If foreign companies charged thesame prices in both markets, while U.S. companies charged 50 per
ii "Utilities Looking Abroad for Quality," New York Times, March 2, 1969.

Electrical Machinery 379
cent more abroad, the foreign-U.S. price ratios on U.S. governmentprojects would be 50 per cent higher than on foreign contracts. Ifforeign companies maintained the same price differentials as U.S. com-panies, foreign and U.S. projects would show the same ratios.
Our data are too thin to give an authoritative answer to this ques-tion. What evidence there is suggests it is unusual for foreign-U.S. priceratios to be as much as 50 per cent higher on foreign than on U.S.projects and, therefore, that both foreign and U.S. companies chargedmore outside the United States. U.K. companies seemed to be sellingabroad at levels more than 50 per cent higher than those charged tothe United States, while suppliers in other countries offered prices abroadthat were higher than their prices to the United States but not by the50 per cent margin.
Price TrendsIn most of the other commodity groups included in this study, in-
ternational price indexes from time-to-time price comparisons are themost reliable source of information on relative price changes. In thisgroup, because most of the products, with electric motors the chiefexception, are made to order for specific contracts, it is almost im-possible to collect transactions prices for an identical product at twodifferent times.
The international price indexes shown in Table 13.8 are, for thisreason, less reliable relative to the other types of indexes than thosefor most other commodity groups in the study. The U.S. indexes arebased on the regression analysis described in the appendix to this chap-ter for electric power machinery other than motors, and on the usualtype of time-to-time price data for electric motors and switchgear. TheGerman indexes for switchgear are calculated from price competitivenessindexes based on time series data, but the German indexes for electricpower machinery and all those for the other countries listed are esti-mated from indexes of price competitiveness based on place-to-placedata. This procedure entails the drawback of multiplying the errors ofthe two types of indexes, a drawback that is the more serious becauseboth are derived from the rather volatile prices offered in bidding onlarge projects.
For electric power machinery other than motors our U.S. index isbased on a regression, for power transformers, of price on capacity

380 Product Reports
Table 13.8International Prices, Electric Power Machinery and Switchgear,
1953, 1957, 1961—64(1962= 100)
1953 1957 1961 1962 1963 1964
ELECTRIC POWER MACHINERY AND SWITCHGEAR (SITC 722)U.S. NA 124 110 100 94 94
EEC NA 107 105 100 99 99
Germany NA 102 104 100 97 100
Japan NA NA 106 100 96 106
ELECTRIC POWER MACHINERY (SITC 722.1)U.S. 132 154 120 100 91 91
U.K. NA 116 110 100 100 92
EEC NA 125 111 100 98 99
Germany NA 117 108 100 96 100
SWITCHGEAR (SITC 722.2) .
U.S. NA NA 99 100 98 99Germany 88 90 100 100 99 99
Source: Appendix C.
(kilovolt-amperes, KVA, or millivolt-amperes, MVA), year,market to which sold (United States vs. rest of the world). As is ex-plained in the appendix to this chapter, it would have been desirable toinclude several more specifications, but the data did not containenough information. This international price index was compared withdomestic price indexes which, also, were constructed so as to take ac-count of the widespread discounts from list price that prevailed in someyears; and the results confirmed the correctness of at least the majorprice trends revealed by the regression analysis.
The U.S. international price index for the group as a whole showsa steep decline from 1957 through 1963, clearly accounted for by theelectric power machinery subgroup, in which the fall was approxi-mately 40 per cent, one of the largest declines among machinery items.Only for the United States do we have an estimate of the price changebefore 1957, and that suggests a substantial rise during that period butnot an unusually large one for machinery.

Electrical Machinery 381
As we pointed out earlier, the fall in U.S. prices after 1957 was froma high level relative to other countries. The decline was precipitatedby a number of events, including outbreaks of competition on someproducts, the indictments of the electrical equipment manufacturers in1960, and technological developments in the production of electricpower equipment, and was influenced also by the increase in the sizeof individual units of equipment.
Prices of electric power machinery in other countries also declinedbetween 1957 and 1963, although none as far as in the United States.But in these countries, as in the United States, the fall in price wasparticularly rapid between 1961 and 1962, which was not, in general,a period of declining price levels.
In 1964 U.S. prices remained unchanged and prices in several othercountries increased for the first time since 1957. In the United Kingdom,however, and particularly in Sweden, the price decline continued; theindicated fall in Swedish prices for 1961 through 1964, not shown inthe table, was at least as large as that in any other country. These inter-national price indexes differ widely from other price measures. An in-dex taken from official Japanese export price data, for example, showsalmost no change in electric power machinery prices from 1961 through1964, while our indexes for Japan and for all other countries showedsubstantial declines.
Two comparisons with U.S. wholesale price indexes gave contrastingresults. For switchgear, both the international and the wholesale priceindex were quite stable from 1961 through 1964, but in electric powermachinery the wholesale index, although it declined from 1957 through1964, as few machinery prices did, fell much less than our interna-tional index. The difference in movement was apparently due to thefailure of the wholesale price index to take account of extensive dis-counting from list prices in both domestic and foreign markets ratherthan from any major differences between domestic and export pricemovements (see the appendix to this chapter).
Electric power equipment is represented in the official export unitvalue index of the U.S. Department of Commerce by only three serieson electric motors and generating sets. The export price movement im-plied by these series is in direct contradiction to that shown by theNBER index. The unit value series show price increases in every periodexcept for 1964, cumulating to a total increase of about 40 per cent.The NBER index, on the other hand, shows a 30 per cent fall in U.S.

382 Product Reports
international prices over the same period. Given our knowledge abouteven list prices in the United States and the extent of discounting fromlist prices in the 1960s it seems fair to say that the unit value data in thissubgroup seriously misrepresent the price trends.
Electricity Distribution Equipment 12
Trade
In 1963, the United Kingdom was by far the leading exporter in thegroup as a whole and in the major subgroup (Table 13.9). Germanyfollowed, and then Japan and the United States. More than two-thirdsof the exports went to countries outside the OECD; and the proportionshipped to these, mainly less developed, countries by the United King-dom and Japan was particularly high. Only Germany exported mainlyto other developed countries. Japan was the leading exporter of insulat-ing equipment (SITC 723.2), with a wide lead over the United States,the United Kingdom, and Germany, which were all at about the sameexport level.
The products involved in this group are very different from most ofthose in the electric power machinery group (SITC 722). Both cableand insulators are relatively standardized items made to a single speci-fication in large quantities, while much of the power equipment is pro-duced to order, with each piece of equipment somewhat different fromthe previous order. Also, a greater degree of technological change tookplace in power equipment than in cable and insulators. The lower rateof technological change may partly explain the unusually small impor-tance of the United States as an exporter.
The shares of the United States and the United Kingdom in OECDexports did not change very greatly in the four years for which we havedata (Table 13.10). The major shifts were the growth in Japaneseexports, almost doubling between 1962 and 1964, and declines in the
share, applying to both Germany and other EEC countries, par-ticularly the latter. The shift in export .shares from the EEC countriesto Japan was even stronger in the main subgroup, insulated wire andcable, than in the group as a whole.
12 SITC 723. Value of OECD exports in 1963: $343 million; three-fourths of 1 percent of study total. Coverage: Insulated wire and cable (80 per cent); electrical insulat-ing equipment.

Tabl
e 13
.9O
ECD
Exp
orts
of E
lect
ricity
Dis
tribu
tion
Equi
pmen
t (SI
TC 7
23),
by O
rigin
, Des
tinat
ion,
and
Com
mod
ity S
ubgr
oup,
196
3(d
olla
rs in
mill
ions
)
00
Val
ue o
fPe
r Cen
t of
OEC
D E
xpor
tsSh
are
in O
ECD
Expo
rts(p
er c
ent)
EEC
Expo
rtsin
723
OEC
DU
.S.
U.K
.To
tal
Ger
man
yJa
pan
Tota
l, al
l des
tinat
ions
and
subg
roup
s$3
4310
0.0
100.
010
.528
.639
.117
.511
.4D
estin
atio
nU
.S.
175.
010
0.0
41.2
17.6
17.6
17.6
OEC
D E
urop
e97
28.3
100.
09.
311
.364
.937
.12.
1U
.K.
51.
410
0.0
60.0
20.0
20.0
EEC
tota
l50
14.6
100.
04.
08.
074
.038
.02.
0G
erm
any
133.
810
0.0
7.7
15.4
53.8
2.2
Can
ada
164.
710
0.0
37.5
56.2
0.6
a6.
2Ja
pan
10.
310
0.0
60.0
40.0
aa
Latin
Am
eric
a21
6.1
100.
028
.69.
538
.114
.314
.3O
ther
185
53.9
100.
07.
636
.731
.49.
216
.2U
nacc
ount
ed fo
r by
dest
inat
ion
51.
410
0.0
a15
.444
.29.
619
.2SI
TC c
omm
odity
subg
roup
Insu
late
d w
ire a
nd c
able
(723
.1)
282
82.2
100.
09.
231
.640
.118
.18.
5El
ectri
cal i
nsul
atin
g eq
uipm
ent
6117
.810
0.0
14.8
16.4
32.8
14.8
24.6
(723
.2)
Sour
ce: A
ppen
dix
A a
nd so
urce
s cite
d th
ere.
aLes
s tha
n 0.
05 p
er c
ent.

384 Product Reports
Table 13.10OECD Exports of Electricity Distribution Equipment, 1961—64
(dollars in millions)
• Value ofOECD
Share in OECD Exports (per cent)EEC
Ger-Exports OECD U.S. U.K. Total many Japan
INCLUDING JAPAN1964 $377 100.0 9.0 26.2 39.5 17.5 14.11963 343 100.0 10.4 28.7 39.0 17.4 11.41962 320 100.0 9.4 25.0 45.3 19.4 7.8
1962 295 100.0 10.2
EXCLUDING JAPAN27.1 49.2 21.0
1961 268 100.0 10.8 48.1 20.5
Source: Appendix B.
Price TrendsInternational prices for electricity distribution equipment rose through-
out most of the period of the study in both the United Kingdom andGermany, while U.S. prices, after rising sharply between 1953 and 1957,declined until 1963 (Table 13.11). The fall in U.S. prices in 1962 issurprisingly large for a year in which other countries' prices were stable.One possible explanation is that the American data were much moreheavily weighted with prices supplied by purchasers than at least theGerman information. However, the data for the United Kingdom from
Table 13.11International Prices, Electricity Distribution Equipment, 1953, 1957,
1961—64
(1962 = 100)
1953 1957 1961 1962 1963 1964
U.s. 100 114 111 100 97 99U.K. 85 95 106 100 101 98
EEC 90 94 100 100 94 94
Germany 90 94 100 100 94 102
Source: Appendix C.
Electrical Machinery 385
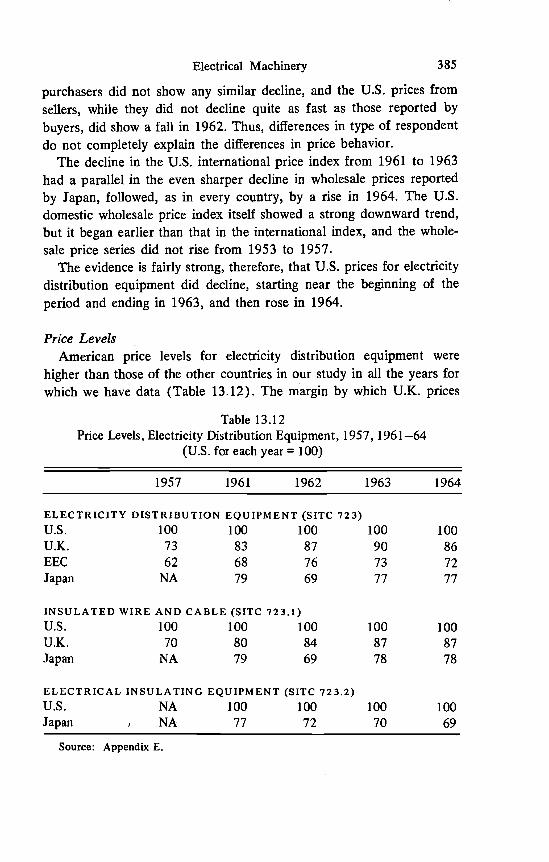
purchasers did not show any similar decline, and the U.S. prices fromsellers, while they did not decline quite as fast as those reported bybuyers, did show a fall in 1962. Thus, differences in type of respondentdo not completely explain the differences in price behavior.
The decline in the U.S. international price index from 1961 to 1963had a parallel in the even sharper decline in wholesale prices reportedby Japan, followed, as in every country, by a rise in 1964. The U.S.domestic wholesale price index itself showed a strong downward trend,but it began earlier than that in the international index, and the whole-sale price series did not rise from 1953 to 1957.
The evidence is fairly strong, therefore, that U.S. prices for electricitydistribution equipment did decline, starting near the beginning of theperiod and ending in 1963, and then rose in 1964.
Price LevelsAmerican price levels for electricity distribution equipment were
higher than those of the other countries in our study in all the years forwhich we have data (Table 13.12). The margin by which U.K. prices
Table 13.12Price Levels, Electricity Distribution Equipment, 1957, 1961—64
(U.S. for each year = 100)
1957 1961 1962 1963 1964
ELECTRICITY DISTRIBUTION EQUIPMENT (SITC 723)U.s. 100 100 100 100 100
U.K. 73 83 87 90 86
EEC 62 68 76 73 72Japan NA 79 69 77 77
INSULATED WIRE AND CABLE (SITC 723.1)U.S. 100 100 100 100 100U.K. 70 80 84 87 87
Japan NA 79 69 78 78
ELECTRICAL INSULATING EQUIPMENT (SITC 723.2)U.S. NA 100 100 100 100Japan NA 77 72 70 69
Source: Appendix E.

386 Product Reports
were lower ranged between 10 and almost 20 per cent, and the EECcountries and Japan undercut the United States by margins of 20 to 30or even 40 per cent.
Few clear trends are evident in the levels in general. In insulated wireand cable, the subgroup for which we had somewhat better data, U.K.prices seemed to be closer to U.S. levels at the end of the period thaninitially. EEC prices appear to have been lower in 1964 than earlier.The Japanese relative price level, except for a dip in 1962, did not showany trend.
The price level data for Germany are too weak to be shown sepa-rately, but as far as they go, they suggest that German prices werehigher than those of other EEC countries in the last two years afterhaving been lower in the first two.
The poor export showing of the United States, described in Table13.9, seems reasonable in the light of the price levels shown here, as dothe unusually strong export positions of Japan and the EEC countriesother than Germany. But the price data show the United Kingdom asbeing a higher-priced exporter than the EEC countries and Japan, afinding which seems anomalous in view of the United Kingdom's domi-nance of export trade in this group. However, the main strength of theUnited Kingdom is in insulated cable sold in Africa and the Far East,and it may be that, in the face of high prices, British sales were aidedby the experience with British equipment and the adoption of Britishstandards in Commonwealth countries.
The many place-to-place comparisons we have for this group are apotential source of information on differences in price levels by marketof sale. Unfortunately, in only three years do we have samples of asmany as five observations for a particular competitor in both U.S. andforeign markets. For electrical generating equipment (SITC 722.1) wefound that the ratio of foreign to American prices was substantiallylower on bids in the United States than abroad. In each case in elec-tricity distribution equipment, the average ratio of foreign to U.S. priceswas lower outside the United States than on U.S. projects, the appositeresult to that in generating equipment.
This result may point to a possible bias in the comparison of pricelevels among foreign countries in this group. Only a smail proportion ofthe EEC bids were on U.S. projects, for which we found that the ratiosof foreign to U.S. prices were relatively high. However, a considerable

Electrical Machinery 387
number of British bids and a majority of the Japanese bids used for ourindexes were on U.S. contracts. If U.S. market price ratios were unfavor-able to foreign finns, as the data suggest, we may have overestimatedBritish and particularly Japanese price levels by overweighting that mar-ket, or underestimatedmarket.
EEC price levels by underweighting the U.S.
Price CompetitivenessThe United States improved its price competitiveness relative to its
European competitors, during 1953—64, particularly before 1962 (Table13.13). Relative to Japan, the U.S. position declined greatlyrecovered almost to the 1961 level.
and then
Data for insulated cable, the main subgroup, show a constant increasein American price competitiveness relative to the United Kingdom, buta sharp fall followed by a gain relative to Japan. In electrical insulatingequipment, however, where only the Japanese data are adequate
Table 13.13
for
U.S. Price Competitiveness, Electricity Distribution Equipment,1953, 1957, 1961—64
(1962 = 100)
1953 1957 1961 1962 1963 1964
ELECTRICITY DISTRIBUTION EQUIPMENT (SITC 723)Relative to
U.K. 85 84 96 100 103 99
EEC 90 82 90 100 96 95Germany 90 82 90 100 97 103
Japan NA NA 113 100 110 111
INSULATED WIRE AND CABLE (S1TC 723.1)Relative to
U.K. NA 83 95 100 103 103Japan NA NA 115 100 113 114
ELECTRICAL INSULATING EQUIPMENT (SITC 723.2)
Relative to Japan NA NA 108 100 98 96Source: Appendix D.
388 Product Reports
the publication of an index, the US. position declined throughout thefour years for which we have data.
The export data of Table 13.10 show a substantial shift from theEEC countries to Japan during a four-year period, 196 1—64, whenEEC prices rose relative to Japanese prices. U.S. and U.K. price move-ments were between those of the other two countries, as were their exportchanges. However, the matching of price and export changes was poorfor 1962—64, when price changes seemed to favor the EEC countries.That finding suggests that the sharp decline and rise in Japanese pricesfrom 1961 to 1963 may reflect the erratic nature of the bidding datarather than actual price changes.
Telecommunications Equipment 13
TradeThe United States was the leading exporter of telecommunications
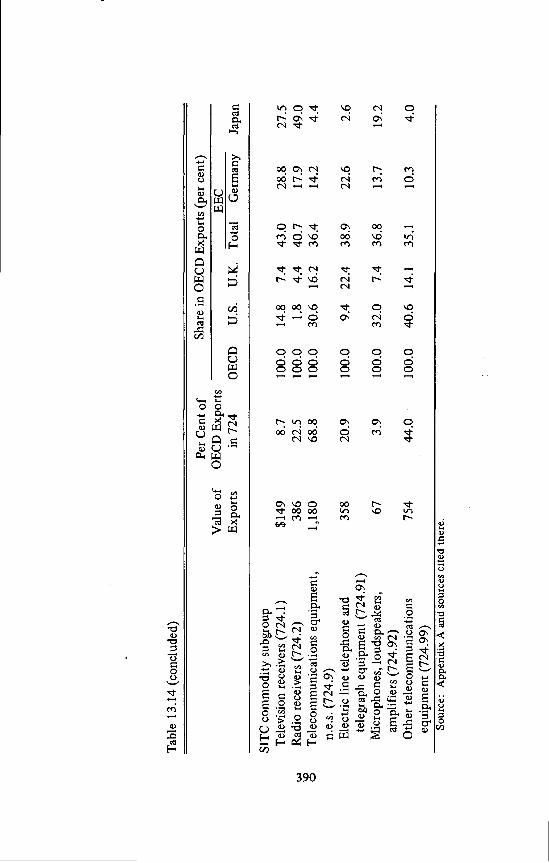
equipment in 1963. Japan, a comparatively minor factor in mostmachinery groups, was in second place, followed by Germany and theUnited Kingdom (Table 13.14). The ranking of the exporters variedgreatly among the subgroups. In television receivers, Germany rankedfirst, followed closely by Japan. The United States and the United King-dom were far behind. Japan completely dominated the trade in radioreceivers, accounting for almost half the exports, largely with its portabletransistor radios. U.S. and U.K. exports were negligible by comparison.In other telecommunications equipment the United States had a longlead over the United Kingdom, its nearest competitor, mainly in special-category exports classified under "electronic detection and navigationalapparatus." These accounted for the great bulk of U.S. exports in thesubgroup and even for three-quarters of U.S. exports of telecommunica-tions equipment as a whole. We infer that exports by the Netherlandsalso were mainly of military products because no data on destinationwere reported in this category.
Exports of telecommunications equipment grew rapidly during thefour years for which we have data. Exports by countries other than
STTC Value of OECD exports in 1963: $1.7 billion; 3.9 per cent of studytotal. Coverage: Television and radio receivers, telephone equipment, other telecommu-nications equipment, including telegraph equipment, microphones, loudspeakers, radarand other communications devices, and other components.

Tabl
e 13
.14
OEC
D E
xpor
ts o
f Tel
ecom
mun
icat
ions
Equ
ipm
ent (
SITC
724
),by
Orig
in, D
estin
atio
n, a
nd C
omm
odity
Sub
grou
p, 1
963
(dol
lars
in m
illio
ns)
Val
ue o
fPe
r Cen
t of
OEC
D E
xpor
tsSh
are
inO
ECD
Expo
rts(p
er c
ent)
EEC
Expo
rtsin
724
OEC
DU
.S.
U.K
.To
tal
Ger
man
yJa
pan
Tota
l, al
l des
tinat
ions
and
subg
roup
s$1
,715
100.
010
0.0
22.7
12.8
37.9
16.3
16.5
210
12.3
100.
04.
312
.49.
363
.8O
ECD
Eur
ope
672
39.2
100.
014
.79.
959
.727
.15.
2U
.K.
442.
610
0.0
50.0
34.1
15.9
6.8
EEC
tota
l38
322
.310
0.0
15.4
7.3
65.3
25.6
3.9
Ger
man
y81
4.7
100.
08.
68.
664
.29.
9C
anad
a89
5.2
100.
066
.319
.16.
74.
56.
7Ja
pan
140.
810
0.0
85.7
7.1
7.1
1.4
Latin
Am
eric
a99
5.8
100.
024
.27.
126
.317
.921
.2O
ther
392
22.9
100.
08.
230
.129
.814
.721
.7U
nacc
ount
ed fo
r by
dest
inat
ion
236
13.8
100.
069
.50.
030
.50.
1
(con
tinue
d)
Tabl
e 13
.14
(con
clud
ed)
Val
ue o
fPe
r Cen
t of
OEC
D E
xpor
tsSh
are
in O
ECD
Exp
orts
(per
cen
t)EE
CEx
ports
in 7
24O
ECD
U.S
.U
.K.
Tota
lG
erm
any
Japa
n
SITC
com
mod
ity su
bgro
upTe
levi
sion
rece
iver
s (72
4.1)
$149
8.7
100.
014
.87.
443
.028
.827
.5R
adio
rece
iver
s (72
4.2)
386
22.5
100.
01.
84.
440
.717
.949
.0Te
leco
mm
unic
atio
ns e
quip
men
t,1,
180
68.8
100.
030
.616
.236
.414
.24.
4n.
e.s.
(724
.9)
Elec
tric
line
tele
phon
e an
d35
820
.910
0.0
9.4
22.4
38.9
22.6
2.6
tele
grap
h eq
uipm
ent (
724.
91)
Mic
roph
ones
, lou
dspe
aker
s,67
3.9
100.
032
.07.
436
.813
.719
.2am
plifi
ers (
724.
92)
Oth
er te
leco
mm
unic
atio
ns75
444
.010
0.0
40.6
14.1
35.1
10.3
4.0
equi
pmen
t (72
4.99
)So
urce
: App
endi
x A
and
sour
ces c
iteci
ther
e.
\0 0

Electrical Machinery 391
Japan increased by more than 40 per cent from 1961 to 1964, andJapanese exports grew by that amount between 1962 and 1964 (Appen-dix B). The U.S. share of OECD exports rose sharply in 1962, mainlyat the expense of Germany. It then fell back to about the initial propor.-tion of exports other than Japanese (Table 13.15). The U.K. share fellin every year, while the main gains were scored by Japan and Italy.
The shifts in export shares showed up more strongly in the subgroupdata. In television receivers the United Kingdom made a large gain in1962 at the expense mainly of Germany. After that all the main export-ers except Japan lost heavily (in relative terms), as Japan doubled itsshare from 15 to 30 per cent in two years. The rise in the Japaneseshare was the result of the rapid growth in exports of small televisionsets, principally to the U.S. market, in which the Japanese succeeded incapturing something like 10 per cent of sales of black and white sets atthe end of our period and probably a greater share later, mostly underthe brand names of U.S. television set producers and retail chains.The U.S. producers specialized in larger sets, for which the market wasgreatest in the United States, while the Japanese were innovators andspecialists in small-screen sets which accounted for the bulk of theJapanese home market. The same specialization seemed to be taking
Table 13.15OECD Exports of Telecommunications Equipment, 1961—64
(dollars in millions)
Value ofOECD
Share in OECD Exports (per cent)EEC
Ger- Nether-Exports OECD U.S. U.K. Total many lands Japan
1964 $1,961
'
100.0 20.6
INCLUDING11.5 40.5
JAPAN16.1 10.2 17.8
1963 1,715 100.0 22.7 12.8 37.9 16.3 7.9 16.51962 1,538 100.0 24.0 13.4 37.0 15.9 7.5 15.8
1962 1,296 100.0 28.5
EXCLUDING15.9 43.6
JAPAN18.9 11.5
1961 1,106 100.0 24.8 16.8 47.4 22.2 6.4
Source: Appendix B.
392 Product Reports
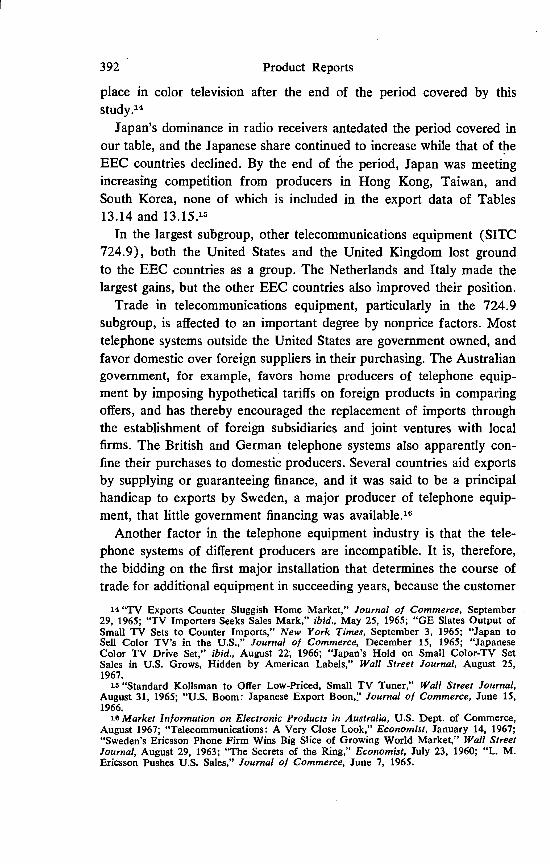
place in color television after the end of the period covered by thisstudy.14
Japan's dominance in radio receivers antedated the period covered inour table, and the Japanese share continued to increase while that of theEEC countries declined. By the end of the period, Japan was meetingincreasing competition from producers in Hong Kong, Taiwan, andSouth Korea, none of which is included in. the export data of Tables13.14 and
In the largest subgroup, other telecommunications equipment (SITC724.9), both the United States and the United Kingdom lost groundto. the EEC countries as a group. The Netherlands and Italy made thelargest gains, but the other EEC countries also improved their position.
Trade in telecommunications equipment, particularly in the 724.9subgroup, is affected to an important degree by nonprice factors. Mosttelephone systems outside the United States are government owned, andfavor domestic over foreign suppliers in their purchasing. The Australiangovernment, for example, favors home producers of telephone equip-ment by imposing hypothetical tariffs on foreign products in comparingoffers, and has thereby encouraged the replacement of imports. throughthe establishment of foreign subsidiaries and joint ventures with localfirms. The British and German telephone systems also apparently con-fine their purchases to domestic producers. Several countries aid exportsby supplying or guaranteeing finance, and it was said to be a principalhandicap to exports by Sweden, a major producer of telephone equip-ment, that little government financing was available.'6
Another factor in the telephone equipment industry is that the tele-phone systems of different producers are incompatible. It is, therefore,the bidding on the first major installation that determines the course oftrade for additional equipment in succeeding years, because the customer
14"TV Exports Counter Sluggish Home Market," Journal of Commerce, September29, 1965; "TV Importers Seeks Sales Mark," ibid., May 25, 1965; "GE Slates Output ofSmall TV Sets to Counter Imports," New York Times, September 3, 1965; "Japan toSell Color TV's in the U.S.," Journal of Commerce, December 15, 1965; "JapaneseColor TV Drive Set," ibid., August 22, 1966; "Japan's Hold on Small Color-TV SetSales in U.S. Grows, Hidden by American Labels," Wall Street Journal, August 25,1967.
15 "Standard Kolisman to Offer Low-Priced, Small TV Tuner," Wall Street Journal,August 31, 1965; "U.S. Boom: Japanese Export Boon," Journal 0/ Commerce, June 15,1966.
16 Market Information on Electronic Products in Australia, U.S. Dept. of Commerce,August 1967; "Telecommunications: A Very Close Look," Economist, January 14, 1967;"Sweden's Ericsson Phone Firm Wins Big Slice of Growing World Market," Wall StreetJournal, August 29, 1963; "The Secrets of the Ring," Economist, July 23, 1960; "L. M.Ericsson Pushes U.S. Sales," Journal of Commerce, June 7, 1965.
Electrical Machinery 393
is fairly well committed to the firm performing the initial installation.This fact, of course, affects pricing policy and at the same time tends toweaken the relationship between the flow of trade and contemporaneousprice relationships.
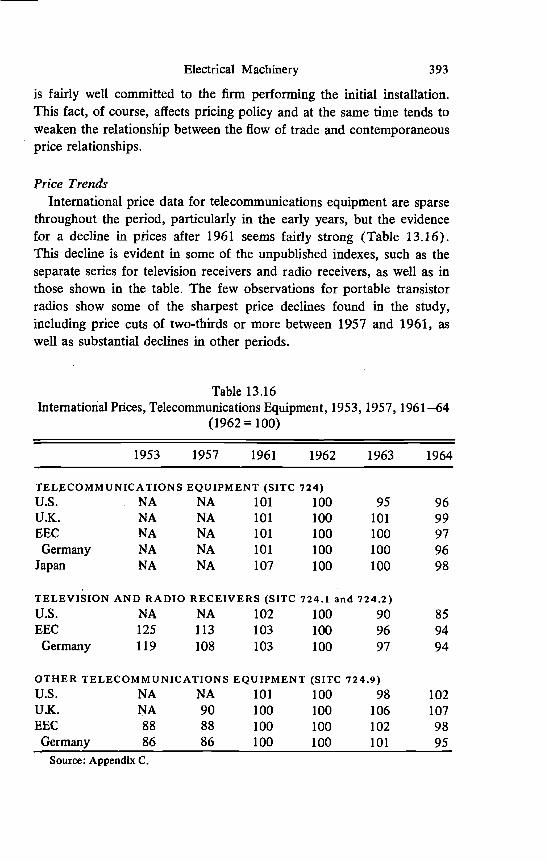
Price TrendsInternational price data for telecommunications equipment are sparse
throughout the period, particularly in the early years, but the evidencefor a decline in prices after 1961 seems fairly strong (Table 13.16).This decline is evident in some of the unpublished indexes, such as theseparate series for television receivers and radio receivers, as well as inthose shown in the table. The few observations for portable transistorradios show some of the sharpest price declines found in the study,including price cuts of two-thirds or more between 1957 and 1961, aswell as substantial declines in other periods.
Table 13.16International Prices, Telecommunications Equipment, 1953, 1957, 1961—64
(1962 = 100)
1953 1957 1961 1962 1963 1964
TELECOMMUNICATIONS EQUIPMENT (SITC 724)U.S. NA NA 101 100 95 96U.K. NA NA 101 100 101 99
EEC NA NA 101 100 100 97
Germany NA NA 101 100 100 96
Japan NA NA 107 100 100 98
TELEVISION AND RADIO RECEIVERS (SITC 724.1 and 724.2)U.S. NA NA 102 100 90 85EEC 125 113 103 100 96 94Germany 119 108 103 100 97 94
OTHER TELECOMMUNICATIONS EQUIPMENT (SITC 724.9)U.S. NA NA 101 100 98 102U.K. NA 90 100 100 106 107
EEC 88 88 100 100 102 98
Germany 86 86 100 100 101 95
Source: Appendix C.

394 Product Reports
There were no U.K. data for radios other than portable transistorsets, and no U.S. data before 1961. The data for television sets andportable transistor radios indicate clearly that prices on both of theseitems fell, and that if we had been able to calculate an index for thecombination of television and radio receivers it would have shown f ail-ing prices, as the indexes for Germany and the EEC countries do.
The main component of telecommunications equipment is SITC 724.9,which is dominated by telephone equipment. Prices in this subgrouprose in the EEC countries until 1963 and in the United Kingdomthroughout the period. American prices were comparatively stable after1961, declining at first and then recovering, but had risen sharply beforethen, according to fragmentary data.
In general, the main directions of movements in international pricesare reflected in wholesale prices, too, with declines in television andradio receivers and comparative stability in other telecommunicationsequipment. The differences appear to invOlve mainly a widespreadtendency toward smaller price declines in domestic wholesale pricesthan in international Coverage, however, is very inconsistent.The U.S. wholesale price excludes portable transistor radios, sincethey are unimportant in U.S. production, although they make up a largepart of international trade in radio receivers. The Japanese wholesaleprice index for radio receivers, on the other hand, contains only transistorradios.
The U.S. Department of Commerce export unit value series for tele-vision and radio receivers, which are components of the official exportunit value indexes, do not resemble any of the other price data in theirtrends or fluctuations. The export unit value for television sets declinedsharply from 1961 through 1963 and then greatly increased. Both inter-national and wholesale price series showed gradual declines with noreversals during those years. The export unit value for radios increasedsubstantially from 1957 to 1963 and then fell precipitously, to con-siderably below the initial level. Wholesale and international prices ofradios were declining throughout this whole period. In view of theintense competition from Japanese transistor radios, it seems very unlikelythat any appropriate measure of U.S. prices could have shown anincrease such as that of the unit value series. In this group, it seems safeto say, the official export unit value data are useless as measures of thebehavior of U.S. export prices.
Electrical Machinery 395
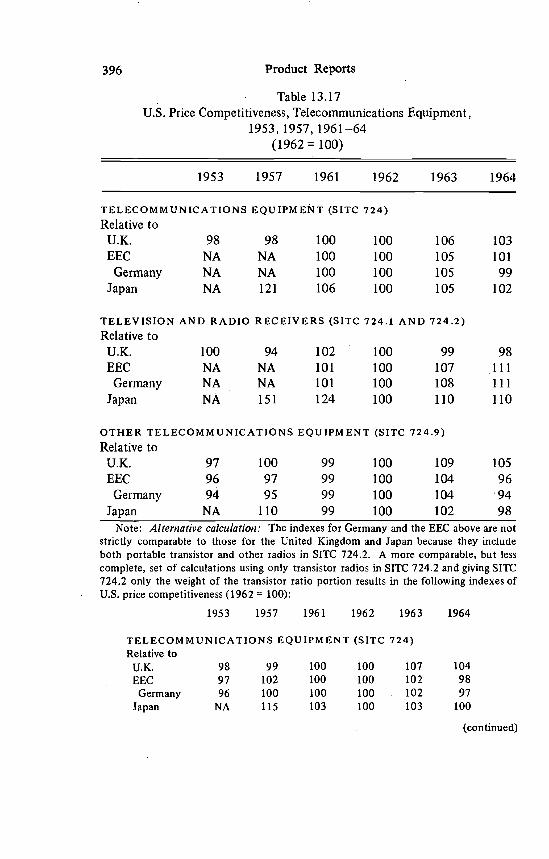
Price CompetitivenessAmerican price competitiveness in telecommunications equipment as
a whole moved within a fairly narrow range between 1953 and 1964,except for Japan (Table 13.17). It ranged from 98 to 106 per cent ofthe 1962 level relative to each of the other major competitors. Concealedin this apparent stability, however, were contrasting movements in com-petitiveness in television and radio receivers on the one hand and inother telecommunications equipment on the other. In television and radioreceivers U.S. price competitiveness declined relative to Japan between1957 and 1962, and relative to the EEC countries especially from 1953to 1962 (see note to Table 13.17). The recovery fell far short of regain-ing the early levels. In other telecommunications equipment the U.S.gained relative to the EEC countries until 1963 and then lost the gains
1964.The comparison with the United Kingdom showed some gains in
U.S. price competitiveness, mainly in the later years and for other tele-communications equipment. The index remained comparatively stablefor television and radio receivers.
The widest movements in U.S. price competitiveness were relative toJapan, a very large fall for both television and radio receivers and forother telecommunications equipment after 1957. The supplementarydata on wholesale prices suggest that even the large movements shownare smaller than the earlier losses, from 1953 to 1957, and that theU.S. recovery after 1962 was minor in comparison to the original de-cline.
Some of the differences among price competitiveness indexes in Table13.16 are due to differences in coverage rather than relative price move-ments for specffic commodities. The main one involves radio receivers(SITC 724.2) for which some countries' data include only portabletransistor radios. The indexes in the note to Table 13.17, less completein coverage than those in the table but more comparable among coun-tries because only portable transistor radios were used in the subgroupindex for SITC 724.2, suggest that U.S. price competitiveness relativeto the EEC countries did not improve much more than that relative tothe United Kingdom after 1962. There was, however, a large declinein the former before 1962, comparable to the decline relative to Japan.
U.S. price competitiveness indexes relative to Japan for television andradio receivers computed from wholesale price data declined moder-
396 Product Reports
Table 13.17U.S. Price Competitiveness, Telecommunications Equipment,
1953, 1957, 1961—64(1962= 100)
1953 1957 1961 1962 1963 1964
TELECOMMUNICATIONS EQUIPMENT (SITC 724)Relative to
U.K. 98 98 100 100 106 103
EEC NA NA 100 100 105 101
Germany NA NA 100 100 105 99
Japan NA 121 106 100 105 102
TELEVISION AND RADIO RECEIVERS (SITC 724.1 AND 724.2)
Relative toU.K. 100 94 102 100 99 98EEC NA NA 101 100 107 .111Germany NA NA 101 100 108 111
Japan NA 151 124 100 110 110
OTHER TELECOMMUNICATIONS EQUIPMENT (SITC 724.9)Relative to
U.K. 97 100 99 100 109 105EEC 96 97 99 100 104 96
Germany 94 95 99 100 104 94
Japan NA 110 99 100 102 98
Note: Alternative calculation: The indexes for Germany and the EEC above are notstrictly comparable to those for the United Kingdom and Japan because they includeboth portable transistor and other radios in SITC 724.2. A more comparable, but lesscomplete, set of calculations using only transistor radios in SITC 724.2 and giving SITC724.2 only the weight of the transistor ratio portion results in the following indexes ofU.S. price competitiveness (1962 = 100):
1953 1957 1961 1962 1963 1964
TELECOMMUNICATIONS EQUIPMENT (SITC 724)Relative to
U.K. 98 99 100 100 107 104EEC 97 102 100 100 102 98Germany 96 100 100 100 102 97
Japan NA 115 103 100 103 100
(continued)
Electrical Machinery 397
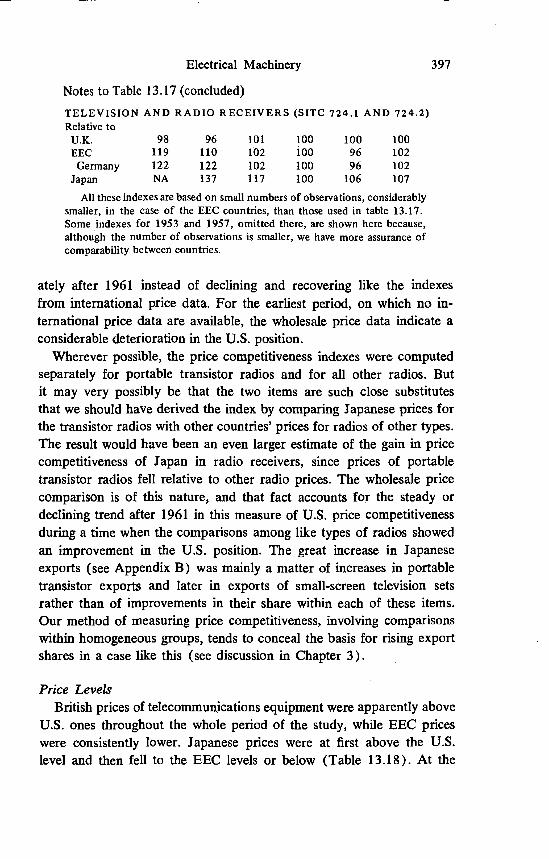
Notes to Table 13.17 (concluded)TELEVISION AND RADIO RECEIVERS (SITC 724.1 AND 724.2)Relative to
U.K. 98 96 101 100 100 100EEC 119 110 1O2 100 96 102Germany 122 122 102 100 96 102
Japan NA 137 117 100 106 107
All these indexes are based on small numbers of observations, considerablysmaller, in the case of the EEC countries, than those used in table 13.17.Some indexes for 1953 and 1957, omitted there, are shown here because,although the number of observations is smaller, we have more assurance ofcomparability between countries.
ately after 1961 instead of declining and recovering like the indexesfrom international price data. For the earliest period, on which no in-ternational price data are available, the wholesale price data indicate aconsiderable deterioration in the U.S. position.
Wherever possible, the price competitiveness indexes were computedseparately for portable transistor radios and for all other radios. Butit may very possibly be that the two items are such close substitutesthat we should have derived the index by comparing Japanese prices forthe transistor radios with other countries' prices for radios of other types.The result would have been an even larger estimate of the gain in pricecompetitiveness of Japan in radio receivers, since prices of portabletransistor radios fell relative to other radio prices. The wholesale pricecomparison is of this nature, and that fact accounts for the steady ordeclining trend after 1961 in this measure of U.S. price competitivenessduring a time when the comparisons among like types of radios showedan improvement in the U.S. position. The great increase in Japaneseexports (see Appendix B) was mainly a matter of increases in portabletransistor exports and later in exports of small-screen television setsrather than of improvements in their share within each of these items.Our method of measuring price competitiveness, involving comparisonswithin homogeneous groups, tends to conceal the basis for rising exportshares in a case like this (see discussion in Chapter 3).
Price LevelsBritish prices of telecommunications equipment were apparently above
U.S. ones throughout the whole period of the study, while EEC priceswere consistently lower. Japanese prices were at first above the U.S.level and then fell to the EEC levels or below (Table 13.18). At the

Table 13.18Price Levels, Telecommunications Equipment, 1953, 1957, 1961—64
(U.S. for each year = 100)
1953 1957 1961 1962 1963 1964
TELECOMMUNICATIONS EQUIPMENT (SITC 724)U.S. 100 100 100 100 100 100U.K. 113 112 115 115 122 118'EEC NA NA 89 89 93 89
Germany NA NA 88 88 93 87Japan NA 104 91 86 90 88
TELEVISION AND RADIO RECEIVERS (SITC 724.1 and 724.2)U.S.. 100 100 100 100 100 100U.K. 111 . 104 113 111 109 108EEC NA NA 83 82 88 91
Germany NA NA 85 84 90 92Japan NA 135 111 89 98 98
OTHER TELECOMMUNICATIONS EQUIPMENT (SITC 724.9)U.S. 100 100 100 100 100 100U.K. 114 116 116 117 127 123
EEC 88 89' 91 92 96 88
Germany 85 86 90 90 94 85Japan NA 93 84 84 87 83
Note: An alternative set of indexes for 724, 724.1 and 724.2, more comparableamong countries but less complete in coverage, can be derived by using only data ontransistor radios in the level for 724 and extrapolating by corresponding indexes ofprice competitiveness, as described in the notes to Table 13.16. These indexes are asfollows (U.S. for each year = 100):
1953 1957 1961 1962 1963 1964
TELECOMMUNICATIONS EQUIPMENT (SITC 724)U.s. 100 100 100 100 100 100U.K. 119 121 121 122 130 127EEC 86 90 88 88 90 87Germany 85 89 88 88 90 85
Japan NA 94 84 82 84 82
TELEVISION AND RADIO RECEIVERS (SITC 724.1 and 724.2)U.s. 100 100 100 100 100 100U.K. 103 101 107 105 105 105EEC ' 97
. 97 83 81 78 83Germany 99 99 83 81 78 83
Japan NA 98 84 72 76 76(continued)
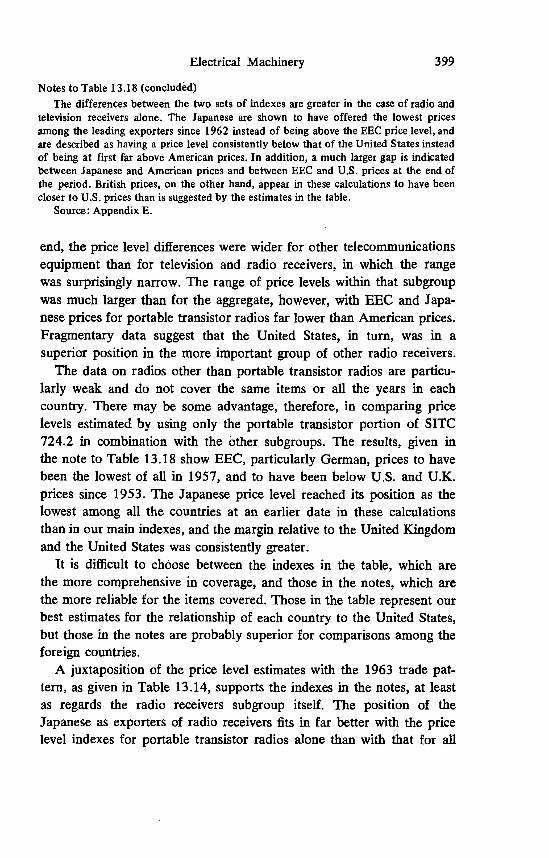
Electrical Machinery 399
Notes to Table 13.18 (concluded)The differences between the two sets of indexes are greater in the case of radio and
television receivers alone. The Japanese are shown to have offered the lowest pricesamong the leading exporters since 1962 instead of being above the EEC price level, andare described as having a price level consistently below that of the United States insteadof being at first far above American prices. In addition, a much larger gap is indicatedbetween Japanese and American prices and between EEC and U.S. prices at the end ofthe period. British prices, on the other hand, appear in these calculations to have beencloser to U.S. prices than is suggested by the estimates in the table.
Source: Appendix E.
end, the price level differences were wider for other telecommunicationsequipment than for television and radio receivers, in which the rangewas surprisingly narrow. The range of price levels within that subgroupwas much larger than for the aggregate, however, with EEC and Japa-nese prices for portable transistor radios far lower than American prices.Fragmentary data suggest that the United States, in turn, was in asuperior position in the more important group of other radio receivers.
The data on radios other than portable transistor radios are particu-larly weak and do not cover the same items or all the years in eachcountry. There may be some advantage, therefore, in comparing pricelevels estimated by using only the portable transistor portion of SITC724.2 in combination with the other subgroups. The results, given inthe note to Table 13.18 show EEC, particularly German, prices to havebeen the lowest of all in 1957, and to have been below U.S. and U.K.prices since 1953. The Japanese price level reached its position as thelowest among all the countries at an earlier date in these calculationsthan in our main indexes, and the margin relative to the United Kingdomand the United States was consistently greater.
It is difficult to choose between the indexes in the table, which arethe more comprehensive in coverage, and those in the notes, which arethe more reliable for the items covered. Those in the table represent ourbest estimates for the relationship of each country to the United States,but those in the notes are probably superior for comparisons among theforeign countries.
A juxtaposition of the price level estimates with the 1963 trade pat-tern, as given in Table 13.14, supports the indexes in the notes, at leastas regards the radio receivers subgroup itself. The position of theJapanese as exporters of radio receivers fits in far better with the pricelevel indexes for portable transistor radios alone than with that for all
400 Product Reports
radios. The levels for portable transistor radios show Japan far belowGermany and the EEC as a whole, and those, in turn, far below theUnited Kingdom and the United States. The only anomaly is the relationbetween the United Kingdom and the United States, with the formerexporting substantially more despite an apparently higher price level.
The export pattern for other telecommunications equipment did not•confirm the reported price levels at all, possibly because military exports,which did not enter the price estimates, were important in trade. TheUnited States, by far the major exporter, showed prices substantiallyhigher than the EEC countries and Japan, while the United Kingdomwas a major exporter despite prices considerably higher than even thoseof the United States. Japan, on the other hand, reported to be the low-est-priced equipment source, was a minor factor.
Household Electrical Equipment 17
TradeGermany was the leading exporter of household electrical equipment,
followed by the United Kingdom, the United States, and Italy, heremaking a rare appearance as a major machinery exporter (Table 13.19).Italy's importance was concentrated in refrigerators, in which it was aclose second to the United States as an exporter and was also a majorproducer. It was surpassed only by the United States and Germany in1963 and only by the United States in 1964. The Italian industry washeavily dependent on exports, sending a third or more of its productionabroad, mainly to other Common Market countries and Great Britain.'8By comparison with Great Britain, at least, Italy specialized in largerefrigerators, although it was also a major producer at the small end ofthe line.'9
The major successes in recent trade in household electrical equipmentwere the expansions in exports by Italy and Japan, the former more thandoubling its exports in three years and the latter almost doubling in
17 SITC 725. Value of OECD exports in 1963: $554 million; 1.2 per cent of studytotal. Coverage: "Domestic" (i.e., household) refrigerators, domestic washing machines,other electromechanical domestic appliances, electric shavers and. hair clippers, and otherdomestic electrical equipment.
18 Free World Production and Trade in Selected Household Appliances, OverseasBusiness Reports, U.S. Dept. of Commerce, December 1966.
19 "Italian Invasion," Economist, March 6, 1965.

Tabl
e 13
.19
OEC
D E
xpor
ts o
f Hou
seho
ld E
lect
rical
Equ
ipm
ent (
SITC
725
),by
Orig
in, D
estin
atio
n, a
nd C
omm
odity
Sub
grO
up, 1
963
(dol
lars
in m
illio
ns)
20.9
(con
tinue
d)
0
Val
ue o
fPe
r Cen
t of
OEC
D E
xpor
tsSh
are
inO
ECD
Expo
rts(p
er c
ent)
EEC
Expo
rtsin
725
OEC
DU
.S.
U.K
.To
tal
Ger
man
yJa
pan
Tota
l, al
l des
tinat
ions
and
subg
roup
s$5
54.4
100.
010
0.0
17.7
18.0
49•4
a24
.03.
5D
estin
atio
nU
.S.
26.8
4.8
100.
025
.040
.79.
011
.2O
ECD
Eur
ope
336.
860
.810
0.0
4.9
16.0
64.8
34.6
0.5
U.K
.23
.64.
210
0.0
9.3
38.1
10.6
0.0
EEC
tota
l18
6.2
33.6
100.
05.
017
.169
.633
.10.
7G
erm
any
30.9
5.6
100.
06.
529
.443
.41.
0C
anad
a35
.26.
310
0.0
89.5
5.7
3.7
0.8
0.3
Japa
n2.
10.
410
0.0
33.3
9.5
42.8
23.8
Latin
Am
eric
a37
.96.
810
0.0
100.
068
.117
.36.
629
.612
.932
.66.
19.
83.
411
.7O
ther
115.
7

Sour
ce: A
ppen
dix
A a
nd so
urce
s cite
d th
ere.
a0f w
hich
Ital
y, 1
0.8
per c
ent.
bØf w
hich
Ital
y, 2
4.9
per c
ent.
0
Tabl
e 13
.19
(con
clud
ed)
.
Val
ue o
fEx
ports
Per C
ent o
fO
ECD
Exp
orts
in 7
25
Shar
e in
OEC
D E
xpor
ts (p
er c
ent)
OEC
DEE
CU
.S.
U.K
.To
tal
Ger
man
yJa
pan
SITC
com
mod
ity su
bgro
upD
omes
tic re
frig
erat
ors (
725.
01)
$168
.130
.310
0.0
25.2
8.6
533b
20.3
2.3
Dom
estic
was
hing
mac
hine
s (72
5.02
)12
8.6
23.2
100.
014
.230
.650
.132
.71.
1El
ectro
mec
hani
cal d
omes
tic11
0.5
19.9
100.
014
.821
.439
.417
.49.
7ap
plia
nces
, n.e
.s. (7
25.0
3)El
ectri
c sh
aver
s and
hai
r clip
pers
43.4
7.8
100.
011
.312
.770
.517
.00.
2(7
25.0
4)El
ectri
c sp
aceh
eatin
g eq
uipm
ent
102.
618
.510
0.0
15.8
16.2
44.8
29.5
3.4
(725
.05)

Electrical Machinery 403
Table 13.20OECD Exports of Household Electrical Equipment, 1961—64
(dollars in millions)
Value ofOECD
Share in OECD Exports (per cent)EECGer-
1964
Exports
$640
OECD
100.0
U.S.
17.5
U.K. Total
INCLUDING15.3 50.9
many
JAPAN23.2
Italy
13.7
Japan
4.31963 554 100.0 17.7 18.0 49.4 24.0 10.8 3.51962 478 100.0 20.9 16.6 50.1 24.7 10.5 3.3
1962 462 100.0 21.6EXCLUDING17.2 51.8
JAPAN25.5 10.9
1961 452 100.0 23.5 16.7 50.8 25.1 8.9
Source: Appendix B.
two (Appendix B). Italy increased its share from 9 to 14 per centwhile the other major exporters, the United States, the United Kingdom,and Germany, all lost ground (Table 13.20). The growth in Italianexports of refrigerators was so great that, in combination with an increas-ing degree of market saturation it led to declines in domestic produc-tion in the other Common Market countries; by the end of the period,Italian exports of washing machines were also gaining in importance.2°
•Price TrendsInternational prices of household electrical equipment changed rela-
tively little over the period of the study (Table 13.21). The pricestability for the group as a whole reflects a sharply declining trend inhousehold refrigerators and mostly rising or stable prices for the otheritems in the group. The only other clear downward trend, not shown inthe table because the number of observations was very small, was forprices of household washing machines in the EEC countries.
Refrigerator prices in the United States and the United Kingdom,based on too few reports for publication, showed major declines, al-
20 From sources in footnotes 18 and 19. See also "Appliance Sales Abroad BuildingUp Momentum," Journal of Commerce, June 14, 1965; "Italy Appliance Makers BoostExports to Britain," ibid., April 8, 1965; "Washing Machines: A New Growth Point?"Economist, September 9, 1967.

404 Product Reports
Table 13.21International Prices, Household Electrical Equipment, 1953, 1957, 196 1—64
(1962 = 100)
1953 1957 1961 1962 1963 1964
HOUSEHOLD ELECTRICAL EQUIPMENT (SITC 725)U.S. NA 102 98 100 102 102U.K. NA NA NA 100 98 102
EEC NA 102 100 100 99 100
Germany NA 101 100 100 99 99
HOUSEHOLD REFRIGERATORS (SITC 725.01)EEC 140 118 101 100 97 96
Germany 132 114 100 100 96 96
ELECTROMECHANICAL HOUSEHOLD APPLIANCES, N.E.S.
(SITC 725.03)EEC 94 94 100 100 101 104Germany 92 93 100 100 101 104
ELECTRIC SPACE-HEATING AND OTHER ELECTRIC HEATINGEQUIPMENT (SITC 725.05)
EEC NA 91 99 100 100 101Germany NA 91 99 100 101 101
Source: Appendix C.
though not as large as those for EEC countries. In the United Kingdomthe price decline continued through 1964, probably in response to thepressure of imports from EEC countries, whose prices were also falling.
Wholesale prices in several cases moved quite differently from theinternational price indexes. They showed a strong downward trend inthe United States, while the international prices were fairly stable; anda large price rise in the United Kingdom in 1962—64, when internationalprice series showed little change (see Appendix F). In Japan, for whichinternational price data were unavailable, wholesale price data indicatedthat the price level was falling between 1961 and 1964.
A downward price trend was pervasive in the U.S. wholesale pricedata, not only in refrigerators, where it was considerably stronger thanthe trend in international prices, but also in the other items, for which
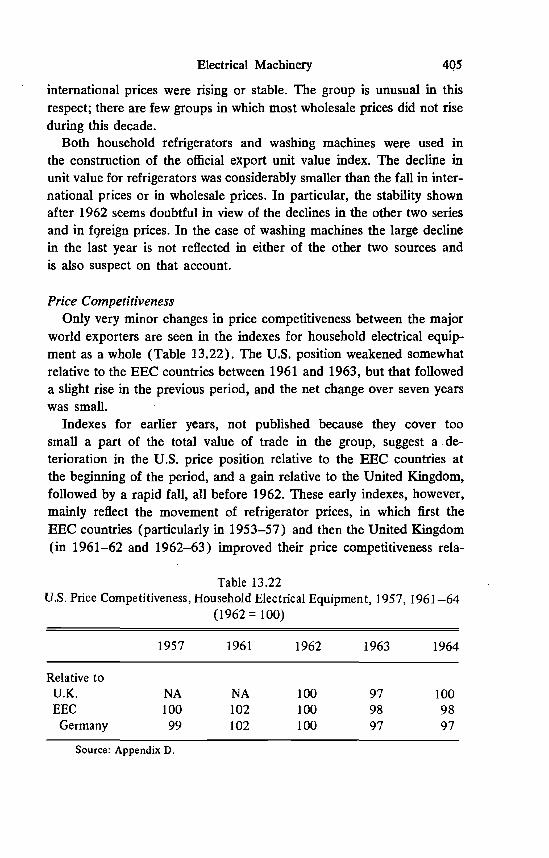
Electrical Machinery 405
international prices were rising or stable. The group is unusual in thisrespect; there are few groups in which most wholesale prices did not riseduring this decade.
Both household refrigerators and washing machines were used inthe construction of the official export unit value index. The decline inunit value for refrigerators was considerably smaller than the fall in inter-national prices or in wholesale prices. In particular, the stability shownafter 1962 seems doubtful in view of the declines in the other two seriesand in f9reign prices. In the case of washing machines the large declinein the last year is not reflected in either of the other two sources andis also suspect on that account.
Price CompetitivenessOnly very minor changes in price competitiveness between the major
world exporters are seen in the indexes for household electrical equip-ment as a whole (Table 13.22). The U.S. position weakened somewhatrelative to the EEC countries between 1961 and 1963, but that followeda slight rise in the previous period, and the net change over seven yearswas small.
Indexes for earlier years, not published because they cover toosmall a part of the total value of trade in the group, suggest a de-terioration in the U.S. price position relative to the EEC countries atthe beginning of the period, and a gain relative to the United Kingdom,followed by a rapid fall, all before 1962. These early indexes, however,mainly reflect the movement of refrigerator prices, in which first theEEC countries (particularly in 1953—57) and then the United Kingdom(in 196 1—62 and 1962—63) improved their price competitiveness rela-
Table 13.22U.S. Price Competitiveness, Household Electrical Equipment, 1957, 1961—64
(1962 = 100)
1957 1961 1962 i963 1964
Relative to
U.K. NA NA 100 97 100
EECGermany
100
99
102
102
100
100
98
97
98
97
Source: Appendix D.

406 Product Reports
tive to the United States by 15 per cent or more. In this item U.S. pricecompetitiveness quite generally fell until 1963, but recovered sharply in1964.
Indexes of price competitiveness from wholesale price data record adifferent story, mainly gains in U.S. price competitiveness throughoutthe period. The chief exceptions are several declines relative to Japan.The indexes from wholesale prices show a 9 per cent gain in U.S. pricecompetitiveness relative to the United Kingdom between 1962 and 1964,while the indexes from international prices show no change. The indexesfrom wholesale prices show a gain relative to Germany of 5 per centbetween 1961 and 1964; those from international prices, a 5 per centdecline.
Data on trade shares given in Table 13.20 fit better with the price.competitiveness indexes from international price data than with thosefrom wholesale price data. They show no gain in exports relative to theUnited Kingdom between 1962 and 1964, as might be expected fromthe wholesale price data. If anything they show some loss in the U.S.relative share. The U.S. export share also declined relative to Germanybetween 1961 and 1964, as might be expected from the internationalprice data, instead of gaining, as one might expect from looking at therelative movements of wholesale prices.
Price LevelsBoth U.K. and EEC household electrical equipment prices have been
between 5 and 10 per cent below U.S. prices throughout the period ofthe study, with no strong trend visible in the data for the group as awhole (Table 13.23). The European level was lower for refrigerators
Table 13.23Price Levels, Household Electrical Equipment, 1957, 1961—64
(U.S. for each year = 100)
1957 1961 1962 1963 1964
U.S. 100 100 100 100 100
U.K. NA NA 92 90 93
EEC 93 95 93 90 90
Source: Appendix E.
Electrical Machinery 407
than for the other items in 1964, particularly in the case of the EECcountries, and there is some evidence of a strong downward trend beforethat. There is a little evidence that EEC prices in the earlier years weresubstantially above U.S. ones.
A few scattered observations for Japan, not shown in the table, sug-gest that the Japanese price level was the lowest of all, but the data donot include any prices on the major household appliances; their inclu-sion might give a different impression.
In general, these place-to-place comparisons are considerably weakerthan those in many other groups because of the large differences in thespecifications of products produced and used in each country.
1'or example, as was mentioned earlier, the most popular householdmodels of refrigerators in the United Kingdom were in the 3.5—4.5cubic foot range even at the end of the period, and a British firm suppliedthe demand for larger models by importing those of about 4.5—8.5 cubicfoot capacity from Italy, where the most popular range of sizes was4.8—6.4 cubic feet.2' In the United States, by way. of contrast, the mostpopular size was 13.5-44.5 cubic feet, and only 45,000 units, about 1per cent of the units produced, were under 8.5 cubic feet.22 The valueof comparing European and British refrigerator data with Americandata for the same products is questionable; it means comparing a smallfringe of the U.S. industry with a high proportion of the Continentaland British output, giving no weight to the bulk of U.S. output, whichmeets little or no competition. If we had received additional data wemight have been able to apply regression analysis to the various coun-tries' data to give a wider range of price comparisons. The small refrig-erators are more important in world trade than the large ones, but U.S.exports were important, at about one-quarter of OECD exports,. as canbe seen in Table 13.19. The average U.S. export unit value of $166 in1963 23 suggests an average size of exported refrigerators in the 12.5—13.5 cubic foot range, which is not represented in our price comparisons.That size would, if included, almost certainly raise the ratio of foreign-U.S. prices in the refrigerator subgroup.
Other appliances also differ substantially from country to country,with foreign products being generally less automatic and of smaller
21 "Italian Invasion," Economist, March 6, 1965; Free World Production and Trade.22 Census of Manufactures: 1963, Industry Statistics: Household Appliances, U.S.
Bureau of the Census, 1966.28 United States Exports of Domestic and Foreign Merchandise; Commodity by Coun-
try of Destination, 1963 Annual, U.S. Bureau of the Census, Report FT 410, 1964.

408 Product Reports
capacity, although some contained features not wanted or not neededin the United States, such as water heaters in washing machines or watersofteners in dishwashers. Where comparability was obtained in someprice comparisons for freezers and dishwashers the European priceswere far above the U.S. levels.
Appendix: Regression Analysis of Power Transformer Prices
Little direct information on price trends for power transformers wascollected in the course of this study, mainly because the data for theseproducts are almost entirely from purchasers and no purchaser is likelyto buy identical items year after year. Even when we pooled the datafrom many purchasers it was difficult to find observations in successiveyears for products identical with respect to the short list of specificationsavailable, and those that did have corresponding specifications probablydiffered in other characteristics for which we did not have information.• In such a product, for which each individual sale involves some degreeof custom tailoring, prices supplied by sellers for an identical productover time are likely to be somewhat artificial. The agency requesting theprice cannot even request actual prices because there will be few, if any,sales of the exact product specified by• the collecting agency. The re-ported price is even more likely than usual to represent a list price, i.e.,without adjustments to meet competition. Since we do not have time-to-time sellers' data on identical products, and each buyers' report is ofan item somewhat different from the previous one, our choice of methodsfor making price comparisons is narrowed. Place-to-place comparisonsfor power transformers, and for most of the other items in this subgroup,were made from bidding data, as described in the text. For comparisonsover time, however, the only possible technique was to fit regressions toeach year's bid prices and to measure the price changes from these.24This procedure was applied only to U.S. prices, because observationsfor the other countries were too few. Indexes for the other countrieswere inferred from the U.S. ones by using the place-to-place relativesfrom bid data.
The basic data .for the regression analysis were approximately 150offers by U.S. companies in bidding on power transformers in the United
24 For a discussion of the use of regression methods, see Chapter 5.

Electrical Machinery 409
States and abroad in 1957 and 1961 through 1964. Only the lowest U.S.offer was taken for each bidding, on the ground that it was the only onerelevant for the buyers. It undoubtedly would have been desirable toinclude several characteristics of the transformers in the equation.25However, we did not collect detailed specifications, although they wereavailable in any degree of completeness desired, because the data wereintended for use in place-to-place comparisons, in which the requirementthat buyers' specifications be met and the evaluation of offers by pur-chasers insured comparability among suppliers. For that reason, the onlycharacteristi.c of the equipment that could be included in our equationswas transformer capacity, and we were obliged to assume that either theother were not correlated with capacity or the year ofpurchase or that they did not affect the price.
It would have been possible to calculate place-to-place indexes throughregression analysis also, but this procedure would not have been efficient.Bidding produces the effect sought from the regression analysis; i.e.,the comparison of prices of comparably specified items, or at least hav-ing comparable minimum specifications. The advantage is that the num-ber of specifications matched or otherwise taken into account is muchgreater than could be included in any regression possible from the exist-ing data.
Given the limitations on the number of characteristics to be used inthe equations the main remaining decisions concerned the form of theequations. The variables included were the capacity of the transformer,measured in millivolt-amperes, the year in which the bidding took place,and a dummy variable to distinguish bids on projects in the United Statesfrom those on foreign projects. The equations with the greatest numberof variables included those listed plus interaction terms to permit thecoefficient for capacity to vary from year to year. Four equation formswere fitted for each set of variables, arithmetic in both dependent andindependent variables, logarithmic in both, the dependent variable arith-metic and the independent variables logarithmic, and vice versa.
The mixed equation forms could be dismissed immediately. Manyfitted the data poorly, and the best of them were inferior to the corre-
25 Dean and De Podwin included not only capacity (kilovolt-amperes) but alsodummy variables for phase and load tap changing, and calculated separate equationsfor self-cooled and forced oil auto and conventional transformers. See Charles R. Deanand Horace J. Dc Podwin, "Product Variation and Price Indexes: A Case Study ofElectrical Apparatus," Proceedings o/the American Statistical Association, December 29,1961.
410 Product Reports
sponding arithmetic or logarithmic equations. The arithmetic equationsproduced some high levels of but the residuals gave clear evidence ofcurviinearity in the relationship of price to capacity.
The arithmetic equations show substantial differences in slope fromyear to year as well as differences in level. In equation 1 of Table 13.24,for example, the coefficient for MVA ranges from .82 in 1962 ($820per MVA) to 2.33 in 1957, and the other equations show similarlywide ranges. However, the slope' measures are sensitive to the presenceor absence of large transformers in the sample. They sometimes increasedsharply when the largest ones were dropped, as in 1962 and 1964, andsometimes declined, as in 1957 and 1963. This effect can be seen by acomparison of Table 13.24, which includes all transformers, with Table13.25, which excludes nine transformers of 300 MVA or over. Theelimination of the large transformers narrows the range of year-to-yearvariation in slope, although it remains large in Table 13.25. The mostdrastic change in coefficients is in 1963, the year in which most Of thelarge transformer bids took place. The coefficient was cut from 1.18 to0.69, the lowest of all the years shown.
The results from dropping the large transformers illustrate their rolein the high levels of reached in the arithmetic regressions. The equa-tions of Table 13.25, without the few largest transformers, produce muchlower levels of ranging from .73 to .78 instead of .85 to .86, mostof them about one-tenth below the corresponding ones in Table 13.24.
The logarithmic equations, which are superior to the arithmetic, areshown in Table 13.26. Differences in slopes, by year, were not statis-tically significant except for 1964. We therefore settled on equation 12,with only a single slope for the other years and with year-to-year pricechanges represented by the coefficients of the year dummy variables. For1964, since the dummy variable for the slope was significant, the meas-ured price change was different at each size of transformer. Price rela-tives were calculated for several different sizes, and these were weightedby our estimate, from bidding data, of the relative importance of eachsize in terms of the value of the trade involved. All of the year dummycoefficients were statistically significant, and the preferred equation, 12,shows a sharp fall in price from 1957 to 1961, smaller declines to 1963,and the smallest of all in 1964.
The logarithmic equations present a number of contrasts with thearithmetic ones. Not only are the k2 higher, all between .93 and .94,
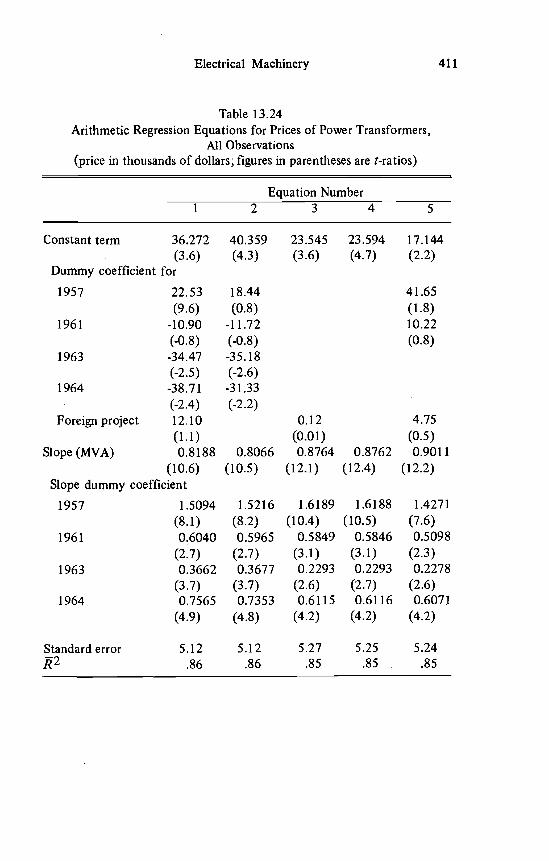
Electrical Machinery 411
Table 13.24Arithmetic Regression Equations for Prices of Power Transformers,
All Observations(price in thousands of dollars; figures in parentheses are t-ratios)
Equation Number1 2 3 4 5
Constant term 36.272 40.359 23.545 23.594 17.144(3.6) (4.3) (3.6) (4.7) (2.2)
Dummy coefficient for1957 22.53 18.44 41.65
(9.6) (0.8) (1.8)1961 -10.90 -11.72 10.22
(-0.8) (-0.8) (0.8)1963 -34.47 -35.18
(-2.5) (-2.6)
1964 -38.71 -31.33(-2.4) (-2.2)
Foreign project 12.10 0.12 4.75(1.1) (0.01) (0.5)
Slope (MVA) 0.8188 0.8066 0.8764 0.8762 0.9011(10.6) (10.5) (12.1) (12.4) (12.2)
Slope dummy coefficient1957 1.5094 1.5216 1.6189 1.6188 1.4271
(8.1) (8.2) (10.4) (10.5) (7.6)1961 0.6040 0.5965 0.5849 0.5846 0.5098
(2.7) (2.7) (3.1) (3.1) (2.3)
1963 0.3662 0.3677 0.2293 0.2293 0.2278(3.7) (3.7) (2.6) (2.7) (2.6)
1964 0.7565 0.7353 0.6115 0.6116 0.6071(4.9) (4.8) (4.2) (4.2) (4.2)
Standard error 5.12 5.12 5.27 5.25 5.24.86 .86 .85 .85 .85

412 Product Reports
Table 13.25Arithmetic Regression Equations for Prices of Power Transformers,
Excluding Large Transformersin thousands of dollars; figures in parentheses are t-ratios)
Equation Number1 2 3 4 5
Constant term 36.835 40.562 31.313 29.296 24.781(5.7) (6.8) (6.9) (8.3) (4.6)
Dummy coefficient for
1957 47.16 43.34 66.18(2.7) (2.5) (3.9)
1961 -10.84 -11.92 3.73(-1.3) (-1.4) (0.5)
1963 -19.20 -19.62(-2.5) (-2.5)
1964 -38.82 -32.04(-3.7) (-3.4)
Foreign projects 9.82 -4.50 0.50(1.4) (-0.7) (0.1)
Slope (MVA) 0.8797 0.8576 0.8497 0.8621 0.9644(10.4) (10.3) (10.6) (11.1) (11.3)
Slope dummy coefficient
1957 1.0750 1.0974 1.6369 1.6443 0.9573(4.5) (4.5) (8.7) (8.7) (3.8)
1961 0.5394 0.5456 0.5295 0.5335 0.4395(3.7) (3.7) (4.0) (4.1) (2.9)
1963 -0.1890 -0.1870 -0.1799 -0.1784 -0.2736
(-2.6) (-2.6) (-2.7) (-2.6) (-4.0)1964 1.0125 0.8688 0.2011 0.1752 0.2441
(2.23) (2.0) (0.5) (0.4) (0.6)
Standard error 3.02 3.04 3.32 3.32 3.17.78 .77 .73 .73 .75

Tabl
e 13
.26
Loga
rithm
ic R
egre
ssio
n Eq
uatio
ns fo
r Pric
es o
f Pow
er T
rans
form
ers,
All
Obs
erva
tions
(nat
ural
loga
rithm
of p
rice
in th
ousa
nds o
f dol
lars
; fig
ures
in p
aren
thes
es a
re t-
ratio
s)
Equa
tion
Num
ber
78
910
1112
Con
stan
t ter
m1.
4781
(15.
8)1.
75 1
0(1
9.1)
1.46
31(1
7.7)
1.71
39(2
2.0)
1.73
95(2
1.9)
•
1.48
86(1
8.1)
Dum
my
coef
ficie
nt19
57fo
r0.
838
(6.2
)0.
714
(4.8
)0.
820
(7.3
)0.
735
(6.0
)0.
740
(6.0
)0.
830
(7.5
)19
610.
289'
(3.6
)0.
240
(2.7
)0.
262
(3.8
)0.
227
(3.0
)0.
224
(2.9
)0.
260
(3.8
)1963
-0.165
-0.197
-0.164
-0.180
-0.178
-0.159.
(-2.2)
(-2.3)
(-2.4)
(-2.4)
(-2.4)
(-2.4)
1964
-0.253
(-2.7)
-0.068
(-0.7)
-0.187
(-2.2)
-0.016
(-0.2)
-(1061
(-0.6)
-0.258
(-2.8)
Fore
ign
proj
ect
0.41
9(6
.0)
0.39
9(5
.8)
0.41
7(6
.1)
Slop
e (in
MV
A)
0.75
55(3
2.6)
0.70
47(2
9.2)
•0.
7620
(41.
4)0.
7 16
6(3
8.9)
0.70
84(3
6.8)
0.75
23(4
0.4)
(con
tinue
d)

I-
Tabl
e 13
.26
(con
clud
ed)
Equa
tion
Num
ber
78
910
1112
Slop
e du
mm
yco
effic
ient
.
1957
-0.0
013
(-0.
1)0.
0036
(0.3
)1961
-0.0094
(-0.7)
-0.0059
(-0.4)
.
1963
0.00
06(0
.1)
0.00
23(0
.5)
1964
0.01
79(2
.2)
0.01
34(1
.4)
0.01
28(1
.4)
0.01
83(2
.3)
Stan
dard
err
or.3
0.3
3.3
0.3
3.3
3.3
0k2
.94
.93
.94
.93
.93
.94

Electrical Machinery 415
and the slopes virtually constant from year to year, but the equationscalculated from the sample excluding the largest transformers (Table13.27) are almost identical to those from the complete sample. Theare hardly reduced by the reduction in the sample, ranging from .91to .94, and the coefficients are mostly very close as well, except those for1964 and the constant term for 1957, which is unstable because of thesmall number of observations for that year.
Price indexes are derived below (Table 13.28) from equation 12(previously mentioned as preferred), which includes a dummy variablefor foreign projects and a slope dummy variable for 1964, and from twoothers. Of these, equation 11 is equation 12 minus the dummyvariablefor foreign projects, and equation 10 also excludes the 1964 slopedummy.
The movements of all three price indexes are fairly similar between1961 and 1963 and those from equations 10 and 11 are similar through-out. However, the index from equation 12 declines in 1964 while theother two rise. It also declines more than the other two in 1957—6 1 and1961—62, and rises more in 1962—63. The only really large differenceis in the last year, when almost all the observations were from foreignprojects; equation 12 implies that the apparent rise in U.S. prices be-tween 1963 and 1964 is due entirely to this fact, and that the compari-son with foreign projects alone shows a continuation of the price declines.
This international price index can be compared with a number ofmeasures of domestic prices of power. transformers and other electricalequipment, although the methods and time period covered differ fromour own and the differences among the indexes cannot, therefore, beassumed to represent differences between domestic and internationalprice behavior. These indexes and the international price index areshown on Chart 13.1 and Table 13.29.
The BLS series relies essentially on list or catalog prices and doesnot reflect what were apparently sharp short-term fluctuations in actualtransaction prices. The indexes published by Dean and De Podwin andby Kuhlman 26 use transaction prices calculated by the electrical equip-ment manufacturers and fluctuate more sharply than the BLS series.The Dean and De Podwin index is, in addition, based on a regression
26 Dean and De Podwin, op. cit.; John M. Kuhiman, "Theoretical Issues in the Esti-mation of Damages in a Private Antitrust Action," Southern Economic Journal, April1967.

Tabl
e 13
.27
Loga
rithm
ic R
egre
ssio
n Eq
uatio
ns fo
r Pric
es o
f Pow
er T
rans
form
ers,
Excl
udin
g La
rge
Tran
sfor
mer
s(n
atur
al lo
garit
hm o
f pric
e in
thou
sand
s of d
olla
rs; f
igur
es in
par
enth
eses
are
t-ra
tios)
Equa
tion
Num
ber
78
910
1112
Con
stan
t ter
m1.
4978
(17.
0)1.
7557
(19.
5)1.
5447
(18.
8)1.
7992
(22.
5)1.
8167
(21.
9)1.
5680
(19.
0)D
umm
y co
effic
ient
for
1957
0.98
1(6
.6)
0.85
1(5
.0)
0.81
6(7
.2)
0.72
1(5
.7)
0.72
2(5
.7)
0.82
2(7
.4)
1961
0.27
6(3
.7)
0.23
3(2
.7)
0.24
8(3
.7)
0.21
3(2
.8)
0.21
2(2
.8)
0.24
7(3
.7)
1963
-0.153
(-2.2)
-0.173
(-2.1)
-0.215
(-3.2)
-0.235
(-3.1)
-0.237
(-3.1)
-0.218
(-3.3)
1964
-0.302
(-3.0)
-0.078
(-0.7)
-0.264
(-3.1)
-0.085
(-0.9)
-0.132
(1.2)
-0.360
(-3.6)
Fore
ign
proj
ect
Slop
e (in
MV
A)
0.42
2(6
.5)
0.75
190.
7058
0.40
3(6
.1)
0.73
760.
6908
0.68
49
0.41
9(6
.3)
0.72
81.
(32.
7)(2
8.2)
(37.
2)(3
3.5)
(31.
4)(3
5.8)
C'
(con
tinue
d)
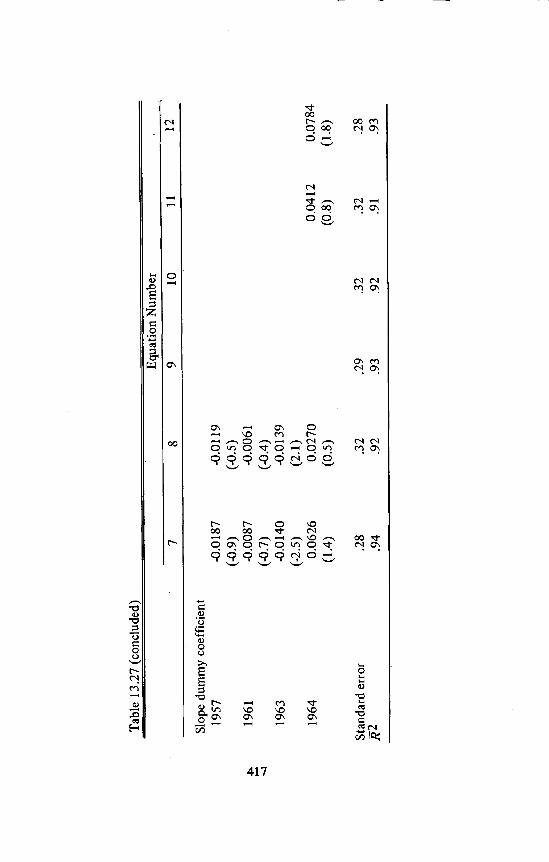
Tabl
e 13
.27
(con
clud
ed)
.
Equa
tion
Num
ber
.
78
910
1112
Slop
e du
mm
yco
effic
ient
1957
-0.0187
(-0.9)
-0.0119
(-0.5)
1961
-0.0
087
(-0.
7)-0
.006
1(-
0.4)
1963
-0.0
140
(-2.
5)-0
.013
9(2
.1)
1964
0.06
26(1
.4)
0.02
70(0
.5)
0.04
12(0
.8)
0.07
84(1
.8)
Stan
dard
err
or.2
8.3
2.2
9.3
2.3
2.2
8k2
.94
.92
.93
.92
.91
.93
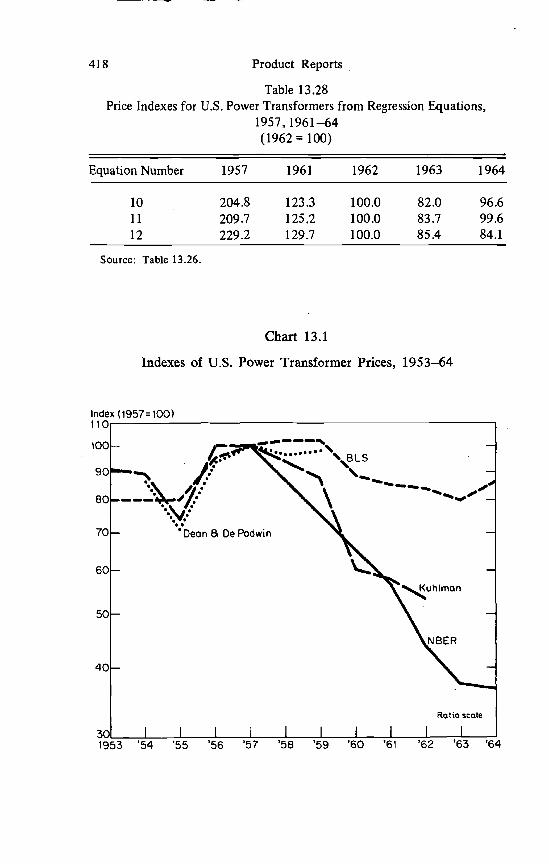
418 Product Reports
Table 13.28Price Indexes for U.S. Power Transformers from Regression Equations,
1957,1961—64(1962 = 100)
Equation Number 1957 1961 1962 1963 1964
10 204.8 123.3 100.0 82.0 96.611 209.7 125.2 100.0 83.7 99.612 229.2 129.7 100.0 85.4 84.1
Source: Table 13.26
Chart 13.1
Indexes of U.S. Power Transformer Prices, 1953—64
1
1953 '54 '55 '56 '57 '58 '59 '60 '61 '62 '63 '64
Index (1957= 100)110
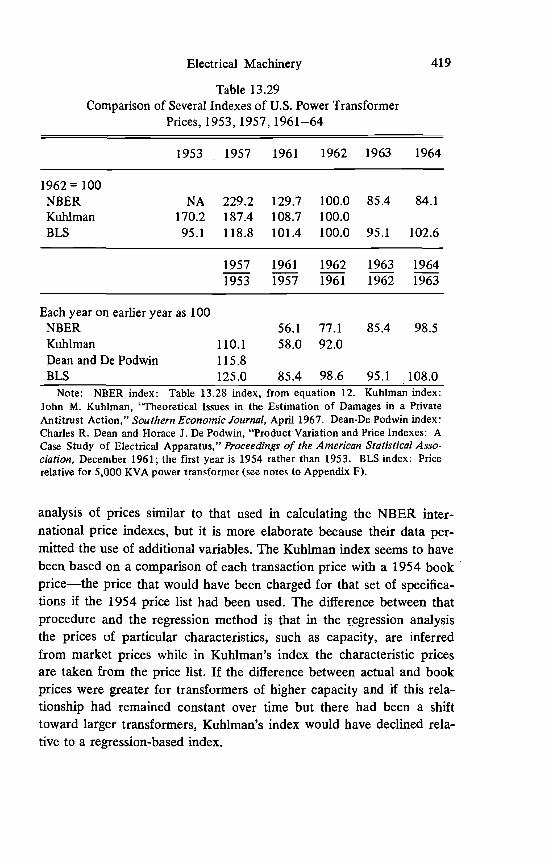
Electrical Machinery 419
Table 13.29Comparison of Several Indexes of U.S. Power Transformer
Prices, 1953, 1957, 1961—64
1953 1957 1961 1962 1963 1964
1962 100NBER NA 229.2 129.7 100.0 85.4 84.1Kuhlman 170.2 187.4 108.7 100.0BLS 95.1 118.8 101.4 100.0 95.1 102.6
19571953
19611957
19621961
19631962
19641963
Each year on earlier year as 100NBER 56.1 77.1 85.4 98.5Kuhiman 110.1 58.0 92.0Dean and De Podwin 115.8BLS 125.0 85.4 98.6 95.1 108.0
Note: NBER index: Table .13.28 index, from equation 12. Kuhiman index:John M. Kuhiman, "Theoretical Issues in the Estimation of Damages in a PrivateAntitrust Action," Southern Economic Journal, April 1967. Dean-De Podwin index:Charles R. Dean and Horace J. De Podwin, "Product Variation and Price Indexes: ACase Study of Electrical Apparatus," Proceedings of the American Statistical Asso-ciation, December 1961; the first year is 1954 rather than 1953. BLS index: Pricerelative for 5,000 KVA power transformer (see notes to Appendix F).
analysis of prices similar to that used in calculating the NBER inter-national price indexes, but it is more elaborate because their data per-mitted the use of additional variables. The Kuhiman index seems to havebeen based on a comparison of each transaction price with a 1954 bookprice—the price that would have been charged for that set of specifica-tions if the 1954 price list had been used. The difference between thatprocedure and the regression method is that in the regression analysisthe prices of particular characteristics, such as capacity, are inferredfrom market prices while in Kuhiman's index the characteristic pricesare taken from the price list, lithe difference between actual and bookprices were greater for transformers of higher capacity and if this rela-tionship had remained constant over time but there had been a shifttoward larger transformers, Kuhiman's index would have declined rela-tive to a regression-based index.

420 Product Reports
In fact, Kuhiman's index resembles Dean and De Podwin's closelyexcept in 1959, when it declined sharply while the Dean-De Podwinindex rose. Even this divergence may have been only in timing,since the Dean-De Podwin index turned sharply downward in the firstquarter of 1960, the last period for which it is available. The NBER andKuhiman indexes show similar large declines from 1957 to 1961, butwe do not have data on intermediate years with which to compare year-to-year fluctuations. In 1962 the NBER index continued its rapid fall,while the Kuhiman series dropped by only 8 per cent.
The resemblances among the three series are particularly striking inview of the large differences in methods of construction, source of data,and even in the transactions covered, since the NBER data referred toforeign and U.S. government sales and the other two mainly or entirelyto sales to private utility companies. The similarity among these indexesreinforces the impression that the BLS index greatly exaggerates thestability of power transformer prices and may well give an incorrectimpression of the trend as well.
Some independent confirmation of the price changes shown by theindexes other than the BLS can be found in newspaper and magazinereports on the antitrust case against the electrical equipment manu-facturers. For example, the "white sale" of 1954—55, which began atabout the end of 1954, and the reported resumption of price-fixingarrangements in 1956 are clearly marked in both the Kuhiman andDean-De Podwin indexes, particularly in the quarterly data, not repro-duced here, but the BLS index shows no trace of them.27 The defensein the trial was quoted as reporting that power transformer prices". . . sagged badly in 1958, well before the end of the conspiracy." 28The BLS series showed a rise in price in 1958 while both Kuhlman andDean-De Podwin confirm the reported decline. The reported declineafter the ending of the conspiracy—". . . 30 per cent or more belowthe price levels of a year ago" 29—matches closely the Kuhiman figureof 29 per cent from the fourth quarter of 1959 to the fourth quarter of1960. The BLS reported a fall of less than 15 per cent in the sameperiod.
27 Richard Austin Smith, "The Incredible Electrical Conspiracy, Part I," Fortune, April1961.
28 "Electrical-Gear Makers Go on Trial Today in First Civil Suit on Price-FixingCharges," Wall Street Journal, March 16, 1964.
29 "Electrifying Surrender," Economist, December 10, 1960.

Electrical Machinery 421
On the other hand, the continuation of declining prices after 1962or 1963 shown by the NBER indexes is contradicted by some news-paper reports in late 1963. These suggested that prices may havereached a low point in late 1963 and then rebounded, a pattern morelike that of the .BLS index or of indexes from the NBER equations thatdid not include a foreign project variable. The reports of price increaseswere frequent from September 1963 through the end of the year.3°However, beginning in March 1964, reports of increases and decreasesin transformer prices alternated frequently, suggesting that attempts toraise prices were being defeated by undercutting of the new levels,31and that the rise in prices shown by the BLS that year may have beenvery temporary or may have reflected only list prices, not transactionsprices. It must also be remembered that the NBER data for 1964 relatealmost entirely to foreign sales, for which the price movement couldhave been different from that in domestic sales.
In general, from the combination of evidence from several sources, weconclude that the large decline in transformer prices shown by the NBERinternational price index is probably a valid description of the course ofprices in these years despite the divergence from price trends given byBLS data. In addition, since the Kuhiman index folldws at least themajor movement of the NBER series after 1961, we used it to extrapolatethe international price index back to 1953.
30 "Prices of Heavy Electrical Goods Are Seen Firming," Wall Street Journal, Sep-tember 18, 1963; "GE Increases Network Transformer Prices," ibid., September 30,1963; "Westinghouse Raises Prices 5% on Network Transformers," ibid., October 4, 1963;"GE Increases Price 6% on Power Transformers," ibid., October 14, 1963; "ElectricalComeback: Power Equipment Field Lifts Prices, Indicating Long Slump Is Ending,"ibid., December 11, 1963.
31 "Westinghouse Reduces Prices on Large-Rated Power Transformers," Wall StreetJournal, March 19, 1964; "McGraw-Edison Unit Lifts Prices of Some Transformersby 6%," ibid., April 1, 1964; "McGraw-Edison Unit Lifts Prices of Larger PowerTransformers," ibid., May 15, 1964; "Westinghouse Raises Prices for Large Transform-ers," New York Times, May 22, 1964; "G.E. Cuts Its Price for Transformers," ibid.,August 8, 1964; "Electrical Equipment Price Increased by Westinghouse," ibid., October15, 1964; "Westinghouse Raises Prices on Some Power, Network Transformers," WallStreet Journal, October 15, 1964; "Big-Transformer Prices Cut by Westinghouse," ibid.,November 4, 1964.