electrical measurements and error analysis...electrical instruments do not always give accurate...
TRANSCRIPT
Electrical Measurements and Error Analysis
INTRODUCTION
If you want to design and test a hypothesis1 in your field of scientific research2, you will haveto collect data through observation or experimentation3. You will then have to analyze the dataand come up with a reasonable conclusion that might or might not validate your hypothesis. Tostand the test of time, these results must be repeatable under similar conditions by you or by otherscientists.
The purpose of this laboratory exercise is to acquaint you with basic scientific conventionsfor measuring electrical quantities and for analyzing the data obtained from those measurements.You will learn how to account for the experimental uncertainties that inevitably arise when usingelectrical instruments. You will learn the difference between uncertainties in measurement anduncertainties propagated through calculations.
This lab is divided into two separate activities. In the first activity, you will calibrate a powersupply by measuring the output voltage. In the second activity, you will use an ohmmeter4 tomeasure the resistance of a group of resistors5 and calculate the standard deviation6. You willalso measure the equivalent resistance of series and parallel combinations and compare them to thecalculated value.
DISCUSSION OF PRINCIPLES
Calibrating a Power Supply
Electrical instruments do not always give accurate measurements. The accuracy of the readingsyou take will depend, partly, on how well the instrument has been calibrated7. A simple calibrationprocess involves setting the power supply to a particular voltage and using a second device, like avoltmeter, to measure the output voltage from the power source. By taking several readings forincreasing output voltage, it is possible to measure the linearity of the output.
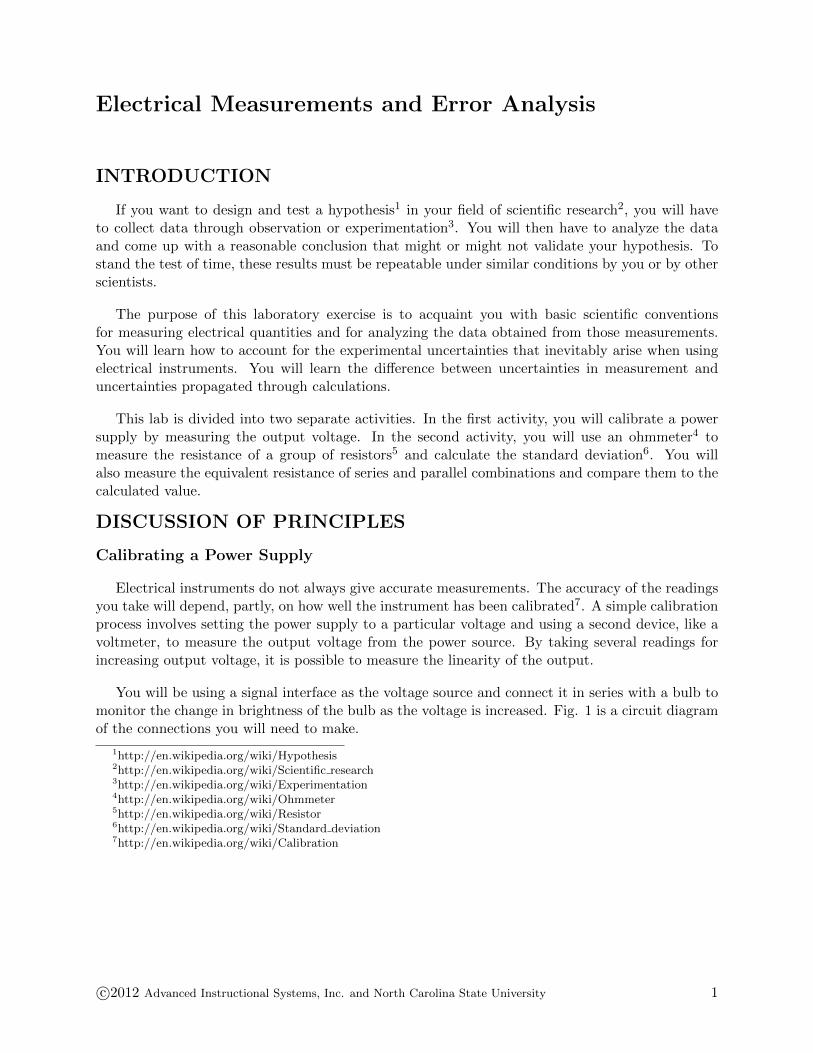
You will be using a signal interface as the voltage source and connect it in series with a bulb tomonitor the change in brightness of the bulb as the voltage is increased. Fig. 1 is a circuit diagramof the connections you will need to make.
1http://en.wikipedia.org/wiki/Hypothesis2http://en.wikipedia.org/wiki/Scientific research3http://en.wikipedia.org/wiki/Experimentation4http://en.wikipedia.org/wiki/Ohmmeter5http://en.wikipedia.org/wiki/Resistor6http://en.wikipedia.org/wiki/Standard deviation7http://en.wikipedia.org/wiki/Calibration
c©2012 Advanced Instructional Systems, Inc. and North Carolina State University 1
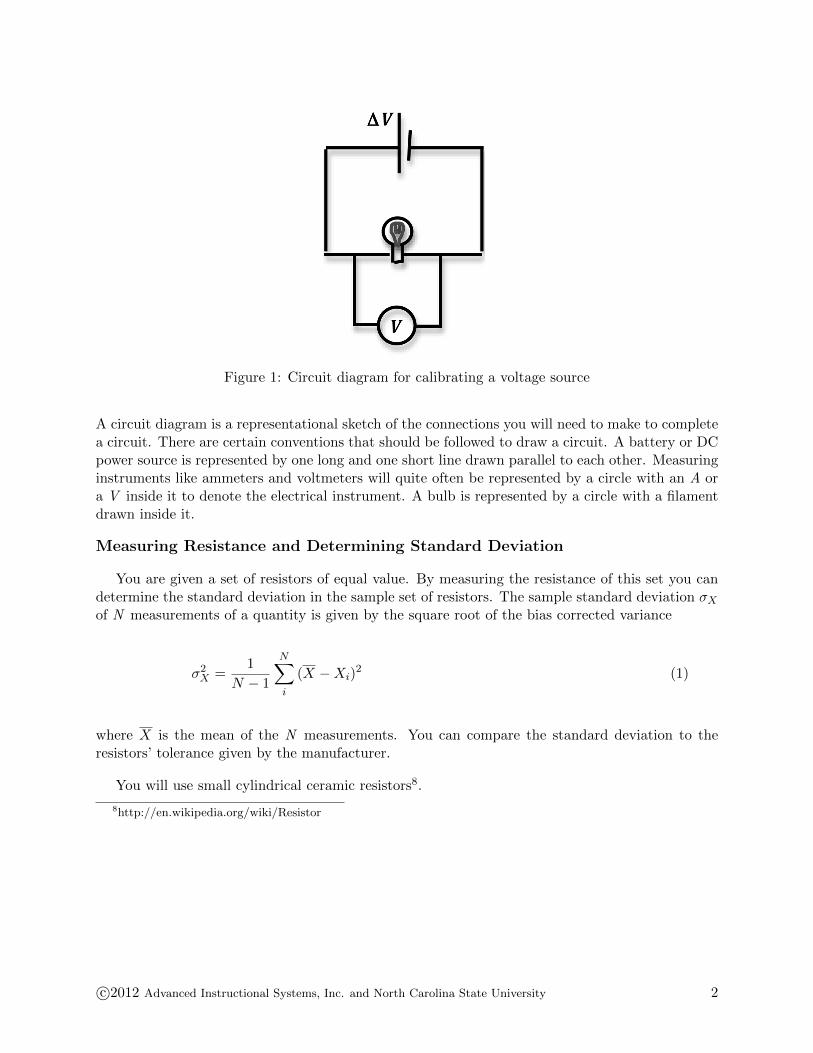
Figure 1: Circuit diagram for calibrating a voltage source
A circuit diagram is a representational sketch of the connections you will need to make to completea circuit. There are certain conventions that should be followed to draw a circuit. A battery or DCpower source is represented by one long and one short line drawn parallel to each other. Measuringinstruments like ammeters and voltmeters will quite often be represented by a circle with an A ora V inside it to denote the electrical instrument. A bulb is represented by a circle with a filamentdrawn inside it.
Measuring Resistance and Determining Standard Deviation
You are given a set of resistors of equal value. By measuring the resistance of this set you candetermine the standard deviation in the sample set of resistors. The sample standard deviation σXof N measurements of a quantity is given by the square root of the bias corrected variance
σ2X =1
N − 1
N∑i
(X −Xi)2 (1)
where X is the mean of the N measurements. You can compare the standard deviation to theresistors’ tolerance given by the manufacturer.
You will use small cylindrical ceramic resistors8.
8http://en.wikipedia.org/wiki/Resistor
c©2012 Advanced Instructional Systems, Inc. and North Carolina State University 2
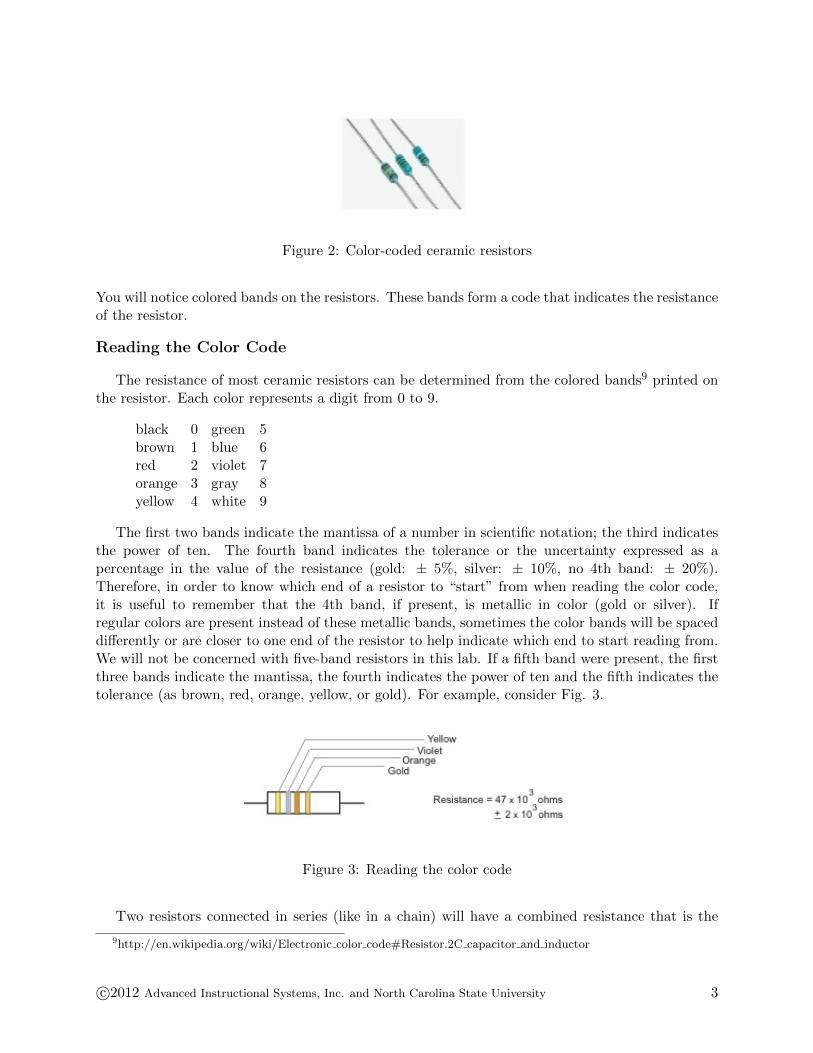
Figure 2: Color-coded ceramic resistors
You will notice colored bands on the resistors. These bands form a code that indicates the resistanceof the resistor.
Reading the Color Code
The resistance of most ceramic resistors can be determined from the colored bands9 printed onthe resistor. Each color represents a digit from 0 to 9.
black 0 green 5brown 1 blue 6red 2 violet 7orange 3 gray 8yellow 4 white 9
The first two bands indicate the mantissa of a number in scientific notation; the third indicatesthe power of ten. The fourth band indicates the tolerance or the uncertainty expressed as apercentage in the value of the resistance (gold: ± 5%, silver: ± 10%, no 4th band: ± 20%).Therefore, in order to know which end of a resistor to “start” from when reading the color code,it is useful to remember that the 4th band, if present, is metallic in color (gold or silver). Ifregular colors are present instead of these metallic bands, sometimes the color bands will be spaceddifferently or are closer to one end of the resistor to help indicate which end to start reading from.We will not be concerned with five-band resistors in this lab. If a fifth band were present, the firstthree bands indicate the mantissa, the fourth indicates the power of ten and the fifth indicates thetolerance (as brown, red, orange, yellow, or gold). For example, consider Fig. 3.
Figure 3: Reading the color code
Two resistors connected in series (like in a chain) will have a combined resistance that is the
9http://en.wikipedia.org/wiki/Electronic color code#Resistor.2C capacitor and inductor
c©2012 Advanced Instructional Systems, Inc. and North Carolina State University 3

sum of the individual resistances. If R1 and R2 are two resistors, then the combined resistancevalue of these two in series will be
Req = R1 +R2 (2)
and the uncertainty in Req will be given by the sum rule. See Appendix C.
When the two resistors are connected in parallel, they will have combined resistance given by
1
Req=
1
R1+
1
R2(3)
and for calculating the uncertainty in Req see Appendix C.
Using a multimeter as an ohmmeter (see Appendix K), you will measure the resistance ofthe set of individual resistors and determine the standard deviation in the measurements. Youwill take pairs of resistances and measure the combined series and parallel values. You will thencompare the measured value to the calculated value and determine the percent uncertainty in yourmeasurements.
OBJECTIVE
The purpose of this laboratory exercise is to learn to use some basic electrical measuring instru-ments in two different activities. In the first activity you will calibrate a power source using twodifferent voltage-measuring instruments and test it for linearity of the output.
In the second part of the lab you will use an ohmmeter to measure the resistance of a setof resistors and determine the errors associated with your measurements. You will also learn tocalculate the standard deviation in the measurements, use the sum and product rule to calculatethe uncertainty arising from the calculations, determine the percent uncertainty and percent error,and evaluate your results.
EQUIPMENT
Signal interface
DataStudio software
PASCO circuit board
Connecting wires
Resistors
Multimeter
PROCEDURE
Procedure A: Calibrating a Power Supply Using a Voltmeter
c©2012 Advanced Instructional Systems, Inc. and North Carolina State University 4
Please print the worksheet for this lab. You will need this sheet to record your data.
Fig. 4 below shows the PASCO circuit board with the bulb. You will be using the circuit boardthroughout this course and, therefore, this will be a good time to get introduced to it.
Figure 4: PASCO circuit board
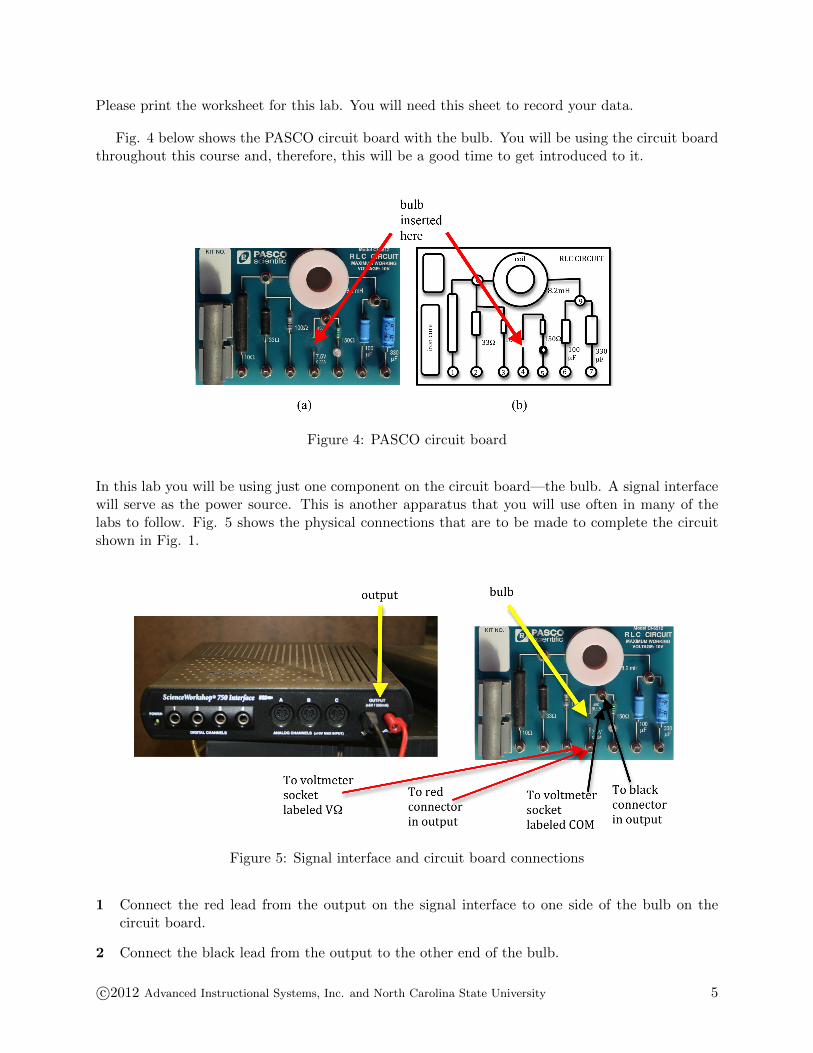
In this lab you will be using just one component on the circuit board—the bulb. A signal interfacewill serve as the power source. This is another apparatus that you will use often in many of thelabs to follow. Fig. 5 shows the physical connections that are to be made to complete the circuitshown in Fig. 1.
Figure 5: Signal interface and circuit board connections
1 Connect the red lead from the output on the signal interface to one side of the bulb on thecircuit board.
2 Connect the black lead from the output to the other end of the bulb.
c©2012 Advanced Instructional Systems, Inc. and North Carolina State University 5
3 Connect the socket of the voltmeter labeled VΩ to one end of the bulb using a second red lead.
Connect a black lead from the socket of the voltmeter labeled COM to the other end of thebulb. This will enable you to measure the output voltage from the power source.
4 Make sure your voltmeter is set to read DC voltage. See Appendix K.
CHECKPOINT 1: Ask your TA to check your circuit connections.
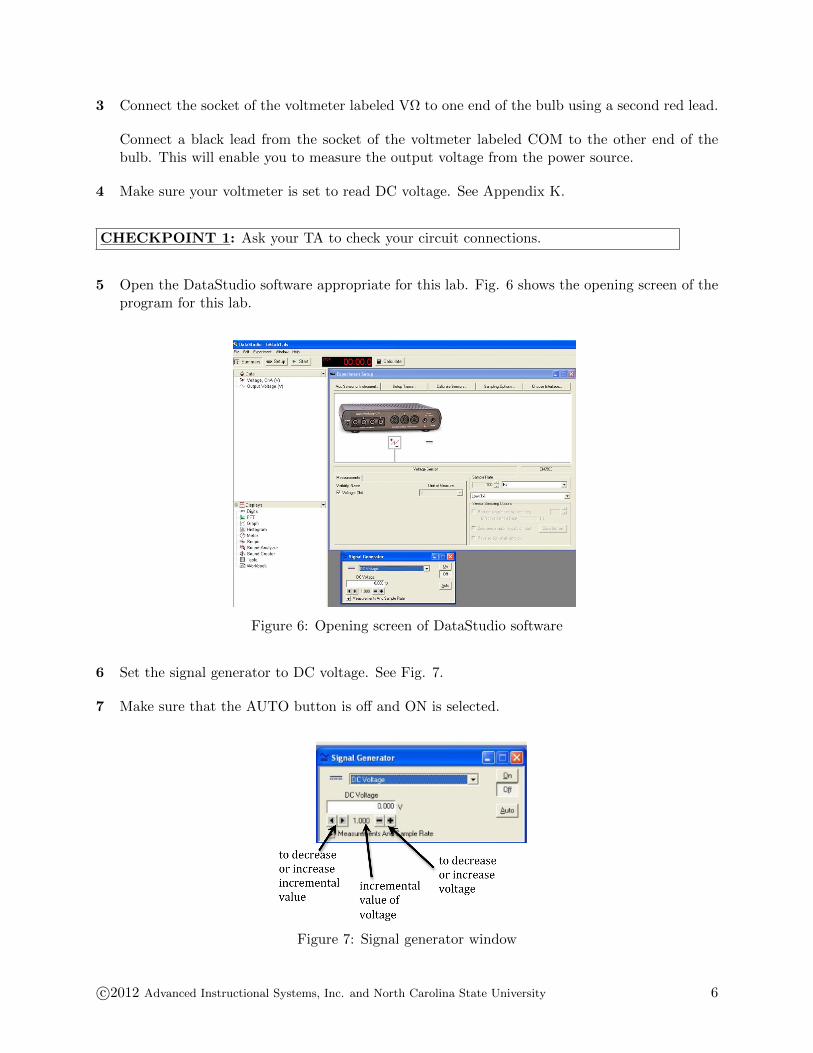
5 Open the DataStudio software appropriate for this lab. Fig. 6 shows the opening screen of theprogram for this lab.
Figure 6: Opening screen of DataStudio software
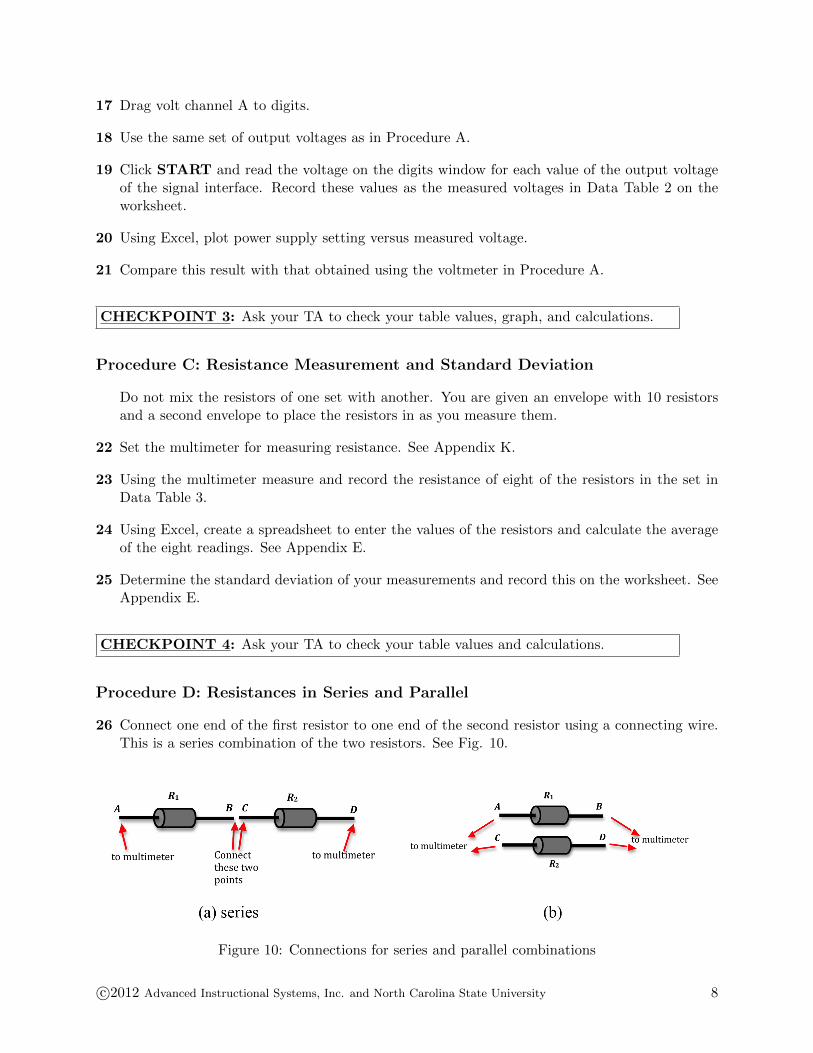
6 Set the signal generator to DC voltage. See Fig. 7.
7 Make sure that the AUTO button is off and ON is selected.
Figure 7: Signal generator window
c©2012 Advanced Instructional Systems, Inc. and North Carolina State University 6

You will use the minus and plus buttons to decrease or increase the voltage. The left and rightarrows are used to set the incremental steps for the voltage change.
8 Set the incremental value to 0.5. See Fig. 7.
9 Use the minus and plus keys to set the voltage to the lowest value possible. Record this valueas the output voltage in Data Table 1 on the worksheet.
10 Record the voltmeter reading as the measured voltage in Data Table 1 on the worksheet.
11 Increase the voltage in the signal generator window in steps of 0.5 V six more times for a totalof seven readings.
For each setting of the signal generator, record the output voltage and measured voltage inData Table 1 of the worksheet.
Be sure to notice the change in brightness of the bulb as you increase the output voltage.
12 Using Excel, plot power supply setting versus measured voltage. See Appendix G.
CHECKPOINT 2: Ask your TA to check your table values, graph, and calculations.
Procedure B: Calibrating a Power Supply Using a Voltage Probe
13 The connections are the same as in Procedure A except for the signal interface. Remove thevoltmeter connections VΩ and COM.
14 Connect the double lead voltage probe to the analog channel A on the signal interface.
15 Connect the other ends of the black and red leads of the voltage probe to the two ends of thebulb on the circuit board.
16 If the digits window is not open, double-click Digits on the task bar on the lower left side ofthe screen. See Fig. 9 below.
Figure 9: Opening the digits window
c©2012 Advanced Instructional Systems, Inc. and North Carolina State University 7
17 Drag volt channel A to digits.
18 Use the same set of output voltages as in Procedure A.
19 Click START and read the voltage on the digits window for each value of the output voltageof the signal interface. Record these values as the measured voltages in Data Table 2 on theworksheet.
20 Using Excel, plot power supply setting versus measured voltage.
21 Compare this result with that obtained using the voltmeter in Procedure A.
CHECKPOINT 3: Ask your TA to check your table values, graph, and calculations.
Procedure C: Resistance Measurement and Standard Deviation
Do not mix the resistors of one set with another. You are given an envelope with 10 resistorsand a second envelope to place the resistors in as you measure them.
22 Set the multimeter for measuring resistance. See Appendix K.
23 Using the multimeter measure and record the resistance of eight of the resistors in the set inData Table 3.
24 Using Excel, create a spreadsheet to enter the values of the resistors and calculate the averageof the eight readings. See Appendix E.
25 Determine the standard deviation of your measurements and record this on the worksheet. SeeAppendix E.
CHECKPOINT 4: Ask your TA to check your table values and calculations.
Procedure D: Resistances in Series and Parallel
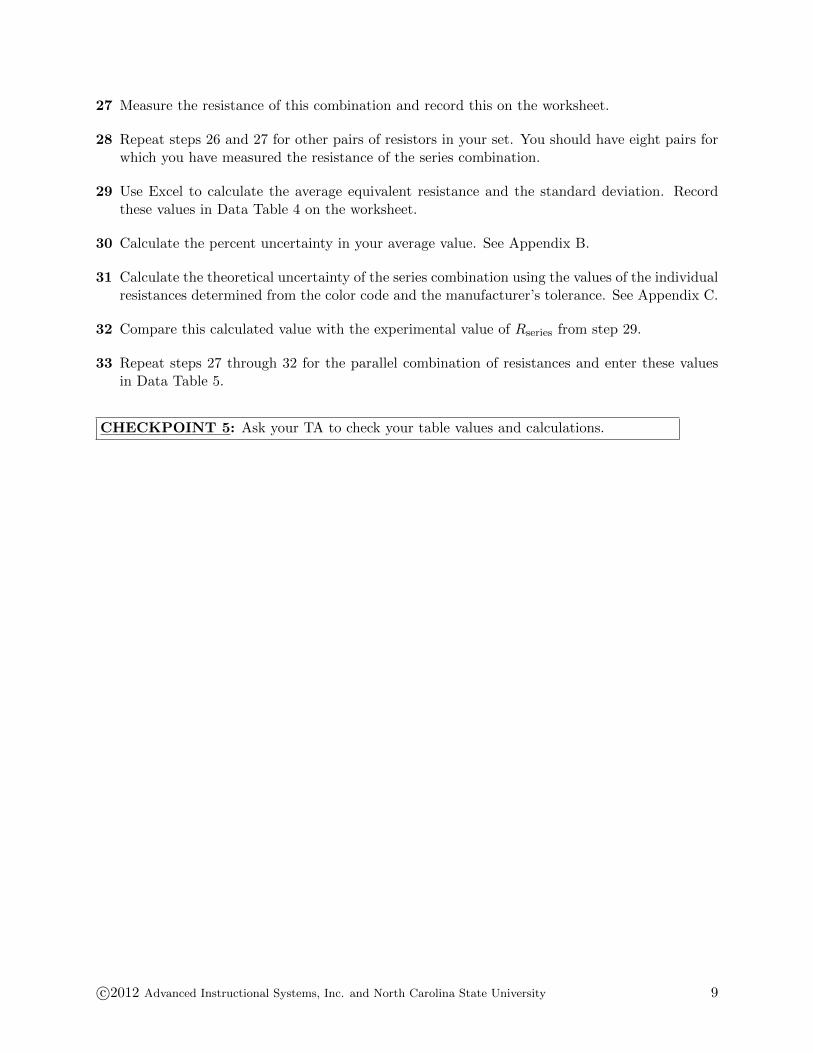
26 Connect one end of the first resistor to one end of the second resistor using a connecting wire.This is a series combination of the two resistors. See Fig. 10.
Figure 10: Connections for series and parallel combinations
c©2012 Advanced Instructional Systems, Inc. and North Carolina State University 8
27 Measure the resistance of this combination and record this on the worksheet.
28 Repeat steps 26 and 27 for other pairs of resistors in your set. You should have eight pairs forwhich you have measured the resistance of the series combination.
29 Use Excel to calculate the average equivalent resistance and the standard deviation. Recordthese values in Data Table 4 on the worksheet.
30 Calculate the percent uncertainty in your average value. See Appendix B.
31 Calculate the theoretical uncertainty of the series combination using the values of the individualresistances determined from the color code and the manufacturer’s tolerance. See Appendix C.
32 Compare this calculated value with the experimental value of Rseries from step 29.
33 Repeat steps 27 through 32 for the parallel combination of resistances and enter these valuesin Data Table 5.
CHECKPOINT 5: Ask your TA to check your table values and calculations.
c©2012 Advanced Instructional Systems, Inc. and North Carolina State University 9