electrical severity measurement tool revision 4 november 2017
TRANSCRIPT

Electrical Severity Measurement Tool Revision 4
November 2017

Electrical Severity Measurement Tool
1.0 Purpose: This tool is intended to measure the severity of exposure to an electrical safety event based on an evaluation of a series of electrical factors. The primary factors include: electrical hazard, environment, shock proximity, arc flash proximity, thermal proximity, use of personal protective equipment and any resulting injury(s) to affected personnel. 2.0 Scope: This tool establishes a standardized approach for tracking and trending exposures to electrical safety events. Specifically this approach provides a consistent method to measure the severity of an electrical safety event and to measure performance over a period of time. The Electrical Severity (ES) calculation is to be performed by an Electrical Safety Subject Matter Expert (SME) with a working knowledge of NFPA 70E. 3.0 Limitations: This tool is not intended to evaluate events that do not involve a worker being exposed to electrical energy. Note: Failure to establish an electrically safe work condition (e.g., lockout/tagout) resulting in the discovery of an incomplete isolation of hazardous electrical energy is considered exposed as defined by NFPA 70E. This does not include discoveries made by absence of voltage/energy verifications in the process of establishing an electrically safe work condition. This tool establishes a metric that can be consistently applied to allow an organization to compare relative performance against itself. Comparison of one organization’s performance to another is considered inappropriate without further normalization due to anomalies and variables that may exist in work scope (e.g., D&D vs. Research), environmental conditions, etc. This tool is not to be used to develop electrical safety program requirements. Since NFPA 70E does not cover all electrical hazards found, such as high current/low voltage, high voltage/low current, radiofrequency, capacitors, and laboratory programs, there are portions of this document based on IEEE paper ESW2009-23 (A Complete Hazard Classification System and its Application). Thus, use of this tool go beyond or supplement current national codes and standards. The intent of this tool is to provide a relative measurement of the severity of the event to electrical hazards.

4.0 User Guidelines 4.1 The tool is not intended to cover all factors that contribute to an electrical safety event. For example, the tool does not take into account (a) training, (b) work control (except for establishing an electrically safe work condition and wearing proper PPE), or (c) equipment maintenance. The tool is intended to give a relative measure of the severity of an electrical safety event that could cause injury, or the potential for injury. Consider only the data required by the Severity Equation. 4.2 The tool is intended to give a quantitative, reproducible measure of the severity of an event. Ideally, the tool should give the same result regardless of the user. 4.3 The tool is not intended to be the sole measure of the severity of an electrical safety event, but to give a measure of the electrical hazard component of the event. There may be other hazards involved (e.g., confined space, radiological), other issues (e.g., lack of training, lack of engineering controls), and other similar management concerns. Other factors may need to be considered in the overall event assessment. 4.4 The tool gives a medium significance score for a dry hand, 120 V shock. There are varying opinions on this result, and considerable thought went into the tool development and pilot results. Consider that, across the USA, there are estimated to be 100’s of dry hand, 120 V shocks daily while performing everyday activities such as inserting a plug into a receptacle, especially across the fingers of one hand. It is very rare that such shocks result in injury or fatality in the workplace, but it is important to record them, to look for trends or concerns. The tool does take into account the factors that can cause such shocks to be harmful or fatal, namely a wet environment. A dry-hand, 120 V shock ranks medium significance. 4.5 Equipment failures that contain the electrical hazard and do not result in a worker being exposed to an electrical hazard gives a score of zero. If the electrical energy escapes, such as when no equipment ground is in place, or inadequate arc flash containment, then a worker may be exposed if within the boundaries as defined in NFPA 70E. Equipment failures may not result in a worker being exposed to an electrical hazard.

5.0 Electrical Severity (ES) Each electrical safety event is reviewed based on the following factors (Charts associated with the electrical hazard factor are in Appendix 1):
Electrical Hazard Factor Environment Factor Shock Proximity Factor Arc Flash Proximity Factor Thermal Proximity Factor Injury Factor PPE/Equipment Mitigation
Electrical Severity (ES) is calculated using the following equation: Electrical Severity (ES) = (Electrical Hazard Factor) * (1 + Environment Factor + Shock Proximity1 Factor + Arc Flash Proximity1,2 Factor + Thermal Proximity1,2 Factor) * (Injury Factor) 1When the proper Personal Protective Equipment (PPE) is used while performing the work then these factors may be reduced to zero (refer to PPE Mitigation section).
2Note that you cannot have both an Arc Flash Proximity Factor and a Thermal Proximity Factor, as the presence of an arc flash hazard includes the thermal hazard.
5.1 Electrical Hazard Factor
The Electrical Hazard Factor is determined by classifying the source of electrical energy (Chart 1) that the worker was exposed to during the event and then assigning a value to it, based on the Electrical Hazard Classification Charts3 found in Appendix 1 of this document and color coded as shown below. Failure to establish an electrically safe work condition (e.g., lockout/tagout) resulting in the discovery of an incomplete isolation of hazardous electrical energy is considered an exposure. This does not include absence of voltage/energy verification in the process of establishing an electrically safe work condition if personnel are wearing personal protective equipment adequate for the assumed shock and arc flash hazard. When an absence of voltage verification confirms an electrically safe work condition has been established, e.g. no voltage, no exposure, and the personal protective equipment was determined to be adequate, the Electrical Hazard Factor = 0.
For Chart 2, 50-230 volts and ≥ 125 kVA transformer, , if the arc flash hazard analysis determines the arc flash boundary is less than 10 inches , the electrical hazard factor can be lowered to moderate from high (to 10 from 50).

3The hazard classification charts cover six broad categories, ac 50/60 Hz (Chart 2), dc (Chart 3), capacitors (Charts 4 & 5), batteries (Chart 6), rf (Chart 7) and sub-rf (Chart 8). These charts, taken collectively, represent almost all of the electrical hazards found in electrical equipment. Consequently, all category classes should be considered when identifying the hazards associated with any piece of electrical equipment. A single piece of equipment may have multiple electrical hazard classifications, and the worker may have been exposed to a combination of hazards. To aid hazard identification, each chart has cross-reference notes. For example, the dc chart has cross-reference notes to capacitance, battery, and ac 50/60 Hz. Event evaluators should have a thorough understanding of the equipment involved in the electrical event. Consulting manuals and schematics and speaking with factory service representatives and SMEs are ways to ensure that all of the hazards are fully understood and that all the pertinent areas/classifications classes are taken into account.
Electrical Hazard blue - no hazard 0 Factor green - low hazard 1 yellow - moderate hazard 10 red - high hazard 50 maroon - very high hazard 100 5.2 Environment Factor
The Environment Factor4 is determined by analyzing the environmental condition found in the area of the event. The Environment Factor is determined in order to assess the level of severity at the time of the event. Human skin resistance can vary considerably from a dry location to one that contains conductive fluids (e.g., end mill misters present in a machine shop). If the proper Personal Protective Equipment (PPE) is used while performing work then this factor can be reduced to zero (refer to PPE Mitigation, section 5.7). 4Dry is indoors unless otherwise noted, Damp is outdoors unless otherwise noted, Wet is assumed when water, snow, or other conductive liquids were involved. Examples: Outdoors can be dry, in certain arid climates, and Indoors can be wet, in work conditions involving conductive fluids or high humidity.
Environment Dry 0 Factor Damp 5
Wet 10 5.3 Shock Proximity Factor The Shock Proximity Factor is determined by performing a Shock Hazard Analysis. Determine whether you have a shock hazard using Table 1, then determine the approach boundaries in Table 2 (ac 50/60 Hz) or Table 3 (dc), which are based on NFPA 70E. Assign the factor based on the approximate distance of the worker(s) to the exposed energy source. All dimensions are distance from the exposed live part to the employee. If the proper Personal Protective Equipment (PPE) is used while performing work then this factor can be reduced to zero (refer to PPE Mitigation, section 5.7).
Table 1 - Thresholds for defining shock hazards.

Source Includes Thresholds ac 50/60 Hz
> 50 V and > 5 mA
dc all > 100 V and > 40 mA (short circuit) Capacitors all > 100 V and > 1 J, or
> 400 V and > 0.25 J Batteries all > 100 V Subrf 1 Hz to 3 kHz > 50 V and > 5 mA rf 3 kHz to 100 MHz A function of frequency
Notes:
1) It is possible for a worker to be exposed to more than one shock hazard at any given location.
2) There may be other electrical hazards below the above shock thresholds (e.g., a thermal burn hazard). See Tables in Appendix 1 below.
3) Injuries may result from startle reactions due to contact with energized components, even though there is no shock hazard, especially high-voltage, low-energy shock.
4) Shock and burn hazards from induced and contact rf currents become negligible above 100MHz
_______________________________________________________________________

5.3.1 Shock Boundary Analysis for 50/60 Hz Shock boundary analysis, including the determination of the Limited, Restricted, and Prohibited Shock Boundaries, is based on the nominal system voltage range, phase to phase with the distance being from the exposed energized electrical conductor or circuit part to the employee. Table 2 is taken from 2015 NFPA 70E. Notes help to explain the content and use of the table. ________________________________________________________________________
Table 2
Approach boundaries to exposed energized electrical conductor or circuit part for shock protection, ac 50/60 Hz.
Nominal System Voltage Range, Phase to Phase1
Limited Approach Boundary
Restricted Approach
Boundary, Includes Inadvertent
Movement Adder Exposed Movable
Conductor3 Exposed Fixed
Circuit Part
<50 Not specified Not specified Not specified
50–1505 3.05 m (10’0”) 1.07 m (3’6”) Avoid contact
151–750 3.05 m (10’0”) 1.07 m (3’6”) 304 mm (1’0”)
751–15 kV 3.05 m (10’0”) 1.53 m (5’0”) 660 mm (2’2”)
15.1–36 kV 3.05 m (10’0”) 1.83 m (6’0”) 787 mm (2’7”)
36.1–46 kV 3.05 m (10’0”) 2.44 m (8’0”) 838 mm (2’9”)
46.1–72.5 kV 3.05 m (10’0”) 2.44 m (8’0”) 1.0 m (3’3”)
72.6–121 kV 3.25 m (10’8”) 2.44 m (8’0”) 1.29 m (3’4”)
138–145 kV 3.36 m (11’0”) 3.05 m (10’0”) 1.15 m (3’10”)
161–169 kV 3.56 m (11’8”) 3.56 m (11’8”) 1.29 m (4’3”)
230–242 kV 3.97 m (13’0”) 3.97 m (13’0”) 1.71 m (5’8”)
345–362 kV 4.68 m (15’4”) 4.68 m (15’4”) 2.77 m (9’2”)
500–550 kV 5.8 m (19’0”) 5.8 m (19’0”) 3.61 m (11’10”)
765–800 kV 7.24 m (23’9”) 7.24 m (23’9”) 4.84 m (15’11”)
Notes:
1) All dimensions are distance from exposed energized electrical conductor or circuit part to worker.
2) For single-phase systems above 250V, select the range that is equal to the system’s maximum phase-to-ground voltage multiplied by 1.732.
3) Exposed Movable Conductor means that the bare conductor can move (e.g., an overhead transmission line conductor). This is unlikely indoors.
4) Exposed Fixed Circuit Part means the bare conductor or other circuit part is stationary and will not move. This is the most common Limited Approach Boundary value used.
5) This includes circuits where the exposure does not exceed 120V ________________________________________________________________________

5.3.2 Shock Boundary Analysis for DC Table 3 gives approach boundaries to exposed energized electrical conductor or circuit part for dc, which is applicable to dc circuits, batteries, and capacitors. This table is taken from the 2015 NFPA 70E. Notes help to explain the content and use of the table. _______________________________________________________________________
Table 3
Approach boundaries to exposed energized electrical conductor or circuit part for shock protection, dc.
Nominal Voltage Conductor to
Ground
Limited Approach
Boundary Exposed Movable
Conductor
Limited Approach Boundary
Exposed Fixed Circuit Part
Restricted Approach
Boundary, Includes Inadvertent
Movement Adder
<100 Not specified Not specified Not specified
100–300 3.0 m (10’0”) 1.0 m (3’6”) Avoid contact
301–1000 V 3.0 m (10’0”) 1.0 m (3’6”) 304 mm (1’0”)
1.1–5 kV 3.0 m (10’0”) 1.5 m (5’0”) 450 mm (1’5”)
5.1–15 kV 3.0 m (10’0”) 1.5 m (5’0”) 660 mm (2’2”)
15.1 kV–45 kV 3.0 m (10’0”) 2.5 m (8’0”) 0.84 m (2’9”)
45.1 kV–75 kV 3.0 m (10’0”) 2.5 m (8’0”) 1 m (3’2”)
75.1 kV–150 kV 3.3 m (10’8”) 3 m (10’0”) 1.2 m (4’0”)
150.1 kV–250 kV 3.6 m (11’8”) 4 m (11’8”) 1.7 m (5’3”)
250.1 kV–500 kV 6.0 m (20’0”) 6 m (20’0”) 3.6 m (11’6”)
500.1 kV–800 kV 8.0 m (26’0”) 8 m (26’0”) 5 m (16’5”)
Notes:
1) All dimensions are distance from exposed energized electrical conductor or circuit part to worker.
2) Voltage is conductor to ground.
3) Exposed Movable Conductor means that the bare conductor can move (e.g., an overhead transmission line conductor). This is unlikely indoors.
4) Exposed Fixed Circuit Part means the bare conductor or other circuit part is stationary and will not move. This is the most common Limited Approach Boundary value used.
______________________________________________________________________________________
________________________________________________________________________ Shock Proximity Outside Limited Approach Boundary 0 Factor Within Limited Approach Boundary 1 Within Restricted Approach Boundary 3
Contact with energized conductors or circuit parts 10

5.4 Arc Flash Proximity Factor The Arc Flash Proximity Factor is determined by performing a Flash Hazard Analysis using one of the methods as described in NFPA 70E. The method used cannot differ from the method that the institution is using to determine Personal Protective Equipment (PPE) to protect against arc flash. The approximate distance of the worker to the energy source is used again to determine the arc flash hazard. If the proper Personal Protective Equipment (PPE) is used while performing work then this factor can be reduced to zero (refer to PPE Mitigation, section 5.7). Note that you cannot have both an Arc Flash Proximity Factor and a Thermal Proximity Factor. The ac arc flash hazards in the table below are based on IEEE 1584, which describes when an arc flash hazard is present. The balance of the table is based on IEEE paper ESW2009-23. ________________________________________________________________________
Table 4
Thresholds for arc flash hazards Source Includes Thresholds ac three-phase
50 and 60 Hz < 240 V and the transformer supplying the circuit is rated ≥ 125 kVA, or < 240 V and the circuit is supplied by more than one transformer, or ≥ 240 V
dc all >100 V and >500 A (short circuit)
Capacitors all > 100 V and > 10 kJ Batteries all > 100 V and > 500 A sub rf 1 – 3 kHz > 250 V and > 500 A rf NA Not Applicable (NA)
________________________________________________________________________ Arc Flash Proximity Outside Arc Flash Boundary 0 Factor Inside Arc Flash Boundary 10

5.5 Thermal Proximity Factor The Thermal Proximity Factor is determined by performing a Thermal Hazard Analysis based on whether a conductive media came into contact with an energized source. The hazard to the worker in this case is a thermal one such as a burn received from holding a wrench or wearing conductive jewelry that came into contact with a high current energy source. Thresholds for thermal burns are noted in Table 5. The Thermal Proximity Factor results from human contact with the conductive media and the power available to the contacting media. If the proper Personal Protective Equipment (PPE) is used while performing work then this factor can be reduced to zero (refer to PPE Mitigation, section 5.7). Note that you cannot have both an Arc Flash Proximity Factor and a Thermal Proximity Factor.
Table 5
Thresholds for thermal burn hazards.
Source Includes Thresholds dc all < 100 V and > 1000 W Capacitors all < 100 V and > 100 J Batteries all < 100 V and > 1000 W subrf 1 – 3 kHz < 50 V and > 1000 W rf NA NA
________________________________________________________________________
Thermal Proximity Factor Power 1-30 kW >30 kW
No contact 0 0 Contact 3 10
5.6 Injury Factor The Injury Factor is determined by the injury to the worker(s) involved in the event. Injury Factor None 1 Shock (no fibrillation) or burn (1st degree) 3 Arc Flash/Blast or burn (2nd degree)1 5 Shock resulting in effects on heart2 10 Permanent disability or burn (3rd degree)1 20 Fatality 100 1Assign the value if the burn injury is affecting more than five percent of the body surface. 2Effects on the heart are determined by an Electrocardiogram (ECG). 5.7 PPE/Equipment Mitigation

Appropriately rated PPE and/or equipment reduces the associated factor(s) to zero when used. Appropriately rated PPE and equipment is designed and manufactured to protect the worker from the electrical hazard associated with that factor and has been tested and certified (if applicable) to do so. The type and ratings (if applicable) of PPE must be determined. ________________________________________________________________________ PPE/Equipment Mitigation
Correct for Environment hazard reduces the Environment Factor to 0 Correct for Shock hazard reduces the Shock Proximity Factor to 0 Correct for Arc Flash hazard reduces the Arc Flash Proximity to 0 Correct for Thermal hazard reduces the Thermal Proximity Factor to 0
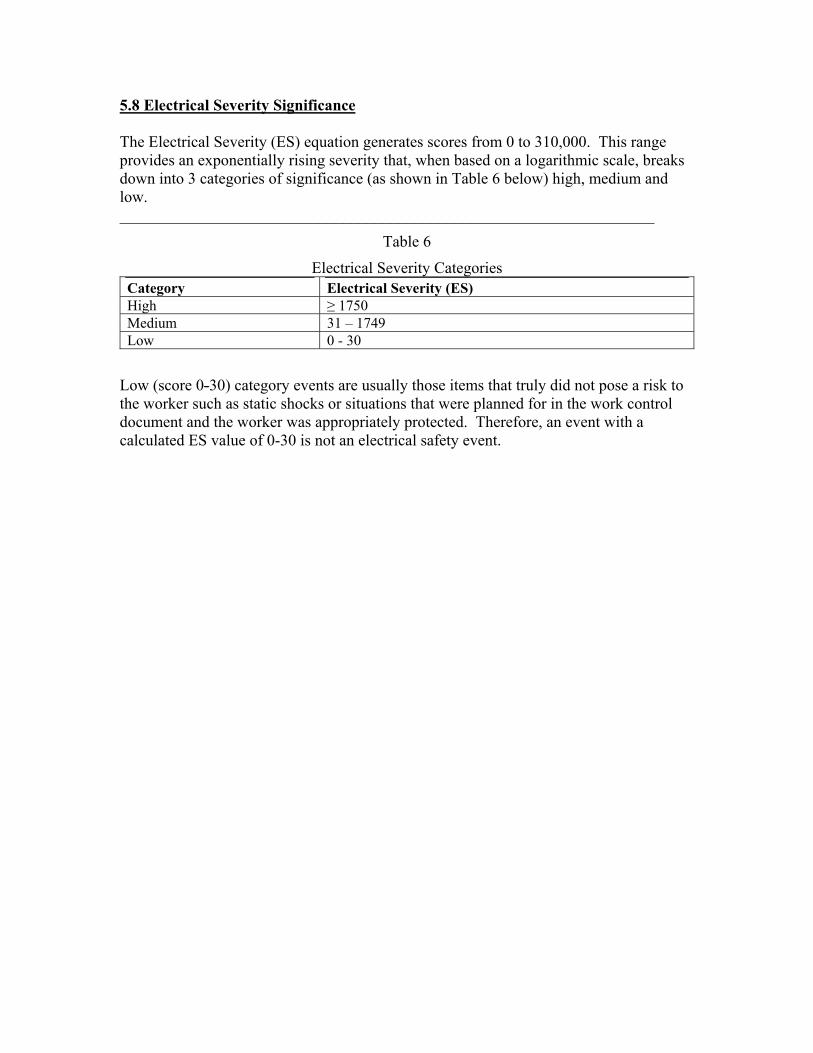
5.8 Electrical Severity Significance The Electrical Severity (ES) equation generates scores from 0 to 310,000. This range provides an exponentially rising severity that, when based on a logarithmic scale, breaks down into 3 categories of significance (as shown in Table 6 below) high, medium and low. ___________________________________________________________________
Table 6
Electrical Severity Categories Category Electrical Severity (ES) High ≥ 1750 Medium 31 – 1749 Low 0 - 30
Low (score 0-30) category events are usually those items that truly did not pose a risk to the worker such as static shocks or situations that were planned for in the work control document and the worker was appropriately protected. Therefore, an event with a calculated ES value of 0-30 is not an electrical safety event.

6.0 Electrical Severity Index (ESI) The Electrical Severity Index (ESI) performance metric was developed to normalize the events against organizational work hours. The ESI should be calculated monthly. The rolling twelve month ESI average should also be calculated monthly to limit the effect of small period fluctuations. Both the monthly ESI and the rolling twelve-month ESI average should be tracked graphically. The ESI is calculated when each event is weighted for severity and then averaged with other events to obtain a result representing performance. The Electrical Severity (ES) is used as the weighting factor for each event in the Electrical Severity Indicator (ESI) metric below.
ESI = 200,000[(ESevent1) + (ESevent2)+ (ESeventN)….] (hours worked)
where: ESI = Electrical Severity Index 200,000 = constant (man hours for a 100 person work force for a full year) event # = electrical safety event label hours worked = actual work hours for work population Note: same as hours used to calculate OSHA Recordable Case Rate (RCR) ES = the Electrical Severity calculated above for a specific event
________________________________________________________________________ The ESI is intended to use a similar approach to calculating OSHA Recordable Case Rate RCR (source of work hours is same). It assigns a numerical weighting factor to each event, the more risk or consequence associated with the event, the higher the weighting factor An evaluation should be performed to determine if continuous improvement is being achieved.

Appendix 1 Factor Charts for Electrical Hazard Classification

Chart 1 – Overview of Electrical Hazards These charts, taken collectively, represent most of the electrical hazards found in electrical equipment. Consequently, all charts should be considered when identifying the hazards associated with any piece of electrical equipment. Where a single piece of equipment has multiple energy sources, the worker may have been exposed to a combination of hazards. To aid hazard identification, each chart has cross-reference notes. For example, the dc chart (Chart 3) has cross-reference notes to capacitance, battery, and 50/60 Hz hazard tables. Event evaluators should have a thorough understanding of the equipment involved in the electrical event. Referencing manuals and schematics, speaking with factory service representatives, and consulting with SMEs are methods to ensure that all of the hazards are fully understood and that all of the pertinent sources are taken into account. Some guidelines on the use of the hazard classification charts are given. The guidelines are general, and there may be exceptions to each one:
Throughout the following charts and tables, threshold numbers are ≤ and >. For example, ≤50 V is not an AC shock hazard, >50 V is an AC shock hazard. Unless otherwise noted.
If you do not understand these guidelines and your equipment, consult an electrical SME

Most all equipment gets its power from the facility (Chart 2) or batteries (Chart 6). Thus, equipment starts with one of those sources. Exceptions are wind and solar generated power sources. You should use the appropriate ac or dc chart.
Most small appliances, hand tools, and portable electrical equipment plugs into receptacles. In general, if you can carry it, most
likely it uses 120 to 240 V ac
Larger equipment may use up to 480 V ac.
Direct current power supplies may have hazards associated with 50/60 Hz (chart 2), dc (Chart 3), and capacitance (Charts 4/5), therefore, all hazards must be evaluated
Uninterruptable power supplies may have hazards associated with batteries (Chart 6), and/or 50/60 Hz power (Chart 2), since they are usually powered by a 50/60 Hz source (input) and produce 50/60 Hz power (output)

Chart 2 – ac, 50/60 Hz Notes on use:
For 50-230 volts and ≥ 125 kVA transformer, , if the arc flash hazard analysis determines the arc flash boundary is less than 10 inches , the electrical hazard factor can be lowered to moderate from high (to 10 from 50).
The voltage is the root mean square (rms) voltage for 50/60 Hz power. For current limited 50/60 Hz circuits (≤ 5mA), use Chart 8. Evaluate all energy sources that the worker was exposed to.
o For dc, use Chart 3 o For Capacitors, less than 400 Volts, use Chart 4 o For Capacitors, greater than 400 Volts, use Chart 5 o For Batteries, use Chart 6, unless V > 100 V, then you must use Chart 3 for dc shock and arc flash o For rf, use Chart 7 o For Sub-rf ac, use Chart 8
230 - 1000 VHigh Hazard
50
15 - 50 VLow Hazard
1
≤ 15 VNo Hazard
0
Determinethe Voltage
150 - 230 V
Determine the size of the system transformer
< 125 kVAModerate Hazard
10
≥ 125 kVAHigh Hazard
50
> 1000 V Very High Hazard
100
50 – 150 VModerate Hazard
10

Chart 3 – dc Notes on use:
The voltage is the dc voltage. The power is available short-circuit power. The current is available short-circuit current. Evaluate all energy sources that the worker was exposed to.
o For ac 50/60 Hz, use Chart 2 o For Capacitors, less than 400 Volts, use Chart 4 o For Capacitors, greater than 400 Volts, use Chart 5 o For Batteries, use Chart 6, unless V > 100 V, then you must use Chart 3 for dc shock and arc flash o For rf, use Chart 7 o For Sub-rf ac, use Chart 8

Chart 4 – Capacitors, ≤ 400 V Notes on use:
The voltage is ac (rms) or dc maximum charge voltage on the capacitor. The energy is maximum energy stored in the capacitor as determined by E = ½ CV2. Evaluate all energy sources that the worker was exposed to.
o For ac 50/60 Hz, use Chart 2 o For dc, use Chart 3 o For Capacitors, greater than 400 Volts, use Chart 5 o For Batteries, use Chart 6, unless V > 100 V, then you must use Chart 3 for dc shock and arc flash o For rf, use Chart 7 o For Sub-rf ac, use Chart 8

Chart 5 – Capacitors, > 400 V Notes on use:
The voltage is ac (rms) or dc maximum charge voltage on the capacitor. The energy is maximum energy stored in the capacitor as determined by E = ½ CV2. ESD in a hazardous location could potentially have a significant hazard. This tool cannot evaluate this hazard. Evaluate all energy sources that the worker was exposed to.
o For ac 50/60 Hz, use Chart 2 o For dc, use Chart 3 o For Capacitors, less than 400 Volts, use Chart 4 o For Batteries, use Chart 6, unless V > 100 V, then you must use Chart 3 for dc shock and arc flash o For rf, use Chart 7 o For Sub-rf ac, use Chart 8

Chart 6 – Batteries Notes on use:
The power is available short-circuit power. Note that if the battery voltage is greater than 100 V also refer to Chart 3 to classify the shock and arc flash hazards. Evaluate all energy sources that the worker was exposed to.
o For ac 50/60 Hz, use Chart 2 o For dc, use Chart 3 o For Capacitors, less than 400 Volts, use Chart 4 o For Capacitors, greater than 400 Volts, use Chart 5 o For rf, use Chart 7 o For Sub-rf ac, use Chart 8

Chart 7 – rf circuits, 3 kHz to 100 MHz Notes on use:
f in the chart is frequency in MHz This chart only addresses the rf shock hazard, it does NOT address exposure to electromagnetic fields. The allowable shock currents are much higher than 50/60 Hz (e.g., 100 mA is allowed for 100 kHz). Evaluate all energy sources that the worker was exposed to.
o For ac 50/60 Hz, use Chart 2 o For dc, use Chart 3 o For Capacitors, less than 400 Volts, use Chart 4 o For Capacitors, greater than 400 Volts, use Chart 5 o For Batteries, use Chart 6, unless V > 100 V, then you must use Chart 3 for dc shock and arc flash o For Sub-rf ac, use Chart 8

Chart 8 – Sub-rf ac, 1 Hz to 3 kHz, NOT for 50/60 Hz Facility or Generator Powered Equipment Notes on use:
For 50/60 Hz facility or generator powered equipment use Chart 2. The voltage is the root mean square (rms) voltage. The power is available short circuit power. The current is available short circuit current. Evaluate all energy sources that the worker was exposed to.
o For dc, use Chart 3 o For Capacitors, less than 400 Volts, use Chart 4 o For Capacitors, greater than 400 Volts, use Chart 5 o For Batteries, use Chart 6, unless V > 100 V, then you must use Chart 3 for dc shock and arc flash o For rf, use Chart 7

Appendix 2 List of Acronyms
ac alternating current D&D Decontamination and Decommissioning dc direct current DOE Department of Energy EFCOG Energy Facility Contractors Operating Group ES Electrical Severity ESD Electrostatic Discharge NFPA National Fire Protection Association PPE Personal Protective Equipment R&D Research and Development rf radio frequency rms root mean square SME Subject Matter Expert UPS Uninterruptible Power Supply