electricity exports and imports - cree nation · pdf filewps power dev. f 2 364 73 105licence...
TRANSCRIPT

(Year Totals)
GW.h
October 2004
Monthly Statistics for
Exports:Imports:
GW.hGW.h
28741526
January – October2000 2003 20042001 2002
0
5000
10000
15000
20000
25000
30000
35000
40000
ExportsImports
Electricity Exports and Imports

04/12/09
1National Energy BoardOffice national de l'énergie
Page
L12MOCT04
CAN$/MW.h2
Energy (MW.h)
OCT04 JAN04 - OCT04 OCT04 JAN04 - OCT04
Revenue (CAN$)1
Exchange Type
TABLE 1Exports and Imports of Electricity
Summary: CanadaOCTOBER 2004
Exports of Electric Energy 48.02 51.23 51 700 425 10 905 628 636 804 860Firm 908 064
51.07 58.81 102 466 315 16 479 043 1 026 428 817Interruptible 1 965 744
0.00 0.00 0 -4 625 266 0Non-Revenue/Inadvertant - 160 447
19.16 16.79 562 218 459 035 8 348 463Service 29 348
Total Exports 2 742 709 154 728 958 23 218 439 1 671 582 139
Total Sales - Firm and Interruptible 2 873 808 154 166 740 27 384 671 1 663 233 676
52.70 66.32
50.10 55.83
Imports of Electric Energy 0.00 0.00 0 -4 871 786 0Non-Revenue/Inadvertant - 154 688
41.45 47.56 63 264 351 19 309 974 935 481 151Purchase 1 526 355
28.59 5.02 1 160 263 329 674 2 357 770Service 40 580
Total Imports 1 412 246 64 424 614 14 767 862 937 838 921 45.62 60.91
For further information, contact:
Number of Export Licences:
Number of Export Permits/Orders:
1 330 463 90 304 344 8 450 577 733 743 218Excess of Exports Over Imports
8
175
183
Footnotes:1. Includes capacity and energy charges.2. Average value for the month and the last 12 months (excludes capacity charge).
Mary-Jane SamStatistical Research Officer,Commodities Business UnitNational Energy Board(403) 299-3706
F - Firm SalesI - Interruptible SalesP - Purchase (Import)N - Non-Revenue (Non-Revenue or Inadvertent)S - Service (Spinning Reserve, Storage, Unit Rental, Transmission, etc.)

04/12/09
1Page National Energy BoardOffice national de l'énergie
Export Summary Report
AuthorizationExchange
Type L12M
Energy (MW.h)
OCT04 JAN04 - OCT04OCT04 JAN04 - OCT04 OCT04
Revenue (CAN$) CAN$/MW.h1 2
by Source, Authorization and Exchange Type
Source
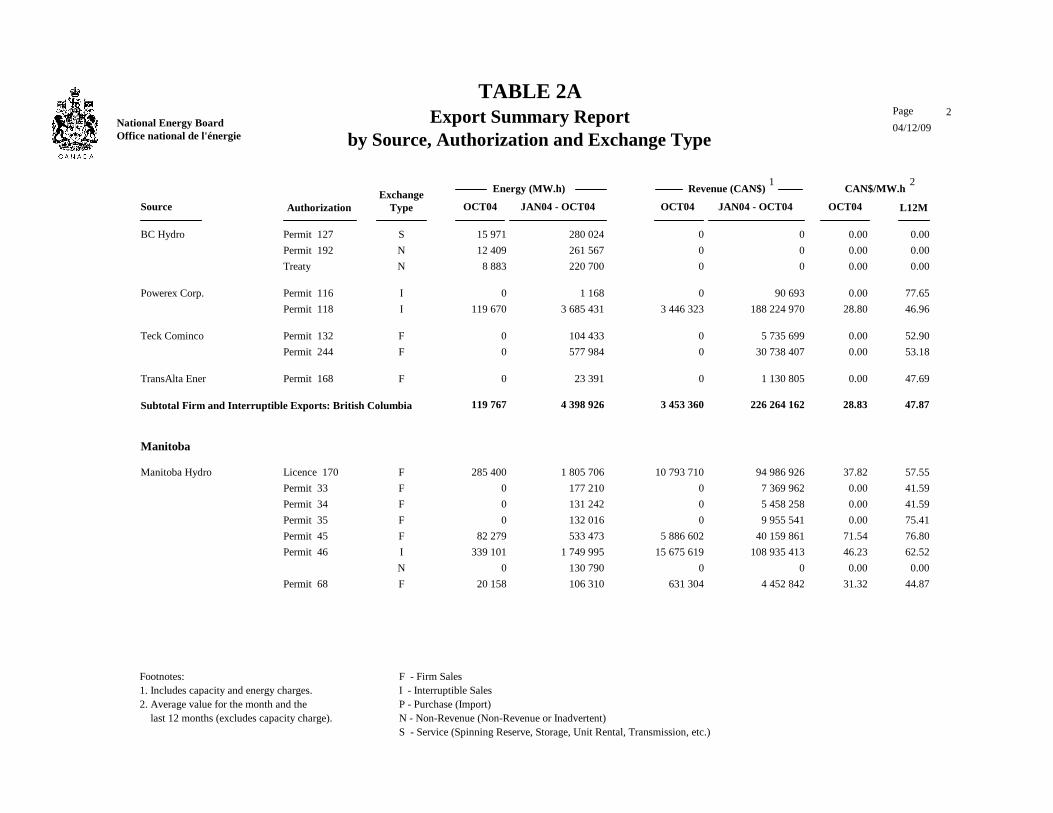
TABLE 2A
Alberta
ATCO & Alberta I 583 25 234 2 130 100 371Permit 93 43.28 47.12
Candela Energy I 0 0 788 32 808Permit 165 0.00 41.63
Enmax Marketing I 1 172 47 649 34 871 1 746 247Permit 169 40.66 49.66
EPCOR Merchant I 270 10 421 36 225 1 656 372Permit 186 38.60 44.82
Powerex Corp. I 0 0 5 728 350 319Permit 116 0.00 61.15
TransAlta Ener F 628 31 179 2 427 102 157Permit 168 49.65 42.09
TransCanada I 0 0 8 968 384 644Permit 78 0.00 42.33
TransCanada Ene I 1 445 71 186 22 782 1 101 448 49.26 48.35
Subtotal Firm and Interruptible Exports: Alberta 4 098 185 669 113 919 5 474 365 45.31 47.26
British Columbia
Aquila Networks F 0 0 5 565 275 105Permit 115 0.00 49.43
BC Hydro F 97 7 037 954 68 484Permit 105 72.58 71.73
N - 175 501 0 -3 768 436 0Permit 127 0.00 0.00
F - Firm SalesI - Interruptible SalesP - Purchase (Import)N - Non-Revenue (Non-Revenue or Inadvertent)S - Service (Spinning Reserve, Storage, Unit Rental, Transmission, etc.)
Footnotes:1. Includes capacity and energy charges.2. Average value for the month and the last 12 months (excludes capacity charge).
04/12/09
2Page National Energy BoardOffice national de l'énergie
Export Summary Report
AuthorizationExchange
Type L12M
Energy (MW.h)
OCT04 JAN04 - OCT04OCT04 JAN04 - OCT04 OCT04
Revenue (CAN$) CAN$/MW.h1 2
by Source, Authorization and Exchange Type
Source
TABLE 2A
BC Hydro S 15 971 0 280 024 0Permit 127 0.00 0.00
N 12 409 0 261 567 0Permit 192 0.00 0.00
N 8 883 0 220 700 0Treaty 0.00 0.00
Powerex Corp. I 0 0 1 168 90 693Permit 116 0.00 77.65
I 119 670 3 446 323 3 685 431 188 224 970Permit 118 28.80 46.96
Teck Cominco F 0 0 104 433 5 735 699Permit 132 0.00 52.90
F 0 0 577 984 30 738 407Permit 244 0.00 53.18
TransAlta Ener F 0 0 23 391 1 130 805Permit 168 0.00 47.69
Subtotal Firm and Interruptible Exports: British Columbia 119 767 3 453 360 4 398 926 226 264 162 28.83 47.87
Manitoba
Manitoba Hydro F 285 400 10 793 710 1 805 706 94 986 926Licence 170 37.82 57.55
F 0 0 177 210 7 369 962Permit 33 0.00 41.59
F 0 0 131 242 5 458 258Permit 34 0.00 41.59
F 0 0 132 016 9 955 541Permit 35 0.00 75.41
F 82 279 5 886 602 533 473 40 159 861Permit 45 71.54 76.80
I 339 101 15 675 619 1 749 995 108 935 413Permit 46 46.23 62.52
N 0 0 130 790 0 0.00 0.00
F 20 158 631 304 106 310 4 452 842Permit 68 31.32 44.87
F - Firm SalesI - Interruptible SalesP - Purchase (Import)N - Non-Revenue (Non-Revenue or Inadvertent)S - Service (Spinning Reserve, Storage, Unit Rental, Transmission, etc.)
Footnotes:1. Includes capacity and energy charges.2. Average value for the month and the last 12 months (excludes capacity charge).
04/12/09
3Page National Energy BoardOffice national de l'énergie
Export Summary Report
AuthorizationExchange
Type L12M
Energy (MW.h)
OCT04 JAN04 - OCT04OCT04 JAN04 - OCT04 OCT04
Revenue (CAN$) CAN$/MW.h1 2
by Source, Authorization and Exchange Type
Source
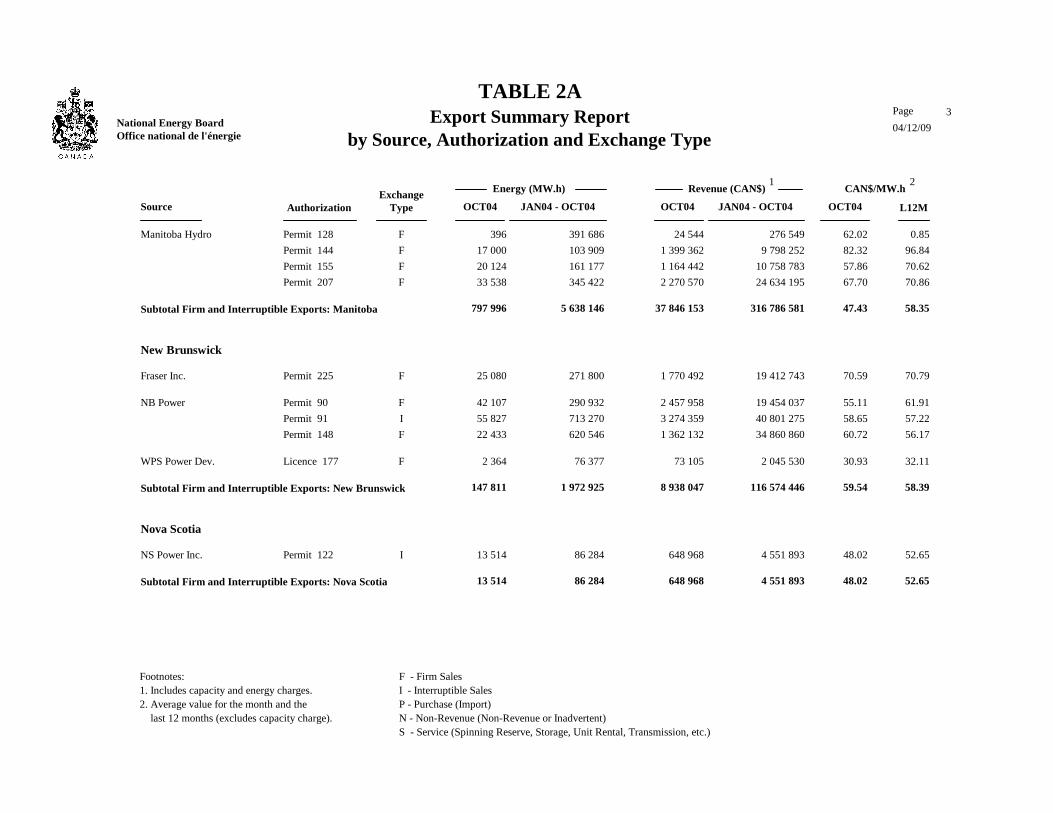
TABLE 2A
Manitoba Hydro F 396 24 544 391 686 276 549Permit 128 62.02 0.85
F 17 000 1 399 362 103 909 9 798 252Permit 144 82.32 96.84
F 20 124 1 164 442 161 177 10 758 783Permit 155 57.86 70.62
F 33 538 2 270 570 345 422 24 634 195Permit 207 67.70 70.86
Subtotal Firm and Interruptible Exports: Manitoba 797 996 37 846 153 5 638 146 316 786 581 47.43 58.35
New Brunswick
Fraser Inc. F 25 080 1 770 492 271 800 19 412 743Permit 225 70.59 70.79
NB Power F 42 107 2 457 958 290 932 19 454 037Permit 90 55.11 61.91
I 55 827 3 274 359 713 270 40 801 275Permit 91 58.65 57.22
F 22 433 1 362 132 620 546 34 860 860Permit 148 60.72 56.17
WPS Power Dev. F 2 364 73 105 76 377 2 045 530Licence 177 30.93 32.11
Subtotal Firm and Interruptible Exports: New Brunswick 147 811 8 938 047 1 972 925 116 574 446 59.54 58.39
Nova Scotia
NS Power Inc. I 13 514 648 968 86 284 4 551 893Permit 122 48.02 52.65
Subtotal Firm and Interruptible Exports: Nova Scotia 13 514 648 968 86 284 4 551 893 48.02 52.65
F - Firm SalesI - Interruptible SalesP - Purchase (Import)N - Non-Revenue (Non-Revenue or Inadvertent)S - Service (Spinning Reserve, Storage, Unit Rental, Transmission, etc.)
Footnotes:1. Includes capacity and energy charges.2. Average value for the month and the last 12 months (excludes capacity charge).
04/12/09
4Page National Energy BoardOffice national de l'énergie
Export Summary Report
AuthorizationExchange
Type L12M
Energy (MW.h)
OCT04 JAN04 - OCT04OCT04 JAN04 - OCT04 OCT04
Revenue (CAN$) CAN$/MW.h1 2
by Source, Authorization and Exchange Type
Source
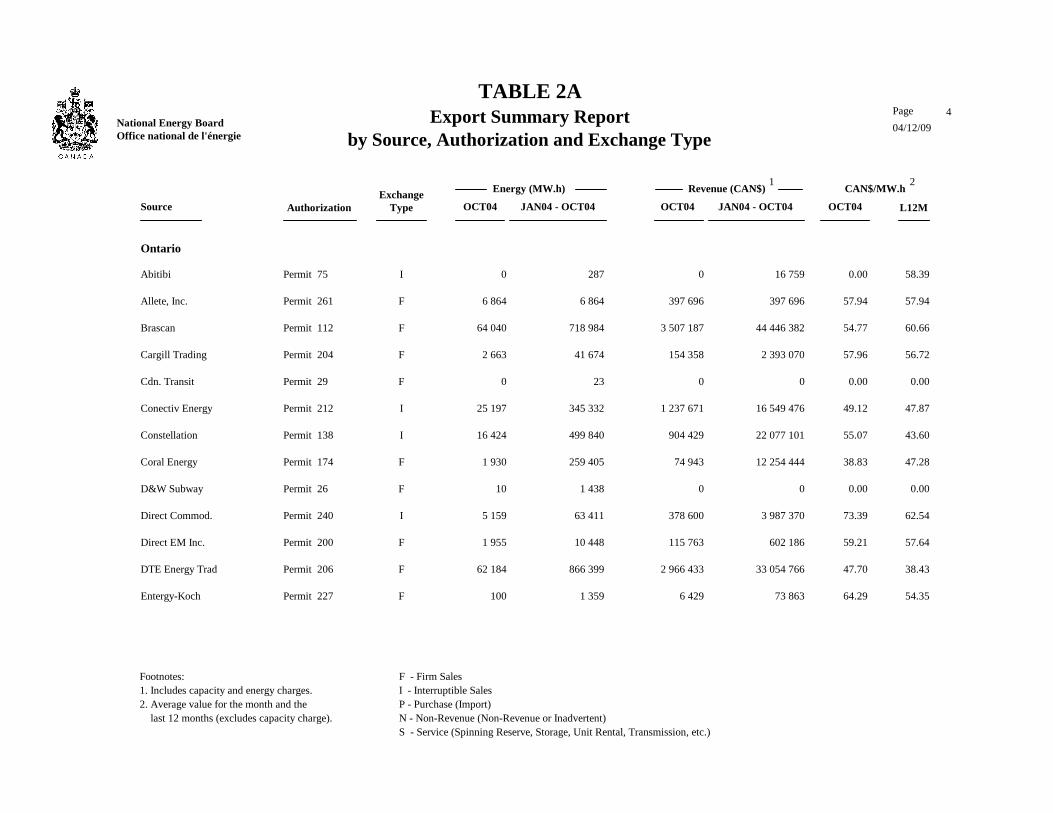
TABLE 2A
Ontario
Abitibi I 0 0 287 16 759Permit 75 0.00 58.39
Allete, Inc. F 6 864 397 696 6 864 397 696Permit 261 57.94 57.94
Brascan F 64 040 3 507 187 718 984 44 446 382Permit 112 54.77 60.66
Cargill Trading F 2 663 154 358 41 674 2 393 070Permit 204 57.96 56.72
Cdn. Transit F 0 0 23 0Permit 29 0.00 0.00
Conectiv Energy I 25 197 1 237 671 345 332 16 549 476Permit 212 49.12 47.87
Constellation I 16 424 904 429 499 840 22 077 101Permit 138 55.07 43.60
Coral Energy F 1 930 74 943 259 405 12 254 444Permit 174 38.83 47.28
D&W Subway F 10 0 1 438 0Permit 26 0.00 0.00
Direct Commod. I 5 159 378 600 63 411 3 987 370Permit 240 73.39 62.54
Direct EM Inc. F 1 955 115 763 10 448 602 186Permit 200 59.21 57.64
DTE Energy Trad F 62 184 2 966 433 866 399 33 054 766Permit 206 47.70 38.43
Entergy-Koch F 100 6 429 1 359 73 863Permit 227 64.29 54.35
F - Firm SalesI - Interruptible SalesP - Purchase (Import)N - Non-Revenue (Non-Revenue or Inadvertent)S - Service (Spinning Reserve, Storage, Unit Rental, Transmission, etc.)
Footnotes:1. Includes capacity and energy charges.2. Average value for the month and the last 12 months (excludes capacity charge).

04/12/09
5Page National Energy BoardOffice national de l'énergie
Export Summary Report
AuthorizationExchange
Type L12M
Energy (MW.h)
OCT04 JAN04 - OCT04OCT04 JAN04 - OCT04 OCT04
Revenue (CAN$) CAN$/MW.h1 2
by Source, Authorization and Exchange Type
Source
TABLE 2A
EPCOR Merchant F 27 762 1 262 979 422 231 17 290 339Permit 187 45.49 41.18
Hydro One Net F 0 0 19 913Permit 25 0.00 46.96
Ind Elc Mark Op N -6 238 0 -1 469 887 0Permit 22 0.00 0.00
Manitoba Hydro I 35 588 1 273 806 58 702 2 302 450Permit 46 35.79 39.22
Morgan Stanley F 0 0 7 788 332 913Permit 181 0.00 42.51
Northern States F 11 135 616 155 12 536 619 388Permit 235 55.33 49.41
Ont Power Gen F 15 30 165 327Permit 24 2.02 1.99
OPGI/OHIM I 81 760 4 697 479 1 976 977 106 277 614Permit 21 54.57 51.18
S 13 377 562 218 179 011 8 348 463 42.03 47.47
Powerex Corp. I 45 596 2 580 686 573 318 31 100 389Permit 116 56.60 54.18
Sempra Corp F 5 914 285 149 65 376 3 663 120Permit 157 48.22 55.69
SPLIT ROCK F 13 091 571 123 260 936 12 848 096Permit 221 43.63 49.54
TransAlta Ener F 15 902 767 143 665 339 31 531 216Permit 168 48.24 47.39
TransCanada PM F 0 0 19 701 666 073Permit 185 0.00 33.81
Subtotal Firm and Interruptible Exports: Ontario 423 289 21 798 059 6 878 552 342 485 949 50.94 48.70
F - Firm SalesI - Interruptible SalesP - Purchase (Import)N - Non-Revenue (Non-Revenue or Inadvertent)S - Service (Spinning Reserve, Storage, Unit Rental, Transmission, etc.)
Footnotes:1. Includes capacity and energy charges.2. Average value for the month and the last 12 months (excludes capacity charge).

04/12/09
6Page National Energy BoardOffice national de l'énergie
Export Summary Report
AuthorizationExchange
Type L12M
Energy (MW.h)
OCT04 JAN04 - OCT04OCT04 JAN04 - OCT04 OCT04
Revenue (CAN$) CAN$/MW.h1 2
by Source, Authorization and Exchange Type
Source
TABLE 2A
Quebec
Brascan F 8 543 546 721 274 730 19 952 216Permit 112 64.00 67.84
Hydro-Quebec F 75 628 7 121 294 791 557 76 597 130Licence 180 34.19 36.09
F 12 876 1 167 003 140 272 12 767 615Licence 181 34.19 36.14
F 11 239 1 038 356 123 832 11 401 242Licence 182 34.19 36.12
F 21 693 1 958 235 208 260 20 399 162Licence 183 34.19 36.09
F 12 917 1 270 989 142 624 13 936 396Licence 184 34.19 36.13
F 0 0 1 107 81 396Permit 20 0.00 73.49
I 1 075 862 59 486 027 4 679 597 389 755 110Permit 64 53.61 78.94
F 0 0 0 - 180 084Permit 65 0.00 0.00
MEHQ I 116 613 6 883 675 1 312 999 67 682 368Permit 129 59.03 51.81
Subtotal Firm and Interruptible Exports: Quebec 1 335 371 79 472 301 7 674 978 612 392 552 52.20 65.05
Saskatchewan
Northpoint I 31 930 1 824 184 620 789 38 700 848Permit 88 55.89 62.15
Powerex Corp. I 33 0 151 2 880Permit 116 0.00 18.70
Subtotal Firm and Interruptible Exports: Saskatchewan 31 963 1 824 184 620 940 38 703 728 55.83 62.15
Total Firm and Interruptible Exports: 50.10 55.83 2 873 808 154 166 740 27 384 671 1 663 233 676
F - Firm SalesI - Interruptible SalesP - Purchase (Import)N - Non-Revenue (Non-Revenue or Inadvertent)S - Service (Spinning Reserve, Storage, Unit Rental, Transmission, etc.)
Footnotes:1. Includes capacity and energy charges.2. Average value for the month and the last 12 months (excludes capacity charge).
04/12/09
7Page National Energy BoardOffice national de l'énergie
Import Summary Report
AuthorizationExchange
Type L12M
Energy (MW.h)
OCT04 JAN04 - OCT04OCT04 JAN04 - OCT04 OCT04
Revenue (CAN$) CAN$/MW.h1 2
by Destination, Authorization and Exchange Type
Destination
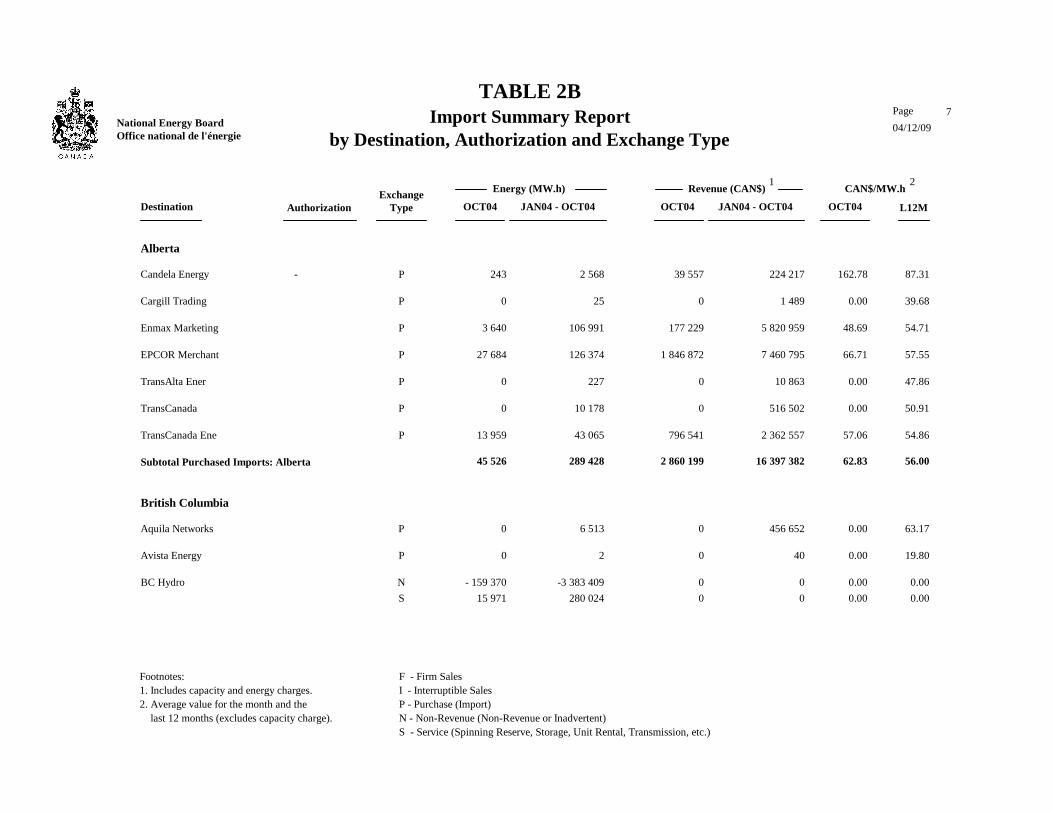
TABLE 2B
Alberta
Candela Energy P 243 39 557 2 568 224 217 - 162.78 87.31
Cargill Trading P 0 0 25 1 489 0.00 39.68
Enmax Marketing P 3 640 177 229 106 991 5 820 959 48.69 54.71
EPCOR Merchant P 27 684 1 846 872 126 374 7 460 795 66.71 57.55
TransAlta Ener P 0 0 227 10 863 0.00 47.86
TransCanada P 0 0 10 178 516 502 0.00 50.91
TransCanada Ene P 13 959 796 541 43 065 2 362 557 57.06 54.86
Subtotal Purchased Imports: Alberta 45 526 2 860 199 289 428 16 397 382 62.83 56.00
British Columbia
Aquila Networks P 0 0 6 513 456 652 0.00 63.17
Avista Energy P 0 0 2 40 0.00 19.80
BC Hydro N - 159 370 0 -3 383 409 0 0.00 0.00
S 15 971 0 280 024 0 0.00 0.00
F - Firm SalesI - Interruptible SalesP - Purchase (Import)N - Non-Revenue (Non-Revenue or Inadvertent)S - Service (Spinning Reserve, Storage, Unit Rental, Transmission, etc.)
Footnotes:1. Includes capacity and energy charges.2. Average value for the month and the last 12 months (excludes capacity charge).
04/12/09
8Page National Energy BoardOffice national de l'énergie
Import Summary Report
AuthorizationExchange
Type L12M
Energy (MW.h)
OCT04 JAN04 - OCT04OCT04 JAN04 - OCT04 OCT04
Revenue (CAN$) CAN$/MW.h1 2
by Destination, Authorization and Exchange Type
Destination
TABLE 2B
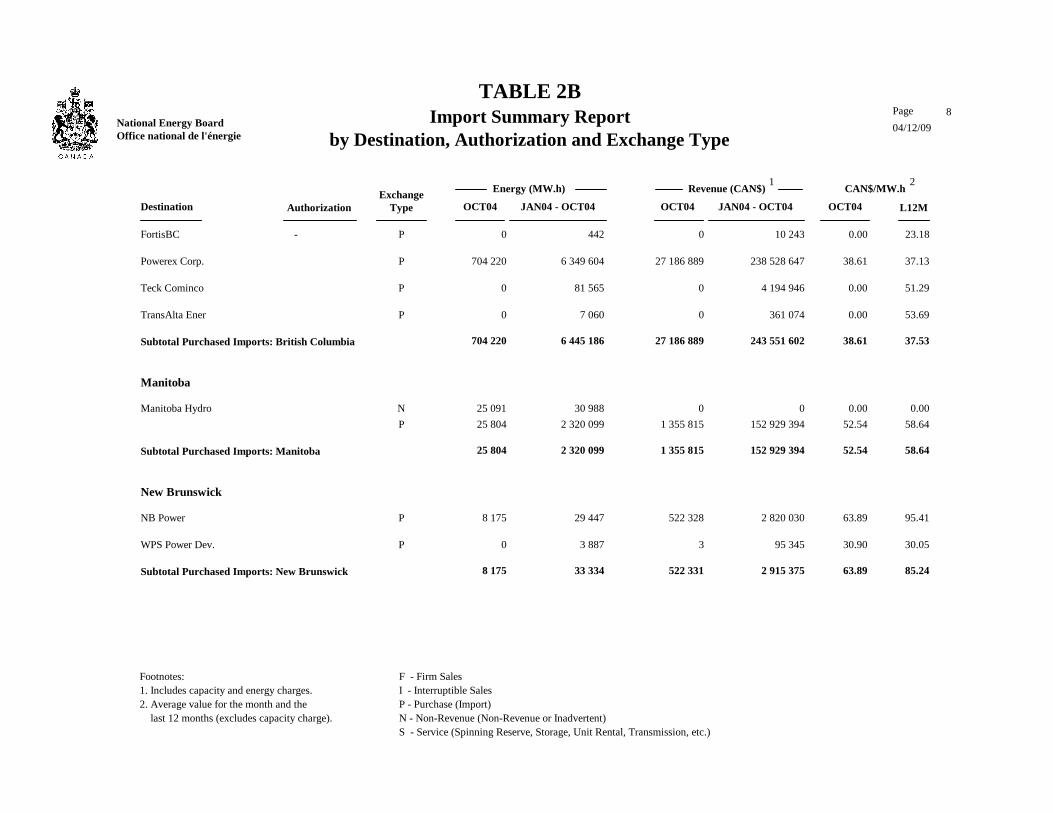
FortisBC P 0 0 442 10 243 - 0.00 23.18
Powerex Corp. P 704 220 27 186 889 6 349 604 238 528 647 38.61 37.13
Teck Cominco P 0 0 81 565 4 194 946 0.00 51.29
TransAlta Ener P 0 0 7 060 361 074 0.00 53.69
Subtotal Purchased Imports: British Columbia 704 220 27 186 889 6 445 186 243 551 602 38.61 37.53
Manitoba
Manitoba Hydro N 25 091 0 30 988 0 0.00 0.00
P 25 804 1 355 815 2 320 099 152 929 394 52.54 58.64
Subtotal Purchased Imports: Manitoba 25 804 1 355 815 2 320 099 152 929 394 52.54 58.64
New Brunswick
NB Power P 8 175 522 328 29 447 2 820 030 63.89 95.41
WPS Power Dev. P 0 3 3 887 95 345 30.90 30.05
Subtotal Purchased Imports: New Brunswick 8 175 522 331 33 334 2 915 375 63.89 85.24
F - Firm SalesI - Interruptible SalesP - Purchase (Import)N - Non-Revenue (Non-Revenue or Inadvertent)S - Service (Spinning Reserve, Storage, Unit Rental, Transmission, etc.)
Footnotes:1. Includes capacity and energy charges.2. Average value for the month and the last 12 months (excludes capacity charge).

04/12/09
9Page National Energy BoardOffice national de l'énergie
Import Summary Report
AuthorizationExchange
Type L12M
Energy (MW.h)
OCT04 JAN04 - OCT04OCT04 JAN04 - OCT04 OCT04
Revenue (CAN$) CAN$/MW.h1 2
by Destination, Authorization and Exchange Type
Destination
TABLE 2B
Nova Scotia
NS Power Inc. P 6 007 423 176 26 775 1 833 570 - 70.45 69.72
Subtotal Purchased Imports: Nova Scotia 6 007 423 176 26 775 1 833 570 70.45 69.72
Ontario
Abitibi P 0 0 17 993 0.00 58.39
Allete, Inc. P 1 011 36 225 16 777 611 805 35.83 36.47
Brascan P 4 461 255 022 269 274 19 386 033 57.17 67.39
Cargill Trading P 64 229 3 204 407 696 461 34 619 605 49.89 48.92
Conectiv Energy P 3 800 179 107 289 629 17 667 760 47.13 56.44
Constellation P 6 485 469 020 62 612 5 398 382 72.32 84.76
Coral Energy P 74 518 3 338 307 136 609 6 442 588 44.80 47.50
D&W Subway P 90 0 1 433 0 0.00 0.00
Direct Commod. P 1 082 79 978 27 254 2 143 547 73.92 76.85
F - Firm SalesI - Interruptible SalesP - Purchase (Import)N - Non-Revenue (Non-Revenue or Inadvertent)S - Service (Spinning Reserve, Storage, Unit Rental, Transmission, etc.)
Footnotes:1. Includes capacity and energy charges.2. Average value for the month and the last 12 months (excludes capacity charge).

04/12/09
10Page National Energy BoardOffice national de l'énergie
Import Summary Report
AuthorizationExchange
Type L12M
Energy (MW.h)
OCT04 JAN04 - OCT04OCT04 JAN04 - OCT04 OCT04
Revenue (CAN$) CAN$/MW.h1 2
by Destination, Authorization and Exchange Type
Destination
TABLE 2B
Direct EM Inc. P 100 6 019 455 28 509 - 60.19 62.66
DTE Energy Trad P 151 984 5 791 262 1 563 720 72 157 796 38.10 45.00
Entergy-Koch P 7 768 520 505 87 636 4 342 938 67.01 49.56
EPCOR Merchant P 679 41 730 21 635 1 740 685 61.46 71.57
Ind Elc Mark Op N -20 409 0 -1 519 365 0 0.00 0.00
Manitoba Hydro P 73 121 2 462 962 277 186 9 934 120 33.68 35.84
Morgan Stanley P 0 0 6 755 923 245 0.00 126.72
Northern States P 0 0 783 46 931 0.00 59.96
OPGI/OHIM P 76 948 3 048 406 983 749 43 921 709 39.62 43.27
S 24 609 1 160 263 49 650 2 357 770 47.15 27.42
Powerex Corp. P 10 110 335 449 179 416 7 284 774 33.18 42.04
Sempra Corp P 2 525 132 527 37 300 1 943 791 52.49 52.25
SPLIT ROCK P 68 374 3 136 001 599 645 27 237 058 45.87 44.61
TransAlta Ener P 94 005 4 483 574 749 541 34 264 373 47.70 45.71
TransCanada PM P 0 0 1 361 186 979 0.00 115.15
Subtotal Purchased Imports: Ontario 641 290 27 520 501 6 009 247 290 283 620 42.91 47.37
F - Firm SalesI - Interruptible SalesP - Purchase (Import)N - Non-Revenue (Non-Revenue or Inadvertent)S - Service (Spinning Reserve, Storage, Unit Rental, Transmission, etc.)
Footnotes:1. Includes capacity and energy charges.2. Average value for the month and the last 12 months (excludes capacity charge).

04/12/09
11Page National Energy BoardOffice national de l'énergie
Import Summary Report
AuthorizationExchange
Type L12M
Energy (MW.h)
OCT04 JAN04 - OCT04OCT04 JAN04 - OCT04 OCT04
Revenue (CAN$) CAN$/MW.h1 2
by Destination, Authorization and Exchange Type
Destination
TABLE 2B
Quebec
Brascan P 739 38 877 15 783 1 055 973 - 52.61 66.91
Hydro-Quebec P 7 072 274 329 3 039 043 174 362 528 38.79 55.27
MEHQ P 2 387 128 172 225 022 18 000 368 53.70 76.31
Subtotal Purchased Imports: Quebec 10 198 441 377 3 279 848 193 418 869 43.28 56.67
Saskatchewan
Northpoint P 85 135 2 954 062 906 057 34 151 339 34.70 37.47
Subtotal Purchased Imports: Saskatchewan 85 135 2 954 062 906 057 34 151 339 34.70 37.47
Total Purchased Imports: 41.45 47.56 1 526 355 63 264 351 19 309 974 935 481 151
F - Firm SalesI - Interruptible SalesP - Purchase (Import)N - Non-Revenue (Non-Revenue or Inadvertent)S - Service (Spinning Reserve, Storage, Unit Rental, Transmission, etc.)
Footnotes:1. Includes capacity and energy charges.2. Average value for the month and the last 12 months (excludes capacity charge).

04/12/09
1Page National Energy Board
Office national de l'énergie
L12M
Energy (MW.h)
Export Sales Summary Report
OCT04 JAN04 - OCT04OCT04 JAN04 - OCT04 OCT04
Revenue (CAN$) CAN$/MW.h1 2
Destination Source
by Destination and Source
TABLE 3A
Alaska British Columbia 97 7 037 954 68 484 72.58 71.73
Subtotal Exports: Alaska 97 7 037 954 68 484 72.58 71.73
Arizona British Columbia 2 966 199 654 138 640 9 141 689 67.31 66.07
Subtotal Exports: Arizona 2 966 199 654 138 640 9 141 689 67.31 66.07
California British Columbia 9 598 201 995 131 383 7 921 617 21.05 57.02
Saskatchewan 0 0 1 21 0.00 21.00
Subtotal Exports: California 9 598 201 995 131 384 7 921 638 21.05 57.02
Colorado British Columbia 1 926 116 010 20 902 1 262 027 60.23 57.90
Subtotal Exports: Colorado 1 926 116 010 20 902 1 262 027 60.23 57.90
Idaho British Columbia 945 66 089 31 697 2 413 073 69.94 76.04
Subtotal Exports: Idaho 945 66 089 31 697 2 413 073 69.94 76.04
Illinois Alberta 0 0 764 27 340 0.00 35.78
British Columbia 0 0 1 168 90 693 0.00 77.65
Saskatchewan 0 0 22 995 0.00 45.23
Subtotal Exports: Illinois 0 0 1 954 119 028 0.00 60.91
Iowa British Columbia 6 0 6 0 0.00 0.00
Subtotal Exports: Iowa 6 0 6 0 0.00 0.00
Maine New Brunswick 147 811 8 938 047 1 972 925 116 574 446 59.54 58.39
Nova Scotia 13 514 648 968 86 284 4 551 893 48.02 52.65
Quebec 116 613 6 883 675 1 312 999 67 682 368 59.03 51.81
Subtotal Exports: Maine 277 938 16 470 690 3 372 208 188 808 707 58.77 55.78
Footnotes:1. Includes capacity and energy charges.2. Average value for the month and the
last 12 months (excludes capacity charge).

04/12/09
2Page National Energy Board
Office national de l'énergie
L12M
Energy (MW.h)
Export Sales Summary Report
OCT04 JAN04 - OCT04OCT04 JAN04 - OCT04 OCT04
Revenue (CAN$) CAN$/MW.h1 2
Destination Source
by Destination and Source
TABLE 3A
Massachusetts Ontario 0 0 10 716 0.00 71.55
Subtotal Exports: Massachusetts 0 0 10 716 0.00 71.55
Michigan Alberta 0 0 488 0 0.00 0.00
Ontario 83 179 3 965 546 1 658 522 71 857 441 47.67 42.95
Saskatchewan 33 0 105 189 0.00 1.75
Subtotal Exports: Michigan 83 212 3 965 546 1 659 115 71 857 630 47.66 42.94
Minnesota Manitoba 0 0 97 777 4 406 217 0.00 45.06
Ontario 54 227 2 522 490 267 591 17 152 056 42.94 59.01
Subtotal Exports: Minnesota 54 227 2 522 490 365 368 21 558 273 42.94 55.60
Montana British Columbia 179 9 441 35 469 2 237 407 52.74 63.41
Subtotal Exports: Montana 179 9 441 35 469 2 237 407 52.74 63.41
ND/Minn Manitoba 797 996 37 846 153 5 540 369 312 380 364 47.43 58.58
Subtotal Exports: ND/Minn 797 996 37 846 153 5 540 369 312 380 364 47.43 58.58
Nevada British Columbia 4 982 187 629 182 340 13 288 944 37.66 69.41
Subtotal Exports: Nevada 4 982 187 629 182 340 13 288 944 37.66 69.41
New England Ontario 800 65 277 4 944 296 662 81.60 58.04
Quebec 588 678 32 265 352 1 901 354 142 603 195 54.81 74.37
Subtotal Exports: New England 589 478 32 330 629 1 906 298 142 899 857 54.85 74.30
New Mexico British Columbia 7 488 498 951 34 794 2 502 012 66.63 70.64
Subtotal Exports: New Mexico 7 488 498 951 34 794 2 502 012 66.63 70.64
Footnotes:1. Includes capacity and energy charges.2. Average value for the month and the
last 12 months (excludes capacity charge).

04/12/09
3Page National Energy Board
Office national de l'énergie
L12M
Energy (MW.h)
Export Sales Summary Report
OCT04 JAN04 - OCT04OCT04 JAN04 - OCT04 OCT04
Revenue (CAN$) CAN$/MW.h1 2
Destination Source
by Destination and Source
TABLE 3A
New York Ontario 282 155 15 077 428 4 870 927 248 303 744 53.29 49.90
Quebec 492 870 27 547 605 3 031 381 265 115 130 52.23 80.33
Subtotal Exports: New York 775 025 42 625 033 7 902 309 513 418 874 52.62 61.44
North Dakota Saskatchewan 31 930 1 824 184 620 789 38 700 848 55.89 62.15
Subtotal Exports: North Dakota 31 930 1 824 184 620 789 38 700 848 55.89 62.15
Ohio Ontario 0 0 2 828 198 773 0.00 70.29
Subtotal Exports: Ohio 0 0 2 828 198 773 0.00 70.29
Oregon Alberta 139 6 144 639 31 811 44.20 49.22
British Columbia 64 564 1 708 974 1 950 014 107 334 595 26.47 50.94
Subtotal Exports: Oregon 64 703 1 715 118 1 950 653 107 366 406 26.51 50.94
Pennsylvania Alberta 0 0 4 276 309 890 0.00 72.47
British Columbia 0 0 12 0 0.00 0.00
Ontario 2 928 167 318 73 730 4 676 557 57.14 63.26
Saskatchewan 0 0 21 1 546 0.00 73.62
Subtotal Exports: Pennsylvania 2 928 167 318 78 039 4 987 994 57.14 63.75
Tennessee Saskatchewan 0 0 2 129 0.00 64.41
Subtotal Exports: Tennessee 0 0 2 129 0.00 64.41
Utah British Columbia 455 27 139 13 724 1 267 283 59.65 91.93
Subtotal Exports: Utah 455 27 139 13 724 1 267 283 59.65 91.93
Vermont Quebec 137 210 12 775 668 1 429 244 136 991 858 35.08 36.92
Subtotal Exports: Vermont 137 210 12 775 668 1 429 244 136 991 858 35.08 36.92
Footnotes:1. Includes capacity and energy charges.2. Average value for the month and the
last 12 months (excludes capacity charge).

04/12/09
4Page National Energy Board
Office national de l'énergie
L12M
Energy (MW.h)
Export Sales Summary Report
OCT04 JAN04 - OCT04OCT04 JAN04 - OCT04 OCT04
Revenue (CAN$) CAN$/MW.h1 2
Destination Source
by Destination and Source
TABLE 3A
Washington Alberta 3 959 179 525 107 752 5 105 325 45.35 46.62
British Columbia 24 313 236 253 1 841 557 77 331 614 9.72 39.45
Subtotal Exports: Washington 28 272 415 778 1 949 309 82 436 938 14.71 39.78
Wyoming British Columbia 2 248 194 188 16 266 1 404 723 86.38 84.41
Subtotal Exports: Wyoming 2 248 194 188 16 266 1 404 723 86.38 84.41
Total Exports 50.10 55.83 2 873 808 154 166 740 27 384 671 1 663 233 676
Footnotes:1. Includes capacity and energy charges.2. Average value for the month and the
last 12 months (excludes capacity charge).

04/12/09
5Page National Energy Board
Office national de l'énergie
L12M
Energy (MW.h)
Import Purchases Summary Report
OCT04 JAN04 - OCT04OCT04 JAN04 - OCT04 OCT04
Revenue (CAN$) CAN$/MW.h1 2
Source Destination
by Source and Destination
TABLE 3B
Arizona British Columbia 212 2 908 13 045 544 903 13.72 41.77
Subtotal Imports: Arizona 212 2 908 13 045 544 903 13.72 41.77
Illinois Ontario 0 0 9 386 653 376 0.00 60.17
Subtotal Imports: Illinois 0 0 9 386 653 376 0.00 60.17
Iowa British Columbia 131 0 131 0 0.00 0.00
Subtotal Imports: Iowa 131 0 131 0 0.00 0.00
Maine New Brunswick 8 175 522 331 33 334 2 915 375 63.89 85.24
Quebec 2 387 128 172 225 022 18 000 368 53.70 76.31
Subtotal Imports: Maine 10 562 650 503 258 356 20 915 743 61.59 77.31
Massachusetts Ontario 35 3 356 35 3 356 95.90 95.90
Subtotal Imports: Massachusetts 35 3 356 35 3 356 95.90 95.90
Michigan Ontario 423 033 17 592 346 4 038 815 183 030 691 41.59 44.26
Subtotal Imports: Michigan 423 033 17 592 346 4 038 815 183 030 691 41.59 44.26
Minnesota Alberta 0 0 25 1 489 0.00 39.68
Ontario 115 654 5 110 742 1 015 899 47 893 670 44.19 46.27
Subtotal Imports: Minnesota 115 654 5 110 742 1 015 924 47 895 159 44.19 46.27
Montana Alberta 640 30 175 1 393 69 013 47.15 49.34
British Columbia 24 733 1 091 854 43 597 1 803 695 44.15 41.37
Subtotal Imports: Montana 25 373 1 122 029 44 990 1 872 707 44.22 41.65
ND/Minn Manitoba 25 804 1 355 815 2 320 099 152 929 394 52.54 58.64
Subtotal Imports: ND/Minn 25 804 1 355 815 2 320 099 152 929 394 52.54 58.64
Footnotes:1. Includes capacity and energy charges.2. Average value for the month and the
last 12 months (excludes capacity charge).

04/12/09
6Page National Energy Board
Office national de l'énergie
L12M
Energy (MW.h)
Import Purchases Summary Report
OCT04 JAN04 - OCT04OCT04 JAN04 - OCT04 OCT04
Revenue (CAN$) CAN$/MW.h1 2
Source Destination
by Source and Destination
TABLE 3B
Nebraska British Columbia 489 8 997 1 079 19 196 18.40 17.79
Subtotal Imports: Nebraska 489 8 997 1 079 19 196 18.40 17.79
Nevada British Columbia 4 240 158 091 11 576 391 555 37.29 33.82
Subtotal Imports: Nevada 4 240 158 091 11 576 391 555 37.29 33.82
New Jersey Ontario 0 0 400 29 410 0.00 73.53
Subtotal Imports: New Jersey 0 0 400 29 410 0.00 73.53
New Mexico British Columbia 5 583 168 086 11 005 309 708 30.11 28.14
Subtotal Imports: New Mexico 5 583 168 086 11 005 309 708 30.11 28.14
New York Ontario 93 305 4 536 935 731 623 49 424 483 48.62 65.95
Quebec 7 811 313 206 3 054 826 175 418 501 40.10 55.31
Subtotal Imports: New York 101 116 4 850 141 3 786 449 224 842 984 47.97 57.31
North Dakota Saskatchewan 85 135 2 954 062 906 057 34 151 339 34.70 37.47
Subtotal Imports: North Dakota 85 135 2 954 062 906 057 34 151 339 34.70 37.47
Ohio Ontario 398 22 641 27 379 1 595 595 56.89 58.34
Subtotal Imports: Ohio 398 22 641 27 379 1 595 595 56.89 58.34
Oregon British Columbia 22 902 919 838 39 893 1 333 970 40.16 33.44
Subtotal Imports: Oregon 22 902 919 838 39 893 1 333 970 40.16 33.44
Pennsylvania Nova Scotia 6 007 423 176 26 775 1 833 570 70.45 69.72
Ontario 8 865 254 480 185 711 7 653 040 28.71 42.59
Subtotal Imports: Pennsylvania 14 872 677 656 212 486 9 486 610 45.57 45.83
Footnotes:1. Includes capacity and energy charges.2. Average value for the month and the
last 12 months (excludes capacity charge).

04/12/09
7Page National Energy Board
Office national de l'énergie
L12M
Energy (MW.h)
Import Purchases Summary Report
OCT04 JAN04 - OCT04OCT04 JAN04 - OCT04 OCT04
Revenue (CAN$) CAN$/MW.h1 2
Source Destination
by Source and Destination
TABLE 3B
Washington Alberta 44 886 2 830 024 288 010 16 326 880 63.05 56.06
British Columbia 629 844 24 469 434 6 286 306 238 309 975 38.85 37.64
Subtotal Imports: Washington 674 730 27 299 458 6 574 316 254 636 855 40.46 38.53
Wyoming British Columbia 16 086 367 681 38 554 838 601 22.86 21.75
Subtotal Imports: Wyoming 16 086 367 681 38 554 838 601 22.86 21.75
Total Imports 41.45 47.56 1 526 355 63 264 351 19 309 974 935 481 151
Footnotes:1. Includes capacity and energy charges.2. Average value for the month and the
last 12 months (excludes capacity charge).

Fuel Type
04/12/09
1Source of Production ReportCanadian Exports
Page National Energy Board
Office national de l'énergie
Energy (MW.h) Revenue (CAN$) CAN$/MW.h
OCT04
TABLE 41
2 2
146 023Canadian Coal 2 856 51.12
103 474 448Hydraulic 2 087 375 49.57
439 104Imported Coal 8 724 50.33
4 423 872Imported Oil 75 543 58.56
2 418 820Natural Gas 40 515 59.70
20 603 454Other 453 417 45.44
131 505 721 2 668 430 49.28Total
Footnotes:1. Source of production data filed by major exporters only.
2. Revenue figures are for illustrative purposes only and are strictly allocatable by energy source.
Additional Notes:- Revenue for Permit 92 not available.

Exporter AuthorizationFuel Type
04/12/09 1Source of Production Report
by Exporter
Page National Energy Board
Office national de l'énergie
Energy (MW.h) Revenue (CAN$) CAN$/MW.h
OCT04
TABLE 5
2 2
1
ATCO & Alberta Permit 93 583 25 234 43.28Other
25 234 583 43.28Subtotal
Subtotal 583 25 234 43.28
BC Hydro Permit 105 97 7 037 72.58Hydraulic
Permit 192 12 409 0 0.00
Treaty 0 8 883 0 0.00
7 037 21 389 0.33Subtotal
Subtotal 21 389 7 037 0.33
Brascan Permit 112 72 583 4 053 908 55.85Hydraulic
4 053 908 72 583 55.85Subtotal
Subtotal 72 583 4 053 908 55.85
Cargill Trading Permit 204 2 663 154 358 57.96Other
154 358 2 663 57.96Subtotal
Subtotal 2 663 154 358 57.96
Conectiv Energy Permit 212 25 197 1 237 671 49.12Other
1 237 671 25 197 49.12Subtotal
Subtotal 25 197 1 237 671 49.12
Coral Energy Permit 174 74 518 3 338 307 44.80Other
3 338 307 74 518 44.80Subtotal
Subtotal 74 518 3 338 307 44.80
Footnotes:1. Source of production data filed by major exporters only.
2. Revenue figures are for illustrative purposes only and are strictly allocatable by energy source.

Exporter AuthorizationFuel Type
04/12/09 2Source of Production Report
by Exporter
Page National Energy Board
Office national de l'énergie
Energy (MW.h) Revenue (CAN$) CAN$/MW.h
OCT04
TABLE 5
2 2
1
Direct Commod. Permit 240 5 159 378 600 73.39Other
378 600 5 159 73.39Subtotal
Subtotal 5 159 378 600 73.39
Direct EM Inc. Permit 200 1 955 115 763 59.21Other
115 763 1 955 59.21Subtotal
Subtotal 1 955 115 763 59.21
DTE Energy Trad Permit 206 62 184 2 966 433 47.70Other
2 966 433 62 184 47.70Subtotal
Subtotal 62 184 2 966 433 47.70
Enmax Marketing Permit 169 1 172 47 649 40.66Canadian Coal
47 649 1 172 40.66Subtotal
Permit 170 280 243 10 598 679 37.82Hydraulic
10 598 679 280 243 37.82Subtotal
Permit 170 2 295 86 803 37.82Imported Coal
86 803 2 295 37.82Subtotal
Permit 170 2 862 108 229 37.82Other
108 229 2 862 37.82Subtotal
Subtotal 286 572 10 841 359 37.83
Entergy-Koch Permit 227 100 6 429 64.29Other
6 429 100 64.29Subtotal
Subtotal 100 6 429 64.29
Footnotes:1. Source of production data filed by major exporters only.
2. Revenue figures are for illustrative purposes only and are strictly allocatable by energy source.

Exporter AuthorizationFuel Type
04/12/09 3Source of Production Report
by Exporter
Page National Energy Board
Office national de l'énergie
Energy (MW.h) Revenue (CAN$) CAN$/MW.h
OCT04
TABLE 5
2 2
1
Hydro-Quebec Licence 180 75 628 2 585 721 34.19Hydraulic
Licence 181 12 876 440 230 34.19
Licence 182 11 239 384 261 34.19
Licence 183 21 693 741 684 34.19
Licence 184 12 917 441 632 34.19
Permit 64 1 075 862 57 681 763 53.61
62 275 291 1 210 215 51.46Subtotal
Subtotal 1 210 215 62 275 291 51.46
Manitoba Hydro Permit 45 80 792 5 780 237 71.54Hydraulic
Permit 46 332 974 15 392 376 46.23
Permit 68 19 794 619 897 31.32
Permit 144 16 693 1 374 077 82.32
Permit 155 19 760 1 143 402 57.86
Permit 207 32 932 2 229 543 67.70
26 539 532 502 945 52.77Subtotal
Permit 45 662 47 340 71.54Imported Coal
Permit 46 2 727 126 063 46.23
Permit 68 162 5 077 31.32
Permit 144 137 11 254 82.32
Permit 155 162 9 364 57.86
Permit 207 270 18 260 67.70
217 358 4 119 52.77Subtotal
Footnotes:1. Source of production data filed by major exporters only.
2. Revenue figures are for illustrative purposes only and are strictly allocatable by energy source.

Exporter AuthorizationFuel Type
04/12/09 4Source of Production Report
by Exporter
Page National Energy Board
Office national de l'énergie
Energy (MW.h) Revenue (CAN$) CAN$/MW.h
OCT04
TABLE 5
2 2
1
Manitoba Hydro Permit 45 825 59 025 71.54Other
Permit 46 3 400 157 179 46.23
Permit 68 202 6 330 31.32
Permit 144 170 14 031 82.32
Permit 155 202 11 676 57.86
Permit 207 336 22 767 67.70
271 009 5 136 52.77Subtotal
Subtotal 512 200 27 027 900 52.77
NB Power Gen. Permit 90 1 489 86 936 58.37Canadian Coal
Permit 91 195 11 438 58.65
98 374 1 684 58.41Subtotal
Permit 90 1 843 107 562 58.37Imported Coal
Permit 91 467 27 381 58.65
134 942 2 309 58.43Subtotal
Permit 90 24 654 1 439 148 58.37Imported Oil
Permit 91 50 889 2 984 725 58.65
4 423 872 75 543 58.56Subtotal
Permit 90 13 834 807 547 58.37Natural Gas
Permit 91 4 248 249 141 58.65
Permit 148 22 433 1 362 132 60.72
2 418 820 40 515 59.70Subtotal
Footnotes:1. Source of production data filed by major exporters only.
2. Revenue figures are for illustrative purposes only and are strictly allocatable by energy source.

Exporter AuthorizationFuel Type
04/12/09 5Source of Production Report
by Exporter
Page National Energy Board
Office national de l'énergie
Energy (MW.h) Revenue (CAN$) CAN$/MW.h
OCT04
TABLE 5
2 2
1
NB Power Gen. Permit 90 287 16 765 58.37Other
Permit 91 29 1 675 58.65
18 440 316 58.40Subtotal
Subtotal 120 367 7 094 449 58.94
Northern States Permit 235 11 135 616 155 55.34Other
616 155 11 135 55.33Subtotal
Subtotal 11 135 616 155 55.33
Ont Power Gen Permit 24 15 30 2.02Other
30 15 2.02Subtotal
Subtotal 15 30 2.02
OPGI/OPIM Permit 21 81 760 4 697 479 57.45Other
4 697 479 81 760 57.45Subtotal
Subtotal 81 760 4 697 479 57.45
Powerex Corp. Permit 116 45 629 2 580 686 56.56Other
Permit 118 119 670 3 446 323 28.80
6 027 008 165 299 36.46Subtotal
Subtotal 165 299 6 027 008 36.46
SPLIT ROCK Permit 221 13 091 571 123 43.63Other
571 123 13 091 43.63Subtotal
Subtotal 13 091 571 123 43.63
Footnotes:1. Source of production data filed by major exporters only.
2. Revenue figures are for illustrative purposes only and are strictly allocatable by energy source.

Exporter AuthorizationFuel Type
04/12/09 6Source of Production Report
by Exporter
Page National Energy Board
Office national de l'énergie
Energy (MW.h) Revenue (CAN$) CAN$/MW.h
OCT04
TABLE 5
2 2
1
TransCanada Ene Permit 78 1 445 71 186 49.26Other
71 186 1 445 49.26Subtotal
Subtotal 1 445 71 186 49.26
Total All Exporters 2 668 430 131 505 721 49.28
Footnotes:1. Source of production data filed by major exporters only.
2. Revenue figures are for illustrative purposes only and are strictly allocatable by energy source.