electricity production subsidies in · pdf fileelectricity production subsidies in australia...
TRANSCRIPT
Electricity production subsidies in Australia
Principal Economics
A policy paper commissioned by the Minerals Council of Australia AUGUST 2015
PO
LIC
Y P
AP
ER
Electricity production subsidies in Australia
Principal Economics is a consulting firm which provides specialist advice in the areas of energy, resources, infrastructure and climate policy, and more broadly on regulatory, competition and strategy matters.
The Minerals Council of Australia is the peak national body representing Australia’s exploration, mining and minerals processing industry, nationally and internationally, in its contribution to sustainable economic, and social development.
This publication is part of the overall program of the MCA, as endorsed by its Board of Directors, but does not necessarily reflect the views of individual members of the Board.
Minerals Council of AustraliaLevel 3, 44 Sydney Ave, Forrest ACT 2603 (PO Box 4497, Kingston ACT Australia 2604)P. + 61 2 6233 0600 | F. + 61 2 6233 0699 www.minerals.org.au | [email protected]
Copyright © 2015 Minerals Council of Australia. All rights reserved. Apart from any use permitted under the Copyright Act 1968 and subsequent amendments, no part of this publication may be reproduced, stored in a retrieval system or transmitted, in any form or by any means, electronic, mechanical, photocopying, recording or otherwise, without the prior written permission of the publisher and copyright holders.
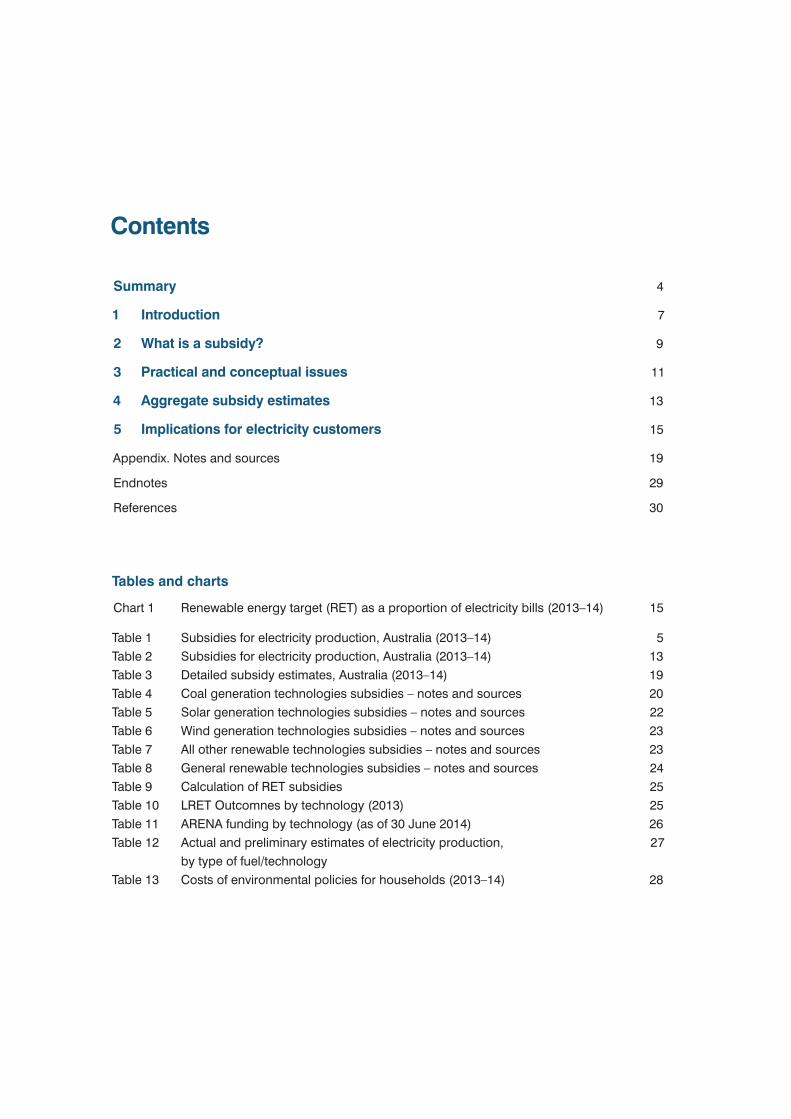
Contents
Summary 4
1 Introduction 7
2 What is a subsidy? 9
3 Practical and conceptual issues 11
4 Aggregate subsidy estimates 13
5 Implications for electricity customers 15
Appendix. Notes and sources 19
Endnotes 29
References 30
Tables and charts
Chart 1 Renewable energy target (RET) as a proportion of electricity bills (2013–14) 15
Table 1 Subsidies for electricity production, Australia (2013–14) 5Table 2 Subsidies for electricity production, Australia (2013–14) 13Table 3 Detailed subsidy estimates, Australia (2013–14) 19Table 4 Coal generation technologies subsidies – notes and sources 20Table 5 Solar generation technologies subsidies – notes and sources 22Table 6 Wind generation technologies subsidies – notes and sources 23Table 7 All other renewable technologies subsidies – notes and sources 23Table 8 General renewable technologies subsidies – notes and sources 24Table 9 Calculation of RET subsidies 25Table 10 LRET Outcomnes by technology (2013) 25Table 11 ARENA funding by technology (as of 30 June 2014) 26Table 12 Actual and preliminary estimates of electricity production, 27 by type of fuel/technology Table 13 Costs of environmental policies for households (2013–14) 28
4 Minerals Council of Australia
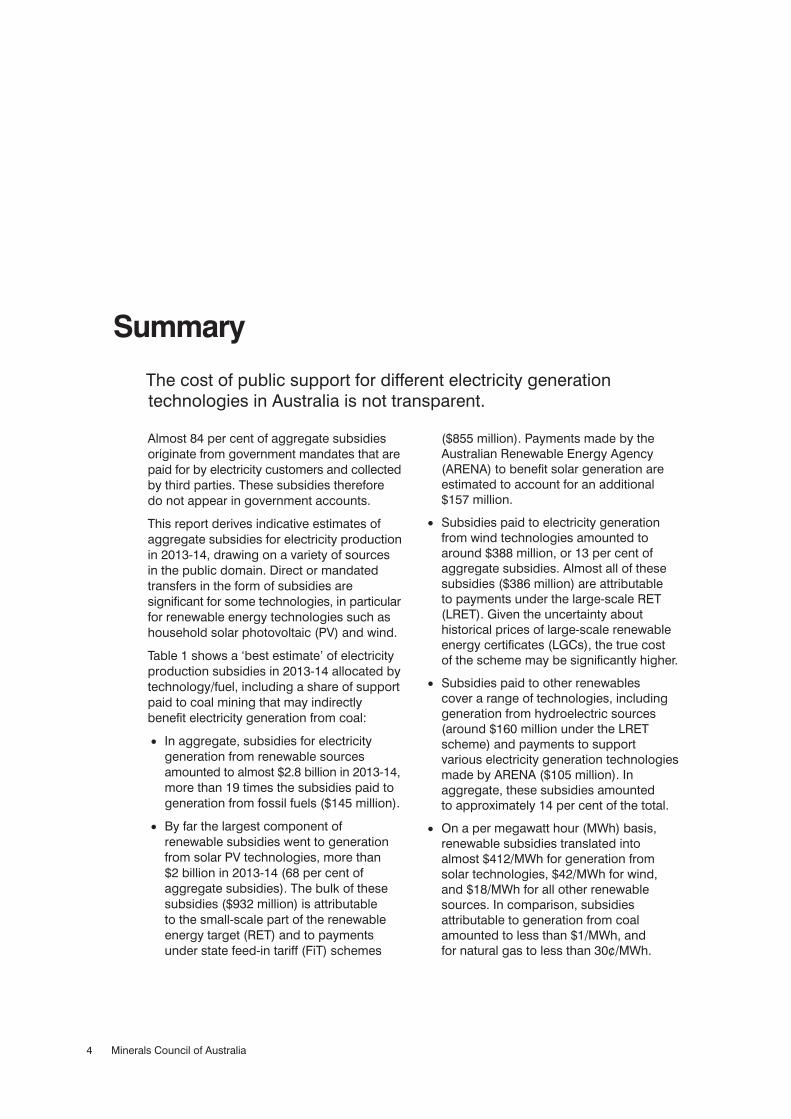
The cost of public support for different electricity generation technologies in Australia is not transparent.
Summary
Almost 84 per cent of aggregate subsidies originate from government mandates that are paid for by electricity customers and collected by third parties. These subsidies therefore do not appear in government accounts.
This report derives indicative estimates of aggregate subsidies for electricity production in 2013-14, drawing on a variety of sources in the public domain. Direct or mandated transfers in the form of subsidies are significant for some technologies, in particular for renewable energy technologies such as household solar photovoltaic (PV) and wind.
Table 1 shows a ‘best estimate’ of electricity production subsidies in 2013-14 allocated by technology/fuel, including a share of support paid to coal mining that may indirectly benefit electricity generation from coal:
• In aggregate, subsidies for electricity generation from renewable sources amounted to almost $2.8 billion in 2013-14, more than 19 times the subsidies paid to generation from fossil fuels ($145 million).
• By far the largest component of renewable subsidies went to generation from solar PV technologies, more than $2 billion in 2013-14 (68 per cent of aggregate subsidies). The bulk of these subsidies ($932 million) is attributable to the small-scale part of the renewable energy target (RET) and to payments under state feed-in tariff (FiT) schemes
($855 million). Payments made by the Australian Renewable Energy Agency (ARENA) to benefit solar generation are estimated to account for an additional $157 million.
• Subsidies paid to electricity generation from wind technologies amounted to around $388 million, or 13 per cent of aggregate subsidies. Almost all of these subsidies ($386 million) are attributable to payments under the large-scale RET (LRET). Given the uncertainty about historical prices of large-scale renewable energy certificates (LGCs), the true cost of the scheme may be significantly higher.
• Subsidies paid to other renewables cover a range of technologies, including generation from hydroelectric sources (around $160 million under the LRET scheme) and payments to support various electricity generation technologies made by ARENA ($105 million). In aggregate, these subsidies amounted to approximately 14 per cent of the total.
• On a per megawatt hour (MWh) basis, renewable subsidies translated into almost $412/MWh for generation from solar technologies, $42/MWh for wind, and $18/MWh for all other renewable sources. In comparison, subsidies attributable to generation from coal amounted to less than $1/MWh, and for natural gas to less than 30¢/MWh.

5Electricity production subsidies in Australia
Fuel/technology
Aggregate subsidies
($ millions)
Share of aggregate subsidies
Estimated electricity
generation (GWh)*
Estimated subsidies ($/MWh)
Coal, inc. share of subsidies paid to coal mining $130 4% 151,922 $0.86
Gas $15 1% 50,423 $0.30
Solar $2,002 68% 4,858 $412.11
Wind $388 13% 9,327 $41.64
All other renewables (inc. hydro)+ $396 14% 22,599 $17.53
Total fossil fuel $145 5% 208,676 $0.70
Total renewables $2,788 95% 36,783 $75.75
Total all fuels/technologies $2,933 100% 245,459 $11.94
Table 1 Subsidies for electricity production, Australia (2013–2014)
Notes: * Electricity generation figures are preliminary estimates + Some subsidies for wind and solar generation may be included in this category
Source: See Appendix
While the cost of public support financed through government budgets is recovered from taxpayers, the subsidies created by the RET and FiT schemes are recovered from electricity customers.
Given the very large sums involved, the impacts on electricity bills for households and businesses have been substantial:
• For households, the combined impacts of the RET and FiT schemes are estimated to account for between 3 and 9 per cent of annual household bills.
• For large businesses that consume more than 5 gigawatt hours (GWh) of electricity per annum, the combined costs of the RET, FiT and state-based schemes has been estimated at around 20 per cent of annual electricity bills for businesses that are not eligible for partial exemption certificates.
For households, the combined impacts of the RET and FiT schemes are estimated to account for between 3 and 9 per cent of annual household bills.

6 Minerals Council of Australia

7Electricity production subsidies in Australia
This report derives indicative estimates of aggregate subsidies paid for electricity production in Australia in 2013-14. The magnitude of these subsidies is not transparent.
1 Introduction
Almost 84 per cent of aggregate subsidies are imposed on electricity customers via various government mandated electricity surcharges and collected by third parties, and therefore do not appear in government accounts. A number of approximations have therefore been made in this report to derive indicative estimates of the subsidy amounts.
This report is structured as follows:
• Section 2 reviews the concept of a subsidy
• Section 3 discusses the conceptual and practical issues that arise in estimating electricity subsidies
• Section 4 shows the aggregate subsidy estimates
• Section 5 discusses the implications for household and business electricity customers.
The sources and the derivation of component estimates are described in the Appendix.

8 Minerals Council of Australia
9Electricity production subsidies in Australia
There is no single definition of what constitutes a subsidy. There is general agreement that subsidisation involves the government, results in (financial) benefits for one party, and a cost to another, but there is no consistent approach when it comes to the details.1
2 What is a subsidy?
In this paper, the definition of a subsidy applied by the Word Trade Organization (WTO 2006) is adopted. The WTO defines three types of government programs that constitute subsidies:
• Transfers made by the government that result in (actual or potential) budgetary outlays, as well as transfers that are made by private entities, as mandated by government
• Programs that involve the provision of goods or services below cost
• Regulatory policies that result in transfers from one group to another.
The WTO definition explicitly recognises that subsidies need not come from government directly. Rather, government can require private actors to pay subsidies by creating corresponding regulations or legislation. This is relevant in the Australian context, given the significant imposts mandated by governments on electricity customers through policies such as the renewable energy target (RET) and feed-in tariff (FiT) schemes.
Davidson (2012) also provides a useful examination of subsidies that focuses on the claim that the mining industry receives subsidies and/or does not pay its ‘fair share’ of taxes. Thus Davidson identifies a check-list of features that constitute a subsidy:
• Is the benefit a direct benefit or an indirect benefit to a firm or industry?
• Is the benefit firm-specific or industry-specific?
• Does the subsidy involve a grant, tax concession, soft loan, or equity participation?
In its annual trade and assistance reviews, the Productivity Commission (PC) refers to the definition of what constitutes industry assistance set out in the Productivity Commission Act 1998 (PC 2015):
… any act that, directly or indirectly: assists a person to carry on a business or activity; or confers a pecuniary benefit on, or results in a pecuniary benefit to, a person in respect of carrying on a business or activity.
Industry assistance is said by the PC (2015) to extend beyond direct government subsidies to particular firms or industries, and includes tariffs, quotas, regulatory restrictions on imported goods and services, tax concessions, the provision of services below cost, and preferential treatment under trade agreements.
The PC’s Trade and Assistance Review (2015) quantifies assistance afforded by tariffs, budgetary measures and taxation concessions, and does not consider the subsidy implications of government mandates. In contrast, in its assessment of carbon emissions policies in key economies (PC 2011), the PC listed a range of electricity production subsidies, including renewable energy targets and feed-in tariffs.

10 Minerals Council of Australia
11Electricity production subsidies in Australia
As set out in the following, estimating electricity production subsidies by fuel or technology in Australia is complicated and requires a number of approximations to be made.
3 Practical and conceptual issues
3.1 Government mandates to purchase renewable energy
Many of the subsidies for electricity generated from renewable sources take the form of government mandates, rather than explicit budgetary expenditures. For these subsidies, the sums involved are not transparent and must be compiled or estimated from various sources.
3.1.1 Renewable Energy TargetThe RET enables large-scale renewable energy producers and households to create renewable energy certificates (RECs) per MWh of renewable electricity generated. Retailers are required to purchase and surrender a prescribed number of large-scale and small-scale RECs; retailers’ REC purchasing costs are recovered from electricity customers. The total subsidies paid by electricity customers to large and small-scale renewable energy producers in this way are not published. Some estimates of the costs of the RET are published in consultants’ reports based on modelling analyses; alternatively, the cost of the RET can be approximated from data published by the Clean Energy Regulator (CER).
The latter approach (using data from CER) has been adopted here, but the resulting estimates are still uncertain. In particular, estimating the subsidies paid under the large-scale and the small-scale components of the RET (the LRET and the SRES, respectively) requires assumptions to be made about the prices of large-scale and small-scale certificates (LGCs and STCs, respectively). These estimates vary widely. For instance, according to CER, the volume-weighted average price per LGCs
was $38.69 and $35.24 in 2013 and 2014, respectively. SKM MMA (2012), in a report for the Climate Change Authority (CCA) put LGC prices in 2013 and 2014 at $45.56 and $52.33, respectively. ACIL Allen (2014) in a report for the Expert Panel estimated LGC prices in 2014 at $55.61. Different LGC price assumptions translate into very significant differences in aggregate subsidy estimates for the LRET, for instance:
• Using CER’s LGC prices implies an aggregate LRET subsidy of $668 million in 2013-14
• Using SKM MMA’s LGC price assumptions implies an aggregate LRET subsidy of $878 million.
The LRET cost estimates derived in this report may therefore represent a (potentially significant) underestimate of the aggregate subsidies paid by Australian electricity customers. This conclusion would also be consistent with the observation that, in practice, retailers may pay higher prices for LGCs than published spot prices, particularly vertically integrated generators (ROAM/Synergies 2014).
3.2.1 Feed-in tariffsAll Australian states and territories have in the past introduced generous subsidies in the form of solar feed-in tariff (FiT) schemes that pay eligible households for energy generated. These FiT schemes are generally funded by distribution network service providers (DNSPs) in the first instance; DNSP recover the costs of FiT schemes from electricity customers as a whole via additional network charges. The earlier FiT schemes have now been closed, but households who signed up at the time

12 Minerals Council of Australia
continue to be entitled to significant subsidies. For most jurisdictions, information about the costs of FiT schemes – and the corresponding burden on electricity customers – is available in DNSPs’ regulatory accounts or annual pricing proposals.
The amount of subsidies implicit in FiT payments made by DNSPs is sometimes disputed.2 As discussed in the Appendix, various Australian agencies have attempted to measure the network benefits that are sometimes claimed to arise from solar PV installations, and have concluded that there are no such benefits and/or that they cannot be achieved using FiT schemes. On the contrary, conventional electricity distribution networks are not configured to accommodate significant quantities of energy being injected at low voltage levels. While there is no public information about these potential costs in Australia, it is understood that higher penetrations of distributed generation (such as PV solar) create challenges in operating distribution networks and requires potentially significant additional investment to be undertaken (EPRI 2005, McDonald et al. 2013). Overall therefore, FiT schemes potentially create network costs that extend beyond the direct subsidies paid to a subset of eligible customers, and which are recovered from electricity customers as a whole who derive no direct benefit from these schemes.
3.2 Attribution of subsidies Government schemes that subsidise electricity generation from renewables often target a range of technologies so that it is not immediately apparent which technology receives the subsidies. The approach that has been taken here is to prorate aggregate subsidies, as best as possible, on the basis of the available information about the fuels/technologies that benefit from the subsidies. For instance, for the RET, CER has published the MWh generated under the large-scale RET (LRET) by technology, while the Australian Renewable Energy Agency (ARENA) provides a breakdown of its funding activities by technology.
There is also a question as to where to ‘draw the line’ in attributing subsidies to
particular beneficiaries. For instance, in many jurisdictions distribution tariffs are structured in a way that customers with solar PV panels (but also customers with air-conditioning) are subsidised by customers who do not use these technologies. Indeed, the Energy Networks Association (ENA, 2013) found that there are substantial and growing ‘hidden transfers’ between customers with PV installations and those without. Estimating these subsidies requires detailed tariff and load shape information and has not been attempted here.
It could also be argued that upstream industries such as electricity generation may benefit indirectly from assistance that may be provided to downstream industries such as coal mining. For instance, in 2013-14 the Australian states and the Commonwealth provide around $120 million to the electricity sector for the purpose of developing low emissions coal technologies. In addition, around $90 million was provided to the coal mining sector directly, some of which might benefit the electricity generation sector. In this context, the approach adopted by the PC (2015) is to allocate subsidies to the initial benefiting industry (PC 2015), so that, for instance, no part of any subsidies to coal mining is attributed to coal generation. The approach taken here as it relates to coal mining is to assume that electricity generation indirectly benefits from subsidies to the coal industry according to the share of (black) coal that is used domestically (around 13 per cent of total production).

13Electricity production subsidies in Australia
Subsidies for electricity generation from renewable sources amounted to almost $2.8 billion in 2013-14, more than 19 times the subsidies paid to generation from fossil fuels ($145 million).
4 Aggregate subsidy estimates
• Aggregate subsidies to generation from coal include the costs of the Commonwealth’s Carbon Capture and Storage Flagships and similar programs at the state level. The cost of state programs that are directed at coal mining and that may indirectly benefit the electricity generation sector has been prorated according to the share of coal that is consumed domestically.3 Subsidies to coal generation accounted for around $119 million or 4 per cent of aggregate subsidies in 2013-14.
• Aggregate subsidies to generation from natural gas are limited to payments made
under the Queensland Gas Scheme (QGS), and accounted for less than 1 per cent of aggregate subsidies. The QGS scheme was closed in December 2013.
• Subsidies benefiting electricity generation from solar technologies are estimated to amount to more than $2 billion in 2013-14, around 68 per cent of aggregate subsidies. The bulk of these subsidies ($932 million) are attributable to the SRES and to payments under state FiT schemes ($855 million). Payments made by ARENA to benefit solar generation technologies are estimated to account for an additional $157 million.
Table 2 Subsidies for electricity production, Australia (2013–2014)
Fuel/technology
Aggregate subsidies
($ millions)
Share of aggregate subsidies
Estimated electricity
generation (GWh)*
Estimated subsidies ($/MWh)
Coal, inc. share of subsidies paid to coal mining $130 4% 151,922 $0.86
Gas $15 1% 50,423 $0.30
Solar $2,002 68% 4,858 $412.11
Wind $388 13% 9,327 $41.64
All other renewables (inc. hydro)+ $396 14% 22,599 $17.53
Total fossil fuel $145 5% 208,676 $0.70
Total renewables $2,788 95% 36,783 $75.75
Total all fuels/technologies $2,933 100% 245,459 $11.94
Notes: * Electricity generation figures are preliminary estimates + Some subsidies for wind and solar generation may be included in this category
Source: See Appendix
14 Minerals Council of Australia
• Subsidies paid to electricity generation from wind technologies amounted to around $388 million, or 13 per cent of aggregate subsidies. Almost all of these subsidies ($386 million) are attributable to payments under the LRET.
• Subsidies paid to other renewables cover a range of technologies, including generation from hydroelectric sources (around $160 million under the LRET scheme), payments towards geothermal generation (around $31 million paid by ARENA), as well as smaller amounts for generation from fuels such as landfill and waste coal mine gas, biomass and others. In aggregate, these subsidies amounted to approximately 14 per cent of the total.
• On a per MWh basis, generation from solar technologies received by far the greatest subsidies, estimated at $412.11/MWh, followed by generation from wind ($41.64/MWh) and other renewable sources ($17.53/MWh). In contrast, subsidies for coal generation (including a share of subsidies for coal mining) amounted to only $0.86/MWh.
Subsidies benefiting electricity generation from solar technologies are estimated to amount to more than $2 billion in 2013-14, around 68 per cent of aggregate subsidies.

15Electricity production subsidies in Australia
While the cost of public support financed through government budgets is recovered from taxpayers, the subsidies created by the RET and FiT schemes are levied on electricity customers.
5 Implications for electricity customers
Given the very large sums involved, the impacts on electricity bills for households and businesses have been substantial.
Estimates of the impacts of the RET and FiT schemes on customer bills vary. According to the Australian Energy Market Commission (AEMC, 2014), an average household paid around $109 per annum in South East Queensland, $107 in New South Wales and $155 in South Australia for the combined LRET, SRES and FiT components of household bills in 2013-14. These payments are estimated by the AEMC to
make up between 3 and 9 per cent of annual household bills. In contrast, the Independent Pricing and Regulatory Tribunal (IPART, 2013) estimated the combined costs of the RET and FiT schemes for a typical residential customer in New South Wales at aroun d $145 in 2013-14.
ROAM/Synergies Consulting (2014) considered the impacts of renewable schemes on electricity bills of households and businesses, and concluded that the RET accounts for a significant component of bills (Chart 1). ROAM/Synergies estimate
Chart 1 Renewable energy target (RET) as a proportion of electricity bills (2013–14)
%
10
8
6
4
2
0
Source: Synergies Consulting/ROAM Consulting 2014
Large-scale renewable energy target Small-scale renewable energy target
Residential/small business
Large business (no exemption)
Large business (moderately emissions-
intensive exemption)
Large business (high emissions-intensive
exemption)
16 Minerals Council of Australia
that during 2013-14, the RET comprised 3 per cent of the typical household or small-business electricity bill and 9.6 per cent for a large business that consumes more than 5 GWh of electricity per annum and is not eligible for partial exemption certificates. They conclude that, as is the case for other renewable schemes, the LRET and SRES contribute a relatively higher percentage of costs for large businesses.
According to ROAM/Synergies (2014), state-based energy policies – of which FiT schemes are by far the most costly – impose comparable or higher costs than the LRET and SRES combined. They estimate that these state-based schemes account for up to 12 per cent of the electricity bill for a large business.
Overall, ROAM/Synergies highlight the proliferation of green energy policies over the last decade at both the federal and state level and the significant cumulative impacts of these policies:
• For residential and small business customers, green energy policies (excluding a carbon price) represents 5 per cent of electricity bills
• For large business customers, green energy policies represent around 20 per cent of electricity bills (with the RET up to 9.6 per cent and state-based schemes up to 12 per cent respectively) excluding carbon price.
Looking forward, the burden on electricity customers as a result of the RET and FiT schemes is unlikely to diminish:
• While the most generous FiT schemes have now been closed to new applicants, the obligations entered into by state governments imply that considerable subsidies will continue to have to be paid to eligible households for many years into the future. For instance, the Queensland Competition Authority (QCA 2013) has estimated that Energex and Ergon Energy will incur accumulated feed-in tariff payments of around $2.9 billion by the end of the scheme in 2028, and that these costs will flow directly through to network charges and electricity bills.
• The RET will similarly continue to represent a significant burden on customers. The LRET has been revised to achieve a target of 33,000 GWh in 2020 (Australian Government 2015), almost double the 2014 target of 16,950 GWh. No changes have been made to the SRES, which will continue to offer significant financial incentives for customers with PV installations by legislating demand for the corresponding certificates.

17Electricity production subsidies in Australia

18 Minerals Council of Australia
19Electricity production subsidies in Australia
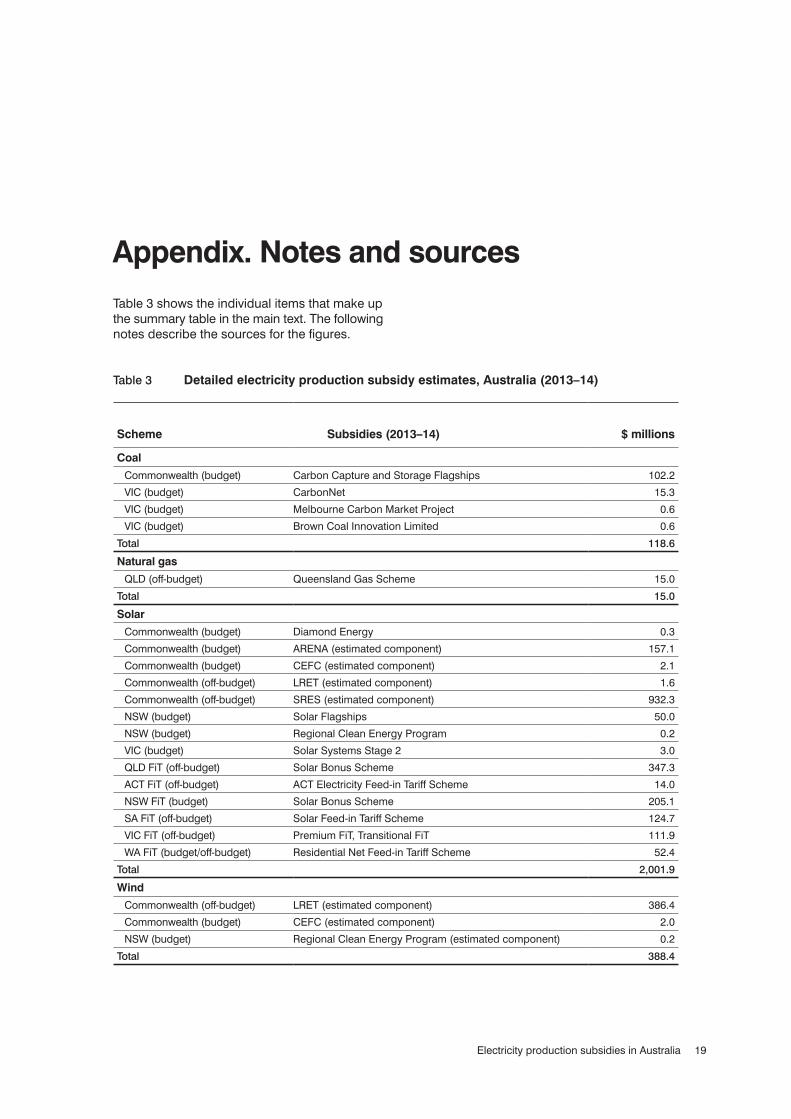
Appendix. Notes and sourcesTable 3 shows the individual items that make up the summary table in the main text. The following notes describe the sources for the figures.
Scheme Subsidies (2013–14) $ millions
Coal
Commonwealth (budget) Carbon Capture and Storage Flagships 102.2
VIC (budget) CarbonNet 15.3
VIC (budget) Melbourne Carbon Market Project 0.6
VIC (budget) Brown Coal Innovation Limited 0.6
Total 118.6
Natural gas
QLD (off-budget) Queensland Gas Scheme 15.0
Total 15.0
Solar
Commonwealth (budget) Diamond Energy 0.3
Commonwealth (budget) ARENA (estimated component) 157.1
Commonwealth (budget) CEFC (estimated component) 2.1
Commonwealth (off-budget) LRET (estimated component) 1.6
Commonwealth (off-budget) SRES (estimated component) 932.3
NSW (budget) Solar Flagships 50.0
NSW (budget) Regional Clean Energy Program 0.2
VIC (budget) Solar Systems Stage 2 3.0
QLD FiT (off-budget) Solar Bonus Scheme 347.3
ACT FiT (off-budget) ACT Electricity Feed-in Tariff Scheme 14.0
NSW FiT (budget) Solar Bonus Scheme 205.1
SA FiT (off-budget) Solar Feed-in Tariff Scheme 124.7
VIC FiT (off-budget) Premium FiT, Transitional FiT 111.9
WA FiT (budget/off-budget) Residential Net Feed-in Tariff Scheme 52.4
Total 2,001.9
Wind
Commonwealth (off-budget) LRET (estimated component) 386.4
Commonwealth (budget) CEFC (estimated component) 2.0
NSW (budget) Regional Clean Energy Program (estimated component) 0.2
Total 388.4
Table 3 Detailed electricity production subsidy estimates, Australia (2013–14)

20 Minerals Council of Australia
A.1 Coal generation subsidies
Jurisdiction Scheme Purpose/notes Data source
Commonwealth (budget)
Carbon Capture and Storage Flagships
Construction and demonstration of large scale integrated carbon capture and storage proj-ects in Australia
PC 2015, p. 204
VIC (budget) CarbonNet As above Public Accounts and Estimates Committee: 2013–14 Budget Esti-mates Questionnaire, DSDBI
VIC (budget) Low Emission Energy Technologies (LEET)/Brown Coal Innovation Limited
Technologies to reduce the environmental impact from sustainable use of brown coal
DSDBI, Annual Report 2013-14
VIC (budget) Melbourne Carbon Market Project
Developing national and international carbon markets
DSDBI, Annual Report 2013-14
Table 4 Coal generation technologies subsidies – notes and sources
Notes: DSDBI refers to Department of State Development, Business and Innovation
Geothermal
Commonwealth (budget) ARENA (estimated component) 31.4
Total 31.4
All other renewables
Commonwealth (budget) Australian Renewable Energy Agency (est. component) 73.3
Commonwealth (budget) Clean Energy Finance Corporation (est. component) 0.9
Commonwealth (off-budget) LRET (estimated component) 279.9
SA (budget) RenewablesSA (estimated component) 0.8
VIC (budget) ETIS Future Energy 2 Sustainable Energy 3.6
WA (budget) Low Emissions Energy Development Fund 6.2
Total 364.8
Coal mining
Commonwealth (budget) Coal Mining Abatement Support Package 3.1
Commonwealth (budget) National Low Emissions Coal Initiative 5.7
NSW (budget) Coal Innovation NSW Fund 2.5
WA (budget) Coal Industry Development 0.2
Total 11.4
Continued ...
Table 3 Detailed subsidy estimates, Australia (2013–14)
Figures may not add up due to rounding.
21Electricity production subsidies in Australia
A.2 Natural gas generation subsidies
The Queensland Gas Scheme (QGS) began in 2005 and was closed at the end of 2013. Under the QGS, Queensland electricity retailers and other liable parties were required to source a prescribed percentage of their electricity from gas-fired generation. The cost of the QGS was estimated on the basis of ACIL Tasman’s (2013) estimated cost in 2013-14 of $0.25/MWh, multiplied by estimated electricity production in Queensland in that year.
A.3 Solar generation subsidies
A.3.1 Solar feed-in tariffs (FiTs)A feed-in tariff (FiT) is a payment for small-scale renewable generation, typically from solar panels installed by customers. FiTs are commonly recovered by distribution network service providers (DNSPs) via a levy from customers as a whole. The early (very generous) FiTs are closed to new entrants, but existing participants continue to receive payments. There is general agreement that small-scale generation does not reduce network costs, e.g. IPART (2012):
We found that PV exports are unlikely to materially reduce network costs in NSW. Any benefits that arise are likely to be location and time-specific (in areas that need upgrading). At current levels of PV installation these benefits are likely to be small because the current level of PV exports cannot offset the need for network upgrades. In addition these potential network benefits may be offset by system-wide cost increases as a result of the uptake of small-scale PV.
Also, Queensland Audit Office (2013-14):
However, solar PV generation does not reduce the cost of the network as peak demand remains constant and the full capacity of the network is still required during these peak periods.
Notwithstanding any benefits of distributed generation (including residential PV installations), a high penetration of distributed generation can present significant challenges to distribution networks (McDonald et al. 2013, EPRI 2005). A certain amount of distributed generation can generally be accommodated on a given distribution system without making
changes to protective devices or operating procedures, but this varies considerably by local network topology, by load characteristics, according to the generation technology and many other factors. However, beyond a certain point, negative effects appear that relate to difficulties in regulating local voltages, other issues with power quality which may interfere with the operation of equipment and shorten equipment life, and raised fault levels.4
These problems arise because distributed generation effectively reverses the traditional role of distribution networks. To date, the purpose of these networks has been to transport electricity from terminal stations to end users in a unidirectional manner. Distribution systems are therefore designed for diminishing network power flows at each subsequent lower voltage level, and networks are built with reducing physical circuit capacities as they approach customers (known as circuit ‘tapering’). Output from distributed generation can reverse the direction of load flows. Particularly at lower voltage levels, tapering can inhibit multi-directional power flows and introduce difficulties in integrating distributed generation. The main impacts of multidirectional power flows then relate to the need to:
• Reconfigure protection systems, which have been designed to operate for unidirectional power flows
• Install more complex voltage controls and reactive power compensation and protections
• Reconfigure the switchgear required to deal with short circuit currents and fault levels at the point of connection and at adjacent voltage levels.
Overall, a high penetration of distributed generation relative to the local capability of the network requires placing numerous fault interrupters along the feeders, each with directional and distance relaying, a potentially costly exercise (EPRI 2005). Considerable communications and control infrastructure also has to be added.
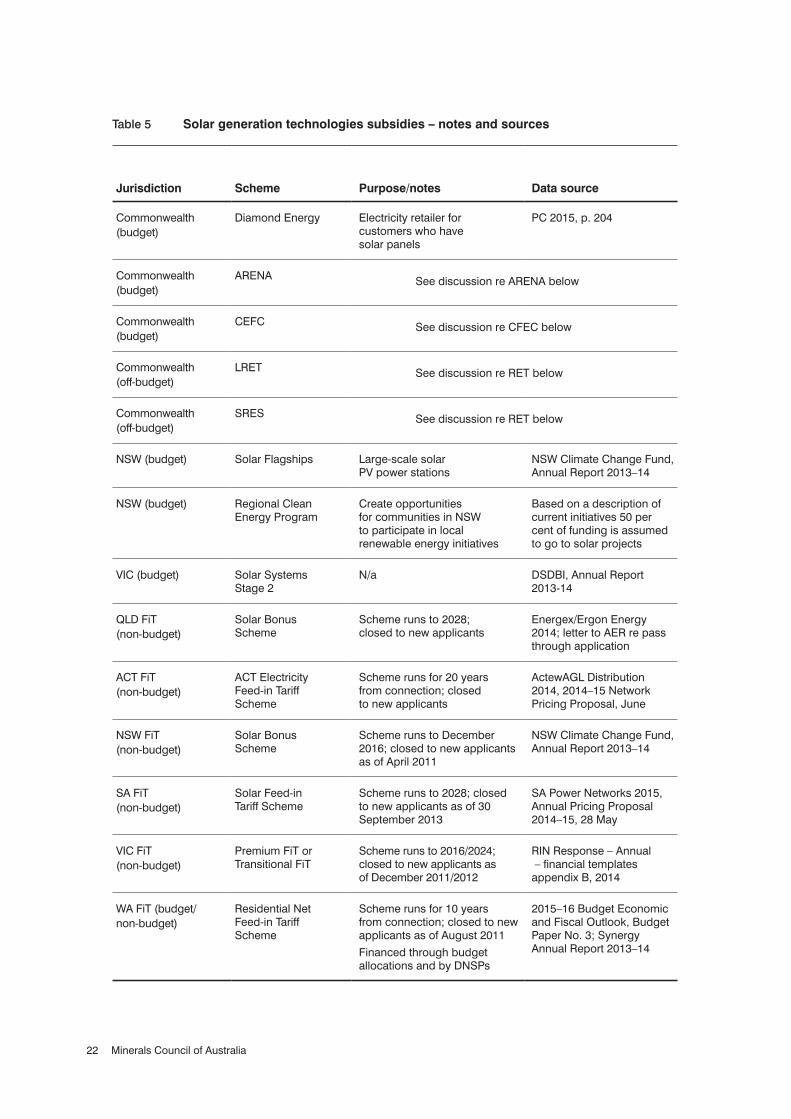
A.3.2 Solar generation subsidiesTable 5 shows solar generation subsidies, including subsidies for FiTs. It has not been possible to find estimates for FiT subsidies for the Northern Territory and Tasmania.
22 Minerals Council of Australia
Jurisdiction Scheme Purpose/notes Data source
Commonwealth (budget)
Diamond Energy Electricity retailer for customers who have solar panels
PC 2015, p. 204
Commonwealth (budget)
ARENA See discussion re ARENA below
Commonwealth (budget)
CEFC See discussion re CFEC below
Commonwealth (off-budget)
LRET See discussion re RET below
Commonwealth (off-budget)
SRES See discussion re RET below
NSW (budget) Solar Flagships Large-scale solar PV power stations
NSW Climate Change Fund, Annual Report 2013–14
NSW (budget) Regional Clean Energy Program
Create opportunities for communities in NSW to participate in local renewable energy initiatives
Based on a description of current initiatives 50 per cent of funding is assumed to go to solar projects
VIC (budget) Solar Systems Stage 2
N/a DSDBI, Annual Report 2013-14
QLD FiT (non-budget)
Solar Bonus Scheme
Scheme runs to 2028; closed to new applicants
Energex/Ergon Energy 2014; letter to AER re pass through application
ACT FiT (non-budget)
ACT Electricity Feed-in Tariff Scheme
Scheme runs for 20 years from connection; closed to new applicants
ActewAGL Distribution 2014, 2014–15 Network Pricing Proposal, June
NSW FiT (non-budget)
Solar Bonus Scheme
Scheme runs to December 2016; closed to new applicants as of April 2011
NSW Climate Change Fund, Annual Report 2013–14
SA FiT (non-budget)
Solar Feed-in Tariff Scheme
Scheme runs to 2028; closed to new applicants as of 30 September 2013
SA Power Networks 2015, Annual Pricing Proposal 2014–15, 28 May
VIC FiT (non-budget)
Premium FiT or Transitional FiT
Scheme runs to 2016/2024; closed to new applicants as of December 2011/2012
RIN Response – Annual – financial templates appendix B, 2014
WA FiT (budget/ non-budget)
Residential Net Feed-in Tariff Scheme
Scheme runs for 10 years from connection; closed to new applicants as of August 2011
Financed through budget allocations and by DNSPs
2015–16 Budget Economic and Fiscal Outlook, Budget Paper No. 3; Synergy Annual Report 2013–14
Table 5 Solar generation technologies subsidies – notes and sources
23Electricity production subsidies in Australia
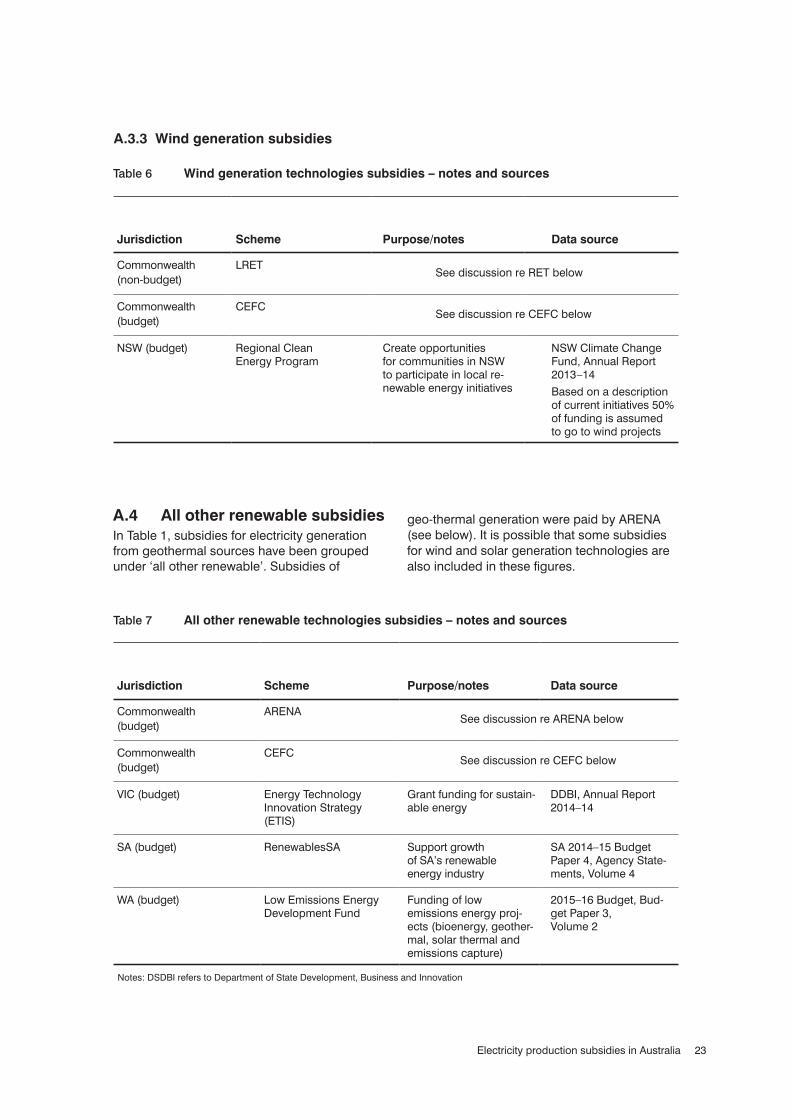
A.3.3 Wind generation subsidies
Jurisdiction Scheme Purpose/notes Data source
Commonwealth (non-budget)
LRETSee discussion re RET below
Commonwealth (budget)
CEFCSee discussion re CEFC below
NSW (budget) Regional Clean Energy Program
Create opportunities for communities in NSW to participate in local re-newable energy initiatives
NSW Climate Change Fund, Annual Report 2013–14
Based on a description of current initiatives 50% of funding is assumed to go to wind projects
Table 6 Wind generation technologies subsidies – notes and sources
A.4 All other renewable subsidiesIn Table 1, subsidies for electricity generation from geothermal sources have been grouped under ‘all other renewable’. Subsidies of
geo-thermal generation were paid by ARENA (see below). It is possible that some subsidies for wind and solar generation technologies are also included in these figures.
Jurisdiction Scheme Purpose/notes Data source
Commonwealth (budget)
ARENASee discussion re ARENA below
Commonwealth (budget)
CEFCSee discussion re CEFC below
VIC (budget) Energy Technology Innovation Strategy (ETIS)
Grant funding for sustain-able energy
DDBI, Annual Report 2014–14
SA (budget) RenewablesSA Support growth of SA’s renewable energy industry
SA 2014–15 Budget Paper 4, Agency State-ments, Volume 4
WA (budget) Low Emissions Energy Development Fund
Funding of low emissions energy proj-ects (bioenergy, geother-mal, solar thermal and emissions capture)
2015–16 Budget, Bud-get Paper 3, Volume 2
Table 7 All other renewable technologies subsidies – notes and sources
Notes: DSDBI refers to Department of State Development, Business and Innovation
24 Minerals Council of Australia
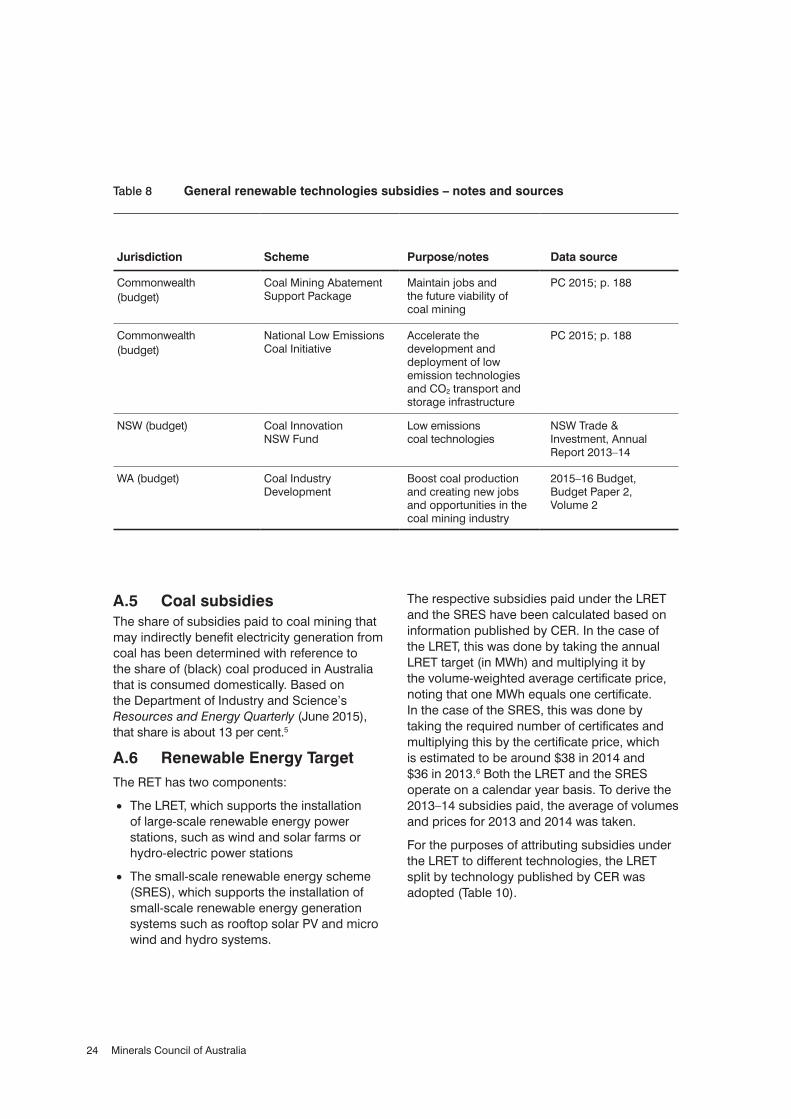
A.5 Coal subsidiesThe share of subsidies paid to coal mining that may indirectly benefit electricity generation from coal has been determined with reference to the share of (black) coal produced in Australia that is consumed domestically. Based on the Department of Industry and Science’s Resources and Energy Quarterly (June 2015), that share is about 13 per cent.5
A.6 Renewable Energy TargetThe RET has two components:
• The LRET, which supports the installation of large-scale renewable energy power stations, such as wind and solar farms or hydro-electric power stations
• The small-scale renewable energy scheme (SRES), which supports the installation of small-scale renewable energy generation systems such as rooftop solar PV and micro wind and hydro systems.
The respective subsidies paid under the LRET and the SRES have been calculated based on information published by CER. In the case of the LRET, this was done by taking the annual LRET target (in MWh) and multiplying it by the volume-weighted average certificate price, noting that one MWh equals one certificate. In the case of the SRES, this was done by taking the required number of certificates and multiplying this by the certificate price, which is estimated to be around $38 in 2014 and $36 in 2013.6 Both the LRET and the SRES operate on a calendar year basis. To derive the 2013–14 subsidies paid, the average of volumes and prices for 2013 and 2014 was taken.
For the purposes of attributing subsidies under the LRET to different technologies, the LRET split by technology published by CER was adopted (Table 10).
Jurisdiction Scheme Purpose/notes Data source
Commonwealth (budget)
Coal Mining Abatement Support Package
Maintain jobs and the future viability of coal mining
PC 2015; p. 188
Commonwealth (budget)
National Low Emissions Coal Initiative
Accelerate the development and deployment of low emission technologies and CO2 transport and storage infrastructure
PC 2015; p. 188
NSW (budget) Coal Innovation NSW Fund
Low emissions coal technologies
NSW Trade & Investment, Annual Report 2013–14
WA (budget) Coal Industry Development
Boost coal production and creating new jobs and opportunities in the coal mining industry
2015–16 Budget, Budget Paper 2, Volume 2
Table 8 General renewable technologies subsidies – notes and sources
25Electricity production subsidies in Australia
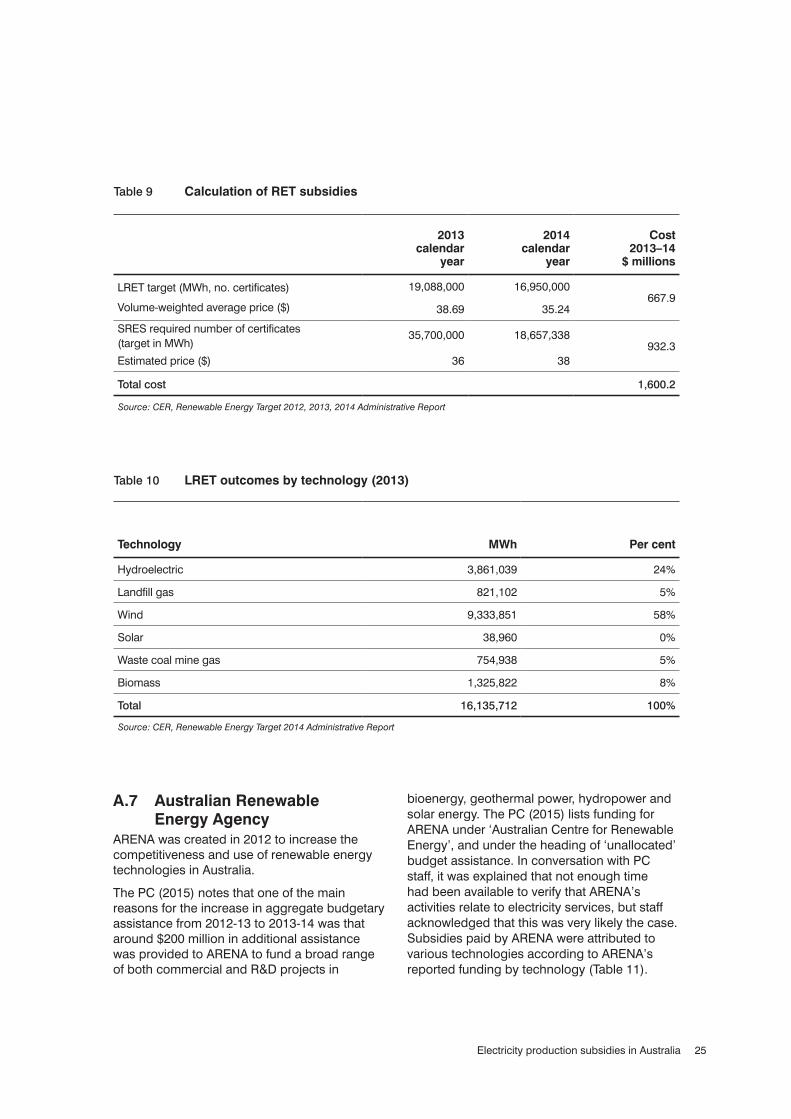
A.7 Australian Renewable Energy Agency
ARENA was created in 2012 to increase the competitiveness and use of renewable energy technologies in Australia.
The PC (2015) notes that one of the main reasons for the increase in aggregate budgetary assistance from 2012-13 to 2013-14 was that around $200 million in additional assistance was provided to ARENA to fund a broad range of both commercial and R&D projects in
bioenergy, geothermal power, hydropower and solar energy. The PC (2015) lists funding for ARENA under ‘Australian Centre for Renewable Energy’, and under the heading of ‘unallocated’ budget assistance. In conversation with PC staff, it was explained that not enough time had been available to verify that ARENA’s activities relate to electricity services, but staff acknowledged that this was very likely the case. Subsidies paid by ARENA were attributed to various technologies according to ARENA’s reported funding by technology (Table 11).
2013 calendar
year
2014 calendar
year
Cost 2013–14
$ millions
LRET target (MWh, no. certificates) 19,088,000 16,950,000667.9
Volume-weighted average price ($) 38.69 35.24
SRES required number of certificates (target in MWh)
35,700,000 18,657,338932.3
Estimated price ($) 36 38
Total cost 1,600.2
Table 9 Calculation of RET subsidies
Source: CER, Renewable Energy Target 2012, 2013, 2014 Administrative Report
Technology MWh Per cent
Hydroelectric 3,861,039 24%
Landfill gas 821,102 5%
Wind 9,333,851 58%
Solar 38,960 0%
Waste coal mine gas 754,938 5%
Biomass 1,325,822 8%
Total 16,135,712 100%
Table 10 LRET outcomes by technology (2013)
Source: CER, Renewable Energy Target 2014 Administrative Report

26 Minerals Council of Australia
A.8 Clean Energy Finance Corporation
The CEFC invests to overcome market barriers and mobilise investment in renewable energy, energy efficiency and low emissions technologies. According to the CEFC’s 2013–14 Annual Report, $8 million was received from government. 62 per cent of funding was targeted at renewable energy generation with the remainder going to energy efficiency and low emissions technology projects (30 per cent and 8 per cent, respectively). The 62 per cent figure has therefore been applied to CEFC’s government funding in 2013–14. Around 25 per cent of total CEFC funding was used to finance wind generation projects, 26 per cent was used to finance solar projects, and the remainder went to finance other forms of renewable energy generation. Subsidies paid by CEFC were allocated on that basis.
In its 2014 Trade and Assistance Review, the PC dedicated a page to the CEFC, concluding that the corporation provides interest rate subsidies to what are essentially commercial projects. The CEFC is not mentioned in the 2015 review.
A.9 2013-14 electricity production estimates
2013–14 electricity production estimates have not yet been published by the Department of Industry and Science. To derive a preliminary estimate of the 2013–14 numbers, the approach that was taken was to use the 2012–13 Bureau of Resources and Energy Economics (BREE) Australia-wide estimates, by type of fuel, and to adjust these by the percentage changes by relevant technology/fuel that have been published for the National Electricity Market for 2013–14 by the Department of the Environment.
Technology Percentage funding
Solar PV 43%
Solar thermal 17%
Geothermal 12%
Marine 9%
Renewable Energy Venture Capital Fund 8%
Bioenergy 6%
Hybrid and enabling 5%
Total 100
Table 11 ARENA funding by technology (as of 30 June 2014)
Source: Australian Renewable Energy Agency, Annual Report 2013–14
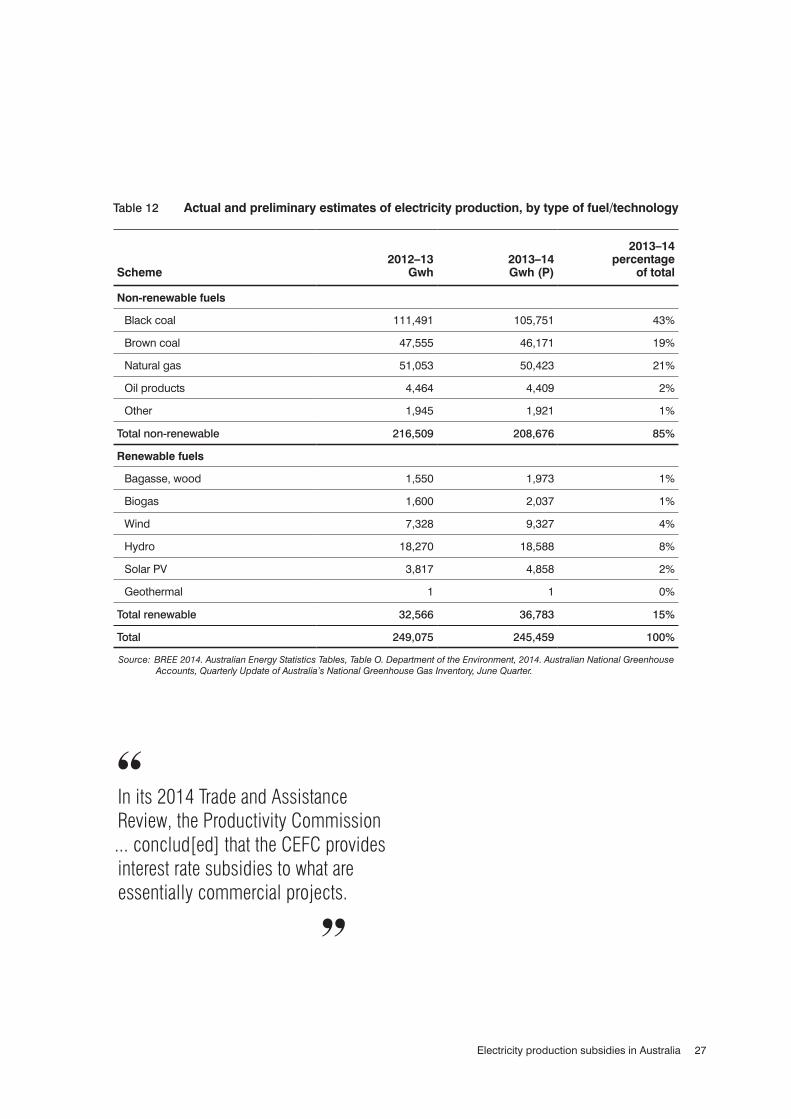
27Electricity production subsidies in Australia
Scheme2012–13
Gwh2013–14 Gwh (P)
2013–14 percentage
of total
Non-renewable fuels
Black coal 111,491 105,751 43%
Brown coal 47,555 46,171 19%
Natural gas 51,053 50,423 21%
Oil products 4,464 4,409 2%
Other 1,945 1,921 1%
Total non-renewable 216,509 208,676 85%
Renewable fuels
Bagasse, wood 1,550 1,973 1%
Biogas 1,600 2,037 1%
Wind 7,328 9,327 4%
Hydro 18,270 18,588 8%
Solar PV 3,817 4,858 2%
Geothermal 1 1 0%
Total renewable 32,566 36,783 15%
Total 249,075 245,459 100%
Table 12 Actual and preliminary estimates of electricity production, by type of fuel/technology
Source: BREE 2014. Australian Energy Statistics Tables, Table O. Department of the Environment, 2014. Australian National Greenhouse Accounts, Quarterly Update of Australia’s National Greenhouse Gas Inventory, June Quarter.
In its 2014 Trade and Assistance Review, the Productivity Commission ... conclud[ed] that the CEFC provides interest rate subsidies to what are essentially commercial projects.

28 Minerals Council of Australia
A.10 AEMC household bill estimates
State/territory SE QLD NSW VIC ACT SA WA TAS NT
Annual bill $1,302 $1,869 $1,339 $1,559 $1633 $1,497 $1,885 $2,366
Renewable subsidy component $109 $107 $97 $122 $155 $75 $62 $84
of which:
LRET $26 $39 $27 $42 $32 $36 $62 $35
SRES $28 $42 $30 $46 $34 $39 $0 $49
FiT $55 $27 $40 $34 $89 $0 $0 $0
Percentage of annual bill 8% 6% 7% 8% 9% 5% 3% 4%
Table 13 Costs of environmental policies for households (2013–14)
Source: Australian Renewable Energy Agency, Annual Report 2013–14

29Electricity production subsidies in Australia
Endnotes
1 Payments for ‘public goods’ (such as defence) are not usually considered subsidies. Most definitions limit the use of the term ‘subsidy’ to transfers to firms, including producer households, and other entities.
2 Under current FiT schemes, retailers may be encouraged or required to offer an additional feed-in tariff corresponding to the value of the renewable energy generated by the customer.
3 These include the Commonwealth Coal Mining Abatement Support Package and National Low Emissions Coal Initiative, Coal Innovation NSW, and Coal Industry Development (WA).
4 For instance, the area closest to a substation tends to be the ‘strongest’ area, i.e. it has the greatest short circuit current availability and the best voltage regulation. In contrast, at more remote sections of the network, distributed generation can amount to only 5 per cent of the feeder capacity when conflicts begin to appear.
5 In 2013-14, black, saleable coal production amounted to 430 Mt. Thermal and metallurgical coal exports amounted to 375 Mt. http://www.industry.gov.au/Office-of-the-Chief-Economist/Publications/Pages/Resources-and-energy-quarterly.aspx
6 E.g. ACIL Allen Consulting (2014) and CER (2014).
30 Minerals Council of Australia
References
ACIL Tasman, Estimated energy costs for 2013-14 retail tariffs: Estimated energy costs for use by the Queensland Competition Authority in its Final Determination on retail electricity tariffs for 2013-14, Report for the Queensland Competition Authority, Brisbane, May 2013.
ACIL Allen, Renewable Energy Target Review: Market Modelling of Various RET options, Melbourne, 2014.
Australian Energy Markets Commission, Residential Electricity Price Trends Report, Melbourne, 5 December 2014.
Australian Government, The Renewable Energy Target (RET) scheme, at: http://www.environment.gov.au/climate-change/renewable-energy-target-scheme; accessed on 17 July 2015.
Clean Energy Regulator, Renewable Energy Target, Administrative Report, Canberra, 2014.
S Davidson, Mining taxes and subsidies: official evidence, Minerals Council of Australia, Canberra, 2012.
Energy Networks Association, National Electricity Amendment (Distribution Network Pricing Arrangements) Rule 2014 (ERC0161), Canberra, 19 December, 2013.
Electric Power Research Institute, Power Quality Impacts of Distributed Generation: Final Report, Washington, March 2005.
R Ford & W Suyker, Industrial subsidies in the OECD economies, Paris: OECD, 1990.
Independent Pricing and Regulatory Tribunal, The impact of green schemes on a typical residential electricity retail bill from 1 July 2013, Sydney, 17 June, 2013.
Independent Pricing and Regulatory Tribunal PART, Solar feed-in tariffs, Setting a fair and reasonable value for electricity generated by small-scale solar PV units in NSW, Energy – Final Report, Sydney, March 2012.
Productivity Commission, Carbon Emission Policies in Key Economies, Research Report, Canberra, 2011.
Productivity Commission, Trade and Assistance Review 2013-14, June 2015.
Queensland Audit Office, Results of audit: Energy sector entities 2012-13; Report to Parliament, Brisbane, 2014.
Queensland Competition Authority, Final Report, Estimating a Fair and Reasonable Solar Feed-in Tariff for Queensland, March 2013.
World Trade Organization, Defining Subsidies, Geneva, 2006.
J McDonald, B Wojszczyk, B Flynn & I Voloh. ‘Distribution Systems, Substations, and Integration of Distributed Generation’, Electrical Transmission Systems and Smart Grids. Springer, New York, 2013, pp. 7-68.
SKM-MMA, Modelling The Renewable Energy Target: Report For The Climate Change Authority, Melbourne, December 2012.
Synergies Economic Consulting & ROAM Consulting, Impact of green energy policies on electricity prices, Report for the Business Council of Australia, Melbourne, July 2014.


PO
LICY
PAP
ER
Minerals Council of Australia
Level 3, 44 Sydney Ave, Forrest ACT 2603 (PO Box 4497, Kingston ACT Australia 2604)P. + 61 2 6233 0600 | F. + 61 2 6233 0699 www.minerals.org.au | [email protected]