electricity wheeling/transmission pricing framework … wheeling... · electricity...
TRANSCRIPT
Planning Energy for a Sustainable World
Electricity Wheeling/Transmission Pricing
Framework for Jamaica Training Seminar
PPA Energy 3rd December 2012

Project programme
2
Schedule of Activities
22-Oct 29-Oct 05-Nov 12-Nov 19-Nov 26-Nov 03-Dec 10-Dec 17-Dec 24-Dec 31-Dec 07-Jan 14-Jan
Jamaica Wheeling Charges including cost of service study 1 2 3 4 5 6 7 8 9 10 11 12 13
1
1.1 Review relevant documents1.2 JPS data review1.3 Obtaining and review of documents for cost of service study1.4 Inception report
2
2.1 Compare wheeling charge methodologies2.2 Examine cost implications of congestion2.3 Examine time of day implications2.4 Consider distribution wheeling charges2.5 Recommend a wheeling charge methodology
3
3.1 Prepare methodological report
4
4.1 Prepare training session material4.2 Deliver training session on wheeling methodologies4.3 Approval from OUR on wheeling methodology4.4 Regulatory framework discussions
Review of Wheeling Charge Methods and Recommendation
Methodological report
Week Commencing
Review of Regulatory documents and other data
Training Session #1
Today’s programme
3
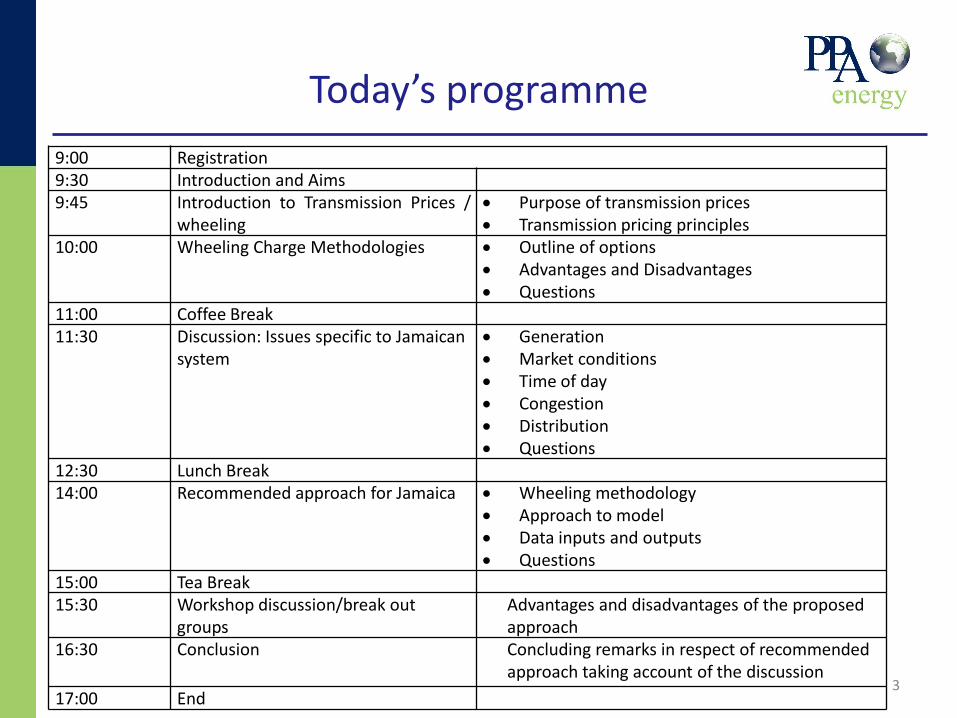
9:00 Registration 9:30 Introduction and Aims 9:45 Introduction to Transmission Prices /
wheeling Purpose of transmission prices Transmission pricing principles
10:00 Wheeling Charge Methodologies Outline of options Advantages and Disadvantages Questions
11:00 Coffee Break 11:30 Discussion: Issues specific to Jamaican
system Generation Market conditions Time of day Congestion Distribution Questions
12:30 Lunch Break 14:00 Recommended approach for Jamaica Wheeling methodology
Approach to model Data inputs and outputs Questions
15:00 Tea Break 15:30 Workshop discussion/break out
groups Advantages and disadvantages of the proposed approach
16:30 Conclusion Concluding remarks in respect of recommended approach taking account of the discussion
17:00 End
Outline
• Objectives
• Transmission pricing – Principles
• Transmission pricing methodology – Types
• Review of international practices
• Key influencing factors for Jamaica
• Recommendations
4

Objectives
• Develop a fair and practical framework for the provision of wheeling services on Jamaica’s transmission and distribution network and
• Facilitate regulatory capacity building in relation to wheeling charge methodologies and the computation of transmission and distribution network fees.
5
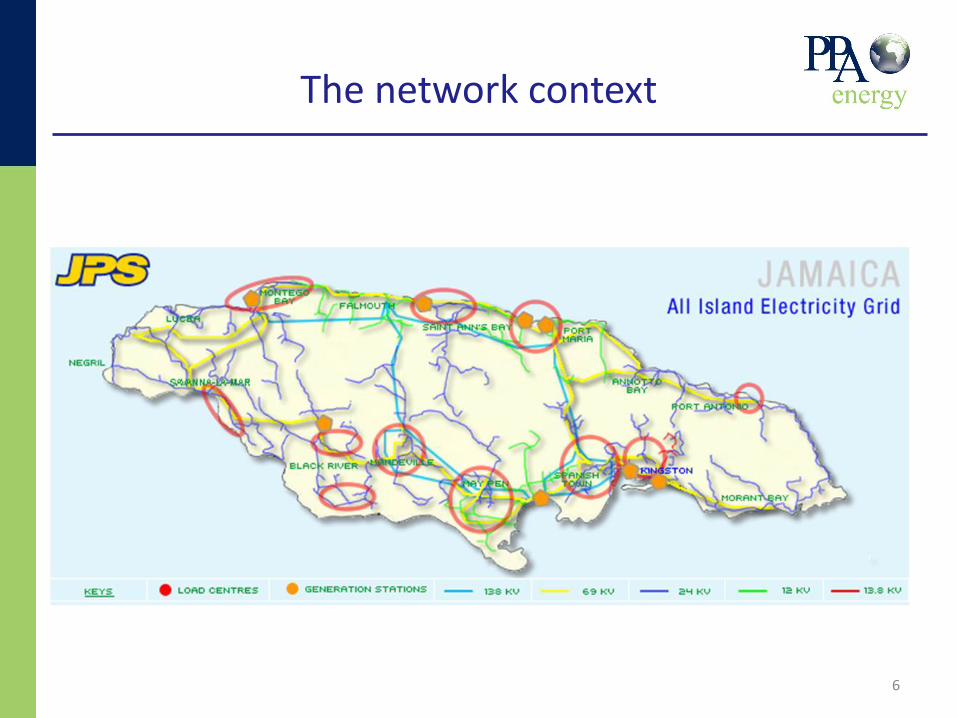
The network context
6
Transmission pricing – Principles
• Promote efficiency
• Recover costs
• Be transparent, fair and predictable
• Be non-discriminatory
7
Promotes efficiency
• Appropriate price signals to generation and demand
• Incentives for appropriate investment –locational signals
• Promotes competition
8
Recovers cost
• Security in cost recovery Lowered cost of capital
• Incentives for appropriate investment – if recovery of cost for appropriate investments is assured
• Different methods available for cost computation
• Historic cost, Future cost (nodal pricing)
• Transmission prices can recover – capital costs,
– O&M costs,
– losses
– congestion
9
Be transparent, fair and predictable
• Encourage new market participants
• Fair
• Stable- immune to ‘price shocks’
• Clear and straightforward to apply
10
Be non-discriminatory
• Treat the network users equally in non discriminating nature.
• Residual costs are allocated in a fair manner – Key issue: balance between user-specific and “socialised” costs
11
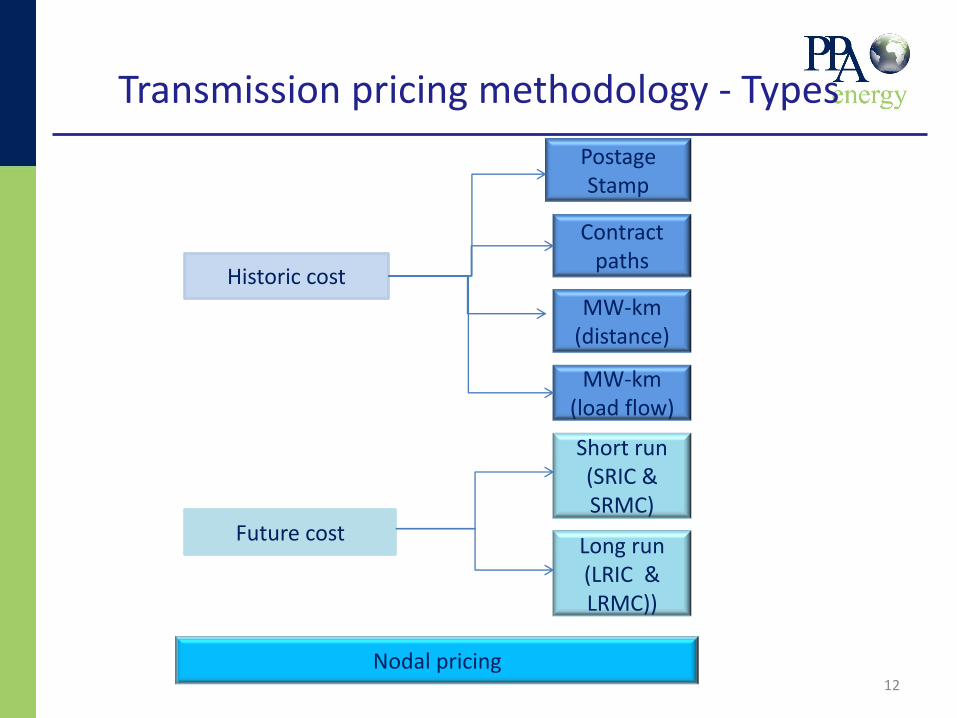
Transmission pricing methodology - Types
12
Historic cost
Future cost
Nodal pricing
Postage Stamp
Contract paths
MW-km (distance)
MW-km (load flow)
Short run (SRIC & SRMC)
Long run (LRIC & LRMC))
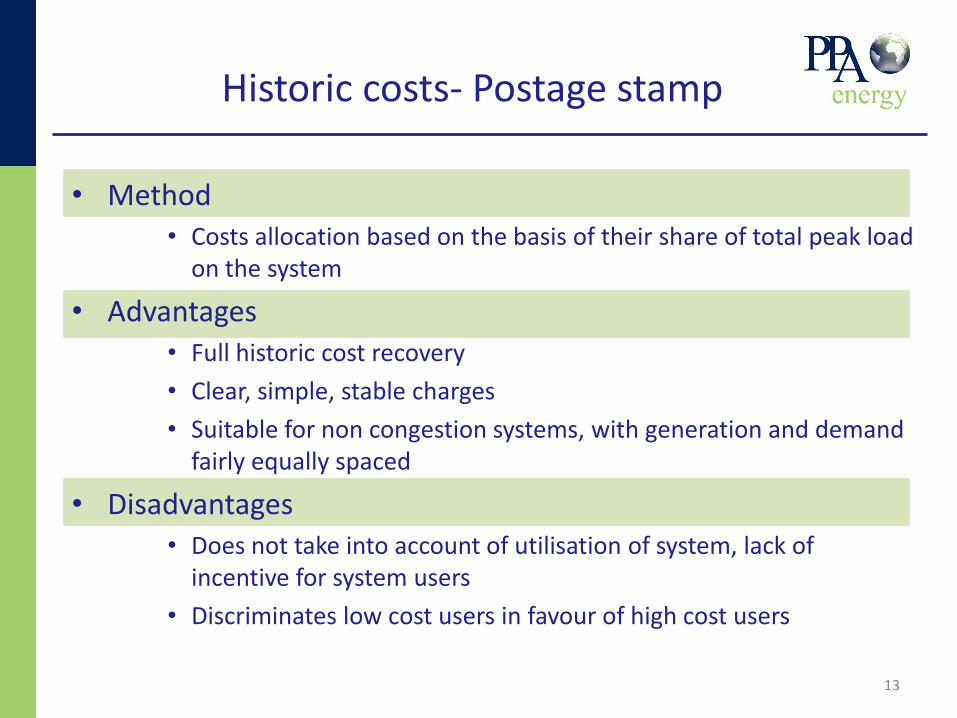
Historic costs- Postage stamp
• Method • Costs allocation based on the basis of their share of total peak load
on the system
• Advantages • Full historic cost recovery
• Clear, simple, stable charges
• Suitable for non congestion systems, with generation and demand fairly equally spaced
• Disadvantages • Does not take into account of utilisation of system, lack of
incentive for system users
• Discriminates low cost users in favour of high cost users
13
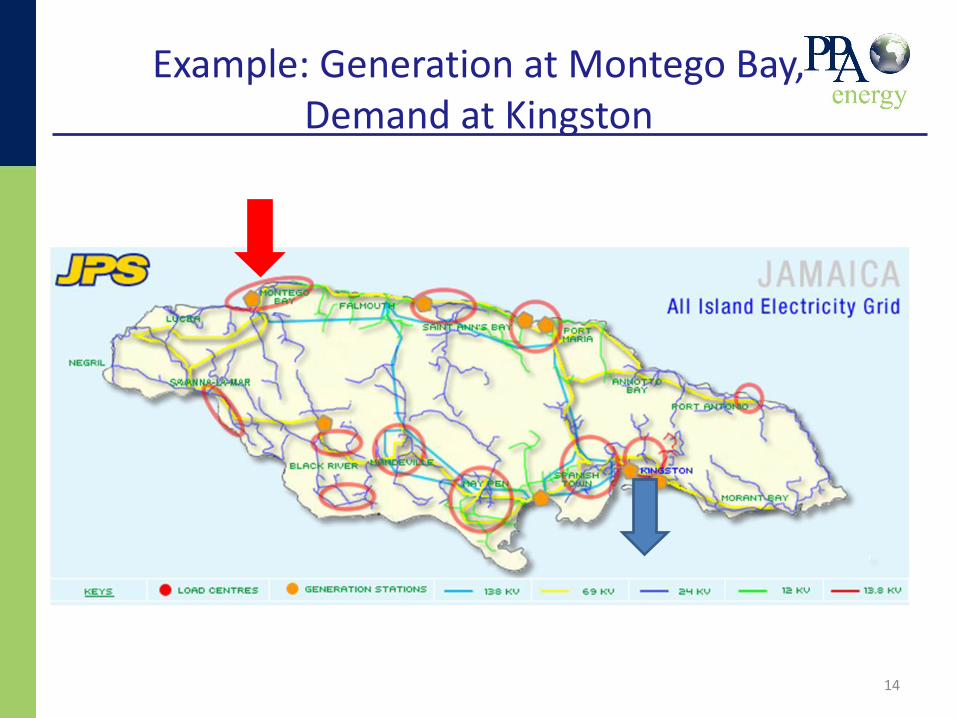
Example: Generation at Montego Bay, Demand at Kingston
14
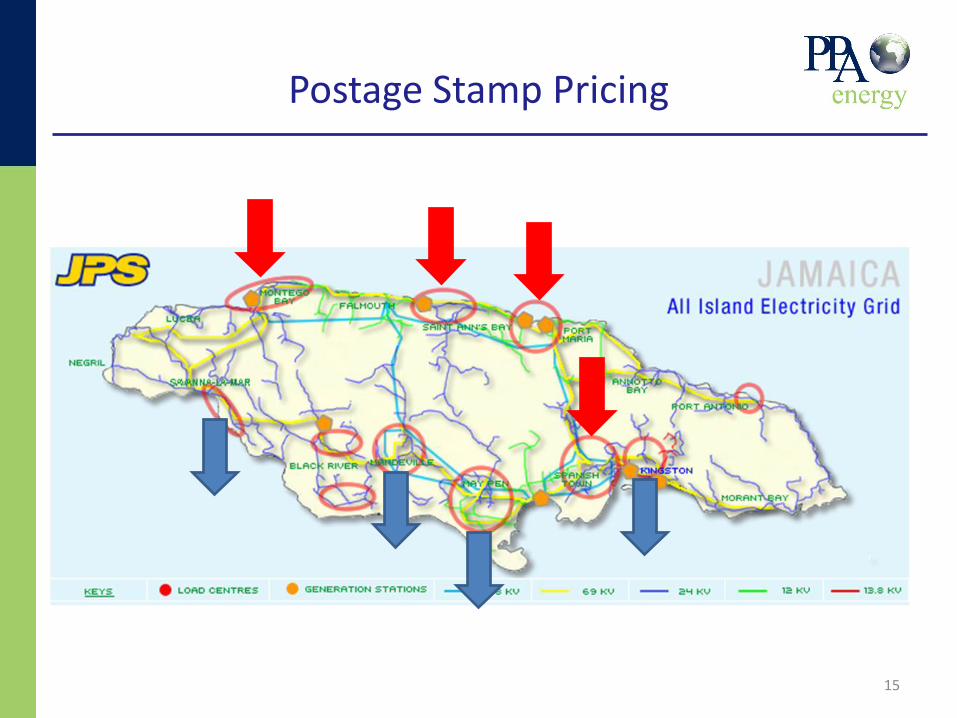
Postage Stamp Pricing
15
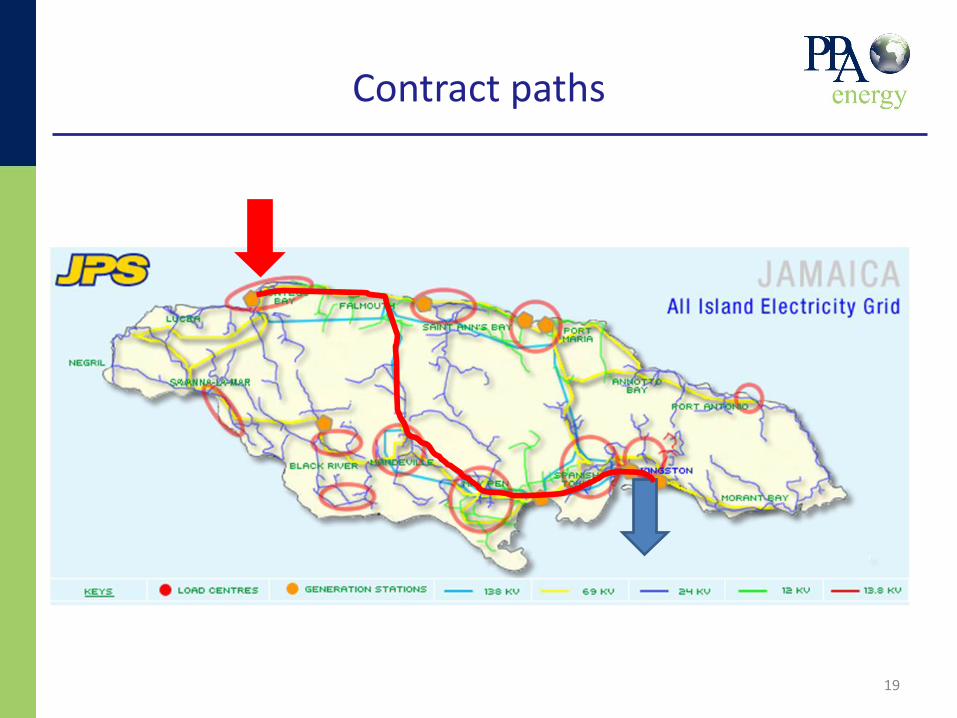
Historic costs- Contract paths
• Method • Costs based on the specific path agreed for an individual wheeling
transaction.
• Advantages • Full historic cost recovery encouraging efficient level of investment
• simple, stable charges
• An improved ability to signals the costs of decisions of individuals
• Disadvantages • Does not take into account of utilisation of system, lack of
incentive for system users
• Potentially discriminates between users
• Low economic efficiency as it may lead to investments out of contract path as well.
16
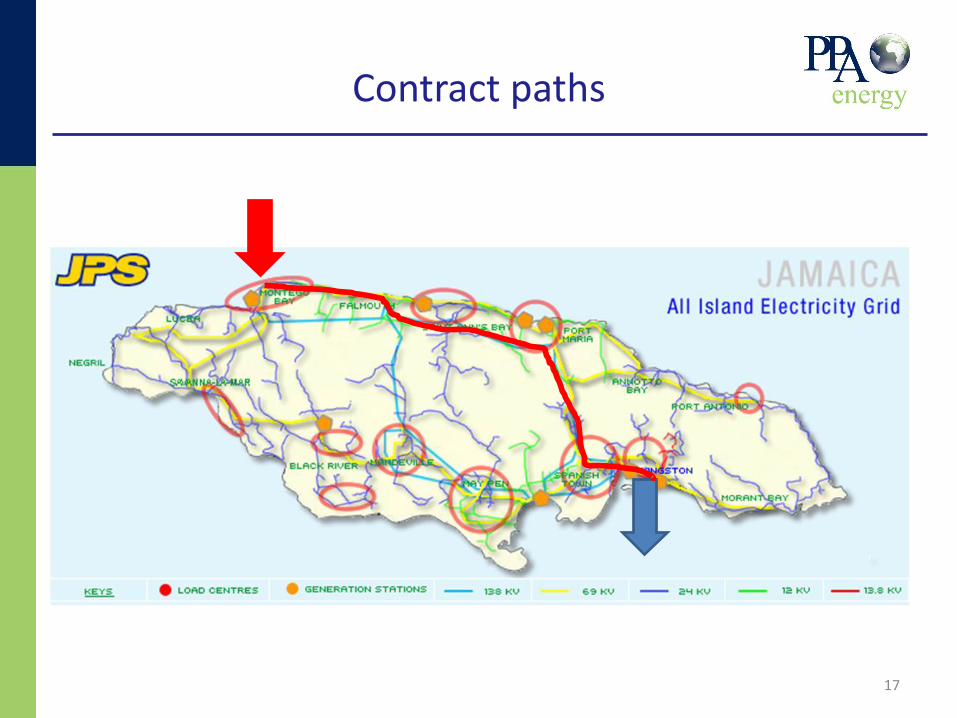
Contract paths
17

18
Contract paths
19
Contract paths
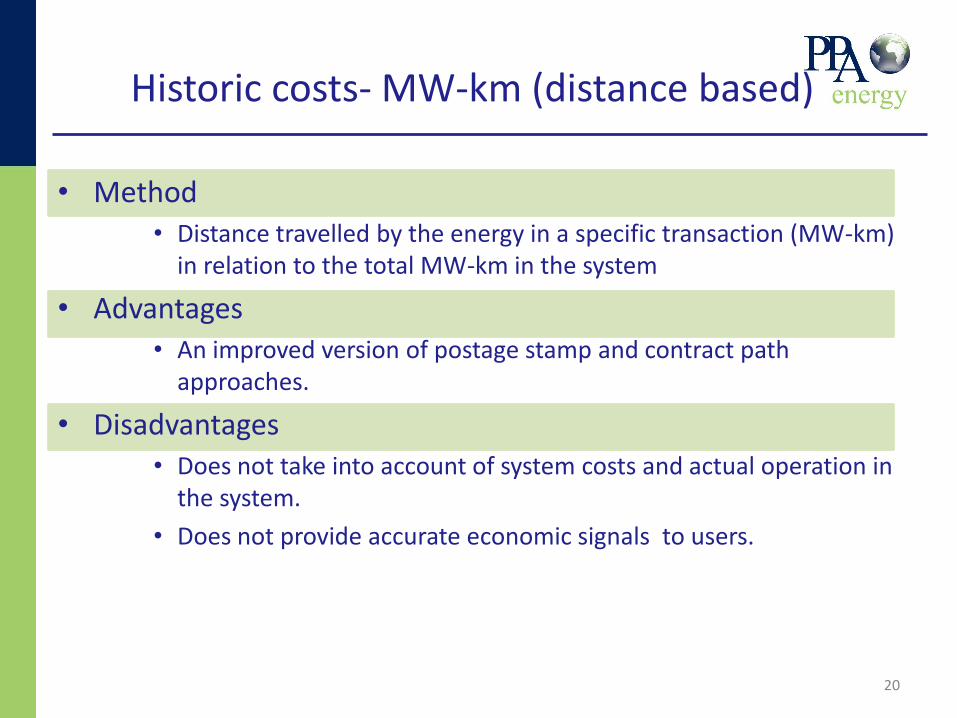
Historic costs- MW-km (distance based)
• Method • Distance travelled by the energy in a specific transaction (MW-km)
in relation to the total MW-km in the system
• Advantages • An improved version of postage stamp and contract path
approaches.
• Disadvantages • Does not take into account of system costs and actual operation in
the system.
• Does not provide accurate economic signals to users.
20
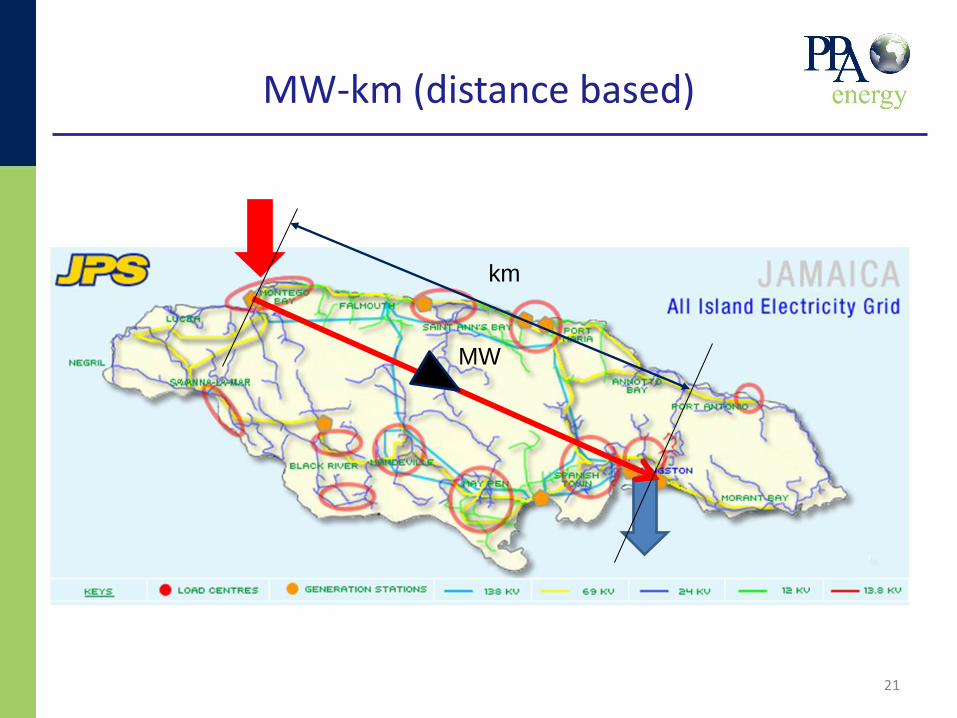
MW-km (distance based)
21
MW
km
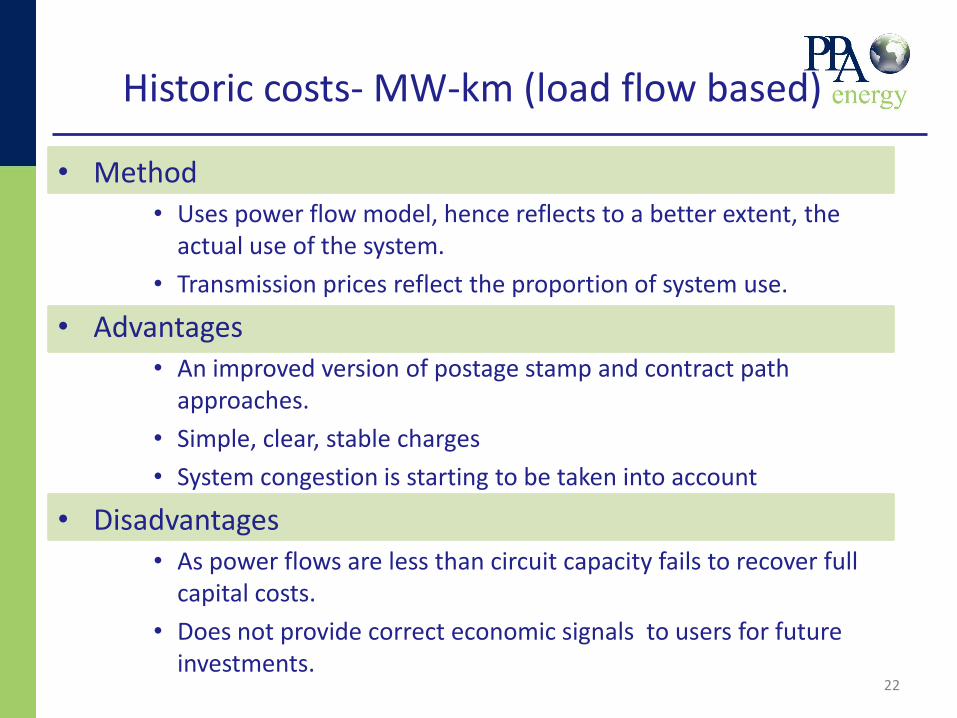
Historic costs- MW-km (load flow based)
• Method • Uses power flow model, hence reflects to a better extent, the
actual use of the system.
• Transmission prices reflect the proportion of system use.
• Advantages • An improved version of postage stamp and contract path
approaches.
• Simple, clear, stable charges
• System congestion is starting to be taken into account
• Disadvantages • As power flows are less than circuit capacity fails to recover full
capital costs.
• Does not provide correct economic signals to users for future investments.
22

MW-km (flow-based)
23
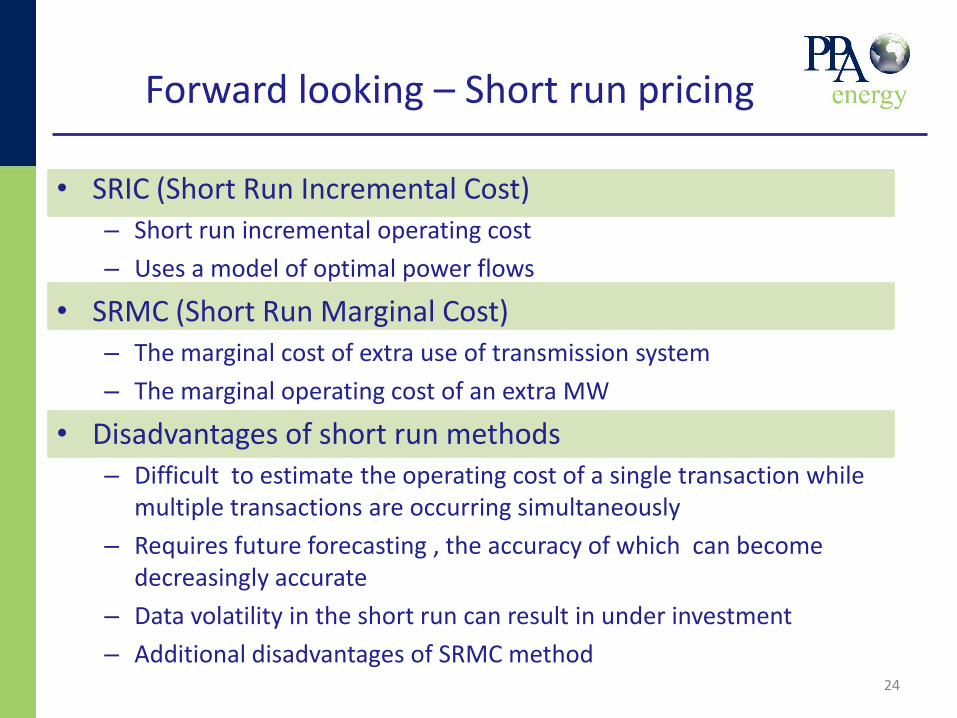
Forward looking – Short run pricing
• SRIC (Short Run Incremental Cost) – Short run incremental operating cost
– Uses a model of optimal power flows
• SRMC (Short Run Marginal Cost) – The marginal cost of extra use of transmission system
– The marginal operating cost of an extra MW
• Disadvantages of short run methods – Difficult to estimate the operating cost of a single transaction while
multiple transactions are occurring simultaneously
– Requires future forecasting , the accuracy of which can become decreasingly accurate
– Data volatility in the short run can result in under investment
– Additional disadvantages of SRMC method 24
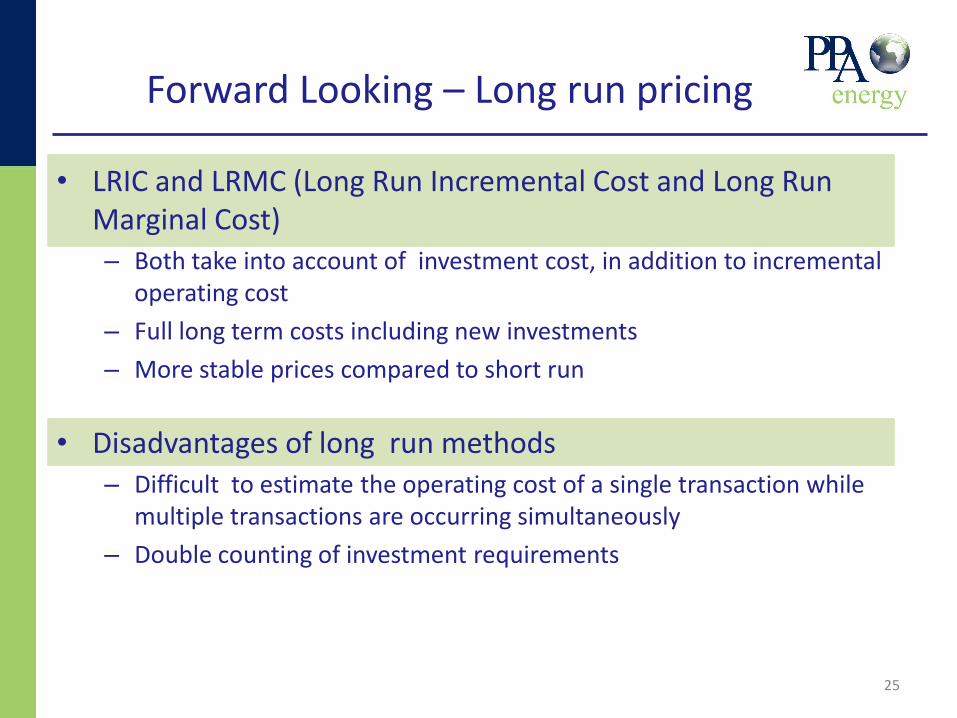
Forward Looking – Long run pricing
• LRIC and LRMC (Long Run Incremental Cost and Long Run Marginal Cost) – Both take into account of investment cost, in addition to incremental
operating cost
– Full long term costs including new investments
– More stable prices compared to short run
• Disadvantages of long run methods – Difficult to estimate the operating cost of a single transaction while
multiple transactions are occurring simultaneously
– Double counting of investment requirements
25
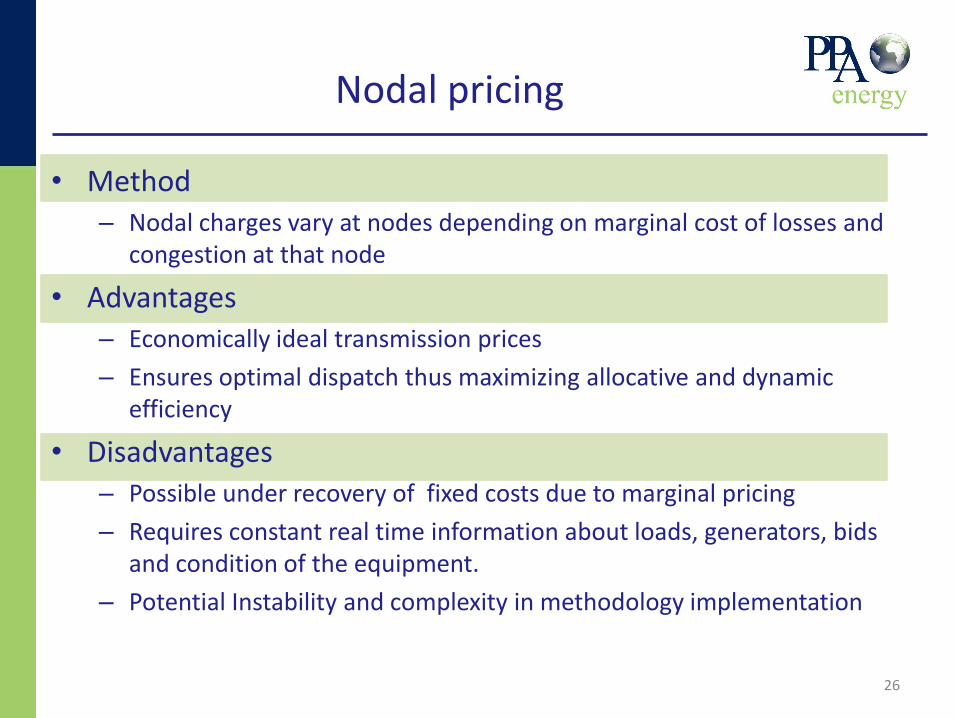
Nodal pricing
• Method – Nodal charges vary at nodes depending on marginal cost of losses and
congestion at that node
• Advantages – Economically ideal transmission prices
– Ensures optimal dispatch thus maximizing allocative and dynamic efficiency
• Disadvantages – Possible under recovery of fixed costs due to marginal pricing
– Requires constant real time information about loads, generators, bids and condition of the equipment.
– Potential Instability and complexity in methodology implementation
26

Nodal pricing
27
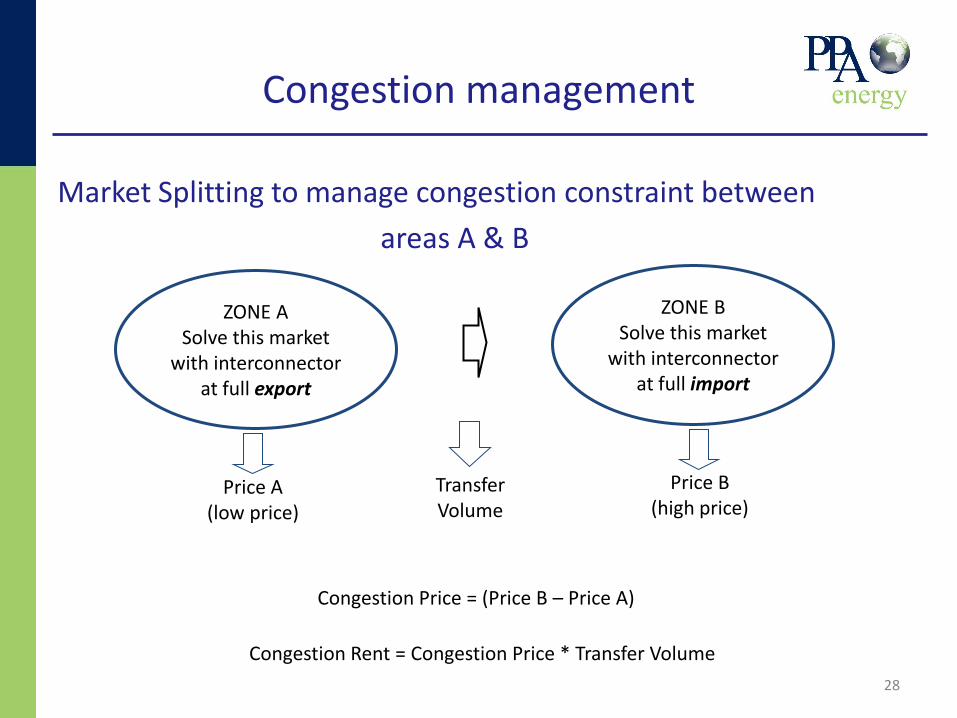
Congestion management
Market Splitting to manage congestion constraint between
areas A & B
28
ZONE A Solve this market
with interconnector at full export
ZONE B Solve this market
with interconnector at full import
Price A (low price)
Price B (high price)
Transfer Volume
Congestion Price = (Price B – Price A)
Congestion Rent = Congestion Price * Transfer Volume
Transmission pricing - International examples
• Nord Pool
• Ireland
• Southern African Power Pool (SAPP)
• Great Britain
• United states: PJM
• New Zealand
• Brazil
29
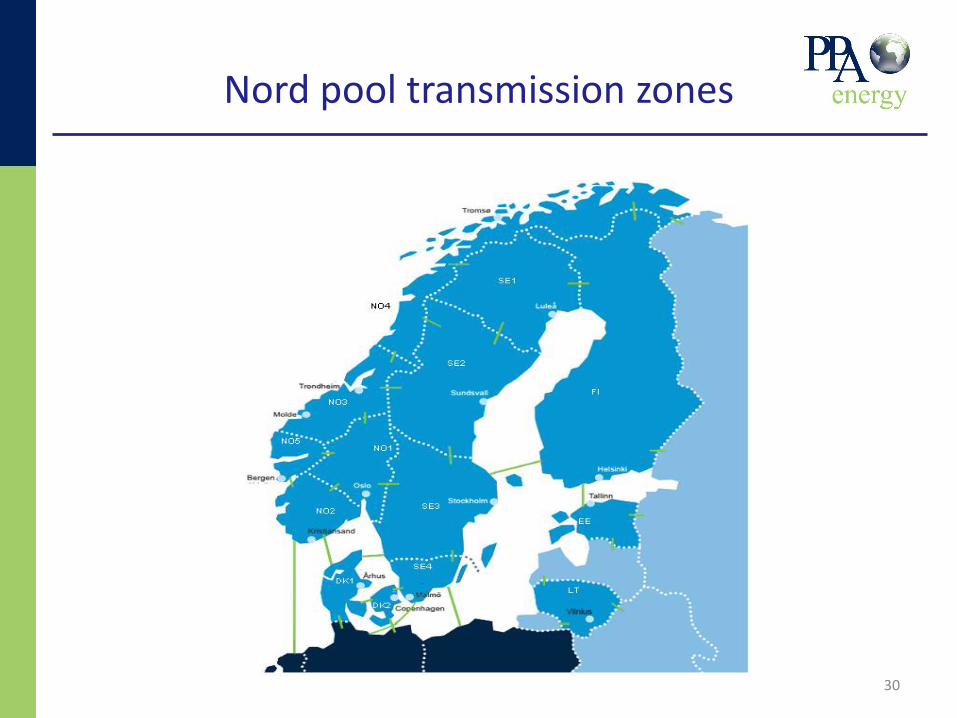
Nord pool transmission zones
30
International examples: Nord Pool
• Nord pool covers six countries in Europe: Denmark, Finland, Sweden, Norway, Estonia and Lithuania.
• Each country has its own TSO and often has more than one market areas.
• Nord pool spot market operates 14 market areas in six countries.
• Nord pool has Point or stamp tariff system
• Producers and consumers pay a fee for the kWh injected or drawn.
• Distance between the countries does not impact the prices.
• Each country has its own transmission tariff for within the country transactions. i.e in Norway, transmission charges include fixed, load and energy components.
• Each country has a different way of allocating charges between consumers and producers.
• Transmission losses (Elspot) – recovered by a standard trading fee Eur/MWh, paid by both buyers and sellers
31
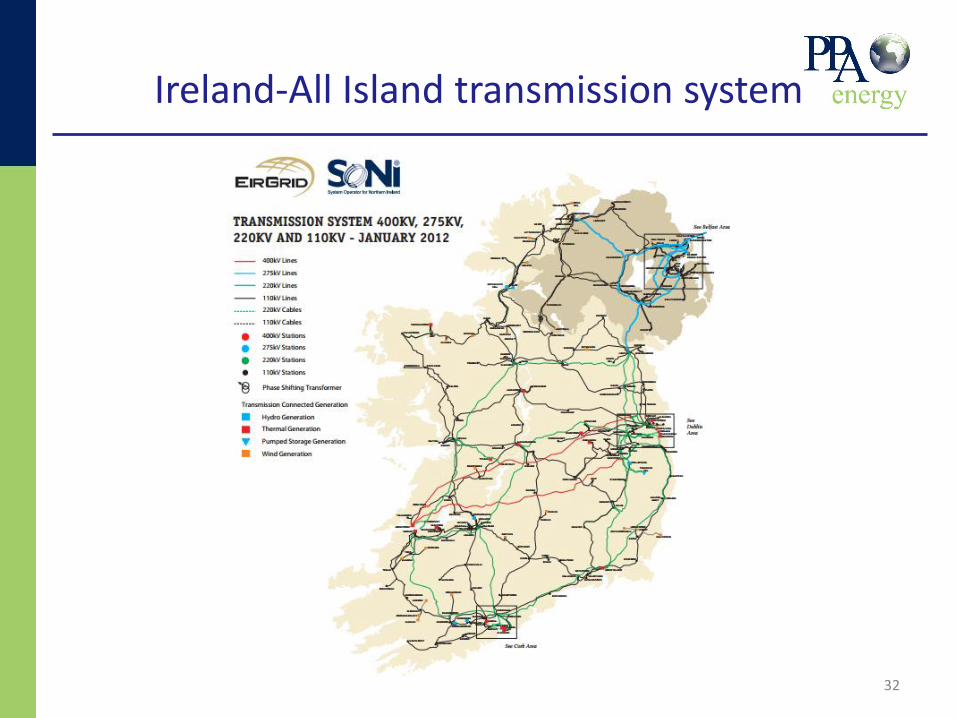
Ireland-All Island transmission system
32
International examples: Ireland
• Eirgrid is the TSO for Republic of Island (RoI) and SONI is the System Operator for Northern Ireland (NI)
• SEMO (Single Electricity Market Operator) operates the centralised gross pool/wholesale market.
• Transmission costs allocated 25:75 between generation and demand
• All island generator transmission tariff recovers 30% from locational element and 70% from a postage stamp element.
• Losses allocated to generators and interconnectors by Transmission Loss Adjustment Factors (TLAF)
33
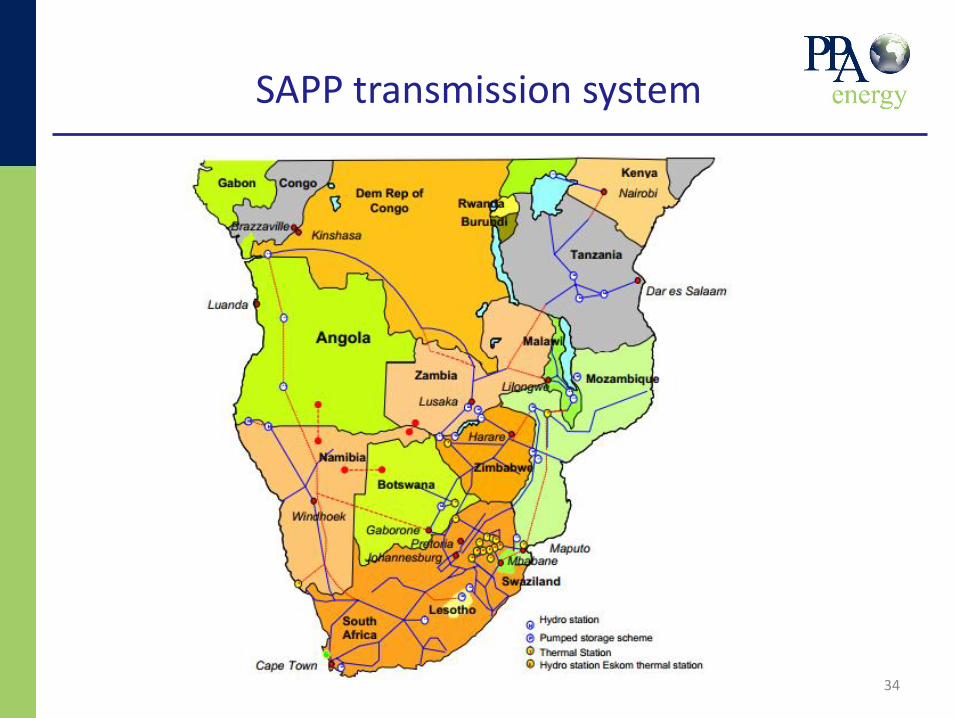
SAPP transmission system
34
International examples: SAPP
• SAPP includes utilities and ministries in energy use in 11 countries: Angola, Botswana, Lesotho, Malawi, Mozambique, Namibia, Swaziland, Tanzania, Zaire, Zimbabwe and South Africa.
• In 2003, SAPP moved from postage stamp to MW-km (load flow) methodology.
• In 2005, Plans to move to Nodal pricing did not go ahead due to various factors.
• Sophisticated Day Ahead Market (DAM) facilitates trading across interconnectors in real time.
• SAPP region is split into market zones that can split as constraints become binding on the interconnectors.
35
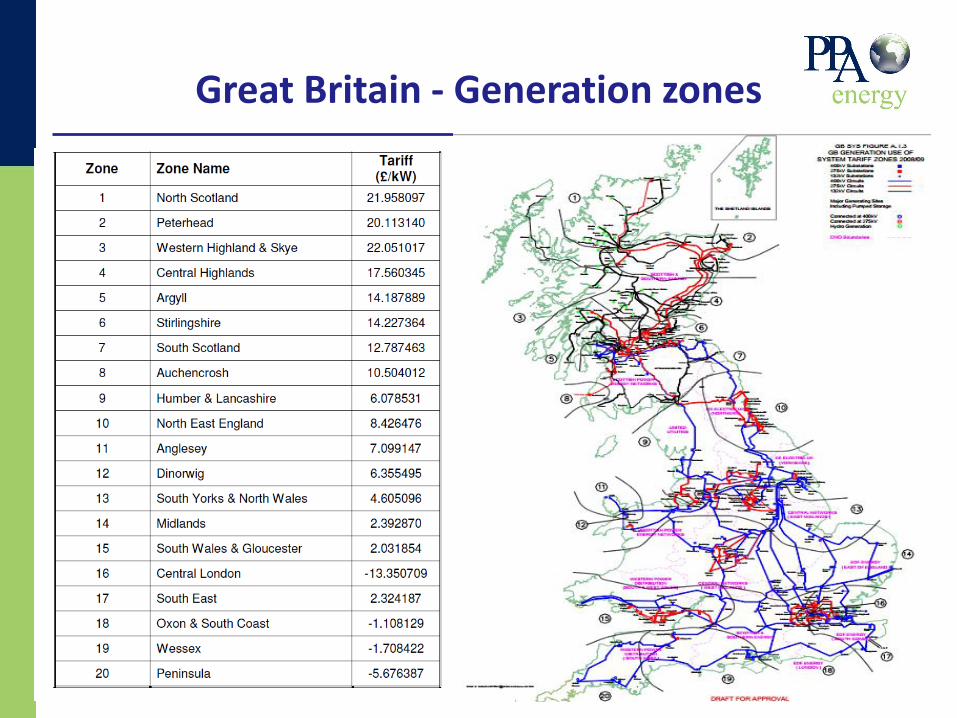
International examples: Great Britain
• National Grid is the System Operator in Great Britain (England, Scotland and Wales)
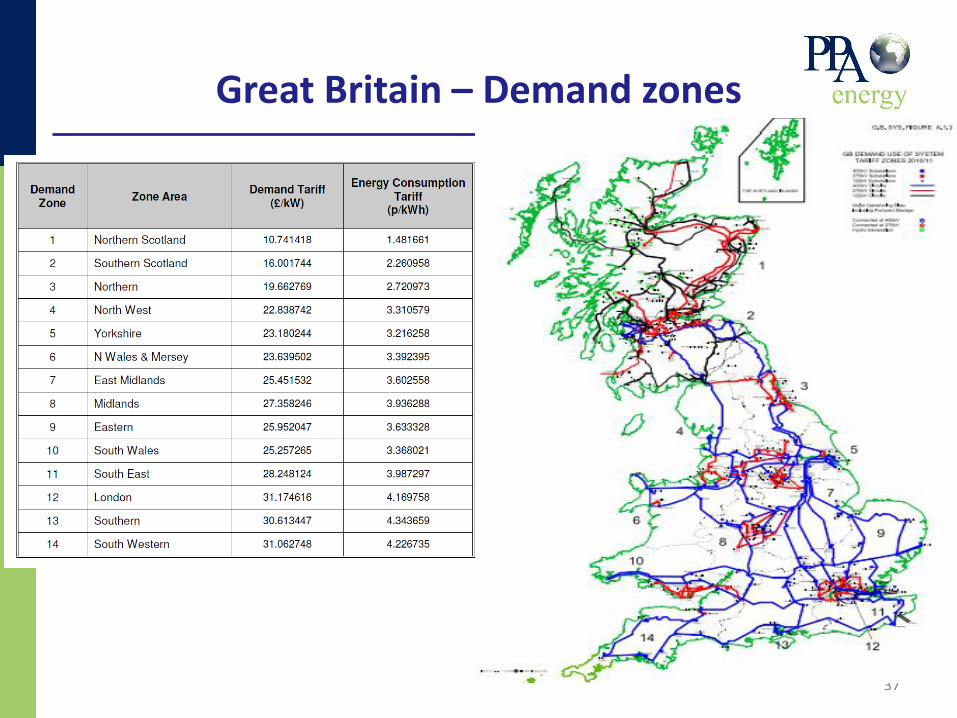
• GB transmission system is divided into 14 demand zones and
20 generation zones
• Transmission charges based on nodal pricing that uses DCLF (Direct Current Load flow) ICRP (Investment cost Related Pricing)
• Charges reflect the incremental cost in addition to locational factor
• Transmission costs are allocated at 27:73 split between generation and demand
• Transmission losses recovered via energy market, through loss factor application
36
37
Great Britain – Demand zones
38
Great Britain - Generation zones
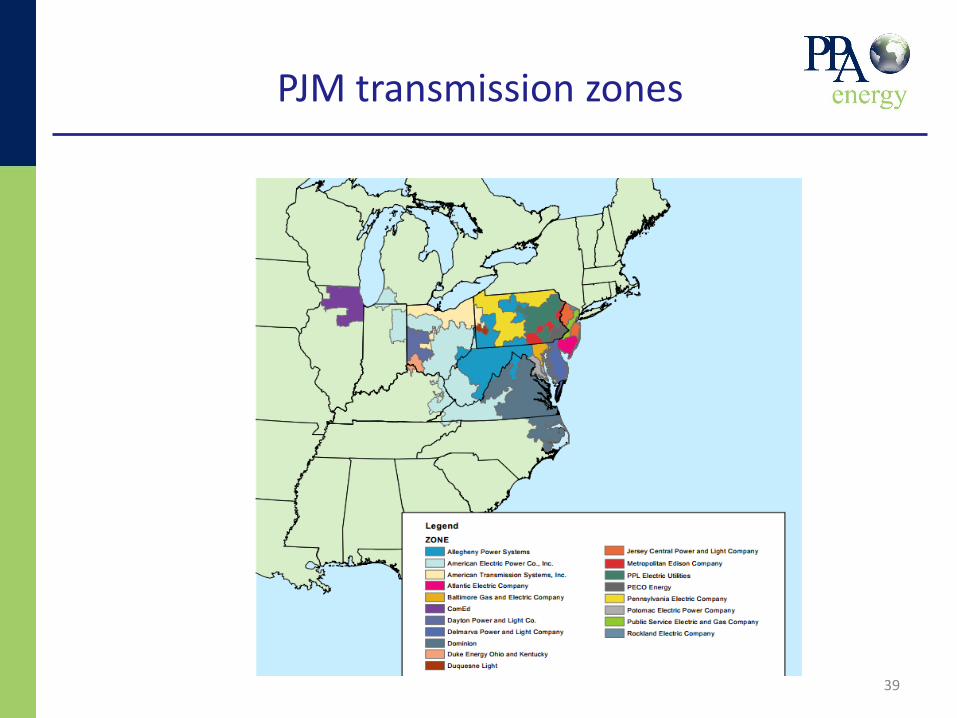
PJM transmission zones
39
International examples: US (PJM)
• PJM , a Regional Transmission Organisation (RTO) manages the interconnection between 13 states and District Columbia and a market operator.
• Uses Locational Marginal Pricing (LMP) – reflects value of energy at the specific location and the time of delivery
• Demand pays 100% transmission costs
• PJM Day ahead market – Forward market- Hourly LMPs are calculated based on generation offers, demand bids and scheduled bilateral transactions.
• PJM Real time market- Spot market –real time LMPs calculated at 5 min intervals.
• FTR (Financial Transmission Rights) traded separately from transmission service.
• Cost of transmission losses are reflected in the energy market prices.
40
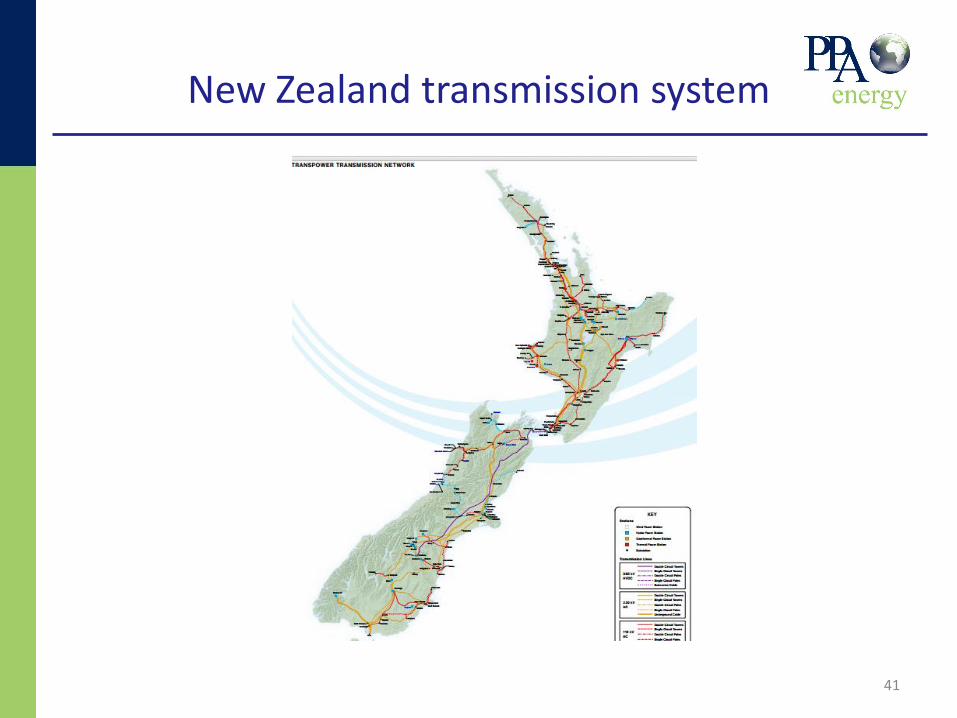
New Zealand transmission system
41
International examples: New Zealand
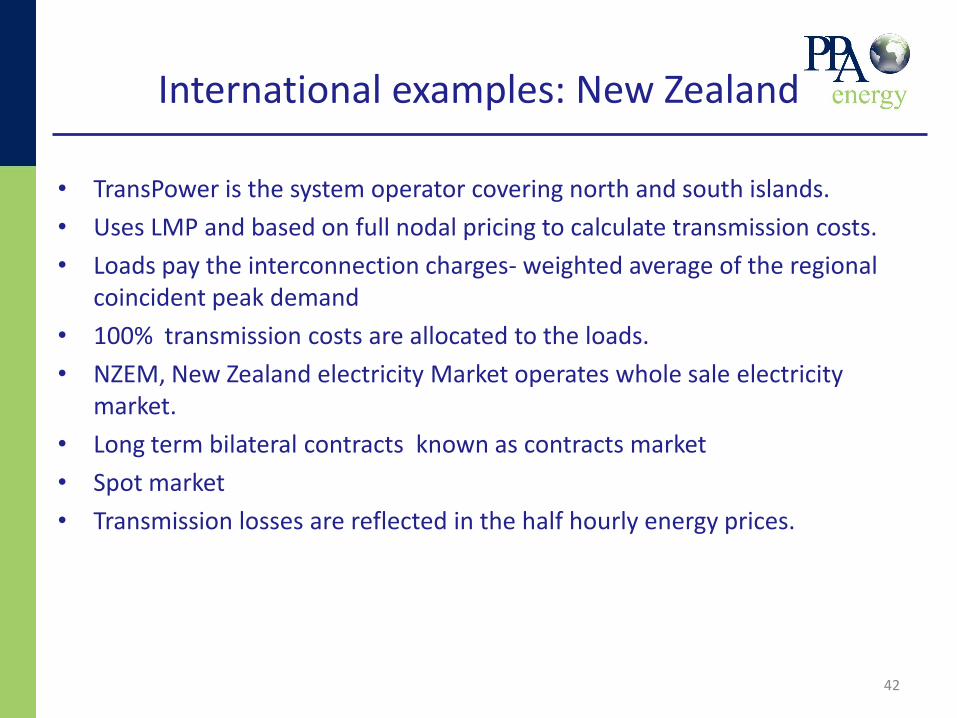
• TransPower is the system operator covering north and south islands.
• Uses LMP and based on full nodal pricing to calculate transmission costs.
• Loads pay the interconnection charges- weighted average of the regional coincident peak demand
• 100% transmission costs are allocated to the loads.
• NZEM, New Zealand electricity Market operates whole sale electricity market.
• Long term bilateral contracts known as contracts market
• Spot market
• Transmission losses are reflected in the half hourly energy prices.
42
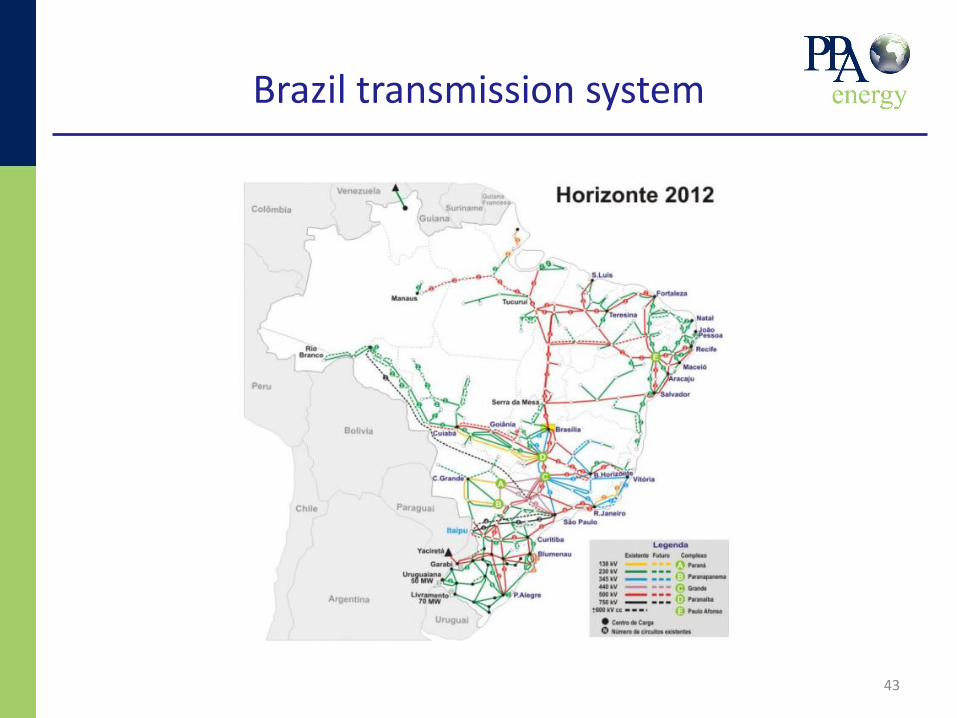
Brazil transmission system
43
International examples: Brazil
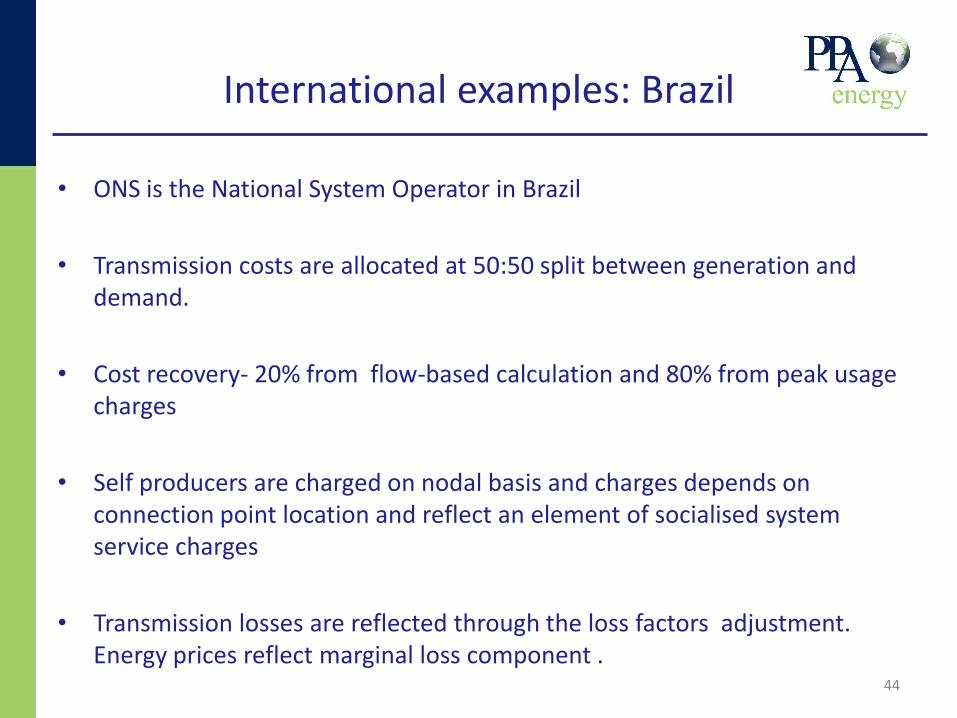
• ONS is the National System Operator in Brazil
• Transmission costs are allocated at 50:50 split between generation and demand.
• Cost recovery- 20% from flow-based calculation and 80% from peak usage charges
• Self producers are charged on nodal basis and charges depends on connection point location and reflect an element of socialised system service charges
• Transmission losses are reflected through the loss factors adjustment. Energy prices reflect marginal loss component .
44
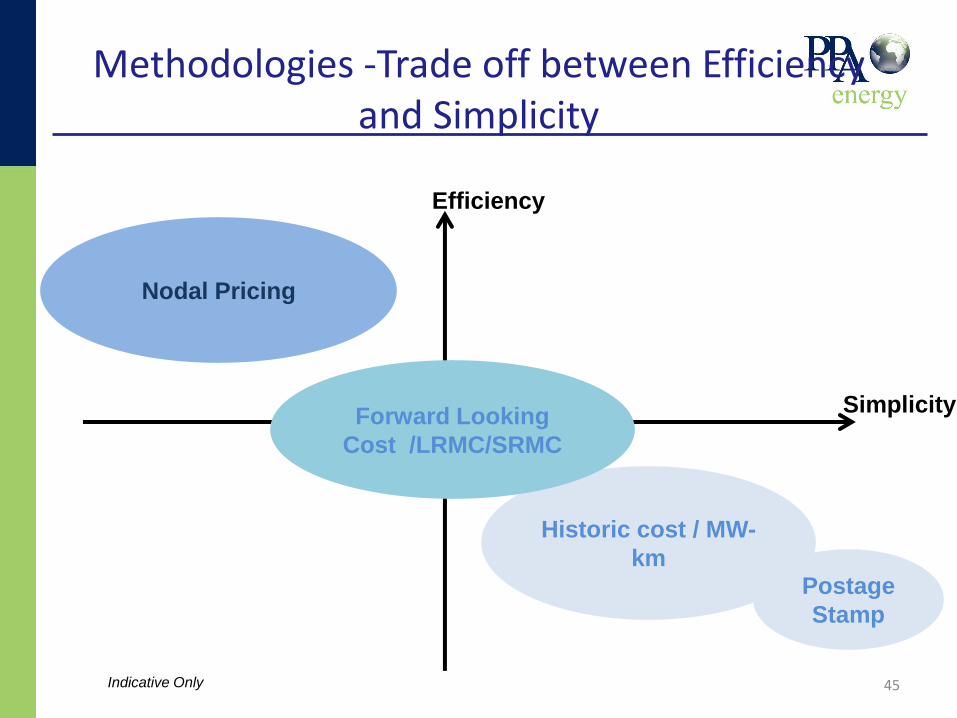
Methodologies -Trade off between Efficiency and Simplicity
45
Simplicity
Efficiency
Historic cost / MW-
km
Forward Looking
Cost /LRMC/SRMC
Nodal Pricing
Postage
Stamp
Indicative Only
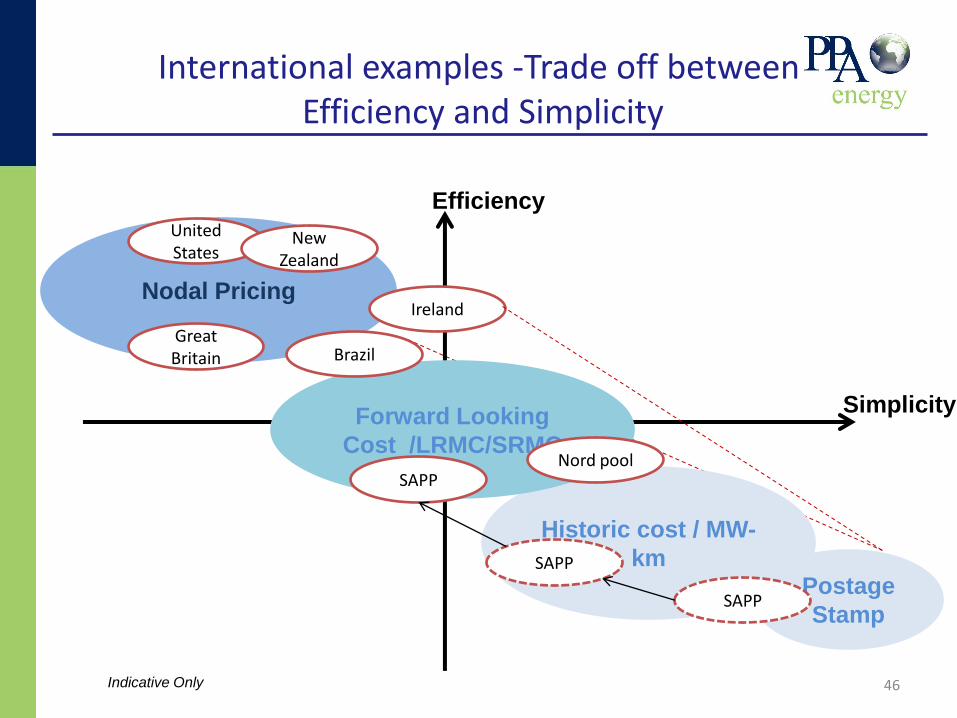
International examples -Trade off between Efficiency and Simplicity
46
Simplicity
Efficiency
Historic cost / MW-
km
Forward Looking
Cost /LRMC/SRMC
Nodal Pricing
Postage
Stamp
Nord pool SAPP
Ireland
Great Britain
United States
New Zealand
Brazil
Indicative Only
SAPP
SAPP
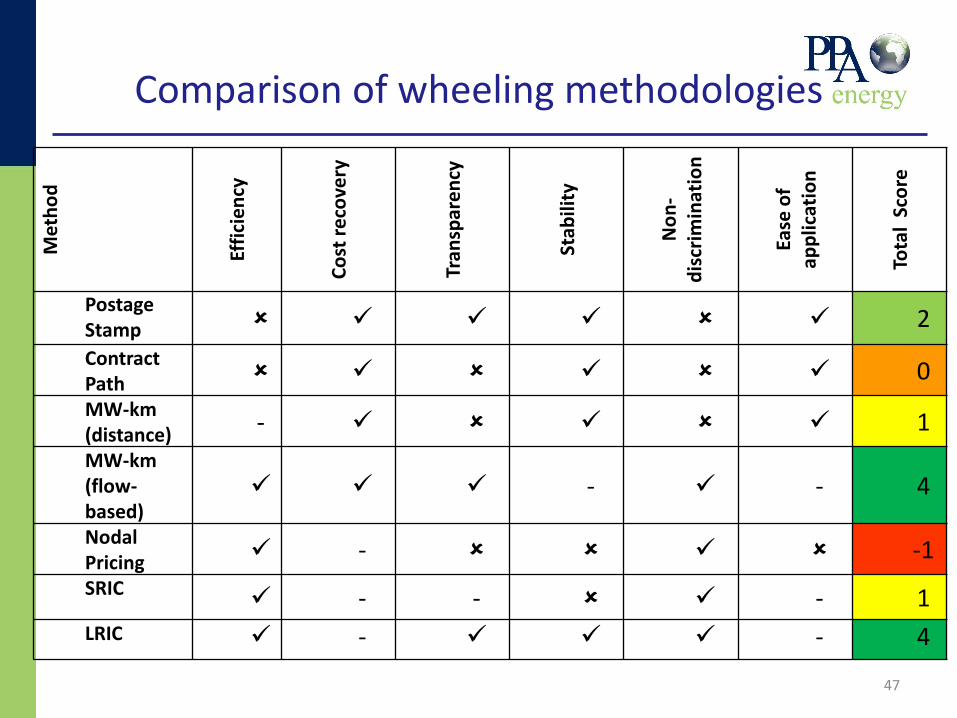
Comparison of wheeling methodologies
47
Met
ho
d
Effi
cie
ncy
Co
st r
eco
very
Tran
spar
en
cy
Stab
ility
No
n-
dis
crim
inat
ion
Ease
of
app
licat
ion
Tota
l Sc
ore
Postage Stamp 2
Contract Path
0
MW-km (distance)
- 1
MW-km (flow-based)
- - 4
Nodal Pricing
- -1
SRIC - - - 1
LRIC - - 4
Influencing factors
• Electricity trading rules: – spot market/gross pool vs. bilateral contracts
– identification of trading counterparties
– entry/exit charges vs. contract based
– restriction to self-generators at present
• Congestion management: – market rules linkage
– value of signal through T charges
– importance of significant locational component
– medium/long term signals of the availability of transmission
48
Influencing factors
• Losses: under all of the methods other than the nodal pricing approach, treated separately from the application of network charges themselves. – via a “postage-stamp” approach, allocating the overall cost of losses
across all system users; or
– by identifying the costs arising from the incremental effect of losses arising from specific wheeling transactions.
• Ancillary Services Costs: impact of generation required to: – balance the network
– maintain supply quality and security standards
– provide top-up/standby electricity
• Cost recovery: – to “socialise” the costs; or
– include in specific the wheeling agreements
49
Discussion: Characteristics of Jamaican Power Sector
Impact on charging methodology
50
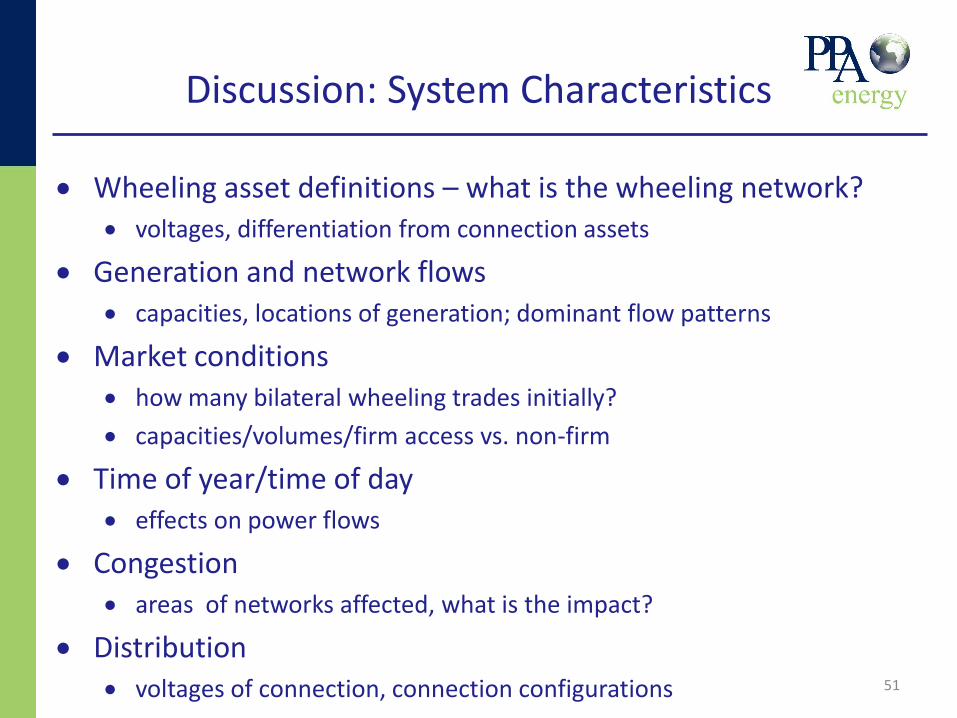
Discussion: System Characteristics
Wheeling asset definitions – what is the wheeling network? voltages, differentiation from connection assets
Generation and network flows capacities, locations of generation; dominant flow patterns
Market conditions how many bilateral wheeling trades initially?
capacities/volumes/firm access vs. non-firm
Time of year/time of day effects on power flows
Congestion areas of networks affected, what is the impact?
Distribution voltages of connection, connection configurations 51
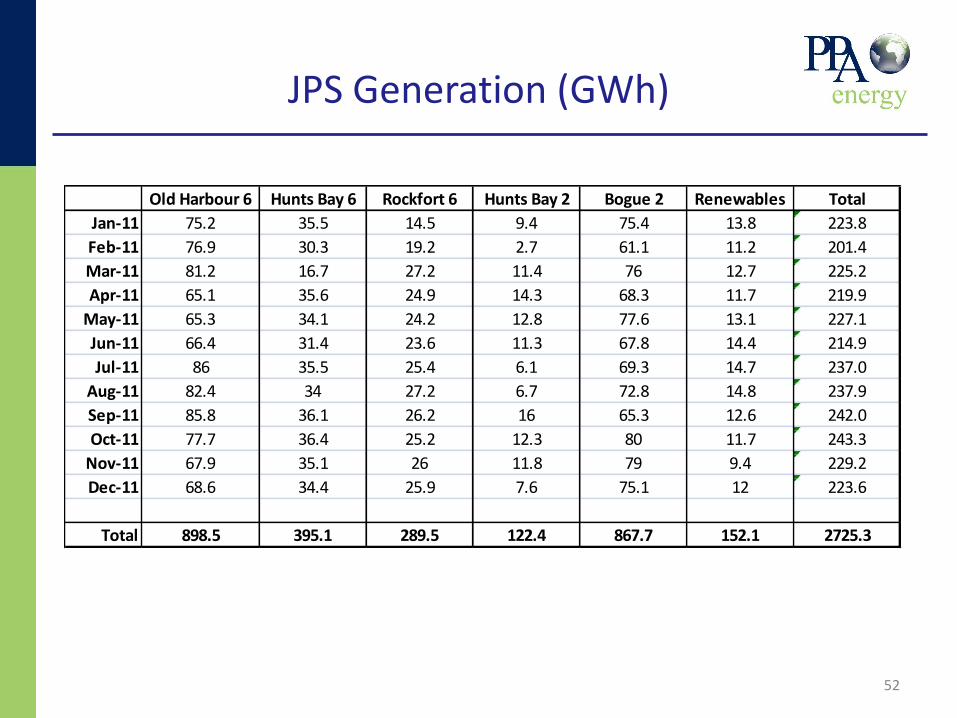
JPS Generation (GWh)
52
Old Harbour 6 Hunts Bay 6 Rockfort 6 Hunts Bay 2 Bogue 2 Renewables Total
Jan-11 75.2 35.5 14.5 9.4 75.4 13.8 223.8
Feb-11 76.9 30.3 19.2 2.7 61.1 11.2 201.4
Mar-11 81.2 16.7 27.2 11.4 76 12.7 225.2
Apr-11 65.1 35.6 24.9 14.3 68.3 11.7 219.9
May-11 65.3 34.1 24.2 12.8 77.6 13.1 227.1
Jun-11 66.4 31.4 23.6 11.3 67.8 14.4 214.9
Jul-11 86 35.5 25.4 6.1 69.3 14.7 237.0
Aug-11 82.4 34 27.2 6.7 72.8 14.8 237.9
Sep-11 85.8 36.1 26.2 16 65.3 12.6 242.0
Oct-11 77.7 36.4 25.2 12.3 80 11.7 243.3
Nov-11 67.9 35.1 26 11.8 79 9.4 229.2
Dec-11 68.6 34.4 25.9 7.6 75.1 12 223.6
Total 898.5 395.1 289.5 122.4 867.7 152.1 2725.3
53
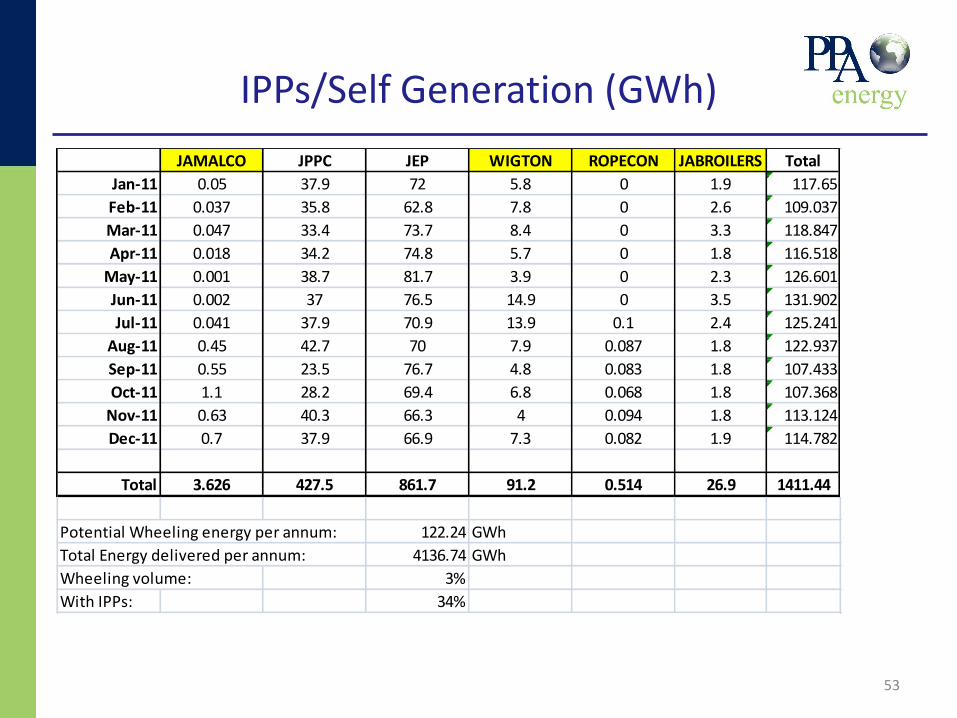
IPPs/Self Generation (GWh)
JAMALCO JPPC JEP WIGTON ROPECON JABROILERS Total
Jan-11 0.05 37.9 72 5.8 0 1.9 117.65
Feb-11 0.037 35.8 62.8 7.8 0 2.6 109.037
Mar-11 0.047 33.4 73.7 8.4 0 3.3 118.847
Apr-11 0.018 34.2 74.8 5.7 0 1.8 116.518
May-11 0.001 38.7 81.7 3.9 0 2.3 126.601
Jun-11 0.002 37 76.5 14.9 0 3.5 131.902
Jul-11 0.041 37.9 70.9 13.9 0.1 2.4 125.241
Aug-11 0.45 42.7 70 7.9 0.087 1.8 122.937
Sep-11 0.55 23.5 76.7 4.8 0.083 1.8 107.433
Oct-11 1.1 28.2 69.4 6.8 0.068 1.8 107.368
Nov-11 0.63 40.3 66.3 4 0.094 1.8 113.124
Dec-11 0.7 37.9 66.9 7.3 0.082 1.9 114.782
Total 3.626 427.5 861.7 91.2 0.514 26.9 1411.44
Potential Wheeling energy per annum: 122.24 GWh
Total Energy delivered per annum: 4136.74 GWh
Wheeling volume: 3%
With IPPs: 34%
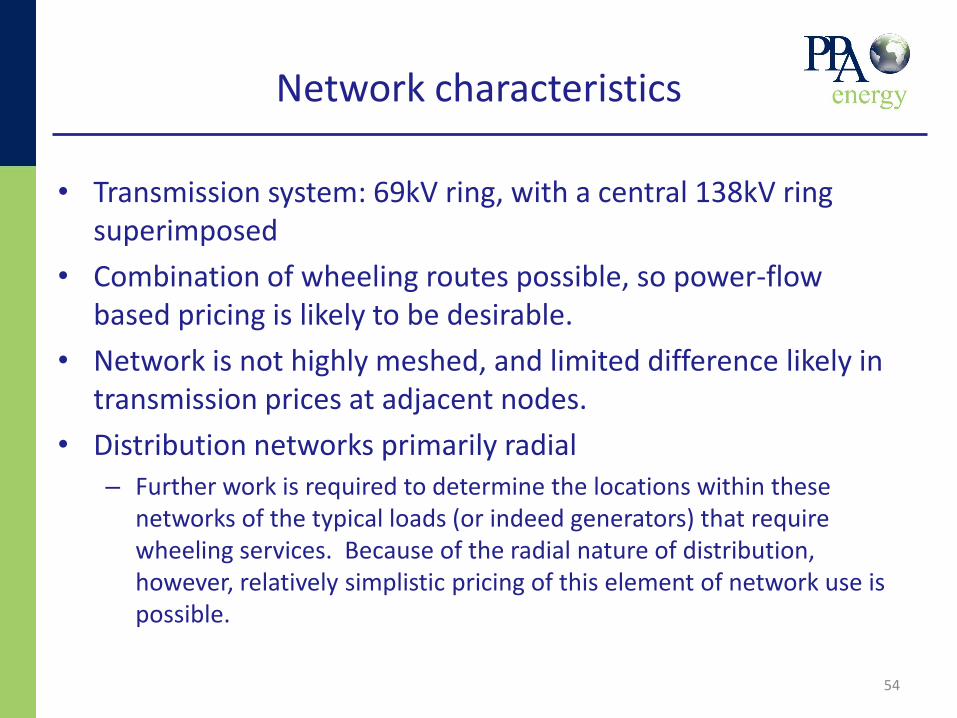
Network characteristics
• Transmission system: 69kV ring, with a central 138kV ring superimposed
• Combination of wheeling routes possible, so power-flow based pricing is likely to be desirable.
• Network is not highly meshed, and limited difference likely in transmission prices at adjacent nodes.
• Distribution networks primarily radial – Further work is required to determine the locations within these
networks of the typical loads (or indeed generators) that require wheeling services. Because of the radial nature of distribution, however, relatively simplistic pricing of this element of network use is possible.
54
55
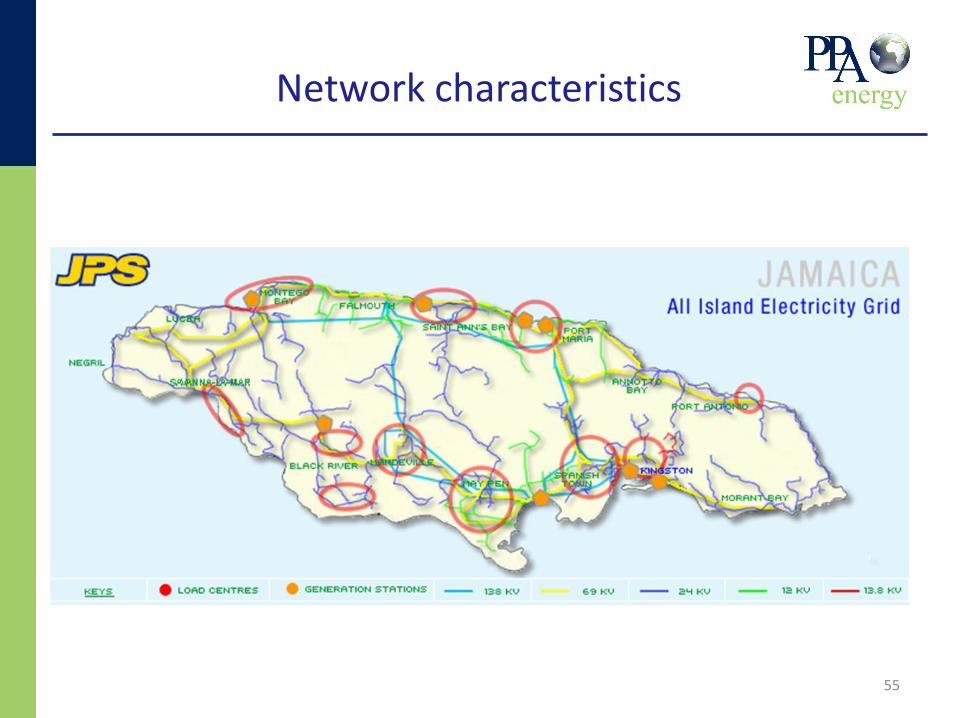
Network characteristics
Comments on Specific Methods
56
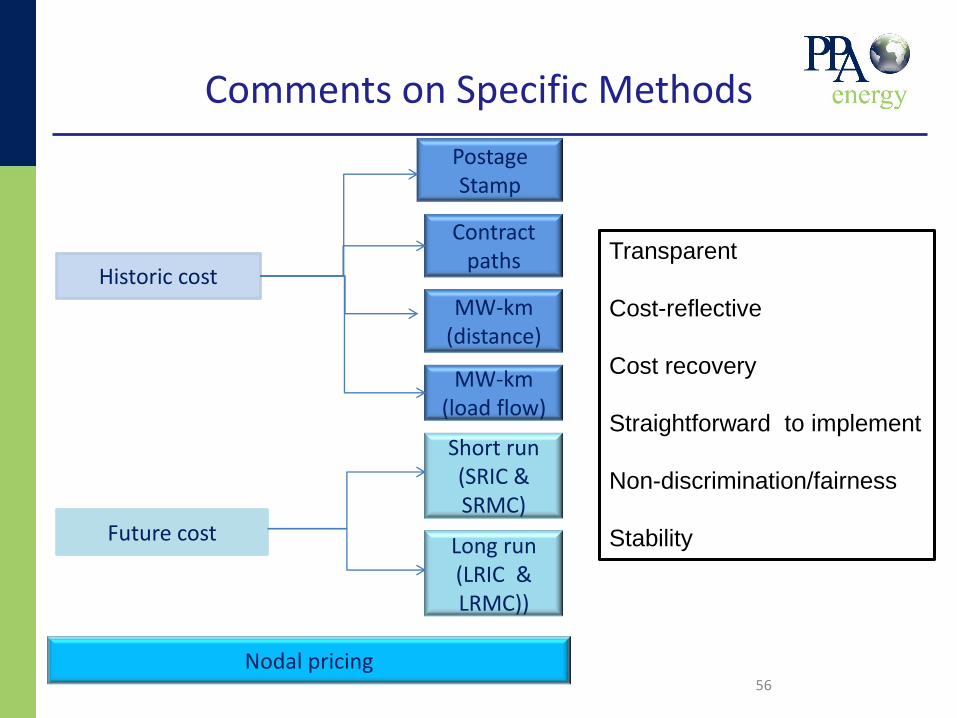
Historic cost
Future cost
Nodal pricing
Postage Stamp
Contract paths
MW-km (distance)
MW-km (load flow)
Short run (SRIC & SRMC)
Long run (LRIC & LRMC))
Transparent
Cost-reflective
Cost recovery
Straightforward to implement
Non-discrimination/fairness
Stability

Recommended Wheeling Methodology
57
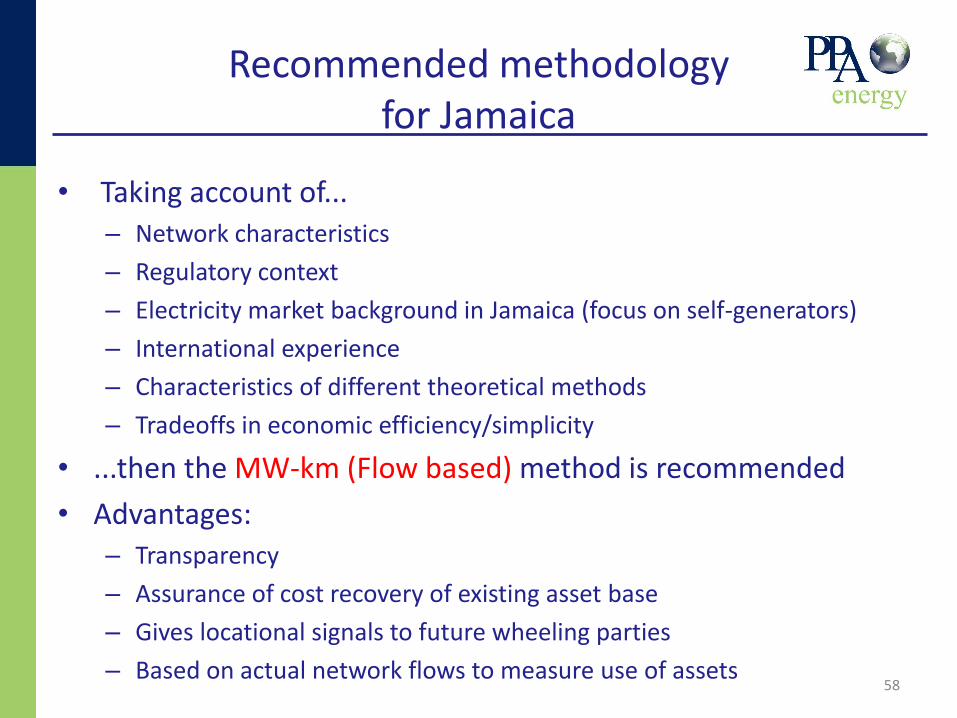
Recommended methodology for Jamaica
• Taking account of... – Network characteristics
– Regulatory context
– Electricity market background in Jamaica (focus on self-generators)
– International experience
– Characteristics of different theoretical methods
– Tradeoffs in economic efficiency/simplicity
• ...then the MW-km (Flow based) method is recommended
• Advantages: – Transparency
– Assurance of cost recovery of existing asset base
– Gives locational signals to future wheeling parties
– Based on actual network flows to measure use of assets
58
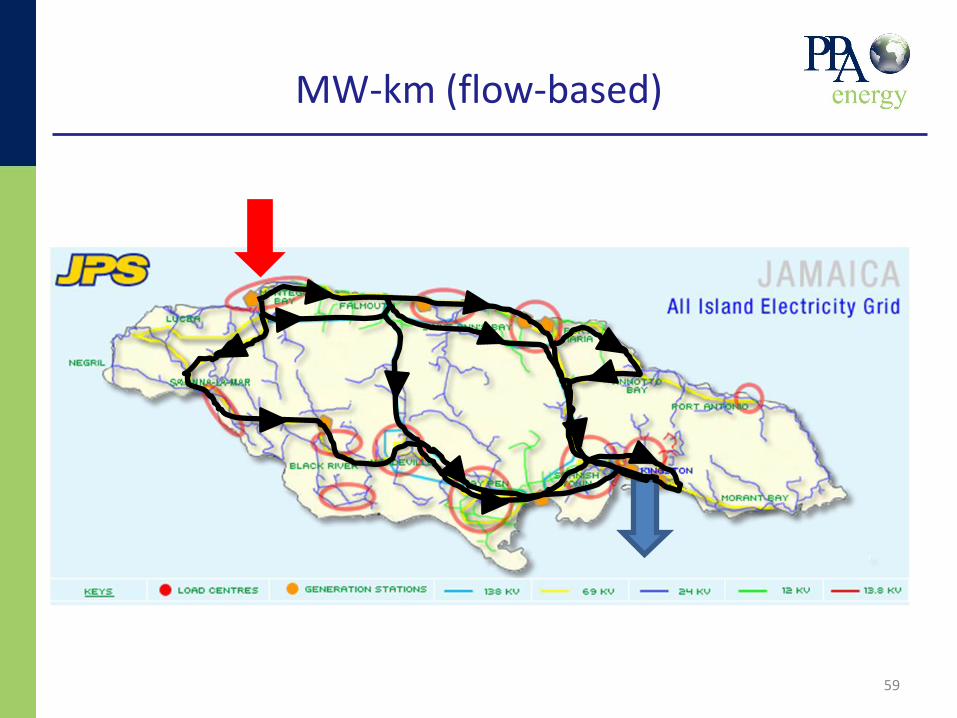
MW-km (flow-based)
59
Compatibility with regulations
• Key documents reviewed:
– The OUR Act
– The All-Island Electric Licence
– 2009-2014 OUR Tariff Determination Report
– 2004 Generation Market Study
60
Key findings
• The proposed methodology is compatible with the high level objectives of the OUR Act – particularly promotion of competition in generation
• JPS All-Island Electric Licence requires non-discrimination in connection/use of system – a clear and transparent wheeling charge structure will assist this
• JPS Licence also requires wheeling charges to be developed that are: – cost reflective
– consistent with tariffs (and must therefore avoid under/over-recovery
– guided by a Cost of Service study
• Need to confirm that locational variation of charges is permissible 61
Key implementation issues
• Distinction between connection and use of system charges – where are the boundaries?
• Incorporate appropriate depreciation rates into treatment of assets
• Share of costs between generators and consumers?
• Agree approach to network constraints
• Adjustment of charges to ensure full revenue recovery
• Confirm that reserves etc. (covered by Q-factor) are outside the scope of the wheeling charges
• Metering, top-up and standby pricing arrangements
62
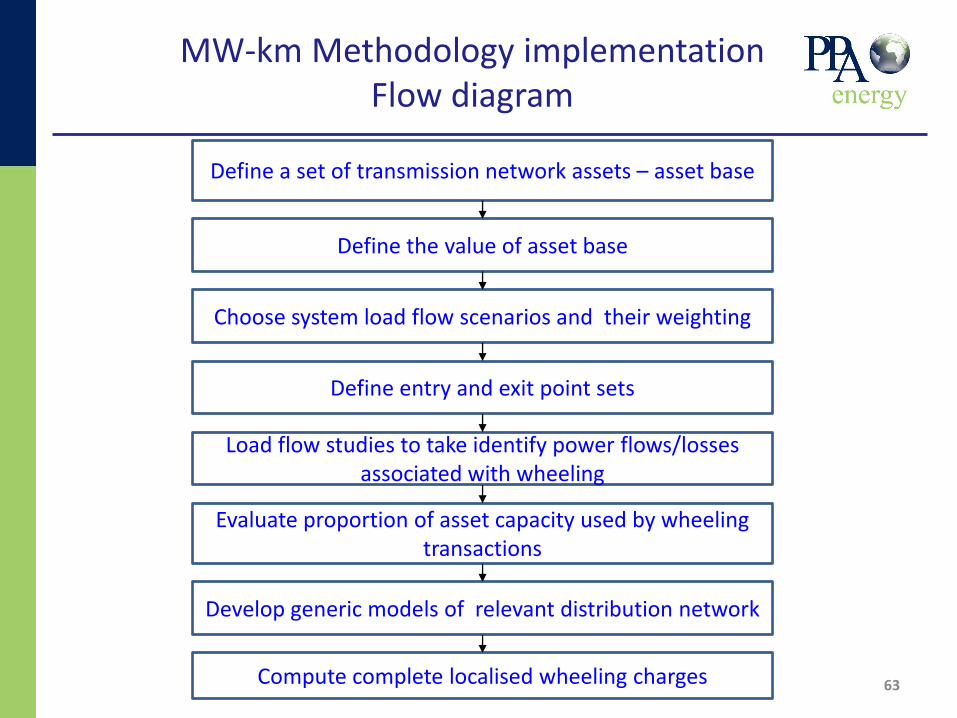
MW-km Methodology implementation
Flow diagram
63
Choose system load flow scenarios and their weighting
Define a set of transmission network assets – asset base
Define the value of asset base
Load flow studies to take identify power flows/losses associated with wheeling
Define entry and exit point sets
Evaluate proportion of asset capacity used by wheeling transactions
Compute complete localised wheeling charges
Develop generic models of relevant distribution network
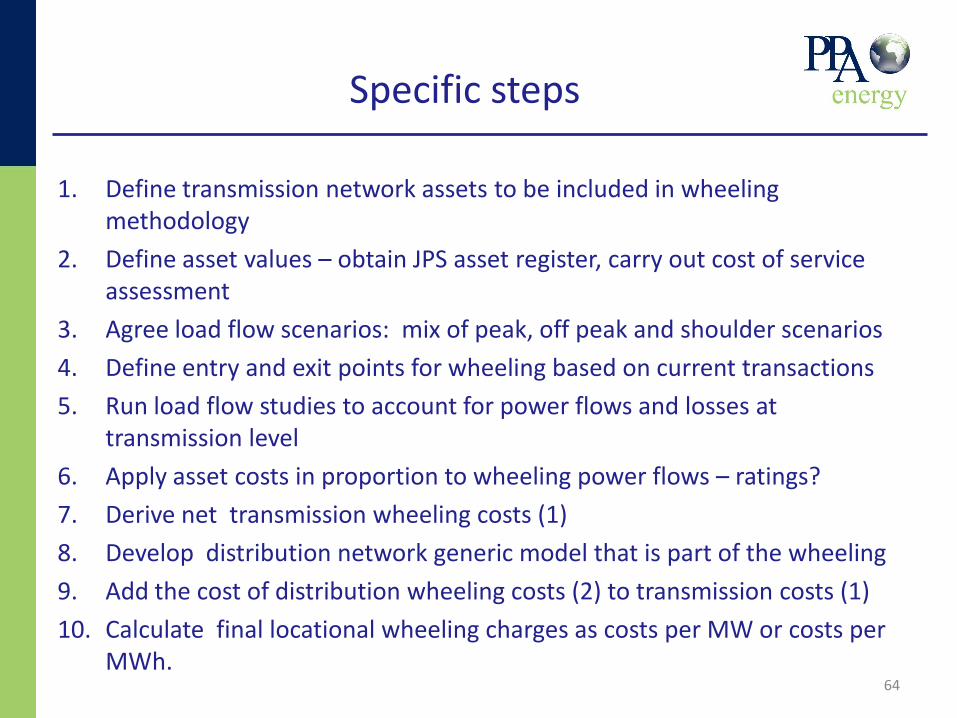
Specific steps
1. Define transmission network assets to be included in wheeling methodology
2. Define asset values – obtain JPS asset register, carry out cost of service assessment
3. Agree load flow scenarios: mix of peak, off peak and shoulder scenarios
4. Define entry and exit points for wheeling based on current transactions
5. Run load flow studies to account for power flows and losses at transmission level
6. Apply asset costs in proportion to wheeling power flows – ratings?
7. Derive net transmission wheeling costs (1)
8. Develop distribution network generic model that is part of the wheeling
9. Add the cost of distribution wheeling costs (2) to transmission costs (1)
10. Calculate final locational wheeling charges as costs per MW or costs per MWh.
64
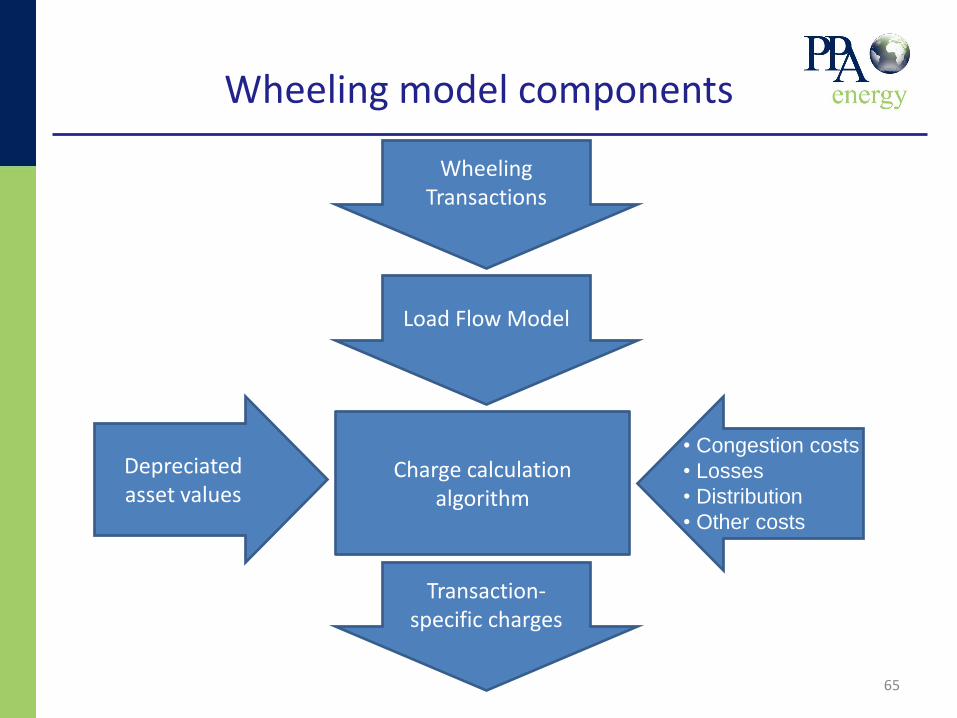
Wheeling model components
65
Load Flow Model
Charge calculation algorithm
Depreciated asset values
Wheeling Transactions
Transaction-specific charges
• Congestion costs
• Losses
• Distribution
• Other costs
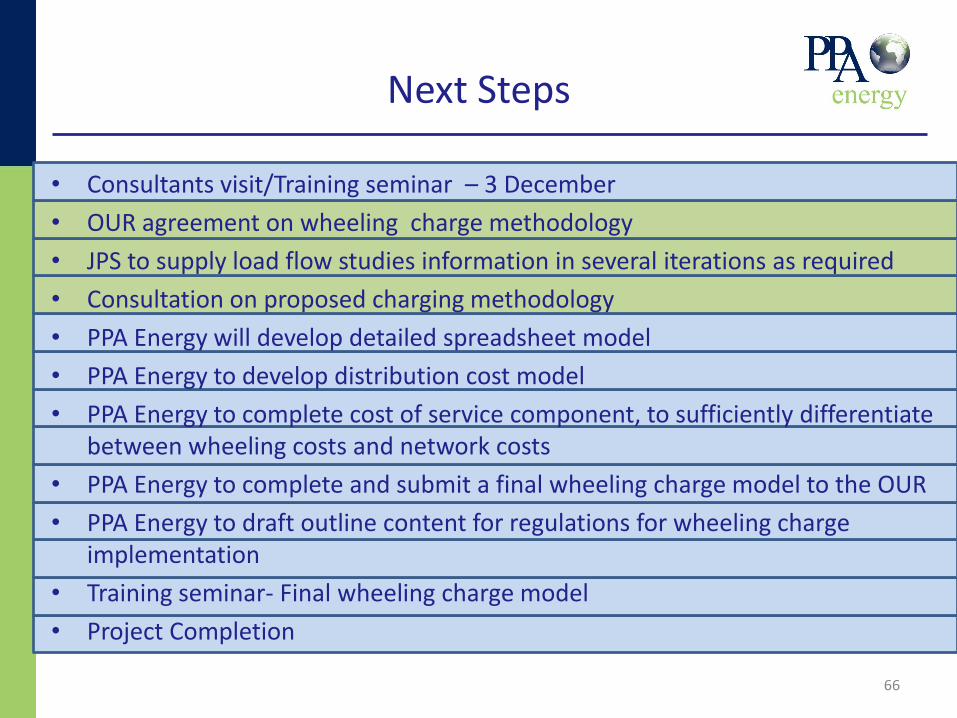
Next Steps
• Consultants visit/Training seminar – 3 December
• OUR agreement on wheeling charge methodology
• JPS to supply load flow studies information in several iterations as required
• Consultation on proposed charging methodology
• PPA Energy will develop detailed spreadsheet model
• PPA Energy to develop distribution cost model
• PPA Energy to complete cost of service component, to sufficiently differentiate between wheeling costs and network costs
• PPA Energy to complete and submit a final wheeling charge model to the OUR
• PPA Energy to draft outline content for regulations for wheeling charge implementation
• Training seminar- Final wheeling charge model
• Project Completion
66

Project programme – next steps
67
Schedule of Activities
22-Oct 29-Oct 05-Nov 12-Nov 19-Nov 26-Nov 03-Dec 10-Dec 17-Dec 24-Dec 31-Dec 07-Jan 14-Jan 21-Jan 28-Jan 04-Feb 11-Feb
Jamaica Wheeling Charges including cost of service study 1 2 3 4 5 6 7 8 9 10 11 12 13 14 15 16 17
5
5.1 Develop cost of service spreadsheet5.2 Provide cost input to wheeling model
6
6.1 High level data review6.2 Develop wheeling model6.3 Populate and test model6.4 Prepare User Manual
7
7.1 Develop regulatory framework
8
8.1 Prepare draft final report including cost of service study
9
9.1 Prepare training session #29.2 Deliver training session on wheeling model and reg. framework9.3 OUR feedback / approval of draft final report and model
10
10.1 Prepare final report including cost of service study
Inception reportMethodological reportTraining Session #1 - Wheeling methodologyTariff wheeling model and instruction materialDraft final report including cost of service studyTraining Session #2 - Wheeling model and regulatory frameworkFinal report (to include cost of service study)
Week Commencing
Training Session #2
Final Report
Deliverables
Develop Wheeling Charge Model
Develop regulatory framework
Draft Report
Cost of Service Study

Questions and discussion
Impact on charging methodology
68

Thank you!
69

70
PPA Energy (UK)
1 Frederick Sanger Road
Surrey Research Park
Guildford, Surrey
GU2 7YD, UK
www.ppaenergy.co.uk
Tel: +44 (0) 1483 544944
Fax: +44 (0) 1483 544955
PPA Energy Pty. Ltd. (South Africa)
1 Eastgate Lane
Bedfordview
Johannesburg
2007
South Africa
www.ppaenergy.co.za
Tel: +27 (0)11 615 3403
Our Contacts