electrocardiograms made easy! part ii. interpreting ... · electrocardiograms made easy! part ii....
TRANSCRIPT
Electrocardiograms Made Easy! Part II. Interpreting Abnormal Atrial Dysrhythmias 1
© 2007 NYSNA, all rights reserved. Material may not be reproduced without written permission.
Electrocardiograms Made Easy! Part II. Interpreting Abnormal Atrial Rhythms NYSNA Continuing Education The New York State Nurses Association is accredited as a provider of continuing nursing education by the American Nurses Credentialing Center’s Commission on Accreditation. This course has been awarded 1.5 contact hours. All American Nurses Credentialing Center (ANCC) accredited organizations' contact hours are recognized by all other ANCC accredited organizations. Most states with mandatory continuing education requirements recognize the ANCC accreditation/approval system. Questions about the acceptance of ANCC contact hours to meet mandatory regulations should be directed to the Professional licensing board within that state. NYSNA has been granted provider status by the Florida State Board of Nursing as a provider of continuing education in nursing (Provider number 50-1437).
Electrocardiograms Made Easy! Part II. Interpreting Abnormal Atrial Dysrhythmias 2
© 2007 NYSNA, all rights reserved. Material may not be reproduced without written permission.
How to Take This Course Please take a look at the steps below; these will help you to progress through the course material, complete the course examination and receive your certificate of completion.
1. REVIEW THE OBJECTIVES The objectives provide an overview of the entire course and identify what information will be focused on. Objectives are stated in terms of what you, the learner, will know or be able to do upon successful completion of the course. They let you know what you should expect to learn by taking a particular course and can help focus your study.
2. STUDY EACH SECTION IN ORDER Keep your learning "programmed" by reviewing the materials in order. This will help you understand the sections that follow.
3. COMPLETE THE COURSE EXAM After studying the course, click on the "Course Exam" option located on the course navigation toolbar. Answer each question by clicking on the button corresponding to the correct answer. All questions must be answered before the test can be graded; there is only one correct answer per question. You may refer back to the course material by minimizing the course exam window.
4. GRADE THE TEST Next, click on "Submit Test." You will know immediately whether you passed or failed. If you do not successfully complete the exam on the first attempt, you may take the exam again. If you do not pass the exam on your second attempt, you will need to purchase the course again.
5. FILL OUT THE EVALUATION FORM Upon passing the course exam you will be prompted to complete a course evaluation. You will have access to the certificate of completion after you complete the evaluation. At this point, you should print the certificate and keep it for your records.
Electrocardiograms Made Easy! Part II. Interpreting Abnormal Atrial Dysrhythmias 3
© 2007 NYSNA, all rights reserved. Material may not be reproduced without written permission.
Introduction Electrocardiograms Made Easy! is a series of three courses comprised of: Basic ECG Interpretations, Interpreting Abnormal Atrial Rhythms, and Interpreting Ventricular Dysrhythmias. Part II. Interpreting Abnormal Atrial Rhythms (the second course in the series) will move beyond the concepts learned in Electrocardiograms Made Easy! – Part I. Basic ECG Interpretations. In achieving this we will advance the concepts related to electrical physiology and the electrocardiogram, focusing on different rhythm presentations, and the mechanical and electrical process involved. To achieve this, the pathophysiology behind differing dysrhythmias will be presented, allowing conceptualization of the mechanical/electrical processes occurring in the dysfunctional cardiac cycle. This assumes that the learner is competent in the basic electrocardiogram principles. If needed please refer to the first course in this series. Cardiovascular disease is composed of heart disease and cerebro-vascular accidents (strokes). Respectively they are the leading and third leading cause of death in the United States. Together they account for the death of 950,000 Americans each year (Centers for Disease Control and Prevention [CDC], 2005). More broadly, 61 million Americans (almost one in four) suffer from some form of cardiovascular disease (CDC, 2005). With tightening purse strings, the impact of cardiovascular diseases on healthcare resources is astounding. The Center for Disease Control and Prevention (CDC) estimates that in 2003 the cost of cardiovascular disease to the economy was $351 billion (CDC, 2005). So what does this mean to me? As active participants in healthcare you will undoubtedly come in contact with the one in four Americans who have cardiovascular disease. This contact may be in any setting: from an emergency department, surgical ward, rehabilitation, or your own family home. So it is important to be familiar with and understand the basics of one of the easiest, most cost-effective, non-invasive tests performed to assess cardiac function: the electrocardiogram (ECG). It is important to be able to interpret electrocardiograms in order for the skilled registered nurse to initiate timely interventions. This course will describe atrial dysrhythmias. It is built on the knowledge gained from the previous Basic ECG Interpretations course. The dysrhythmias discussed result from various abnormalities in the conduction of electrical impulses around the AV node or above. Deciphering the P wave on the ECG strip is the clue for determining the possible problems with the electrical/mechanical conduction. Content Outline
• Advancing Electro Physiology • Essentials Review • Introduction to dysrhythmias • Atrial dysrhythmias etiology • Atrial dysrhythmias
1. Sinus Bradycardia 2. Sinus Tachycardia 3. Supraventricular Tachycardia 4. Atrial Fibrillation 5. Atrial Flutter 6. Junctional Rhythm 7. Accelerated Junctional Rhythm
• Summary
Electrocardiograms Made Easy! Part II. Interpreting Abnormal Atrial Dysrhythmias 4
© 2007 NYSNA, all rights reserved. Material may not be reproduced without written permission.
Course Objectives Upon the completion of this course the learner will be able to:
• Identify the most common dysrhythmias originating from the atrium • Differentiate the characteristics of the three pace makers • Identify a heart rate site of impulse stimulus
Electrocardiograms Made Easy! Part II. Interpreting Abnormal Atrial Dysrhythmias 5
© 2007 NYSNA, all rights reserved. Material may not be reproduced without written permission.
About the Author David Pickham, MN, RN, began his nursing education at the University of Newcastle in New South Wales, Australia. He has since worked as a registered nurse focusing on emergency medicine in Australia, Canada, and the United States. He has a master’s of nursing in advanced practice and currently is a doctoral candidate at the University of California. His interests lie specifically in the field of electrocardiography (also known as ECG or EKG) which led him to create courses on Electrocardiograms Made Easy!
Electrocardiograms Made Easy! Part II. Interpreting Abnormal Atrial Dysrhythmias 6
© 2007 NYSNA, all rights reserved. Material may not be reproduced without written permission.
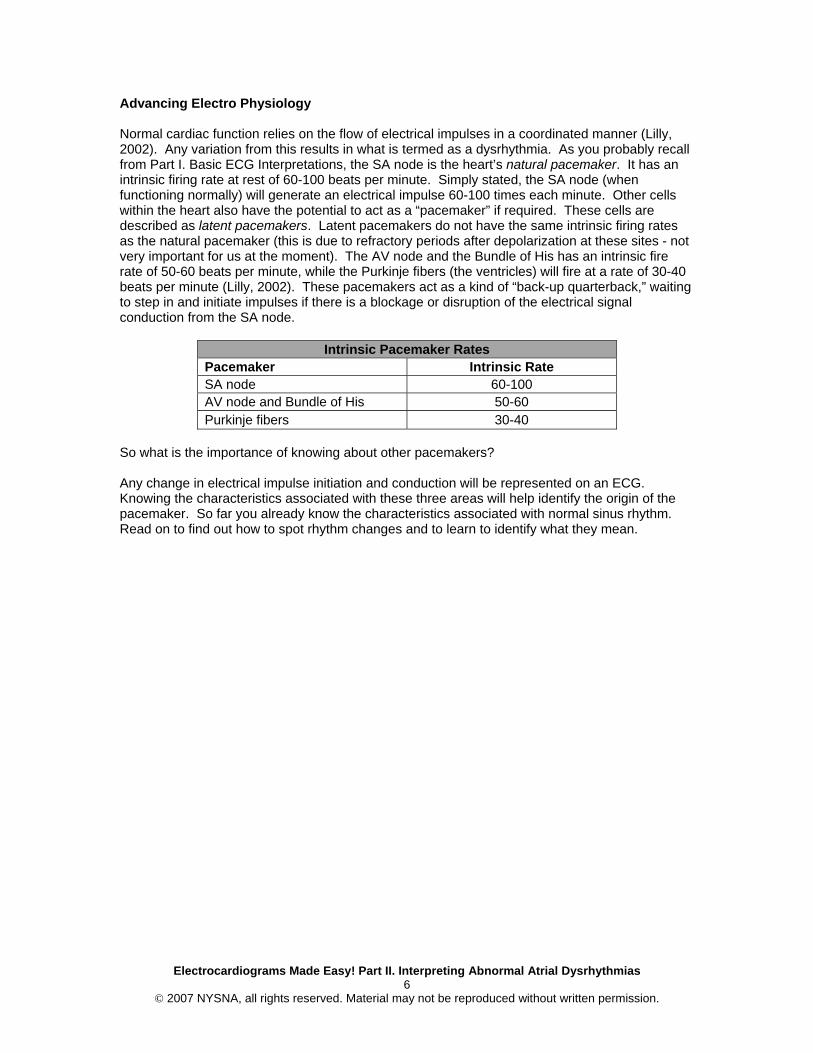
Advancing Electro Physiology Normal cardiac function relies on the flow of electrical impulses in a coordinated manner (Lilly, 2002). Any variation from this results in what is termed as a dysrhythmia. As you probably recall from Part I. Basic ECG Interpretations, the SA node is the heart’s natural pacemaker. It has an intrinsic firing rate at rest of 60-100 beats per minute. Simply stated, the SA node (when functioning normally) will generate an electrical impulse 60-100 times each minute. Other cells within the heart also have the potential to act as a “pacemaker” if required. These cells are described as latent pacemakers. Latent pacemakers do not have the same intrinsic firing rates as the natural pacemaker (this is due to refractory periods after depolarization at these sites - not very important for us at the moment). The AV node and the Bundle of His has an intrinsic fire rate of 50-60 beats per minute, while the Purkinje fibers (the ventricles) will fire at a rate of 30-40 beats per minute (Lilly, 2002). These pacemakers act as a kind of “back-up quarterback,” waiting to step in and initiate impulses if there is a blockage or disruption of the electrical signal conduction from the SA node.
Intrinsic Pacemaker Rates Pacemaker Intrinsic Rate SA node 60-100 AV node and Bundle of His 50-60 Purkinje fibers 30-40
So what is the importance of knowing about other pacemakers? Any change in electrical impulse initiation and conduction will be represented on an ECG. Knowing the characteristics associated with these three areas will help identify the origin of the pacemaker. So far you already know the characteristics associated with normal sinus rhythm. Read on to find out how to spot rhythm changes and to learn to identify what they mean.
Electrocardiograms Made Easy! Part II. Interpreting Abnormal Atrial Dysrhythmias 7
© 2007 NYSNA, all rights reserved. Material may not be reproduced without written permission.
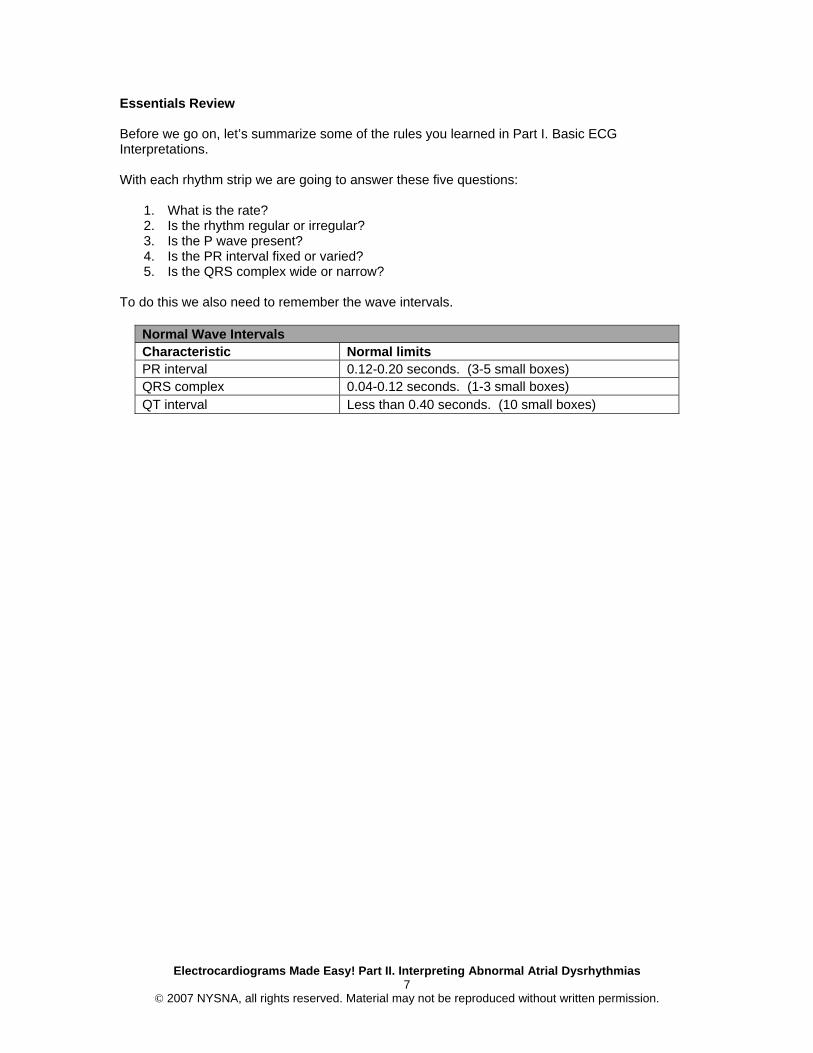
Essentials Review Before we go on, let’s summarize some of the rules you learned in Part I. Basic ECG Interpretations. With each rhythm strip we are going to answer these five questions:
1. What is the rate? 2. Is the rhythm regular or irregular? 3. Is the P wave present? 4. Is the PR interval fixed or varied? 5. Is the QRS complex wide or narrow?
To do this we also need to remember the wave intervals.
Normal Wave Intervals Characteristic Normal limits PR interval 0.12-0.20 seconds. (3-5 small boxes) QRS complex 0.04-0.12 seconds. (1-3 small boxes) QT interval Less than 0.40 seconds. (10 small boxes)
Electrocardiograms Made Easy! Part II. Interpreting Abnormal Atrial Dysrhythmias 8
© 2007 NYSNA, all rights reserved. Material may not be reproduced without written permission.
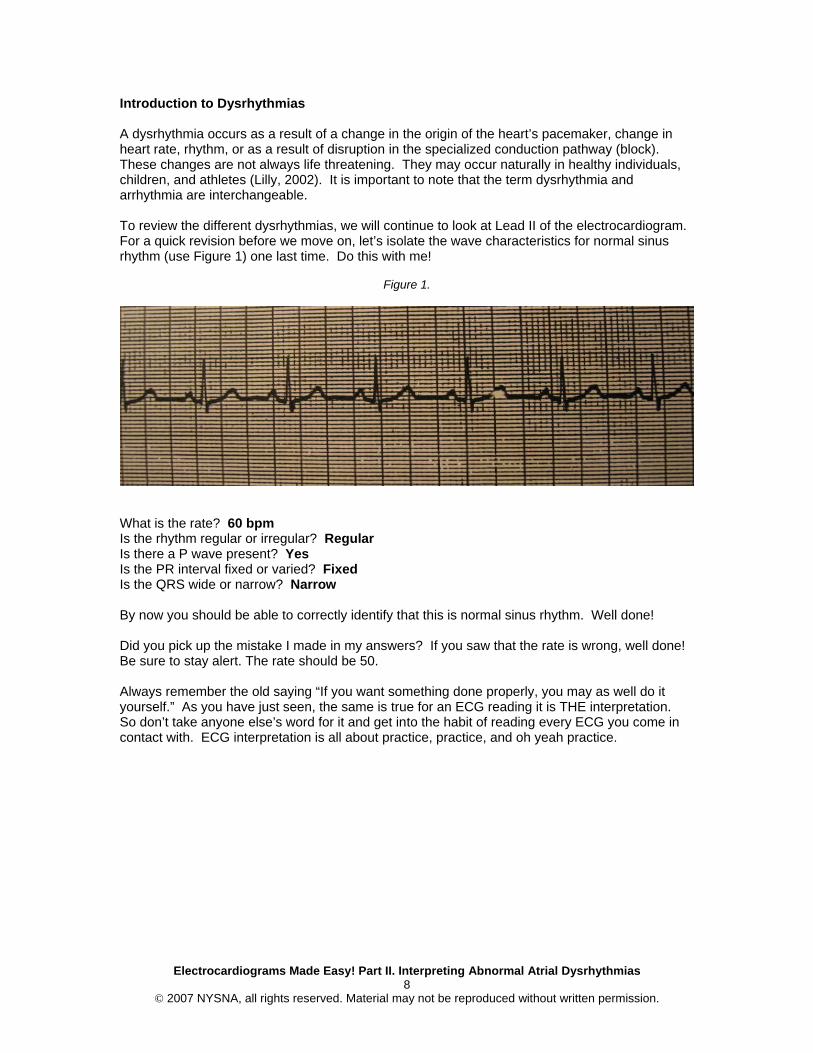
Introduction to Dysrhythmias A dysrhythmia occurs as a result of a change in the origin of the heart’s pacemaker, change in heart rate, rhythm, or as a result of disruption in the specialized conduction pathway (block). These changes are not always life threatening. They may occur naturally in healthy individuals, children, and athletes (Lilly, 2002). It is important to note that the term dysrhythmia and arrhythmia are interchangeable. To review the different dysrhythmias, we will continue to look at Lead II of the electrocardiogram. For a quick revision before we move on, let’s isolate the wave characteristics for normal sinus rhythm (use Figure 1) one last time. Do this with me!
Figure 1.
What is the rate? 60 bpm Is the rhythm regular or irregular? Regular Is there a P wave present? Yes Is the PR interval fixed or varied? Fixed Is the QRS wide or narrow? Narrow By now you should be able to correctly identify that this is normal sinus rhythm. Well done! Did you pick up the mistake I made in my answers? If you saw that the rate is wrong, well done! Be sure to stay alert. The rate should be 50. Always remember the old saying “If you want something done properly, you may as well do it yourself.” As you have just seen, the same is true for an ECG reading it is THE interpretation. So don’t take anyone else’s word for it and get into the habit of reading every ECG you come in contact with. ECG interpretation is all about practice, practice, and oh yeah practice.
Electrocardiograms Made Easy! Part II. Interpreting Abnormal Atrial Dysrhythmias 9
© 2007 NYSNA, all rights reserved. Material may not be reproduced without written permission.
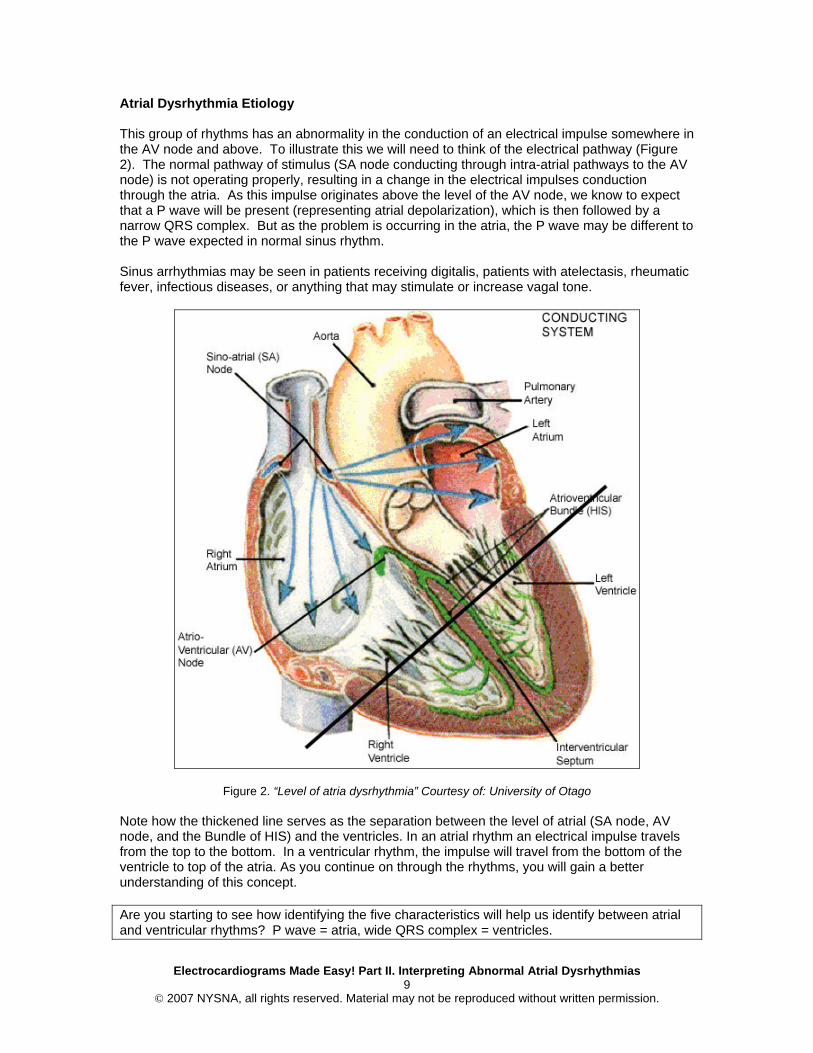
Atrial Dysrhythmia Etiology This group of rhythms has an abnormality in the conduction of an electrical impulse somewhere in the AV node and above. To illustrate this we will need to think of the electrical pathway (Figure 2). The normal pathway of stimulus (SA node conducting through intra-atrial pathways to the AV node) is not operating properly, resulting in a change in the electrical impulses conduction through the atria. As this impulse originates above the level of the AV node, we know to expect that a P wave will be present (representing atrial depolarization), which is then followed by a narrow QRS complex. But as the problem is occurring in the atria, the P wave may be different to the P wave expected in normal sinus rhythm. Sinus arrhythmias may be seen in patients receiving digitalis, patients with atelectasis, rheumatic fever, infectious diseases, or anything that may stimulate or increase vagal tone.
Figure 2. “Level of atria dysrhythmia” Courtesy of: University of Otago Note how the thickened line serves as the separation between the level of atrial (SA node, AV node, and the Bundle of HIS) and the ventricles. In an atrial rhythm an electrical impulse travels from the top to the bottom. In a ventricular rhythm, the impulse will travel from the bottom of the ventricle to top of the atria. As you continue on through the rhythms, you will gain a better understanding of this concept. Are you starting to see how identifying the five characteristics will help us identify between atrial and ventricular rhythms? P wave = atria, wide QRS complex = ventricles.
Electrocardiograms Made Easy! Part II. Interpreting Abnormal Atrial Dysrhythmias 10
© 2007 NYSNA, all rights reserved. Material may not be reproduced without written permission.
If not then don’t panic. We are going to go through these two groups of rhythms in depth, after which you will have plenty of time to practice. For now as long as you can identify the P wave, measure the PR interval, the QRS complex, and are not falling asleep, then you are at the level you need to be to master rhythm interpretation by the end of this course. Let’s begin!
Electrocardiograms Made Easy! Part II. Interpreting Abnormal Atrial Dysrhythmias 11
© 2007 NYSNA, all rights reserved. Material may not be reproduced without written permission.
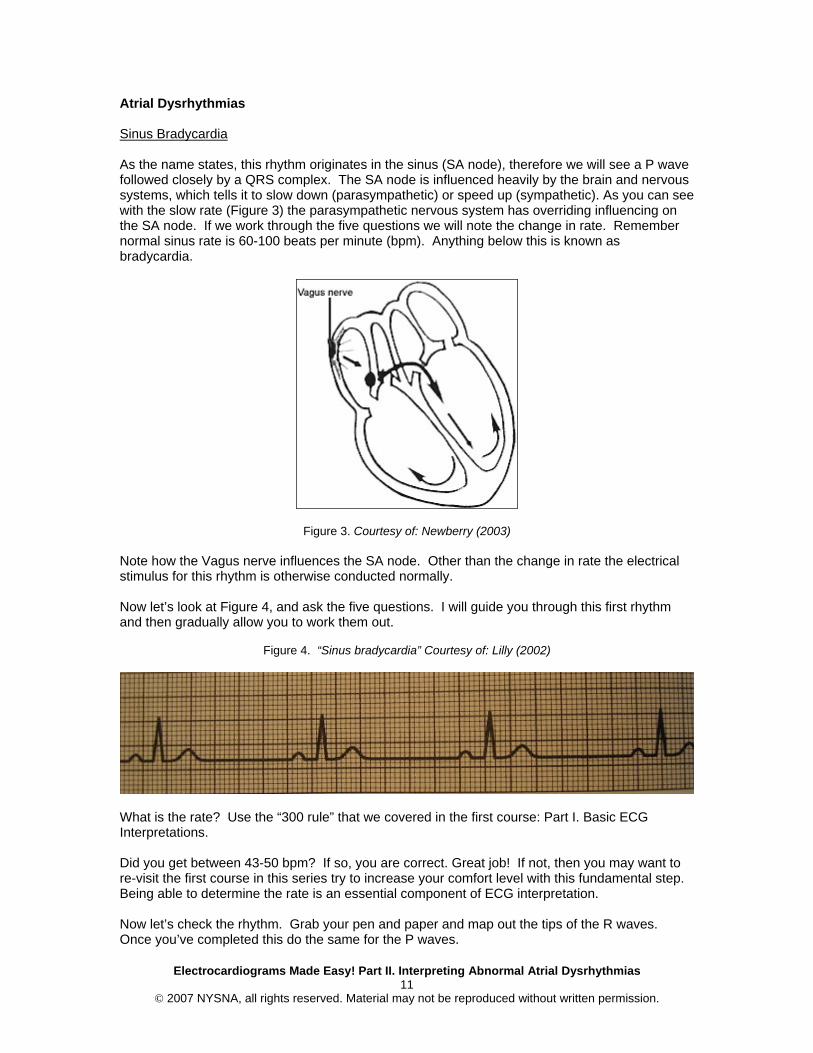
Atrial Dysrhythmias Sinus Bradycardia As the name states, this rhythm originates in the sinus (SA node), therefore we will see a P wave followed closely by a QRS complex. The SA node is influenced heavily by the brain and nervous systems, which tells it to slow down (parasympathetic) or speed up (sympathetic). As you can see with the slow rate (Figure 3) the parasympathetic nervous system has overriding influencing on the SA node. If we work through the five questions we will note the change in rate. Remember normal sinus rate is 60-100 beats per minute (bpm). Anything below this is known as bradycardia.
Figure 3. Courtesy of: Newberry (2003)
Note how the Vagus nerve influences the SA node. Other than the change in rate the electrical stimulus for this rhythm is otherwise conducted normally. Now let’s look at Figure 4, and ask the five questions. I will guide you through this first rhythm and then gradually allow you to work them out.
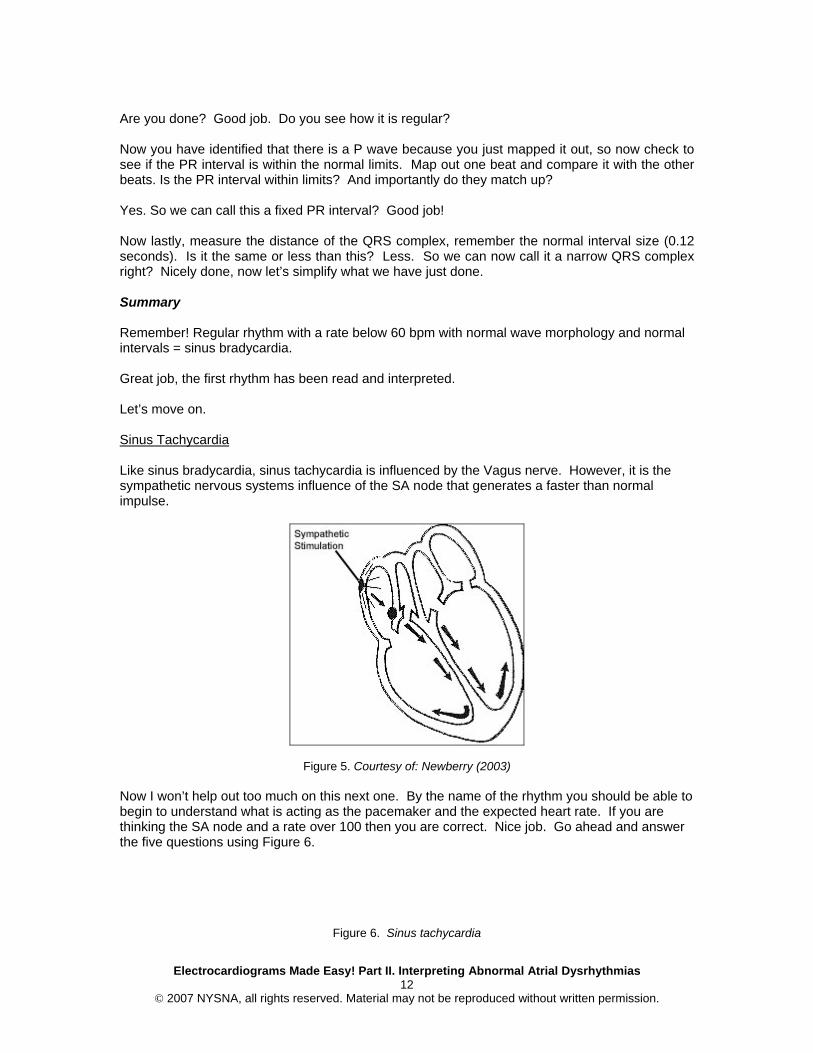
Figure 4. “Sinus bradycardia” Courtesy of: Lilly (2002)
What is the rate? Use the “300 rule” that we covered in the first course: Part I. Basic ECG Interpretations. Did you get between 43-50 bpm? If so, you are correct. Great job! If not, then you may want to re-visit the first course in this series try to increase your comfort level with this fundamental step. Being able to determine the rate is an essential component of ECG interpretation. Now let’s check the rhythm. Grab your pen and paper and map out the tips of the R waves. Once you’ve completed this do the same for the P waves.
Electrocardiograms Made Easy! Part II. Interpreting Abnormal Atrial Dysrhythmias 12
© 2007 NYSNA, all rights reserved. Material may not be reproduced without written permission.
Are you done? Good job. Do you see how it is regular? Now you have identified that there is a P wave because you just mapped it out, so now check to see if the PR interval is within the normal limits. Map out one beat and compare it with the other beats. Is the PR interval within limits? And importantly do they match up? Yes. So we can call this a fixed PR interval? Good job! Now lastly, measure the distance of the QRS complex, remember the normal interval size (0.12 seconds). Is it the same or less than this? Less. So we can now call it a narrow QRS complex right? Nicely done, now let’s simplify what we have just done. Summary Remember! Regular rhythm with a rate below 60 bpm with normal wave morphology and normal intervals = sinus bradycardia. Great job, the first rhythm has been read and interpreted. Let’s move on. Sinus Tachycardia Like sinus bradycardia, sinus tachycardia is influenced by the Vagus nerve. However, it is the sympathetic nervous systems influence of the SA node that generates a faster than normal impulse.
Figure 5. Courtesy of: Newberry (2003) Now I won’t help out too much on this next one. By the name of the rhythm you should be able to begin to understand what is acting as the pacemaker and the expected heart rate. If you are thinking the SA node and a rate over 100 then you are correct. Nice job. Go ahead and answer the five questions using Figure 6.
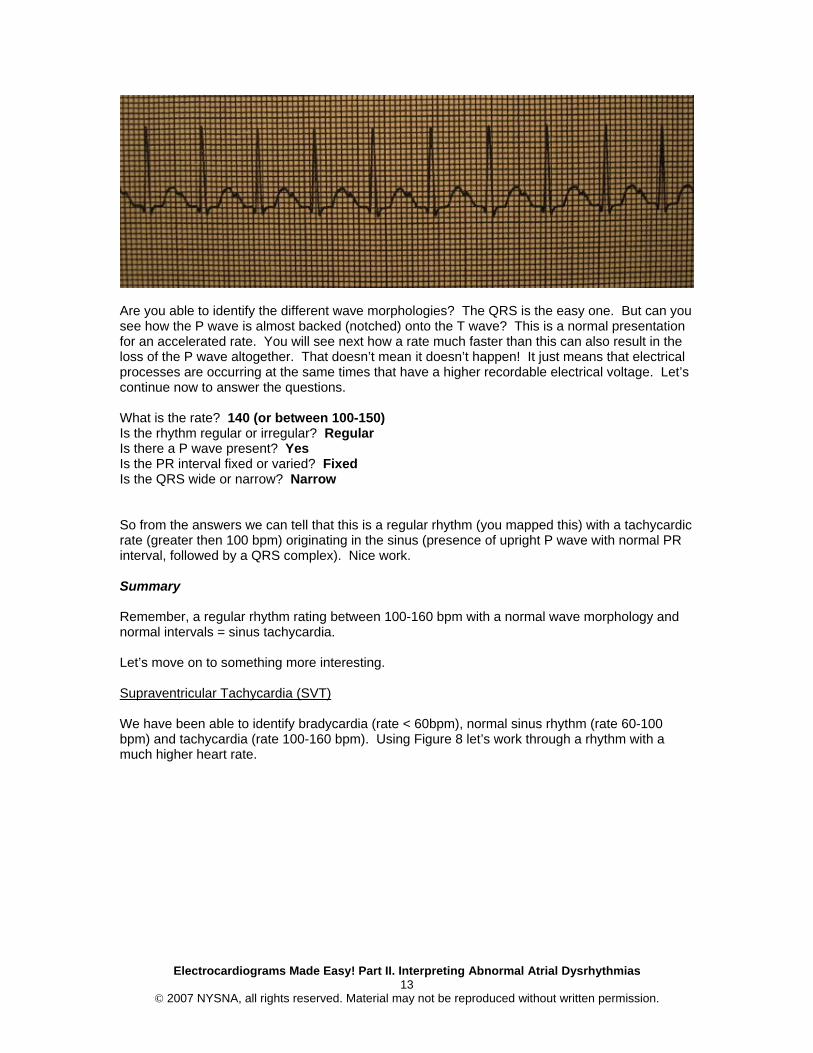
Figure 6. Sinus tachycardia
Electrocardiograms Made Easy! Part II. Interpreting Abnormal Atrial Dysrhythmias 13
© 2007 NYSNA, all rights reserved. Material may not be reproduced without written permission.
Are you able to identify the different wave morphologies? The QRS is the easy one. But can you see how the P wave is almost backed (notched) onto the T wave? This is a normal presentation for an accelerated rate. You will see next how a rate much faster than this can also result in the loss of the P wave altogether. That doesn’t mean it doesn’t happen! It just means that electrical processes are occurring at the same times that have a higher recordable electrical voltage. Let’s continue now to answer the questions. What is the rate? 140 (or between 100-150) Is the rhythm regular or irregular? Regular Is there a P wave present? Yes Is the PR interval fixed or varied? Fixed Is the QRS wide or narrow? Narrow So from the answers we can tell that this is a regular rhythm (you mapped this) with a tachycardic rate (greater then 100 bpm) originating in the sinus (presence of upright P wave with normal PR interval, followed by a QRS complex). Nice work. Summary Remember, a regular rhythm rating between 100-160 bpm with a normal wave morphology and normal intervals = sinus tachycardia. Let’s move on to something more interesting. Supraventricular Tachycardia (SVT) We have been able to identify bradycardia (rate < 60bpm), normal sinus rhythm (rate 60-100 bpm) and tachycardia (rate 100-160 bpm). Using Figure 8 let’s work through a rhythm with a much higher heart rate.
Electrocardiograms Made Easy! Part II. Interpreting Abnormal Atrial Dysrhythmias 14
© 2007 NYSNA, all rights reserved. Material may not be reproduced without written permission.
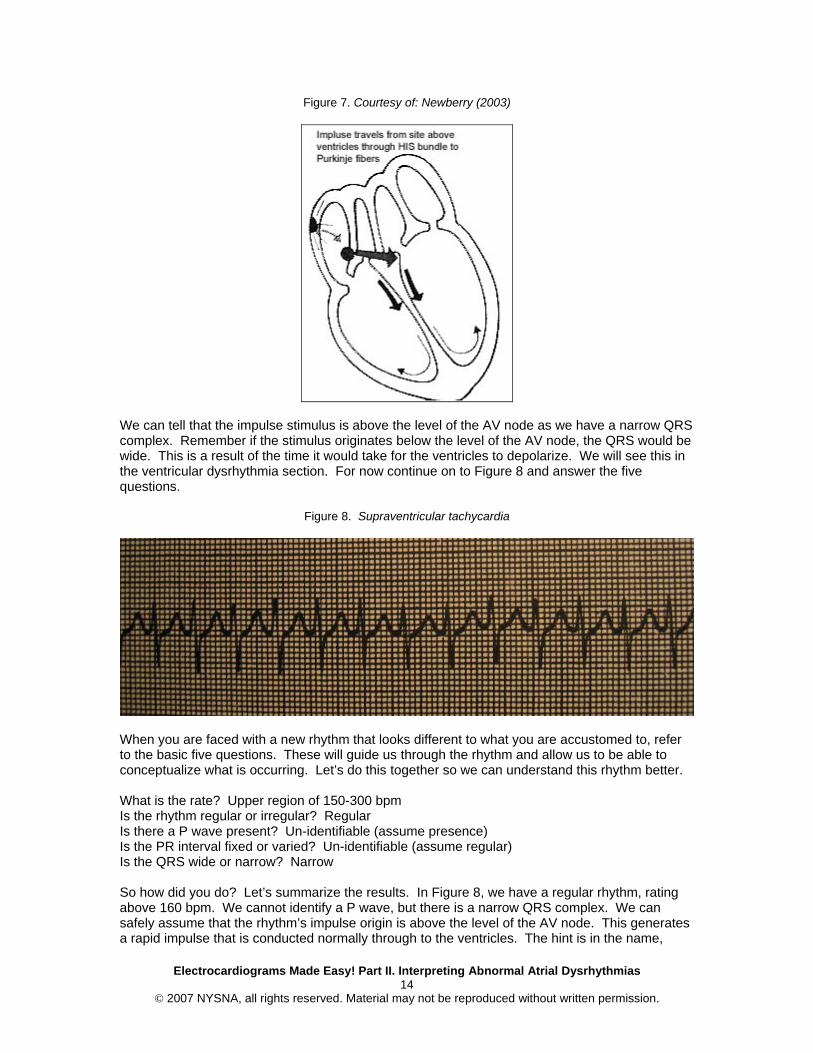
Figure 7. Courtesy of: Newberry (2003)
We can tell that the impulse stimulus is above the level of the AV node as we have a narrow QRS complex. Remember if the stimulus originates below the level of the AV node, the QRS would be wide. This is a result of the time it would take for the ventricles to depolarize. We will see this in the ventricular dysrhythmia section. For now continue on to Figure 8 and answer the five questions.
Figure 8. Supraventricular tachycardia
When you are faced with a new rhythm that looks different to what you are accustomed to, refer to the basic five questions. These will guide us through the rhythm and allow us to be able to conceptualize what is occurring. Let’s do this together so we can understand this rhythm better. What is the rate? Upper region of 150-300 bpm Is the rhythm regular or irregular? Regular Is there a P wave present? Un-identifiable (assume presence) Is the PR interval fixed or varied? Un-identifiable (assume regular) Is the QRS wide or narrow? Narrow So how did you do? Let’s summarize the results. In Figure 8, we have a regular rhythm, rating above 160 bpm. We cannot identify a P wave, but there is a narrow QRS complex. We can safely assume that the rhythm’s impulse origin is above the level of the AV node. This generates a rapid impulse that is conducted normally through to the ventricles. The hint is in the name,
Electrocardiograms Made Easy! Part II. Interpreting Abnormal Atrial Dysrhythmias 15
© 2007 NYSNA, all rights reserved. Material may not be reproduced without written permission.
supra (meaning above) ventricular tachycardia. Simply, it is a tachycardia occurring above the level of the ventricles. Although we cannot see the P wave we must assume that it is present. Remember how they became notched into the T wave during sinus tachycardia, well now due to the rate they are hidden below the T wave (ventricular repolarization). The narrow QRS complex is the key in this rhythm. Are you starting to see how important intervals are now? Even though we cannot see a P wave, we are able to assume that the atria are involved, simply on the basis of the narrow QRS complex. Summary Remember, a regular rhythm rating above 160 bpm with a narrow QRS complex = SVT. Atrial Fibrillation (A-fib) By now you are starting to see how the names of rhythms actually describe the electrical process that is occurring. This rhythm is no different. From atrial fibrillation we know without looking at the rhythm, that there is fibrillation (muscle twitching that lacks coordination) in the atria. This lack of coordination results in electrical chaos within the atrium. With no clear impulse conduction system, haphazard impulses are carried through the AV node into the ventricles. Once in the ventricles, normal impulse conduction occurs.
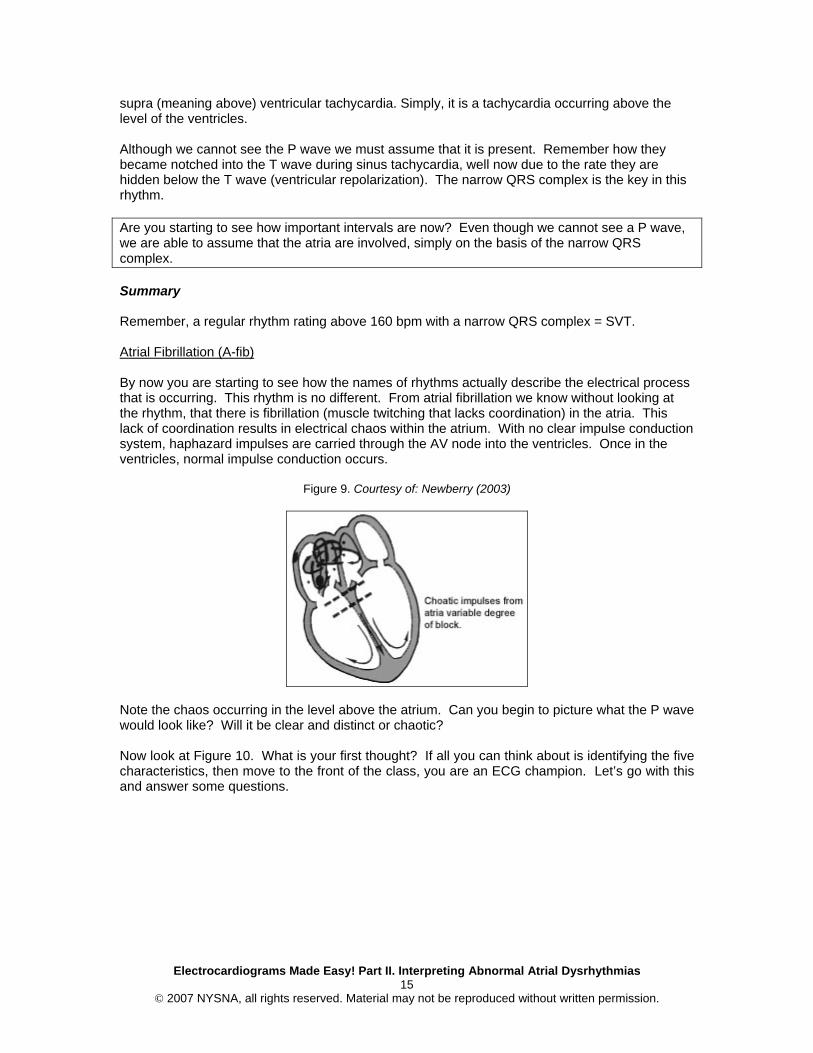
Figure 9. Courtesy of: Newberry (2003)
Note the chaos occurring in the level above the atrium. Can you begin to picture what the P wave would look like? Will it be clear and distinct or chaotic? Now look at Figure 10. What is your first thought? If all you can think about is identifying the five characteristics, then move to the front of the class, you are an ECG champion. Let’s go with this and answer some questions.
Electrocardiograms Made Easy! Part II. Interpreting Abnormal Atrial Dysrhythmias 16
© 2007 NYSNA, all rights reserved. Material may not be reproduced without written permission.
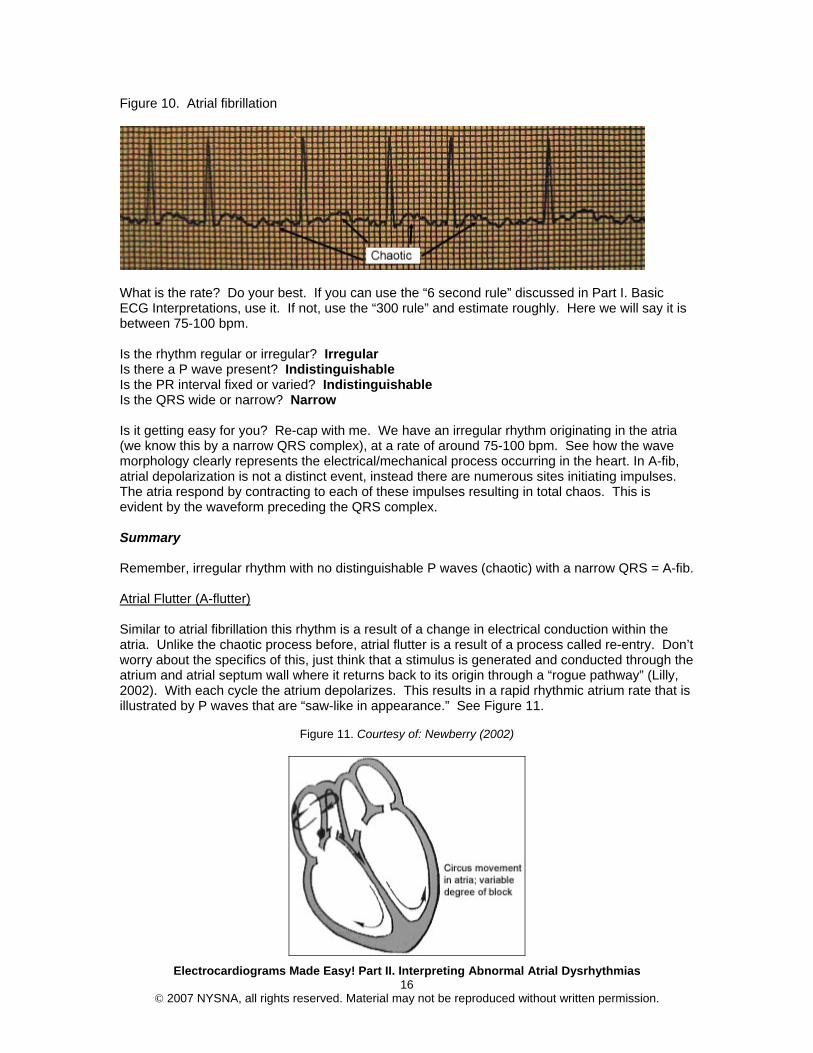
Figure 10. Atrial fibrillation
What is the rate? Do your best. If you can use the “6 second rule” discussed in Part I. Basic ECG Interpretations, use it. If not, use the “300 rule” and estimate roughly. Here we will say it is between 75-100 bpm. Is the rhythm regular or irregular? Irregular Is there a P wave present? Indistinguishable Is the PR interval fixed or varied? Indistinguishable Is the QRS wide or narrow? Narrow Is it getting easy for you? Re-cap with me. We have an irregular rhythm originating in the atria (we know this by a narrow QRS complex), at a rate of around 75-100 bpm. See how the wave morphology clearly represents the electrical/mechanical process occurring in the heart. In A-fib, atrial depolarization is not a distinct event, instead there are numerous sites initiating impulses. The atria respond by contracting to each of these impulses resulting in total chaos. This is evident by the waveform preceding the QRS complex. Summary Remember, irregular rhythm with no distinguishable P waves (chaotic) with a narrow QRS = A-fib. Atrial Flutter (A-flutter) Similar to atrial fibrillation this rhythm is a result of a change in electrical conduction within the atria. Unlike the chaotic process before, atrial flutter is a result of a process called re-entry. Don’t worry about the specifics of this, just think that a stimulus is generated and conducted through the atrium and atrial septum wall where it returns back to its origin through a “rogue pathway” (Lilly, 2002). With each cycle the atrium depolarizes. This results in a rapid rhythmic atrium rate that is illustrated by P waves that are “saw-like in appearance.” See Figure 11.
Figure 11. Courtesy of: Newberry (2002)
Electrocardiograms Made Easy! Part II. Interpreting Abnormal Atrial Dysrhythmias 17
© 2007 NYSNA, all rights reserved. Material may not be reproduced without written permission.
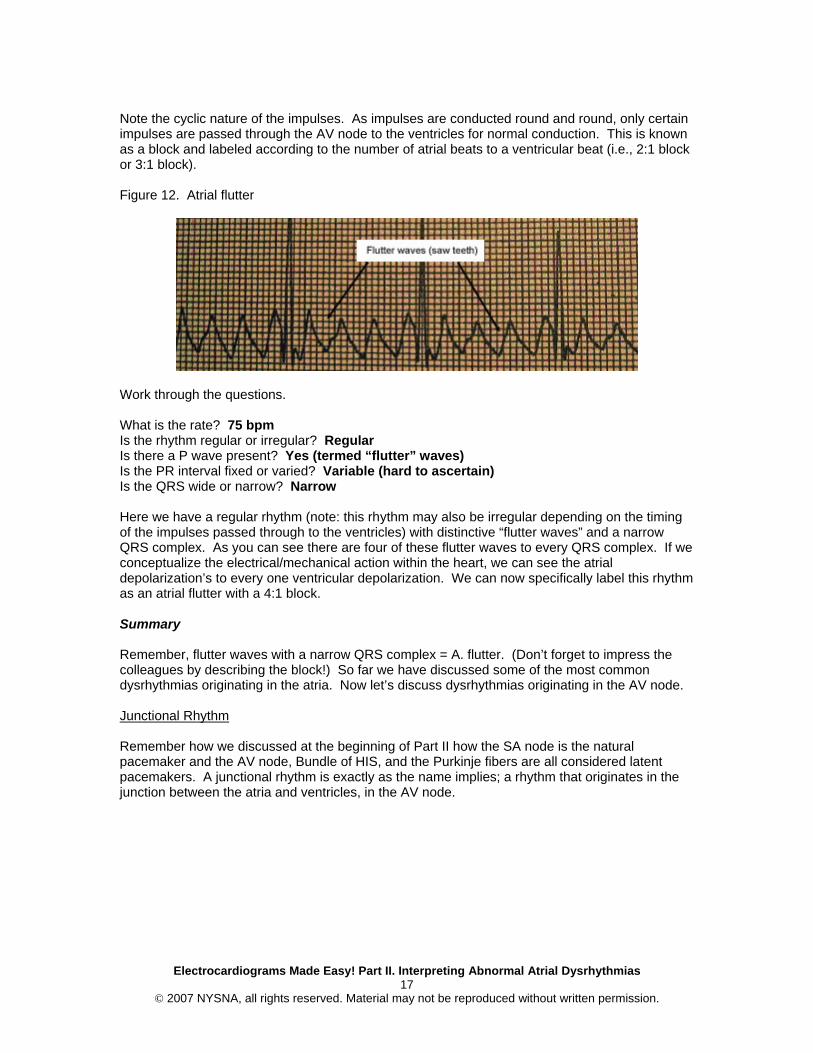
Note the cyclic nature of the impulses. As impulses are conducted round and round, only certain impulses are passed through the AV node to the ventricles for normal conduction. This is known as a block and labeled according to the number of atrial beats to a ventricular beat (i.e., 2:1 block or 3:1 block). Figure 12. Atrial flutter
Work through the questions. What is the rate? 75 bpm Is the rhythm regular or irregular? Regular Is there a P wave present? Yes (termed “flutter” waves) Is the PR interval fixed or varied? Variable (hard to ascertain) Is the QRS wide or narrow? Narrow Here we have a regular rhythm (note: this rhythm may also be irregular depending on the timing of the impulses passed through to the ventricles) with distinctive “flutter waves” and a narrow QRS complex. As you can see there are four of these flutter waves to every QRS complex. If we conceptualize the electrical/mechanical action within the heart, we can see the atrial depolarization’s to every one ventricular depolarization. We can now specifically label this rhythm as an atrial flutter with a 4:1 block. Summary Remember, flutter waves with a narrow QRS complex = A. flutter. (Don’t forget to impress the colleagues by describing the block!) So far we have discussed some of the most common dysrhythmias originating in the atria. Now let’s discuss dysrhythmias originating in the AV node. Junctional Rhythm Remember how we discussed at the beginning of Part II how the SA node is the natural pacemaker and the AV node, Bundle of HIS, and the Purkinje fibers are all considered latent pacemakers. A junctional rhythm is exactly as the name implies; a rhythm that originates in the junction between the atria and ventricles, in the AV node.
Electrocardiograms Made Easy! Part II. Interpreting Abnormal Atrial Dysrhythmias 18
© 2007 NYSNA, all rights reserved. Material may not be reproduced without written permission.
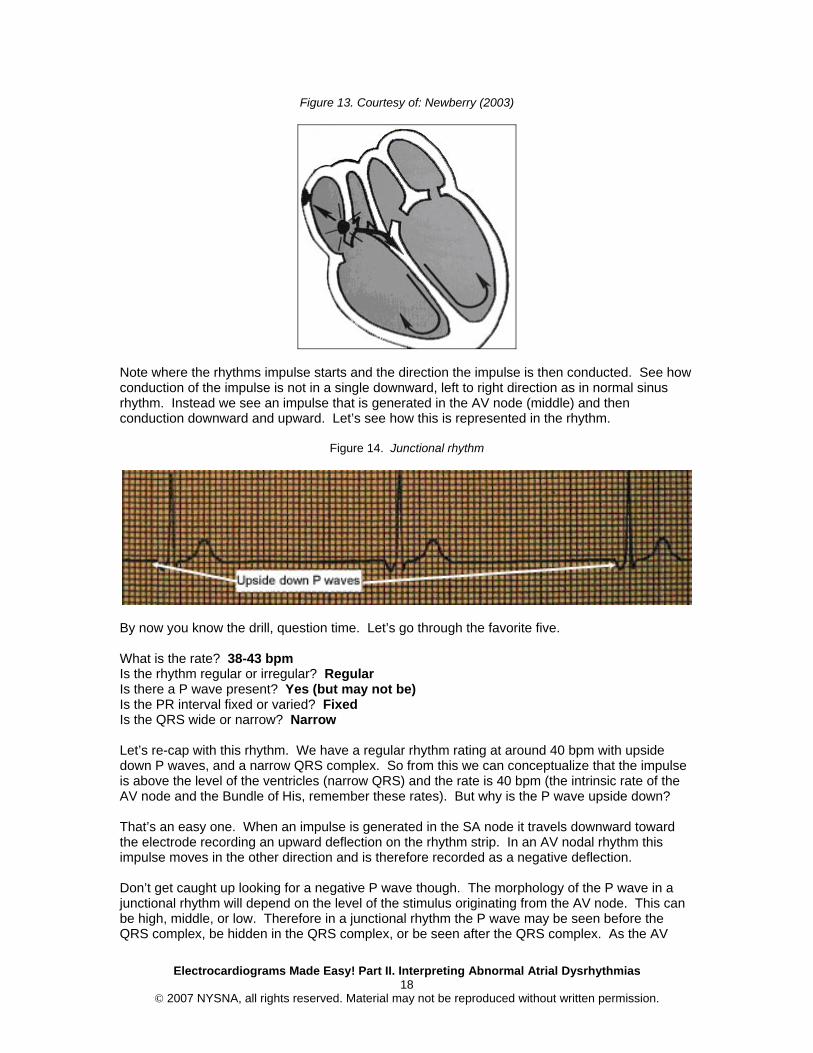
Figure 13. Courtesy of: Newberry (2003)
Note where the rhythms impulse starts and the direction the impulse is then conducted. See how conduction of the impulse is not in a single downward, left to right direction as in normal sinus rhythm. Instead we see an impulse that is generated in the AV node (middle) and then conduction downward and upward. Let’s see how this is represented in the rhythm.
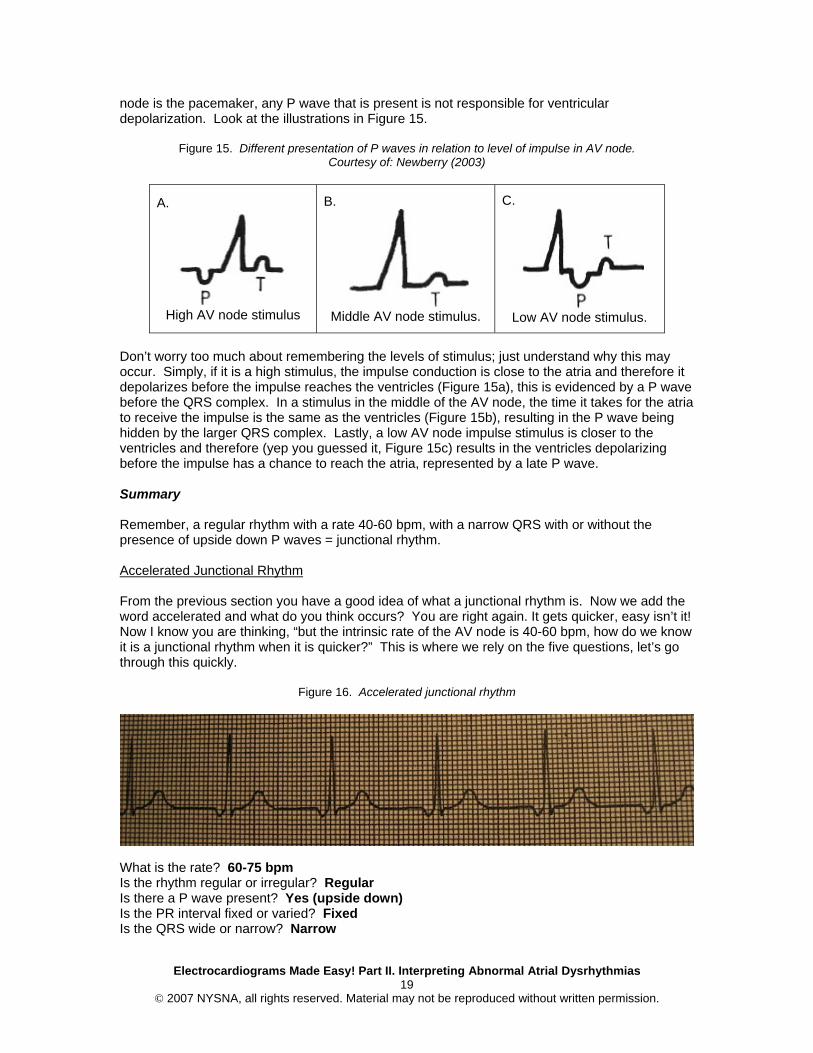
Figure 14. Junctional rhythm
By now you know the drill, question time. Let’s go through the favorite five. What is the rate? 38-43 bpm Is the rhythm regular or irregular? Regular Is there a P wave present? Yes (but may not be) Is the PR interval fixed or varied? Fixed Is the QRS wide or narrow? Narrow Let’s re-cap with this rhythm. We have a regular rhythm rating at around 40 bpm with upside down P waves, and a narrow QRS complex. So from this we can conceptualize that the impulse is above the level of the ventricles (narrow QRS) and the rate is 40 bpm (the intrinsic rate of the AV node and the Bundle of His, remember these rates). But why is the P wave upside down? That’s an easy one. When an impulse is generated in the SA node it travels downward toward the electrode recording an upward deflection on the rhythm strip. In an AV nodal rhythm this impulse moves in the other direction and is therefore recorded as a negative deflection. Don’t get caught up looking for a negative P wave though. The morphology of the P wave in a junctional rhythm will depend on the level of the stimulus originating from the AV node. This can be high, middle, or low. Therefore in a junctional rhythm the P wave may be seen before the QRS complex, be hidden in the QRS complex, or be seen after the QRS complex. As the AV
Electrocardiograms Made Easy! Part II. Interpreting Abnormal Atrial Dysrhythmias 19
© 2007 NYSNA, all rights reserved. Material may not be reproduced without written permission.
node is the pacemaker, any P wave that is present is not responsible for ventricular depolarization. Look at the illustrations in Figure 15.
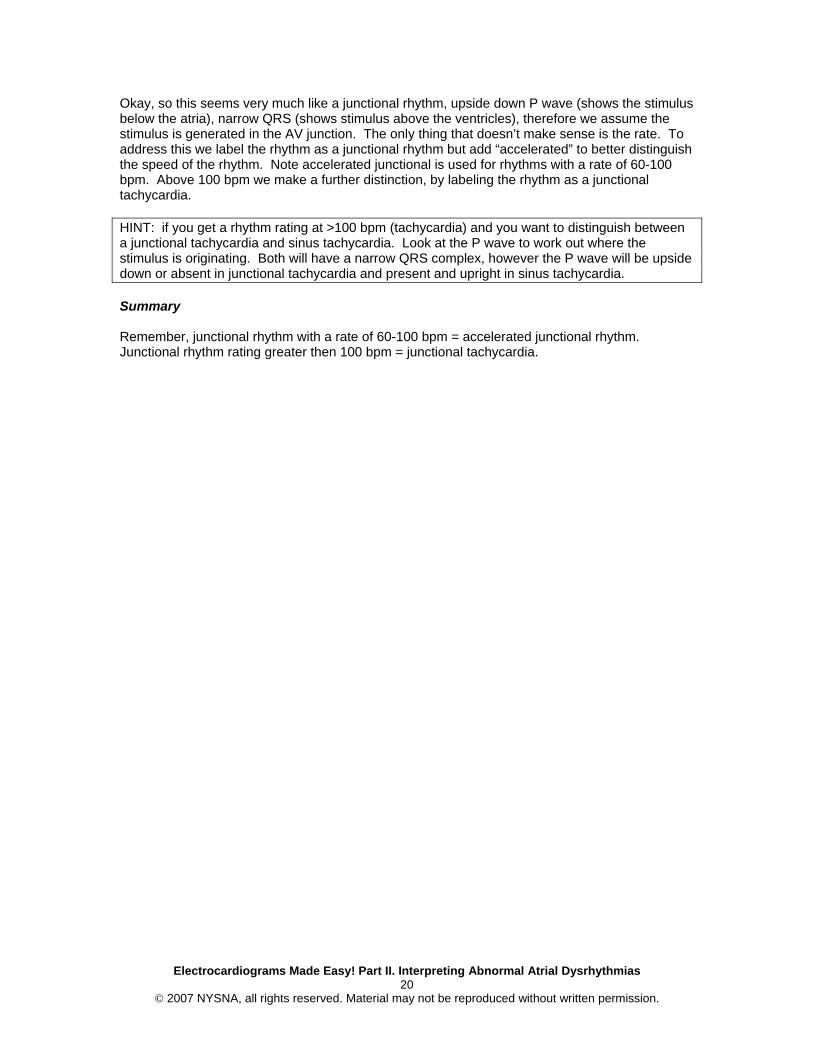
Figure 15. Different presentation of P waves in relation to level of impulse in AV node. Courtesy of: Newberry (2003)
A.
High AV node stimulus
B.
Middle AV node stimulus.
C.
Low AV node stimulus.
Don’t worry too much about remembering the levels of stimulus; just understand why this may occur. Simply, if it is a high stimulus, the impulse conduction is close to the atria and therefore it depolarizes before the impulse reaches the ventricles (Figure 15a), this is evidenced by a P wave before the QRS complex. In a stimulus in the middle of the AV node, the time it takes for the atria to receive the impulse is the same as the ventricles (Figure 15b), resulting in the P wave being hidden by the larger QRS complex. Lastly, a low AV node impulse stimulus is closer to the ventricles and therefore (yep you guessed it, Figure 15c) results in the ventricles depolarizing before the impulse has a chance to reach the atria, represented by a late P wave. Summary Remember, a regular rhythm with a rate 40-60 bpm, with a narrow QRS with or without the presence of upside down P waves = junctional rhythm. Accelerated Junctional Rhythm From the previous section you have a good idea of what a junctional rhythm is. Now we add the word accelerated and what do you think occurs? You are right again. It gets quicker, easy isn’t it! Now I know you are thinking, “but the intrinsic rate of the AV node is 40-60 bpm, how do we know it is a junctional rhythm when it is quicker?” This is where we rely on the five questions, let’s go through this quickly.
Figure 16. Accelerated junctional rhythm
What is the rate? 60-75 bpm Is the rhythm regular or irregular? Regular Is there a P wave present? Yes (upside down) Is the PR interval fixed or varied? Fixed Is the QRS wide or narrow? Narrow
Electrocardiograms Made Easy! Part II. Interpreting Abnormal Atrial Dysrhythmias 20
© 2007 NYSNA, all rights reserved. Material may not be reproduced without written permission.
Okay, so this seems very much like a junctional rhythm, upside down P wave (shows the stimulus below the atria), narrow QRS (shows stimulus above the ventricles), therefore we assume the stimulus is generated in the AV junction. The only thing that doesn’t make sense is the rate. To address this we label the rhythm as a junctional rhythm but add “accelerated” to better distinguish the speed of the rhythm. Note accelerated junctional is used for rhythms with a rate of 60-100 bpm. Above 100 bpm we make a further distinction, by labeling the rhythm as a junctional tachycardia. HINT: if you get a rhythm rating at >100 bpm (tachycardia) and you want to distinguish between a junctional tachycardia and sinus tachycardia. Look at the P wave to work out where the stimulus is originating. Both will have a narrow QRS complex, however the P wave will be upside down or absent in junctional tachycardia and present and upright in sinus tachycardia. Summary Remember, junctional rhythm with a rate of 60-100 bpm = accelerated junctional rhythm. Junctional rhythm rating greater then 100 bpm = junctional tachycardia.
Electrocardiograms Made Easy! Part II. Interpreting Abnormal Atrial Dysrhythmias 21
© 2007 NYSNA, all rights reserved. Material may not be reproduced without written permission.
The Grand Finale A dysrhythmia is not necessarily a critical event. It occurs as a result of a change in the origin of the heart’s pacemaker resulting in a change to the heart rate and rhythm. If you can look at a rhythm and answer these questions you will identify whether the ECG is normal and these will help identify your rhythm.
1. What is the rate? 2. Is the rhythm regular or irregular? 3. Is the P wave present? 4. Is the PR interval fixed or varied? 5. Is the QRS wide or narrow?
Remember, if the ECG is consisting of a regular rhythm rating between 60 and 100 (sinus) and you can identify upright P waves that have a fixed PR interval, followed closely by a narrow QRS complex, then you are looking at an ECG that is consistent with normal cardiac function. If however any of these differed from normal wave morphology then you have identified a dysrhythmia. If you want to see what the atria is doing check out the following: 1. Determine if the P waves are uniform across the strip 2. Are the P waves uniform? 3. Is there one P wave for each QRS? 4. Is the QRS narrow? Hopefully by now you are beginning to think about the mechanical actions the rhythm strip represents as well as the automaticity. The primary pacemaker site is the SA node with the secondary sites as the AV junction, atrial and ventricular cells. The secondary pacer sites act as the escape mechanisms, so that when the higher focus fails, the lower site takes over as a slower back-up. If the SA node fails the AV site escapes to maintain cardiac activity. Now that you understand some of the atrial dysrhythmias, please refer to the course, Electrocardiograms Made Easy! - Part III. Interpreting Ventricular Dysrhythmias to learn about dysrhythmias originating within the ventricles.
Electrocardiograms Made Easy! Part II. Interpreting Abnormal Atrial Dysrhythmias 22
© 2007 NYSNA, all rights reserved. Material may not be reproduced without written permission.
References Centers for Disease Control. (2005). Preventing heart disease and stroke. Retrieved December
17, 2007, from http://www.cdc.gov/nccdphp/publications/factsheets/prevention/cvh.htm Emergency Nurses Association, & Newberry, L. (Ed.). (2002). Sheehy’s emergency nursing:
Principles and practice (5th ed.). St. Louis, MO: Elsevier Health Sciences Division. Lilly, L. S. (Ed.). (2003). Pathophysiology of heart disease. A collaboration project of medical
students and faculty (3rd ed.). Philadelphia, PA: Lippincott Williams & Wilkins. University of Otago. (n.d.). Disease of the heart. Retrieved December 17, 2007, from
http://highschoolbiology.otago.ac.nz/heart.html
Electrocardiograms Made Easy! Part II. Interpreting Abnormal Atrial Dysrhythmias 23
© 2007 NYSNA, all rights reserved. Material may not be reproduced without written permission.
Electrocardiograms Made Easy! Part II. Interpreting Abnormal Atrial Dysrhythmias Course Exam
After studying the downloaded course and completing the course exam, you need to enter your answers online. Answers cannot be graded from this downloadable version of the course. To enter your answers online, go to e-leaRN’s Web site, www.elearnonline.net and click on the Login/My Account button. As a returning student, login using the username and password you created, click on the “Go to Course” link, and proceed to the course exam.
1. The heart’s natural “pacemaker” is the _____________.
A. AV node B. Bundle of His C. Purkinje Fibers D. SA node
2. The presence of a P wave preceding the QRS complex indicates that the electrical impulse
was generated in the _________.
A. Atria B. Ventricles
3. Sinus bradycardia is a normally conducted rhythm with a rate above 60 beats.
A. True B. False
4. The electrical stimulus for Sinus Tachycardia is the __________ and will “fire” at a rate of
__________ beats per minute.
A. Purkinje Fibers; 60 – 100 B. SA node; 100 – 160 C. Left Bundle Branch; 100 – 140 D. SA Node; 40 – 80
5. Atrial fibrillation will result in a regular rhythm with clear P waves and a chaotic QRS complex.
A. True B. False
6. In a Junctional rhythm the electrical stimulus originates in the __________ and will typically
rate __________ beats per minute.
A. SA node; 40 – 80 B. Bundle of His; 60 – 100 C. AV node; 40 – 60 D. Ventricles; 80 – 100
7. An electrocardiogram showing an Accelerated Junctional rhythm will have a rate faster then a
typical Junctional rhythm, but slower then Junctional tachycardia.
A. True B. False
Electrocardiograms Made Easy! Part II. Interpreting Abnormal Atrial Dysrhythmias 24
© 2007 NYSNA, all rights reserved. Material may not be reproduced without written permission.
8. “Saw-teeth” patterning of the P wave is indicative of
A. Atrial fibrillation B. Ventricular Flutter C. AV node injury D. Atrial Flutter
9. Supra-ventricular tachycardia has a rate typically
A. Between 100 – 160 beats per minute B. Above 160 beats per minute C. Below 160 beats per minute D. Over 100 but no more then 140 beats per minute
10. Atrial dysrhythmias characteristically:
A. Have a P wave with a wide QRS complex B. Possess an N wave followed closely by a normal QRS complex C. Have no P wave and a wide QRS complex D. May or may not have a clear P wave but will have a narrow QRS complex