electrocatalysts for synergistically boosting hydrogen
TRANSCRIPT
Supporting Information
Polyoxomolybdate-derived carbon-encapsulated multicomponent
electrocatalysts for synergistically boosting hydrogen evolution
Xiong Liu,‡a Kun Ni,‡c Bo Wen,a Chaojiang Niu,*a Jiashen Meng,a Ruiting Guo,a Qi Li,a Jiantao Li,a
Yanwu Zhu,c Xiaojun Wu,*b Dongyuan Zhaoa,d and Liqiang Mai*a
aState Key Laboratory of Advanced Technology for Materials Synthesis and Processing, International
School of Materials Science and Engineering, Wuhan University of Technology, Luoshi Road 122,
Wuhan, 430070, Hubei, China. E-mail: [email protected]; [email protected] Key Laboratory of Materials for Energy Conversion, CAS Center for Excellence in Nanoscience,
Hefei National Laboratory of Physical Sciences at the Microscale, and Synergetic Innovation of Quantum
Information & Quantum Technology, University of Science and Technology of China, Hefei, Anhui
230026, P. R. China. E-mail: [email protected] Key Laboratory of Materials for Energy Conversion, Chinese Academy of Sciences, & Department
of Materials Science and Engineering, & iChEM (Collaborative Innovation Center of Chemistry for
Energy Materials), University of Science and Technology of China, 96 Jin Zhai Rd, Hefei, Anhui
230026, P. R. ChinadDepartment of Chemistry, State Key Laboratory of Molecular Engineering of Polymers, Shanghai Key
Laboratory of Molecular Catalysis and Innovative Materials, iChEM, Fudan University, Shanghai
200433, P. R. China
Experimental sectionSynthesis of organic-inorganic hybrid polyoxomolybdate composites. In a typical synthesis of MoNi-2-mim nanowire arrays, 0.3 g of (NH4)6Mo7O24·4H2O, 0.2 g of Ni(NO3)2·6H2O and 0.5 g of 2-Methylimidazole were added into 40 mL of methanol solution. After stirring for 5 min, the mixture was put into a 50 mL Teflon-lined
stainless steel autoclave. Pieces of carbon clothes (20 mm × 30 mm) were washed by
diluted hydrochloric acid, deionized water, acetone, ethanol, and dried at 70 °C in a vacuum oven. Afterwards, a piece of pre-treated carbon cloth was placed vertically in an autoclave heated at 160 °C for 20 h. After reacting, the precipitates and carbon cloth were washed with ethanol and dried at 70 °C. The areal weight loading of MoNi-2-mim nanowires on the carbon cloth is ~ 1.5 mg cm-2.
Synthesis of MoO2-Ni@NC nanowire catalyst. The synthesized MoNi-2-mim nanowire arrays and powders were firstly heated at 280 °C in Ar/H2 (95:5 vol.%) for 2 h, and then at 500 ~ 600 °C in Ar/H2 for 2 h to obtain MoO2-Ni@NC nanowire arrays
Electronic Supplementary Material (ESI) for Journal of Materials Chemistry A.This journal is © The Royal Society of Chemistry 2018
and MoO2-Ni@NC powders. The areal weight loading of MoO2-Ni@NC nanowires on the carbon cloth is ~ 1 mg cm-2.
Synthesis of MoO2@NC catalyst. The as-synthesized MoNi-2-mim nanowire arrays were firstly heated at 280 °C in Ar/H2 for 2 h to maintain the nanowire structure, then at 500 °C in Ar/H2 for 2 h and Ni component was removed via acid treatments to obtain MoO2@NC catalyst. Noting that after calcinations at 500 °C, the MoO2 phase was formed. Lower calcination temperature resulted in lower graphitization degree of carbon, thus the unprotected Ni nanoparticles were easily removed.
Synthesis of NC catalyst. The as-synthesized MoNi-2-mim nanowire arrays were firstly heated at 280 °C in Ar/H2 for 2 h to maintain the nanowire structure, then calcined at 400 °C in Ar/H2 for 2 h. The Ni and Mo species were removed via acid treatments and then calcined at 500, 550 or 600 °C to obtain N-doped carbon catalyst. Noting that after calcination at 400 °C, the sample is low-crystalline and the Ni and Mo species can be easily removed.
Characterization. TEM, high-resolution TEM (HRTEM), HAADF-STEM and SAED were collected using a JEM-2100F/Titan G260-300 transmission electron microscope. The crystallographic characterizations of the as-synthesized samples were performed using a Bruker D8 Advance X-ray diffractometer with Cu Kα radiation (λ = 1.54060 Å). SEM images were collected with a JEOL-7100F microscope at an acceleration voltage of 20 kV. XPS and UPS measurements were conducted using an ESCALAB 250Xi instrument. Raman and Fourier-transform infrared (FTIR) spectra were obtained using Renishaw INVIA micro-Raman spectroscopy and Nicolet6700 measurements, respectively. CHNS elemental analyzer was applied to determine the contents of carbon and nitrogen. ICP measurements were performed by PerkinElmer Optima 4300DV spectrometer.
Electrochemical measurements. Electrochemical measurements were measured using a three-electrode system on an electrochemical workstation (CHI760E) in 0.5 M H2SO4 solution at room temperature (25 ± 2 °C). A saturated calomel electrode (SCE, saturated KCl as the filling solution) was applied as a reference electrode, a graphite rod was used as a counter electrode and the catalysts supported on the carbon cloth were directly used as a working electrode. LSV polarization curves were tested at a slow scan rate of 5 mV s-1 to eliminate the capacitive current during the electrocatalytic reaction as much as possible. The data were corrected by iR compensation to remove the influence of ohmic resistance. EIS was carried out in a frequency range from 0.1 Hz to 100,000 Hz. The commercial Pt/C catalyst supported on the carbon cloth was prepared via
dispersing 8 mg Pt/C and 2 mg Vulcan XC-72R in 700 µL isopropyl alcohol, 250 µL H2O and 50 µL Nafion solution (5 wt.%) to form a homogeneous ink, then a 125 µL ink which contains 1 mg catalyst was coated on the carbon cloth within 1 cm2. In 0.5 M H2SO4, the potential was referenced to a reversible hydrogen electrode (RHE) based on the following equation: . In 𝐸(𝑅𝐻𝐸) = 𝐸(𝑆𝐶𝐸) + 0.2415 𝑉 + 0.0592 × 𝑝𝐻
addition, the current density calculation is based on the geometric area of an electrode.The proton adsorption experiments were measured by a dialysis method according
to the previous reports.1,2 In detail, the solution which contains the catalyst was dialyzed using a semi-permeable membrane (MWCO 1000) in a 600 mL beaker, and the dialysate was 5 mM HCl (500 mL). If the catalyst displays the good H+ adsorption behavior, the H+ would gradually cross the semi-permeable membrane dialyze into the solution of catalyst. After stirring on predetermined time intervals, the residual concentration of HCl solution was determined by titrating with 5 mM NaOH solution.The amount of the adsorbed H+ (based on the quality of HCl) Q (mg/g) is calculated by the following equation:
𝑄 =(𝐶0 ‒ 𝐶𝑒) × 𝑉
𝑊
Here, C0 and Ce are the initial and equilibrium concentration of HCl (mg/L), respectively. V is the volume of HCl solution (L) and W is the weight (mg) of catalyst adsorbent.
Calculation method. The structure optimization and electron structure calculations of all considered catalysts were performed by using Vienna ab initio simulation package (VASP).3 A generalized gradient approximation (GGA) with the Perdew-Burke-Ernzerhof (PBE) function was used to describe exchange correlation interactions.4,5 The plane wave basis set cutoff energy was 500 eV. Gaussian smearing with sigma value of 0.05 eV for the geometry optimization and 0.2 eV for the projected density of states (PDOS) calculation was employed. The energy convergence tolerance for self-consistent field (SCF) for the geometry optimization was 0.01 meV. The force convergence tolerance for the geometry optimization was considered as 0.05 eV/angstrom. All calculations were done with spin unrestricted. The crystal orbital Hamilton population (COHP) calculations were carried out by LOBSTER software program.8 The K points were sampled as using Monkhorst-Pack method7 for 2 × 1 × 1
the geometry optimization and sampled as for the band decomposed charge 4 × 2 × 1
density calculation and COHP analyses and sampled as for the PDOS 8 × 4 × 1
calculation.

Fig. S1 Comparison of the MoO2-Ni@NC nanowire catalyst in this work with the carbon-encapsulated catalysts reported previously for the acidic HER. The NC, GO and CNTs represent N-doped carbon, graphene oxide and carbon nanotubes, respectively.
Fig. S2 (a) Synthesis of the novel inorganic-organic hybrid polyoxomolybdate (denoted as MoNi-2-mim) nanowire arrays. (b) Formation of the N-doped carbon-encapsulated MoO2-Ni (denoted as MoO2-Ni@NC) nanowire arrays via the calcination under H2 protection.
14.514.
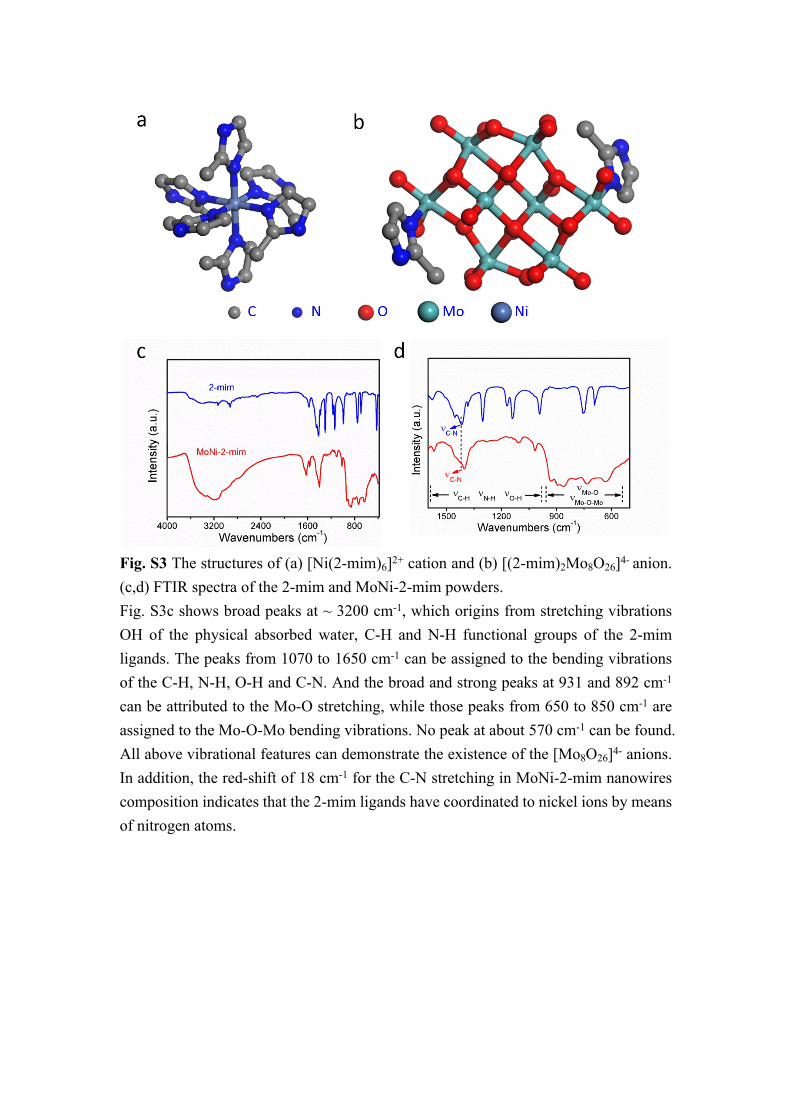
Fig. S3 The structures of (a) [Ni(2-mim)6]2+ cation and (b) [(2-mim)2Mo8O26]4- anion. (c,d) FTIR spectra of the 2-mim and MoNi-2-mim powders.Fig. S3c shows broad peaks at ~ 3200 cm-1, which origins from stretching vibrations OH of the physical absorbed water, C-H and N-H functional groups of the 2-mim ligands. The peaks from 1070 to 1650 cm-1 can be assigned to the bending vibrations of the C-H, N-H, O-H and C-N. And the broad and strong peaks at 931 and 892 cm-1 can be attributed to the Mo-O stretching, while those peaks from 650 to 850 cm-1 are assigned to the Mo-O-Mo bending vibrations. No peak at about 570 cm-1 can be found. All above vibrational features can demonstrate the existence of the [Mo8O26]4- anions. In addition, the red-shift of 18 cm-1 for the C-N stretching in MoNi-2-mim nanowires composition indicates that the 2-mim ligands have coordinated to nickel ions by means of nitrogen atoms.
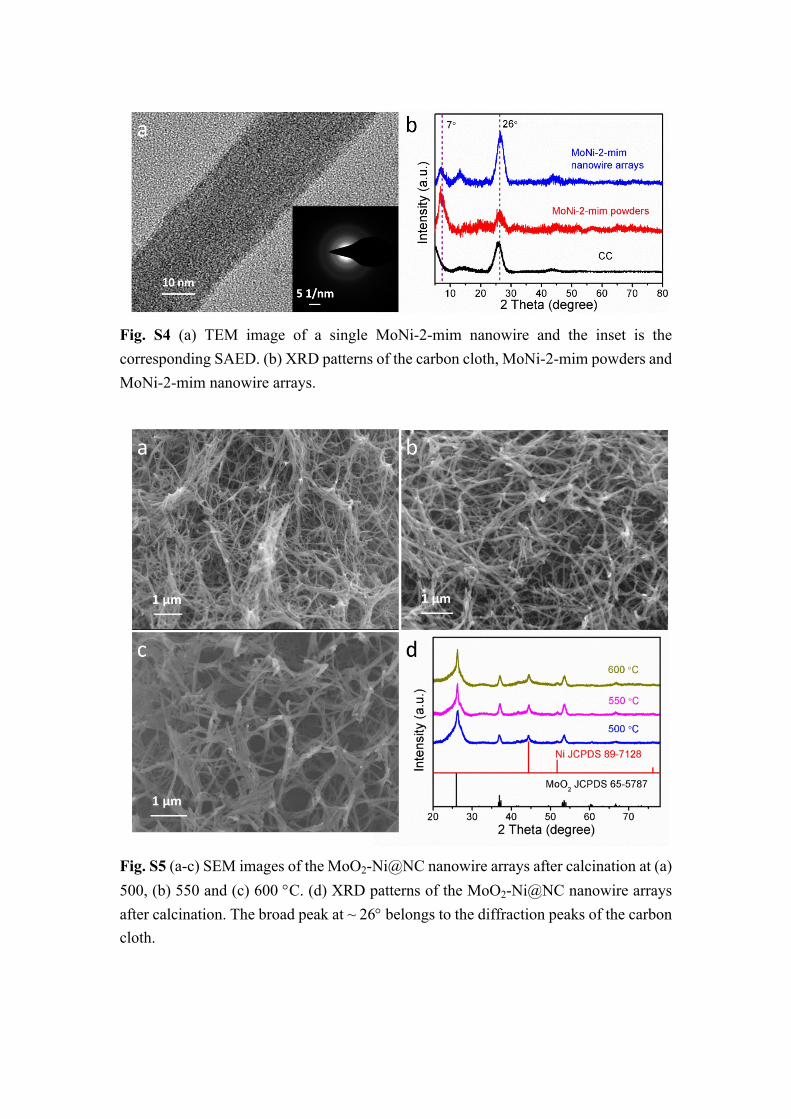
Fig. S4 (a) TEM image of a single MoNi-2-mim nanowire and the inset is the corresponding SAED. (b) XRD patterns of the carbon cloth, MoNi-2-mim powders and MoNi-2-mim nanowire arrays.
Fig. S5 (a-c) SEM images of the MoO2-Ni@NC nanowire arrays after calcination at (a) 500, (b) 550 and (c) 600 C. (d) XRD patterns of the MoO2-Ni@NC nanowire arrays after calcination. The broad peak at ~ 26 belongs to the diffraction peaks of the carbon cloth.
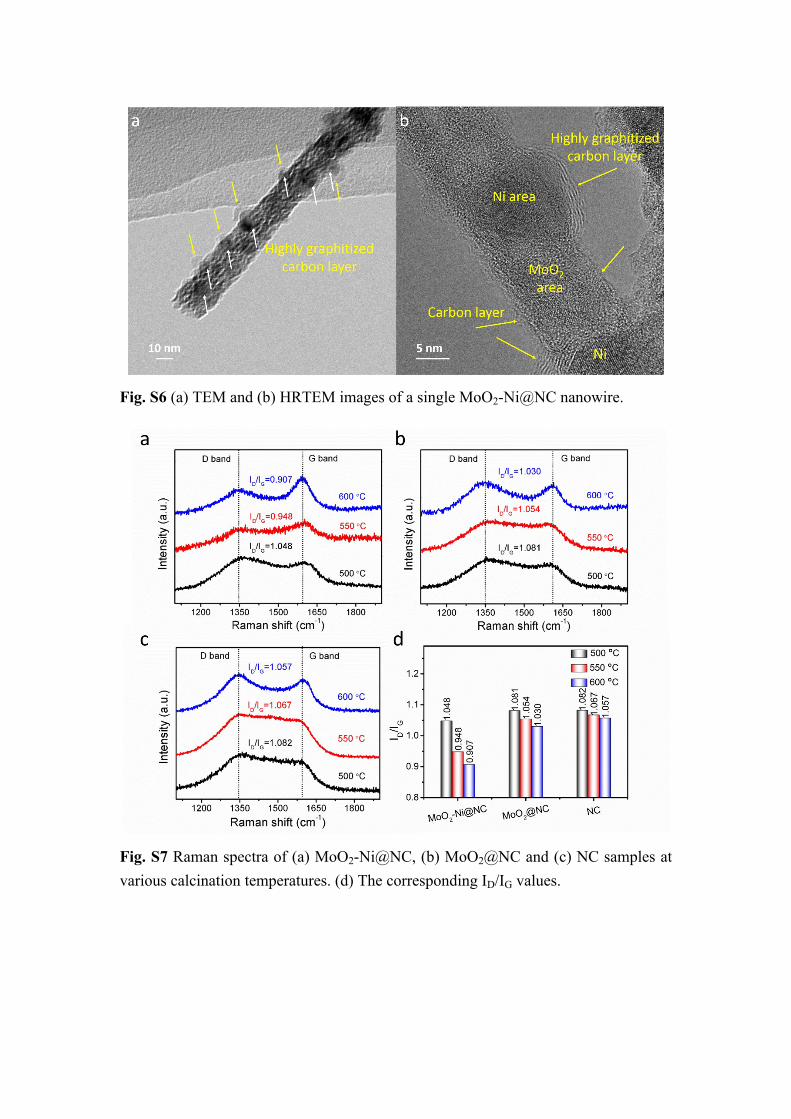
Fig. S6 (a) TEM and (b) HRTEM images of a single MoO2-Ni@NC nanowire.
Fig. S7 Raman spectra of (a) MoO2-Ni@NC, (b) MoO2@NC and (c) NC samples at various calcination temperatures. (d) The corresponding ID/IG values.
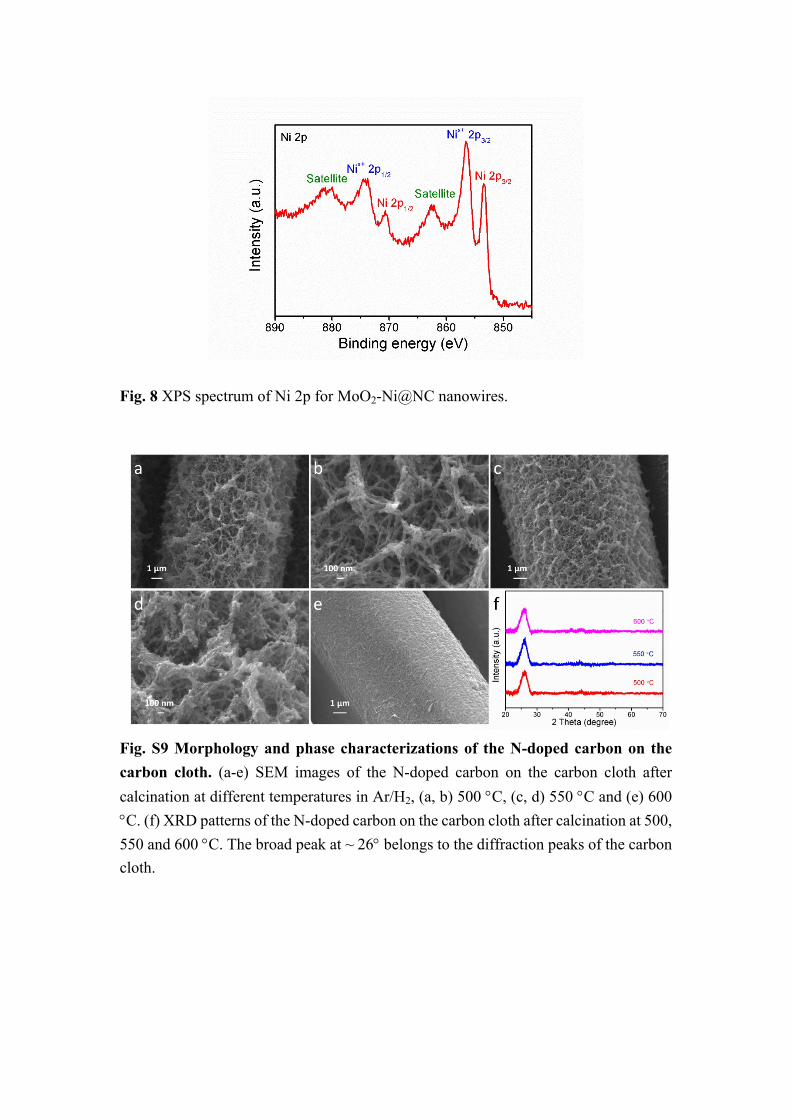
Fig. 8 XPS spectrum of Ni 2p for MoO2-Ni@NC nanowires.
Fig. S9 Morphology and phase characterizations of the N-doped carbon on the carbon cloth. (a-e) SEM images of the N-doped carbon on the carbon cloth after calcination at different temperatures in Ar/H2, (a, b) 500 C, (c, d) 550 C and (e) 600 C. (f) XRD patterns of the N-doped carbon on the carbon cloth after calcination at 500, 550 and 600 C. The broad peak at ~ 26 belongs to the diffraction peaks of the carbon cloth.
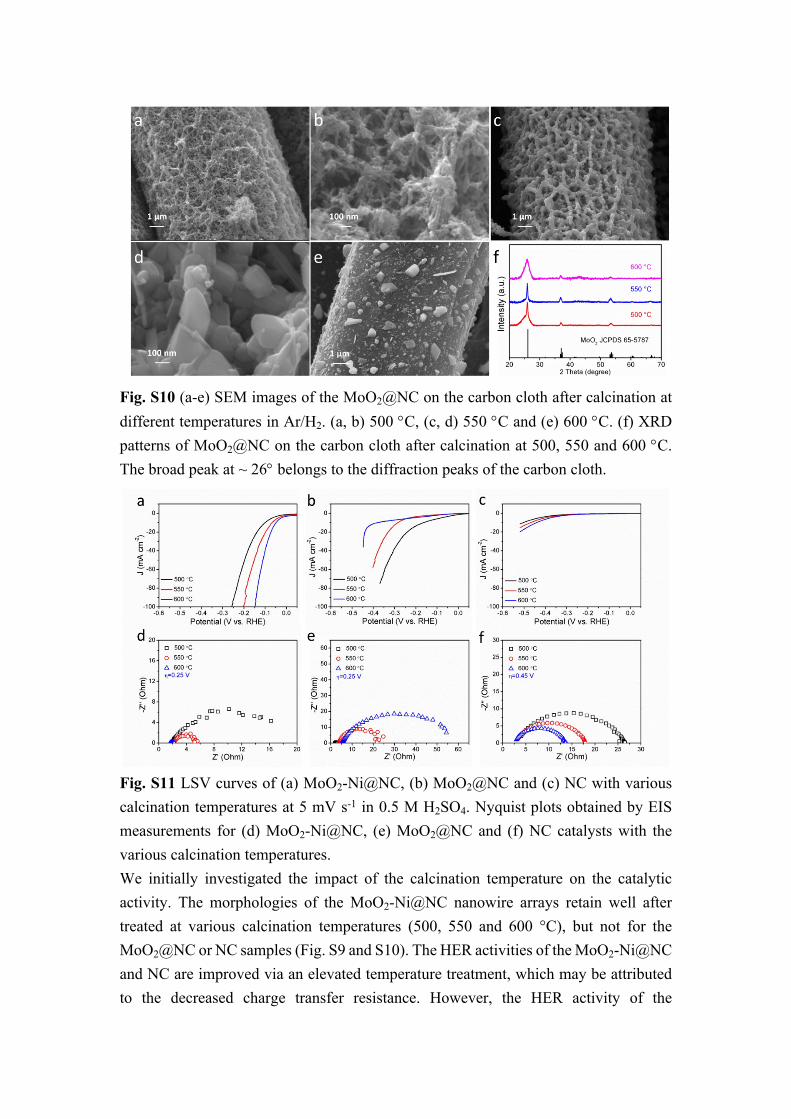
Fig. S10 (a-e) SEM images of the MoO2@NC on the carbon cloth after calcination at different temperatures in Ar/H2. (a, b) 500 C, (c, d) 550 C and (e) 600 C. (f) XRD patterns of MoO2@NC on the carbon cloth after calcination at 500, 550 and 600 C. The broad peak at ~ 26 belongs to the diffraction peaks of the carbon cloth.
Fig. S11 LSV curves of (a) MoO2-Ni@NC, (b) MoO2@NC and (c) NC with various calcination temperatures at 5 mV s-1 in 0.5 M H2SO4. Nyquist plots obtained by EIS measurements for (d) MoO2-Ni@NC, (e) MoO2@NC and (f) NC catalysts with the various calcination temperatures.We initially investigated the impact of the calcination temperature on the catalytic activity. The morphologies of the MoO2-Ni@NC nanowire arrays retain well after treated at various calcination temperatures (500, 550 and 600 °C), but not for the MoO2@NC or NC samples (Fig. S9 and S10). The HER activities of the MoO2-Ni@NC and NC are improved via an elevated temperature treatment, which may be attributed to the decreased charge transfer resistance. However, the HER activity of the
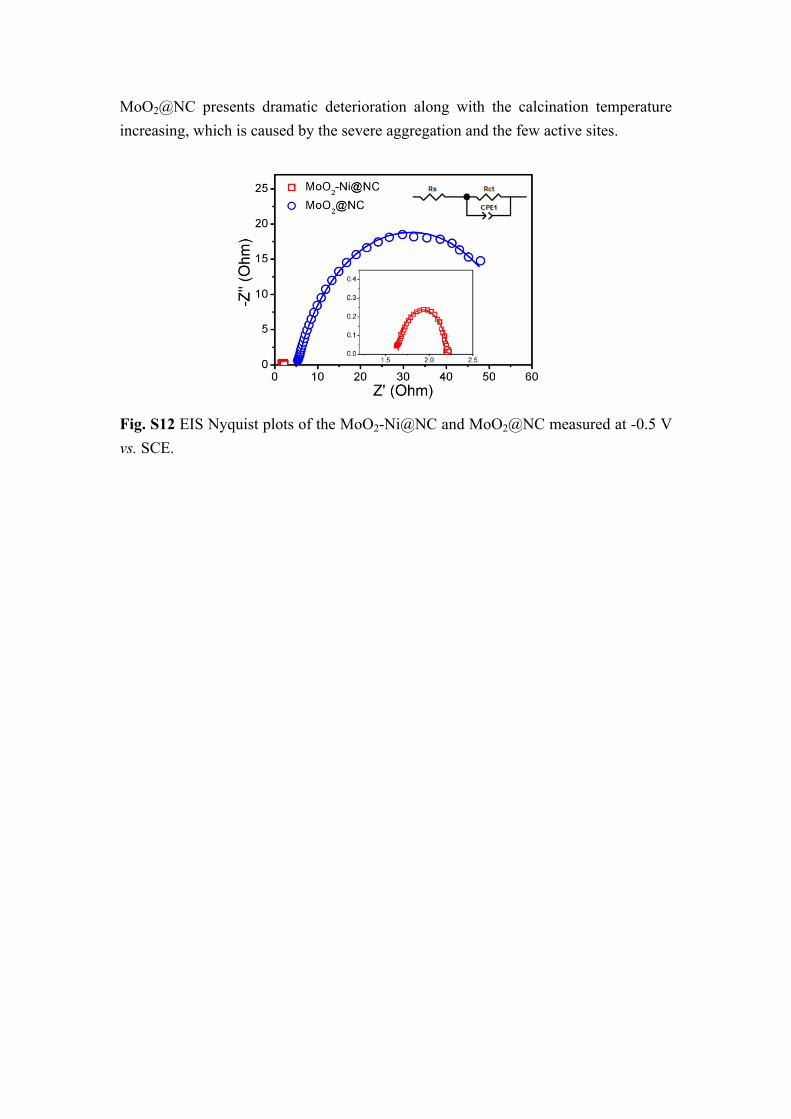
MoO2@NC presents dramatic deterioration along with the calcination temperature increasing, which is caused by the severe aggregation and the few active sites.
Fig. S12 EIS Nyquist plots of the MoO2-Ni@NC and MoO2@NC measured at -0.5 V vs. SCE.

Fig. S13 Valence band spectra of the MoO2-Ni@NC and MoO2@NC from UPS measurements.
Fig. S14 The dependence of the adsorption time on the amount of adsorbed H+ (based on the quality of HCl) on the MoO2-Ni@NC and MoO2@NC in 5 mM HCl aqueous solution.
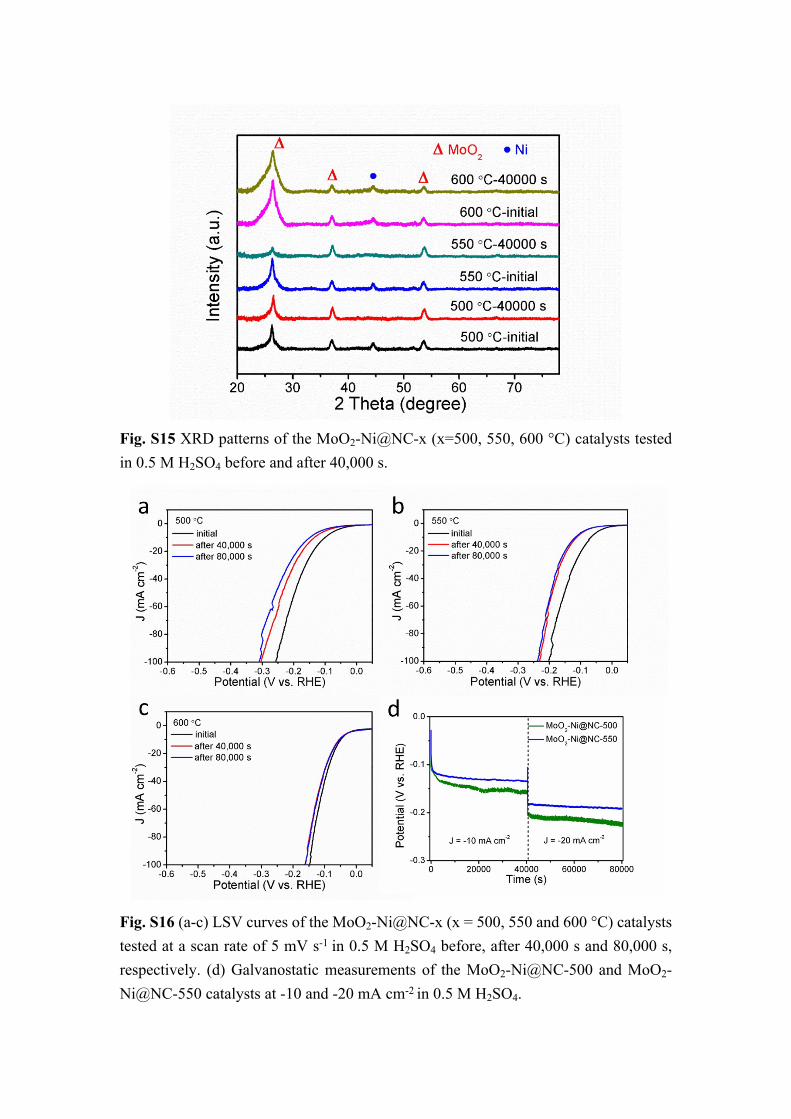
Fig. S15 XRD patterns of the MoO2-Ni@NC-x (x=500, 550, 600 °C) catalysts tested in 0.5 M H2SO4 before and after 40,000 s.
Fig. S16 (a-c) LSV curves of the MoO2-Ni@NC-x (x = 500, 550 and 600 °C) catalysts tested at a scan rate of 5 mV s-1 in 0.5 M H2SO4 before, after 40,000 s and 80,000 s, respectively. (d) Galvanostatic measurements of the MoO2-Ni@NC-500 and MoO2-Ni@NC-550 catalysts at -10 and -20 mA cm-2 in 0.5 M H2SO4.

Fig. S17 (a) SEM image and the corresponding elemental mappings of the MoO2-Ni@NC nanowire arrays after testing in 0.5 M H2SO4 for 40,000 s. (b)TEM and (c) HRTEM images of the MoO2-Ni@NC nanowires, which origin from the MoO2-Ni@NC nanowire arrays after HER testing in 0.5 M H2SO4.

Fig. S18 Structural models of (a-c) MoO2-Ni@NC, (d-f) MoO2@NC and (g-i) NC. The blue, brown, red, fuchsia and orchid balls refer to N, C, O, Ni and Mo atoms, respectively.
Based on the approximate plane on our nanowire structure at the atomic level, the planar models are adopted. In addition, due to the single carbon layer is widely used in the models for the carbon-encapsulated electrocatalysts,15,23,24 thus the planar models with the single N-doped carbon layer on the top and the MoO2 with Ni cluster substituted partly below the carbon layer were adopted. Though the calculated models are much smaller than the experimental results, it would not undermine the reliability of calculations to reflect the effect of the inner MoO2-Ni on the outer N-doped carbon.25,26

Fig. S19 The ΔGH* calculated at different sites on the surface of MoO2-Ni@NC model.
Fig. S20 (a-c) PDOS analysis of MoO2-Ni@NC, MoO2@NC and NC models with the H atom adsorbed on the C-N6 site, respectively. (d,e) COHP analysis of MoO2@NC and NC models, respectively. (f) COHP analysis for the H-N bond of the MoO2-Ni@NC, MoO2@NC and NC models, respectively.
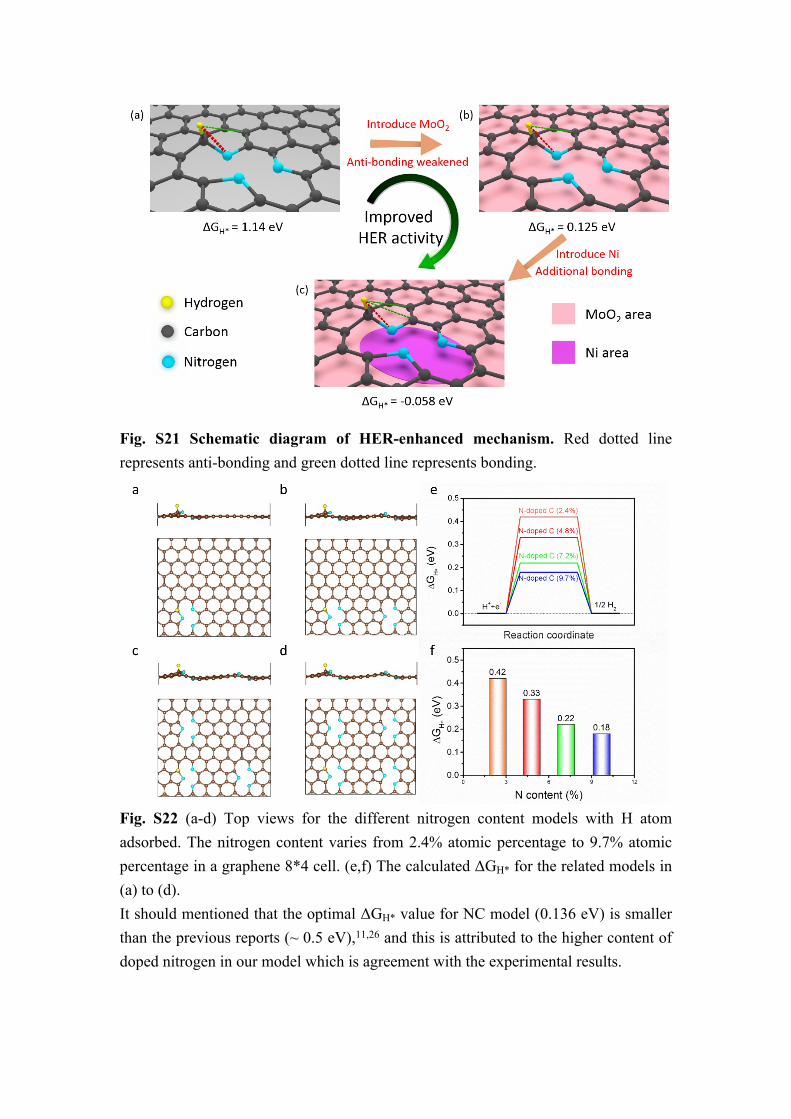
Fig. S21 Schematic diagram of HER-enhanced mechanism. Red dotted line represents anti-bonding and green dotted line represents bonding.
Fig. S22 (a-d) Top views for the different nitrogen content models with H atom adsorbed. The nitrogen content varies from 2.4% atomic percentage to 9.7% atomic percentage in a graphene 8*4 cell. (e,f) The calculated ΔGH* for the related models in (a) to (d).It should mentioned that the optimal ΔGH* value for NC model (0.136 eV) is smaller than the previous reports (~ 0.5 eV),11,26 and this is attributed to the higher content of doped nitrogen in our model which is agreement with the experimental results.
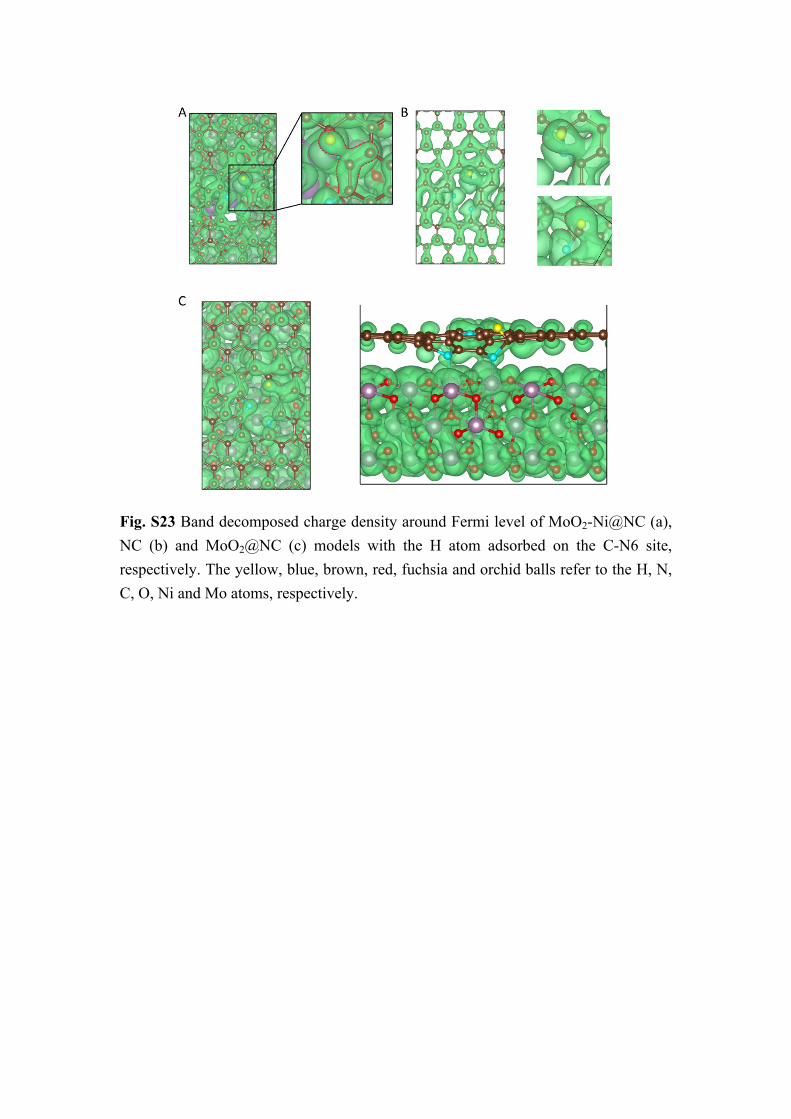
Fig. S23 Band decomposed charge density around Fermi level of MoO2-Ni@NC (a), NC (b) and MoO2@NC (c) models with the H atom adsorbed on the C-N6 site, respectively. The yellow, blue, brown, red, fuchsia and orchid balls refer to the H, N, C, O, Ni and Mo atoms, respectively.
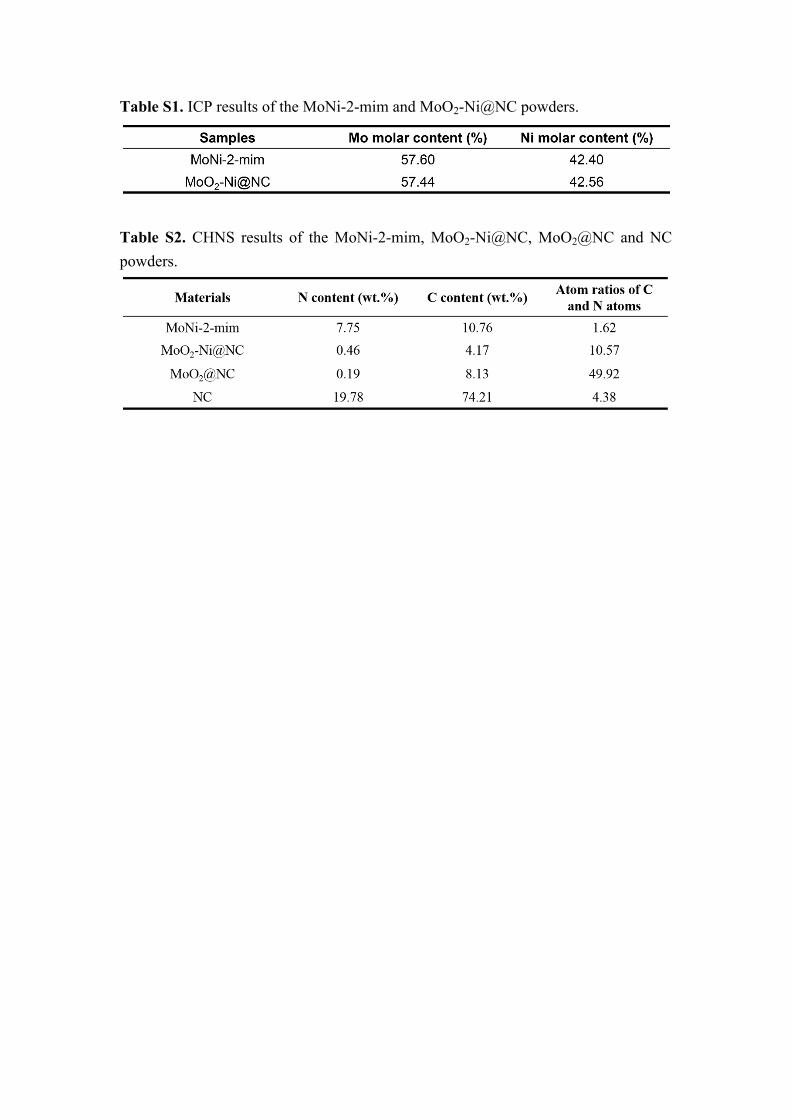
Table S1. ICP results of the MoNi-2-mim and MoO2-Ni@NC powders.
Table S2. CHNS results of the MoNi-2-mim, MoO2-Ni@NC, MoO2@NC and NC powders.
References1 H. Li, W. Q. Kong, J. Liu, N. Y. Liu, H. Huang, Y. Liu and Z. H. Kang, Carbon,
2015, 91, 66-75.2 Y. Y. Ma, C. X. Wu, X. J. Feng, H. Q. Tan, L. K. Yan, Y. Liu, Z. H. Kang, E. B.
Wang and Y. G. Li, Energy Environ. Sci., 2017, 10, 788-798.3 J. Hafner, J. Comput. Chem., 2008, 29, 2044-2078.4 J. P. Perdew, K. Burke and M. Ernzerhof, Phys. Rev. Lett., 1996, 77, 3865-3868.5 M. Ernzerhof and G. E. Scuseria, J. Chem. Phys., 1999, 110, 5029-5036.6 S. Maintz, V. L. Deringer, A. L. Tchougreeff and R. Dronskowski, J. Comput.
Chem., 2016, 37, 1030-1035.7 H. J. Monkhorst and J. D. Pack, Phys. Rev. B, 1976, 13, 5188-5192.8 Y. Jiao, Y. Zheng, K. Davey and S. Z. Qiao, Nat. Energy, 2016, 1, 16130.9 Y. Hou, Z. H. Wen, S. M. Cui, S. Q. Ci, S. Mao and J. H. Chen, Adv. Funct. Mater.,
2015, 25, 872-882.10 Y. C. Zhou, Y. H. Leng, W. J. Zhou, J. L. Huang, M. W. Zhao, J. Zhan, C. H. Feng,
Z. H. Tang, S. W. Chen and H. Liu, Nano Energy, 2015, 16, 357-366.11 S. H. Noh, M. H. Seo, J. Kang, T. Okajima, B. Han and T. Ohsaka, NPG Asia
Mater., 2016, 8, e312.12 X. X. Zou, X. X. Huang, A. Goswami, R. Silva, B. R. Sathe, E. Mikmekova and
T. Asefa, Angew. Chem., Int. Ed., 2014, 126, 4461-4465.13 Y. Zheng, Y. Jiao, Y. H. Zhu, L. H. Li, Y. Han, Y. Chen, A. J. Du, M. Jaroniec and
S. Z. Qiao, Nat. Commun., 2014, 5, 3783.14 Q. Han, Z. H. Cheng, J. Gao, Y. Zhao, Z. P. Zhang, L. M. Dai and L. T. Qu, Adv.
Funct. Mater., 2017, 27, 1606352.15 W. J. Zhou, J. Zhou, Y. C. Zhou, J. Lu, K. Zhou, L. J. Yang, Z. H. Tang, L. G. Li
and S. W. Chen, Chem. Mater., 2015, 27, 2026-2032.16 M. Kuang, Q. H. Wang, P. Han and G. F. Zheng, Adv. Energy Mater., 2017, 7,
1700193.17 J. T. Zhang, L. T. Qu, G. Q. Shi, J. Y. Liu, J. F. Chen and L. M. Dai, Angew. Chem.,
Int. Ed., 2016, 55, 2230-2234.18 J. Deng, P. J. Ren, D. H. Deng and X. H. Bao, Angew. Chem., Int. Ed., 2015, 54,
2100-2104.19 W. J. Zhou, T. L. Xiong, C. H. Shi, J. Zhou, K. Zhou, N. W. Zhu, L. G. Li, Z. H.
Tang and S. W. Chen, Angew. Chem., Int. Ed., 2016, 128, 8556-8560.20 H. S. Fan, H. Yu, Y. F. Zhang, Y. Zheng, Y. B. Luo, Z. F. Dai, B. Li, Y. Zong and
Q. Y. Yan, Angew. Chem., Int. Ed., 2017, 56, 12566-12570.21 S. P. Wang, J. Wang, M. L. Zhu, X. B. Bao, B. Y. Xiao, D. F. Su, H. R. Li and Y.
Wang, J. Am. Chem. Soc., 2015, 137, 15753-15759.22 T. Wang, Y. R. Guo, Z. X. Zhou, X. H. Chang, J. Zheng and X. G. Li, ACS Nan,

2016, 10, 10397-10403.23 J. W. Su, Y. Yang, G. L. Xia, J. T. Chen, P. Jiang and Q. W. Chen, Nat. Commun.,
2017, 8, 14969.24 P. Jiang, J. T. Chen, C. L. Wang, K. Yang, S. P. Gong, S. Liu, Z. Y. Lin, M. S. Li,
G. L. Xia, Y. Yang, J. W. Su and Q. W. Chen, Adv. Mater., 2018, 30, 1705324.25 Y. T. Xu, X. F. Xiao, Z. M. Ye, S. L. Zhao, R. A. Shen, C. T. He, J. P. Zhang, Y.
D. Li and X. M. Chen, J. Am. Chem. Soc., 2017, 139, 5285-5288.26 Y. Yang, Z. Y. Lun, G. L. Xia, F. C. Zheng, M. N. He and Q. W. Chen, Energy
Environ. Sci., 2015, 8, 3563-3571.