electrochemical characterization and time‑variant structural
TRANSCRIPT
ELECTROCHEMICAL CHARACTERIZATION AND
TIME-VARIANT STRUCTURAL RELIABILITY ASSESSMENT OF
POST-TENSIONED, SEGMENTAL CONCRETE BRIDGES
A Dissertation
by
RADHAKRISHNA PILLAI GOPALAKRISHNAN
Submitted to the Office of Graduate Studies of Texas A&M University
in partial fulfillment of the requirements for the degree of
DOCTOR OF PHILOSOPHY
May 2009
Major Subject: Civil Engineering
ELECTROCHEMICAL CHARACTERIZATION AND
TIME-VARIANT STRUCTURAL RELIABILITY ASSESSMENT OF
POST-TENSIONED, SEGMENTAL CONCRETE BRIDGES
A Dissertation
by
RADHAKRISHNA PILLAI GOPALAKRISHNAN
Submitted to the Office of Graduate Studies of Texas A&M University
in partial fulfillment of the requirements for the degree of
DOCTOR OF PHILOSOPHY
Approved by:
Co-Chairs of Committee, David Trejo Mary Beth D. Hueste Committee Members, Paolo Gardoni Kenneth F. Reinschmidt Daren B.H. Cline Head of Department, David V. Rosowsky
May 2009
Major Subject: Civil Engineering
iii
ABSTRACT
Electrochemical Characterization and Time-Variant Structural Reliability Assessment of
Post-Tensioned, Segmental Concrete Bridges. (May 2009)
Radhakrishna Pillai Gopalakrishnan, B.E., University of Allahabad, India;
M.S., Texas A&M University
Co-Chairs of Committee, Dr. David Trejo Dr. Mary Beth D. Hueste
In post-tensioned (PT) bridges, prestressing steel tendons are the major load carrying
components. These tendons consist of strands, ducts, and cementitious grout that fill the
interstitial space between the strands and ducts. However, inspections on PT bridges
have reported the presence of voids, moisture, and chlorides inside grouted ducts as the
major cause of accelerated corrosion of strands. Corrosion of the strands has resulted in
PT bridge failures in Europe and tendon failures in the United States. As most of the PT
bridges have high importance measures and the consequences of failure are significant, it
is important to maintain high levels of safety and serviceability for these bridges. To
meet this goal, bridge management authorities are in dire need of tools to quantify the
long-term performance of these bridges. Time-variant structural reliability models can
be useful tools to quantify the long-term performance of PT bridges.
This doctoral dissertation presents the following results obtained from a
comprehensive experimental and analytical program on the performance of PT bridges.
Electrochemical characteristics of PT systems
Probabilistic models for tension capacity of PT strands and wires exposed to various void and environmental conditions
Time-variant structural reliability models (based on bending moment and stress limit states) for PT bridges
iv
Time-variant strength and service reliabilities of a typical PT bridge experiencing HS20 and HL93 loading conditions and different exposure conditions for a period of 75 years
The experimental program included exposure of strand specimens to wet-dry and
continuous-atmospheric conditions. These strand specimens were fabricated to mimic
void and/or grout-air-strand (GAS) conditions inside the tendons. It was found that the
GAS interface plays a major role in strand corrosion. The GAS interfaces that are
typically located in the anchorage zones of harped PT girders or vertical PT columns can
cause aggressive strand corrosion. At these locations, if voids are present and the
environment is relatively dry, then limited corrosion of the strands occurs. However, if
the presence of high relative humidity or uncontaminated and chloride-contaminated
water exists at these interfaces, then corrosion activity can be high. The strands were
exposed for a period of 12, 16, and 21 months, after which the remaining tension
capacity was determined.
The analytical program included the development of probabilistic strand capacity
models (based on the experimental data) and the structural reliability models. The time-
variant tension capacity predicted using the developed probabilistic models were
reasonably consistent with the tendon failures observed in PT bridges in Florida and
Virginia. The strength reliability model was developed based on the moment capacity
and demand at midspan. Service reliability model was developed based on the allowable
and applied stresses at midspan. Using these models, the time-variant strength and
service reliabilities of a typical PT bridge were determined based on a set of pre-defined
constant and random parameters representing void, material, exposure, prestress,
structural loading, and other conditions. The strength and service reliabilities of PT
bridges exposed to aggressive environmental conditions can drop below the
recommended values at relatively young ages. In addition, under similar conditions the
service reliability drops at a faster rate than the strength reliability.
viii
TABLE OF CONTENTS
Page
ABSTRACT ..................................................................................................................... iii
DEDICATION ................................................................................................................... v
ACKNOWLEDGMENTS ................................................................................................ vi
TABLE OF CONTENTS ............................................................................................... viii
LIST OF FIGURES .......................................................................................................... xv
LIST OF TABLES ....................................................................................................... xxiii
1. INTRODUCTION ........................................................................................................ 1
1.1. Prestressed Concrete Technology ....................................................................... 1 1.2. Definitions ........................................................................................................... 2 1.3. Classification of Post-Tensioned Systems .......................................................... 2
1.3.1. Internal post-tensioned systems .............................................................. 3 1.3.2. External post-tensioned systems ............................................................. 4
1.4. Research Motivation ........................................................................................... 5 1.5. Research Objectives ............................................................................................ 7 1.6. Research Assumptions ........................................................................................ 7 1.7. Research Methodology ........................................................................................ 9 1.8. Organization of Dissertation ............................................................................. 10
2. LITERATURE REVIEW ........................................................................................... 13
2.1. Introduction ....................................................................................................... 13 2.2. Deterioration of Post-Tensioned Bridges .......................................................... 13
2.2.1. Failures of internal, grouted, post-tensioned systems ........................... 13 2.2.2. Failures of external, grouted post-tensioned systems ............................ 15
2.3. Parameters Influencing Corrosion of Post-Tensioned Systems ........................ 22 2.3.1. Dissimilar metallic materials in post-tensioned systems ....................... 22 2.3.2. Grout class ............................................................................................. 24 2.3.3. Voids ..................................................................................................... 25
ix
Page
2.3.4. Oxygen concentration ........................................................................... 27 2.3.5. Cementitious pore-solution and pH ....................................................... 27 2.3.6. Carbon dioxide concentration ............................................................... 29 2.3.7. Moisture conditions and precipitation ................................................... 30 2.3.8. Time of wetness .................................................................................... 32 2.3.9. Relative humidity .................................................................................. 32 2.3.10. Chloride concentration .......................................................................... 34 2.3.11. Temperature .......................................................................................... 35 2.3.12. Axial stress ............................................................................................ 35 2.3.13. Other factors .......................................................................................... 36
2.4. Corrosion Evaluation Using Visual Inspection Tools ....................................... 37 2.5. Modeling Corrosion of Steel (Immersion Conditions) ..................................... 38 2.6. Modeling Corrosion of Steel (Continuous-Atmospheric Conditions) .............. 40
2.6.1. Atmospheric corrosion models based on environmental parameters, time functions, or both ....................................................... 40
2.6.2. Atmospheric corrosion models based on time functions only .............. 42 2.6.3. Developing and updating the power corrosion model .......................... 46
2.7. Structural Capacity of Post-Tensioned, Segmental Bridges ............................. 48 2.7.1. Parameters directly influencing structural behavior of PT girders........ 48 2.7.2. A history of design codes/practices for concrete bridges ...................... 52 2.7.3. Differences in the behavior of monolithic and segmental
post-tensioned beams ............................................................................ 53 2.7.4. Stress-strain relationship for unbonded tendons ................................... 53 2.7.5. Stress-strain relationship for concrete cross sections ............................ 54 2.7.6. In-service and allowable stresses in a cross section .............................. 56 2.7.7. Existing approaches to determine flexural capacity of prestressed
girders .................................................................................................... 58 2.8. Structural Demand on Post-Tensioned Bridges ................................................ 59
2.8.1. Dead load ............................................................................................... 59 2.8.2. Live and impact loads ........................................................................... 60
2.9. Structural Reliability of Post-Tensioned Bridges .............................................. 62 2.9.1. Modeling and assessment of structural reliability ................................. 62 2.9.2. Structural reliability of bridges with uncorroded strands ...................... 65 2.9.3. Target reliability index .......................................................................... 66
2.10. Typical Characteristics of Segmental Concrete Bridges in Texas .................... 69 2.10.1. Segmental concrete bridges in Texas .................................................... 69 2.10.2. San Antonio “Y” bridge ........................................................................ 70 2.10.3. Span and girder inventory in San Antonio “Y” bridge ......................... 73 2.10.4. Tendon inventory on San Antonio “Y” bridge ...................................... 77 2.10.5. Cross-sectional properties of girders in San Antonio “Y” bridge ......... 77
2.11. Summary ........................................................................................................... 79
x
Page
3. CURRENT NEEDS AND RESEARCH SIGNIFICANCE ....................................... 80
4. ENVIRONMENTAL CHARACTERIZATION MAPS OF TEXAS ........................ 83
4.1. Introduction ....................................................................................................... 83 4.2. Freeze-Day, Temperature, Relative Humidity, and Rain-Day maps ................ 84 4.3. Chloride Maps ................................................................................................... 86 4.4. Total Corrosion Risk Maps ............................................................................... 88 4.5. Summary ........................................................................................................... 91
5. ELECTROCHEMICAL AND TENSION CAPACITY BEHAVIOR OF WIRES AND STRANDS - EXPERIMENTAL PROGRAM .................................... 92
5.1. Introduction ....................................................................................................... 92 5.2. Materials Used in the Experimental Program ................................................... 93
5.2.1. Metallic reinforcement .......................................................................... 93 5.2.2. Mineral aggregates used in concrete ..................................................... 96 5.2.3. Cementitious materials .......................................................................... 98 5.2.4. Water ................................................................................................... 101 5.2.5. Chloride concentration in the exposure solutions and grouts ............. 102
5.3. Cyclic Polarization Tests ................................................................................. 103 5.3.1. Introduction and objectives ................................................................. 103 5.3.2. Experimental design and specimen layout .......................................... 104 5.3.3. Sample preparation and test procedures .............................................. 106
5.4. Galvanic Corrosion Tests ................................................................................ 108 5.4.1. Introduction and objectives ................................................................. 108 5.4.2. Experimental design and specimen layout - Modified ASTM
G109 tests ............................................................................................ 108 5.4.3. Casting, curing, and exposure procedures - Modified ASTM G109
tests ...................................................................................................... 111 5.4.4. Experimental design and specimen layout - Bearing plate tests ......... 112 5.4.5. Casting, curing, and exposure procedures – Bearing plate tests ......... 114 5.4.6. Corrosion evaluation procedures ......................................................... 116
5.5. Strand and Wire Corrosion Tests .................................................................... 116 5.5.1. Introduction and objectives ................................................................. 116 5.5.2. Experimental design and specimen layout .......................................... 117 5.5.3. Concrete reaction frames and stressing operations for stressed
strand specimens ................................................................................. 128 5.5.4. Casting, curing, and exposure procedures ........................................... 136 5.5.5. Corrosion evaluation procedures ......................................................... 142 5.5.6. Tension capacity determination or estimation procedures .................. 142
5.6. Summary ......................................................................................................... 147
xi
Page
6. ELECTROCHEMICAL AND TENSION CAPACITY BEHAVIOR OF WIRES AND STRANDS - RESULTS .................................................................... 148
6.1. Introduction ..................................................................................................... 148 6.2. Cyclic Polarization Test Results ..................................................................... 148 6.3. Galvanic Corrosion Test Results ..................................................................... 152
6.3.1. Modified ASTM G109 test results ...................................................... 152 6.3.2. Bearing plate test results ..................................................................... 155
6.4. Strand and Wire Corrosion Test Results ......................................................... 157 6.4.1. General visual observations ................................................................ 157 6.4.2. Estimating tension capacity from strand photographs ........................ 158 6.4.3. Tension capacities of strand and wire specimens ................................ 160
6.5. Critical Parameters Influencing Tension Capacity of PT Strands ................... 168 6.5.1. Statistical hypothesis tests ................................................................... 168 6.5.2. Effect of grout class ............................................................................. 169 6.5.3. Effect of moisture and chloride conditions ......................................... 169 6.5.4. Effect of stress conditions ................................................................... 173 6.5.5. Effect of void conditions ..................................................................... 174
6.6. Summary ......................................................................................................... 175
7. MODELING TENSION CAPACITY OF STRANDS EXPOSED TO WET-DRY (WD) CONDITIONS ............................................................................ 177
7.1. Introduction ..................................................................................................... 177 7.2. Statistical Procedures to Develop Probabilistic Models ................................. 177
7.2.1. Statistical diagnosis of experimental data ........................................... 177 7.2.2. Formulation of probabilistic capacity models ..................................... 178 7.2.3. Assessment or calibration of probabilistic capacity models ............... 179
7.3. Probabilistic Models for Tension Capacity of “As-Received” Strands .......... 184 7.4. Tension Capacity Models for Strands Under WD Exposure conditions -
Analytical Program ........................................................................................ 184 7.4.1. Parameters used in the models for wet-dry conditions ....................... 185 7.4.2. Analytical steps to develop capacity models for strands under
wet-dry (WD) conditions (Steps WD-1 through WD-5) ..................... 186 7.4.3. Assumptions for predicting strand capacity under wet-dry
conditions ............................................................................................ 192 7.5. Tension Capacity Models for Strands Under WD Exposure
conditions: Results .......................................................................................... 193 7.5.1. Step WD-1: Identifying groups of void types with statistically
dissimilar effects on tension capacity ................................................. 193 7.5.2. Step WD-2: Models for unstressed strands under WD exposure
conditions (using unstressed strand data only) .................................... 194
xii
Page
7.5.3. STEP WD-3: Models for stressed strands under WD exposure conditions (using stressed strand data only) ........................................ 208
7.5.4. STEP WD-4: Models for stressed strands under WD exposure conditions (using unstressed strand model and stressed strand data) ..................................................................................................... 221
7.5.5. STEP WD-5: Selection of the most appropriate set of models for WD conditions .................................................................................... 230
7.5.6. Summary of strand capacity models for wet-dry conditions ............... 232
8. RELATIONSHIPS BETWEEN THE TENSION CAPACITIES OF UNSTRESSED WIRES AND STRESSED STRANDS .......................................... 234
8.1. Introduction ..................................................................................................... 234 8.2. Relationships Between Tension Capacities of Stressed Strands and
Unstressed Wires – Analytical Program ......................................................... 234 8.2.1. Introduction and objectives ................................................................. 234 8.2.2. Parameters used in the probabilistic models for tension capacity ....... 235 8.2.3. Analytical steps to develop “unstressed wire-stressed strand”
capacity model (Steps WS-1 through WS-4) ...................................... 236 8.3. Relationships Between Tension Capacities of Stressed Strands and
Unstressed Wires - Results .............................................................................. 242 8.3.1. STEP WS-1: Develop models for wires exposed to solutions with
%sCl levels below and above critical chloride threshold .................. 242 8.3.2. STEP WS-2: Develop UW-US-SSWD, BIOV model .............................. 246 8.3.3. STEP WS-3: Develop UW-SSWD, BIOV Model .................................... 251 8.3.4. Step WS-4: Select the more suitable “wire-strand” relationship for
both WD and CA exposure conditions ................................................ 254 8.3.5. Summary of wire-strand relationships ................................................ 255
9. MODELING TENSION CAPACITY OF STRANDS EXPOSED TO CONTINUOUS-ATMOSPHERIC (CA) CONDITIONS ........................................ 256
9.1. Introduction ..................................................................................................... 256 9.2. Disclaimer ....................................................................................................... 256 9.3. Probabilistic Models for Tension Capacity of Strands – Analytical
Program ........................................................................................................... 257 9.3.1. Introduction and objectives ................................................................. 257 9.3.2. Parameters used in the probabilistic models for tension capacity ....... 258 9.3.3. Steps to develop tension capacity models for strands under CA
conditions (Steps CA-1 through CA-4) ............................................... 259 9.3.4. Assumptions for predicting strand capacity under CA conditions ...... 262
xiii
Page
9.4. Tension Capacity Models for Strands Under CA Exposure Conditions-Results ............................................................................................................. 263 9.4.1. Step CA-1: Develop probabilistic model for tension capacity of
strands under CA and NV conditions .................................................. 263 9.4.2. Step CA-2: Develop probabilistic models for unstressed wires
under CA and BIOV conditions .......................................................... 263 9.4.3. Step CA-3: Predict the capacity of stressed strands at 9 months ........ 268 9.4.4. Step CA-4: Develop the model for stressed strands under CA and
BIOV exposure conditions .................................................................. 270 9.4.5. Prediction of tension capacity of stressed strands under CA and
BIOV conditions ................................................................................. 270 9.5. Summary ......................................................................................................... 272
10. MODELING AND ASSESSMENT OF STRUCTURAL RELIABILITY OF SEGMENTAL BRIDGES ........................................................................................ 273
10.1. Introduction and Objective .............................................................................. 273 10.2. Framework to Determine Structural Reliability .............................................. 273 10.3. Modeling Strength Reliability ......................................................................... 275
10.3.1. Strength limit state function, probability of strength failure, and strength reliability index ..................................................................... 275
10.3.2. Probabilistic modeling of moment capacity of the girder at midspan ............................................................................................... 276
10.3.3. Probabilistic modeling of moment demand on the girder at midspan ............................................................................................... 290
10.4. Modeling Service Reliability .......................................................................... 291 10.4.1. Service limit state function, probability of service failure, and
service reliability index ....................................................................... 291 10.4.2. Probabilistic modeling of stress capacity of extreme fibers at
midspan ............................................................................................... 292 10.4.3. Probabilistic modeling of stress demand on extreme fibers at
midspan ............................................................................................... 293 10.5. Random Parameters in the Probabilistic Models ............................................ 296
10.5.1. Void and damage/opening conditions on post-tensioning systems ..... 296 10.5.2. Tension capacity of strands ................................................................. 297 10.5.3. Prestress loss of strands ....................................................................... 300 10.5.4. Compressive strength of concrete ....................................................... 301 10.5.5. Dead and live load parameters ............................................................ 301
10.6. Time-Variant Structural Reliability Assessment of Typical Post-Tensioned Bridge .................................................................................... 302 10.6.1. Geometrical and structural characteristics of typical
post-tensioned bridge .......................................................................... 302 10.6.2. Definitions of parameters for the reliability assessment ..................... 304
xiv
Page
10.6.3. Time-variant strength reliability index ................................................ 307 10.6.4. Time-variant service reliability index ................................................. 312
10.7. Summary ......................................................................................................... 317
11. CONCLUSIONS AND RECOMMENDATIONS ................................................... 318
11.1. Introduction ..................................................................................................... 318 11.2. Limitations and Assumptions .......................................................................... 318 11.3. Conclusions ..................................................................................................... 319
11.3.1. Corrosion risks at different geographic locations in Texas ................. 319 11.3.2. Cyclic polarization curves of prestressing steel .................................. 320 11.3.3. Galvanic corrosion testing of post-tensioned systems ........................ 320 11.3.4. Probabilistic tension capacity of strands and wires ............................. 321 11.3.5. Structural reliability of post-tensioned bridges ................................... 323
11.4. Recommendations for Future Research .......................................................... 325 11.5. Recommendations for Field Implementations ................................................ 327
REFERENCES ............................................................................................................... 328
APPENDIX A ALL TENSION CAPACITY DATA .................................................... 340
APPENDIX B STRUCTURAL DETAILING OF CONCRETE REACTION FRAMES .............................................................................................. 360
APPENDIX C TRIAL MODELS FOR THE TENSION CAPACITY OF WIRES UNDER CONTINUOUS-ATMOSPHERIC CONDITIONS ............... 364
APPENDIX D STRENGTH AND SERVICE RELIABILITY INDICES ................... 372
VITA………….. ............................................................................................................ 374
1
1. INTRODUCTION
1.1. PRESTRESSED CONCRETE TECHNOLOGY
In the late 1920s, Eugene Freyssinet, a French civil engineer, pioneered the prestressed
concrete technology. He patented prestressed concrete technology in 1928 and is
considered as the father of prestressed concrete (Emmanuel 1980). Although Freyssinet
pioneered prestressed concrete, Doehring patented prestressing methods as early as
1888. Freyssinet recognized that only high-strength prestressing wire could counteract
the effects of creep, develop anchorage, and improve other load-carrying attributes,
which helped in the widespread use of prestressed concrete technology in many
structural systems including long-span segmental bridges. Two types of stressing
technologies are commonly used. These include: 1) pre-tensioning, where the stress is
applied before the concrete hardens and 2) post-tensioning, where the stress is applied
after the concrete hardens. This document focuses on the electrochemical
characterization and probabilistic capacity modeling of post-tensioning strands and
structural reliability of grouted, post-tensioned (PT), segmental concrete bridges
(denoted as “PT bridges” herein).
In the 1950s, Europeans started the construction of long-span PT bridges. About
a decade later, the United States (US) also began constructing similar PT bridges. Later,
grouted post-tensioned systems became economically viable and popular for long-span
PT bridge construction (NCHRP 1998). The definitions of some important
terminologies used in this document are provided next.
_____________________ This dissertation follows the format of the ASCE Journal of Engineering Mechanics.
2
1.2. DEFINITIONS
Various components of grouted PT systems include wires, strands, ducts, and tendons.
In this document, they are defined as follows:
Wire (or PT Wires) – Single wire with 0.2 inch (5 mm) diameter and made of high strength steel meeting ASTM A416 specifications.
Strand (or PT Strands) – Seven helically coiled wires (six outer wires helically coiled around one center wire) with a nominal diameter of 0.6 inches (15.24 mm).
Ducts (or PT Ducts) – Metallic or high-density polyethylene (HDPE) pipe in which several strands are placed and then the interstitial spaces are filled with cementitious grouts.
Tendons (or PT Tendons) – The system containing a group of several strands (structural load-carrying elements) and the cementitious grout and ducts (non-structural, corrosion-protection elements).
Grout – The cementitious grout placed around the strands and inside the ducts in a tendon system.
Void – The air space inside a PT duct system formed due to the absence of grout.
1.3. CLASSIFICATION OF POST-TENSIONED SYSTEMS
Based on the location of the tendons, grouted PT systems are classified into two types,
namely internal and external PT systems. A tendon that is placed outside the concrete is
defined as an external tendon. A tendon that is placed inside the concrete is defined as
an internal tendon. In general, PT bridges may have either or both of these tendon
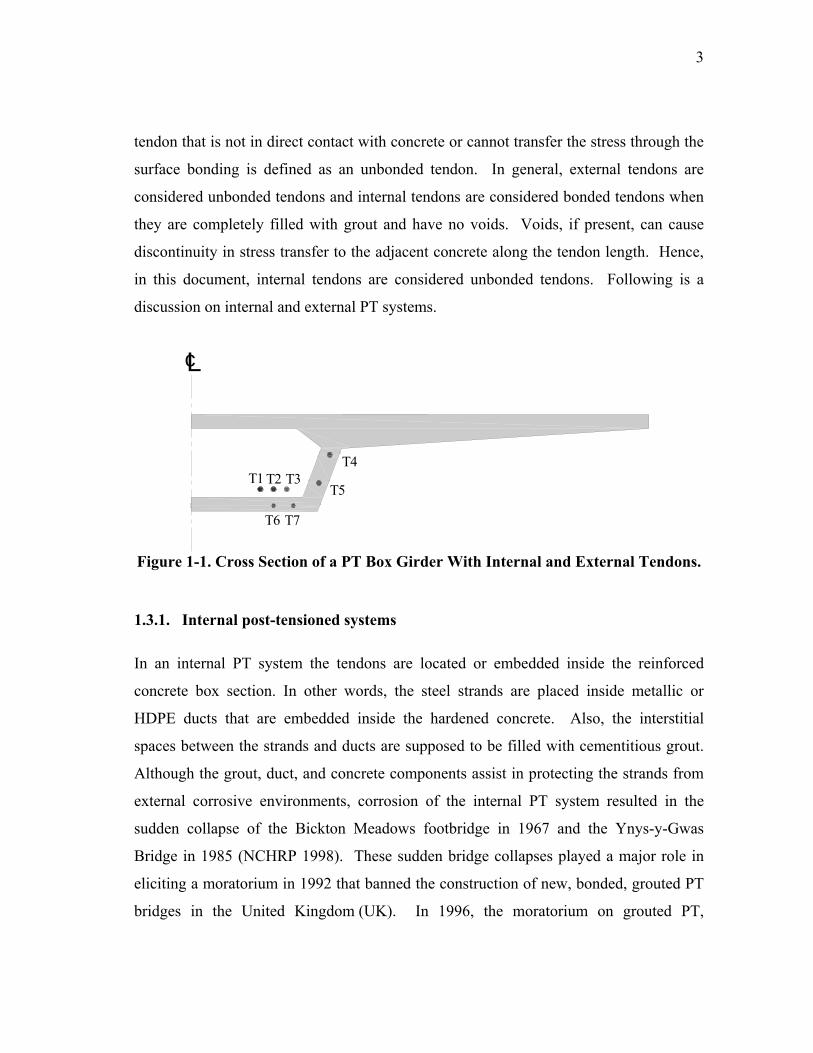
systems. Figure 1-1 shows a schematic of a cross section at midspan of a typical PT
bridge girder. In this figure the T1 through T3 tendons are external and the T4 through
T9 tendons are internal.
Tendons are also classified as bonded and unbonded tendons. A tendon that is in
direct contact or bonded to the adjacent concrete is defined as a bonded tendon. A
3
tendon that is not in direct contact with concrete or cannot transfer the stress through the
surface bonding is defined as an unbonded tendon. In general, external tendons are
considered unbonded tendons and internal tendons are considered bonded tendons when
they are completely filled with grout and have no voids. Voids, if present, can cause
discontinuity in stress transfer to the adjacent concrete along the tendon length. Hence,
in this document, internal tendons are considered unbonded tendons. Following is a
discussion on internal and external PT systems.
Figure 1-1. Cross Section of a PT Box Girder With Internal and External Tendons.
1.3.1. Internal post-tensioned systems
In an internal PT system the tendons are located or embedded inside the reinforced
concrete box section. In other words, the steel strands are placed inside metallic or
HDPE ducts that are embedded inside the hardened concrete. Also, the interstitial
spaces between the strands and ducts are supposed to be filled with cementitious grout.
Although the grout, duct, and concrete components assist in protecting the strands from
external corrosive environments, corrosion of the internal PT system resulted in the
sudden collapse of the Bickton Meadows footbridge in 1967 and the Ynys-y-Gwas
Bridge in 1985 (NCHRP 1998). These sudden bridge collapses played a major role in
eliciting a moratorium in 1992 that banned the construction of new, bonded, grouted PT
bridges in the United Kingdom (UK). In 1996, the moratorium on grouted PT,
T1
T6 T7
cL
T4
T5T3T2
4
cast-in-place bridge construction in the UK was removed. However, because of
concerns with the corrosion protection of internal tendons at the joints between the
precast segments, the moratorium on grouted PT, precast, segmental bridge construction
in the UK remains in place even today.
In the recently constructed bridges in the US, this potential problem of internal
tendon corrosion at box-girder or segment joints has been minimized by replacing the
older practice of constructing with dry-joints with epoxy resin-joints. Contrary to the
experience in the UK, the internal PT systems in US bridges have been reported as
performing ‘good’ (NCHRP 1998). Based on the tendon failure cases in US bridges, the
internal PT system seems to be less vulnerable to corrosion than the external PT strands.
1.3.2. External post-tensioned systems
In an external PT system, the tendons are located inside the interior void space (typically
rectangular or trapezoidal in cross section) of the concrete box girder and not embedded
in the hardened concrete. The external tendons are connected to the concrete box at
anchorage zones and deviator blocks. The deviator blocks are used only to control
tendon profile. The steel strands are placed inside HDPE ducts and the interstitial space
between the strands and the HDPE ducts is filled with cementitious grout. Because the
tendons are not embedded inside the hardened concrete section, the monitoring, repair,
and maintenance of external PT systems are not as complex as those for internal PT
systems. However, because of the absence of concrete cover protection and the possible
presence of unwanted air-voids, external tendons can be more vulnerable to corrosion
than internal tendons within the same bridge segment. Tendon failures have been
reported on the Mid-Bay, Niles Channel, Sunshine Skyway, and 17 other PT bridges in
Florida (FDOT 1999, FDOT 2001a, FDOT 2001b, NCHRP 1998) and the VarinaEnon
PT bridge in Virginia (Hansen 2007). The literature cites the presence of voids and
exposure to corrosive environments as major causes for these tendon failures. It should
5
be noted that these external PT system failures were observed in bridges at relatively
young ages (i.e., between 8 and 17 years after construction).
1.4. RESEARCH MOTIVATION
Although grouted PT systems gained acceptance and popularity due to good economy,
better aesthetics, faster construction and other positive aspects, the PT segmental bridge
industry witnessed corrosion related failures of grouted PT systems at relatively young
ages. This raises questions on the long-term performance of these infrastructure
systems. According to NCHRP (1998), “…there is a pressing need for US bridge
engineers to gain an understanding of durability issues associated with segmental
construction and to be able to judge on a technical and rational basis the veracity of the
on-going moratorium in the UK pertaining to segmental construction…”. Moreover,
various studies on the tendon failure cases and recent inspections conducted by various
federal and state transportation agencies reported the presence of air-voids (voids herein)
in the grouted tendons as one of the causes for strand corrosion (ASBI 2000, FDOT
1999, FDOT 2001a, FDOT 2001b, Hansen 2007, NCHRP 1998).
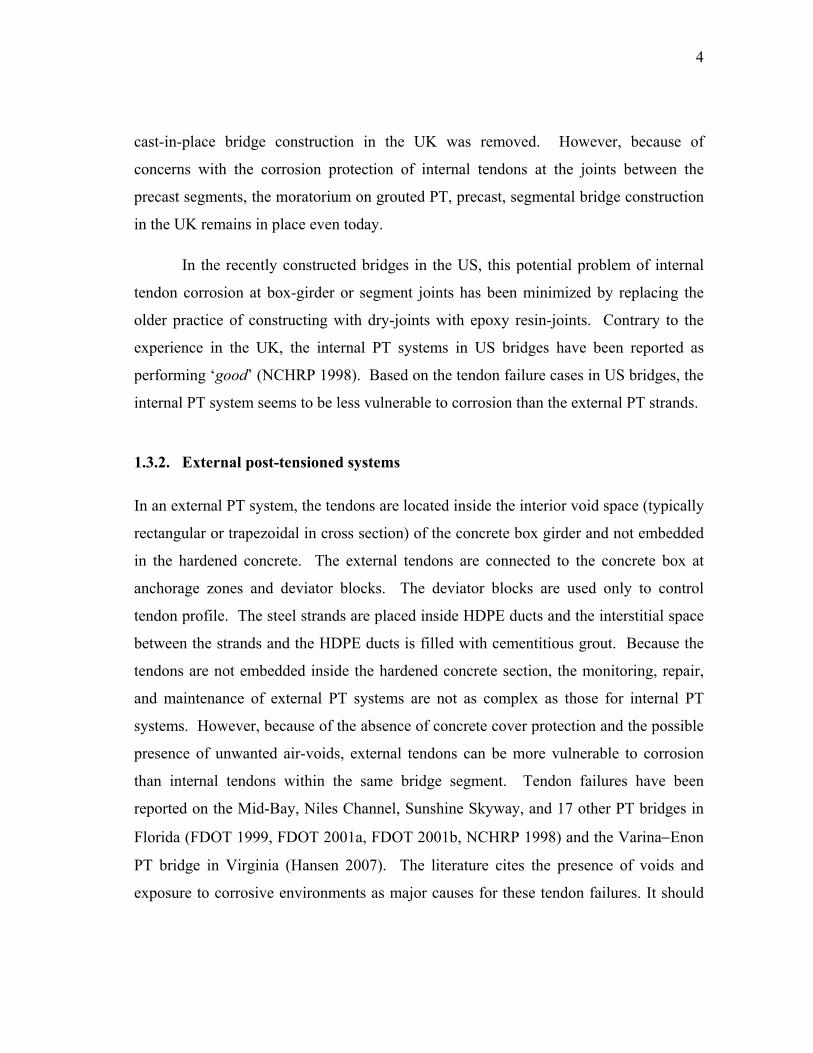
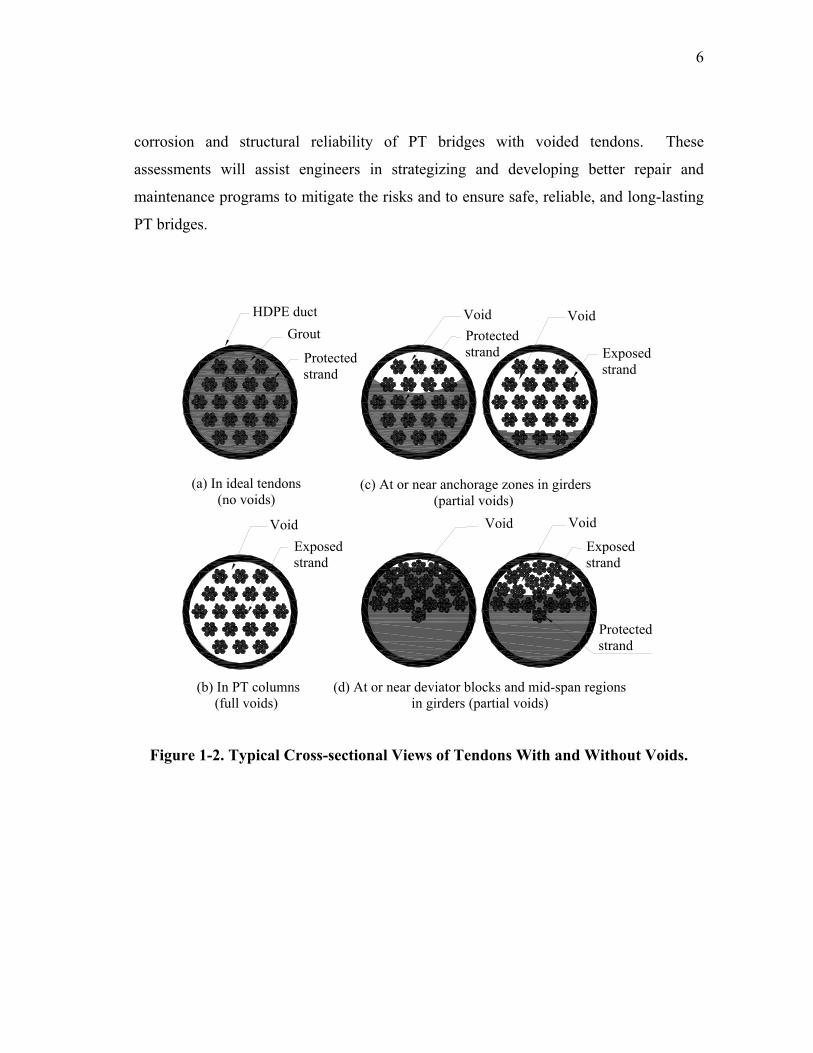
Figure 1-2 shows cross-sectional views of tendons with and without voids.
Bleed-water evaporation, poor grouting, poor construction practices, or a combination of
these are possible reasons for this unwanted void formation inside the tendons (FDOT
1999, FDOT 2001a, FDOT 2001b, NCHRP 1998, Schupack 2004). The strands in the
voids with corrosive conditions, such as rainwater, seawater, salt-fog, de-icing /anti-
icing salts, or a combination of these, can result in a higher probability of corrosion,
especially localized corrosion, resulting in a reduction in tension capacity (CT). The
reduction in CT of these strands can adversely affect the structural capacity and
reliability of PT bridges. According to Poston et al. (2003), “…depending upon the
initial prestress in the tendon, a reduction in strength to 75 percent of the original
minimum specified reduces the live-load capacity by 50 percent or more….” These
studies and field observations indicate that there is a dire need to assess the long-term
6
corrosion and structural reliability of PT bridges with voided tendons. These
assessments will assist engineers in strategizing and developing better repair and
maintenance programs to mitigate the risks and to ensure safe, reliable, and long-lasting
PT bridges.
Figure 1-2. Typical Cross-sectional Views of Tendons With and Without Voids.
Void
(d) At or near deviator blocks and mid-span regionsin girders (partial voids)
Void
(b) In PT columns(full voids)
Void Void
Void
(c) At or near anchorage zones in girders(partial voids)
Grout
Protectedstrand
HDPE duct
(a) In ideal tendons(no voids)
Exposedstrand
Exposedstrand
Protectedstrand
Exposedstrand
Protectedstrand

7
1.5. RESEARCH OBJECTIVES
The major objectives of this research are:
1. to develop environmental characterization maps of Texas to assist in assessing the corrosion risk level of a PT bridge based on its geographic location [results presented in Section 4].
2. to investigate the electrochemical corrosion characteristics of the steel meeting the ASTM A416 specifications when exposed to cementitious material environments with and without chloride contamination [results are presented in Section 6].
3. to test whether galvanic corrosion occurs between the conventional reinforcement and strands and bearing plates at the anchorage zones; and if so, to assess the increased level of corrosion activity [results are presented in Section 6].
4. to identify critical material, environmental, void, and stress parameters that influence corrosion and CT of strands in PT bridges [results are presented in Section 6].
5. to develop probabilistic models for CT of strands exposed to various material, environmental, void, and stress conditions [results are presented in Section 7, 8, and 9].
6. to develop a time-variant structural reliability model for typical PT bridges and then assess the structural reliability of a typical PT bridge [results are presented in Section 10].
1.6. RESEARCH ASSUMPTIONS
To attain the research objectives, the following research hypotheses and assumptions
have been made:
The CT of PT wires and strands is reduced when exposed to high moisture, temperature, and chloride conditions. The CT is further reduced as a function of time.
Environmental conditions at the strand interface can be determined.
8
The reduced CT of corroding PT wires and strands can be probabilistically modeled with reasonable levels of accuracy.
No theoretical model could be developed or found in the literature for the time-dependent corrosion of strands exposed to wet-dry (WD), continuous-atmospheric (CA), or both these conditions. Hence, all the models developed in this document are empirical in nature.
There exists a relationship between wire and strand corrosion processes, when exposed to similar WD or CA conditions.
The long-term corrosion of strands under field conditions can be modeled using the experimental data from shorter-term wire corrosion tests under controlled laboratory conditions.
The stressed strands (i.e., strands experiencing in-service stress conditions) may exhibit more reduction in CT than the unstressed strands.
Because most tendons in the field were found to have voids, all the internal and external tendons are assumed to be unbonded tendons while determining moment capacity (CM) of the girder.
Only external tendons are assumed to exhibit corrosion-induced loss in CT. Internal tendons are relatively well-protected from the external environment and free of active corrosion.
Among the external tendons, the rate of corrosion of strands exposed to No Void (NV) and CA conditions is negligible. In addition, it is highly unlikely that there will be a Parallel Void (PV) and not a Bleedwater, Inclined, or Orthogonal Void (BIOV) condition (see detail definitions and schematics in Subsection 5.5.2.1) inside a tendon.
The CM and stresses at extreme fibers at midspan of a PT bridge girder can be modeled using probabilistic models for CT of strands, statistical expressions for compressive strength of concrete, prestress losses in strands, void and damage conditions of PT systems, and principles of structural mechanics.
Moment demand at midspan can be modeled using statistical expressions for the dead loads and live and impact loads due to HS20 and HL93 loading conditions.
9
Time-variant structural reliability can be assessed based on strength and service limit states.
Time-variant strength reliability (i.e., based on ultimate bending moment) can be modeled and assessed using CM and moment demand (DM) models of PT bridge girders.
Time-variant service reliability (i.e., based on in-service stresses on extreme fibers) can be modeled and assessed using the allowable and applied in-service stresses (i.e., stress capacity and demand, respectively) of PT bridge girders.
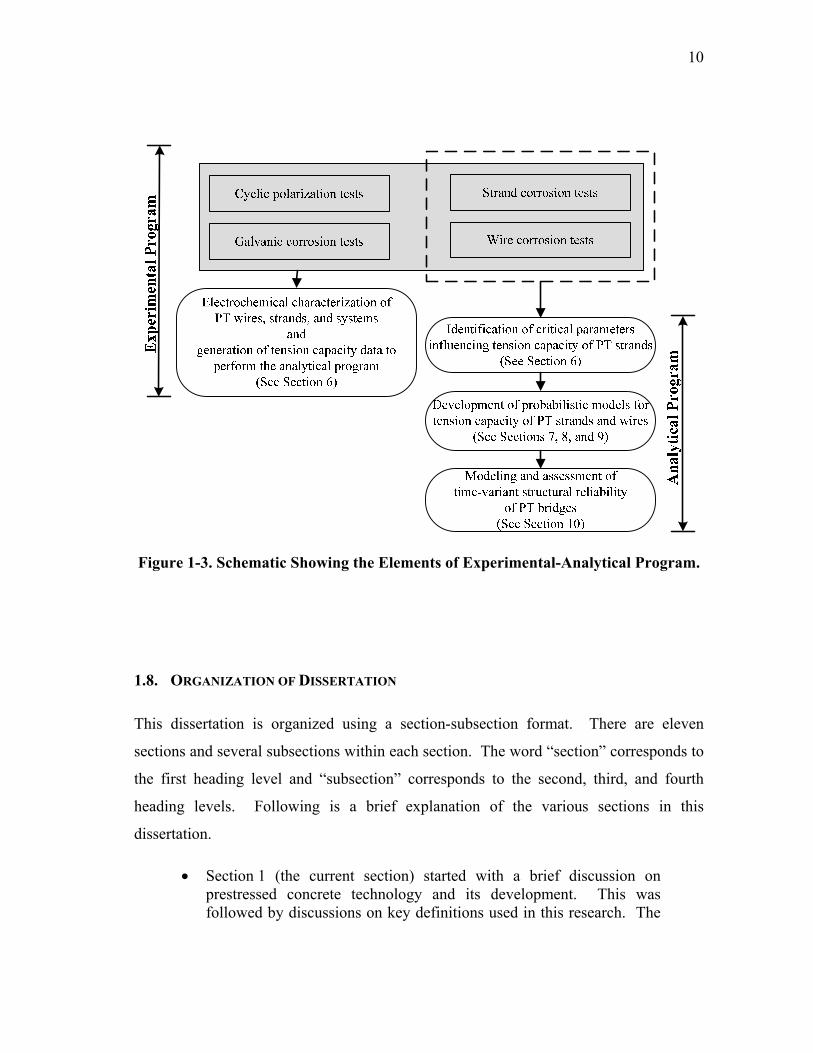
1.7. RESEARCH METHODOLOGY
A coupled experimental-analytical research methodology has been developed to attain
the research objectives listed in Section 1.5. A schematic showing experimental and
analytical programs of this research is provided in Figure 1-3.
The experimental program includes electrochemical characterization of PT
strands and systems. This is performed using the results from electrochemical testing:
cyclic polarization tests, galvanic corrosion tests, strand corrosion tests, and wire
corrosion tests. These electrochemical tests are shown in the shaded-box in Figure 1-3.
The analytical program include: 1) the development of probabilistic models for
time-variant CT of PT strands and 2) the modeling and assessment of time-variant
structural reliability of PT bridges. The results from the strand and wire corrosion tests
will be used to perform this analytical program, as indicated by the dashed-box in Figure
1-3.
10
Figure 1-3. Schematic Showing the Elements of Experimental-Analytical Program.
1.8. ORGANIZATION OF DISSERTATION
This dissertation is organized using a section-subsection format. There are eleven
sections and several subsections within each section. The word “section” corresponds to
the first heading level and “subsection” corresponds to the second, third, and fourth
heading levels. Following is a brief explanation of the various sections in this
dissertation.
Section 1 (the current section) started with a brief discussion on prestressed concrete technology and its development. This was followed by discussions on key definitions used in this research. The
11
research motivation and objectives were then presented. Following this, the assumptions and methodology of this research were provided.
Section 2 provides a comprehensive review of literature. This section starts with a review of some case histories of failure of PT systems. A review of parameters influencing and modeling of electrochemical process is then provided. Following this, modeling the CM, in-service stresses, and load demands on bridge is reviewed. Then modeling and assessment of structural reliability is reviewed. Towards the end of the section 2, typical characteristics of segmental bridges in Texas are discussed.
Section 3 presents the current research needs and the significance of this research.
Section 4 presents the environmental characterization maps and corrosion risks of various geographic locations in Texas.
Section 5 provides details of the experimental program. Details of all the materials used in the experimental program are provided first. The experimental design and test layout and other details of cyclic polarization, galvanic corrosion, and strand and wire corrosion test programs are then provided.
Section 6 presents the experimental results from the cyclic polarization test, galvanic corrosion tests, and strand and wire corrosion tests. Also, critical parameters influencing CT of strands are identified in this section.
Section 7 presents the probabilistic models for the CT of strands under WD exposure conditions. This section also presents the statistical procedures used to develop probabilistic models for CT of strands.
Section 8 presents the probabilistic models relating the CT of the strands and wires under WD exposure conditions.
Section 9 presents the probabilistic models for the CT of strands under WD and CA exposure conditions.
Section 10 presents the development of strength and service reliability models of PT bridges. As an application of these models, this section also presents the time-variant structural reliability of a typical PT bridge at various exposure conditions.
12
Section 11 presents conclusions from this research. Recommendations for future research initiatives and field implementation are also presented in this section.
80
3. CURRENT NEEDS AND RESEARCH SIGNIFICANCE
Bridge inspections have reported the presence of voids, moisture, and chlorides inside
grouted PT ducts as being the major cause of accelerated corrosion of strands. This
corrosion results in the reduction of tension capacity and can eventually lead to tensile
failure of PT strands (NCHRP 1998, ASBI 2000, FDOT 2001a and b, and Hansen 2007).
The reduction in tension capacity or tensile failure of PT strands can in turn significantly
and adversely affect the safety and serviceability of PT bridges. As these bridges have
high importance measures and the consequences of failures are significant, it is
important to maintain high levels of safety and serviceability for these PT bridges.
According to NCHRP (1998), “…there is a pressing need for US bridge engineers to
gain an understanding of durability issues associated with segmental construction and to
be able to judge on a technical and rational basis the veracity of the on-going
moratorium in the UK pertaining to segmental construction…” To meet this pressing
need and to ensure high levels of safety and serviceability, bridge management
authorities are in dire need of tools to quantify the long-term performance of these
bridges.
The presence of voids, damages, and openings on PT ducts and anchorages in
combination with exposure to severe environmental conditions can result in corrosion of
PT strands. This time-variant process can in turn cause reduction in the strength and
service reliability indices over time. Therefore, strength and service reliability indices
can be considered as quantified measures or indicators for the safety and serviceability,
respectively, of PT bridges. The time-variant strength reliability index can be modeled
and estimated by using structural reliability techniques and moment capacity and
demand models for PT bridges. The time-variant service reliability index can be
modeled and estimated by using structural reliability techniques and in-service stress
capacity and demand models for PT bridges. The estimated reliability indices at future
81
times can be then compared with corresponding target reliability indices. This
comparison will help in making decisions on the degree of inspection, repair, and
maintenance required. In summary, time-variant structural reliability models can be
useful tools to quantify the long-term performance of PT bridges. Probabilistic models
for tension capacity of PT strands are necessary to develop time-variant structural
reliability models. Experimental data on electrochemical and tension capacity behavior
of PT strands are necessary to develop these probabilistic models for tension capacity of
PT strands. Unfortunately, the current literature does not provide sufficient information
on the electrochemical and tension capacity behavior of PT strands. Furthermore,
knowledge of the electrochemical characteristics of ASTM A416 steel when immersed
in various cementitious pore solutions and the potential for galvanic corrosion in these
systems could assist engineers in developing non-destructive tools for the inspection of
corrosion in PT bridges. However, such information is not sufficiently addressed in the
literature.
A coupled experimental and analytical program was developed and conducted to
fill these knowledge gaps and answer the following questions:
Can environmental characterization maps be generated to assess corrosion risks in Texas?
Can information be generated to non-destructively inspect or detect electrochemical corrosion of strands in PT systems?
What are the critical void, material, environmental, and other factors that can significantly influence the corrosion activity of embedded strands?
Does this corrosion significantly influence the tension capacity of strands over time? If so, how can the probabilistic tension capacity of strands be modeled and assessed?
Does the corrosion-induced loss in tension capacity of strands affect the strength and serviceability of PT bridges? If so, how can the strength and service reliabilities of PT bridges be modeled and assessed?
82
This research will attempt to answer these questions to assist bridge owners in
ensuring safe and reliable PT bridges for long durations. The experimental part of this
research includes electrochemical and tension capacity testing of PT strands exposed to
various exposure conditions. The analytical part of this research includes modeling and
assessing the probabilistic tension capacity of PT strands and modeling and assessing the
structural reliability of PT bridges. Both strength and service reliability are modeled as a
function of time and other influencing parameters for a typical PT bridge. These
reliability models are then used to assess time-variant strength and service reliability of a
PT bridge subjected to HS20 and HL93 loading conditions. It is important to note that
these models can assess the structural reliability based on climatic conditions and the
data on void and damage conditions of bridges while minimizing expensive and
non-routine bridge inspections. It should also be noted that the objective of this research
is to develop general reliability models for PT bridges. Further development of the
model will be needed for assessing the reliability of specific PT bridges in Texas. Based
on long-term structural reliability assessments, inspection, repair, and maintenance
programs can be optimized and funds can be appropriately allocated to meet public
needs, while ensuring safe PT bridges.
318
11. CONCLUSIONS AND RECOMMENDATIONS
11.1. INTRODUCTION
This section provides conclusions drawn from a research project on the effects of void,
environmental, and other exposure conditions on the long-term performance of
post-tensioned (PT) bridges. Initially, environmental characterization maps of Texas
were developed. The electrochemical and tension capacity (CT) behavior of PT systems
were then experimentally investigated. Based on these experimental results and
engineering judgment and assumptions, probabilistic models to determine CT of strands
were then developed. Following this, time-variant structural reliability models were
developed. Using these reliability models, the strength and service reliabilities of a
typical PT bridge for a period of 75 years were assessed.
11.2. LIMITATIONS AND ASSUMPTIONS
Limitations and assumptions associated with the results obtained from this research
include:
Sufficient field data on wet-dry (WD) conditions inside the tendons were not obtained to more accurately calibrate the probabilistic models for CT of strands exposed to WD exposure conditions.
Sufficient field data on the amount of strand corrosion under continuous-atmospheric (CA) conditions could not be obtained to more accurately calibrate the probabilistic models for CT of strands exposed to CA exposure conditions.
Engineering judgment and assumptions were made to calibrate the probabilistic models to potential field conditions.
Probabilistic models for the CT of strands were used in the structural reliability analysis. Hence, the limitations of the probabilistic models for the CT of strands are also applicable to the structural reliability assessment.
319
All internal tendons were assumed to be intact and free from corrosion.
Structural reliability models developed in this research consider only a simply supported condition.
Structural reliability models developed here consider only uniaxial bending mechanisms. These models do not consider biaxial bending, shear, torsion, or other structural mechanisms, which can influence the system reliability of PT bridges.
Although limitations exist, some valuable conclusions are drawn from this
research and are presented next.
11.3. CONCLUSIONS
11.3.1. Corrosion risks at different geographic locations in Texas
Section 4 presented maps showing freeze-days, temperature, relative humidity, and
rain-days in Texas. These maps were developed using Geographic Information Systems
(GIS) technology and the data collected from the internet and Texas Department of
Transportation district engineers. The conclusions drawn from these maps are:
The majority of Texas has a moderate level of corrosion risk and some areas have a high level of corrosion risk.
Coastal regions have the most critical conditions due to consistent exposure to chloride-contaminated environments.
These general maps should be used only for initial screening purposes. Corrosion risk of a specific PT bridge should be assessed based on additional relevant information (such as the presence of voids, damage, moisture, chlorides, etc. inside the tendons).
320
11.3.2. Cyclic polarization curves of prestressing steel
Subsections 5.3 and 6.2 presented the cyclic polarization testing of the steel meeting
ASTM A416 specifications and the corresponding results, respectively. The conclusions
include the following:
The broken passive films on the steel surface are self-healed and a negative hysteresis is observed when exposed to 0.00 and 0.06 %sCl simulated concrete pore solution. The broken passive films are not repaired and a positive hysteresis is observed when exposed to 1.8 %sCl solution. Based on these observations, it can be concluded that the critical chloride threshold level for the steel meeting the ASTM A416 specifications is in between 0.06 and 1.8 %sCl.
11.3.3. Galvanic corrosion testing of post-tensioned systems
The galvanic corrosion test program and results are provided in Subsections 5.4 and 6.3,
respectively. The conclusions include the following:
The corrosion potentials of conventional reinforcement and prestressing strands are similar. It was determined from this testing that there was limited galvanic corrosion between conventional reinforcement and prestressing strands.
The presence of moisture can initiate galvanic corrosion between bearing plates and conventional reinforcement and bearing plates and strands in PT systems. Also, the presence of high amounts of chlorides can accelerate corrosion.
321
11.3.4. Probabilistic tension capacity of strands and wires
Section 5 presented the experimental program and results on strand and wire corrosion
tests. Sections 7, 8, and 9 presented the probabilistic models for tension capacity (CT) of
strands and wires. Subsection 5.5.2 presented the definitions and schematics of different
void conditions (i.e., NV, PV, OV, IV, BV, and BIOV). The conclusions derived from
these results are as follows:
The corrosion mechanisms for a PT system containing voids and one containing no voids are different and the presence of the voids has a more significant effect on the corrosion rate than the grout material characteristics, such as chemical composition and water-cementitious materials ratio.
The moisture level has a statistically significant influence on the corrosion and CT of PT strands. The CT of strands exposed to high moisture levels can be up to 17 percent less than the CT of strands exposed to low moisture levels, provided other exposure conditions remain the same.
The chloride level has a statistically significant influence on the corrosion rate and CT of PT strands. The CT of strands exposed to high chloride levels can be up to 25 percent less than the CT of strands exposed to negligible chloride levels, provided other exposure conditions remain the same.
The in-service stress level has a statistically significant influence on the corrosion and CT of PT strands. The CT of stressed strands can be 1.6 to 17 percent less than the CT of unstressed strands, provided other exposure conditions remain same.
The type of void, especially the orientation of grout-air-strand (GAS) interface, has a statistically significant influence on the corrosion rate and resulting reduction in the tension capacity of strands. Typically, more localized corrosion will occur at strands in PT columns and anchorage zones on PT girders than at strands near the midspan region of PT girders.
In fully grouted tendons (i.e., NV conditions), moisture and chlorides are the most influential factors in accelerating corrosion and reducing the CT of the exposed strands. Hence, as long as the fully grouted
322
tendons are protected from chloride and moisture ingress, the corrosion rate and capacity loss should be negligible. However, this protection is very difficult to accomplish as cracks were found in both Class A and Class C grouts prepared in the laboratory. This is likely to be the case in the field also. In addition, cracks or openings were found on PT ducts and anchorages in the field.
BV, IV, and OV conditions have statistically similar effect on the CT of strands. Because of the larger cathode-to-anode ratio and a smaller cathode-anode contact region, PV conditions facilitate a less corrosive environment than the BIOV condition, provided other exposure conditions remain similar.
In general, the corrosivity of NV conditions is less than that of PV conditions and the corrosivity of PV conditions is less than that of BIOV conditions.
In voided tendons, the presence of moisture or standing water is a critical factor in accelerating corrosion and reducing the CT of the exposed strands. Hence, moisture should be prevented from infiltrating the ducts.
When continuous-atmospheric (CA) and BIOV conditions exist, combinations of high relative humidity and temperature or the combinations of high relative humidity, temperature, and chlorides can cause severe corrosion in relatively short periods of time. When relative humidity and temperature are both low, the corrosion rates were found to be lower.
When exposed to similar conditions, a seven-wire strand can lose more CT than the sum of CT lost by seven individual wires or a solid wire with seven times more area. A power relationship between the CT of strands and wires exhibits better accuracy than a linear relationship.
323
11.3.5. Structural reliability of post-tensioned bridges
Section 10 developed the structural reliability models for PT bridges. The time-variant
strength and service reliabilities of a typical PT bridge were then assessed using the
developed reliability models. The WD condition that is assumed for the analysis
consisted of 2 months of wet time and 10 months of dry time in every year.
The conclusions derived from the study on strength reliability are:
Strength reliability models can be developed and can be used to predict the flexural strength reliability index, βstrength, of PT bridges at future times.
For the typical PT bridge (defined in Subsection 10.6.1) the βstrength based on the parameters defined in Subsection 10.6.2 is as follows:
When all the strands are in “as-received” conditions, βstrength is above the βtarget used for calibrating the AASHTO LRFD Specifications (2007) (i.e., 3.5) and recommended by ISO 13822 (2001) for the cases with low consequences of failure (i.e., 3.1).
If one tendon is exposed to WD cycles and completely corrodes or fails in tension due to high stress levels, the strength reliability model shows that the value of βstrength stays above 3.5.
If two tendons are exposed to WD cycles and compeletely corrode or fail in tension due to high stress levels, the value of βstrength drops below 3.5 but stays above 3.1.
When the bridge is subjected to HS20 loading and three or more external tendons are exposed to WD cycles with 0.006 percent chloride solution, the value of βstrength drops below 3.5 within 25 years and below 3.1 within 35 years. These time estimates reduce to about 10 and 13 years when exposed to WD cycles with 1.8 percent chloride solution.
324
The conclusions derived from the study on service reliability are:
Service reliability models can be developed and can be used to estimate the reliability index for maintaining the flexural stress limits for service load conditions, βservice, of PT bridges at future times.
For the typical PT bridge (defined in Subsection 10.6.1) the βservice based on the parameters defined in Subsection 10.6.2 is as follows:
When the defined PT bridge is subjected to HS20 loading and all the strands are in “as-received” condition, the reliability model shows that value of βservice is above 1.5 (i.e., the βtarget value recommended by ISO 13822 [2001] for the cases with irreversible consequence of failure).
When the defined PT bridge is subjected to HS20 or HL93 loading and all the strands are in “as-received” condition, the reliability models show that the βservice is between 0 and 1.5 (i.e., the βtarget values recommended by ISO 13822 (2001) for the cases with irreversible and reversible consequences of failure).
When the bridge is subjected to HS20 loading and only one tendon is exposed to WD cycles with 0.006, 0.018, or 1.8 percent chloride solutions, the reliability models show that βservice stays above 0 for more than 75 years.
When the bridge is subjected to HL93 loading and only one tendon is exposed to WD cycles with 0.006 percent chloride solution, βservice can drop to a value below 0 within about 25 years. This time estimate reduces to about 9 years when exposed to 1.8 percent chloride solution.
Serviceability reduces significantly if more than one tendon is exposed to WD cycles.

325
11.4. RECOMMENDATIONS FOR FUTURE RESEARCH
Recommendations for future research include the following:
Testing and evaluation of long-term performance of construction materials and systems under field conditions should be conducted.
Information should be gathered from the field to better understand the exposure conditions and corrosion levels on strands in PT systems.
Additional information on chloride exposure and chloride usage factors (such as the application rate of de-icing or anti-icing salts on bridges) in Texas should be collected and incorporated into the developed maps.
A larger number of specimens should be tested to increase the statistical significance of the test results obtained. Also, experiments should be performed using more combinations of test parameters.
Additional modified ASTM G109 and bearing plate tests should be performed with more parameter combinations to better evaluate this potential issue.
Additional experiments should be conducted on unstressed strands with more combinations of test variables. The models for stressed strands developed in this research may then be re-calibrated using this new information on the CT behavior of unstressed strands.
The effect of the interface between the existing and repair grouts on corrosion and resulting loss in the CT of strands should be investigated. The test specimens used in this research program could be modified to perform these tests.
Strand surfaces inside the voided anchorages are inaccessible. This makes it difficult to estimate the level of corrosion at these void locations and sufficient data on corrosion of strands in the field are not available. Special remote-controlled tools that can clean and collect the corrosion products at these strand surfaces need to be developed. Such tools can then be used to collect data on corrosion of strands in the field, especially under CA exposure conditions. These data could then be used in estimating the long-term performance of PT bridges.
326
The following modifications should be incorporated into the structural reliability models developed in this research:
Develop probabilistic models to evaluate the moment demand due to continuous support conditions;
Develop probabilistic models to predict CT of corroding strands in internal tendons;
Develop a model to more accurately assess the time-dependent prestress losses;
Develop models to assess reliability of girders with both bonded and unbonded tendons.
Develop a model to accommodate the effect of construction practices on structural behavior. These practices include sequential pre-stressing, type of construction technique (such as span-by-span, cantilever construction etc.), sequence in which the falsework is removed, and other influential factors.
Collect field information on actual loading conditions and develop corresponding structural demand models.
Develop structural reliability models based on shear, torsion, and other structural limit states.
Develop a system reliability model for PT bridges based on the above recommended models for additional limit states.
Assess the time-variant structural reliability of specific PT bridges in Texas.
Assess the time-variant structural reliability of different standard AASHTO pre-tensioned bridges.
327
11.5. RECOMMENDATIONS FOR FIELD IMPLEMENTATIONS
Recommendations for implementations in the field include the following:
Consider coating the inside and outside surfaces of bearing plates with epoxy or other dielectric material such that the galvanic corrosion between the bearing plate and other metallic materials in the PT systems can be minimized.
Inspect the PT strands and girders at regular intervals, especially when the importance measures of the bridge and the likelihood of the occurrence of WD conditions inside the tendons are high.
Prevent the infiltration of water and chlorides into PT systems and the formation of voids in PT systems during construction. Maintain dry conditions in the voids in tendons until the effects of grout repairs on strand corrosion can be assessed.