electrochemical impedance spectroscopy · pdf fileelectrochemical impedance spectroscopy...
TRANSCRIPT


ELECTROCHEMICAL IMPEDANCE SPECTROSCOPYMEASUREMENTS OF BARRIER COATINGS
Ken Holyoake, ARMATEC Environmental Ltd, andJiangnan Yuan, Materials Performance Technologies Ltd
SUMMARY
Polymer based coatings use barrier technology to protect substrates from corrosive chemicalsand environments, particularly when in immersion service. Barrier technology uses materialssuch as flake reinforcements and provides an almost impermeable barrier between thechemicals and the substrate. Water transport in the coating, which may carry oxygen andaggressive ions from the environment to the metal/coating interface, is a critical parameter inassessing the ability of a coating to protect a steel substrate from corrosion. ASTM E96 is themost widely used procedure for measuring the water vapour permeability of a coating system.
In this work, EIS (electrochemical impedance spectroscopy) has been used to investigate thewater absorption/transportation for a number of coatings including high performance barriercoatings used in immersion service. EIS spectra showed the pore resistance of the coatings,and the data was used to calculate the water absorption of the coatings as a function of testingtime. A good correlation was established between water vapour permeability and EISmeasurements for the coatings studied. It is concluded that EIS data will be useful in predictinglifetime expectancy of coatings used in immersion service.
Vinyl ester flakeglass coatings showed no detectable water absorption over the 12 days of thetest. This unique behaviour has not been seen in reported literature before. Thus the EIS testingdata is in line with the outstanding performance of vinyl ester flakeglass systems in immersionservice in actual installations.
The results in this investigation demonstrate that EIS techniques can provide quick, reliable,and reproducible measurements for water transport evaluation in coatings. This work showsthat EIS techniques are also applicable to thick barrier type coatings as well as the thinnercoatings studied by other researchers.
Keywords: EIS, electrochemical impedance spectroscopy, barrier coatings, vinyl esterflakeglass coatings, water absorption, corrosion.
1. INTRODUCTION
Polymer based coatings use barrier technology to protect substrates from corrosive chemicalsand environments, particularly when in immersion service. Due the harsh environments thistype of coatings is subject to, low permeability is critical for the barrier coatings to protect steelsubstrates from corrosion in immersion service [1]. The permeability of the coating determines
Page 2
the rate of transport of water, oxygen and other small molecules to the steel surface where theyparticipate in the slow corrosion process. The rate of transport in turn is a function of theimmersion temperature [1]. Hence, water permeability evaluation is particularly important inpractical coating applications and in new coating developments.
Water absorption can be measured by classical gravimetric [2] and capacitance [3] methods.The traditional gravimetric methods, such as ASTM E-96 standard, are time taking andincorporate measurement errors and reproducibility difficulties, while capacitance techniquesprovide quick, accurate, and reproducible measurements [4] of water uptake during immersiontests. However, the application of capacitance techniques for permeability assessment of barriertype polymer coatings can be rarely seen in the published literature.
Washburn et al [1] measured the water vapour permeability of several polymer materials usingthe ASTM E-96 standard, which subjects the coatings to a fixed difference in water vapourpressure from one side to the other. It was found that non-permeable fillers were effective inretarding the moisture intrusion. Platelet type fillers were found to be most effective, with theoverlapping flakes providing maximum effectiveness in restricting permeation of water and othersmall molecules through the coating.
Electrochemical impedance spectroscopy (EIS) is a powerful tool for studying coatingdegradation and corrosion of polymer coated metallic materials [5]. Through appropriatemodelling, EIS can provide some critical information on moisture intrusion, coating degradation,development of coating defects, coating delamination, and under film corrosion mechanisms [5,6]. This paper reports results of an investigation of the water permeation of various coatingsystems including barrier coatings using EIS techniques. The effects of coating thickness andfiller contents in the coatings were also studied. In comparison with data obtained by ASTM E-96 standard tests, the applicability of EIS technique for coating permeability assessment isdiscussed.
2. EXPERIMENTAL
Coating samples were prepared on 150 ¥ 150 mm steel panels of 4 mm thick. The steelsurfaces were prepared by abrasive blasting with steel grit to achieve a minimum surface profileof 75 mm, and the coatings were applied according to their standard data sheets. The coatingswere applied and allowed to cure at ambient temperature in the range 15°C to 20°C. Coatingstested are listed in Table 1.
The EIS measuring system employed in this investigation consisted of a PARC EG&G 273potentiostat and a Solartron SI 1255 frequency response analyser. The impedance spectrawere obtained using PARC M398 EIS software. A section of a plastic tube (f100 ¥ 100 mm)was glued on each coated sample to form an electrochemical cell with the steel substrate as theworking electrode, a Ag/AgCl electrode as the reference electrode, and a platinum mesh as thecounter electrode. Each cell was filled with 300 ml of 0.6 M NaCl solution prepared withanalytical reagent and distilled water. All the measurements were performed at an ambienttemperature of 22 ± 2°C.

Page 3
Table 1. Coatings tested.
Label Coating Type & Description Thickness, mm1A Vinyl ester trowel applied: 0% Flakeglass 1.701B Vinyl ester trowel applied: 15% Flakeglass 2.351C Vinyl ester trowel applied: 25% Flakeglass 2.401D Vinyl ester trowel applied: 35% Flakeglass 2.602A Vinyl ester flakeglass trowel applied: 1 Coat 1.252B Vinyl ester flakeglass trowel applied: 2 Coats 2.602C Vinyl ester flakeglass trowel applied: 3 Coats 3.502D Vinyl ester flakeglass trowel applied: 4 Coats 4.003A Vinyl ester flakeglass trowel applied: Standard 3.004A Vinyl ester flake filled brush applied 1.154B Vinyl ester fibreglass laminate 2.204C Vinyl ester lining: Filled basecoat plus laminate 3.004D Vinyl ester lining: Filled basecoat and topcoat, reinforced 3.005A Epoxy flake filled spray applied: 1 coat 0.355B Epoxy flake filled spray applied: 2 coats 0.605C High build epoxy plus polyurethane: spray applied 0.405D High build epoxy plus polyurethane: spray applied 0.355E Epoxy flake filled: brush applied 0.805F Epoxy flake filled: trowel applied 3.00
3. RESULTS AND DISCUSSION
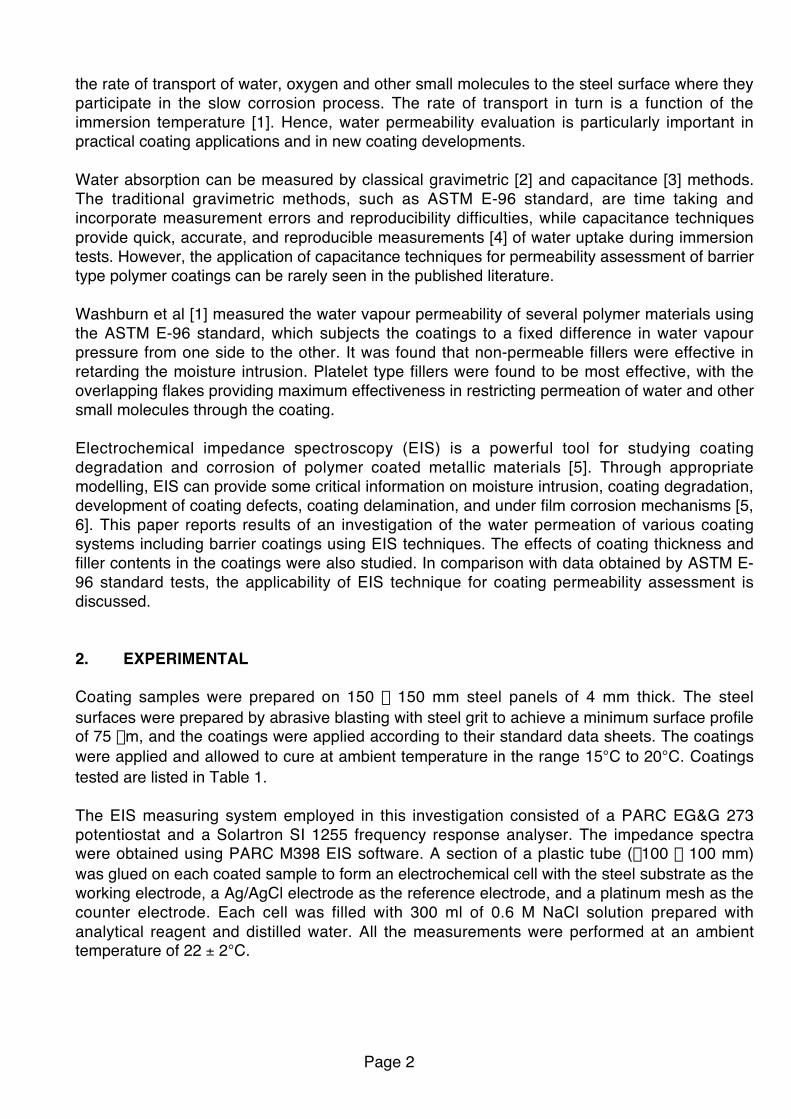
Figure 1 shows examples of the EIS spectra representing two different behaviours observed forthe coating systems investigated in this work. Figure 2 shows an equivalent RC circuitapplicable for most organic coatings [5]. The pore resistance, RP, which represents the ability ofa coating to protect the substrate, can be determined in the low frequency region in which thecoating impedance is independent of frequency. The results show that some of the coatings(mostly in sample 5 series) have their well-defined pore resistance in the Bode diagrams, asshown by sample 5A in Figure 1. The other type of EIS behaviour, which represent most of thecoatings from samples 1 to 4, is characterised by a nearly perfect - 1 slope in the Bode diagramextending to the frequency range of < 0.01 Hz, indicating the extremely high pore resistance ofthese coatings (> 1010 W). In this case, the pore resistance of the coating cannot be preciselydetermined in the Bode diagrams with the frequency range of 100 kHz to 10 mHz tested in thisinvestigation.
Page 4
-3 -2 -1 0 1 2 3 4 5 62
3
4
5
6
7
8
9
10
11
Day 0
3A 5A
Impe
danc
e , l
og IZ
I (W )
Frequency, log f (Hz)
Figure 1. EIS spectra of samples 3A and 5A immediately after immersion.
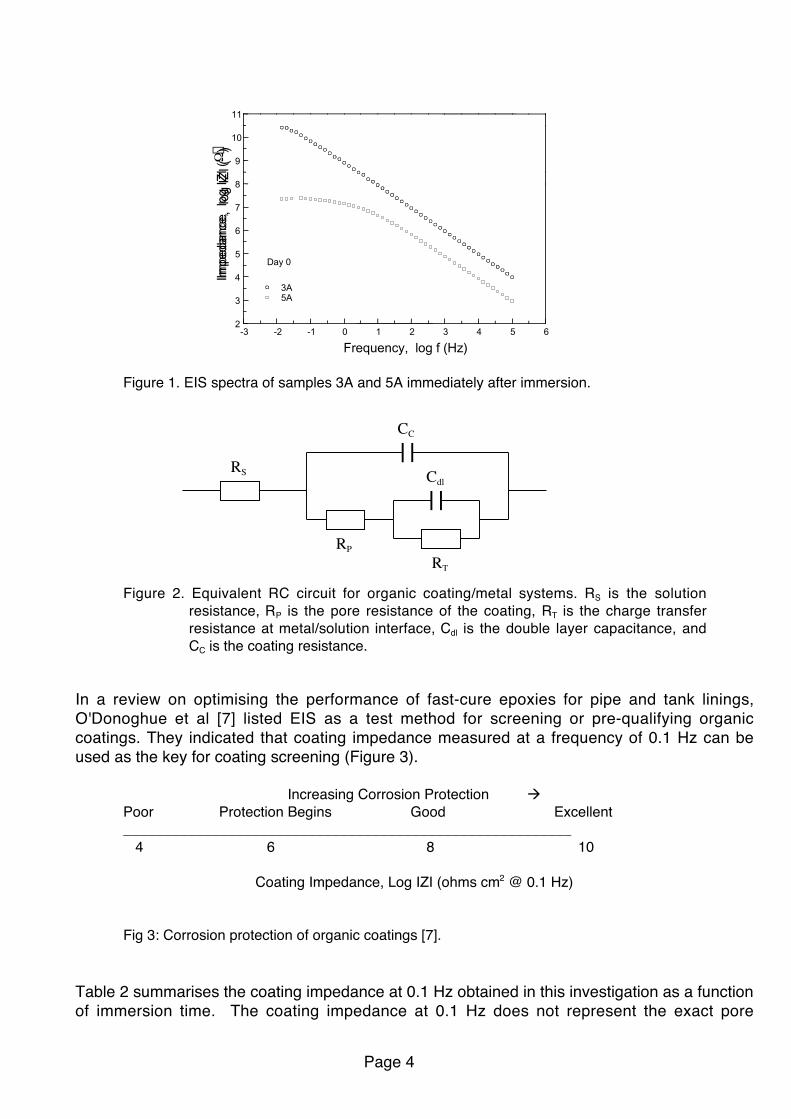
Figure 2. Equivalent RC circuit for organic coating/metal systems. RS is the solutionresistance, RP is the pore resistance of the coating, RT is the charge transferresistance at metal/solution interface, Cdl is the double layer capacitance, andCC is the coating resistance.
In a review on optimising the performance of fast-cure epoxies for pipe and tank linings,O'Donoghue et al [7] listed EIS as a test method for screening or pre-qualifying organiccoatings. They indicated that coating impedance measured at a frequency of 0.1 Hz can beused as the key for coating screening (Figure 3).
Increasing Corrosion Protection ‡Poor Protection Begins Good Excellent________________________________________________________
4 6 8 10
Coating Impedance, Log IZI (ohms cm2 @ 0.1 Hz)
Fig 3: Corrosion protection of organic coatings [7].
Table 2 summarises the coating impedance at 0.1 Hz obtained in this investigation as a functionof immersion time. The coating impedance at 0.1 Hz does not represent the exact pore
RT
RP
CC
RS Cdl

Page 5
resistance for most of the coatings tested in this work, as discussed above, and so theimpedance figures can only be used for comparison purposes.
Table 2. Coating impedance, IZI, at 0.1 Hz as a function of immersion time.
Impedance @ 0.1 Hz (Wcm2)Sample CoatingThickness
(mm) 0 Day 4 Day 8 Day 12 Day1A 1.70 4.66 ¥ 109 4.53 ¥ 109 4.46 ¥ 109
1B 2.35 5.94 ¥ 109 6.21 ¥ 109 6.50 ¥ 109 6.30 ¥ 109
1C 2.40 5.38 ¥ 109 5.60 ¥ 109 5.42 ¥ 109
1D 2.60 6.37 ¥ 109 6.27 ¥ 109 6.03 ¥ 109
2A 1.25 3.33 ¥ 109 3.35 ¥ 109 3.48 ¥ 109
2B 2.60 6.06 ¥ 109 6.06 ¥ 109 6.31 ¥ 109
2C 3.50 7.24 ¥ 109 7.43 ¥ 109 7.07 ¥ 109
2D 4.00 8.23 ¥ 109 7.96 ¥ 109 7.94 ¥ 109
3A 3.00 6.72 ¥ 109 6.99 ¥ 109 7.53 ¥ 109
4A 1.15 2.85 ¥ 109 2.82 ¥ 109 2.85 ¥ 109 2.83 ¥ 109
4B 2.20 5.83 ¥ 109 5.50 ¥ 109 5.91 ¥ 109
4C 3.00 6.56 ¥ 109 5.97 ¥ 109
4D 3.00 3.15 ¥ 109 3.00 ¥ 109
5A 0.35 2.93 ¥ 107 2.69 ¥ 106
5B 0.60 7.01 ¥ 107 7.54 ¥ 106 7.64 ¥ 106
5C 0.40 3.23 ¥ 108 1.38 ¥ 108 1.79 ¥ 108
5D 0.35 4.79 ¥ 108 1.94 ¥ 108
5E 0.80 5.18 ¥ 108 2.12 ¥ 108
5F 3.00 1.30 ¥ 109 1.09 ¥ 109
0.5 1.0 1.5 2.0 2.5 3.0 3.5 4.0 4.52
3
4
5
6
7
8
9
IZI @ 0.1 HzImmersion: Day 0
Impe
danc
e, IZ
I ́1
09 (
W )
Coating Thickness, mm
Figure 4. Relationship between IZI at 0.1 Hz and coating thickness for sample series 2 and 3coatings.

Page 6
Figure 4 plots the IZI at 0.1 Hz as a function of coating thickness for sample series 2 and 3which are of the same coating type but at different thicknesses. The results demonstrate thatthe coating impedance increased with coating thickness. As can be seen in Table 2, nosignificant change of the coating impedance was observed in the sample series from 1 to 4during 12 days of immersion (Figure 5). However, a very different behaviour was found for thesample series 5 coatings. As shown in Figure 6, the coating impedance at 0.1 Hz decreased byone order of magnitude after only four days of immersion. A minor decrease was observedduring further immersion up to 12 days.
-3 -2 -1 0 1 2 3 4 5 63
4
5
6
7
8
9
10
11
12
Coating: 4BThickness: 2.20 mm
Day 0 Day 12
Impe
danc
e, lo
g IZ
I (W )
Frequency, log f (Hz)
Figure 5. EIS spectra of sample 4B as a function of immersion time.
-3 -2 -1 0 1 2 3 4 5 6
3
4
5
6
7
8 Sample: 5BThickness: 0.60 mm
Day 0 Day 4
Impe
danc
e, lo
g IZ
I (W )
Frequency, log f (Hz)
Figure 6. EIS spectra of sample 5B as a function of immersion time.
During the EIS measurements, no significant corrosion or coating degradation was observedduring 12 days of testing. The decreases of coating impedance during the immersion tests ismost likely due to the intrusion of moisture and ions into the micro pore structures in the

Page 7
coatings, which in turn increased the pore conductance. The measurement of the waterabsorption or water permeability using EIS techniques is based on the determination of thechanges of the coating capacitance. The coating capacitance can be calculated from the EISdata C = 1/IZI at the frequency of 1/2p Hz. The water absorption can be calculated by theformula given by Hartshorn et al [8].
F = [log (Ct / C0)] / [log eH2O]
where F is the volume fraction of the absorbed water, Ct is the coating capacitance at time t, C0
is the capacitance at t = 0, and eH2O is the dielectric constant of water. In this investigation, thecoating capacitance measured immediately after immersion is taken as C0. The calculated Fusing the capacitance values obtained in this work are summarised in Table 3. Any calculated Fless than 0.01 is taken as zero due to the limits of measurement errors. A close examination ofthe data in Tables 2 and 3 reveals a correlation between IZI and F during the immersion tests,indicating that the decrease of IZI was due mainly to the water absorption in the coatings.
Table 3. Water absorption, F, as a function of immersion time.
Water Absorption, FSample CoatingThickness
(mm) 4 Day 8 Day 12 Day1A 1.70 ~ 0 ~ 01B 2.35 ~ 0 ~ 0 ~ 01C 2.40 ~ 0 ~ 01D 2.60 ~ 0 ~ 02A 1.25 ~ 0 ~ 02B 2.60 ~ 0 ~ 02C 3.50 ~ 0 ~ 02D 4.00 ~ 0 ~ 03A 3.00 ~ 0 ~ 04A 1.15 ~ 0 ~ 0 ~ 04B 2.20 ~ 0 ~ 04C 3.00 ~ 04D 3.00 0.0295A 0.35 0.1105B 0.60 0.077 0.0805C 0.40 0.151 0.1505D 0.35 0.1315E 0.80 0.0875F 3.00 0.030
Page 8
024681012140.000.020.040.060.080.10 4A 5B
Wat
er A
bsor
ptio
n,
F
Immersion Time, Day
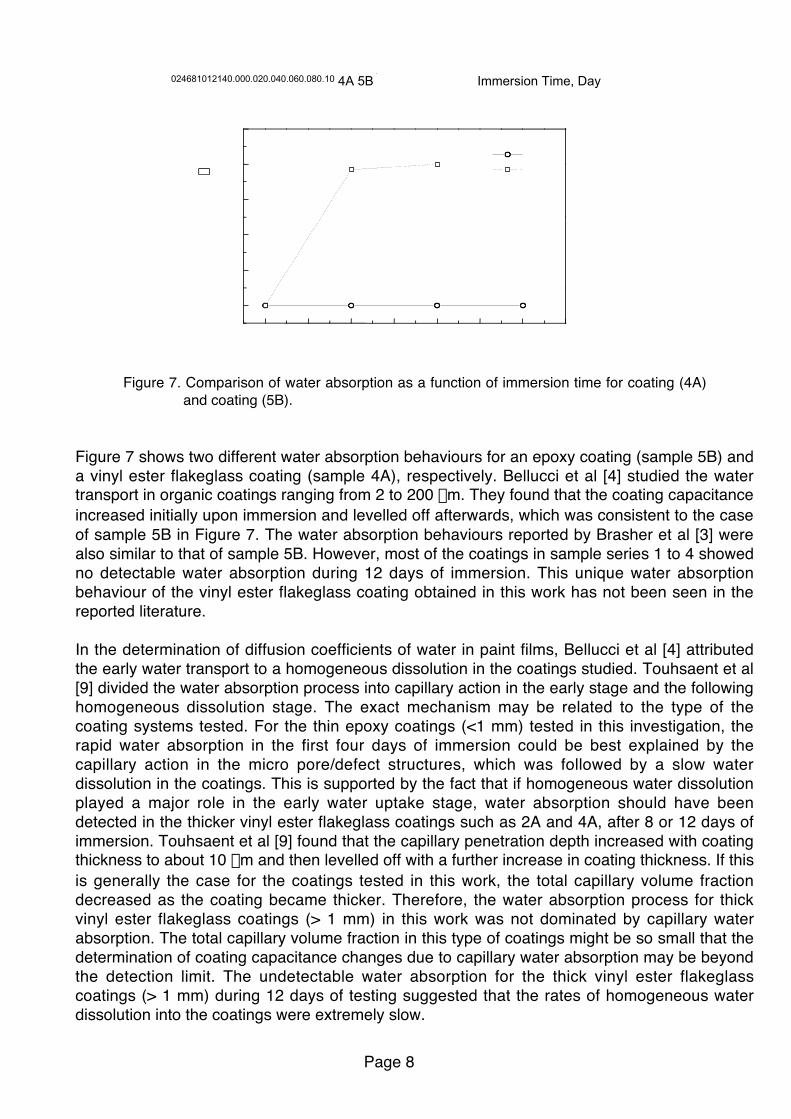
Figure 7. Comparison of water absorption as a function of immersion time for coating (4A)and coating (5B).
Figure 7 shows two different water absorption behaviours for an epoxy coating (sample 5B) anda vinyl ester flakeglass coating (sample 4A), respectively. Bellucci et al [4] studied the watertransport in organic coatings ranging from 2 to 200 mm. They found that the coating capacitanceincreased initially upon immersion and levelled off afterwards, which was consistent to the caseof sample 5B in Figure 7. The water absorption behaviours reported by Brasher et al [3] werealso similar to that of sample 5B. However, most of the coatings in sample series 1 to 4 showedno detectable water absorption during 12 days of immersion. This unique water absorptionbehaviour of the vinyl ester flakeglass coating obtained in this work has not been seen in thereported literature.
In the determination of diffusion coefficients of water in paint films, Bellucci et al [4] attributedthe early water transport to a homogeneous dissolution in the coatings studied. Touhsaent et al[9] divided the water absorption process into capillary action in the early stage and the followinghomogeneous dissolution stage. The exact mechanism may be related to the type of thecoating systems tested. For the thin epoxy coatings (<1 mm) tested in this investigation, therapid water absorption in the first four days of immersion could be best explained by thecapillary action in the micro pore/defect structures, which was followed by a slow waterdissolution in the coatings. This is supported by the fact that if homogeneous water dissolutionplayed a major role in the early water uptake stage, water absorption should have beendetected in the thicker vinyl ester flakeglass coatings such as 2A and 4A, after 8 or 12 days ofimmersion. Touhsaent et al [9] found that the capillary penetration depth increased with coatingthickness to about 10 mm and then levelled off with a further increase in coating thickness. If thisis generally the case for the coatings tested in this work, the total capillary volume fractiondecreased as the coating became thicker. Therefore, the water absorption process for thickvinyl ester flakeglass coatings (> 1 mm) in this work was not dominated by capillary waterabsorption. The total capillary volume fraction in this type of coatings might be so small that thedetermination of coating capacitance changes due to capillary water absorption may be beyondthe detection limit. The undetectable water absorption for the thick vinyl ester flakeglasscoatings (> 1 mm) during 12 days of testing suggested that the rates of homogeneous waterdissolution into the coatings were extremely slow.

Page 9
0 10 20 30 40 504.0x10 9
4.5x10 9
5.0x10 9
5.5x10 9
6.0x10 9
6.5x10 9
7.0x10 9
Content of Flakeglass, wt %
Impe
danc
e at
0.1
Hz
(W -
cm2
)
0
1
2
3
4
5
6
7
Vap
our
Per
mea
bilit
y, (
X10
-2 gr
/m2
mm
Hg
day)
Figure 7. Comparison of IZI at 0.1 Hz and vapour permeability as a function of flakeglass contentin coatings of sample series 1.
Figure 8 compares the IZI at 0.1 Hz and water vapour permeability for sample series 1. With theincrease of flakeglass content, the water vapour permeability decreased [10], and at the sametime, the IZI at 0.1 Hz increased. Therefore, there is a rough correlation between water vapourpermeability and the impedance data, suggesting a possibility of using the IZI data to evaluatethe water vapour permeability of coatings.
-0.05 0.00 0.05 0.10 0.15 0.20 0.25 0.30 0.35
2.0x10⁹
4.0x10⁹
6.0x10⁹
8.0x10⁹
3A
4D
4C
4B
4A
5B
Day 0 Day 4
Impe
danc
e, lo
g IZ
I (W -
cm2)
Permeance (perms)
IZI at 0.1 Hz
Figure 9. Correlation between IZI at 0.1 Hz and water vapour permeance.
Figure 9 plots the IZI data obtained in this work at 0.1 Hz against the water vapour permeancedata reported elsewhere [1]. It is clear there is a good correlation between IZI at 0.1 Hz andwater vapour permeance. As already discussed, significant water absorption was observed forthe epoxy coatings less than 1 mm thick. Although the reported water vapour permeance dataavailable [1] are limited to only some of the coatings tested in this investigation, it is likely that a

Page 10
correlation exists between the water absorption obtained using EIS in this work and the watervapour permeability measured using ASTM E-96 standard.
The preliminary results have demonstrated the capability of EIS technique in evaluating thewater transport properties of barrier type coatings. By an appropriate modelling of the coatingsystem, EIS can provide information such as water absorption rate and depth of microcapillary/defect structures, water diffusion coefficient of homogeneous dissolution, which in turncan be used to calculate the water permeability in coatings. Normally the measurement error isless than 5% corresponding to a F detection limit of less than 0.01. This provides a high degreeof reproducibility of measurement as compared with the traditional gravimetric methods, such asASTM E-96 standard. As indicated above, EIS can also reveal the mechanisms of watertransport in the coatings as well as the under film corrosion mechanisms following the waterabsorption.
It is the author's experience that coatings of the type trowel applied vinyl ester flakeglass havean almost indefinite life in a mild aqueous solution such as salt water, and a life in a chlorinesolution in the order of 15 years. The high performance of this type of coating has beenreflected by EIS data measured during 12 days of immersion. EIS measurements did not revealany significant changes during the testing period, which is indicative of extremely low waterabsorption and ion intrusion processes in these coatings. The results suggest that a coatingwith a IZI value at 0.1 Hz in excess of 6 x 10⁹ W-cm2 represents a high performance barriercoating suitable for continuous immersion service in a mild aqueous solution. This figureprovides a benchmark for comparing to other coatings. EIS techniques have been used topredict coating lifetime [4]. For the barrier coatings examined in this investigation, theassessment of coating life expectancy may require longer immersion periods and acceleratedtests such as tests at elevated temperature.
4. CONCLUSIONS
This preliminary EIS investigation of the water absorption in the polymer coatings producedusing barrier technology has led to the following conclusions:
ß EIS spectra showed the pore resistance of different types of coatings. Vinyl ester flakeglasscoatings showed an extremely high pore resistance.
ß For the same coating type, the coating impedance increased with increasing coatingthickness.
ß The decrease in coating impedance with immersion time for some of the samples may bestbe explained by the water/ion absorption, leading to the increase of the conductance in thecoatings.
ß For the epoxy coatings of < 1 mm thick, the quick water absorption at early immersion stagecould be explained by a capillary action of the pore/defect structure in the coatings.
ß For the vinyl ester flakeglass coatings, there was no detected water absorption over the 12days of the test. Thus the EIS testing data is in line with the outstanding performance of vinylester flakeglass systems in immersion service in actual installations.
ß There is a correlation between water vapour permeability and EIS measurements for thecoatings studied. Therefore EIS data appears useful in comparing different coatings for usein such applications as immersion in aqueous solutions. It is concluded that EIS data will beuseful in predicting lifetime expectancy of coatings in immersion service.

Page 11
ß EIS techniques can provide quick, reliable, and reproducible measurements for watertransport evaluation in coatings. This work shows that EIS techniques are also applicable tothick barrier type coatings as well as the thinner coatings studied by other researchers.
7. REFERENCES
1. R.B.Washburn, M.J.Galloway, and W.R.Slama. Journal of Protective Coatings & Linings, 2,pp30 (1985).
2. J. Crank and G. S. Park, Diffusion in Polymers, Academic Press, New York, NY, 1954.3. D. M. Brasher and A. H. Kingsbury, J. Appl. Chem., 4, February, pp62 (1954).4. F. Bellucci and L. Nicodemo, Corrosion, 49, pp235 (1993).5. F. Mansfeld and C. H. Tsai, Corrosion, 47, pp985 (1991)6. J.R.Scully and S.T.Hensley. Corrosion, 50, pp705 (1994).7. M.O'Donoghue, R.Garrett, V.J.Datta, P.Meli, and L.Meilus. JPCL-PMC, pp36-51, March
1998.8. L. Hartshorn, N. Megson, and E. Rushton, J. Soc. Chem. Ind., 56, pp266T (1937).9. R. E. Touhsaent and H. Leidheiser, Jr., Corrosion, 28, pp435 (1972).10. Nippon Sheet Glass Co., Ltd. Technical Bulletin for Microglas® Glass Flake.
ACKNOWLEDGEMENT
The authors wish to thank Technologies New Zealand for funding this project. The performanceof EIS measurements by B. Lin is also acknowledged.