electrochemical investigation of the reaction mechanism in ...1156782/fulltext01.pdf · iii...
TRANSCRIPT

Electrochemical Investigation of theReaction Mechanism in
Lithium-Oxygen Batteries
JONAS LINDBERG
Doctoral ThesisKTH - School of Chemical Science and Engineering
Department of Chemical EngineeringApplied Electrochemistry
SE-100 44 Stockholm, SwedenStockholm, Sweden 2017

TRITA-CHE 2017:36ISSN 1654-1081ISBN 978-91-7729-614-0
KTH Chemical Science and EngineeringSE-100 44 Stockholm
SWEDEN
Akademisk avhandling som med tillstånd av Kungl Tekniska högskolanframlägges till offentlig granskning för avläggande av teknologie dok-torsexamen i kemivetenskap måndag den 18e december 2017 klockan10.00 i K1, Teknikringen 56, Kungl Tekniska högskolan, Stockholm.
© Jonas Lindberg, December 2017
Tryck: Universitetsservice US AB

iii
Abstract
Lithium-oxygen batteries, also known as Lithium-air batter-ies, could possibly revolutionize energy storage as we know. Byletting lithium react with ambient oxygen gas very large theo-retical energy densities are possible. However, there are severalchallenges remaining to be solved, such as finding suitable mate-rials and understanding the reaction, before the lithium-oxygenbattery could be commercialized. The scope of this thesis isfocusing on the latter of these challenges.
Efficient ion transport between the electrodes is imperativefor all batteries that need high power density and energy effi-ciency. Here the mass transport properties of lithium ions inseveral different solvents was evaluated. The results showedthat the lithium mass transport in electrolytes based on thecommonly used lithium-oxygen battery solvent dimethyl sulfox-ide (DMSO) was very similar to that of conventional lithium-ionbattery electrolytes. However, when room temperature ionicliquids were used the performance severely decreased.
Addition of Li salt will effect the oxygen concentration inDMSO-based electrolytes. The choice of lithium salt influencedwhether the oxygen concentration increased or decreased. Atone molar salt concentration the highest oxygen solubility was68 % larger than the lowest one.
Two model systems was used to study the electrochemicalreaction: A quartz crystal microbalance and a cylindrical ultra-microelectrode. The combined usage of these systems showedthat during discharge soluble lithium superoxide was produced.A consequence of this was that not all discharge product endedup on the electrode surface.
During discharge the cylindrical ultramicroelectrodes dis-played signs of passivation that previous theory could not ade-quately describe. Here the passivation was explained in termsof depletion of active sites. A mechanism was also proposed.
The O2 and Li+ concentration dependencies of the dischargeprocess were evaluated by determining the reactant reactionorder under kinetic and mass transport control. Under kineticcontrol the system showed non-integer reaction orders with that

iv
of oxygen close to 0.5 suggesting that the current determiningstep involves adsorption of oxygen. At higher overpotentials,at mass transport control, the reaction order of lithium andoxygen was zero and one, respectively. These results suggestthat changes in oxygen concentration will influence the currentmore than that of lithium.
During charging not all of the reaction product was re-moved. This caused an accumulation when several cycles wasexamined. The charge reaction pathway involved de-lithiationand bulk oxidation, it also showed an oxygen concentration de-pendence.

v
Sammanfattning
Litiumsyrebatteriet, även känt som litiumluftbatteriet, kanpotentiellt revolutionera vårt förhållande till energilagring. Ge-nom att låta litium reagera med syrgas från luften kan teoretiskthöga energitätheter uppnås. Dock så behöver många problemlösas, så som att hitta lämpliga elektrod- och elektrolytmaterialsamt att få en ökad förståelse för reaktionsmekanismen, innanlitiumsyrebatteriet kan kommersialiseras. Den här avhandling-en behandlar de sistnämnda av dessa problem.
För att ett batteri ska kunna leverera hög effekttäthet ochenergieffektivitet krävs en effektiv jontransport mellan elektro-derna. Här utvärderades masstransporten hos flera olika elekt-rolyter. Resultatet visade att masstransporten av litium i enlitiumsyrebatterielektrolyt (baserad på dimetylsulfoxid (DM-SO)) är likvärdig med en konventionell litiumjonbatterielekt-rolyt. När elektrolyter baserade på jonvätskor användes uppvi-sades väldigt stora energiförluster.
När litiumsalt tillsattes påverkades lösligheten av syre iDMSO-baserade elektrolyter. Vilken sorts litiumsalt som an-vändes påverkade om lösligheten av syre ökade eller minskade.Vid en saltkoncentration på en molar var den högsta syrelöslig-heten 68 % större än den lägsta.
Två olika modellsystem används för att studera den elektro-kemiska reaktionen: En elektrokemisk kvartskristallmikrovåg ochen cylindrisk ultramikroelektrod. Vid kombinerad användningav dessa system påvisades att löslig litiumsuperoxid bildadesvid urladdningen. Följden av detta blev att endast delar av ur-laddningsprodukten hamnade på elektroden.
Vid urladdning visade ultramikroelektroderna tecken på pas-sivering som inte kunde beskrivas av tidigare teori. Här föreslåsatt passiveringen uppstår på grund av en blockering av de akti-va säten där reaktionen fortskrider. För denna process föreslåsäven en detaljerad mekanism.
Urladdningsprocessens koncentrationsberoende utvärdera-des genom att bestämma reaktionsordningen för syre och liti-um under kinetisk- och masstransport kontroll. Under kinetisk

vi
kontroll fanns inga heltalsreaktionsordningar, för syre var re-aktionsordningen nära 0.5 vilket föreslår att det reaktionsstegsom bestämmer strömstorleken innefattar en adsorption av sy-re. Vid högre överpotentialer, då systemet var under masstrans-portkontroll, var reaktionsordningarna för litium och syre nollrespektive ett. Detta föreslår att ändringar i syrekoncentrationpåverkar strömmen betydligt mer än vad det gör för litium.
Under uppladdning kunde inte all reaktionsprodukt avlägs-nas från elektroden. Detta ledde till en ackumulation då fleracykler studerades. Uppladdningens delsteg innefattade en deli-tiering följt av en oxidation av reaktionsproduktbulken. Dennaprocess uppvisade även ett syrekoncentrationsberoende.

vii
PublicationsThis thesis is based on the following publications:
I Jonas Lindberg, Henrik Lundgren, Mårten Behm, and Göran Lind-bergh. Benchmarking of Electrolyte Mass Transport inNext Generation Lithium Batteries. Journal of Electrochem-ical Science and Engineering (2017)
II Jonas Lindberg, Balázs Endrődi, Gustav Åvall, Patrik Johansson,Ann Cornell, and Göran Lindbergh. Li-salt Anion Effect on O2Solubility in Li-O2 Battery Electrolytes, Manuscript submit-ted
III Jonas Lindberg, Björn Wickman, Mårten Behm, Ann Cornell,and Göran Lindbergh. The Effect of O2 Concentration onthe Reaction Mechanism in Li-O2 Batteries. J. Electroanal.Chem., 797, (2017) 1-7
IV Jonas Lindberg, Ann Cornell, and Göran Lindbergh. Determin-ing the Li+ and O2 Concentration Dependence in Li-O2Batteries with Ultramicroelectrodes, Manuscript
Work not appended in the thesis:
1. Jonas Lindberg and Balázs Endrődi, Measuring Dissolved O2in Dimethyl Sulfoxide Solution in the Presence of Differ-ent Lithium Salts, Application note, https://www.presens.de/knowl-edge
Author contributionPaper I Principal author. I preformed all experiments and wrote
most of the paper
Paper II Principal Author. The DFT calculations were performedby Gustav Åvall, Chalmers. The viscosity and density measure-ments were made together with Dr. Yajing Yan, Chalmers. The

viii
O2 solubility measurements were performed togheter with Dr.Balázs Endrődi, KTH. I performed all electrochemical measure-ments and wrote most of the paper.
Paper III Principal Author. The AFM measurements were performedby Prof. Torbjörn Pettersson, KTH. The O2 solubility measure-ments were performed togheter with Dr. Balázs Endrődi, KTH. Iperformed all EQCM measurements and wrote most of the paper.
Paper IV Principal Author. I performed all experiments and wrotemost of the paper.

Contents
Contents ix
1 Introduction 11.1 Li-O2 Batteries . . . . . . . . . . . . . . . . . . . . . . 21.2 Scope of the Thesis . . . . . . . . . . . . . . . . . . . . 6
2 Experimental 92.1 O2 Solubility . . . . . . . . . . . . . . . . . . . . . . . 9
Mass Spectrometer (MS) . . . . . . . . . . . . . . . . . 9Optical O2 Sensor . . . . . . . . . . . . . . . . . . . . . 10
2.2 Electrolyte Mass Transport Resistivity (EMTR) . . . . 10Ionic Conductivity and Ohmic Resistivity . . . . . . . 11Diffusion Resistivity . . . . . . . . . . . . . . . . . . . 11
2.3 Dynamic Viscosity and Density . . . . . . . . . . . . . 122.4 Electrochemical Quartz Crystal Microbalance (EQCM) 122.5 Cylindrical Ultramicroelectrodes (UME) . . . . . . . . 132.6 Formation of the LiFePO4 Counter Electrodes . . . . . 142.7 Chemicals . . . . . . . . . . . . . . . . . . . . . . . . . 14
3 Results and Discussion 173.1 Lithium Mass Transport . . . . . . . . . . . . . . . . . 173.2 Oxygen solubility . . . . . . . . . . . . . . . . . . . . . 213.3 Electrochemical Evaluation of the Reaction Mechanism 25
Reduction Rate Law . . . . . . . . . . . . . . . . . . . 27Oxidation Mechanism . . . . . . . . . . . . . . . . . . 33
3.4 Electrode surface passivation . . . . . . . . . . . . . . . 35
ix

x CONTENTS
4 Conclusion 41
5 Acknowledgments 45
Bibliography 47

Chapter 1
Introduction
Currently our modern lifestyle causes large anthropogenic emissionsof greenhouse gases. Since 1850 the global average temperature hasincreased with 0.85 °C and over the last 100 years the average global sealevel have risen with 20 cm. [1] Furthermore, the emission of greenhousegases is closely linked to the problem of air pollution.
The transport sector is responsible for a large part of the globalCO2 emissions. One of the most promising efforts in reducing theseemissions have been the introduction of hybrid (HEV), plug-in hybrid(PHEV), and battery electric vehicles (BEV). These vehicles rely onLi-ion batteries to store energy, for PHEV and BEV the driving rangewill be directly influenced by the energy density of the battery. Inorder to accelerate the use of these vehicles the battery cost must belowered and energy density increased. [2] In order to do so two waysare possible: incremental improvement of current technology or a jumpforward by developing new technology.
Developing a Novel BatteryWhen designing a battery one must choose two electrodes. In order tomaximize the energy content these two electrodes need to be separatedby a large electrochemical potential and be able to transfer a largeamount of charge as the theoretical energy, Wth, equals the reversiblecell voltage, E0, times the theoretical capacity, Cth, according to:
1
2 CHAPTER 1. INTRODUCTION
Wth = E0Cth (1.1)
More often is the specific energy, Wth,s, more interesting as thisparameter is normalized with respect to the electrode mass. Thus,when designing a high energy density battery, the ideal electrochemicalreaction should include two low density electrodes separated by a largeelectrochemical potential. Two elements creating an extra interestingcombination fulfilling these criteria are lithium and oxygen.
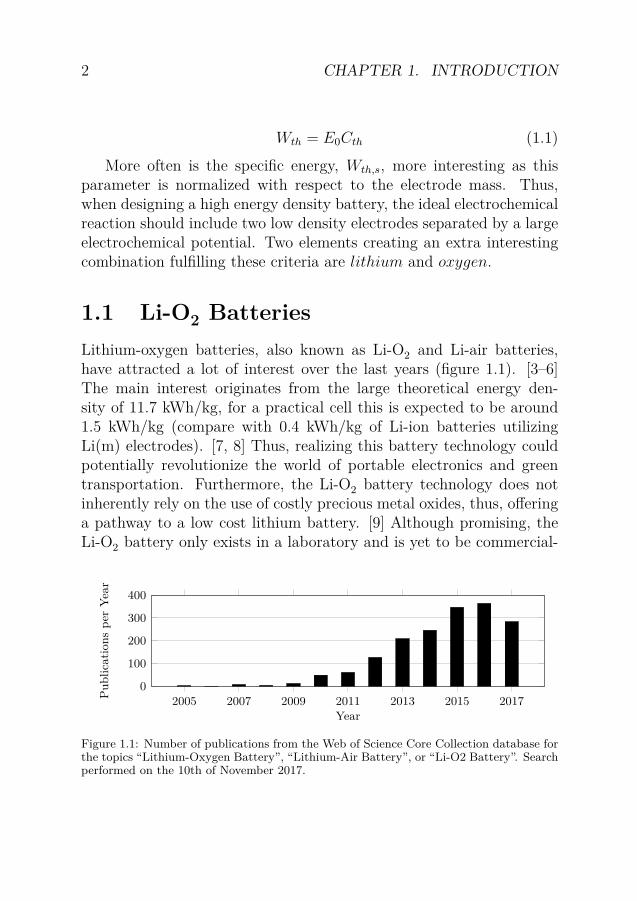
1.1 Li-O2 BatteriesLithium-oxygen batteries, also known as Li-O2 and Li-air batteries,have attracted a lot of interest over the last years (figure 1.1). [3–6]The main interest originates from the large theoretical energy den-sity of 11.7 kWh/kg, for a practical cell this is expected to be around1.5 kWh/kg (compare with 0.4 kWh/kg of Li-ion batteries utilizingLi(m) electrodes). [7, 8] Thus, realizing this battery technology couldpotentially revolutionize the world of portable electronics and greentransportation. Furthermore, the Li-O2 battery technology does notinherently rely on the use of costly precious metal oxides, thus, offeringa pathway to a low cost lithium battery. [9] Although promising, theLi-O2 battery only exists in a laboratory and is yet to be commercial-
2005 2007 2009 2011 2013 2015 20170
100
200
300
400
Year
Publ
icat
ions
per
Year
Figure 1.1: Number of publications from the Web of Science Core Collection database forthe topics “Lithium-Oxygen Battery”, “Lithium-Air Battery”, or “Li-O2 Battery”. Searchperformed on the 10th of November 2017.

1.1. LI-O2 BATTERIES 3
ized as this battery chemistry has several challenges remaining to besolved.
The cell reaction consists of lithium (Li) reacting with oxygen molecules(O2) forming lithium superoxide (LiO2) that proceeds to form lithiumperoxide (Li2O2) (figure 1.2). [4, 10] The cell reaction is written as:
2 Li + O2 −−−− Li2O2 (1.2)
When discharging and charging this battery with a constant cur-rent several studies have shown over 100 cycles with good capacity re-tention. Gold O2-electrodes in dimethyl sulfoxide (DMSO) electrolyteshowed a capacity of 325 mAh g−1
gold over 100 cycles at current densi-ties of 500 mA g−1
gold. [11] Cycling of titanium carbide (TiC) electrodeshave shown capacities of 350 mAh g−1
TiC and 500 mAh g−1TiC for elec-
trolytes based on DMSO and TEGDME, respectively, with currents of250 mA g−1
TiC where the capacity retention was higher for the DMSO-based electrolyte. [12] Carbon electrodes have shown 100 cycles ofconstant capacity cycling of 1000 mAh g−1
Carbon at current densities 1A g−1
Carbon. [13] These cycles a characterized by potential difference ofseveral hundred millivolts between charge and discharge, most notablyis the large overpotential for the charging reaction.
The reduction product has been identified as toroidal particles [14,15], at high currents the particles are small forming a film on the elec-
O2(g)
O2(sol)
Li+Li2O2Li(m)
e-
e-
e-
2Li++O2
Figure 1.2: A schematic representation of the Li-O2 battery. The system consists of threeparts: a negative electrode, an electrolyte, and a positive electrode. As for a Li-ion battery,the role of the negative electrode is to store lithium, here depicted as metallic lithium.The electrolytes role is to shuffle Li-ions between the two electrodes. Specifically for aLi-O2 battery, it also needs to dissolve and and transport O2. At the positive electrodeO2 reacts with Li+ forming Li2O2 during discharge, therefore this electrode is also referredto as the O2-electrode.

4 CHAPTER 1. INTRODUCTION
trode while at low currents discrete particles are formed. [16–18]. Asthe particles grow there is an increase in superoxide-like content sug-gesting a complex and non-stoichiometric reduction process. [19–21]The particle growth has also been linked to the presence of traceamounts of water in the electrolyte. [22]
During galvanostatic cycling the discharge voltage profile is typi-cally flat over a wide capacity range followed by a so called suddendeath behavior where the potential drops steeply. As the depositedLi2O2 is an insulator it will passivate the electrode by hindering elec-tron tunneling once it reaches a certain thickness. This film thicknesshas been suggested to be in the magnitude of 6-10 nm. [23, 24] Be-yond the main reaction, the observed cell voltage is also influenced bythe presence of side reactions. During galvanostatic discharge parts ofthe product consists of lithium carbonate (Li2CO3) and other lithium-organic compounds. [25] These side products require higher potentialsto oxidize resulting a high overpotential of the battery. [26]
The reaction mechanism is better understood by deconvoluting itinto several reaction steps and discussing whether these steps are elec-trochemical or chemical in nature and how they are influenced by theirchemical environment. The first step of the reduction has been sug-gested to be a one electron reduction of O2: [27, 28]
O2 + e− −−→ O −2 (1.3)
Followed by a reaction with Li+ forming LiO2:
O −2 + Li+ −−→ LiO2 (1.4)
An alternative first step has been suggested where the combinationof reactions 1.3 and 1.4 are occurring in a single step: [10]
O2 + Li+ + e− −−→ LiO2 (1.5)
The proceeding step is solvent dependent. This is seen when usingrotating ring disk electrode (RRDE) as electrolytes based on DMSOhave a high ring current while as electrolytes based on acetonitrile(CH3CN) produce negligible ring currents. [29–33] This suggests two

1.1. LI-O2 BATTERIES 5
separate reaction paths, one surface mediated and one solution medi-ated. This has been linked to the electrolytes ability to stabilize theintermediate, whether the intermediate has the form O –
2 or LiO2 isalso electrolyte dependent. [29] This ability is quantified by the sol-vents donor number (DN) [22, 29, 34]. A high DN solvent will stabilizeLiO2 in the electrolyte, making the reaction proceed via a disproportionreaction pathway (equation 1.6), while a low DN solvent will promoteelectrochemical formation of a uniform film of discharge products onthe electrode surface (equation 1.7). [29, 34–36]
2LiO2 −−→ Li2O2 + O2 (1.6)
LiO2 + e− + Li+ −−→ Li2O2 (1.7)
Only measuring the current in a galvanostatic cycling experimentwill not adequately describe the full reaction confined to the electrodesurface in a Li-O2 battery. For this to be evaluated additional quan-titative techniques are needed. By measuring the consumption/evo-lution of O2 gas with a differential electrochemical mass spectrometer(DEMS) it is possible to determine the number of moles of O2 per elec-tron transferred. Thus, it is possible to discriminate between the oneelectron formation of LiO2, the two electron formation of LiO2, and thefour electron formation of Li2O. [10, 37] Furthermore, by using isotopelabeling it is possible separately determine the stability of the elec-trolyte and electrode. [25, 38] By utilizing an electrochemical quartzcrystal microbalance (EQCM) it is possible to relate the electrode masschange per charge transferred. Thus, it is possible to determine theamount of current resulting in a mass change and to get an idea of thespecie reacting by relating the measured mass per electron to its molarweight. Measurements in DMSO-based electrolytes have shown thatonly part of the current contribute to an electrode mass increase thussuggesting that part of reduction product will reside in the electrolyteand thus might not be able to be oxidized. [39–43]
Beyond the electrode reaction processes, the performance of thebattery will also rely on the properties of the Li+ and O2 reactants.The electrolytes ability to dissolve O2 has been mentioned as a key
6 CHAPTER 1. INTRODUCTION
electrolyte property, [44] however, the actual O2 concentration is sel-dom known. By using Henry’s law the solubility can be quantified asit relates the pressure of a gas to its concentration in a solvent, at lowconcentration and moderate pressure:
Hcp = c
p(1.8)
where Hcp is Henry’s constant, p partial pressure, and c concentra-tion. Previously, the O2 concentration has successfully been measuredin numerous carbonate-based electrolytes. [45] However, carbonatebased electrolytes decompose and are not regarded suitable for Li-O2batteries. [46]
For the other reactant, Li+, its influence on electrolyte performancehas in general not been studied for Li-O2 batteries. For example, theLi+ mass transport has been assumed to be the same as for Li-ionbatteries although this is not necessarily the case. [47, 48]
The Way Forward
As seen in the above introduction there have been significant advancesin the development of the Li-O2 battery over the last few years. How-ever, there is more work to be done. For example, the electrolytemass transport, the reaction concentration dependency, the electrodesurface confined reaction, and the surface passivation are some of thephenomena that need to be further evaluated in a quantitative way.
1.2 Scope of the ThesisIn order to better understand the reaction mechanism in Li-O2 batter-ies, this thesis examined the physico-chemical processes confined to theelectrolyte and the O2-electrode. The O2 and Li+ reactants was stud-ied by quantifying the mass transport of Li+ and the solubility of O2 inthe electrolyte (Paper I and II, respectively). These findings were thenused as input to the two electrochemical model systems used, utilizingcylindrical ultramicroelectrodes (Paper II and IV) and an electrochem-ical quartz crystal microbalance (Paper III). Specifically, the electrode

1.2. SCOPE OF THE THESIS 7
material and geometry (Paper II, III, IV), reaction rate law (IV), andelectrode surface passivation (II, III, and IV) have been studied.


Chapter 2
Experimental
Here an overview of the used techniques are presented, further detailscan be found in the individual papers.
2.1 O2 SolubilityThe solubility of O2 was measured with two different techniques: amass spectrometer and an optical sensor.
Mass Spectrometer (MS)The O2 saturation concentration in the electrolyte was measured usinga Hiden HPR-20 type bench-top MS, equipped with a quartz capillaryinlet. Argon (99.9990 % purity) was used as carrier gas at a flow of 50ml min−1. To improve time resolution, only the m/Q of Ar, O2, andN2 was monitored. The experiments were conducted at 22°C. Beforeeach set of measurement the MS was calibrated for O2 and N2. Whenmeasuring the O2 solubility, 100 ml of the O2 saturated electrolyte waspoured inside the MS reaction chamber where it was stirred and bub-bled with the Ar carrier gas in order to purge the electrolyte of O2.When opening the reaction chamber a small amount of air entered thechamber thus increasing the amount of O2. The O2 originating fromair was subtracted from the measurements by relating this O2 amount
9

10 CHAPTER 2. EXPERIMENTAL
to the measured N2 amount. The amount of O2 in the electrolyte couldthen be measured, making calculation of the saturation concentrationand Henry’s constant possible. The O2 saturation concentration indeionized water (Millipore Direct-Q3 UV, ρ=18.2 MΩ cm) was mea-sured at 1 atm O2 pressure to evaluate the reliability of the technique.A set of four measurements had a mean O2 saturation concentrationof 1.29 mM with a standard deviation 0.04 mM when saturated at 1atm. This corresponds to a Henry’s constant, Hcp, of 1.3 · 10−5 molm−3 Pa−1 which is in line with reported literature values [49]. Hcp
is defined as the concentration of O2 in the electrolyte divided by itspartial pressure at equilibrium.
Optical O2 SensorAn optical oxygen sensor (PreSens, OXY-1 SMA) was utilized to mea-sure the O2 concentration in electrolytes saturated with technical air.Before a measurement, 25 ml of the electrolyte was saturated with tech-nical air for 30 min. The electrolyte was then transferred to the testvessel where the measurement was conducted. The solubility of O2 inMilliQ water was measured to 1.1 mM, thus, reasonably agreeing withliterature. [49]
2.2 Electrolyte Mass TransportResistivity (EMTR)
First used as a way to interpret the result from a full characterizationbased on concentrated electrolyte theory, the EMTR is a useful figureof merit when it comes to quantify and compare mass transport inelectrolytes [50–53]. From the experimentally measurable quantitiesconductivity and diffusion potential at steady state, the EMTR caneasily be calculated, using eq. 2.1.
−(∂Φ/∂x)s.s.
i= 1
κ+ ∆φdiff, s.s. · εβ
l· 1
i(2.1)

2.2. ELECTROLYTE MASS TRANSPORT RESISTIVITY (EMTR)11
where Φ is the electrolyte potential1, i the current density, κ theconductivity, ∆φdiff, s.s. is the potential drop caused by concentrationgradients at steady state in a cell of length l. The influence of theporosity and tortuosity of the separator is taken into account by mul-tiplying with the porosity, ε, raised to the power of the Bruggemanconstant β. The first term on the right hand side of eq 2.1 is the ohmicresistivity, the second term is called the diffusion resistivity2.
Ionic Conductivity and Ohmic ResistivityFor the EMTR calculations, the ionic conductivity was used to calcu-late the ohmic resistivity by using the first term on the right-hand sideof eq. 2.1. The ionic conductivity was measured inside an argon-filledglove box using a Consort K912 conductometer with a SK41T four-electrode probe. Prior to the measurements the probe was calibratedoutside the glove box using KCl standard solutions.
Diffusion ResistivityIn order to determine the diffusion resistivity a symmetrical test cellwith two Li-metal electrodes was assembled. To ensure a constant inter-electrode distance the electrodes were separated by a Teflon spacer-ringwith a thickness of 500 µm and an inner diameter of 6 mm. Theelectrolyte was soaked into a Whatman GF/A glass micro fiber filter,placed inside the spacer-ring. The filter has a porosity of 0.9, and theBruggeman coefficient has previously been determined to 3.44 [50].
The diffusion potential (∆φdiff in eq. 2.1) was measured in thetest cell directly after a galvanostatic polarization. The steady statediffusion potential was inserted into the second term on the right-hand
1The electrolyte potential is defined and measured with a metal reference elec-trode of the same kind as the cation. The EMTR is therefore also defined for thatspecie.
2Note that this term describes both migration and diffusion, it contains both t+and D, and both these modes of transport will give rise to concentration gradients.The term “diffusion resistivity” is simply chosen to agree with previously usedterminology.
12 CHAPTER 2. EXPERIMENTAL
side of equation 2.1 in order to calculate the diffusion resistivity. Themagnitude of the polarization current was chosen so that the potentialdirectly after current switch-off was between 5 and 50 mV. The lowerpotential limit was chosen to give low noise contribution, and the upperlimit was set to avoid dendrite formation. Each electrolyte compositionwas tested in at least four test cells and each cell was polarized withat least four different currents giving potential drops at steady statespanning over 5 to 50 mV.
2.3 Dynamic Viscosity and DensityAn Anton Paar LOVIS 2000 M/ME viscometer was used to measurethe dynamic viscosity, using an oscillating U-tube, together with thedensity using the falling sphere method.
2.4 Electrochemical Quartz CrystalMicrobalance (EQCM)
For the EQCM measurements a PAR 273 potentiostat was used incombination with a Q-Sense E4 QCM equipped with a QEM 401 elec-trochemistry module. The sensors (Q-Sense) were used as received andconsisted of a gold coated quartz crystal with 0.78 cm2 active area, italso served as working electrode for the O2 reaction. These experi-ments utilized a piece of LiFePO4 as counter electrode (see 2.6). Theelectrodes were separated by an o-ring of 1 mm thickness making thevolume of electrolyte inside the cell 100 µl. The cell module used Kalrezo-rings to ensure chemical stability. The cell was kept at a constanttemperature of 20°C by the built-in temperature control, the cell wasgiven time to equilibrate its temperature before the measurements werestarted. The measured change in frequency of the resonating sensor wastranslated into change in mass using the Sauerbrey equation:
∆f = − 2f 20
A√
ρqµq
∆m (2.2)

2.5. CYLINDRICAL ULTRAMICROELECTRODES (UME) 13
where ∆f is the measured frequency change, f0 is the resonantfrequency of the crystal, A is the sensor area, ρq is the density of quartz,µq is the shear modulus of quartz and ∆m the mass change. TheSauerbrey equation is valid as long as the film deposited is sufficientlyrigid, i.e as long as the change in dissipation is small [54]. The massesreported were obtained using the third frequency overtone.
2.5 Cylindrical Ultramicroelectrodes(UME)
The UME cells were assembled in house utilizing carbon fibers (CF)or a gold wire as working electrode (WE) (table 2.1) The 5.5 µm CFwas covered with epoxy, a so called sizing, that was removed by wash-ing it with acetone. The 2.5 µm CF was unsized and used withoutwashing. In the manufacturing, one end of the WE was attached to acopper current collector by silver glue. The copper current collector,with the WE attached to it, was covered with a thermoplastic (3M)and placed inside a polyethylene pouch cell. The polyethylene pouchcell and thermoplastic were then welded so that the current collectorand silver glue were encapsulated inside the thermoplastic, only expos-ing 15 mm of the WE to the electrolyte. The welding turned out to bea key step for making functioning cells. When performed incorrectly,electrolyte would enter between the WE and the thermoplastic, ulti-mately leading to tilted cyclic voltammograms. The counter electrodeconsisted of aluminum coated LiFePO4 (see 2.6). The UME cell wasassembled inside an argon glove box and placed in a vial containing 3ml of electrolyte, i.e. there was an excess of electrolyte and semi-infinitediffusion conditions could be assumed. The vial (with electrolyte andultramicroelectrode cell) was placed inside a glass jar with gas inletsin the lid.

14 CHAPTER 2. EXPERIMENTAL
Precursor Manufacturer RadiusCF Polyacrylonitrile Toho Tenax IMS65 2.5CF Tar pitch Dialed, K63712 5.5
Gold wire Metallic gold Advent 7.5
Table 2.1: The materials for the different cylindrical ultramicroelectrodes used.
2.6 Formation of the LiFePO4 CounterElectrodes
The counter electrode used for the UME and EQCM measurementsconsisted of a LiFePO4 film coated on aluminum foil. The LiFePO4was chosen to ensure stability of the counter electrode towards thesolvent [25]. Before placing the LiFePO4 electrode inside the UME orEQCM cell it underwent a formation cycling in a Li(m) half cell untilreproducible behavior was seen, typically three full cycles. At the endof the formation cycling the LiFePO4 electrode was left at 50 % state-of-charge (SOC) where the potential was 3.44 V vs. Li+/Li(m), thispotential was used to relate the WE potential to Li+/Li(m). As boththe UME and EQCM cell consisted of only two electrodes, the counterelectrode also served as reference electrode. In order to minimize thepolarization of the LiFePO4 electrode it was deliberately designed withexcess capacity, for the EQCM and UME the LiFePO4 electrode thecapacities, at 50 % SOC, were 2.25 and 1.5 mAh, respectively, typicalcapacities seen during reduction for the EQCM gold electrode and theultramicroelectrode WE were 10−6 and 10−8 mAh, respectively.
2.7 ChemicalsThe salts used were lithium bis(trifluoromethane)sulfonimide (LiTFSI,Sigma-Aldrich, 99.95 %), lithium perchlorate (LiClO4, Sigma-Aldrich,99.99 %), lithium trifluoromethanesulfonate (LiTf, Sigma-Aldrich, 99.995%), and tetrabutylammonium hexafluorophosphate (TBAPF6, Sigma-Aldrich, 98 %). As solvents dimethyl sulfoxide (DMSO, SigmaAldrich,Anhydrous) was used as well as three room temperature ionic liquids

2.7. CHEMICALS 15
(RTIL): N-ethyl-N-methyl-imidazoleum-TFSI (EMI-TFSI, Solvionic, 99.9% purity), N-propyl-N-methyl-pyrrolidinium-TFSI (Pyr13-TFSI, Solvionic,99.9 % purity), and N-propyl-N-methyl-piperidinium-TFSI (Pip13-TFSI,Solvionic, 99.9 % purity). The organic carbonate electrolyte consistedof LiTFSI salt in ethylene carbonate:diethyl carbonate (EC:DEC) witha 1:1 weight ratio (Novolyte, battery grade). All RTIL electrolytes con-tained 1.0 M Li-TFSI, for the DMSO and EC:DEC electrolytes the saltcontent was varied. All chemicals were used as received.


Chapter 3
Results and Discussion
3.1 Lithium Mass TransportWhen evaluating the Li+ mass transport the diffusion resistivity waslarger than the ohmic resistivity for all electrolytes examined (table3.1). Thus, when the concentration gradients in the electrolyte reachedsteady state, the polarizations from migration and diffusion were largerthan the ohmic polarization.
Electrolyte Diffusion OhmicSolvent Resistivity Resistivity
/ Ω·m / Ω·mEC:DEC 3.0±0.8 1.5DMSO 4.6±1.6 1.0
EMI-TFSI 91±9 3Pyr13-TFSI 220±10 10Pip13-TFSI 590±50 31
Table 3.1: The mean diffusion and ohmic resistivity of the various electrolytes testedcontaining 1 M Li-TFSI. The diffusion resistivities are reported with their standard devi-ations.
As the electrolytes based on EC:DEC and DMSO showed similarohmic and diffusion resistivity it can be concluded that DMSO is a suit-able electrolyte for Li-O2 batteries from a mass transport perspective
17

18 CHAPTER 3. RESULTS AND DISCUSSION
(figure 3.1). The lowest electrolyte mass transport resistivity (EMTR)was observed at concentrations above 0.5 M Li-TFSI. Lower concentra-tions resulted in higher EMTR, thus, suggesting that the mass trans-port of Li+ will play a larger role as its concentration decreases. Aresistivity vs. concentration graph was produced by Nyman et al. froma full characterization of LiPF6 in 3:7 EC:EMC [50] displaying simi-lar results, although the diffusion resistivity is slightly higher in thepresent study, which might be due to a larger anion inhibiting masstransport. This confirms that the method applied here provides resultsequivalent to those obtained from complex full characterizations basedon physical models.
0.2 0.4 0.6 0.8 1 1.2 1.4 1.6
5
10
15
20
25
Concentration / mol dm-3
EMT
R/
Ωm
EC:DECDMSO
Figure 3.1: The EMTR for DMSO and EC:DEC, respectively, at different LiTFSI con-centrations.
For the room temperature ionic liquid (RTIL) electrolytes the totalpolarization was dominated by the diffusion resistivity. For example,for EMI-TFSI the ohmic resistivity was twice as high and the diffusionresistivity ∼30 times as high when compared with EC:DEC. Whenmixing EMI-TFSI with EC:DEC the ohmic and the diffusion resistivityincreased with EMI-TFSI content, with the diffusion resistivity beingfar greater in magnitude at high EMI-TFSI content (figure 3.2).
The time needed for the diffusion polarization to reach a steadystate depends on the inter-electrode distance, electrolyte, and the po-

3.1. LITHIUM MASS TRANSPORT 19
1.5
2
2.5
3
Ohm
icR
esist
ivity
/Ω
m
0
25
50
75
100
Diff
usio
nR
esist
ivity
/Ω
m
0 20 40 60 80 100
EMI-TFSI in solvent / vol.%1 : 10 1 : 8 1 : 6 1 : 4 1 : 2 1 : 0
Li+:(EC:DEC) Molar Ratio
Figure 3.2: Ohmic and diffusion resistivity of electrolytes consisting of 1 M LiTFSI in asolvent mixture of EC:DEC and EMI-TFSI. , The first bottom x-axis shows the volumecontent of EMI-TFSI in the solvent, the second x-axis shows the Li+:(EC:DEC) molarratio assuming that Li+ prefers coordination to EC:DEC over EMI-TFSI for the entirerange.
larization current. In the galvanostatic polarization experiments, cur-rents varying by one order of magnitude was needed in order to getdiffusion polarizations within the desired range of 5 to 50 mV. There-fore, the time needed to reach steady state also varied by one orderof magnitude with larger currents needing more time. The diffusionpolarization for the electrolytes based on EC:DEC and DMSO typi-cally reached steady state within 10 to 20 minutes for polarizations of10 mV. For the RTILs this time was typically 4 to 20 hours. Keepin mind that the test cell had an interelectrode distance of 500 µm
20 CHAPTER 3. RESULTS AND DISCUSSION
and if it was to be reduced one order of magnitude, to better agreewith a real battery, then the time would be reduced by two orders ofmagnitude (according to Fick’s second law). This would correspond to2-12 min for the electrolytes based on the RTILs and 6-12 seconds forthose based on EC:DEC and DMSO. Further, the time needed for thediffusion resistivity to equal the ohmic resistivity would be typicallyfive seconds for the RTIL based electrolytes and 1-2 seconds for theelectrolytes based on EC:DEC and DMSO. This indicates that lossesdue to concentration gradients in a Li battery must be considered inmost usage scenarios where energy efficiency and high power density isimportant.
A molecular explanation of the large diffusion resistivity for RTILsmight be found in how the Li-ion solvation shell is influenced by theRTIL concentration. In the presence of ethylene carbonate the predom-inant Li-solvent complex is [Li(EC)4]+. [55] This is also the preferen-tial coordination of Li+ in mixed EC:EMI-TFSI electrolytes consistingof 0.5 M LiTFSI and 2 M EC, i.e. for a Li+:EC molar ratio of 1:4.[56, 57]. An EMI-TFSI solvent content of 58 vol.% (EC:DEC contentof 42 vol.%) corresponds to a Li+:(EC:DEC) molar ratio of 1:4. Athigher EMI-TFSI concentration the EC:DEC in the solvation shell isreplaced by TFSI anions, changing the charge of the Li-ion complexfrom positive to negative. In fact, at an EMI-TFSI content of ~60vol.% there is a steep increase in diffusion resistivity, thus, suggestingthat the solvation of Li+ will influence its mass transport properties(figure 3.2). When no EC:DEC is present the coordination numberof Li+ is a little bit lower than two suggesting that the predominantcoordination complex is [Li(TFSI)2]– . [58] As [Li(TFSI2)]– would mi-grate in the opposite direction of [Li(EC)4]+ the only mode of Li-iontransport in the preferred direction would be diffusion resulting in largediffusion resistivity. For RTILs the diffusion and migration propertiesare often ignored, however, this study shows that, even when presentin small quantities, the mass transport in RTIL electrolytes need to bequantified as only presenting conductivity can be misleading.

3.2. OXYGEN SOLUBILITY 21
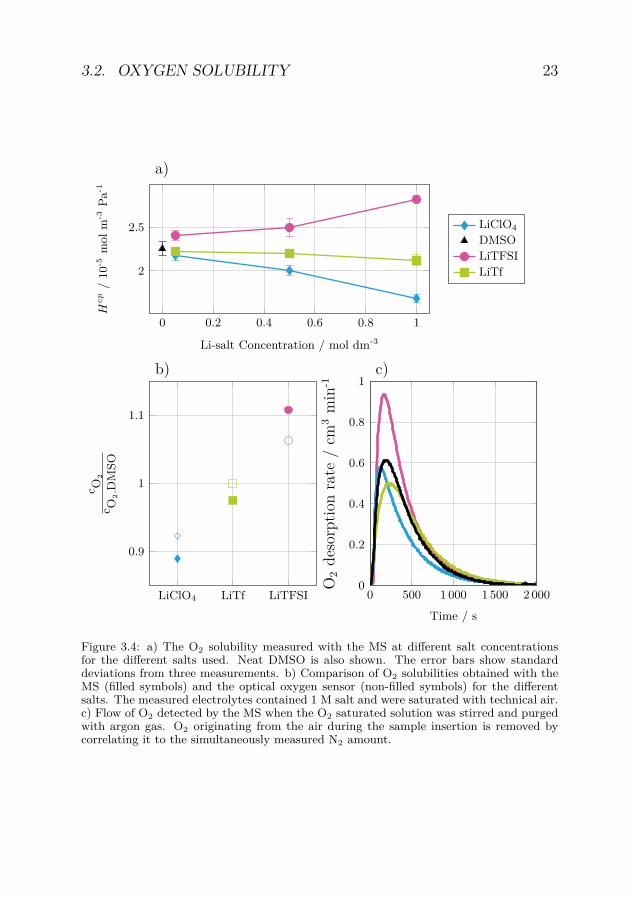
3.2 Oxygen solubilityThe solubility of O2 in DMSO electrolytes based on LiTFSI, LiTf, andLiClO4 was quantified by calculating Hcp from equation 1.8 using anMS. For DMSO-based electrolytes, the O2 concentration increases lin-early with partial pressure up to at least 1 atm, thus, confirming thatHenry’s law is valid within this pressure interval (figure 3.3). This hasalso been confirmed previously. [59] The Li-salt had a clear influenceon the O2 solubility with values diverging further from neat DMSOas the Li-salt concentration increased (figure 3.4a). However, the saltsexamined showed quite different solubility trends. For the LiClO4 elec-trolytes the O2 solubility decreased with increased salt concentration.For the LiTf electrolytes, the O2 solubility did also decrease with in-creasing salt concentration, but not to the same extent as for LiClO4.In contrast to LiClO4 and LiTf, the O2 solubility in the LiTFSI elec-trolytes increased with increasing salt concentration. As LiTFSI andLiClO4 are two of the most used salts in Li-O2 battery electrolytes,it is worth noting that the electrolytes containing LiTFSI had a 68 %higher O2 solubility than when LiClO4 was used at salt concentrationsof 1 M.
As a second method to assess the O2 solubility trend, an opticaloxygen sensor was used (figure 3.4b). The solubility trend obtained by
0 0.2 0.4 0.6 0.8 10
1
2
O2 Pressure / atm
O2
Con
cent
ratio
n/
mm
oldm
-3
Figure 3.3: The dissolved O2 concentration at different partial pressures for 0.5 M LiTFSIin DMSO. The concentrations were measured with an MS.

22 CHAPTER 3. RESULTS AND DISCUSSION
the optical sensor matched that obtained by the MS with solubilitiesincreasing with addition of LiTFSI and decreasing with addition ofLiClO4 (figure 3.4b).
The solubility of O2 in the electrolytes agree well with previouslyreported values, e.g. Henry’s constant has been measured to 1.83·10−5
mol m−3Pa−1 for neat DMSO using volumetric measurements [45] andto 1.58·10−5 mol m−3Pa−1 for 1 M LiClO4 in DMSO in a flow cellcoupled to a mass spectrometer, [59] to compare with 2.25·10−5 and1.68·10−5 mol m−3Pa−1 measured in this study, respectively. Muchlower values have been observed using RRDE with solubilities about2.5 times lower than those observed in this study at 1 M Li-salt concen-trations. [30] However, electrochemical measurements, such as RRDE,are likely to suffer from passivation, resulting in a suppressed currentthat might explain the underestimated O2 solubilities.
The difference in solubility is believed to be related to the samephysico-chemical process for all electrolytes as they possess the sameO2 desorption kinetics with detection curves having one large initialpeak followed by a longer tail (figure 3.4c). Note, that the peak shapedO2 desorption curve is caused by the geometry of the MS reactionvessel, i.e. extracting desorption kinetics parameters would not bestraightforward as the geometry would also need to be considered.
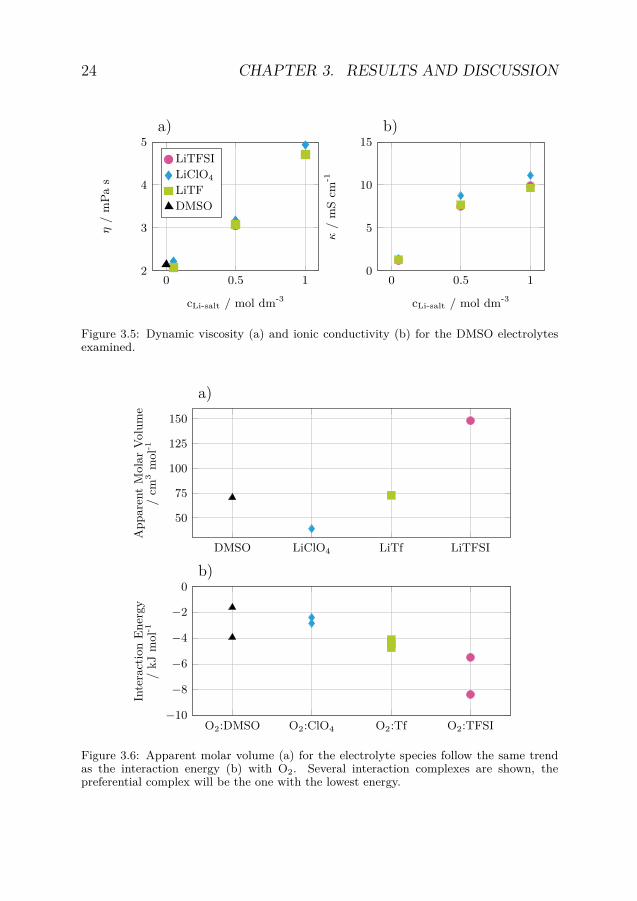
Neither the dynamic viscosity, η, nor the ionic conductivity, κ, ofthe electrolytes followed the same trend as the observed Hcp (figure 3.5aand 3.5b). For the LiTFSI and LiTf electrolytes κ and η were almostidentical while the LiClO4 electrolytes showed slightly larger values forall salt concentrations measured. At low concentration of LiTFSI andLiTf, η decreased compared to neat DMSO; for the LiClO4 electrolytesit increased with the addition of salt. As κ was comparable for all salts,at each salt concentration, thus, it is likely so that the observed trendsin Hcp cannot be explained in terms of dissociation of the salts. Bothtrends in apparent molar volume and O2 interaction energy, calculatedby density functional theory (DFT), matches the solvation trend amongthe salts with LiTFSI having both the largest apparent molar volumeand the most stable O2 interaction (figure 3.6a and 3.6b). Thus, sug-gesting that the size of the anion and its interaction with O2 might bewhat influences whether the O2 solubility will increase or not.
3.2. OXYGEN SOLUBILITY 23
0 0.2 0.4 0.6 0.8 1
2
2.5
Li-salt Concentration / mol dm-3
Hcp
/10
-5m
olm
-3Pa
-1
a)
LiClO4
DMSOLiTFSILiTf
LiClO4 LiTf LiTFSI
0.9
1
1.1
c O2
c O2
,DM
SO
b)
0 500 1 000 1 500 2 0000
0.2
0.4
0.6
0.8
1
Time / s
O2
deso
rptio
nra
te/
cm3
min
-1
c)
Figure 3.4: a) The O2 solubility measured with the MS at different salt concentrationsfor the different salts used. Neat DMSO is also shown. The error bars show standarddeviations from three measurements. b) Comparison of O2 solubilities obtained with theMS (filled symbols) and the optical oxygen sensor (non-filled symbols) for the differentsalts. The measured electrolytes contained 1 M salt and were saturated with technical air.c) Flow of O2 detected by the MS when the O2 saturated solution was stirred and purgedwith argon gas. O2 originating from the air during the sample insertion is removed bycorrelating it to the simultaneously measured N2 amount.
24 CHAPTER 3. RESULTS AND DISCUSSION
0 0.5 12
3
4
5
cLi-salt / mol dm-3
η/
mPa
s
a)
LiTFSILiClO4
LiTFDMSO
0 0.5 10
5
10
15
cLi-salt / mol dm-3
κ/
mS
cm-1
b)
Figure 3.5: Dynamic viscosity (a) and ionic conductivity (b) for the DMSO electrolytesexamined.
DMSO LiClO4 LiTf LiTFSI
50
75
100
125
150
App
aren
tM
olar
Volu
me
/cm
3m
ol-1
a)
O2:DMSO O2:ClO4 O2:Tf O2:TFSI−10
−8
−6
−4
−2
0
Inte
ract
ion
Ener
gy/
kJm
ol-1
b)
Figure 3.6: Apparent molar volume (a) for the electrolyte species follow the same trendas the interaction energy (b) with O2. Several interaction complexes are shown, thepreferential complex will be the one with the lowest energy.
3.3. ELECTROCHEMICAL EVALUATION OF THE REACTIONMECHANISM 25
Electrode Material Radius Coulombic Efficiencyr / µm Qc/Qa
Planar EQCM Gold - 0.29UME Gold 7.5 0.19UME CF 5.5 0.10UME CF 2.5 0.04
Table 3.2: The coulombic efficiency, defined as the amount of anodic charge divided bythe reduction charge, of all electrodes used in 0.5 M LiTFSI DMSO electrolytes saturatedwith 1 atm O2 at a sweep rate of 10 mV/s.
3.3 Electrochemical Evaluation of theReaction Mechanism
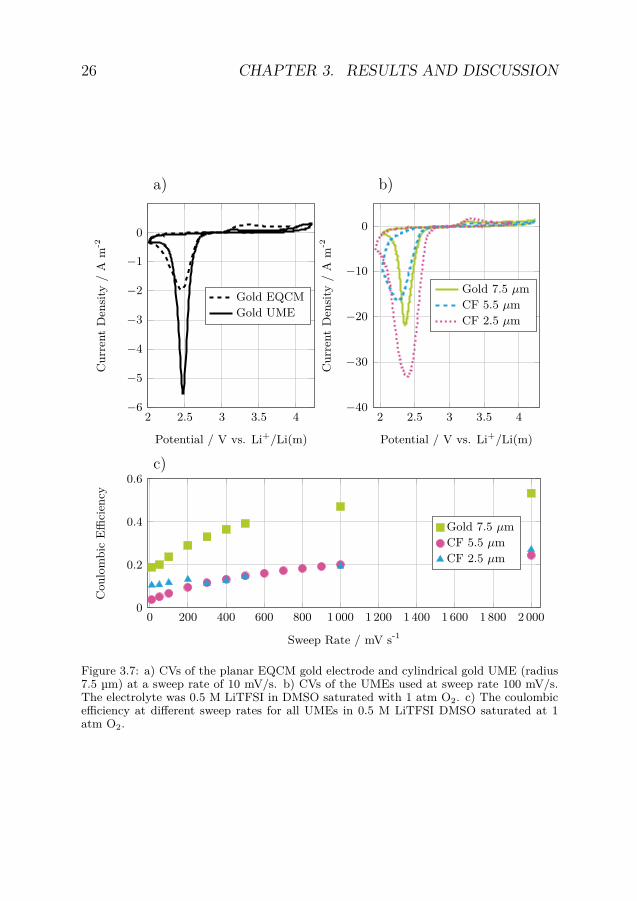
When evaluating the reaction mechanism two types of electrodes wereused: a planar gold electrochemical quartz crystal microbalance (EQCM)electrode with ability to measure change in electrode mass in-situ andcylindrical ultramicroelectrodes (UME), consisting of either a gold wireor a carbon fiber (CF), with enhanced mass transport and a well-defined geometry. As these two systems differ in electrode geometrytheir current response will also differ with higher reduction and loweroxidation current densities for the cylindrical UMEs compared with theplanar EQCM electrodes (figure 3.7a).
As the potential was swept in a negative direction in the CV ex-periments, a current starting at 2.8 V vs. Li+/Li(m), was seen corre-sponding to the reduction of oxygen (figure 3.7b). As this study usedDMSO as solvent, the reduced oxygen would proceed to form Li2O2, viathe soluble LiO2 intermediate, in a solution mediated electrochemical-chemical (EC) reaction. [29] When the negative turn potential wasreached the sweep direction was reversed. At potentials higher than 2.9V vs. Li+/Li(m) an oxidation current was observed. This correspondsto the oxidation of the reduced oxygen species (LiO2 and Li2O2).
The influence of electrode geometry was significant with the planarEQCM electrodes showing larger coulombic efficiencies than the UMEs(table 3.2). The influence of CF electrode radius was very small as theCFs with 2.5 and 5.5 µm radius showed very similar coulombic efficien-
26 CHAPTER 3. RESULTS AND DISCUSSION
2 2.5 3 3.5 4
0
−1
−2
−3
−4
−5
−6
Potential / V vs. Li+/Li(m)
Cur
rent
Den
sity
/A
m-2
a)
Gold EQCMGold UME
2 2.5 3 3.5 4−40
−30
−20
−10
0
Potential / V vs. Li+/Li(m)
Cur
rent
Den
sity
/A
m-2
b)
Gold 7.5 µmCF 5.5 µmCF 2.5 µm
0 200 400 600 800 1 000 1 200 1 400 1 600 1 800 2 0000
0.2
0.4
0.6
Sweep Rate / mV s-1
Cou
lom
bic
Effici
ency
c)
Gold 7.5 µmCF 5.5 µmCF 2.5 µm
Figure 3.7: a) CVs of the planar EQCM gold electrode and cylindrical gold UME (radius7.5 µm) at a sweep rate of 10 mV/s. b) CVs of the UMEs used at sweep rate 100 mV/s.The electrolyte was 0.5 M LiTFSI in DMSO saturated with 1 atm O2. c) The coulombicefficiency at different sweep rates for all UMEs in 0.5 M LiTFSI DMSO saturated at 1atm O2.

3.3. ELECTROCHEMICAL EVALUATION OF THE REACTIONMECHANISM 27
cies at most sweep rates (figure 3.7c). However, the electrode materialdid influence the coulombic efficiency with gold UMEs showing largercoulombic efficiency compared with the CFs. Also, the reduction cur-rent onset potential was shifted depending on electrode material withlower values for CF electrodes with 2.5 µm radius compared with CFelectrodes with 5.5 µm radius (figure 3.7b). This shift in current onsetmight be due to a change in exchange current density, i0, suggestingthat the two CFs have different catalytic properties that might be ex-plained by their different precursors (polyacrylonitrile for the 2.5 µmCF and tar pitch for the 5.5 µm CF).
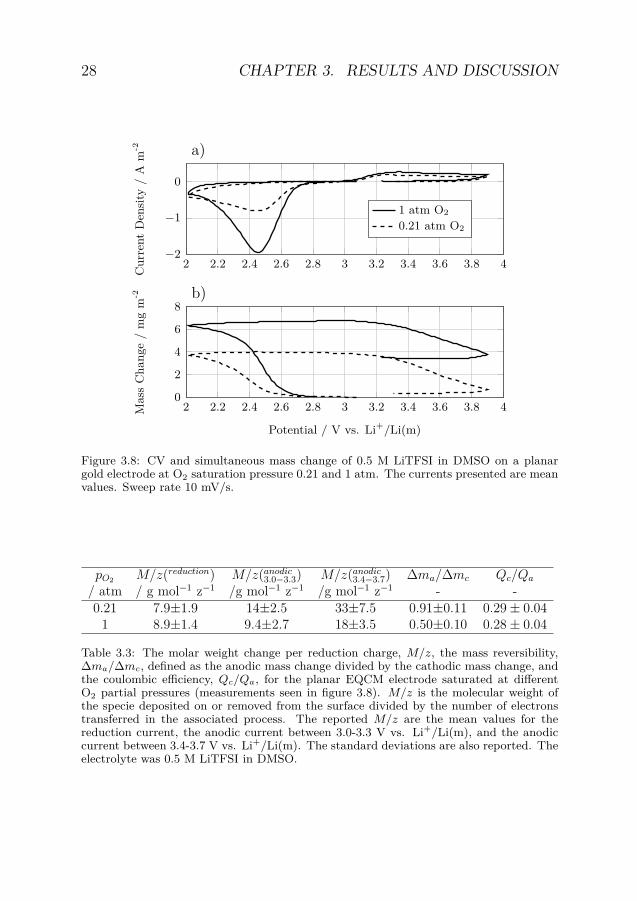
During the reduction the electrode mass increased as a consequenceof reaction product deposition (figure 3.8). The mass change per elec-tron transferred, M/z, was small indicating that only parts of the re-duced specie ended up on the electrode (table 3.3). Furthermore, thespecies formed on the surface will be oxidized to a much larger extentthan the total amount of species formed during the reduction as themass reversibility is a lot larger than the coulombic efficiency.
This observation is in line with the proposed mechanism wheresoluble LiO2 is formed as an intermediate that can be transportedaway from the electrode [29, 42]. The suggested reduction mechanismis therefore formation of soluble LiO2 which partly proceeds to forma Li2O2 deposit on the electrode. Assuming that these species arethe only ones formed the reduction product ratio is 65:35 for LiO2and Li2O2. From combined CV and UV absorbance measurementscorresponding product ratio was determined to be 73:27 for LiO2 andLi2O2 [60].
Reduction Rate LawWhen studying the electrochemical reaction the overpotential, η, wasdefined as:
η = ELi2O2|Li(m) − E0 (3.1)
where E0 is the standard electrode potential at cLi+0= 1 M and cO2,0=
Hcp · pO2,0 (pO2,0 = 1 bar) corresponding to 2.91 V vs Li+/Li(m). The
28 CHAPTER 3. RESULTS AND DISCUSSION
2 2.2 2.4 2.6 2.8 3 3.2 3.4 3.6 3.8 4−2
−1
0
Cur
rent
Den
sity
/A
m-2 a)
1 atm O2
0.21 atm O2
2 2.2 2.4 2.6 2.8 3 3.2 3.4 3.6 3.8 40
2
4
6
8
Potential / V vs. Li+/Li(m)
Mas
sC
hang
e/
mg
m-2 b)
Figure 3.8: CV and simultaneous mass change of 0.5 M LiTFSI in DMSO on a planargold electrode at O2 saturation pressure 0.21 and 1 atm. The currents presented are meanvalues. Sweep rate 10 mV/s.
pO2 M/z(reduction) M/z(anodic3.0−3.3) M/z(anodic
3.4−3.7) ∆ma/∆mc Qc/Qa
/ atm / g mol−1 z−1 /g mol−1 z−1 /g mol−1 z−1 - -0.21 7.9±1.9 14±2.5 33±7.5 0.91±0.11 0.29 ± 0.04
1 8.9±1.4 9.4±2.7 18±3.5 0.50±0.10 0.28 ± 0.04
Table 3.3: The molar weight change per reduction charge, M/z, the mass reversibility,∆ma/∆mc, defined as the anodic mass change divided by the cathodic mass change, andthe coulombic efficiency, Qc/Qa, for the planar EQCM electrode saturated at differentO2 partial pressures (measurements seen in figure 3.8). M/z is the molecular weight ofthe specie deposited on or removed from the surface divided by the number of electronstransferred in the associated process. The reported M/z are the mean values for thereduction current, the anodic current between 3.0-3.3 V vs. Li+/Li(m), and the anodiccurrent between 3.4-3.7 V vs. Li+/Li(m). The standard deviations are also reported. Theelectrolyte was 0.5 M LiTFSI in DMSO.
3.3. ELECTROCHEMICAL EVALUATION OF THE REACTIONMECHANISM 29
electrode potential, ELi2O2|Li(m), at Li+ concentration, cLi+ , was corre-lated to the LiFePO4 reference electrode by:
ELi2O2|Li(m) = ELi2O2|cLi+ |LiFePO4 + 0.059 log10(cLi+) + ELiFePO4|1M |Li(m) (3.2)
where ELi2O2|cLi+ |LiFePO4 is the measured cell potential and ELiFePO4|1M |Li(m)is measured to 3.4096 V.
The cell reaction can then be described by Butler-Volmer’s equationin the following form:
i = nFk1cγLi2O2Li2O2 exp
((1−β)·nF
RTELi2O2|Li(m)
)
−nFk−1cγLi+Li+ c
γO2O2 exp
(−βnF
RTELi2O2|Li(m)
)(3.3)
where i is the current density, γ the reaction order, β the asymmetrycoefficient, F Faraday’s constant, R the ideal gas constant, and T theabsolute temperature.
The exchange current density, i0, is defined at the standard state:
i0 = nFk−1cγLi+
Li+0c
γO2O2,0 exp
(−βnF
RTE0)
(3.4)
Adding eq. 3.1, 3.3 and 3.4 for the cathodic term:
i = −i0cγLi+Li+ c
γO2O2 exp
(−βnF
RTη
)(3.5)
where c is the concentration normalized by the standard state con-centration. At high overpotentials this yields Tafel’s equation in thefollowing form:
ln(−i) = ln[i0c
γLi+Li+ c
γO2O2 exp
(−βnF
RTη
)](3.6)
log10(−i) = log10(i0) + γO2 log10(cO2) + γLi+ log10(cLi+) − βF2.303RT
η (3.7)
30 CHAPTER 3. RESULTS AND DISCUSSION
log10
( i / A m-2)-0.4 -0.2 0.2 0.4 0.6 0.80
Over
pote
nti
al /
V
-0.33
-0.31
-0.29
-0.27
0.21 atm, 0.5 M
1 atm, 0.5 M1 atm, 0.05 M
0.21 atm, 0.05 M
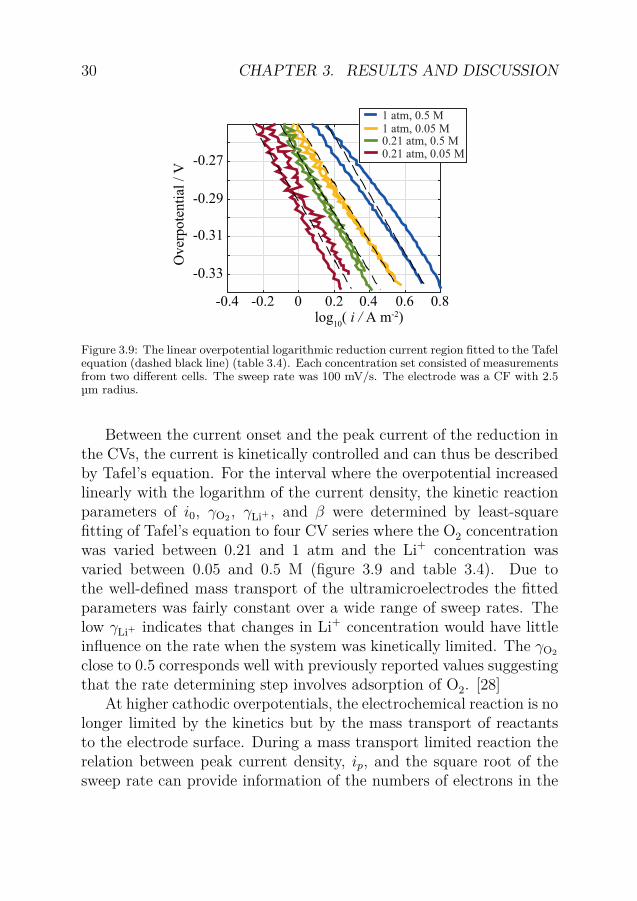
Figure 3.9: The linear overpotential logarithmic reduction current region fitted to the Tafelequation (dashed black line) (table 3.4). Each concentration set consisted of measurementsfrom two different cells. The sweep rate was 100 mV/s. The electrode was a CF with 2.5µm radius.
Between the current onset and the peak current of the reduction inthe CVs, the current is kinetically controlled and can thus be describedby Tafel’s equation. For the interval where the overpotential increasedlinearly with the logarithm of the current density, the kinetic reactionparameters of i0, γO2 , γLi+ , and β were determined by least-squarefitting of Tafel’s equation to four CV series where the O2 concentrationwas varied between 0.21 and 1 atm and the Li+ concentration wasvaried between 0.05 and 0.5 M (figure 3.9 and table 3.4). Due tothe well-defined mass transport of the ultramicroelectrodes the fittedparameters was fairly constant over a wide range of sweep rates. Thelow γLi+ indicates that changes in Li+ concentration would have littleinfluence on the rate when the system was kinetically limited. The γO2
close to 0.5 corresponds well with previously reported values suggestingthat the rate determining step involves adsorption of O2. [28]
At higher cathodic overpotentials, the electrochemical reaction is nolonger limited by the kinetics but by the mass transport of reactantsto the electrode surface. During a mass transport limited reaction therelation between peak current density, ip, and the square root of thesweep rate can provide information of the numbers of electrons in the

3.3. ELECTROCHEMICAL EVALUATION OF THE REACTIONMECHANISM 31
ν i0 γO2 γLi+ βmV s−1 A m−2
10 0.026 0.58 0.23 0.16100 0.083 0.61 0.38 0.151000 0.15 0.46 0.37 0.14
Table 3.4: Fitted kinetic parameters of the reduction reaction in the linear overpotentiallogarithmic current region. The data for 100 mV s−1 is shown in figure 3.9.
reaction formula, n, the diffusion coefficient, D, and the reaction order,γ. 1 For a change in reactant concentration, assuming constant valuesof D and n, this relation can be written as the proportionality:
ip ∝ cγ√
ν (3.8)
Thus, the reaction order can be obtained by examining how ip iseffected when varying the concentrations of Li+ and O2. By varyingthe O2 concentration between 0.21 and 1 atm, at an excess Li+ con-centration of 0.5 M, the reaction order for O2 was found by minimizingthe difference between the proportionalities at each concentration:
χ2 = min∑[ip(1atm)
ν1/2(1atm)·cγO2
(1atm) − ip(0.21atm)ν1/2(0.21atm)·cγ
O2(0.21atm)
](3.9)
γO2 was determined to 0.99 by finding the minimum of equation 3.9using the MATLAB function fminsearch. Thus, the reaction orderwith respect to O2 is 1 during mass transport limitation. This agreeswith previously reported reaction orders for O2. [61] When ip is plottedversus cO2
√ν at 0.21 and 1 atm it does indeed follow the same curved
line (figure 3.10). The Li+ reaction order was determined by varyingthe Li+ concentration between 0.04 mM and 0.20 mM at an excess O2
1For a fast electron transfer, Ox+ne− → Red, this relation equals the Randles-Sevcik equation:
−ip = 2.69 · 105n3/2D1/2ox coxν1/2
For slow electron transfers this relation can be written as:−ip = 3.01 · 105n3/2β1/2D
1/2ox coxν1/2
where β is the asymmetry factor.
32 CHAPTER 3. RESULTS AND DISCUSSION
0 50 100 150−60
−40
−20
0
√ν
/ mV1/2 s-1/2
Peak
Cur
rent
Den
sity
/A
m-2 a)
1 atm O2
0.21 atm O2
0 25 50 75 100√
ν · cO2
/ mV1/2 s-1/2 mol dm-3
b)
0 10 20 30√
ν
/ mV1/2 s-1/2
c)
0.04 mM Li+
0.2 mM Li+
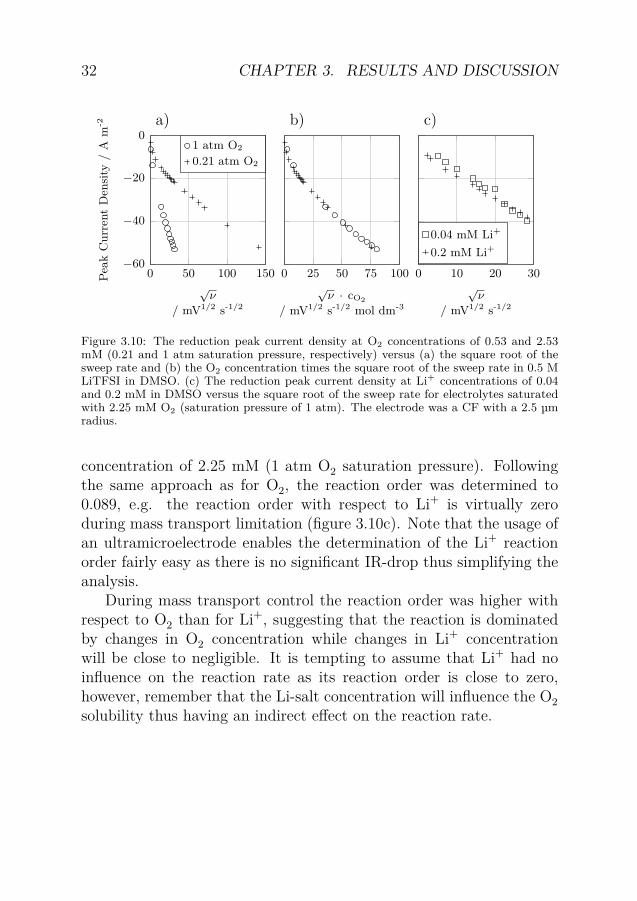
Figure 3.10: The reduction peak current density at O2 concentrations of 0.53 and 2.53mM (0.21 and 1 atm saturation pressure, respectively) versus (a) the square root of thesweep rate and (b) the O2 concentration times the square root of the sweep rate in 0.5 MLiTFSI in DMSO. (c) The reduction peak current density at Li+ concentrations of 0.04and 0.2 mM in DMSO versus the square root of the sweep rate for electrolytes saturatedwith 2.25 mM O2 (saturation pressure of 1 atm). The electrode was a CF with a 2.5 µmradius.
concentration of 2.25 mM (1 atm O2 saturation pressure). Followingthe same approach as for O2, the reaction order was determined to0.089, e.g. the reaction order with respect to Li+ is virtually zeroduring mass transport limitation (figure 3.10c). Note that the usage ofan ultramicroelectrode enables the determination of the Li+ reactionorder fairly easy as there is no significant IR-drop thus simplifying theanalysis.
During mass transport control the reaction order was higher withrespect to O2 than for Li+, suggesting that the reaction is dominatedby changes in O2 concentration while changes in Li+ concentrationwill be close to negligible. It is tempting to assume that Li+ had noinfluence on the reaction rate as its reaction order is close to zero,however, remember that the Li-salt concentration will influence the O2solubility thus having an indirect effect on the reaction rate.

3.3. ELECTROCHEMICAL EVALUATION OF THE REACTIONMECHANISM 33
Oxidation MechanismWhen examining the M/z for the oxidation it is best divided into tworegions: 1) a lower potential part, ranging from the current onset at3.0 V vs. Li+/Li(m) up to the end of the oxidation peak at 3.3 V vs.Li+/Li(m), with the largest oxidation current but with little change indeposited mass and 2) a higher potential part, from 3.4 to 3.7 V vs.Li+/Li(m), where the current is lower and most of the reversible massis removed (figure 3.8). The reaction path of the oxidation has previ-ously been studied with operando X-ray diffraction [62] and potentio-static intermittent titration technique [63] with results suggesting thatbelow 3.4 V vs Li+/Li(m) surface de-lithiation of Li2O2 is taking place.Raman measurements suggested that below 3.5 V vs. Li+/Li(m) theLiO2-like surface of Li2O2 is oxidized [64]. There was an O2 concentra-tion dependence of the M/z with more mass is transferred in relationto charge at lower O2 concentration than at high O2 concentration.Further, there was also a clear difference between the two oxidationregions with M/z values being twice as large at the high potential endof the oxidation. Below 3.4 V vs. Li+/Li(m) a high amount of charge isbeing transferred in relation to the amount of mass. This may be inter-preted as de-lithiation of Li2O2 to form Li-deficient Li2O2, which agreeswith previous findings [62, 63]. Above 3.4 V vs. Li+/Li(m) the M/zanalysis leads to two separate reaction paths for the different O2 con-centrations. When saturated with 1 atm O2 the reversible mass seemsto consist of Li2O2, when saturated with 0.21 atm O2 the reversiblemass change seems to be due to a “LiO2-like” specie being oxidized.At potentials above 3.4 V vs. Li+/Li(m) a two-phase oxidation of bulkLi2O2 [63] and oxidation of crystalline Li2O2 [62] have been reported.Two possible reasons for why the high potential region oxidation pro-duces two different reaction paths might be that the reduction productis not stoichiometric [20, 64] and also that the O2 concentration has aneffect. The O2 concentration dependence is likely indirect as the oxida-tion will be effected by the size and morphology of the Li2O2 particlesformed during the reduction (which in turn depends on the amount ofO2 available). At low O2 concentration the deposited mass is lower,and the particles formed are likely smaller.

34 CHAPTER 3. RESULTS AND DISCUSSION
3.2 3.4 3.6 3.80
20
40
60
Li
Li2O2
LiO2
Potential / V vs. Li+/Li(m)
Mas
spe
rEl
ectr
on/
gm
ol-1
z-1 a)
3.2 3.4 3.6 3.8Li
Li2O2
LiO2
Potential / V vs. Li+/Li(m)
b)
Figure 3.11: The black line shows the average M/z during the oxidation of the CVsin figure 3.8. The standard deviation is represented by the shaded area. Electrolytessaturated at (a) 0.21 atm and (b) 1 atm O2. The horizontal guide lines show the M/z forLi, LiO2, and Li2O2.

3.4. ELECTRODE SURFACE PASSIVATION 35
3.4 Electrode surface passivationOn the EQCM electrode there was a build-up of reaction product onthe surface as the mass did not return to its initial value after theCV is completed (figure 3.8). During the cathodic sweep the electrodemass increased, corresponding to the formation of Li2O2, however, dur-ing the anodic sweep all reduction product was not removed from theelectrode surface. Furthermore, the mass reversibility was higher atlow O2 concentration than at high O2 concentration, this might beexplained by the fact that less mass was deposited at lower concen-tration. A consequence of the poor mass reversibility was that thereduction product was accumulated on the electrode surface as severalcycles were measured (figure 3.12). Thus, this build up would furthercomplicate the reduction and oxidation processes as the electrode sur-face would change after each cycle. Due to the small electrolyte volumeused in the EQCM experiments the latter CVs was likely effected bythe depletion of O2 from the electrolyte as not all O2 was recoveredupon oxidation.
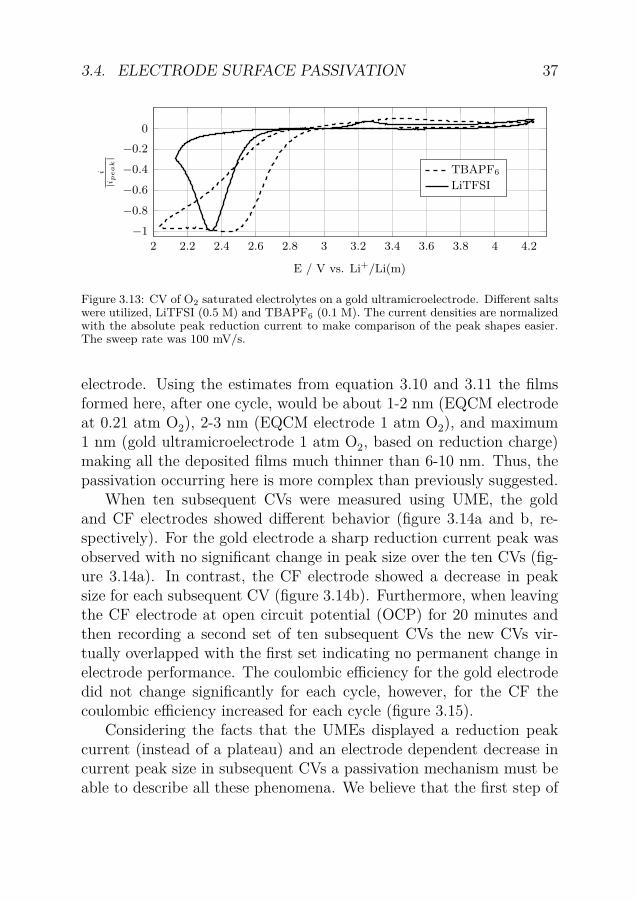
When cylindrical UMEs were used the electrolyte was in excessmaking the O2 concentration constant. Due to the enhanced masstransport the current was expected to reach a limiting plateau in a CVexperiment (opposite to a planar electrode where a peak is expected).However, the reduction currents in the presence of Li+ and O2 didshow a limiting current peak, only when the cation was changed (inthis case to tetrabutylammonium (TBA)) a limiting current plateauwas observed (figure 3.13). The appearance of the peak when LiTFSIwas used is likely due to a passivation phenomenon occurring on theelectrode as there are no limitations in mass transport or changes inconcentrations when the UME was used.
The deposition of Li2O2 on the electrode surface is closely linkedwith the capacity limitation of the electrode as the deposition will ul-timately insulate the electrode preventing further reaction. This hasbeen suggested to occur when the discharge particles reach a thick-nesses of 6-10 nm. [23, 24]. If assuming that the deposit forms auniform film and that the density equals that of bulk Li2O2 then thefilm thickness can be determined by:

36 CHAPTER 3. RESULTS AND DISCUSSION
0 500 1 000 1 500 2 000 2 500 3 000 3 500
0
−0.3
−0.6
Cur
rent
/A
m-2
a)
2468
Thi
ckne
ss/
nm
b)
0 500 1 000 1 500 2 000 2 500 3 000 3 50005
101520
Time / s
Mas
s/
mg
m-2
Figure 3.12: Ten consecutive CV current responses (a) and mass changes (b) in electrolytesaturated with 0.21 atm O2. The thickness is obtained from eq. 3.10. The sweep limitwas 2.2 to 3.9 V vs Li+/Li(m). For clarity the reductions are shown against a whitebackground and the oxidations are shown against a shaded background.
d = m
ρLi2O2A(3.10)
where d is the film thickness, m the mass, ρLi2O2 the density ofbulk Li2O2, and A the area of a planar electrode. Thus, a mass changeof 1 mg / m2 would correspond to a film increase by 0.43 nm (figure3.12). If no mass change can be measured, an estimate of the maximumfilm thickness can be obtained based on the reduction capacity. For acylindrical electrode geometry the film thickness can then be describedby:
d =(
MLi2O2Q
2FρLi2O2πl+ r2
0
)1/2
− r0 (3.11)
where MLi2O2 is the molar weight, Q the accumulated charge, lthe length of a cylindrical electrode, and r0 the radius of a cylindrical
3.4. ELECTRODE SURFACE PASSIVATION 37
2 2.2 2.4 2.6 2.8 3 3.2 3.4 3.6 3.8 4 4.2
0−0.2−0.4−0.6−0.8
−1
E / V vs. Li+/Li(m)
i|i
pe
ak
|
TBAPF6
LiTFSI
Figure 3.13: CV of O2 saturated electrolytes on a gold ultramicroelectrode. Different saltswere utilized, LiTFSI (0.5 M) and TBAPF6 (0.1 M). The current densities are normalizedwith the absolute peak reduction current to make comparison of the peak shapes easier.The sweep rate was 100 mV/s.
electrode. Using the estimates from equation 3.10 and 3.11 the filmsformed here, after one cycle, would be about 1-2 nm (EQCM electrodeat 0.21 atm O2), 2-3 nm (EQCM electrode 1 atm O2), and maximum1 nm (gold ultramicroelectrode 1 atm O2, based on reduction charge)making all the deposited films much thinner than 6-10 nm. Thus, thepassivation occurring here is more complex than previously suggested.
When ten subsequent CVs were measured using UME, the goldand CF electrodes showed different behavior (figure 3.14a and b, re-spectively). For the gold electrode a sharp reduction current peak wasobserved with no significant change in peak size over the ten CVs (fig-ure 3.14a). In contrast, the CF electrode showed a decrease in peaksize for each subsequent CV (figure 3.14b). Furthermore, when leavingthe CF electrode at open circuit potential (OCP) for 20 minutes andthen recording a second set of ten subsequent CVs the new CVs vir-tually overlapped with the first set indicating no permanent change inelectrode performance. The coulombic efficiency for the gold electrodedid not change significantly for each cycle, however, for the CF thecoulombic efficiency increased for each cycle (figure 3.15).
Considering the facts that the UMEs displayed a reduction peakcurrent (instead of a plateau) and an electrode dependent decrease incurrent peak size in subsequent CVs a passivation mechanism must beable to describe all these phenomena. We believe that the first step of

38 CHAPTER 3. RESULTS AND DISCUSSION
2 2.5 3 3.5 4
−20
−10
0
Potential / V vs Li+/Li(m)
Cur
rent
Den
sity
/A
m-2
a)
CV1
CV10
2 2.5 3 3.5 4
−20
−10
0
Potential / V vs Li+/Li(m)
b)
CV1
CV10
CV11
CV20
Figure 3.14: Selected subsequent CVs of 0.5 M LiTFSI at 100 mV/s saturated with 1 atmO2 for a) a gold electrode with 7.5 µm radius and b) a CF electrode with 2.5 µm radius.CV1 shows the first CV recorded, CV10 shows the tenth CV recorded. For the CF in panelb), after CV10 was recorded the cell was left at OCP for 20 minutes and a second set of tensubsequent CVs was recorded with the first and last being CV11 and CV20, respectively.
the reduction likely involves O2 reacting at an electrode surface activesite, Θ, according to:
O2 + e− + Li+ + Θ −−→ ΘLiO2 (3.12)
This would occupy the active site for further reduction, thus caus-ing a depletion of active sites and a peak shaped reduction currentresponse. Once formed on the surface, the residence time of LiO2likely depends on the substrate. On the gold electrode, a short res-idence time of LiO2 could explain the small change in the CV shapeand coulombic efficiency during subsequent cycling as the LiO2 is eitherdesorped or oxidized before the next CV starts. For the CF electrodethe desorption rate of LiO2 would be slower and each cycle would ac-cumulate LiO2 explaining the decrease in peak size between the CVs.This also explains the increase in coulombic efficiency as there would beLiO2 already adsorbed on the surface from the previous cycles makingmore of it available for oxidation. When left at OCP there would beenough time for all LiO2 to desorb or react, thus, explaining why theCF electrode returns to its initial behavior.
Although the active site occupation mechanism suggested here is

3.4. ELECTRODE SURFACE PASSIVATION 39
0 5 10 15 200.15
0.2
0.25
0.3
CV Number
Cou
lom
bic
Effici
ency
Figure 3.15: Coulombic efficiency of each cycle during the subsequent CVs for gold ()and CF () electrodes. After the tenth CV the CF electrode was left at OCP for 20minutes before measuring ten more subsequent CVs.
different from the electron tunneling passivation it should not be viewedas an opposing mechanism. The electron tunneling passivation is likelydominating when larger amount of charge is transferred (as on theEQCM electrodes (figure 3.12)).


Chapter 4
Conclusion
This work has successfully studied the reaction mechanism in Li-O2batteries by considering the Li+ and O2 reactants in the electrolytebulk and their reactions at the O2-electrode surface.
The mass transport of Li+ was evaluated for several next generationLi-battery electrolytes in a quick and convenient way. The importanceof quantifying the diffusion polarization together with the ohmic po-larization is highlighted when trying to estimate the total electrolytepolarization. When a conventional Li-ion battery electrolyte was ex-amined the results showed good agreement with ohmic and diffusionresistivities from a full characterization based on a physical model, thus,validating the method used. Electrolytes based on dimethyl sulfoxide(DMSO) showed mass transport resistivities similar to those of theconventional Li-ion electrolyte, making the DMSO based electrolytessuitable for use in Li-O2 batteries from a mass transport perspective.Electrolytes based on room temperature ionic liquids (RTIL) were un-suitable for Li-battery applications where high power is needed as theyhave very large mass transport resistivities. For all the electrolytes ex-amined, the concentration gradients developed quickly enough for thediffusion resistivity to become larger than the ohmic resistivity in shorttime. The method employed, measuring both the ohmic and diffusionresistivity, offered insight to the mass transport of a group of elec-trolytes where previously little has been known beyond conductivityand viscosity.
41

42 CHAPTER 4. CONCLUSION
When examining the O2 solubility it was seen that Henry’s law holdsin the measured O2 partial pressure range (0 to 1 atm). Henry’s con-stant for 0.5 M LiTFSI in DMSO was measured to 2.49·10−5 mol·m−3·Pa−1.The solubility of O2 was influenced by both concentration and type ofLi salt in the electrolyte. Electrolytes based on LiClO4 showed decreas-ing O2 solubility when the salt concentration was increased. Likewise,electrolytes containing LiTf also showed decreasing solubility, however,not to the same extent as for LiClO4. Opposite to what was observedfor LiClO4 and LiTf, the solubility of O2 in LiTFSI containing elec-trolytes increased as the salt concentration was increased. In otherwords, LiClO4 and LiTFSI influenced the O2 solubility differently andthis effect must not be neglected. The observed solubility followed thesame trend as the apparent molar volume, i.e. the electrolytes contain-ing LiTFSI had the largest solubility and molar volume. Furthermore,the interaction energy between O2 and the other species present inthe electrolyte, calculated by DFT, also followed this trend, with the[O2:TFSI] complex having the strongest interaction. This suggests thatthe apparent molar volume and interaction energy might explain theobserved O2 solubilities.
The O2 partial pressure influenced the electrochemical performanceof both cylindrical UME electrodes and planar EQCM electrodes withhigher partial pressures resulting in higher current densities. The UMEmaterial had some influence on the electrode reaction with polyacrylonitrile-based CFs showing larger current densities than tar-based CFs andmetallic gold wire. However, the most important electrode propertywas the radius suggesting that the electrode geometry will play a keyrole in the Li-O2 battery cell design. Under kinetic limitation, the re-duction reaction rate law was little effected by the Li+ concentrationand likely involves an O2 adsorption step. The non-integer reactionorders at kinetic limitation suggest a complex mechanism. At highoverpotentials, where the reduction is diffusion limited, the reactionorder was one with respect to O2 and zero with respect to Li+, thus,suggesting that only changes in the O2 concentration will effect thereaction rate.
From the simultaneously measured current and mass change it isconcluded that the reduction involves formation of soluble LiO2. Some

43
of the LiO2 was transported away from the electrode surface makingit unavailable for further reaction while some of the LiO2 proceededto form Li2O2 on the electrode surface. A consequence of this is thatit is hard to use the discharge capacity as an exact measure of howmuch Li2O2 is present on the electrode as this will be influenced bythe solubility of the intermediate, the convection in the system, andthe electrode surface topography. By relating the mass change to thesimultaneous charge transfer it was seen that the first step of the oxida-tion (between 3.0 to 3.4 V vs. Li+/Li(m)) involved de-lithiation of theLi2O2-discharge product making it more LiO2-like. As the dischargeproceeds above 3.4 V vs. Li+/Li(m) the bulk of the discharge productwas oxidized. Furthermore, the oxidation reaction path showed an O2concentration dependency.
The surface passivation observed on cylindrical UMEs differed be-tween the gold and CF electrodes and could not be explained by abuildup of Li2O2. Instead, a passivation mechanism involving the oc-cupation of active sites on the electrode surface is proposed and amechanism is suggested.
In conclusion, the work performed in this thesis contributes to theknowledge of the Li-O2 battery chemistry, specifically in terms of Li+mass transport, O2 solubility, reaction rate law, and electrode passiva-tion. As these are seldom considered aspects, thus, this thesis occupiesan important niche and could aid in the realization of the Li-O2 battery.
In a broader perspective, the results presented here suggests that aLi-O2 battery device relying on ambient O2 must be engineered withfocus on the uptake of O2. Comparing the two reactants, O2 has higherreaction order and lower solubility than Li+ making the transport ofO2 to the electrode a key issue if high power density is wanted. Onesuggestion for future research would be to quantify the mass transportof O2 in this system during electrochemical operation. The solubleLiO2 will further complicate the electrode design as it need to enableoxidation of all reduction product. Failing to do so will lead to loss ofcyclable Li. Either the electrode must be designed in such a way thatit can easily capture and oxidize LiO2 or the electrolyte need to bechanged to one where LiO2 is less soluble. In a device, the passivationof the electrode might be a mixed blessing. It limits the capacity during

44 CHAPTER 4. CONCLUSION
galvanostatic cycling, however, at the same time defines an upper limitof the state of charge. If the passivation does not influence the electrodereaction reversibility the passivation potential can be used to definecurrent cut off thus simplifying battery management.

Chapter 5
Acknowledgments
Firstly, the financial support from the Swedish foundation for strategicresearch (Stiftelsen för strategisk forskning, SSF) is gratefully acknowl-edged.
My main supervisors Mårten and Göran, thank you for giving methe opportunity to work with this project. I was always allowed tofollow my own path and to a large extent make my own project, some-thing that I have appreciate. To my co-supervisor Ann, thank you forjoining the project at a point where everything seemed hopeless.
My collaborators Henrik, Björn, Balázs, Gustav, and Patrik, yourimpact on the project has been of much value and have greatly in-creased the scientific quality of the work, IMHO.
The present and past colleagues of the TEK-group, from our timetogether I have many fond memories. My time at TEK wouldn’t havebeen the same without you!
To my KTH-friends, a.k.a. “lunch-gänget”, we have spent onedecade together at KTH and I’m sure that we will be friends for manymore years.
Lastly, thank you to all my friends and family, on Gotland and themainland, for supporting me all these years.
45


Bibliography
[1] R. Pachauri, M. Allen, V. R. Barros, J. Broome, W. Cramer,R. Christ, J. A. Church, L. Clarke, Q. Dahe, P. Dasgupta,N. K. Dubash, O. Edenhofer, I. Elgizouli, C. B. Field, P. Forster,P. Friedlingstein, J. Fuglestvedt, L. Gomez-Echeverri, S. Halle-gatte, G. Hegerl, M. Howden, K. Jiang, B. Jimenez Cisneros,V. Kattsov, H. Lee, K. J. Mach, J. Marotzke, M. D. Mastrandrea,L. Meyer, J. Minx, Y. Mulugetta, K. OBrien, M. Oppenheimer,J. J. Pereira, R. Pichs-Madruga, G.-K. Plattner, H.-O. Pörtner,S. B. Power, B. Preston, N. Ravindranath, A. Reisinger, K. Ri-ahi, M. Rusticucci, R. Scholes, K. Seyboth, Y. Sokona, R. Stavins,T. F. Stocker, P. Tschakert, D. van Vuuren, J.-P. van Ypersele, Cli-mate Change 2014: Synthesis Report. Summary for Policymakers,IPCC (2007) .
[2] B. Nykvist, M. Nilsson, Rapidly Falling Costs of Battery Packsfor Electric Vehicles, Nat. Clim. Change 5 (2015) 329–332.
[3] K. Abraham, Z. Jiang, A Polymer Electrolyte-based RechargeableLithium/Oxygen Battery, J. Electrochem. Soc. 143 (1996) 1–5.
[4] T. Ogasawara, A. Débart, M. Holzapfel, P. Novák, P. G. Bruce,Rechargeable Li2O2 Electrode for Lithium Batteries, J. Am.Chem. Soc 128 (2006) 1390–1393.
[5] M. Armand, J.-M. Tarascon, Building Better Batteries, Nature451 (2008) 652–657.
47
48 BIBLIOGRAPHY
[6] R. Noorden, A Better Battery: Chemists are ReinventingRechargeable Cells to Drive Down Costs and Boost Capacity, Na-ture 507 (2014) 26–28.
[7] G. Girishkumar, B. McCloskey, A. Luntz, S. Swanson, W. Wilcke,Lithium-air Battery: Promise and Challenges, J. Phys. Chem.Lett. 1 (2010) 2193–2203.
[8] J. Christensen, P. Albertus, R. S. Sanchez-Carrera, T. Lohmann,B. Kozinsky, R. Liedtke, J. Ahmed, A. Kojic, A Critical Reviewof Li/Air Batteries, J. Electrochem. Soc. 159 (2012) R1–R30.
[9] D. Howell, B. Cunningham, T. Duong, P. Faguy, Overview of theDOE VTO Advanced Battery R&D Program, Tech. rep., VehicleTechnologies Office, US Department of Energy (2016).
[10] B. D. McCloskey, R. Scheffler, A. Speidel, G. Girishkumar, A. C.Luntz, On the Mechanism of Nonaqueous Li-O2 Electrochemistryon C and Its Kinetic Overpotentials: Some Implications for Li-AirBatteries, J. Phys. Chem. C 116.
[11] Z. Peng, S. A. Freunberger, Y. Chen, P. G. Bruce, A Reversibleand Higher-rate Li-O2 Battery., Science 337 (2012) 563–6.
[12] M. M. O. Thotiyl, S. A. Freunberger, Z. Peng, Y. Chen, Z. Liu,P. G. Bruce, A Stable Cathode for the Aprotic Li-O2 Battery, Nat.Mater. 12 (2013) 1050–1056.
[13] H.-G. Jung, J. Hassoun, J.-B. Park, Y.-K. Sun, B. Scrosati, AnImproved High-performance Lithium-air Battery, Nat. Chem. 4(2012) 579–585.
[14] R. R. Mitchell, B. M. Gallant, C. V. Thompson, Y. Shao-Horn, All-carbon-nanofiber Electrodes for High-energy Recharge-able Li-O2 Batteries, Energy Environ. Sci. 4 (2011) 2952–2958.
[15] R. Black, S. H. Oh, J.-h. Lee, T. Yim, B. Adams, L. F. Nazar,Screening for Superoxide Reactivity in Li-O 2 Batteries : Effecton , Li2O2 LiOH Crystallization, J. Am. Chem. Soc .

BIBLIOGRAPHY 49
[16] B. D. Adams, C. Radtke, R. Black, M. L. Trudeau, K. Zaghib,L. F. Nazar, Current Density Dependence of Peroxide Formationin the Li-O2 Battery and its Effect on Charge, Energy Environ.Sci. 6 (2013) 1772.
[17] R. R. Mitchell, B. M. Gallant, Y. Shao-horn, C. V. Thompson,Mechanisms of Morphological Evolution of Li2O2 Particles DuringElectrochemical Growth, J. Phys. Chem. Lett. (2013) 1–5.
[18] K.-H. Xue, E. McTurk, L. Johnson, P. G. Bruce, A. a. Franco,A Comprehensive Model for Non-Aqueous Lithium Air BatteriesInvolving Different Reaction Mechanisms, J. Electrochem. Soc.162 (2015) A614–A621.
[19] C. Xia, M. Waletzko, L. Chen, K. Peppler, P. J. Klar, J. Janek,Evolution of Li2O2 Growth and Its Effect on Kinetics of Li-O2Batteries, ACS Appl. Mater. Inter. .
[20] J. Yang, D. Zhai, H.-H. Wang, K. C. Lau, J. a. Schlueter, P. Du,D. J. Myers, Y.-K. Sun, L. Curtiss, K. Amine, Evidence forLithium Superoxide-like Species in the Discharge Product of aLi-O2 Battery., Phys. Chem. Chem. Phys. 15 (2013) 3764–71.
[21] R. Cao, E. D. Walter, W. Xu, E. N. Nasybulin, P. Bhattacharya,M. E. Bowden, M. H. Engelhard, J.-G. Zhang, The Mechanismsof Oxygen Reduction and Evolution Reactions in NonaqueousLithium-oxygen Batteries, ChemSusChem 7 (2014) 2436–40.
[22] N. B. Aetukuri, B. D. McCloskey, J. M. García, L. E. Krupp,V. Viswanathan, A. C. Luntz, Solvating Additives Drive Solution-mediated Electrochemistry and Enhance Toroid Growth in non-aqueous Li-O2 Batteries, Nat. Chem. 7 (2015) 50–56.
[23] V. Viswanathan, K. S. Thygesen, J. Hummelshøj, J. K. Nørskov,G. Girishkumar, B. McCloskey, A. Luntz, Electrical Conductivityin Li2O2 and its Role in Determining Capacity Limitations in Non-aqueous Li-O2 Batteries, J. Chem. Phys 135 (2011) 214704.

50 BIBLIOGRAPHY
[24] K. B. Knudsen, A. C. Luntz, S. H. Jensen, T. Vegge, J. Hjelm, Re-dox Probing Study of the Potential Dependence of Charge Trans-port Through Li2O2, J. Phys. Chem. C 119 (2015) 28292–28299.
[25] M. M. Ottakam Thotiyl, S. Freunberger, Z. Peng, P. G. Bruce,The Carbon Electrode in Nonaqueous Li-O2 Cells, J. Am. Chem.Soc. 135 (2013) 494–500.
[26] B. D. McCloskey, A. Valery, A. C. Luntz, S. R. Gowda, G. M.Wallraff, J. M. Garcia, T. Mori, L. E. Krupp, Combining AccurateO2 and Li2O2 Assays to Separate Discharge and Charge StabilityLimitations in Nonaqueous Li-O2 Batteries, J. Phys. Chem. Lett.4 (2013) 2989–2993.
[27] S. A. Freunberger, Y. Chen, N. E. Drewett, L. J. Hardwick,F. Bardé, P. G. Bruce, The Lithium-oxygen Battery with Ether-based Electrolytes, Angew. Chem. Int. Edit. 50 (2011) 8609–8613.
[28] Y.-C. Lu, H. A. Gasteiger, E. Crumlin, R. McGuire, Y. Shao-Horn, Electrocatalytic Activity Studies of Select Metal Surfacesand Implications in Li-air Batteries, J. Electrochem. Soc. 157(2010) A1016–A1025.
[29] L. Johnson, C. Li, Z. Liu, Y. Chen, S. A. Freunberger, P. C.Ashok, B. B. Praveen, K. Dholakia, J.-M. Tarascon, P. G. Bruce,The Role of LiO2 Solubility in O2 Reduction in Aprotic Solventsand its Consequences for Li-O2 Batteries, Nat. Chem. 6 (2014)1091–1099.
[30] F. S. Gittleson, R. E. Jones, D. K. Ward, M. E. Foster, OxygenSolubility and Transport in Li-air Battery Electrolytes: Establish-ing Criteria and Strategies for Electrolyte Design, Energ. Environ.Sci. 10 (2017) 1167–1179.
[31] J. Herranz, A. Garsuch, H. A. Gasteiger, Using Rotating RingDisc Electrode Voltammetry to Quantify the Superoxide RadicalStability of Aprotic Li-air Battery Electrolytes, J. Phys. Chem. C116 (2012) 19084–19094.

BIBLIOGRAPHY 51
[32] W. R. Torres, S. E. Herrera, A. Y. Tesio, M. Pozo, E. J. Calvo,Soluble TTF Catalyst for the Oxidation of Cathode Products inLi-Oxygen Battery : A Chemical Scavenger, Electrochim. Acta182 (2015) 1118–1123.
[33] C. Bondue, P. Reinsberg, H. Baltruschat, A Chronoamperomet-ric Differential Electrochemical Mass Spectroscopy Study on theGrowth of Li2O2 and Its Effect on the Mechanism of OxygenReduction in Dimethylsulfoxide Based Electrolytes, Electrochim.Acta .
[34] C. O. Laoire, S. Mukerjee, K. M. Abraham, E. J. Plichta, M. A.Hendrickson, Elucidating the Mechanism of Oxygen Reduction forLithium-Air Battery Applications, J. Phys. Chem. C 113.
[35] C. J. Allen, J. Hwang, R. Kautz, S. Mukerjee, E. J. Plichta, M. A.Hendrickson, K. Abraham, Oxygen Reduction Reactions in IonicLiquids and the Formulation of a General ORR Mechanism forLi-air Batteries, J. Phys. Chem. C 116 (2012) 20755–20764.
[36] M. J. Trahan, S. Mukerjee, E. J. Plichta, M. A. Hendrickson,K. Abraham, Studies of Li-air Cells Utilizing Dimethyl Sulfoxide-based Electrolyte, J. Electrochem. Soc. 160 (2013) A259–A267.
[37] C. J. Bondue, M. Hegemann, C. Molls, E. Thome, H. Baltruschat,A Comprehensive Study on Oxygen Reduction and Evolution fromLithium Containing DMSO Based Electrolytes at Gold Electrodes,J. Electrochem. Soc. 163.
[38] B. D. McCloskey, A. Speidel, R. Scheffler, D. C. Miller,V. Viswanathan, J. S. Hummelshoj, J. K. Norskov, A. C. Luntz,Twin Problems of Interfacial Carbonate Formation in NonaqueousLi-O2 Batteries, J. Phys. Chem. Lett. 3 (2012) 997–1001.
[39] J. Lindberg, B. Wickman, M. Behm, A. Cornell, G. Lindbergh,The Effect of O2 Concentration on the Reaction Mechanism inLi-O2 Batteries, J. Electroanal. Chem 797 (2017) 1–7.
52 BIBLIOGRAPHY
[40] N. A. Galiote, D. C. Azevedo, O. N. d. Oliveira Junior,F. Huguenin, et al., Investigating the Kinetic Mechanisms of theOxygen Reduction Reaction in a Nonaqueous Solvent, J. Phys.Chem. C 118 (2014) 21995–22002.
[41] D. Sharon, V. Etacheri, A. Garsuch, M. Afri, A. A. Frimer, D. Au-rbach, On the Challenge of Electrolyte Solutions for Li-air Bat-teries: Monitoring Oxygen Reduction and Related Reactions inPolyether Solutions by Spectroscopy and EQCM, J. Phys. Chem.Lett. 4 (2012) 127–131.
[42] S. Schaltin, G. Vanhoutte, M. Wu, F. Bardé, J. Fransaer, A QCMStudy of ORR-OER and an in situ Study of a Redox Mediator inDMSO for Li-O2 Batteries, Phys. Chem. Chem. Phys 17 (2015)12575–12586.
[43] W. R. Torres, L. Cantoni, A. Y. Tesio, M. Pozo, E. J. Calvo,EQCM Study of Oxygen Cathodes in DMSO LiPF6 Electrolyte,J. Electroanal. Chem. 765 (2016) 45–51.
[44] R. Younesi, G. M. Veith, P. Johansson, K. Edstrom, T. Vegge,Lithium Salts for Advanced Lithium Batteries: Li-metal, Li-O2,and Li-S, Energy Environ. Sci. (2015) 1905–1922.
[45] J. Read, K. Mutolo, M. Ervin, W. Behl, J. Wolfenstine,a. Driedger, D. Foster, Oxygen Transport Properties of OrganicElectrolytes and Performance of Lithium/Oxygen Battery, J. Elec-trochem. Soc. 150 (2003) A1351.
[46] S. A. Freunberger, Y. Chen, Z. Peng, J. M. Griffin, L. J. Hardwick,F. Bardé, P. Novák, P. G. Bruce, Reactions in the RechargeableLithium-O2 Battery with Alkyl Carbonate Electrolytes, J. Am.Chem. Soc 133 (2011) 8040–8047.
[47] P. Andrei, J. P. Zheng, M. Hendrickson, E. J. Plichta, Some Pos-sible Approaches for Improving the Energy Density of Li-Air Bat-teries, J. Electrochem. Soc. 157.

BIBLIOGRAPHY 53
[48] U. Sahapatsombut, H. Cheng, K. Scott, Modelling of Operationof a Lithium-air Battery with Ambient Air and Oxygen-selectiveMembrane, J. Power Sources 249 (2014) 418–430.
[49] R. Sander, Compilation of Henry’s Law Constants (version 4 .0)for Water as Solvent, Atmos. Chem. Phys (2015) 4399–4981.
[50] A. Nyman, M. Behm, G. Lindbergh, Electrochemical Charac-terisation and Modelling of the Mass Transport Phenomena inLiPF6-EC-EMC Electrolyte, Electrochim. Acta 53 (2008) 6356–6365.
[51] H. Lundgren, J. Scheers, M. Behm, G. Lindbergh, Characteriza-tion of the Mass-Transport Phenomena in a SuperconcentratedLiTFSI : Acetonitrile Electrolyte, J. Electrochem. Soc. 162 (2015)1334–1340.
[52] H. Lundgren, M. Behm, G. Lindbergh, Electrochemical Charac-terization and Temperature Dependency of Mass-Transport Prop-erties of LiPF6 in EC:DEC, J. Electrochem. Soc. 162 (2015) 3–10.
[53] K. C. Hogstrom, H. Lundgren, S. Wilken, T. G. Zavalis, M. Behm,K. Edstrom, P. Jacobsson, P. Johansson, G. Lindberg, Impact ofthe Flame Retardant Additive Triphenyl Phosphate (TPP) on thePerformance of Graphite/LiFePO4 Cells in High Power Applica-tions, J. Power Sources 256 (2014) 430–439.
[54] B. Wickman, H. Grönbeck, P. Hanarp, B. Kasemo, Corrosion In-duced Degradation of Pt / C Model Electrodes Measured withElectrochemical Quartz Crystal Microbalance, J. Electrochem.Soc. (2010) 592–598.
[55] M. D. Bhatt, M. Cho, K. Cho, Density Functional Theory Calcu-lations for the Interaction of Li+ Cations and PF−
6 Anions withNonaqueous Electrolytes, Can. J. Chem. 89 (2011) 1525–1532.
[56] L. J. Hardwick, M. Holzapfel, A. Wokaun, P. Novak, RamanStudy of Lithium Coordination in EMI-TFSI Additive Systems
54 BIBLIOGRAPHY
as Lithium-ion Battery Ionic Liquid Electrolytes, J. Raman Spec-trosc. 38 (2007) 110–112.
[57] J. C. Lassegues, J. Grondin, D. Talaga, Lithium Solvationin bis(trifluoromethanesulfonyl)imide-based Ionic Liquids, Phys.Chem. Chem. Phys 8 (2006) 5629–5632.
[58] J.-C. Lassegues, J. Grondin, C. Aupetit, P. Johansson, Spectro-scopic Identification of the Lithium Ion Transporting Species inLiTFSI-Doped Ionic Liquids, J. Phys. Chem. A 113 (2009) 305–314.
[59] M. Khodayari, P. Reinsberg, A.-e.-a. A. Abd-el latif, C. Merdon,Determining Solubility and Diffusivity by Using a Flow Cell Cou-pled to a Mass Spectrometer, ChemPhysChem (2016) 1647–1655.
[60] Q. Yu, S. Ye, In Situ Study of Oxygen Reduction in Dimethyl Sul-foxide (DMSO) Solution: A Fundamental Study for Developmentof the Lithium–Oxygen Battery, J. Phys. Chem. C 119 (2015)12236–12250.
[61] P. Reinsberg, P. P. Bawol, H. Baltruschat, Electrochemical Reac-tion Order of the Oxygen Reduction Reaction in Li+-ContainingDMSO, J. Phys. Chem. C .
[62] S. Ganapathy, B. D. Adams, G. Stenou, M. S. Anastasaki,K. Goubitz, X.-F. Miao, L. F. Nazar, M. Wagemaker, Nature ofLi2O2 Oxidation in a Li-O2 Battery Revealed by Operando X-rayDiffraction, J. Am. Chem. Soc. .
[63] B. M. Gallant, D. G. Kwabi, R. R. Mitchell, J. Zhou, C. V. Thomp-son, Y. Shao-Horn, Influence of Li2O2 Morphology on OxygenReduction and Evolution Kinetics in Li-O2 Batteries, Energy En-viron. Sci. (2013) 2518–2528.
[64] D. Zhai, H.-H. Wang, K. C. Lau, J. Gao, P. C. Redfern, F. Kang,B. Li, E. Indacochea, U. Das, H.-H. Sun, H.-J. Sun, K. Amine,L. A. Curtiss, Raman Evidence for Late Stage Disproportionationin a Li-O2 Battery, J. Phys. Chem. Lett. .