electrochemical methods to study iron-sulfur cluster … geil, mike grodick, dr. alexis komor, dr....
TRANSCRIPT

Electrochemical Methods to Study Iron-Sulfur Cluster Proteins
Thesis by
Helen Segal
In Partial Fulfillment of the Requirements for the degree of
Doctor of Philosophy
CALIFORNIA INSTITUTE OF TECHNOLOGY
Pasadena, California
2016
(Defended May 18, 2016)

ii
2016
Helen Segal

iii ACKNOWLEDGEMENTS
I would like to thank all those involved in making this thesis a reality. First, I
would like to thank my advisor Doug Rees for his constant help and support. I
would also like to thank my thesis committee, Harry Gray, Long Cai, and Judy
Campbell, for helpful scientific discussion and advice. I had the privilege of working
with a number of very talented scientists in the lab throughout my graduate
studies. I am grateful for the support and scientific discussions with: Dr. Jacqueline
K. Barton, Dr. Mike Hill, Dr. Andrew Udit, Dr. Keiko Yokoyama, Dr. Anna Arnold,
Phil Bartels, Kelsey Boyle, Adam Boynton, Dr. Russ Ernst, Dr. Ariel Furst, Dr.
Wendy Geil, Dr. Mike Grodick, Dr. Alexis Komor, Dr. Anna McConnell, Dr. Tim
Mui, Dr. Natalie Muren, Liz O’Brien, Dr. Eric Olmon, Dr. Catrina Pheeney, Dr.
Christine Romano, Dr. Curtis Schneider, Dr. Katie Schaeffer, Rebekah Silva, Dr.
Hang Song, Dr. Pam Sontz, Dr. Alyson Weidman, Andy Zhou, Keisha Dykes,
Jenny He, Chengcheng Fan, Nadia Herrera, Julie Hoy, Dr. Chinny Idigo, Dr. Jens
Kaiser, Aron Kamajaya, Jeffrey Lai, Allen Lee, Qiwen Li, Phong Nguyen, Pavle,
Nikolovski, and Dr. Janet Yang. I would especially like to thank the members of
Team Nitro for supporting me through a very challenging transition, and for
creating an environment that always made me excited to come to work: Dr. James
Howard, Dr. Thomas Spatzal, Dr. Limei Zhang, Dr. Kathryn Perez, Christine
Morrison, Belinda Wenke, Andrew Buller, Renee Arias, Keith Beadle, Corinna
Probst, and Felix Kolbe. Finally, I would like to thank Phoebe Ray and Maureen
Renta for always keeping everything running smoothly in the lab.
I would also like to thank my friends and family for encouraging and
supporting me throughout graduate school. I would especially like to thank my
roommates, Matt Griffin, Connie Wang, Eric Lubeck, Marvin, and Team Cuddles.
Their comradery throughout the last six years has been invaluable. I would like to
acknowledge my little brother Zachary. We do not talk very often, but when we do
it is magical. I would especially like to thank my parents Andrew Segal and Laurie
Segal who taught me the value of hard work and integrity. Their support and trust
in me throughout graduate school were essential for the completion of this thesis.
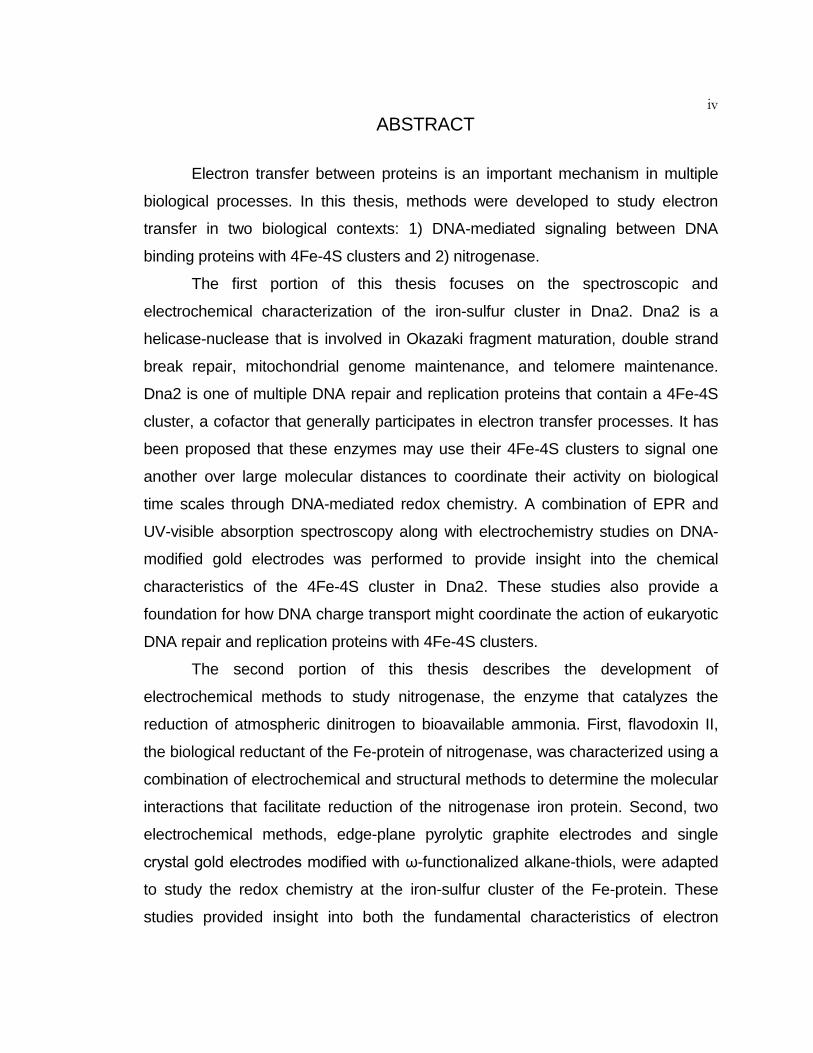
iv ABSTRACT
Electron transfer between proteins is an important mechanism in multiple
biological processes. In this thesis, methods were developed to study electron
transfer in two biological contexts: 1) DNA-mediated signaling between DNA
binding proteins with 4Fe-4S clusters and 2) nitrogenase.
The first portion of this thesis focuses on the spectroscopic and
electrochemical characterization of the iron-sulfur cluster in Dna2. Dna2 is a
helicase-nuclease that is involved in Okazaki fragment maturation, double strand
break repair, mitochondrial genome maintenance, and telomere maintenance.
Dna2 is one of multiple DNA repair and replication proteins that contain a 4Fe-4S
cluster, a cofactor that generally participates in electron transfer processes. It has
been proposed that these enzymes may use their 4Fe-4S clusters to signal one
another over large molecular distances to coordinate their activity on biological
time scales through DNA-mediated redox chemistry. A combination of EPR and
UV-visible absorption spectroscopy along with electrochemistry studies on DNA-
modified gold electrodes was performed to provide insight into the chemical
characteristics of the 4Fe-4S cluster in Dna2. These studies also provide a
foundation for how DNA charge transport might coordinate the action of eukaryotic
DNA repair and replication proteins with 4Fe-4S clusters.
The second portion of this thesis describes the development of
electrochemical methods to study nitrogenase, the enzyme that catalyzes the
reduction of atmospheric dinitrogen to bioavailable ammonia. First, flavodoxin II,
the biological reductant of the Fe-protein of nitrogenase, was characterized using a
combination of electrochemical and structural methods to determine the molecular
interactions that facilitate reduction of the nitrogenase iron protein. Second, two
electrochemical methods, edge-plane pyrolytic graphite electrodes and single
crystal gold electrodes modified with ω-functionalized alkane-thiols, were adapted
to study the redox chemistry at the iron-sulfur cluster of the Fe-protein. These
studies provided insight into both the fundamental characteristics of electron

v transfer reactions involving nitrogenase, as well as insight into how to better study
this enzyme using electrochemical methods.
vi PUBLISHED CONTENT AND CONTRIBUTIONS
Grodick, M. A., Segal, H. M., Zwang, T. J., and Barton, J. K. (2014). “DNA-Mediated Signaling by Proteins with 4Fe-4S Clusters is Necessary for Genomic Integrity”. In: Journal of the American Chemical Society 136.17, pp. 6470–6478. doi: 10.1021/ja501973c.
H. M. S. participated in the design and implementation of the lac+ reversion assay for MutY activity and participated in the writing of the manuscript.
Sontz, P. A., Muren, N. B., and Barton, J. K. (2012). “DNA Charge Transport for Sensing and Signaling”. In: Accounts of Chemical Research 45.10, pp. 1792–1800. doi: 10.1021/ar3001298.
Figure 5 reprinted with permission from the copyright holder, American Chemical Society.
Pheeney, C. G., Arnod, A. R., Grodick, M. A., and Barton, J. K. (2013). “Multiplexed Electrochemistry of DNA-Bound Metalloproteins”. In: Journal of the American Chemical Society 135.32, pp. 11869–11878. doi: 10.1021/ja4041779.
Figure 4 reprinted with permission from the copyright holder, American Chemical Society.

vii TABLE OF CONTENTS
Acknowledgements………………………………………………………... iii Abstract …………………………………………………………………...….iv Published Content and Contributions…………………………….............vi Table of Contents…………………………………………………………. vii List of Illustrations and/or Tables………………………...…………..……ix Chapter 1: Introduction ........................................................................... 1
Iron-Sulfur Clusters in DNA Binding Proteins ................................... 1 Nitrogenase ..................................................................................... 10 References ...................................................................................... 18
Chapter 2: Purification and Spectroscopic Characterization S. cerevisiae Dna2 ........................................................... 30
Abstract ........................................................................................... 30 Introduction ...................................................................................... 31 Methods ........................................................................................... 33 Results ............................................................................................ 41 Conclusion ....................................................................................... 53 References ...................................................................................... 54
Chapter 3: Dna2 Electrochemical Characterization on DNA-Modified Gold Electrodes ........................................ 58
Abstract ........................................................................................... 58 Introduction ...................................................................................... 59 Materials and Methods .................................................................... 63 Results ............................................................................................ 66 Conclusion ....................................................................................... 76 References ...................................................................................... 78
Chapter 4: Electrochemical Assay to Detect Dna2 Nuclease Activity .............................................................. 81
Abstract ........................................................................................... 81 Introduction ...................................................................................... 81 Materials and Methods .................................................................... 84 Results ............................................................................................ 88 Conclusion ....................................................................................... 93 References ...................................................................................... 95
Chapter 5: Electrochemical and Structural Characterization of Azotobacter vinelandii Flavodoxin II ............................ 97
viii
Abstract ........................................................................................... 97 Introduction ...................................................................................... 98 Method .......................................................................................... 101 Results .......................................................................................... 106 Conclusion ..................................................................................... 116 References .................................................................................... 118
Chapter 6: Electrochemical Studies of the Azotobacter vinelandii Nitrogenase Iron Protein ........... 124
Abstract ......................................................................................... 124 Introduction .................................................................................... 125 Method .......................................................................................... 129 Results .......................................................................................... 135 Conclusion ..................................................................................... 143 References .................................................................................... 145
Appendix 1: Materials for S. cerevisiae Dna2 Expression in E. coli......................................................................... 148 Appendix 2: Dna2 Electrochemical Nuclease Assay Supporting Figures and Tables ..................................... 154 Appendix 3: Electrochemical and Structural Characterization of Azotobacter vinelandii Flavodoxin II Supporting Figures and Tables ..................................... 170 Appendix 4: A Method for Monitoring DNA Charge Transport Signaling Between DNA Repair Proteins ...................... 181
ix LIST OF ILLUSTRATIONS AND/OR TABLES
Number Page Figure 1.1 The Structure of DNA ................................................................. 2
Figure 1.2 Platforms for Studying DNA Charge Transport .......................... 3
Figure 1.3 Model for DNA Charge Transport in DNA Repair ...................... 7
Table 1.1 DNA Binding Proteins with 4Fe-4S Clusters .............................. 8
Figure 1.4 Structure of the Nitrogenase Complex ..................................... 12
Figure 1.5 Electron Transfer in Nitrogenase ............................................. 13
Table 1.2 Midpoint Potentials of the Nitrogenase Metal Clusters ............ 16
Figure 2.1 S. cerevisiae Dna2 ................................................................... 31
Figure 2.2 Crystal Structure of Mouse Dna2 Bound to DNA ..................... 32
Figure 2.3 Gel Analysis of the Dna2 Purification ....................................... 37
Figure 2.4 Dna2 Activity Assays ................................................................ 41
Figure 2.5 UV-Visible Absorption Spectrum of Dna2 ................................ 42
Figure 2.6 X-Band EPR Spectrum of Dna2 at 10K ................................... 43
Figure 2.7 Dna2 and Dna2 C771A Nuclease Assays ............................... 44
Figure 2.8 Dna2 and Dna2 E675A Nuclease Assays ............................... 45
Figure 2.9 UV-Visible Absorption Spectra of Dna2 Mutants ..................... 46
Figure 2.10 Oxidative Degradation of the 4Fe-4S Cluster in Dna2 ............. 48
Figure 2.11 UV-Visible Absorption Spectrum of Reduced Dna2 ................ 49
Figure 2.12 X-Band EPR Spectrum of Reduced Dna2 ............................... 51
Table 2.1 EPR Data for DNA Binding Proteins with 4Fe-4S Clusters ...... 52
Figure 3.1 DNA Charge Transport on DNA-Modified Gold Electrodes ..... 61
Figure 3.2 Protein Electrochemistry on DNA-Modified Gold Electrodes ... 63
x Table 3.1 Oligonucleotides for Electrochemistry ...................................... 64
Figure 3.3 Dna2 on DNA-Modified Gold Electrodes ................................. 68
Figure 3.4 DNA-Mediated Electrochemistry of DNA Binding Proteins ...... 69
Figure 3.5 Signal Intensity Over Time ....................................................... 70
Figure 3.6 Dna2 and Dna2 C771A on DNA-Modified Gold Electrodes .... 71
Figure 3.7 Dna2 in Nuclease Assay Buffer ............................................... 72
Figure 3.8 Dna2 in Helicase Assay Buffer ................................................. 74
Figure 3.9 Electronic Coupling Between the Iron-Sulfur Cluster
of Dna2 and the DNA on Gold Electrodes ............................ 75
Figure 4.1 Electrochemical Dna2 Nuclease Assay ................................... 83
Figure 4.2 Electrochemical Nuclease Assay on a 5’-Tail
DNA Substrate ....................................................................... 90
Figure 4.3 Dna2 Nuclease Assay on 5’-Tail DNA Substrates with
Different Overhang Lengths................................................... 92
Figure 4.4 Electrochemical Nuclease Assay with the
Dna2 E675A Nuclease-Deficient Mutant ............................... 93
Figure 5.1 Flavodoxin II on Basal plane Graphite Electrodes
Modified with DDAB ............................................................. 107
Figure 5.2 pH Titration of Flavodoxin II ................................................... 110
Figure 5.3 Structure of Oxidized Flavodoxin II ........................................ 111
Figure 5.4 The FMN Binding Site of Flavodoxin II ................................... 113
Figure 5.5 Model of the Flavodoxin II - Iron Protein Complex ................. 115
Figure 6.1 Methods for Studying the Redox Properties of Av2 ............... 127
Figure 6.2 Analysis of Purified Nitrogenase Component Proteins .......... 130

xi Figure 6.3 Acetylene Reduction Assay.................................................. 132
Figure 6.4 Nitrogenase Activity following Preparation for
Electrochemistry Experiments ............................................. 135
Figure 6.5 Av2 Direct Electrochemistry on Edge-Plane Pyrolytic
Graphite Electrodes ............................................................. 138
Figure 6.6 Cyclic Voltammograms of Av2 on Single Crystal
Gold Electrodes ................................................................... 139
Table 6.1 Midpoint Potential of Av2 on Gold Electrodes ...................... 140
Figure 6.7 Oxidation of Av2 on Single Crystal Gold Electrodes ............ 141
Figure 6.8 Redox Chemistry of Av2 Bound to MgATP on
Single Crystal Gold Electrodes ............................................ 142
Table A1.1 Primers for Construction of the Wildtype and Mutant
pQTEV-DNA2 Overexpression Plasmids .......................... 149
Table A1.2 Primers for Site-Directed Mutagenesis of the Dna2
Overexpression Plasmid .................................................... 150
Table A1.3 Plasmids for Dna2 Overexpression .................................. 151
Table A1.4 E. coli Strains for Wildtype and Mutant Dna2
Overexpression .................................................................. 152
Table A1.5 E. coli Strains for Storage of the Dna2
Overexpression Plasmids .................................................. 153
Figure A2.1 Comparison of Wildtype Dna2 and Dna2 E675A
Nuclease Activity with Methylene Blue DNA ..................... 155
Figure A2.2 Electrochemical Nuclease Assay on the
Duplex DNA Substrate ....................................................... 156
Figure A2.3 Electrochemical Nuclease Assay on the
5’-Tail with a Two Nucleotide Overhang DNA Substrate .. 157
xii Figure A2.4 Electrochemical Nuclease Assay on the
5’-Tail with a Twenty Nucleotide Overhang
DNA Substrate ............................................................... 158
Figure A2.5 Quantification of DNA on the Working Electrode ................ 159
Figure A2.6 Scan Rate Analysis 1 .......................................................... 160
Figure A2.7 Scan Rate Analysis 2 .......................................................... 161
Figure A2.8 Scan Rate Analysis 3 .......................................................... 162
Figure A2.9 Scan Rate Analysis 4 .......................................................... 163
Figure A2.10 Scan Rate Analysis 5 .......................................................... 164
Figure A2.11 Scan Rate Analysis 6 .......................................................... 165
Figure A2.12 Scan Rate Analysis 7 .......................................................... 166
Figure A2.13 Scan Rate Analysis 8 .......................................................... 167
Table A2.1 Oligonucleotides for the
Electrochemical Nuclease Assay .................................. 168
Table A2.2 DNA Substrates for the
Electrochemical Nuclease Assay .................................. 169
Figure A3.1 Cyclic Voltammogram of Flavodoxin II on
Unmodified Basal Plane Graphite Electrodes ................ 171
Figure A3.2 Cyclic Voltammogram of Flavodoxin II Purified
from E. coli ...................................................................... 172
Figure A3.3 Cyclic Voltammogram of FMN ........................................... 173
Figure A3.4 Cyclic Voltammogram of Flavodoxin II with the
High and Low Potential Species ..................................... 174
Figure A3.5 Flavodoxin II Scan Rate Analysis ...................................... 175
Figure A3.6 FMN Scan Rate Analysis ................................................... 176
Figure A3.7 Potential Reduction Mechanisms of FMN Bound
by Flavodoxin II ............................................................... 177
xiii Table A3.1 Midpoint Potentials of
Azotobacter vinelandii Flavodoxin II ............................. 178
Table A3.2 Data Collection and Refinement Statistics for
A. vinelandii Flavodoxin II (nifF) .................................... 179
Table A3.3 Predicted Amino Acid Residue Interactions
Between Flavodoxin II and the Iron Protein.................. 180
Figure A4.1 Helper Function Assay ........................................................ 183
Figure A4.2 In-frame Inactivation of dinG via the Wanner Method ........ 186
Table A4.1 Primers for Construction of the DinG Helper
Function Assay Plasmids and E. coli Strains ................ 190
Figure A4.3 Results of the Helper Function Assay for MutY Activity ..... 191
Figure A4.4 Growth Curves for the CC104 E. coli Strain ....................... 193

1 C h a p t e r 1
INTRODUCTION
Proteins have evolved to bind a range of metal centers that are required for
enzymatic activity. These metal centers have many functions, including but not
limited to stabilizing protein structure, acting as a Lewis Acid-Base, or participating
in redox reactions (1-3). This latter role involves electron transfer between redox-
active transition metal centers, and constitutes an important step in reactions
catalyzed by enzymes, like ribonucleotide reductase and the respiratory chain
complex, that sustain the growth and proliferation of organisms. Additionally, this
type of reaction occurs in enzymes, like hydrogenase and nitrogenase, that are
models for the development of environmentally friendly catalysts for industrial
processes (1). Thus, studies of electron transfer in metal-binding proteins can
advance the general understanding of both human health and industrial catalyst
development. In this thesis, methods were developed to study inter- and intra-
protein electron transfer in two different systems: (1) DNA binding proteins that
contain 4Fe-4S clusters and (2) nitrogenase.
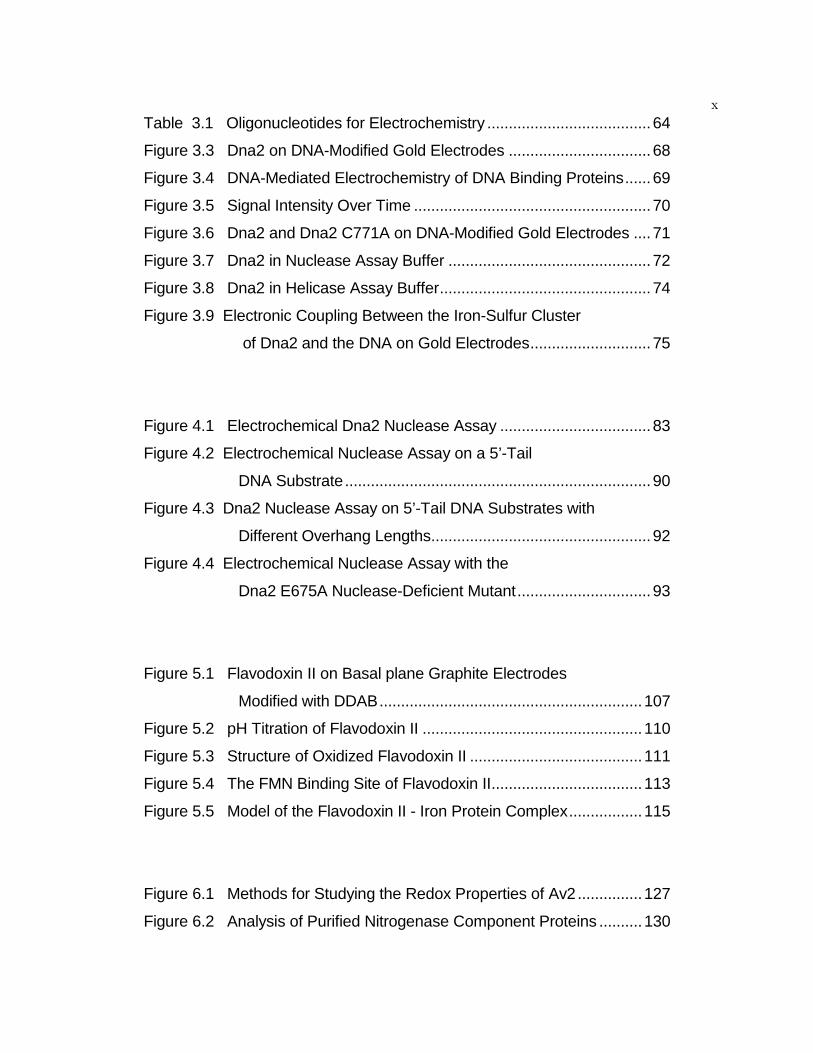
Iron-Sulfur Clusters in DNA Binding Proteins DNA is composed of a series of heterocyclic, aromatic base pairs
surrounded by a sugar phosphate backbone (4). The π-orbitals of the planar
nucleobases stack in a manner that is reminiscent of the orbital overlap in
conductive π-stacked solids, like graphite (Figure 1). Consistent with this
observation, shortly after the double helix structure of B-form DNA was discovered,
it was proposed that the base pairs could be a medium for charge transport (5,6).
Using multiple experimental strategies for studying both ground state and excited
state electron transfer through DNA (Figure 2), the Barton lab has confirmed this
prediction, and has established that DNA acts as a molecular wire to facilitate rapid
charge transport over large molecular distances of up to 100 nanometers. This
2
finding, along with the discovery that small perturbations in DNA structure
attenuate charge transport, has provided a basis for studying this chemistry within
a cell (7-9).
DNA charge transport (CT) has been studied in multiple biological contexts,
including long-range activation of redox-active transcription factors, protection of
DNA from oxidative damage, and detection of damaged or mismatched base pairs
by DNA repair proteins (10-17). In order for proteins to participate in this type of
signaling, they must bind DNA and have a redox active cofactor that can
participate in electron transfer reactions. Common cofactors of this type include:
NAD+/NADH, FADH2/FAD+, copper-containing cofactors, and iron-containing
cofactor, such as hemes and iron-sulfur clusters (1). Traditionally, redox-active
cofactors were not common in DNA binding proteins; however, in the last decade a
number of proteins involved in DNA and RNA metabolism have been identified as
Figure 1.1. The Structure of DNA. (Top) A top-down view of DNA. (Bottom) A side view of DNA. The sugar phosphate backbone is shown in dark purple while the nucleobases are shown in light purple. The π-orbitals of the nucleobases overlap such that they create a conduit for electron transfer.

3 4Fe-4S cluster binding proteins (Tables 1). The role of the 4Fe-4S clusters in
these proteins remains enigmatic (18, 19).
DNA Glycosylases with 4Fe-4S Clusters. The first DNA repair protein in which a
4Fe-4S cluster was observed was Endonuclease III (EndoIII), a DNA glycosylase
(20). Since this original discovery, DNA glycosylases have served as a model
system for preliminary characterization of DNA-mediated charge transport
signaling between DNA repair proteins.
DNA glycosylases are the enzymes responsible for the first step in the base
excision repair pathway in which damaged nucleobases are excised to initiate
repair of DNA lesions prior to replication. Thus, DNA glycosylases are able to
search an entire genome to find and repair DNA lesions that often have only minor
chemical and structural differences from the canonical Watson-Crick base pairs
(21-23). A subset of DNA glycosylases contain a 4Fe-4S cluster, which is
positioned within 15Å of the DNA binding site of these enzymes (24, 25).
Figure 1.2. Platforms for Studying DNA Charge Transport. (Left) DNA-modified electrodes with a redox probe. (Top Right) DNA-mediated quenching of the luminenscence of a donor metallointercalator by an acceptor metallointercalator. (Middle Right) DNA-mediated oxidation of guanine by a metallointercalator that is a photo-oxidant. (Bottom Right) A single molecule device for studying DNA conductivity that consists of a piece of DNA covalently attached across a gap in a carbon nanotube.

4 Therefore, the 4Fe-4S cluster is close enough to the DNA nucleobases to
theoretically allow for electron transfer between this metal center and the DNA.
Although the distance between the 4Fe-4S cluster in EndoIII is sufficient for
electron transfer to occur between the protein and the DNA, experimental
evidence suggested that this cofactor was not redox-active. Specifically, the 4Fe-
4S cluster in EndoIII could not be reduced at a biologically relevant potential, and it
could not be oxidized without degradation (20). These observations suggested that
this cofactor had a purely structural role. However, work from the David lab
showed that although the 4Fe-4S cluster in MutY, a structurally related DNA
glycosylase, was required for DNA binding, it was not required for protein folding or
thermal stability (26). Consistent with these findings, the Barton lab has proposed
that this iron cofactor is in fact redox-active, and participates in DNA-mediated
electron transfer rather than having a purely structural role (10, 15-17).
The first insight into the redox activity of the 4Fe-4S cluster in DNA
glycosylases was the observation that DNA binding shifts the midpoint potential of
this iron cofactor. The DNA bound potential of the 2+/3+ couple of the 4Fe-4S
cluster in three DNA glycosylases, Endonuclease III, MutY, and UDG, was
measured on DNA-modified gold electrodes to be 80 mV v. NHE (27, 28). Using
cyclic voltammetry, it was observed that the redox process being monitored was
reversible, which suggested that DNA binding prevented the oxidative degradation
of the protein that was observed in the absence of DNA. Furthermore, experiments
done to directly compare the midpoint potential of EndoIII with or without DNA on
highly oriented pyrolytic graphite (HOPG) electrodes revealed that there was a
negative 200 mV shift in midpoint potential upon DNA binding (29). Since there is
no significant change in protein conformation when bound to DNA, this shift in
potential corresponds to a three orders of magnitude higher EndoIII DNA binding
affinity when the 4Fe-4S cluster is in the 3+ oxidation state relative to the 2+
oxidation state. What is responsible for this large change in redox potential upon
DNA binding?

5 To answer this question, a family of EndoIII mutants was created to alter
the electrostatic interactions around the 4Fe-4S cluster while maintaining wild type
DNA binding affinity (30). The midpoint potentials of these mutant proteins were
compared on DNA-modified gold electrodes to determine how changing
electrostatics around the 4Fe-4S cluster affects the midpoint potential of the
protein. The EndoIII mutants did not have a significantly different DNA-bound
midpoint potential from that of wild type EndoIII. This result is consistent with the
observation that the electrostatic environment created by the polyanionic DNA is
responsible for the dramatic shift in the DNA-bound midpoint potential of the 4Fe-
4S cluster in EndoIII.
Two key principles were determined from the experiments described above.
First, DNA binding by DNA repair and replication proteins that contain 4Fe-4S
clusters shifts the midpoint potential of the iron cofactor and prevents the oxidative
degradation of these metal centers. The Nernst equation predicts that this shift in
potential corresponds to a three orders of magnitude higher affinity for DNA when
the protein is in its oxidized form relative to its reduced form. Second, the
polyanionic nature of DNA is responsible for the negative shift in midpoint potential
observed upon protein binding to DNA.
DNA Helicases with 4Fe-4S Clusters. SFII family DNA helicases contain a 4Fe-
4S cluster, which has been well conserved throughout evolution. The 4Fe-4S
cluster in these helicases seems to act as a wedge that separates double helical
DNA in a process that is driven by ATP hydrolysis (31-34). Notably, upon ATP
hydrolysis, it is thought that the 4Fe-4S cluster is brought closer to the DNA
nucleobases, which in turn could facilitate electron transfer from the 4Fe-4S cluster
of the helicase to the DNA (16, 17). This phenomenon has been observed for XPD
from Sulfolobus Acidocaldarius, which has a midpoint potential of 80mV v. NHE as
measured on DNA-modified gold electrodes. An increase in signal intensity as
measured by cyclic voltammetry upon ATP addition suggests better electronic

6 coupling between the 4Fe-4S cluster of XPD and the electrode upon ATP
hydrolysis.
The E. coli DNA helicase DinG, another SFII family helicase, has also been
studied extensively to determine the redox properties of its 4Fe-4S cluster. These
studies have provided conflicting information about the redox properties of the
4Fe-4S cluster in DinG. Specifically, one study out of the Ding lab indicated that, in
contrast to DNA glycosylases, the 4Fe-4S cluster in DinG was not susceptible to
oxidative degradation. Additionally, using chemical redox titrations, it was
determined that the 4Fe-4S cluster of DinG could be reversibly cycled between the
1+ and 2+ oxidation states with a midpoint potential of -390 ± 23 mV v. NHE at pH
8.0 (35). Notably, none of these studies tested the redox behavior of DinG when
bound to DNA. In contrast, a second study suggested that the 4Fe-4S cluster in
DinG could be oxidized to the 3+ oxidation state. Furthermore, when bound to
DNA, the midpoint potential of the 2+/3+ couple of the 4Fe-4S cluster in DinG was
80 mV v. NHE. The 1+/2+ couple of the 4Fe-4S cluster could not be determined
from these experiments (17). Like XPD, addition of ATP led to an increase in the
signal intensity of the [4Fe-4S]2+/3+ couple as measured by cyclic voltammetry on
DNA-modified gold electrodes. Thus, this study showed that the similarity in
midpoint potential between DNA glycosylases and DNA helicases when bound to
DNA suggests electrons can be transferred between their metal centers in a DNA-
mediated self-exchange reaction (16, 17).
A Model for DNA Charge Transport in DNA Repair. The chemical
characteristics of the 4Fe-4S clusters in DNA repair proteins described above are
the basis for a model for how these proteins signal each other with DNA-mediated
redox chemistry as a first step in DNA damage detection (Figure 3) (10, 15-17).
This model provides a mechanism by which DNA repair proteins can use DNA CT
to scan the genome for sites of damage. In this model, the 4Fe-4S cluster of a
DNA repair protein becomes oxidized by an oxidant endogenous to the cell, like a

7
guanine radical (14, 47). If a second DNA repair protein binds downstream of the
first protein, and there is no intervening lesion, the second protein injects an
electron into the DNA π-stack. This electron can travel through the DNA to
reduce the distally bound protein. Once in the 2+ oxidation state, this protein has
a low affinity for DNA, and dissociates to undergo 3D diffusion to a new area of the
genome. However, if there is a site of DNA damage between these two
Figure 1.3. Model for DNA Charge Transport in DNA Repair. In the cytoplasm of E. coli, the 4Fe-4S cluster in the DNA binding protein is in the 2+ oxidation state. This protein can then bind DNA, shifting the midpoint potential of the 4Fe-4S cluster in the protein such that it is more susceptible to oxidation. The presence of a common oxidant, like a guanine radical (1) oxidizes the 4Fe-4S cluster to the 3+ oxidation state (2). A protein with a 4Fe-4S cluster in the 2+ oxidation state becomes oxidized to the 3+ oxidation state upon binding to DNA, and releases an electron into the DNA π-stack. If there is no intervening DNA lesion, this electron can reduce the 4Fe-4S cluster of a distal enzyme. Since the protein has a lower affinity for DNA when its 4Fe-4S cluster is in the 2+ oxidation state, the protein is more likely to dissociate from the DNA and bind in a new region of the genome. If there is a mismatch between the two enzymes, charge transport will be attenuated, and both enzymes will remain bound to DNA in their oxidized form. These proteins can then undergo 1D diffusion along DNA to find and repair the DNA lesion. Figure 5 from Reference 88.
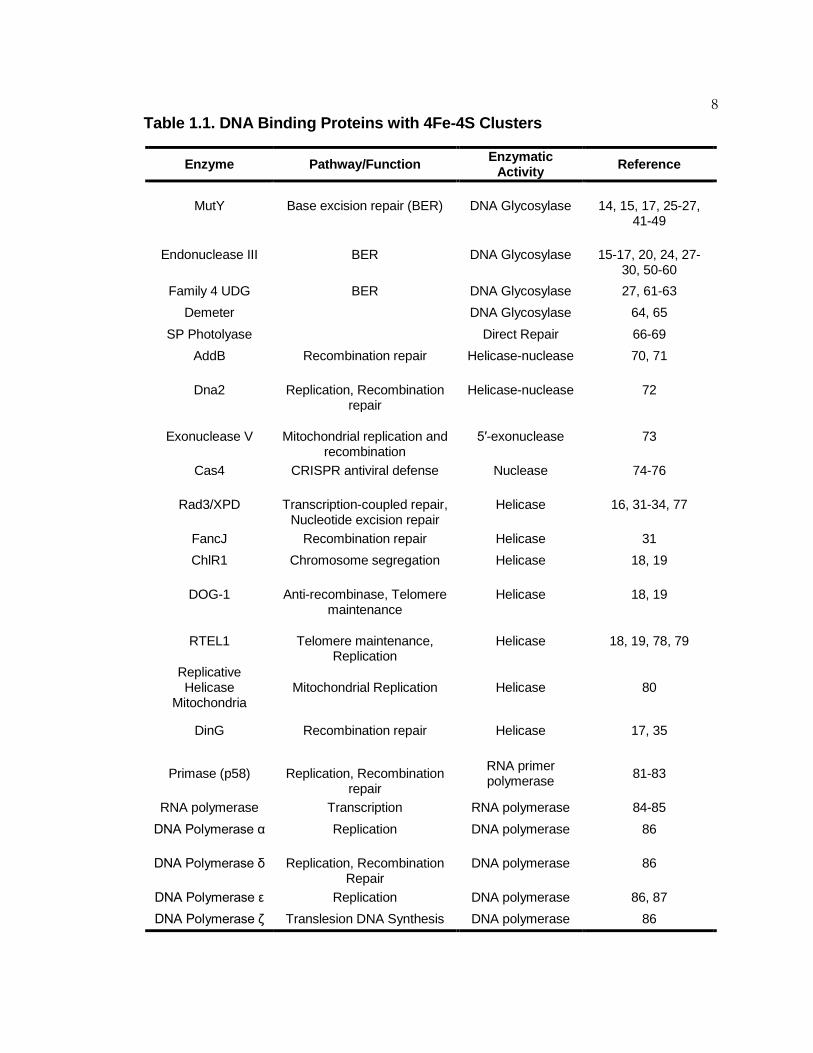
8 Table 1.1. DNA Binding Proteins with 4Fe-4S Clusters
Enzyme Pathway/Function Enzymatic Activity Reference
MutY Base excision repair (BER) DNA Glycosylase
14, 15, 17, 25-27, 41-49
Endonuclease III BER DNA Glycosylase 15-17, 20, 24, 27-
30, 50-60 Family 4 UDG BER DNA Glycosylase 27, 61-63
Demeter DNA Glycosylase 64, 65 SP Photolyase Direct Repair 66-69
AddB Recombination repair Helicase-nuclease 70, 71
Dna2
Replication, Recombination repair
Helicase-nuclease 72
Exonuclease V
Mitochondrial replication and recombination
5′-exonuclease 73
Cas4 CRISPR antiviral defense Nuclease 74-76
Rad3/XPD
Transcription-coupled repair, Nucleotide excision repair
Helicase 16, 31-34, 77
FancJ Recombination repair Helicase 31 ChlR1 Chromosome segregation Helicase 18, 19
DOG-1
Anti-recombinase, Telomere maintenance
Helicase 18, 19
RTEL1
Telomere maintenance, Replication
Helicase 18, 19, 78, 79
Replicative Helicase
Mitochondria Mitochondrial Replication Helicase 80
DinG Recombination repair Helicase 17, 35
Primase (p58)
Replication, Recombination repair
RNA primer polymerase 81-83
RNA polymerase Transcription RNA polymerase 84-85 DNA Polymerase α Replication DNA polymerase 86
DNA Polymerase δ
Replication, Recombination Repair
DNA polymerase 86
DNA Polymerase ε Replication DNA polymerase 86, 87 DNA Polymerase ζ Translesion DNA Synthesis DNA polymerase 86
9 proteins, DNA CT cannot occur and the 4Fe-4S cluster of the distal protein
will remain in the 3+ oxidation state. This DNA repair protein remains bound to
DNA, and processes along the double helix via 1D diffusion to find and repair
the site of damage as described by established mechanisms (36-39). This model
provides an explanation for how redox-active DNA repair proteins, like MutY,
which are found at a low copy number of about 30 per cell (40), can scan the
genome for damaged nucleobases within the doubling time of E. coli.
A mathematical model was developed to prove that DNA CT could increase
the efficiency of the DNA glycosylase search process (15). This model compared
the search time of MutY as a function of DNA CT distance and percentage of
protein with an oxidized 4Fe-4S cluster. This model showed that without DNA CT,
a protein that was maintained at a copy number of 30 per cell would take 46
minutes to search the entire E. coli genome using 1D diffusion along the DNA
helix. However, if DNA CT could occur over just 200 base pairs, then with only
20% of total protein in the 3+ oxidation state, the search time could be reduced to
8 minutes. When considering the feasibility of these search times it is important to
remember that the doubling time of E. coli is about 30 minutes. Additionally, under
normal growth conditions, in which low mutagenesis is observed, there must be a
mechanism to repair DNA damage prior to replication and cell division. Thus, a
search process that relies on purely 1D diffusion cannot provide an explanation for
how proteins present on the order of tens of copies per cell could search, let alone
repair, DNA damage in the entire E. coli genome prior to replication. This model for
DNA-mediated signaling in DNA repair could provide an additional mechanism by
which these proteins localize to sites of DNA damage within the cell.
Conclusion. In this thesis, methods were developed to study the model for DNA
CT in DNA repair. Specifically, to understand the applicability of the model
described above to eukaryotic systems, the chemical characteristics of the 4Fe-4S
cluster in Dna2, a eukaryotic helicase-nuclease involved in DNA repair and
replication, were determined with a variety of spectroscopic and electrochemical
10 techniques. Electrochemical studies of the metal center in Dna2 provided insight
into the role of this cofactor within eukaryotic DNA repair and replication. In
addition to the Dna2 studies, a biological assay was developed to study DNA-
mediated signaling between MutY, EndoIII, and DinG as a first step in DNA
damage detection. The combination of these studies provided insight into how
DNA-mediated redox signaling could be used within the cell.
Nitrogenase
Nitrogenase is the only enzyme found in nature that catalyzes the reduction
of atmospheric dinitrogen to bioavailable ammonia in a process known as nitrogen
fixation (89). The only other mechanism by which significant amounts of ammonia
are produced from dinitrogen is by an industrial method called the Haber-Bosch
process, which employs extremely high temperatures (350-550 °C) and pressures
(250-350 atm) along with a heterogeneous metal catalyst to drive this reaction (90-
92). The Haber-Bosch process is employed as the industrial method to fix
dinitrogen for use in the production of artificial fertilizers, which helps to sustain
food production. This process currently consumes up to 2% of global energy
production, and this energy demand will continue to expand as the food
requirement increases with the population (93, 94). A better understanding of the
mechanism of nitrogenase, which uses energy derived from ATP hydrolysis at
ambient pressure and temperature to reduce dinitrogen, could help guide
development of alternate, less energy intensive, nitrogen fixation methods.
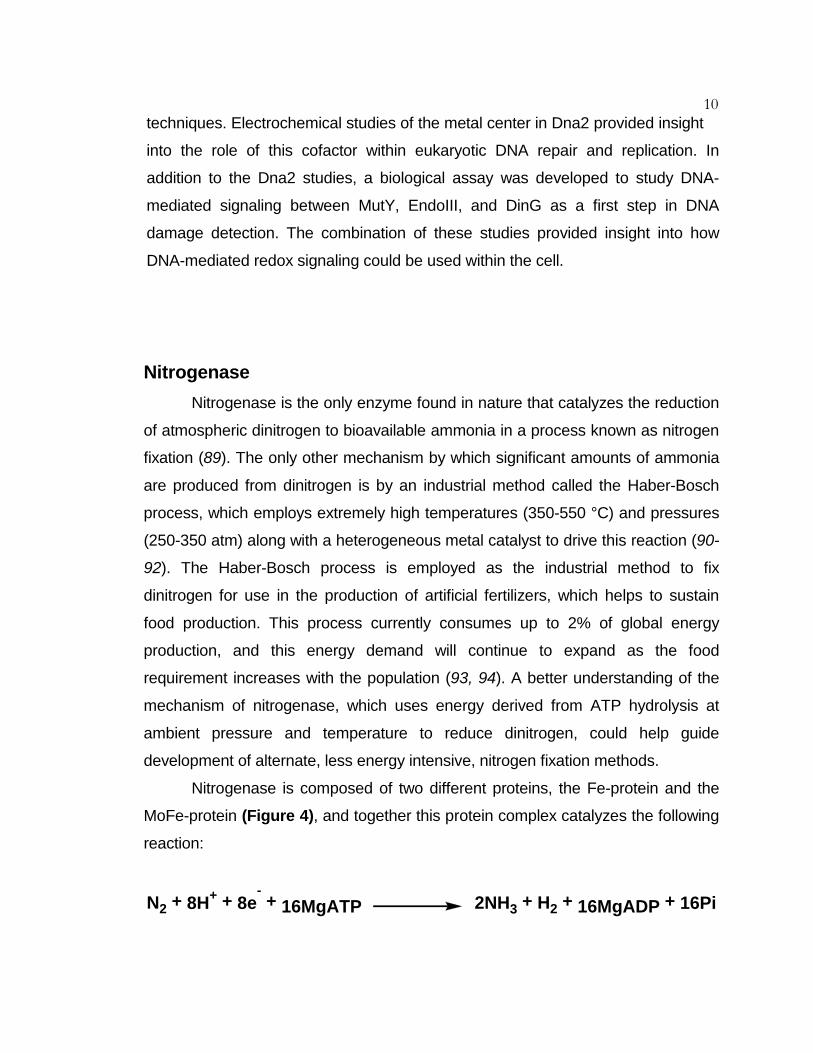
Nitrogenase is composed of two different proteins, the Fe-protein and the
MoFe-protein (Figure 4), and together this protein complex catalyzes the following
reaction:
N2 + 8H+ + 8e
- + 16MgATP
2NH3 + H2
+ 16MgADP + 16Pi

11
The Fe-protein is a 63 kDa γ2 homodimer that contains a single 4Fe-4S cluster that
bridges the two monomers. This protein is the physiological reductant of the MoFe-
protein, and uses ATP hydrolysis at two ATP binding sties to gate electron transfer
to the metal centers in the MoFe-protein (95-98). The Fe-protein can only function
as an ATPase when in complex with the MoFe-protein. The MoFe-protein is a 230
kDa α2β2 heterotetramer, which contains two different metal cofactors, the P-
cluster and the FeMo-cofactor. The P-cluster is an 8Fe-7S cluster, which serves as
a gateway for electrons into the FeMo-cofactor. The FeMo-cofactor is the site of
substrate reduction, and consists of a 7Fe:9S:1C:1Mo-R-homocitrate cluster (96-
100). Although the MoFe-protein is composed of 2α- and 2β-subunits, and thus
contains two FeMo-cofactor active sites, each αβ pair acts independently to
catalyze nitrogen reduction. Substrates can only bind to the FeMo-cofactor when it
has been reduced by 2-4 electrons relative to the state of the cofactor as isolated
in the presence of the reductant sodium dithionite (89, 97). Thus, prior to substrate
reduction, multiple rounds of electron transfer from the 4Fe-4S cluster of the Fe-
protein to the P-cluster, and from the P-cluster to the FeMo-cofactor must occur in
a mechanism that is gated by ATP hydrolysis.
Electron Transfer in Nitrogenase. The mechanism of electron transfer between
the different metal centers in nitrogenase has been studied using a combination of
X-ray crystallography and electrochemistry (96, 97, 101). Electrochemical methods
provided information about the midpoint potentials of the nitrogenase metal
clusters. Thus, these experiments yielded thermodynamic information to assess
the feasibility of different electron transfer mechanisms (Table 2) (107-114). X-ray
crystallography has provided data on the distances between the metal cofactors in
different conformational states of the enzyme complex. In general, single-step
electron transfer between two metal centers is extremely sensitive to the distance
between the metal clusters with facile electron transfer occuring only between

12
cofactors separated by distances less than about 15 Å (102-104). Therefore, these
studies have provided insight into possible electron transfer mechanisms by
considering the distances between the metal clusters in different protein
conformational states.
Figure 1.4. Structure of the Nitrogenase Complex. The structure of the Azotobacter vinelandii nitrogenase complex with AMP-PCP bound to the Fe-protein (PDB Entry = 4WZB). The nucleotide binding sites are not shown in this structure. The Fe-protein is shown in pink and the MoFe-protein is shown in green. The metal centers are highlighted in yellow. The chemical structures of the three nitrogenase metal clusters are shown in black.
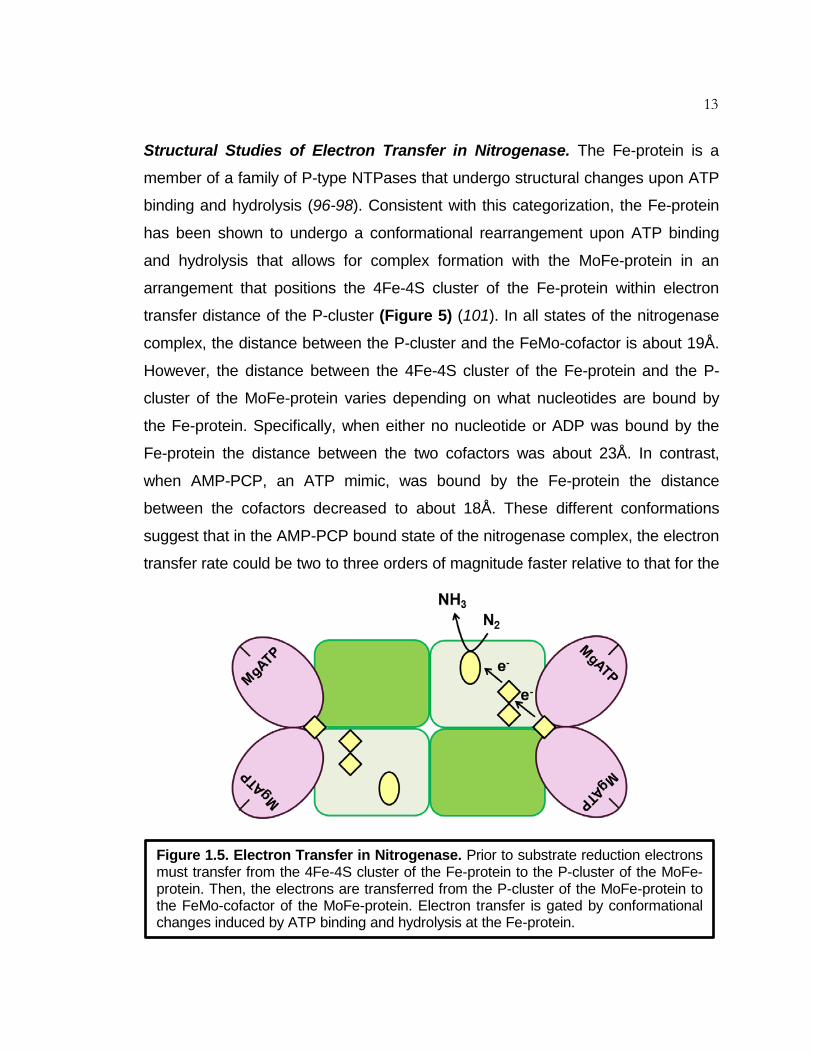
13 Structural Studies of Electron Transfer in Nitrogenase. The Fe-protein is a
member of a family of P-type NTPases that undergo structural changes upon ATP
binding and hydrolysis (96-98). Consistent with this categorization, the Fe-protein
has been shown to undergo a conformational rearrangement upon ATP binding
and hydrolysis that allows for complex formation with the MoFe-protein in an
arrangement that positions the 4Fe-4S cluster of the Fe-protein within electron
transfer distance of the P-cluster (Figure 5) (101). In all states of the nitrogenase
complex, the distance between the P-cluster and the FeMo-cofactor is about 19Å.
However, the distance between the 4Fe-4S cluster of the Fe-protein and the P-
cluster of the MoFe-protein varies depending on what nucleotides are bound by
the Fe-protein. Specifically, when either no nucleotide or ADP was bound by the
Fe-protein the distance between the two cofactors was about 23Å. In contrast,
when AMP-PCP, an ATP mimic, was bound by the Fe-protein the distance
between the cofactors decreased to about 18Å. These different conformations
suggest that in the AMP-PCP bound state of the nitrogenase complex, the electron
transfer rate could be two to three orders of magnitude faster relative to that for the
Figure 1.5. Electron Transfer in Nitrogenase. Prior to substrate reduction electrons must transfer from the 4Fe-4S cluster of the Fe-protein to the P-cluster of the MoFe-protein. Then, the electrons are transferred from the P-cluster of the MoFe-protein to the FeMo-cofactor of the MoFe-protein. Electron transfer is gated by conformational changes induced by ATP binding and hydrolysis at the Fe-protein.
14 nucleotide free form of nitrogenase (101). Thus, it was proposed that nucleotide
binding, and potentially also hydrolysis, could gate electron transfer between the
4Fe-4S cluster of the Fe-protein and the P-cluster of the MoFe-protein. In addition
to distances between the cofactors in nitrogenase, another important value for
determining the feasibility of different electron transfer mechanisms is the midpoint
potential of the metal cofactors.
Thermodynamic Properties of the Fe-Protein. Despite its relatively modest
midpoint potential, the Fe-protein is the only known biological reductant capable of
reducing the FeMo-cofactor to a state that is competent for substrate reduction.
The 4Fe-4S cluster in the Fe-protein is unusual in that it can exist in three different
oxidation states (105, 106). The three different oxidation states of the 4Fe-4S
cluster in the Fe-protein are 0 (S = 0, 4), 1+ (S = 1/2, 3/2), and 2+ (S = 0) (89, 97).
The midpoint potential of the 1+/2+ couple of the 4Fe-4S cluster in the Fe-
protein is -300 mV v. NHE (107). Upon MgATP binding or MgADP binding, the
midpoint potential of the Fe-protein shifts about -120 mV or -160 mV, respectively
(108). The midpoint potential of the Fe-protein also undergoes a negative potential
shift upon binding the MoFe-protein in the presence of aluminum fluoride-MgADP,
an ATP hydrolysis mimic. The potential of the Fe-protein in this complex could not
be determined; however, it was concluded that it must be significantly less than -
550 mV v. NHE (109). Thus, the midpoint potential of the [4Fe-4S]1+/2+ couple
shifts such that there is a larger driving force for electron transfer from the 4Fe-4S
cluster of the Fe-protein to the metal centers in the MoFe-protein in the nucleotide-
bound state of the nitrogenase complex.
There is less known about the midpoint potential of the 1+/0 couple of the
Fe-protein, and there are discrepancies in the literature about the midpoint
potential of this transition. In one report, the potential was found to be -460 mV v.
NHE, while in a second report the potential was reported to be -790 mV v. NHE
(110, 111). If the true potential of this reaction is closer to the latter value it would
most likely not be a biologically relevant redox couple. However, if the true

15 midpoint potential was about -460 mV v. NHE, this transition would be important
in the nitrogenase mechanism. Initial results have suggested that in Azotobacter
vinelandii one of the biological reductants of nitrogenase, flavodoxin II, can reduce
the Fe-protein to its all ferrous form; however, these results remain controversial
(106). Thus, the biological relevance of the all-ferrous form of the Fe-protein
depends on the true value of the midpoint potential of the 4Fe-4S1+/0 couple.
Thermodynamic Properties of the MoFe-Protein. Electrochemical methods
were also used to study the midpoint potential of the two metal centers in the
MoFe-protein. Chemical redox titrations have indicated that the P-cluster reversibly
cycles through four different oxidation states; however, the net charge on the P-
cluster in any of the oxidation states is not known (97). The four different oxidation
states that the P-cluster cycles through are the PN (S = 0), PSemiox (S = 1/2, 5/2) ,
POx1 (S = 3,4), and POx2 (S = 1/2, 7/2) states. As isolated in the presence of sodium
dithionite, the P-cluster is in the PN oxidation state. The midpoint potential of both
the PN/Semiox and PSemiox/Ox1 couple is -307 mV v. NHE. The midpoint potential of the
POx1/POx2 couple is +90 mV v. NHE (97, 112, 113). Upon binding to the Fe-protein
in the presence of an ATP hydrolysis mimic, the midpoint potentials of both the
PN/Semiox and PSemiox/Ox1 couples of the P-cluster shift such that they are significantly
more negative. Thus, in the two-protein nitrogenase complex, the midpoint
potential of the P-cluster shifts such that there is a larger driving force to reduce the
MoFe protein (109).
The other metal cluster in the MoFe-protein is the FeMo-cofactor, and it has
been hypothesized that this cofactor cycles through three different oxidation states:
MOx, MN, and MR. Like the P-cluster, the net charge on the FeMo-cofactor has not
been determined for any oxidation state of the metal center (97,115). When the
MoFe-protein is isolated in the presence of sodium dithionite, the FeMo-cofactor is
in the MN oxidation state with a spin state of S=3/2. The MR oxidation state is the
fully reduced form of the FeMo-cofactor, which is the only state of the cofactor to
which substrates and inhibitors can bind (89, 97). The only measured midpoint
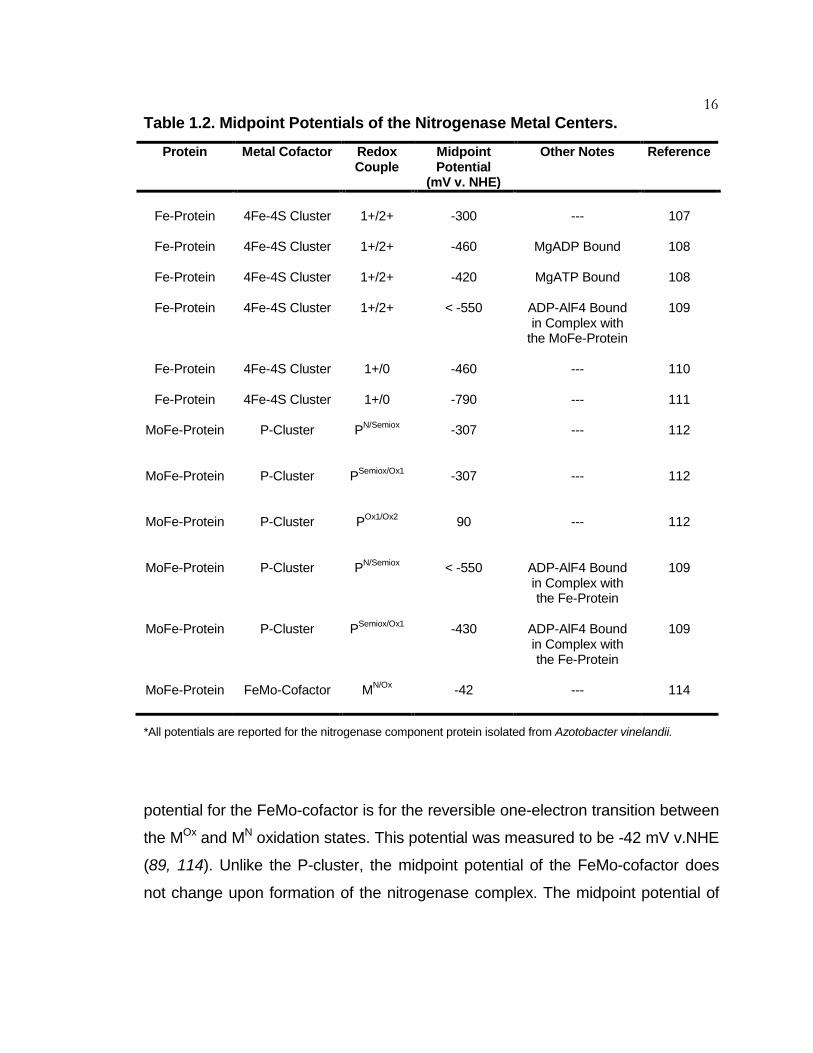
16 Table 1.2. Midpoint Potentials of the Nitrogenase Metal Centers.
Protein Metal Cofactor Redox Couple
Midpoint Potential
(mV v. NHE)
Other Notes Reference
Fe-Protein
4Fe-4S Cluster
1+/2+
-300
---
107
Fe-Protein
4Fe-4S Cluster
1+/2+
-460
MgADP Bound
108
Fe-Protein
4Fe-4S Cluster
1+/2+
-420
MgATP Bound
108
Fe-Protein
4Fe-4S Cluster
1+/2+
< -550
ADP-AlF4 Bound in Complex with
the MoFe-Protein
109
Fe-Protein
4Fe-4S Cluster
1+/0
-460
---
110
Fe-Protein
4Fe-4S Cluster
1+/0
-790
---
111
MoFe-Protein
P-Cluster
PN/Semiox
-307
---
112
MoFe-Protein
P-Cluster
PSemiox/Ox1
-307
---
112
MoFe-Protein
P-Cluster
POx1/Ox2
90
---
112
MoFe-Protein
P-Cluster
PN/Semiox
< -550
ADP-AlF4 Bound in Complex with the Fe-Protein
109
MoFe-Protein
P-Cluster
PSemiox/Ox1
-430
ADP-AlF4 Bound in Complex with the Fe-Protein
109
MoFe-Protein
FeMo-Cofactor
MN/Ox
-42
---
114
*All potentials are reported for the nitrogenase component protein isolated from Azotobacter vinelandii.
potential for the FeMo-cofactor is for the reversible one-electron transition between
the MOx and MN oxidation states. This potential was measured to be -42 mV v.NHE
(89, 114). Unlike the P-cluster, the midpoint potential of the FeMo-cofactor does
not change upon formation of the nitrogenase complex. The midpoint potential of
17 the MN/MR couple is unknown (109). Thus, it is not clear what potential is
required for substrate binding to the FeMo-cofactor.
Conclusion. The electrochemical and structural studies of nitrogenase are
consistent with a mechanism of electron transfer from the 4Fe-4S of the Fe-protein
to the P-cluster followed by electron transfer from the P-cluster to the FeMo-
cofactor, the site of substrate reduction. This electron transfer process is gated by
ATP binding and hydrolysis at the Fe-protein, which initiates a series of
conformational changes in the nitrogenase complex. Despite progress made in the
understanding of electron transfer in nitrogenase, there are still a number of
questions that remain regarding how eight electrons can be delivered to dinitrogen
to produce ammonia during nitrogen reduction. In this thesis, electrochemical
methods were developed as tools to investigate these questions. Direct
electrochemistry on single crystal gold electrodes and edge-plane pyrolytic
graphite electrodes provided insight into the redox properties of the 4Fe-4S cluster
of the Fe-protein isolated from Azotobacter vinelandii. Surfactant-modified basal
plane graphite electrodes were also developed as a method for studying the redox
properties of flavodoxin II, a biological reductant of nitrogenase. This method was
complemented with structural studies to better characterize the interaction between
flavodoxin II and the Fe-protein of nitrogenase with a focus on determining the
molecular interactions that facilitate reduction of the 4Fe-4S cluster of the Fe-
protein to its all ferrous state. In combination, this research has provided insight
into the biological mechanism of electron transfer to and through nitrogenase.

18 References
1. Bertini, I., Harry B. Gray, Edward I. Stiefel, and Joan Selverstone Valentine. Biological Inorganic Chemistry: Structure and Reactivity. Sausalito: University Science Books, 2007. Print.
2. Liu, J., Chakraborty, S., Hosseinzadeh, P., Yu, Y., Tian, S., Petrik, I., Bhagi, A., and Lu, Y. (2014) Metalloproteins Containing Cytochrome, Iron-Sulfur, or Copper Redox Centers. Chem Rev. 114, 4366-4469.
3. Winkler, J. R. and Gray, H. B. (2014) Electron Flow through Metalloproteins. Chem Rev. 114, 3369-3380.
4. Watson, J. D. and Crick, F. H. C. (1953) A Structure for Deoxyribose
Nucleic Acid. Nature. 171, 737-738. 5. Eley, D. D. and Spivey, D. I. (1962) Semiconductivity of Organic
Substances. Part 9 – Nucleic Acid in the Dry State. Trans. Faraday Soc. 58, 411-415.
6. O’Neill, M. A. and Barton, J.K. (2005) Sequence-Dependent DNA
Dynamics: The Regulator of DNA-mediated Charge Transport. Chapter 2, 27-75 from Wagenknecht, H.-A. Charge Transfer in DNA: From Mechanism to Application. WILEY-VCH Verlag GmbH & Co.
7. Genereux, J. C. and Barton, J. K. (2010) Mechanisms for DNA Charge
Transport. Chem Rev. 110, 1642-1662.
8. Delaney, S. and Barton, J. K. (2003) Long-Range DNA Charge Transport. J Org Chem. 68, 6475-6483.
9. Muren, N. B., Olmon, E. D., and Barton, J. K. (2012) Solution, Surface, and
Single Molecule Platforms for the Study of DNA-Mediated Charge Transport. Phys Chem Chem Phys. 14, 13754-13771.
10. Genereux, J. C., Boal, A. K., and Barton, J. K. (2010) DNA-Mediated
Charge Transport in Redox Sensing and Signaling. J Am Chem Soc. 132, 891-905.
19 11. Gorodetsky, A. A., Dietrich, L. E. P., Lee, P. E., Demple, B., Newman, D.
K., and Barton, J. K. (2008) DNA Binding Shifts the Redox Potential of the Transcription Factor SoxR. Proc. Natl. Acad. Sci. USA. 105, 3684-3689.
12. Lee, P. E., Demple, B., and Barton, J. K. (2009) DNA-Mediated Redox
Signaling for Transcriptional Activation of SoxR. Proc. Natl. Acad. Sci. USA 106, 13164-13168.
13. Arnold, A. R. and Barton, J. K. (2013) DNA Protection by the Bacterial
Ferritin Dps via DNA Charge Transport. J. Am. Chem. Soc. 135, 15726-15729.
14. Yavin, E., Boal, A. K., Stemp, E. D. A., Boon, E. M., Livingston, A. L.,
O’Shea, V. L., David, S. S., and Barton, J. K. (2005) Protein-DNA Charge Transport: Redox Activation of a DNA Repair Protein by Guanine Radical. Proc. Nat. Acad. Sci. USA. 102, 3546-3551.
15. Boal, A. K., et al. (2009) Redox Signaling Between DNA Repair Proteins for
Efficient Lesion Detection. Proc. Natl. Acad. Sci. U.S.A. 106, 15237-15242.
16. a) Mui, T. P., Fuss, J. O., Ishida, J. P., Tainer, J. A., and Barton, J. K . (2011) ATP-Stimulated, DNA-Mediated Redox Signaling by XPD, a DNA Repair and Transcription Helicase. J. Am. Chem. Soc. 133, 16378-16381. b) Sontz, P. A., Mui, T. P., Fuss, J. O., Tainer, J. A., and Barton, J. K. (2012) DNA Charge Transport as a First Step in Coordinating the Detection of Lesions by Repair Proteins. Proc. Natl. Acad. Sci. USA. 109, 1856-1861.
17. Grodick, M. A., Segal, H. M., Zwang, T. J., and Barton, J. K. (2014) DNA-
Mediated Signaling by Proteins with 4Fe-4S Clusters Is Necessary for Genomic Integrity. J. Am. Chem. Soc. 136, 6470-6478.
18. White, M. F. and Dillingham, M. S. (2012) Iron-Sulphur Clusters in Nucleic
Acid Processing Enzymes. Curr. Op. Struct. Biol. 22, 94-100.
19. Wu, Y. and Brosch, R. M. Jr. (2012) DNA Helicase and Helicase-Nuclease Enzymes with a Conserved Iron-Sulfur Cluster. Nucleic Acids Res. 40, 4247-4260.
20. Cunningham, R. P., et al. (1989) Endonuclease III is an Iron-Sulfur
Protein. Biochem. 28, 4450-4455.

20
21. Friedman, J. I. and Stivers, J. T. (2010) Detection of Damaged DNA Bases by DNA Glycosylase Enzymes. Biochem. 49, 4957.
22. Breimer, L. H. and Lindahl T. (1984) DNA Glycosylase Activities for
Thymine Residues Damaged by Ring Saturation, Fragmentation, or Ring Contraction are Functions of Endonuclease III in Escherichia coli. J. Biol. Chem. 259, 5543–5548.
23. Au, K. G., Clark, S., Miller, J. H., and Modrich, D. (1989) Escherichia coli
mutY Gene Encodes an Adenine Glycosylase Active on G-A Mispairs. Proc. Natl. Acad. Sci. USA. 86, 8877-8881.
24. Fromme, J. C. and Verdine, G. L. (2003) Structure of a Trapped Endonuclease III-DNA Covalent Intermediate. EMBO J. 22, 3461-3471.
25. Fromme, J. C., Banerjee, A., Huang, S. J., and Verdine, G. L. (2004)
Structural Basis for Removal of Adenine Mispaired with 8-Oxoguanine by MutY Adenine DNA Glycosylase. Nature. 427, 652-656.
26. Poreelo, S. L, Cannon, M. J., and David, S. S. (1998) A Substrate Recognition Role for the [4Fe-4S]2+ Cluster of the DNA Repair Glycosylase MutY. Biochem. 37, 6465-6475.
27. Boal, A. K., Yavin, E., Lukianova, O. A., O’Shea, V. L., David, S. S., and Barton, J. K. (2005) DNA-Bound Redox Activity of DNA Repair Glycosylases Containing [4Fe-4S] Clusters. Biochem. 44, 8397-8407.
28. Romano, C. A.*, Sontz, P. A.*, and Barton, J. K. (2011) Mutants of the Base
Excision Repair Glycosylase, Endonuclease III: DNA Charge Transport as a First Step in Lesion Detection. Biochem. 50, 6133-6145.
29. Gorodetsky, A. A., Boal, A. K., and Barton, J. K. (2006) Direct
Electrochemistry of Endonuclease III in the Presence and Absence of DNA. J Am Chem Soc. 128, 12082-12083.
30. Pheeney, C. G., Arnod, A. R., Grodick, M. A., and Barton, J. K. (2013) Multiplexed Electrochemistry of DNA-Bound Metalloproteins. J Am Chem Soc. 135, 11869-11878.
21 31. Rudolf, J., Makrantoni, V., Ingledew, W. J., Stark, M. J., and White, M.
F. (2006) The DNA Repair Helicases XPD and FancJ have Essential Iron-Sulfur Domains. Mol Cell. 23, 801-808.
32. Fan, L., et al. (2008) XPD Helicase Structures and Activities: Insights into the Cancer and Aging Phenotypes from XPD Mutations. Cell. 133, 789-800.
33. Liu, H., et al. (2008) Structure of the DNA Repair Helicase XPD. Cell. 133, 801-812.
34. Wolski, S. C., et al. (2008) Crystal Structure of the FeS Cluster-Containing Nucleotide Excision Repair Helicase XPD. PLoS Biology. 24, e149.
35. Ren, B., Duan, X., and Ding, H. (2009) Redox Control of the DNA Damage-Inducible Protein DinG Helicase Activity via its Iron-Sulfur Cluster. J Biol Chem. 284, 7746-7755.
36. Blainey, P. C., van Oijen, A. M., Banerjee, A., Verdine, G. L., and Xie, X. S.
(2006) A Base-Excision DNA-Repair Protein finds Intrahelical Lesion Bases by Fast Sliding in Contact with DNA. Proc Natl Acad Sci. 103, 5752-5757.
37. Nelson, S. R., Dunn, A. R. Kathe, S. D., Warshaw, D. M., and Wallace, S.
S. (2014) Two Glycosylase Families Diffusively Scan DNA using a Wedge Residue to Probe for and Identify Oxidatively Damaged Bases. Proc Natl Acad Sci. 111, E2091-E2099.
38. Nelson, S. R., Dunn, A. R. Kathe, S. D., Warshaw, D. M., and Wallace, S.
S. (2014) Two Glycosylase Families Diffusively Scan DNA Using a Wedge Residue to Probe for and Identify Oxidatively Damaged Bases. Proc Natl Acad Sci. USA. 111, E2091-E2099.
39. Dunn, A. R., Kad, N. M., Nelson, S. R., Warshaw, D. M., and Wallace, S. S.
(2011) Single Qdot-Labeled Glycosylase Molecules Use a Wedge Amino Acid to Probe for Lesions while Scanning Along DNA. Nucleic Acids Res. 39, 7487-7498.
40. Demple, B. and Harrison, L. (1994) Repair of Oxidative Damage to DNA:
Enzymology and Biology. Ann Rev Biochem. 63, 915-948.

22 41. Golinelli, M. P., Chmiel, N. H., and David, S. S. (1999) Site-Directed
Mutagenesis of the Cysteine Ligands to the [4Fe-4S] Cluster of Escherichia coli MutY. Biochem. 38, 6997-7007.
42. Chepanoske, C. L., Golinelli, M. P., Williams, S. D., and David, S. S. (2000) Positively Charged Residues within the Iron-Sulfur Cluster Loop of E. coli MutY Participate in Damage Recognition and Removal. Arch Biochem Biophys. 380, 11-9.
43. Boon, E. M., Pope, M. A., Williams, S. D., David, S. S., and Barton, J. K. (2002) DNA-Mediated Charge Transport as a Probe of MutY/DNA Interaction. Biochem. 41, 8464-8470.
44. Lu, A. L. and Wright, P. M. (2003) Characterization of an Escherichia coli Mutant MutY with a Cysteine to Alanine Mutation at the Iron-Sulfur Domain. Biochem. 42, 3742-3750.
45. Boon, E. M., Livingston, A. L., Chmiel, N. H., David, S. S., and Barton, J. K. (2004) DNA-Mediated Charge Transport for DNA Repair. Proc Natl Acad Sci USA. 100, 12543-12547.
46. Lee, C. Y., Bai, H., Houle, R., Wilson, G. M., and Lu, A. L. (2004) An Escherichia coli MutY Mutant without the Six-Helix Barrel Domain is a Dimer in Solution and Assembles Cooperatively into Multisubunit Complexes with DNA. J Biol Chem. 279, 52653-52663.
47. Yavin, E., Stemp, E. D., O’Shea, V. L., David, S. S., and Barton, J. K.
(2006) Electron Trap for DNA-Bound Repair Enzymes: A Strategy for DNA-Mediated Signaling. Proc Natl Acad Sci USA. 103, 3610-3614.
48. Bai, H. and Lu, A. L. (2007) Physical and Functional Interactions Between Escherichia coli MutY Glycosylase and Mismatch Repair Protein MutS. J Bacteriol. 189, 902-910.
49. Engstrom, L. M., Brinkmeyer, M. K., Ha, Y., Raetz, A. G., Hedman, B.,
Hodgson, K. O., Solomon, E. I., and David, S. S. (2014) A Zinc Linchpin Motif in the MUTYH Glycosylase Interdomain Connector is Required for Efficient Repair of DNA Damage. J Am Chem Soc. 136, 7829-7832.
50. Fu, W., O’Handley, S., Cunningham, R. P., and Johnson, M. K. (1992)
The Role of the Iron-Sulfur Cluster in Escherichia coli Endonuclease III. A Resonance Raman Study. J Biol Chem. 267, 16135-16137.
51. Kuo, C. F., McRee, D. E., Cunningham, R. P., and Tainer, J. A. (1992) Crystallization and Crystallographic Characterization of the Iron-Sulfur

23 Containing DNA-repair Enzyme Endonuclease III from Escherichia coli. J Mol Biol. 227, 347-351.
52. Duo, C. F., McRee, D. E., Fisher, C. L., O’Handley, S. F., Cunningham, R. P., and Tainer, J. A. (1992) Atomic Structure of the DNA Repair [4Fe-4S] Enzyme Endonuclease III. Science. 258, 434-440.
53. Thayer, M. M., Aheran, H., Xing, D., Cunningham, R. P., and Tainer, J. A. (1995) Novel DNA Binding Motifs in the DNA Repair Enzyme Endonuclease III Crystal Structure. EMBO J. 14, 4108-4120.
54. Aspinwall, R., et al. (1997) Cloning and Characterization of a Functional Human Homolog of Escherichia coli Endonuclease III. Proc Natl Acad Sci USA. 94, 109-114.
55. You, H. J., Swanson, R. L., and Doetsch, P. W. (1998) Saccharomyces cerevisiae Posseses Two Functional Homologues of Escherichia coli Endonuclease III. Biochem. 37, 6033-6040.
56. Alseth, I., Eide, L., Pirovano, M., Rognes, T., Seeberg, E., and Bjørås, M. (1999) The Saccharomyces cerevisiae Homologues of Endonuclease III from Escherichia coli, Ntg1 and Ntg2, are Both Required for Efficient Repair of Spontaneous and Induced Oxidative DNA Damage in Yeast. Mol Cell Biol. 19, 3779-3787.
57. Shekhtman, A., McNaughton, L., Cunningham, R. P., and Baxter, S. M. (1999) Identification of the Archaeoglobus fulgidus Endonuclease III DNA Interaction Surface using Heteronuclear NMR Methods. Structure. 7, 919-930.
58. Roldán-Arjona, T., García-Ortiz, M. V., Ruiz-Rubio, M., and Ariza, R. R. (2000) cDNA Cloning, Expression and Functional Characterization of an Arabidopsis thaliana Homologue of the Escherichia coli DNA Repair Enzyme Endonuclease III. Plant Mol Biol. 44, 43-52.
59. Rogers, P. A., Eide, L., Klungland, A., and Ding, H. (2003) Reversible Inactivation of E. coli Endonuclease III via Modification of Its [4Fe-4S] Cluster by Nitric Oxide. DNA Repair. 2, 809-817.
60. Moe, E., Sezer, M., Hildebrandt, P., and Todorovic, S. (2015) Surface Enhanced Vibrational Spectroscopic Evidence for an Alternative DNA-Independent Redox Activation of Endonuclease III. Chem. Commun. 51, 3255-3257.

24 61. Hinks, J. A., Evans, M. C., DeMiguel, Y., Sartori, A. A., Jiricny, J., and
Pearl, L. H. (2002) An Iron-Sulfur Cluster in the Family 4 Uracil-DNA Glycosylases. J Biol Chem. 277, 16936-16940.
62. Hoseki, J., Okamoto, A., Masui, R., Shibata, T., Inoue, Y., Yokoyama, S., and Kuramitsu, S. (2003) Crystal Structure of a Family 4 Uracil-DNA Glycosylase from Thermus thermophiles HB8. J Mol Biol. 333, 515-526.
63. Engstrom, L. M., Partington, O. A., and David, S. S. (2012) An Iron-Sulfur Cluster Loop Motif in the Archaeoglobus fulgidus Uracil-DNA Glycosylase Mediates Efficient Uracil Recognition and Removal. Biochem. 51, 5187-5197.
64. Mok, Y. G., Uzawa, R., Lee, J., Weiner, G. M., Eichman, B. F., Fischer, R. L., and Huh, J. H. (2010) Domain Structure of the DEMETER 5-Methylcytosine DNA Glycosylase. Proc Natl Acad Sci USA. 107, 19225-19230.
65. Brooks, S. C., Fischer, R. L., Huh, J. H., and Eichman, B. F. (2014) 5-Methylcytosine Recognition by Arabidopsis thaliana DNA Glycosylases DEMETER and DML3. Biochem. 53, 2525-2532.
66. Cheek, J. and Broderick, J. B. (2002) Direct H Atom Abstraction from Spore Photoproduct C-6 Initiates DNA Repair in the Reaction Catalyzed by Spore Photoproduct Lyase: Evidence for a Reversibly Generated Adenosyl Radical Intermediate. J Am Chem Soc. 124, 2860-2861.
67. Buis, J. M., Cheek, J., Kaliri E., and Broderick, J. B. (2006) Characterization of an Active Spore Photoproduct Lyase, a DNA Repair Enzyme in the Radical S-adenosylmethionine Superfamily. J Biol Chem. 281, 25994-26003.
68. Oberpichler, I., et al. (2011) A Photolyase-Like Protein from Agrobacterium tumefaciens with an Iron-Sulfur Cluster. PLoS One. 6, e26775.
69. Zhang, F., Scheerer, P., Oberpichler, I., Lamparter, T., and Kraub, N. (2013) Crystal Structure of a Prokaryotic (6-4) Photolyase with an Fe-S Cluster and a 6,7-Dimethyl-8-ribityllumazine Antenna Chromophore. Proc Natl Acad Sci USA. 110, 7217-7222.
70. Yeeles, J. T., Cammack, R., and Dillingham, M. S. (2009) An Iron-Sulfur Cluster is Essential for the Binding of Broken DNA by AddAB-Type Helicase-Nucleases. J Biol Chem. 284, 7746-7755.

25 71. Cromie, G.A. (2009) Phylogenetic Ubiquity and Shuffling of the Bacterial
RecBCD and AddAB Recombination Complexes. J Bacteriol. 191, 5076-5084.
72. a) Pokharel, S. and Campbell, J. L. (2012) Cross Talk Between the Nuclease and Helicase Activities Dna2: Role of an Essential Iron-Sulfur Cluster Domain. Nucleic Acids Res. 40, 7821-7830. b) Zhou, C. Pourmal, S., and Pavletich, N. P. (2015) Dna2 Nuclease-Helicase Structure, Mechanism and Regulation by Rpa. eLIFE. 4, e09832.
73. Sparks, J. L, Kumar, R., Singh, M., Wold, M. S., Pandita, T. K., and Burgers, P. M. (2012) Human Exonuclease 5 is a Novel Sliding Exonuclease Required for Genomic Stability. J Biol Chem. 287, 42773-42783.
74. Zhang, J., Kasciukovic, T., and White, M. F. (2012) The CRISPR Associated Protein Cas4 is a 5’ to 3’ DNA Exonuclease with an Iron-Sulfur Cluster. PLoS One. 7, e47232.
75. Lemak, S., et al. (2013) Toroidal Structure and DNA Cleavage by the CRISPR-Associated [4Fe-4S] Cluster Containing Cas4 Nuclease SS0001 from Sulfolobus solfactaricus. J Am Chem Soc. 135, 17476-17487.
76. Lemak, S., et al. (2014) The CRISPR-Associated Cas4 Protein Pcal_0546 from Pyrobaculum calidifontis Contains a [2Fe-2S] Cluster: Crystal Structure and Nuclease Activity. Nucleic Acids Res. 42, 11144-11155.
77. Pugh, R. A., et al. (2008) The Iron-Containing Domain is Essential in Rad3
Helicases for Coupling of ATP Hydrolysis to DNA Translocation and for Targeting the Helicase to the Single-Stranded DNA-Double Stranded DNA Junction. J Biol Chem. 283, 1732-1743.
78. Uringa, E. J., Youds, J. L., Lisaingo, K., Lansdorp, P. M., and Boulton, S.
J. (2011) RTEL1: An Essential Helicase for Telomere Maintenance and the Regulation of Homologous Recombination. Nucleic Acids Res. 39, 1647-1655.
79. Landry, A. P. and Ding, H. (2014) The N-terminus Domain of Human DNA Helicase Rtel1 Contains a Redox Active Iron-Sulfur Cluster. Biome Res Int. Article ID 285791.
80. Stiban, J., Farnum, G. A., Hovde, S. L., and Kaguni, L. S. (2014) The N-Terminal Domain of the Drosophila Mitochondrial Replicative DNA
26 Helicase Contains an Iron-Sulfur Cluster and Binds DNA. J Biol Chem. 289, 24032-24042.
81. Klinge, S., Hirst, J., Maman, J. D., Krude, T., and Pellegrini, L. (2007) An
Iron-Sulfur Domain of the Eukaryotic Primase is Essential for RNA Primer Synthesis. Nature Struct Mol Biol. 14, 875-877.
82. Weiner, B. E., et al. (2007) An Iron-Sulfur Cluster in the C-Terminal Domain of the p58 Subunit of Human DNA Primase. J Biol Chem. 282, 33444-33451.
83. Vaithiyalingam, S., Warren, E. M., Eichman, B. F., and Chazin, W. J. (2010) Insights into Eukaryotic DNA Priming from the Structure and Functional Interactions of the 4Fe-4S Cluster Domain of Human DNA Primase. Proc Natl Acad Sci USA. 107, 13684-13689.
84. Hirata, A., Klein, B. J., and Mrakami, K. S. (2008) The X-Ray Crystal Structure of RNA Polymerase from Archaea. Nature. 451, 851-854.
85. Lesssner, F. H., Jennings, M. E., Hirata, A., Duin, E. C., and Lessner, D. J. (2012) Subunit D of RNA Polymerase from Methanosarcina acetivorans Contains Two Oxygen-Labile [4Fe-4S] Clusters: Implications for Oxidant-Dependent Regulation of Transcription. J Biol Chem. 287, 18510-18523.
86. Netz, D. J., et al. (2011) Eukaryotic DNA Polymerases Require an Iron-Sulfur Cluster for the Formation of Active Complexes. Nature Chem Biol. 8, 125-132.
87. Jain, R., et al. (2014) An Iron-Sulfur Cluster in the Polymerase Domain of Yeast DNA Polymerase ɛ. J Mol Biol. 426, 301-308.
88. Sontz, P. A., Muren, N. B., and Barton, J. K. (2012) DNA Charge Transport for Sensing and Signaling. Acc Chem Res. 45, 1792-1800.
89. Spatzal, T. (2015) The Center of Biological Nitrogen Fixation: FeMo Cofactor. Z Anorg Allg Chem. 1, 10-17.
90. Topham, Susan, A. “The History of the Catalytic Synthesis of Ammonia.” Catalysis Science and Technology. Vol. 7. Berlin-Heidelberg: Springer-Verlag, 1985. 1-50. Print.
91. Yiokari, C. G., Pitselis, G. E., Polydoros, D. G., Katsaounis, A. D., and Vayenas, C. G. (2000) High-Pressure Electrochemical Promotion of
27 Ammonia Synthesis over an Industrial Iron Catalyst. J Phys Chem A. 104, 10600-10602.
92. Alberty, R. A. (1994) Thermodynamics of the Nitrogenase Reactions. J Biol Chem. 269, 7099-7102.
93. Galloway, J. N., et al. (2008) Transformation of the Nitrogen Cycle: Recent Trends, Questions, and Potential Solutions. Science. 320, 889-892.
94. Erisman, J. W., Sutton, M. A., Galloway, J., Klimont, Z., and Winiwarter, W. (2008) How a Century of Ammonia Synthesis Changed the World. Nature Geosci. 1, 636-639.
95. Georgiadis, M. M., Komiya, H., Chakrabarti, P., Woo, D., Kornuc, J. J., and Rees, D. C. (2002) Crystallographic Structure of the Nitrogenase Iron Protein from Azotobacter vinelandii. Science. 257, 1653-1659.
96. Howard, J. B. and Rees, D. C. (2006) How Many Metals Does it Take to Fix N2? A Mechanistic Overview of Biological Nitrogen Fixation. Proc Natl Acad Sci USA. 103, 17088-17093.
97. Burgess, B. K. and Lowe, D. J. (1996) Mechanism of Molybdenum Nitrogenase. Chem Rev. 96, 2983-3011.
98. Seefeldt, L. C., Hoffman, B. M., and Dean, D. R. (2009) Mechanism of Mo-Dependent Nitrogenase. Ann Rev Biochem. 78, 701-722.
99. Einsle, O., Tezcan, A. F., Andrade, S. L., Schmid, B., Yoshida, M., Howard, J. B., and Rees, D. C. (2002) Nitrogenase MoFe Protein at 1.16Å Resolution: A Central Ligand in the FeMo Cofactor. Science. 297, 1696-1700.
100. Spatzal, T., Aksoyoglu, M., Zhang, L., Andrade, S. L. A., Schleicher, E., Weber, S., Rees, D. D., and Einsle, O. (2011) Evidence for Interstitial Carbon in Nitrogenase FeMo Cofactor. Science. 334, 940.
101. Tezcan, F. A., Kaiser, J. T., Mustafi, D., Walton, M. Y., Howard, J. B., and Rees, D. C. (2005) Nitrogenase Complexes: Multiple Docking Sites for a Nucleotide Switch Protein. Science. 309, 1377-1380.
102. Winkler, J. R. and Gray, H. B. (2014) Long-Range Electron Tunneling. J Am Chem Soc. 136, 2930-2939.

28 103. Langen, R., Chang, I.-J., Germanas, J. P., Richards, J. H., and Gray,
H. B. (1995) Electron Tunneling in Proteins: Coupling Through a Beta Strand. Science. 268, 1733-1735.
104. Regan, J. J., Di Bilio, A. J., Langen, R., Skov, L. K., Winkler, J. R., Gray, H. B., and Onuchic, J. N. (1995) Electron Tunneling in Azurin: The Coupling Across a Beta-Sheet. Chem Biol. 2, 489-496.
105. Angrove, H. C., Yoo, S. J., Münck, E., and Burgess, B. K. (1998) An All-Ferrous State of the Fe Protein of Nitrogenase. Interaction with Nucleotides and Electron Transfer to the MoFe Protein. J Biol Chem. 273, 26330-26337.
106. Lowery, T. J., Wilson, P. E., Zhang, B., Bunker, J., Harrison, R. G., Nyborg, A. C., Thiriot, D., and G. D. (2006) Flavodoxin Hydroquinone Reduces Azotobacter vinelandii Fe Protein to the All-Ferrous Redox State with a S=0 Spin State. Proc Natl Ac Sci USA. 103, 1131-17136.
107. Ryle, M. J. and Seefeldt, L. C. (1996) Elucidation of a MgATP Signal Transduction Pathway in the Nitrogenase Iron Protein: Formation of a Conformation Resembling the MgATP-Bound State by Protein Engineering. Biochem. 35, 4766-4775.
108. Ryle, M. J. and Seefeldt, L. C. (1996) The [4Fe-4S] Cluster Domain of the Nitrogenase Iron Protein Facilitates Conformational Changes Required for the Cooperative Binding of Two Nucleotides. Biochem. 35, 15654-15662.
109. Spee, J. H., Arendsen, A. F., Wassink, H., Marritt, S. J., Hagen, W. R., and Haaker, H. (1998) Redox Properties and Electron Paramagnetic Resonance Spectroscopy of the Transition State Complex of Azotobacter vinelandii Nitrogenase. FEBS Lett. 432, 55-58.
110. Watt, G. D. and Reddy, K. R. N. (1994) Formation of an All Ferrous Fe4S4 Cluster in the Iron Protein Component of Azotobacter vinelandii Nitrogenase. J Inorg Biochem. 53, 281-294.
111. Guo, M., Sulc, F., Ribbe, M. W., Farmer, P. J., and Burgess, B. K. (2002) Direct Assessment of the Reduction Potential of the [4Fe-4S]1+/0 Couple of the Fe Protein from Azotobacter vinelandii. J Am Chem Soc. 124, 12100-12101.
29 112. Pierik, A. J., Wassink, H., Haaker, H., and Hagen, W. R. (1993) Redox
Properties and EPR Spectroscopy of the P Clusters of Azotobacter vinelandii MoFe Protein. Eur J Biochem. 212, 51-61.
113. Margan, T. V., Mortenson, L. E., McDonald, J. W., Watt, G. D. (1988) Comparison of Redox and EPR Properties of the Molybdenum Iron Proteins of Clostridium pasteurianum and Azotobacter vinelandii Nitrogenases. J Inorg Biochem. 33, 111-120.
114. O’Donnell, M. J. and Smith, B. E. (1978) Electron-Paramagnetic-Resonance Studies on the Redox Properties of the Molybdenum-Iron Protein of Nitrogenase Between +50 and -450 mV. Biochem J. 173, 831-838.
115. Bjornsson, R., Neese, F., Schrock, R. R., Einsle, O., and DeBeer, S. (2015) The Discovery of Mo(III) in FeMoco: Reuniting Enzyme and Model Chemistry. J Biol Inorg Chem. 20, 447-460.
30 C h a p t e r 2
PURIFICATION AND SPECTROSCOPIC CHARACTERIZATION OF S. CEREVISIAE DNA2
Abstract Dna2 is a eukaryotic helicase-nuclease that has multiple roles in genome
maintenance. This protein binds a 4Fe-4S cluster in its nuclease domain that is
required for maximum nuclease and ATPase activity. In this chapter, a new
overexpression and purification procedure is described to isolate S. cerevisiae
Dna2 from E. coli. The purified protein was active as both a nuclease and a DNA-
dependent ATPase. Purification of Dna2 mutants suggested that there were no
contaminating metal binding proteins, nucleases, or DNA-independent ATPases.
Additionally, UV-visible absorption spectroscopy and EPR spectroscopy revealed
that purified Dna2 could bind a 4Fe-4S cluster. This metal center was susceptible
to oxidation to the 3Fe-4S cluster by potassium ferricyanide. Additionally, these
studies suggested that the [4Fe-4S]3+ cluster could be generated upon oxidation of
Dna2. The 3Fe-4S cluster could be reduced by one electron to the 0 oxidation
state. Although the EPR and UV-visible absorption spectrum of Dna2 changed
upon reduction with sodium dithionite, the absence of certain features on the EPR
spectrum prevented assignment of the reduced protein as the [4Fe-4S]1+ cluster.
These results provide a basic characterization of the iron-sulfur cluster in Dna2,
which can serve as a foundation for future studies of how chemical changes to the
iron-sulfur cluster could regulate Dna2 enzymatic activity.

31 Introduction
Dna2 is a helicase-nuclease that is involved in Okazaki fragment
maturation, recombinational repair, mitochondrial genome maintenance, and
telomere maintenance (1-4). This protein is composed of a RecB-like nuclease
domain and a SF1B helicase domain. The C-terminal SF1B helicase domain of
Dna2 is a 5’ to 3’ helicase, which binds and hydrolyzes adenosine triphosphate to
separate double stranded DNA (Figure 2.1) (5). The RecB-like nuclease domain
at the N-terminus of the protein is responsible for its dual nuclease activity (5’ to 3’
and 3’ to 5’) (5,6). This domain also contains an evolutionarily conserved 4Fe-4S
cluster, which is essential for coordinating the helicase and nuclease activity of
Dna2 (7).
There is no structure of S. cerevisiae Dna2; however, a 2.3Å structure of
the mouse homolog bound to DNA revealed that it is a cylindrical protein (Figure 2.2) (8). The nuclease domain forms its base, and consists of a doughnut-like
structure through which DNA can pass. This nuclease domain also contains a
4Fe-4S cluster, which is located about 13 Å from the protein-bound ssDNA. The
helicase domain packs on top of the nuclease domain, continuing the cylindrical
hole that binds the DNA substrate. A β-barrel stock and an oligonucleotide binding
domain also interact with the DNA. Notably, the nuclease domain seems to act as
a base to stabilize the overall structure of the protein. The portion of the nuclease
domain that binds the 4Fe-4S cluster interacts with the β-barrel domain, which
Figure 2.1. S. cerevisiae Dna2. Four cysteines, C519, C768, C771, and C777, in the RecB-family nuclease domain ligate the 4Fe-4S cluster in Dna22. Glutamate 675 (E675) is important for Dna2 nuclease activity. Lysine 1080 (K1080) is important for Dna2 helicase activity.

32
also stabilizes the helicase domain of Dna2. Thus, the 4Fe-4S cluster domain is
positioned such that any distortions caused by chemical modification of the iron-
sulfur cluster could have a profound effect on the nuclease activity, helicase
activity, and/or DNA binding affinity of the protein.
The iron-sulfur cluster in Dna2 is conserved throughout eukaryotes from
yeast to humans, and this motif is one of the prototypical members of a new
structural family called the iron-staple nucleases (9). Nucleases of this structural
family contain a 4Fe-4S cluster that is ligated by four cysteine residues, three of
which are found as the motif CX2CX5C. The fourth ligating cysteine is located
about 250 amino acids away from the other three cysteines (7). Mutagenesis
studies have suggested that the iron-sulfur cluster in S. cerevisiae Dna2 is
important for enzymatic activity, but not essential for DNA binding (7). Despite this
important role in enzymatic activity, little is known about the chemical
characteristics of the iron-sulfur cluster.
Figure 2.2. Crystal Structure of Mouse Dna2 Bound to DNA. The different domains of Dna2 are colored as follows: dark blue = oligonucleotide binding domain, white = nuclease domain, green = β-barrel domain, pink = helicase 1A domain, and light blue = helicase 2A domain. The 4Fe-4S cluster is shown in gold. ssDNA is shown in red. The α-domain and ADP are not shown. (PDB Code: 5EAX)
33 A purification strategy for S. cerevisiae Dna2 was developed to isolate
this protein. This procedure allowed for the purification of Dna2 at high
concentrations appropriate for spectroscopic analysis. The isolated protein
contained an intact 4Fe-4S cluster, and had both nuclease and ATPase activity
similar to that observed for Dna2 purified with other protocols. Since defects in
4Fe-4S cluster loading cause a severe decrease in the nuclease and ATPase
activity of Dna2, this result provided additional support to the observation that
purified Dna2 contained an intact 4Fe-4S cluster. A series of Dna2 mutants were
purified using the new strategy to confirm that there were no contaminating metal
binding proteins, nucleases, or DNA-independent ATPases. Finally, spectroscopic
methods were used to determine the accessible oxidation states of the iron-sulfur
cluster. These experiments lay a foundation for studies of how the oxidation state
of the iron-sulfur cluster bound by Dna2 could regulate the enzymatic activity of
this protein.
Methods Materials. Glycerol and sodium chloride were purchased from Macron fine
chemicals. Tryptone, yeast extract, and agar were purchased from BD. Isopropyl
β-D-1-thiogalactopyranoside (IPTG) and dithiothreitol (DTT) was purchased from
Research Products International (RPI). PBS buffer was purchased from Cellgro.
All other chemicals were purchased from Sigma-Aldrich. The buffers were
adjusted to the indicated pH at room temperature with 6M NaOH. All columns for
Dna2 purification were purchased from GE Healthcare. The γ-32P adenosine
triphosphate was ordered from MP Biomedicals. All of the solutions used for
making denaturing polyacrylamide gels were purchased from National Diagnostics.
The pGal18-DNA2 construct was a gift from the Campbell lab (Caltech). All
oligonucleotide primers were purchased from IDT DNA.

34 Full Length Dna2 Overexpression Plasmid. The full DNA2 gene was cloned into
the BamHI and NotI sites of the pQTEV vector (Addgene, ID: 31291) such that
there was an N-terminal hepta-histidine tag and a TEV cleavage site when Dna2
was expressed from this construct (10). The Gibson assembly method was used to
make the full length Dna2 overexpression construct (11). The pQTEV
overexpression vector (~5 μg) was double restriction enzyme digested with 50
units of BamHI-HF (NEB) and 50 units of NotI-HF (NEB) for twenty hours at 37 °C.
The DNA2 gene was PCR amplified from the pGal18-DNA2 (7) vector in two
separate fragments with the first four primers outlined in Table A1.1, dNTP mix
(Roche), and Hi Fi Taq Polymerase (Roche). The PCR products were purified by
gel extraction (Qiagen). The Gibson assembly reaction was set-up such that 50
fmol of each of the digested pQTEV plasmid and PCR products were added to
water to a final volume of 10 μL. 10 μL of 2x Gibson Assembly Master Mix (NEB)
was added to the DNA substrates. The reaction was incubated at 50 °C for one
hour. The reaction mixture was transformed into TOP10 electrocompetent cells
(Invitrogen) via electroporation. Any colonies that were selected on LB ampicillin
(100 μg/mL) agar plates were screened for the desired plasmid by sequencing the
plasmids with the eight check primers outlined at the bottom of Table A1.1
(Laragen).
The codon that encoded the N-terminal methionine of Dna2 was removed
to avoid undesired initiation of translation at the beginning of the Dna2 gene rather
than at the start of the N-terminal hepta-histidine tag. The methionine codon
deletion was made by site-directed mutagenesis of pQTEV-DNA2 using the
oligonucleotide primers that are shown in Table A1.1 and a QuikChange Lightning
Site-Directed Mutagenesis Kit (Agilent). The primers used in the mutagenesis
reaction were pQTEV-yDna2 N-Met Del. Forward and pQTEV-yDna2 N-Met Del.
Reverse. Following mutagenesis, the plasmids were sent for sequencing with the
eight check primers presented at the bottom of Table A1.1 (Laragen). The isolated
plasmid was transformed into Rosetta2 (DE3) pLysS cells (Novagen) to make the
strain for Dna2 overexpression.
35
Full Length Dna2 Mutant Overexpression Plasmids and E. coli Strains. The
indicated point mutations were constructed by site-directed mutagenesis of the
pQTEV-DNA2 plasmid using the oligonucleotide primers that are shown in Table A1.2 and a QuikChange Lightning Site-Directed Mutagenesis Kit (Agilent).
Following mutagenesis, the plasmids were sent for sequencing with the eight
check primers outlined in Table A1.1 (Laragen). The plasmids encoding mutant
Dna2 (Table A1.3) were transformed into Rosetta2 (DE3) pLysS cells (Novagen)
to make the strains for mutant Dna2 overexpression (Table A1.4). Wildtype Dna2 and Mutant Dna2 Overexpression and Purification. The protocol for
purification of S. cerevisiae Dna2 was adapted from the procedure developed by
Dr. Julien Lafrance-Vanasse (Tainer lab). The following buffers were prepared,
were adjusted to the correct pH at room temperature, and were filtered with a 0.2
micron filter: histrap buffer A (20 mM trizma-HCl, pH 8, 0.5 M NaCl, 0.5 mM DTT);
histrap buffer B (20 mM trizma-HCl, pH 8, 0.5 M NaCl, 0.5 M Imidazole, 0.5 mM
DTT); anion exchange buffer A (20 mM trizma-HCl, pH 8, 0.1 mM EDTA, 2 mM
DTT), anion exchange buffer B (20 mM trizma-HCl, pH 8, 1 M NaCl, 0.1 mM
EDTA, 2 mM DTT), and gel filtration buffer (20 mM trizma-HCl, pH 8, 200 mM
NaCl, 0.1 mM EDTA, 2 mM DTT). Dithiothreitol (DTT) was added to all buffers the
day of Dna2 purification.
A single colony from an LB chloramphenicol (25 μg/mL) ampicillin (100
μg/mL) agar plate streaked with the Rosetta2 (DE3) pLysS cells that contained the
Dna2 overexpression plasmid was used to inoculate a 10 mL overnight starter
culture supplemented with 100 μg/mL ampicillin and 25 μg/mL chloramphenicol.
The starter culture was diluted 1:100 into 1L of terrific broth medium containing 50
μg/mL ampicillin and 25 μg/mL chloramphenicol. The Rosetta2 (DE3) pLysS
strains containing the wild type Dna2 and mutant Dna2 overexpression plasmids
were grown to late exponential phase (OD600 ~ 1.0) at 37 °C with shaking (150
RPM) in an Innova43 incubator shaker. Then, the temperature of the incubator

36 was dropped to 16 °C, and overexpression of Dna2 was induced by addition of
IPTG to a final concentration of 200 μM in each culture. The cultures were
incubated for 20 hours at 16 °C with shaking (150 RPM). The cells were pelleted
via centrifugation at 6238 x g for 10 minutes. The cell pellets were transferred to 50
mL polypropylene tubes, and were re-pelleted via centrifugation at 6238 x g for 10
minutes. All centrifugation steps were performed at 4 °C. The supernatant was
decanted, and the cell pellets were washed with PBS buffer (Cellgro). About 10g of
cell paste per liter of media was isolated with this procedure. The cell pellets were
stored in the -80 °C freezer until Dna2 purification.
All lysis steps were carried out on ice at room temperature. The Rosetta2
(DE3) pLysS cell pellets were thawed on ice. The cell pellets were re-suspended in
lysis buffer (20 mM Trizma-HCl, 500 mM NaCl, 10 mM Imidazole, 0.5 mM DTT, pH
8.0) with a homogenizer. The lysis buffer also contained complete protease
inhibitor tablets (Roche) at a concentration of one tablet per 50 mL of buffer. The
cells were lysed with a microfluidizer (Microfluidics Corp.). The cell debris was
pelleted by centrifugation in a floor centrifuge (Sorvall RC6+) at 21,580 x g in the
F14-6x250y rotor at 4 °C (FiberLite). The supernatant was filtered with a 0.45
micron filter.
All subsequent purification steps were performed at 10 °C in a deli case
(VWR). The filtered cell lysate was loaded with a Pump P960 (GE Healthcare) to
two 5 mL HisTrap HP columns connected in tandem with a Pump P960. The
column was attached to an Akta FPLC (GE Healthcare), and the column was
washed with 8 column volumes 99% HisTrap Buffer A/1% HisTrap Buffer B. Then,
the following wash steps were performed: a gradient from 1 to 10% HisTrap Buffer
B over 4 column volumes, a gradient from 10-11% HisTrap Buffer B over 8 column
volumes, a gradient from 11-100% HisTrap Buffer B over 4 column volumes, and 5
column volumes of 100% HisTrap Buffer B. Dna2 eluted from the HisTrap column
between 30% and 70% HisTrap Buffer B.
Following the HisTrap column, Dna2 was exchanged into 20% Anion
Exchange Buffer B /80% Anion Exchange Buffer A on a HiPrep 26/10 desalting
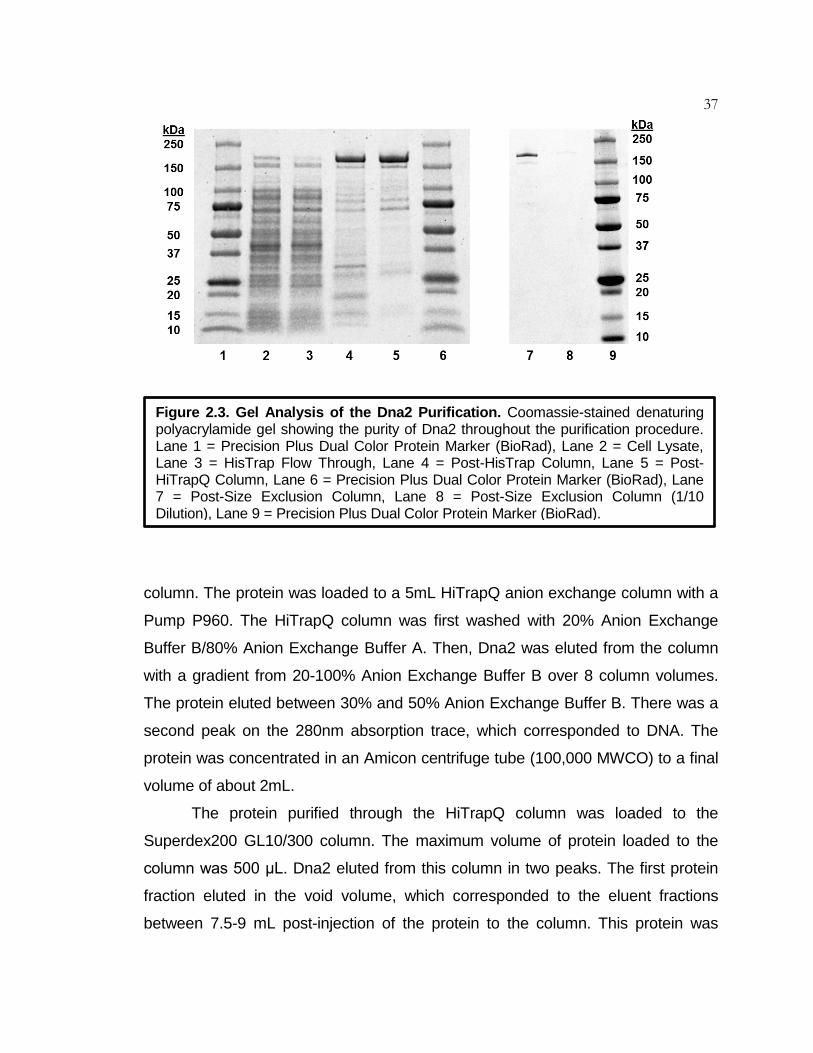
37
column. The protein was loaded to a 5mL HiTrapQ anion exchange column with a
Pump P960. The HiTrapQ column was first washed with 20% Anion Exchange
Buffer B/80% Anion Exchange Buffer A. Then, Dna2 was eluted from the column
with a gradient from 20-100% Anion Exchange Buffer B over 8 column volumes.
The protein eluted between 30% and 50% Anion Exchange Buffer B. There was a
second peak on the 280nm absorption trace, which corresponded to DNA. The
protein was concentrated in an Amicon centrifuge tube (100,000 MWCO) to a final
volume of about 2mL.
The protein purified through the HiTrapQ column was loaded to the
Superdex200 GL10/300 column. The maximum volume of protein loaded to the
column was 500 μL. Dna2 eluted from this column in two peaks. The first protein
fraction eluted in the void volume, which corresponded to the eluent fractions
between 7.5-9 mL post-injection of the protein to the column. This protein was
Figure 2.3. Gel Analysis of the Dna2 Purification. Coomassie-stained denaturing polyacrylamide gel showing the purity of Dna2 throughout the purification procedure. Lane 1 = Precision Plus Dual Color Protein Marker (BioRad), Lane 2 = Cell Lysate, Lane 3 = HisTrap Flow Through, Lane 4 = Post-HisTrap Column, Lane 5 = Post-HiTrapQ Column, Lane 6 = Precision Plus Dual Color Protein Marker (BioRad), Lane 7 = Post-Size Exclusion Column, Lane 8 = Post-Size Exclusion Column (1/10 Dilution), Lane 9 = Precision Plus Dual Color Protein Marker (BioRad).

38 aggregated Dna2, and had lower ATPase and nuclease activity than the protein
that eluted from the column in the second peak of the chromatogram. The second
batch of Dna2 that eluted from the column corresponded to the eluent fractions
that Dna2 was expected to elute from the column based on its size (protein was
found in eluent fractions 10-12.5 mL post-injection of protein to the column)
(Figure 2.7). The protein collected in the second peak was concentrated in an
Amicon centrifuge tube (100,000 MWCO) to a final concentration of 25-100 μM.
This protein was aliquoted to cryotubes, and was flash frozen in liquid nitrogen.
The protein was stored in the -80 °C freezer.
The concentration of protein was estimated based off of the absorption of
the sample at 280nm. The extinction coefficient of the protein at 280nm is 97,530
M-1 cm-1 (12). The concentration of protein that contained a 4Fe-4S cluster was
estimated based off of the absorption of the sample at 410nm. The extinction
coefficient at 410nm was estimated as 17,000 M-1 cm-1 based on literature
precedence (13). The purity of the isolated protein was analyzed on a denaturing
polyacrylamide gel (Figure 2.3). The size of Dna2 was approximately 175 kDa.
Dna2 Nuclease Activity Assay. A 5’-tail DNA substrate (5’-
TTCACGAGATTTACTTATTTCACTGCGGCTACATGATGCATCGTTAGGCGATT
CCGCCTAACGATGCATCATGT -3’) (IDT DNA) was 5’-radiolabeled with a
previously published procedure (7). The nuclease reaction mixture consisted of
varying concentrations of Dna2 with 20 fmol radiolabeled 5’-tail DNA substrate in
25 mM Trizma-HCl, pH 8, 0.05 mg/mL BSA, 1 mM DTT, and 1 mM MgCl2. The
reactions were incubated at 37 °C for thirty minutes. Then, the reactions were
inactivated by incubation at 95 °C for five minutes. The reaction mixtures were
loaded to a 12 % sequencing gel, and a 90W potential was applied to the gel. The
gel was exposed to a phosphor screen (GE Healthcare). The phosphor screen
was imaged on the Typhoon imager (GE Healthcare). All gel images were
processed with ImageQuant software (GE Healthcare).
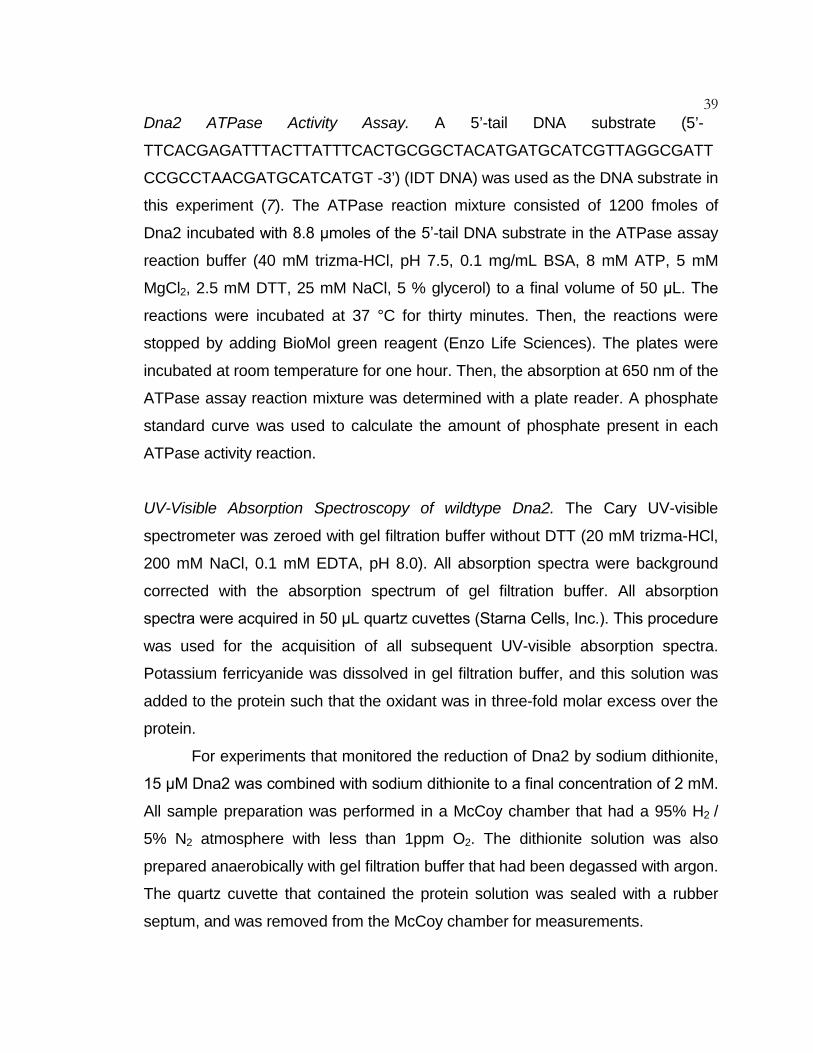
39 Dna2 ATPase Activity Assay. A 5’-tail DNA substrate (5’-
TTCACGAGATTTACTTATTTCACTGCGGCTACATGATGCATCGTTAGGCGATT
CCGCCTAACGATGCATCATGT -3’) (IDT DNA) was used as the DNA substrate in
this experiment (7). The ATPase reaction mixture consisted of 1200 fmoles of
Dna2 incubated with 8.8 μmoles of the 5’-tail DNA substrate in the ATPase assay
reaction buffer (40 mM trizma-HCl, pH 7.5, 0.1 mg/mL BSA, 8 mM ATP, 5 mM
MgCl2, 2.5 mM DTT, 25 mM NaCl, 5 % glycerol) to a final volume of 50 μL. The
reactions were incubated at 37 °C for thirty minutes. Then, the reactions were
stopped by adding BioMol green reagent (Enzo Life Sciences). The plates were
incubated at room temperature for one hour. Then, the absorption at 650 nm of the
ATPase assay reaction mixture was determined with a plate reader. A phosphate
standard curve was used to calculate the amount of phosphate present in each
ATPase activity reaction.
UV-Visible Absorption Spectroscopy of wildtype Dna2. The Cary UV-visible
spectrometer was zeroed with gel filtration buffer without DTT (20 mM trizma-HCl,
200 mM NaCl, 0.1 mM EDTA, pH 8.0). All absorption spectra were background
corrected with the absorption spectrum of gel filtration buffer. All absorption
spectra were acquired in 50 μL quartz cuvettes (Starna Cells, Inc.). This procedure
was used for the acquisition of all subsequent UV-visible absorption spectra.
Potassium ferricyanide was dissolved in gel filtration buffer, and this solution was
added to the protein such that the oxidant was in three-fold molar excess over the
protein.
For experiments that monitored the reduction of Dna2 by sodium dithionite,
15 μM Dna2 was combined with sodium dithionite to a final concentration of 2 mM.
All sample preparation was performed in a McCoy chamber that had a 95% H2 /
5% N2 atmosphere with less than 1ppm O2. The dithionite solution was also
prepared anaerobically with gel filtration buffer that had been degassed with argon.
The quartz cuvette that contained the protein solution was sealed with a rubber
septum, and was removed from the McCoy chamber for measurements.

40
Electron Paramagentic Resonance Spectroscopy of Dna2. On the day that EPR
spectra were acquired, Dna2 that had been purified through the HiTrapQ column
was thawed on ice, and was purified on the Superdex200 GL10/300 size exclusion
column. X-band EPR spectra were acquired on a Bruker EMX spectrometer. All
spectra were acquired at 10K, a temperature that was maintained with an Oxford
continuous-flow helium cryostat. All samples were assembled, except for the
protein. The protein was added to the solution immediately before the sample was
frozen in liquid nitrogen. EPR parameters were as follows: receiver gain =
5.02e+003, modulation amplitude = 4G, microwave power = 12.847 mW. This
procedure was used for the acquisition of all subsequent EPR spectra unless
indicated otherwise. All reported spectra were obtained by subtracting the
spectrum of gel filtration buffer from the spectrum of the sample. The EPR spectra
presented are all the first derivative of the acquired spectra.
All EPR samples were prepared aerobically unless indicated. K3Fe(CN)6
solutions were prepared aerobically. 100 μM Dna2 was combined with 2 mM
potassium ferricyanide, and this solution as incubated on ice for 15 minutes prior to
transfer to an EPR tube (Wilmad Lab Glass). The sample was flash frozen in liquid
nitrogen.
100 μM as purified Dna2 was combined with sodium dithionite to a final
concentration of 2 mM sodium dithionite in a McCoy chamber that had an
atmosphere of 95% N2/ 5% H2 with less than 1ppm O2. The dithionite solution was
also prepared in the chamber with gel filtration buffer that had been degassed with
argon. The Dna2 and sodium dithionite solution was added to the quartz EPR
tube. The sample was flash frozen in liquid nitrogen immediately after removal
from the anaerobic chamber.
To prepare Dna2 samples for EPR without any oxygen in the original
protein sample, the protein was degassed on a Schlenk line for one hour. The
Dna2 solution was quickly cycled between vacuum and argon ten times every
fifteen minutes. The solution was left under argon between cycles. The solution
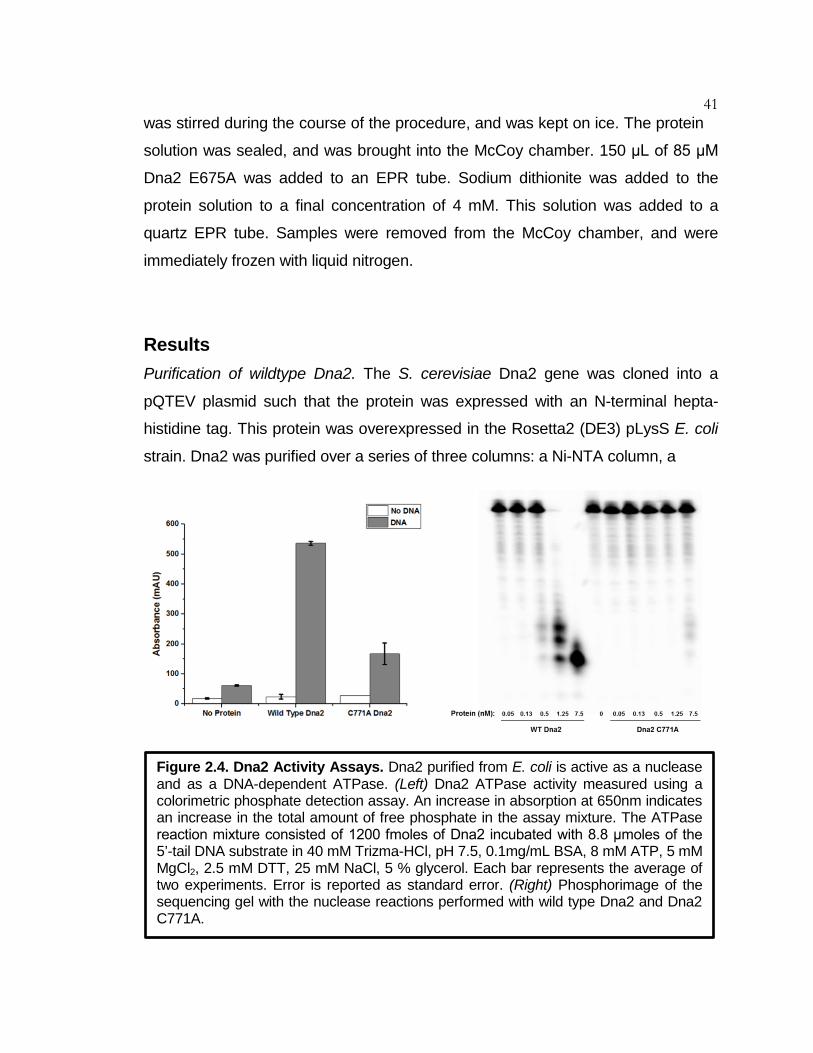
41 was stirred during the course of the procedure, and was kept on ice. The protein
solution was sealed, and was brought into the McCoy chamber. 150 μL of 85 μM
Dna2 E675A was added to an EPR tube. Sodium dithionite was added to the
protein solution to a final concentration of 4 mM. This solution was added to a
quartz EPR tube. Samples were removed from the McCoy chamber, and were
immediately frozen with liquid nitrogen.
Results
Purification of wildtype Dna2. The S. cerevisiae Dna2 gene was cloned into a
pQTEV plasmid such that the protein was expressed with an N-terminal hepta-
histidine tag. This protein was overexpressed in the Rosetta2 (DE3) pLysS E. coli
strain. Dna2 was purified over a series of three columns: a Ni-NTA column, a
Figure 2.4. Dna2 Activity Assays. Dna2 purified from E. coli is active as a nuclease and as a DNA-dependent ATPase. (Left) Dna2 ATPase activity measured using a colorimetric phosphate detection assay. An increase in absorption at 650nm indicates an increase in the total amount of free phosphate in the assay mixture. The ATPase reaction mixture consisted of 1200 fmoles of Dna2 incubated with 8.8 μmoles of the 5’-tail DNA substrate in 40 mM Trizma-HCl, pH 7.5, 0.1mg/mL BSA, 8 mM ATP, 5 mM MgCl2, 2.5 mM DTT, 25 mM NaCl, 5 % glycerol. Each bar represents the average of two experiments. Error is reported as standard error. (Right) Phosphorimage of the sequencing gel with the nuclease reactions performed with wild type Dna2 and Dna2 C771A.

42
HiTrapQ anion exchange column, and a Superdex200 size exclusion column.
Trypsin digest followed by liquid chromatography tandem mass spectrometry (LC-
MS-MS) analysis of the purified protein indicated that Dna2 was isolated during
this purification. This method also allowed for the identification of DnaK as the
major contaminating protein in the purification. Other chaperone proteins like
GroEL, DnaJ, and GrpE also contaminated purified Dna2.
Dna2 as isolated using this method contained a 4Fe-4S cluster. The
percentage of Dna2 that contained an intact 4Fe-4S cluster was defined as the
cluster loading. This value was estimated by comparing the absorption at 280nm
to the absorption at 410nm. The average cluster loading for Dna2 isolated with this
purification protocol ranged from 65-80%.
The nuclease and ATPase activity of Dna2 isolated with the new purification
scheme was analyzed and compared to results recorded in the literature. This
assay revealed that the protein was active, and that the activity of the protein was
the same as Dna2 purified from S. cerevisiae (Figure 1) (7,14). Specifically, in the
Figure 2.5. UV-Visible Absorption Spectrum of Dna2. (Left) The UV-visible absorption spectrum of Dna2 in 20 mM trizma-HCl, 200 mM NaCl, 0.1 mM EDTA, pH 8. (Right) The absorption spectrum of Dna2 over the course of 23 hours. The top right of the spectrum indicates the length of time the protein was at room temperature prior to spectrum acquisition.

43 literature, Dna2 has been
observed to completely degrade
DNA substrates at
concentrations above 7 nM. The
DNA substrate was partially
degraded at concentrations of 2
nM. Similar to these
observations, in the work
describe in this study, the DNA
substrate was completely
degraded at Dna2
concentrations above 7 nM.
Partial degradation of the
substrate was observed at Dna2
concentrations of 1.5 nM.
Wild type Dna2 was also active as an ATPase when bound to DNA. As
observed previously, Dna2 was not active as an ATPase when DNA was not
present. Thus, there were no DNA-independent ATPases that co-purified with
wildtype Dna2.
Spectroscopic Characterization of the Iron-Sulfur Cluster in Dna2. The UV-visible
absorption spectrum of Dna2 had a broad peak, with a maximum at 415nm in
addition to the peak at 280nm that indicated the presence of aromatic amino acid
residues in the protein. This spectrum suggests that the isolated protein binds a
4Fe-4S cluster. The 4Fe-4S cluster in Dna2 was not stable over time as evidenced
by a large decrease in absorption at 415nm after 23 hours (Figure 2.5). The iron-sulfur cluster in Dna2 was also characterized with electron
paramagnetic resonance (EPR) spectroscopy. As isolated, the majority of the 4Fe-
4S cluster in Dna2 was most likely in the EPR silent 2+ oxidation state. However,
Figure 2.6. X-Band EPR Spectrum of Dna2 at 10K. EPR Spectrum of Dna2 as isolated in 20mM trizma-HCl, 200mM NaCl, 0.1 mM EDTA, pH 8.

44 there was a signal centered at g = 2.00 on the X-band EPR spectrum of the
isolated protein (Figure 2.6). Thus, a fraction of the isolated protein bound a 3Fe-
4S cluster (15,16). There was a second signal observed with g = 4.3. In biological
samples, this signal is often attributed to high-spin mononuclear Fe3+ ions that are
in sites of low symmetry (17,18). Thus, this signal was assigned to ferric iron that
was present due to degradation of the iron-sulfur cluster. Consistent with this
assignment, the signal with an average g-value of 4.3 decreased in intensity when
the EPR samples were prepared anaerobically, suggesting that this signal was
largely generated by iron-sulfur cluster degradation during aerobic sample
preparation.
Purification of Dna2 Mutants. Three Dna2 mutants were isolated to confirm that
there were no contaminants in the purified protein that could interfere with
experiments. The Dna2 C771A mutant contains alanine in place of one cysteine
residue that ligates the 4Fe-4S cluster in Dna2. This mutant was isolated to
confirm that there were no co-purifying metal binding proteins (7). The nuclease-
deficient Dna2 E675A mutant was purified to confirm that there were no
contaminating nucleases (5). A third Dna2 mutant, Dna2 P504S, was also purified
Figure 2.7. Dna2 and Dna2 C771A Nuclease Assays. Dna2 nuclease assay immediately following purification by size exclusion chromatography. (Left) Phosphoradiogram of the 12% denaturing polyacrylamide gel with the products of the nuclease reaction assays performed with Dna2 immediately after elution from the Superdex200 size exclusion column in the column void volume (Peak 1) and the expected Dna2 eluent fraction (Peak 2). (Right) Phosphoradiogram of the 12% denaturing polyacrylamide gel with the products of the nuclease reaction assays performed with the Dna2 C771A mutant directly following elution from the Superdex200 size exclusion column in the column void volume (Peak 1) and the predicted Dna2 eluent fraction (Peak 2).

45 to determine whether this protein bound a 4Fe-4S cluster. Notably, proline 504 is
an evolutionarily conserved residue in Dna2, and mutation of this residue to serine
has resulted in both deficiencies in protein activity as well as phenotypic changes
similar to those Dna2 mutants designed to disrupt iron-sulfur cluster binding (7).
Dna2 C771A. The Dna2 C771A mutant was purified with the same protocol
that was used to isolate wildtype Dna2. As determined by UV-visible absorption
spectroscopy, iron-sulfur cluster incorporation into the Dna2 C771A mutant was
less than that observed for wildtype Dna2, which was consistent with previous
results (7). The total 4Fe-4S cluster loading for the purified protein was estimated
to be 9%. The UV-visible absorption spectrum of Dna2 C771A was distinct from
that observed for the wildtype protein. There were two major peaks in this
spectrum, but the size of these peaks was significantly smaller than those
observed for wild type Dna2. The first peak had a maximum at 425 nm while the
second peak was centered at ~330 nm (Figure 2.9). This second peak was
consistent with the typical absorption spectrum of a 3Fe-4S cluster. Thus, there
may have been a small amount of the
Dna2 C771A mutant isolated that bound a
3Fe-4S cluster. This result agrees with
observations made in the literature that
DNA binding proteins with a single
mutation at a ligating cysteine residue still
bind a 3Fe-4S cluster (19,20).
The nuclease and ATPase activity
of Dna2 C771A isolated with the new
purification procedure was analyzed and
compared to values recorded in the
literature (7). Consistent with previous
reports, the ATPase and nuclease activity
of Dna2 C771A was less than that of the
wildtype protein (Figure 2.4). However, if
Figure 2.8. Dna2 and Dna2 E675A Nuclease Assay. Comparison of Dna2 E675A and wildtype Dna2 nuclease activity. Phosphoradiogram of the 12% sequencing gel that contained the nuclease assay reactions.
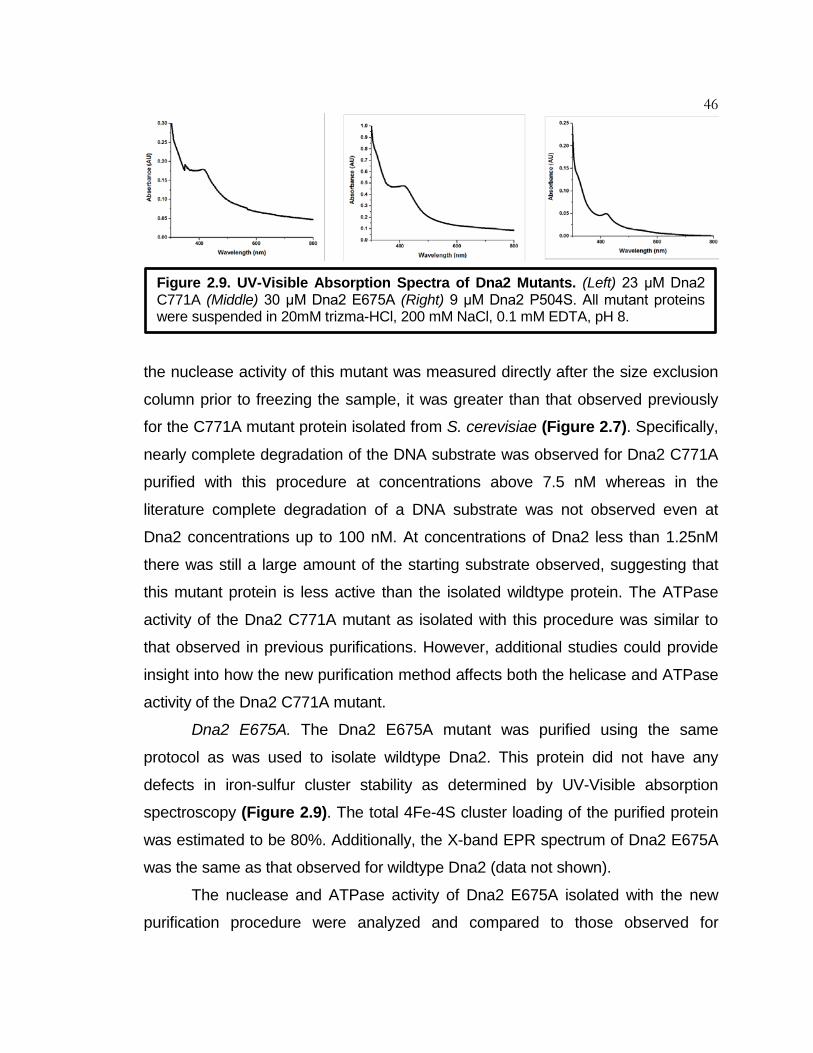
46
the nuclease activity of this mutant was measured directly after the size exclusion
column prior to freezing the sample, it was greater than that observed previously
for the C771A mutant protein isolated from S. cerevisiae (Figure 2.7). Specifically,
nearly complete degradation of the DNA substrate was observed for Dna2 C771A
purified with this procedure at concentrations above 7.5 nM whereas in the
literature complete degradation of a DNA substrate was not observed even at
Dna2 concentrations up to 100 nM. At concentrations of Dna2 less than 1.25nM
there was still a large amount of the starting substrate observed, suggesting that
this mutant protein is less active than the isolated wildtype protein. The ATPase
activity of the Dna2 C771A mutant as isolated with this procedure was similar to
that observed in previous purifications. However, additional studies could provide
insight into how the new purification method affects both the helicase and ATPase
activity of the Dna2 C771A mutant.
Dna2 E675A. The Dna2 E675A mutant was purified using the same
protocol as was used to isolate wildtype Dna2. This protein did not have any
defects in iron-sulfur cluster stability as determined by UV-Visible absorption
spectroscopy (Figure 2.9). The total 4Fe-4S cluster loading of the purified protein
was estimated to be 80%. Additionally, the X-band EPR spectrum of Dna2 E675A
was the same as that observed for wildtype Dna2 (data not shown).
The nuclease and ATPase activity of Dna2 E675A isolated with the new
purification procedure were analyzed and compared to those observed for
Figure 2.9. UV-Visible Absorption Spectra of Dna2 Mutants. (Left) 23 μM Dna2 C771A (Middle) 30 μM Dna2 E675A (Right) 9 μM Dna2 P504S. All mutant proteins were suspended in 20mM trizma-HCl, 200 mM NaCl, 0.1 mM EDTA, pH 8.

47 purification performed in the literature (Figure 2.8) (5). Consistent with previous
reports, the mutant protein was active as a DNA-dependent ATPase. The Dna2
E675A mutant had a significant decrease in nuclease activity with only a small
amount of nuclease activity observed at protein concentrations up to 7.5 nM.
Dna2 P504S. Dna2 P504S was purified using the same protocol as was
used to isolate wildtype Dna2. This protein did not have any defects in iron-sulfur
cluster stability as determined with UV-visible absorption spectroscopy. The total
4Fe-4S cluster loading was estimated to be about 80%. Dna2 P504S has
phenotypic similarities to the Dna2 cysteine mutants that have impaired iron-sulfur
cluster binding. Thus, future studies with this mutant, which retains an iron-sulfur
cluster but has deficiencies in both nuclease and helicase activity, could provide
insight into potential roles for the iron-sulfur cluster in Dna2.
The 4Fe-4S Cluster in Dna2 is Susceptible to Oxidation by Potassium
Ferricyanide. Dna2 was combined with a three-fold molar excess of potassium
ferricyanide to investigate whether the iron-sulfur cluster could be oxidized to form
[4Fe-4S]3+. Upon oxidation with potassium ferricyanide, there was a significant
decrease in the absorption at 410 nm. These absorption changes suggested that
the 4Fe-4S cluster in Dna2 was susceptible to oxidative degradation with the 3Fe-
4S cluster as a transient product of iron-sulfur cluster oxidation (Figure 2.10). There was no evidence for formation of the [4Fe-4S]3+ cluster with this technique.
EPR spectroscopy also suggested that the 4Fe-4S cluster in Dna2 was
susceptible to oxidative degradation. The X-band EPR spectrum of purified Dna2
oxidized with an excess of potassium ferricyanide contained three major signals at
g = 2.00, g = 4.3, and g = 9.6 (Figure 2.10). The first signal was assigned to the
3Fe-4S cluster. This signal had primary g-values of 1.98, 2.00, 2.02 with a feature
at a g-value of 2.10. The latter value suggests that a small amount of the [4Fe-
4S]3+ cluster was formed upon oxidation with potassium ferricyanide (21). The
signal at a g-value of 9.6 also increased in intensity following oxidation. This signal
was most likely due to a 3Fe-4S cluster in a tetrahedral configuration (S=5/2). This
48
signal has been previously observed for purple aconitase (22). Thus, these
spectroscopic studies suggest that Dna2 contains a 4Fe-4S cluster that is
susceptible to oxidation with the 3Fe-4S cluster and [4Fe-4S]3+ cluster as products
of iron-sulfur cluster oxidation.
Reaction of the Iron-Sulfur Cluster in Dna2 with Sodium Dithionite. To further
understand the redox properties of the 4Fe-4S cluster in Dna2, the reduction of
this metal center was investigated using spectroscopic methods. The UV-visible
absorption spectrum of Dna2 in the presence of sodium dithionite suggested that
the iron cofactor in the protein was being reduced to the 1+ oxidation state. The
absorption maximum of the 4Fe-4S cluster shifted to slightly higher wavelengths of
425 nm upon reduction (Figure 2.11). When the protein was exposed to air the
original absorption band with a maximum at 415 nm was restored; however, there
Figure 2.10. Oxidative Degradation of the 4Fe-4S Cluster in Dna2. (Left) The UV-Visible absorption spectrum of Dna2 with a three-fold molar excess of potassium ferricyanide at different times following oxidant addition. (Right) X-band EPR spectrum of 100 μM Dna2 with 2mM potassium ferricyanide at 10K. The peaks were assigned as follows from right to left: g = 2 – [3Fe-4S]1+ (S=1/2), g = 2.10 – [4Fe-4S]3+, g = 4.3 – free ferric iron or [3Fe-4S]1+ (S=3/2), g = 9.6 – [3Fe-4S]1+. The broad peak at about 1800 gauss is due to excess potassium ferricyanide.
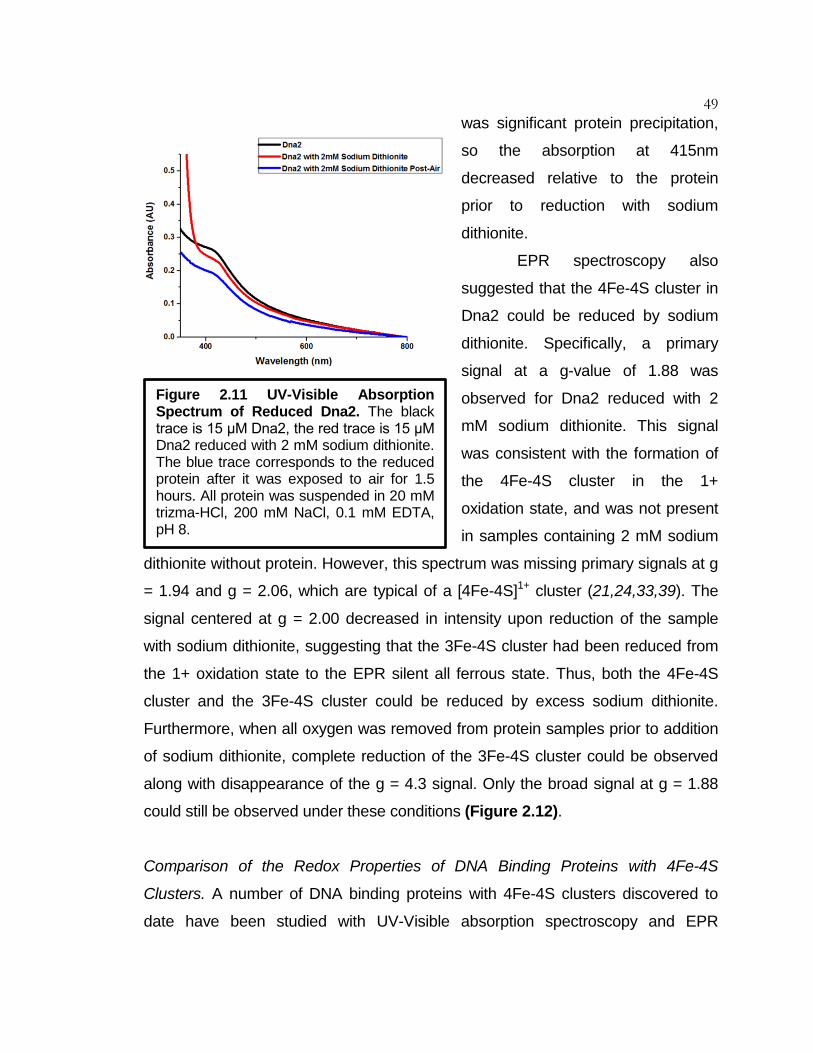
49 was significant protein precipitation,
so the absorption at 415nm
decreased relative to the protein
prior to reduction with sodium
dithionite.
EPR spectroscopy also
suggested that the 4Fe-4S cluster in
Dna2 could be reduced by sodium
dithionite. Specifically, a primary
signal at a g-value of 1.88 was
observed for Dna2 reduced with 2
mM sodium dithionite. This signal
was consistent with the formation of
the 4Fe-4S cluster in the 1+
oxidation state, and was not present
in samples containing 2 mM sodium
dithionite without protein. However, this spectrum was missing primary signals at g
= 1.94 and g = 2.06, which are typical of a [4Fe-4S]1+ cluster (21,24,33,39). The
signal centered at g = 2.00 decreased in intensity upon reduction of the sample
with sodium dithionite, suggesting that the 3Fe-4S cluster had been reduced from
the 1+ oxidation state to the EPR silent all ferrous state. Thus, both the 4Fe-4S
cluster and the 3Fe-4S cluster could be reduced by excess sodium dithionite.
Furthermore, when all oxygen was removed from protein samples prior to addition
of sodium dithionite, complete reduction of the 3Fe-4S cluster could be observed
along with disappearance of the g = 4.3 signal. Only the broad signal at g = 1.88
could still be observed under these conditions (Figure 2.12).
Comparison of the Redox Properties of DNA Binding Proteins with 4Fe-4S
Clusters. A number of DNA binding proteins with 4Fe-4S clusters discovered to
date have been studied with UV-Visible absorption spectroscopy and EPR
Figure 2.11 UV-Visible Absorption Spectrum of Reduced Dna2. The black trace is 15 μM Dna2, the red trace is 15 μM Dna2 reduced with 2 mM sodium dithionite. The blue trace corresponds to the reduced protein after it was exposed to air for 1.5 hours. All protein was suspended in 20 mM trizma-HCl, 200 mM NaCl, 0.1 mM EDTA, pH 8.

50 spectroscopy. All of these analyses provide evidence that these proteins bind
4Fe-4S clusters; however, these experiments also show that the 4Fe-4S clusters
do not all share the same redox properties (Table 2.1). In general, consistent with
observations from UV-Visible absorption spectroscopy, the DNA binding proteins
are purified aerobically with a [4Fe-4S]2+ cluster. This cofactor is EPR silent.
Depending on the conditions under which the protein was isolated, there is a
variable amount of protein purified with a [3Fe-4S]1+ cluster. This cluster can
generally be reduced to [3Fe-4S]0 with sodium dithionite, which is consistent with
the results observed for the iron-sulfur cluster in Dna2.
Reduction of the [4Fe-4S]2+ cluster to the [4Fe-4S]1+ cluster has not been
observed by EPR spectroscopy for all DNA binding proteins with 4Fe-4S clusters.
Specifically, it was observed that the iron-sulfur cluster in the following DNA
binding proteins could be reduced to the 1+ oxidation state: Endonuclease III,
Uracil DNA glycosylase, the 4Fe-4S cluster in the polymerase domain of
Polymerase epsilon, RNA polymerase, DinG, and Rtel1 (13,27,30,31,35). The
metal center in these proteins was reduced to [4Fe-4S]1+. The DNA binding
proteins that are not reduced to the 1+ oxidation state include: MutY, the
deoxyribodipyrimidine photolyase PhrB, eukaryotic primase, Rad3/XPD, AddAB,
and polymerase delta (9,15,26,28,29,34). Notably, the recombinant C-terminal
domains of the eukaryotic replicative DNA polymerases as purified from E. coli can
be reduced to the 1+ oxidation state by sodium dithionite even though the iron-
sulfur cluster in the complete DNA polymerase δ protein complex cannot be
reduced (34). Although the EPR spectrum of Dna2 changed upon reduction by
sodium dithionite, it did not have the characteristic spectrum of a [4Fe-4S]1+
cluster. The 3Fe-4S cluster bound by this protein was reduced to the all ferrous
state by sodium dithionite, but future studies will need to confirm the reduction of
the 4Fe-4S cluster in Dna2 to the 1+ oxidation state.
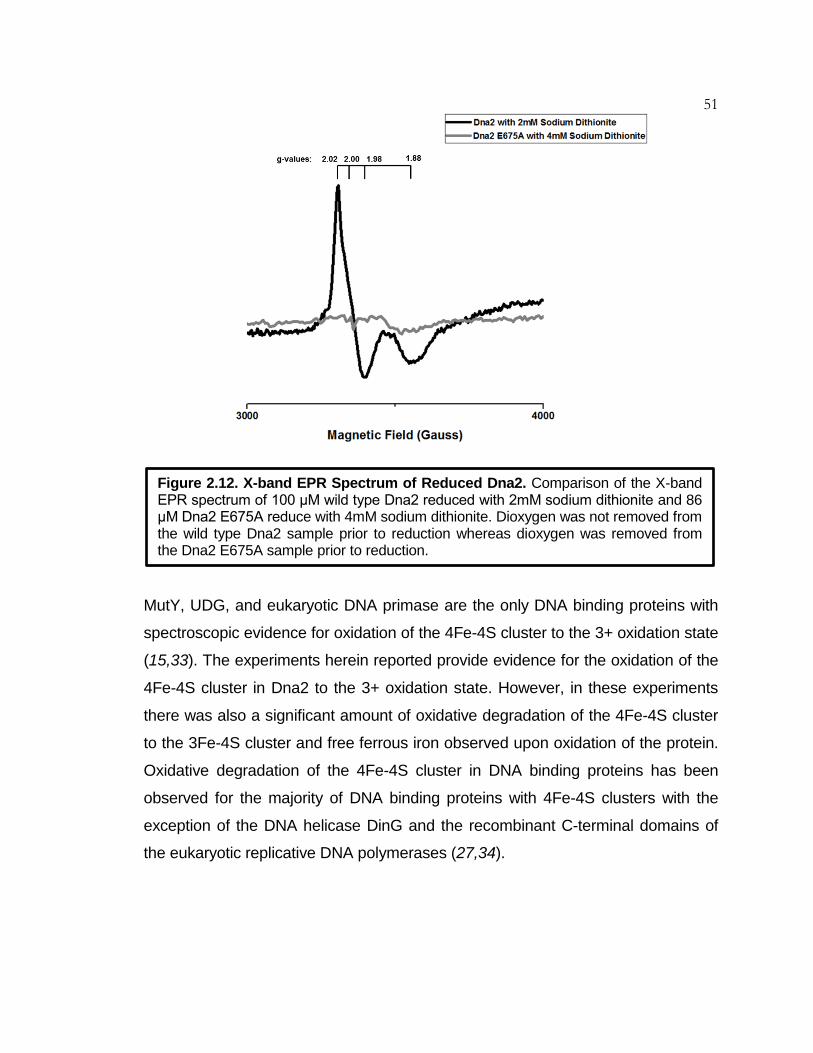
51
MutY, UDG, and eukaryotic DNA primase are the only DNA binding proteins with
spectroscopic evidence for oxidation of the 4Fe-4S cluster to the 3+ oxidation state
(15,33). The experiments herein reported provide evidence for the oxidation of the
4Fe-4S cluster in Dna2 to the 3+ oxidation state. However, in these experiments
there was also a significant amount of oxidative degradation of the 4Fe-4S cluster
to the 3Fe-4S cluster and free ferrous iron observed upon oxidation of the protein.
Oxidative degradation of the 4Fe-4S cluster in DNA binding proteins has been
observed for the majority of DNA binding proteins with 4Fe-4S clusters with the
exception of the DNA helicase DinG and the recombinant C-terminal domains of
the eukaryotic replicative DNA polymerases (27,34).
Figure 2.12. X-band EPR Spectrum of Reduced Dna2. Comparison of the X-band EPR spectrum of 100 μM wild type Dna2 reduced with 2mM sodium dithionite and 86 μM Dna2 E675A reduce with 4mM sodium dithionite. Dioxygen was not removed from the wild type Dna2 sample prior to reduction whereas dioxygen was removed from the Dna2 E675A sample prior to reduction.
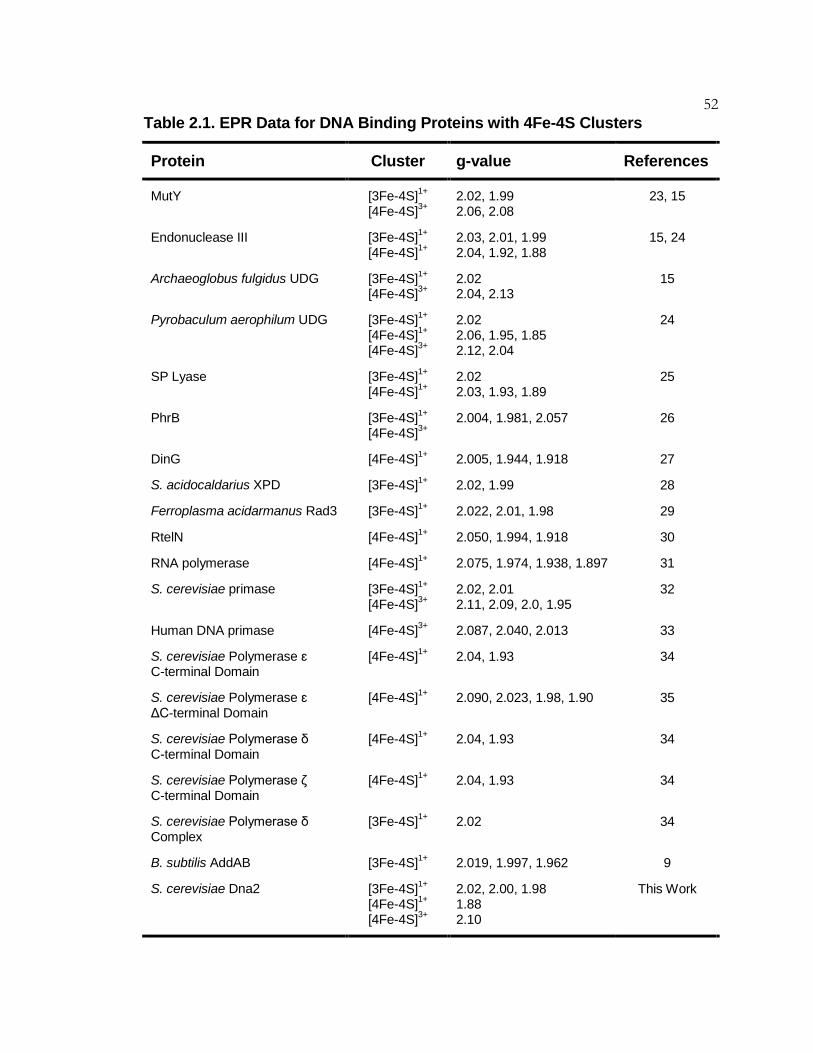
52 Table 2.1. EPR Data for DNA Binding Proteins with 4Fe-4S Clusters
Protein
Cluster
g-value
References
MutY
[3Fe-4S]1+ [4Fe-4S]3+
2.02, 1.99 2.06, 2.08
23, 15
Endonuclease III [3Fe-4S]1+
[4Fe-4S]1+ 2.03, 2.01, 1.99 2.04, 1.92, 1.88
15, 24
Archaeoglobus fulgidus UDG [3Fe-4S]1+
[4Fe-4S]3+ 2.02 2.04, 2.13
15
Pyrobaculum aerophilum UDG [3Fe-4S]1+
[4Fe-4S]1+
[4Fe-4S]3+
2.02 2.06, 1.95, 1.85 2.12, 2.04
24
SP Lyase [3Fe-4S]1+
[4Fe-4S]1+ 2.02 2.03, 1.93, 1.89
25
PhrB [3Fe-4S]1+ [4Fe-4S]3+
2.004, 1.981, 2.057
26
DinG [4Fe-4S]1+ 2.005, 1.944, 1.918
27
S. acidocaldarius XPD [3Fe-4S]1+ 2.02, 1.99
28
Ferroplasma acidarmanus Rad3 [3Fe-4S]1+ 2.022, 2.01, 1.98
29
RtelN [4Fe-4S]1+ 2.050, 1.994, 1.918
30
RNA polymerase [4Fe-4S]1+ 2.075, 1.974, 1.938, 1.897
31
S. cerevisiae primase [3Fe-4S]1+
[4Fe-4S]3+ 2.02, 2.01 2.11, 2.09, 2.0, 1.95
32
Human DNA primase [4Fe-4S]3+ 2.087, 2.040, 2.013
33
S. cerevisiae Polymerase ɛ C-terminal Domain
[4Fe-4S]1+ 2.04, 1.93
34
S. cerevisiae Polymerase ɛ ΔC-terminal Domain
[4Fe-4S]1+
2.090, 2.023, 1.98, 1.90
35
S. cerevisiae Polymerase δ C-terminal Domain
[4Fe-4S]1+ 2.04, 1.93 34
S. cerevisiae Polymerase ζ C-terminal Domain
[4Fe-4S]1+ 2.04, 1.93 34
S. cerevisiae Polymerase δ Complex
[3Fe-4S]1+ 2.02 34
B. subtilis AddAB
[3Fe-4S]1+ 2.019, 1.997, 1.962 9
S. cerevisiae Dna2 [3Fe-4S]1+
[4Fe-4S]1+
[4Fe-4S]3+
2.02, 2.00, 1.98 1.88 2.10
This Work
53 Conclusion
A purification strategy was developed for the expression and purification of
S.cerevisiae Dna2. The isolated protein had full enzymatic activity, and nearly
complete 4Fe-4S cluster incorporation. Purification of Dna2 mutants using this
protocol revealed that there were no contaminating metal binding proteins, DNA-
independent ATPases, or nucleases in the purified protein. This purification
strategy allowed for isolation of protein for characterization of the 4Fe-4S cluster in
Dna2 by UV-visible absorption spectroscopy and EPR spectroscopy. These
studies showed that as purified Dna2 was isolated with the majority of the protein
in the EPR silent 2+ oxidation state, and with a fraction of the protein binding a
[3Fe-4S]1+ cluster. The 4Fe-4S cluster in Dna2 was susceptible to oxidation by
potassium ferricyanide to generate the [3Fe-4S]1+, Fe3+, and [4Fe-4S]3+. The 3Fe-
4S cluster in Dna2 could be reduced by sodium dithionite, but studies aimed at
determining whether Dna2 could be reduced to [4Fe-4S]1+ were inconclusive. The
observations made in this chapter along with recent biochemical and structural
studies suggest that different oxidation states of the iron-sulfur cluster in Dna2
exist, and reversible redox chemistry that cycles between these different states
could regulate Dna2 enzymatic activity.

54 References
1. Bae, S.-H., Bae, K.-H., Kim, J.-A., and Seo, Y.-S. (2001) RPA Governs Endonuclease Switching During Processing of Okazaki Fragments in Eukaryotes. Nature. 412, 456-461.
2. Zhu, Z., Chung, W.-H., Shim, E. Y., Lee, S. E., and Ira, G. (2008) Sgs1 Helicase and Two Nucleases Dna2 and Exo1 Resect DNA Double-Strand Break Ends. Cell. 134, 981-994.
3. Choe, W., Budd, M., Imamura, O., Hoopes, L., and Campbell, J. L. (2002)
Dynamic Localization of an Okazaki Fragment Processing Protein Suggests a Novel Role in Telomere Replication. Mol Cell Biol. 22, 4202-4217.
4. Duxin, J. P., Dao, B., Martinsson, P., Rajala, N., Guittat, L., Campbell, J.
L., Spelbrink, J. N., and Stewart, S. A. (2009) Human Dna2 is a Nuclear and Mitochondrial DNA Maintenance Protein. Mol Cell Biol. 29, 4274-4282.
5. Budd, M. E., Choe, W. C., Campbell, J. L. (2000) The Nuclease Activity of
the Yeast DNA2 Protein, which is Related to the RecB-Like Nucleases, is Essential In Vivo. J Biol Chem. 275, 16518-16529.
6. Stewart, J. A., Campbell, J. L., and Bambara, R. A. (2010) Dna2 is a Structure-Specific Nuclease, with Affinity for 5’-Flap Intermediates. Nucleic Acids Res. 38, 920-930.
7. Pokharel, S. and Campbell, J. L. (2012) Cross Talk Between the Nuclease and Helicase Activities of Dna2: Role of an Essential Iron-Sulfur Cluster Domain. Nucleic Acids Res. 40, 7821-7830.
8. Zhou, C. Pourmal, S., and Pavletich, N. P. (2015) Dna2 Nuclease-Helicase Structure, Mechanism and Regulation by Rpa. eLIFE. 4, e09832.
9. Yeeles, J. T., Cammack, R., and Dillingham, M. S. (2009) An Iron-Sulfur Cluster is Essential for the Binding of Broken DNA by AddAB-Type Helicase-Nucleases. J Biol Chem. 284, 7746-7755.
10. Scheich, C., Niesen, F. H., Seckler, R., and Büssow, K. (2004) An Automated In Vitro Protein Folding Screen Applied to a Human Dynactin Subunit. Protein Sci. 13, 370-380.
55
11. Gibson, D. G., et al. (2009) Enzymatic Assembly of DNA Molecules up to Several Hundred Kilobases. Nature Methods. 6, 343-345.
12. Gasteiger, E., Hoogland, C., Gattiker, A., Duvaud, S., Wilkins, M. R., Appel, R. D., and Bairoch, A. Protein Identification and Analysis Tools on the ExPASy Server; (In) John M. Walker (ed): The Proteomics Protocols Handbook, Humana Press (2005). Pp. 571-607.
13. Cunningham, R. P., et al. (1989) Endonuclease III is an Iron-Sulfur Protein. Biochem. 28, 4450-4455.
14. Levikova, M., Klaue, D., Seidel, R., and Cejka, P. (2013) Nuclease Activity
of Saccharomyces cerevisiae Dna2 Inhibits Its Potent DNA Helicase Activity. Proc Natl Ac Sci USA. 110, E1992-E2001.
15. Boal, A. K., Yavin, E., Lukianova, O. A., O’Shea, V. L., David, S. S., Barton, J. K. (2005) DNA-bound Redox Activity of DNA Repair Glycosylases Containing [4Fe-4S] Clusters. Biochem. 44, 8397-8407.
16. Kennedy, M. C., Mende-Mueller, L., Blondint, G. A., and Beinert, H. (1992) Purification and Characterization of Cytosolic Aconitase from Beef Liver and Its Relationship to the Iron-Responsive Element Binding Protein. Proc Natl Acad Sci. USA. 89, 11730-11734.
17. Taboy, C. H., Vaughan, K. G., Mietzner, T. A., Aisen, P., and Crubliss, A. L. (2001) Fe3+ Coordination and Redox Properties of a Bacterial Transferrin. J Biol Chem. 276, 2719-2724.
18. Bou-Abdallah, F. and Chasteen, N. D. (2008) Spin Concentration Measurements of High-Spin (g’ = 4.3) Rhombic Iron(III) Ions in Biological Samples: Theory and Application. J Biol Inorg Chem. 13, 15-24.
19. Engstrom, L. M., Partington, O. A., and David, S. S. (2012) An Iron-Sulfur Cluster Loop Motif in the Archaeoglobus fulgidus Uracil-DNA Glycosylase Mediates Efficient Uracil Recognition and Removal. Biochem. 51, 5187-5197.
20. Lu, A. L. and Wright, P. M. (2003) Characterization of an Escherichia coli Mutant MutY with a Cysteine to Alanine Mutation at the Iron-Sulfur Domain. Biochem. 42, 3742-3750.

56 21. Lippard, S. J. and Berg, J. M. Principles of Bioinorganic Chemistry.
University Science Books, 1994. Print.
22. Kennedy, M. C., et al. (1984) Evidence for the Formation of a Linear [3Fe-4S] Cluster in Partially Unfolded Aconitase. J Biol Chem. 259, 14463-14471.
23. Yavin, E., Boal, A. K., Stemp, E. D. A., Boon, E. M., Livingston, A. L.,
O’Shea, V. L., David, S. S., and Barton, J. K. (2005) Protein-DNA Charge Transport: Redox Activation of a DNA Repair Protein by Guanine Radical. Proc Nat Acad Sci USA. 102, 3546-3551.
24. Hinks, J. A., Evans, M. C., DeMiguel, Y., Sartori, A. A., Jiricny, J., and
Pearl, L. H. (2002) An Iron-Sulfur Cluster in the Family 4 Uracil-DNA Glycosylases. J Biol Chem. 277, 16936-16940.
25. Buis, J. M., Cheek, J., Kaliri E., and Broderick, J. B. (2006) Characterization
of an Active Spore Photoproduct Lyase, a DNA Repair Enzyme in the Radical S-adenosylmethionine Superfamily. J Biol Chem. 281, 25994-26003.
26. Oberpichler, I., et al. (2011) A Photolyase-Like Protein from Agrobacterium
tumefaciens with an Iron-Sulfur Cluster. PLoS One. 6, e26775.
27. Ren, B., Duan, X., and Ding, H. (2009) Redox Control of the DNA Damage Inducible Protein DinG Helicase Activity via Its Iron-Sulfur Cluster. J Biol Chem. 284, 7746-7755.
28. Rudolf, J., Makrantoni, V., Ingledew, W. J., Stark, M. J., and White, M. F.
(2006) The DNA Repair Helicases XPD and FancJ Have Essential Iron-Sulfur Domains. Mol Cell. 23, 801-808.
29. Pugh, R. A., et al. (2008) The Iron-Containing Domain is Essential in Rad3
Helicases for Coupling of ATP Hydrolysis to DNA Translocation and for Targeting the Helicase to the Single-Stranded DNA-Double Stranded DNA Junction. J Biol Chem. 283, 1732-1743.
30. Landry, A. P. and Ding, H. (2014) The N-Terminus Domain of Human DNA
Helicase Rtel1 Contains a Redox Active Iron-Sulfur Cluster. Biome Res Int. Article ID 285791.
31. Lesssner, F. H., Jennings, M. E., Hirata, A., Duin, E. C., and Lessner, D. J.
(2012) Subunit D of RNA Polymerase from Methanosarcina acetivorans Contains Two Oxygen-Labile [4Fe-4S] Clusters: Implications for Oxidant-Dependent Regulation of Transcription. J Biol Chem. 287, 18510-18523.

57
32. Klinge, S., Hirst, J., Maman, J. D., Krude, T., and Pellegrini, L. (2007) An Iron-Sulfur Domain of the Eukaryotic Primase is Essential for RNA Primer Synthesis. Nature Struct Mol Biol. 14, 875-877.
33. Weiner, B. E., et al. (2007) An Iron-Sulfur Cluster in the C-Terminal Domain
of the p58 Subunit of Human DNA Primase. J Biol Chem. 282, 33444-33451.
34. Netz, D. J., et al. (2011) Eukaryotic DNA Polymerases Require an Iron-
Sulfur Cluster for the Formation of Active Complexes. Nature Chem Biol. 8, 125-132.
35. Jain, R., et al. (2014) An Iron-Sulfur Cluster in the Polymerase Domain of
Yeast DNA Polymerase ɛ. J Mol Biol. 426, 301-308.
36. Genereux, J. C., Boal, A. K., and Barton, J. K. (2010) DNA-Mediated Charge Transport in Redox Sensing and Signaling. J Am Chem Soc. 132, 891-905.
37. White, M. F. and Dillingham, M. S. (2012) Iron-Sulphur Clusters in Nucleic
Acid Processing Enzymes. Curr Opin Struct Biol. 22, 94-100.
38. Wu, Y. and Brosh, R. M. Jr. (2012) DNA Helicase and Helicase-Nuclease Enzymes with a Conserved Iron-Sulfur Cluster. Nucleic Acids Res. 40, 4247-4260.
39. Lindahl, P. A., Gorelick, N. J., Münck, E., and Orme-Johnson, W. H. (1987) EPR and Mössbauer Studies of Nucleotide-bound Nitrogenase Iron Protein from Azotobacter vinelandii. J Biol Chem. 31, 14945-14953.
58 C h a p t e r 3
DNA2 ELECTROCHEMICAL CHARACTERIZATION ON DNA-MODIFIED GOLD ELECTRODES
Abstract The redox activity of the 4Fe-4S cluster in Dna2 was monitored on DNA-
modified gold electrodes. The midpoint potential of this iron cofactor was 60 ± 20
mV v. NHE, which was assigned as the 2+/3+ couple of the 4Fe-4S cluster by
comparison to other DNA binding proteins. A mutant of Dna2, Dna2 C771A, which
binds an unstable 4Fe-4S cluster was not redox active on DNA-modified gold
electrodes, suggesting that the observed signal was due to redox chemistry at the
iron-sulfur cluster. Similar to other DNA binding proteins with 4Fe-4S clusters,
there was no signal observed for Dna2 on gold electrodes modified with ssDNA.
Additionally, the signal intensity as measured by cyclic voltammetry was less on
working electrodes modified with double stranded DNA with an abasic site relative
to undamaged double stranded DNA. These results are consistent with the
observed redox process occurring via a DNA-mediated electron transfer
mechanism. In addition to preliminary characterization of the DNA-bound midpoint
potential of Dna2, the electronic coupling between the iron-sulfur cluster and the
DNA was assessed under conditions that favored either the helicase or nuclease
activity of Dna2. Addition of adenosine triphosphate (ATP) to the bulk protein
solution on the electrode surface, activating the helicase activity of Dna2, led to an
increase in the signal intensity as measured by cyclic voltammetry. In contrast,
addition of MgCl2 to activate the nuclease activity of Dna2, led to a broadening of
the cathodic and anodic peak intensity with a decrease in signal intensity. These
results suggested that the electronic coupling between the iron cofactor in Dna2
and the DNA changed depending on the enzymatic activity of the protein.
Specifically, ATP hydrolysis that occurs while Dna2 is active as a helicase

59 enhances electronic coupling between the DNA and iron-sulfur cluster, whereas
the iron-sulfur cluster does not efficiently participate in DNA-mediated charge
transfer when Dna2 is active as a nuclease. Introduction
DNA-modified gold electrodes are a platform for studying DNA-mediated
electron transfer between an electrode and reactants in the ground state (1,2).
These electrodes are prepared by depositing DNA modified with an alkane-thiol
linker onto a gold working electrode such that a covalent bond forms between the
sulfur on the DNA and the gold surface of the electrode. During this process, the
DNA self assembles into monolayers in which the DNA is positioned at a 45° angle
relative to the gold surface (3). The DNA can either be modified with a redox active
probe prior to deposition to the surface or a DNA binding redox active probe can
be added to the electrode surface following DNA monolayer formation. Then, the
characteristics of electron transfer through DNA can be monitored by analyzing the
flow of electrons from the working electrode, through the DNA base pair π-system,
to the probe (1,2). Although the exact mechanism of charge transport on DNA-
modified electrodes is distinct from that observed in excited state studies with
metal complexes, the general principles of DNA CT are conserved between both
types of experiments: 1) small perturbations in DNA structure attenuate charge
transport and 2) charge transport occurs over large molecular distances with
shallow distance dependence.
The observation that small perturbations to DNA structure attenuate charge
transport on DNA-modified gold electrodes was made early in the development of
this technique. Initial cyclic voltammetry experiments with self-assembled
monolayers of DNA covalently modified with daunomycin showed that a cytosine-
adenine mismatch base pair in the center of a DNA duplex decreased the flow of
electrons through the DNA relative to a DNA duplex without a mismatched base

60 pair (1). This observation was later replicated with a variety of intercalating
redox-active probes and DNA sequences (2,4-6). These early experiments were
performed on a single working electrode. In recent years, the Barton lab has
developed a multiplexed electrode platform that is well suited for the high-
throughput study of DNA CT in larger DNA substrates of up to 100 base pairs in
length (Figure 3.1) (7,8). Using this platform, it was observed that, regardless of
whether electron transfer occurred in a twenty nucleotide DNA duplex or a one
hundred nucleotide DNA duplex, the electron transfer rate was limited by tunneling
through the alkane-thiol linker. These results provided a lower bound on the rate of
electron transfer through the DNA of >108 s-1, a result that was consistent with the
observation that the length of the alkane-thiol linker was inversely proportional to
the rate of electron transfer (9). Furthermore, the DNA substrates that were used in
these experiments had nicks in the sugar phosphate backbone. Thus, it was
concluded that the electrons were transported through the DNA base pair π-
system, regardless of the integrity of the sugar phosphate backbone (8,10). All of
these observations suggest that, consistent with DNA acting as a molecular wire,
ground state electron transfer through the π-system of the nucleobases occurs at
a fast rate with shallow distance dependence. This multiplex chip platform was
used for all experiments described in this chapter.
DNA-modified gold electrodes can also be used to study redox-active DNA
binding proteins, providing insight into the redox chemistry of the 4Fe-4S cluster in
DNA glycosylases and DNA helicases (14-17). These studies have allowed for the
determination of both the thermodynamic properties of the redox process occurring
at the iron-sulfur cluster, as well as the mechanism of charge transport from the
metal center of the protein to the electrode. These experiments revealed that DNA
binding shifts the midpoint potential of the iron-sulfur cluster in DNA binding
proteins by 200 mV such that the DNA bound potential of the 2+/3+ couple of the
4Fe-4S cluster is 80 mV v. NHE (11-16). Additionally, this technique allowed for
the measurement of the electronic coupling between the iron-sulfur cluster of a
protein and the DNA to which it is bound (Figure 3.2). Using this strategy, proteins

61 with altered electron transport properties have been found in disease-relevant
mutants of both the DNA glycosylase Endonuclease III and the DNA helicase XPD
(18,19). Since these mutant proteins had no difference in enzymatic activity or
stability, it was concluded that they have a mutation that attenuates the flow of
electrons from the DNA attached to the electrode to the 4Fe-4S cluster of the
protein. The identification of charge transport deficient mutants has provided
insight into potential electron transport mechanisms within these proteins, as well
as tools for studying the role of DNA CT in disease.
The final type of experiment that can be done to characterize redox-active
proteins on DNA-modified gold electrodes is assaying enzymatic activity at the
DNA that modifies the electrode. The prototypical example of this type of
experiment was the characterization of the ATPase activity of the DNA helicases
Figure 3.1. DNA Charge Transport on DNA-Modified Gold Electrodes. Schematic of a multiplex chip with four different types of DNA deposited to the four different quadrants of the chip: one hundred nucleotide duplex DNA, one hundred nucleotide duplex DNA with a mismatched DNA base pair, seventeen nucleotide duplex DNA, and seventeen nucleotide duplex DNA with a mismatched DNA base pair. A single mismatched base pair (red) in either DNA duplex attenuates electron transfer (yellow arrow) from the electrode surface to the redox probe that was covalently attached to the DNA.
62 DinG and XPD (13,16). Specifically, it was observed that the electronic coupling
between the DNA and the iron-sulfur cluster in these DNA helicases increases
upon ATP hydrolysis. Thus, ATP hydrolysis was proposed to cause a structural
change that facilitated electron transfer through the DNA to the 4Fe-4S cluster of
the protein. This change in electronic coupling could be directly visualized as a
change in signal intensity as measured with cyclic voltammetry, which allowed for
the monitoring of DNA helicase ATPase activity at the electrode surface.
In this chapter, the midpoint potential of Dna2 was determined to be 60 ±
20 mV v. NHE on gold electrodes modified with different DNA substrates.
Consistent with the observed redox chemistry occurring at the iron-sulfur cluster of
Dna2, there was no signal at this potential for the Dna2 C771A mutant. This
mutant has defects in 4Fe-4S cluster binding (20). Variation in the amount of
charge transported between the iron-sulfur cluster in Dna2 and the electrode on
different DNA substrates suggested that the signal at 60 ± 20 mV v. NHE was the
midpoint potential of Dna2 bound to DNA. Specifically, the amount of charge that
flowed from the electrode to the iron-sulfur cluster bound by Dna2 was significantly
less when single stranded DNA (ssDNA) and double stranded DNA (dsDNA) with
an abasic site modified the elecrode relative to an undamaged dsDNA substrate
(2,11).
The redox activity of the iron-sulfur cluster in Dna2 was also assayed under
conditions that favored either helicase or nuclease activity. The signal intensity of
the cathodic and anodic peak on the cyclic voltammogram of Dna2 increased upon
addition of ATP, which activates Dna2 as a helicase. Thus, consistent with
observations made on other DNA helicases, electronic coupling between the iron-
sulfur cluster in Dna2 and the electrode is enhanced when the protein is acting as
a helicase. The addition of magnesium chloride, which activates the nuclease
activity of the protein, led to broadening of both the anodic and cathodic peak on
the cyclic voltammogram along with a decrease in signal intensity. Therefore,
electronic coupling between the iron-sulfur cluster of Dna2 and the electrode is
decreased when this protein is active as a nuclease. These experiments suggest
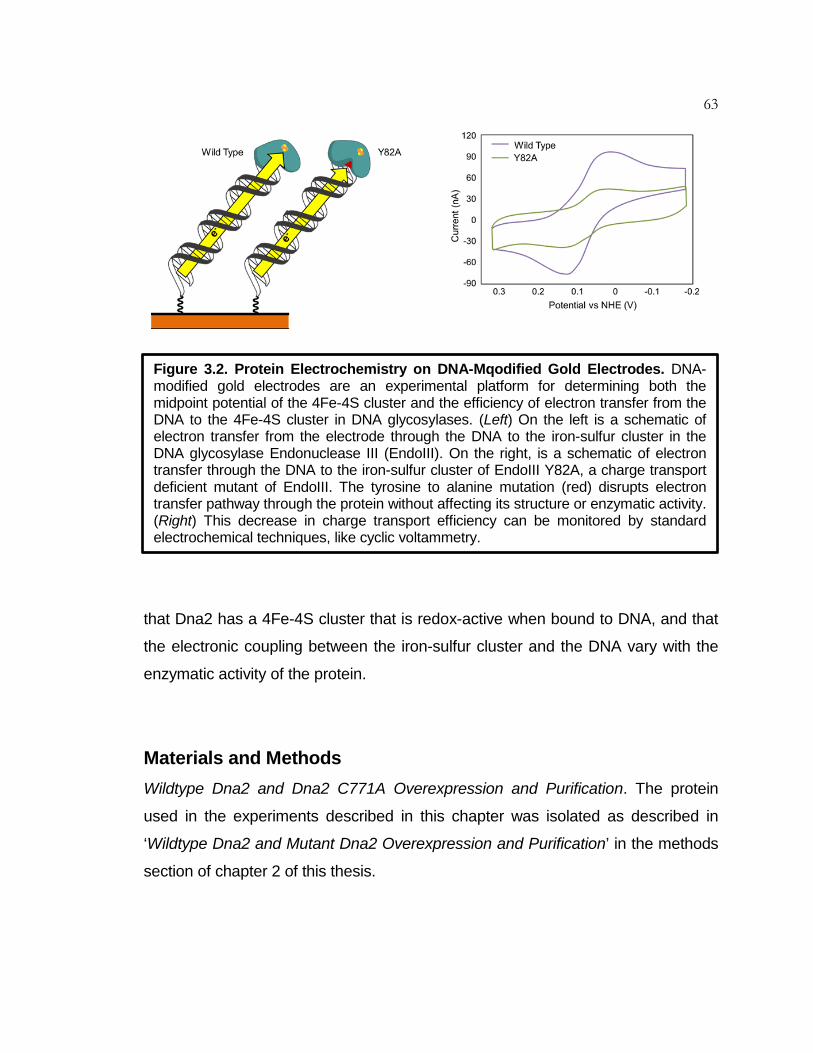
63
that Dna2 has a 4Fe-4S cluster that is redox-active when bound to DNA, and that
the electronic coupling between the iron-sulfur cluster and the DNA vary with the
enzymatic activity of the protein.
Materials and Methods
Wildtype Dna2 and Dna2 C771A Overexpression and Purification. The protein
used in the experiments described in this chapter was isolated as described in
‘Wildtype Dna2 and Mutant Dna2 Overexpression and Purification’ in the methods
section of chapter 2 of this thesis.
Figure 3.2. Protein Electrochemistry on DNA-Mqodified Gold Electrodes. DNA-modified gold electrodes are an experimental platform for determining both the midpoint potential of the 4Fe-4S cluster and the efficiency of electron transfer from the DNA to the 4Fe-4S cluster in DNA glycosylases. (Left) On the left is a schematic of electron transfer from the electrode through the DNA to the iron-sulfur cluster in the DNA glycosylase Endonuclease III (EndoIII). On the right, is a schematic of electron transfer through the DNA to the iron-sulfur cluster of EndoIII Y82A, a charge transport deficient mutant of EndoIII. The tyrosine to alanine mutation (red) disrupts electron transfer pathway through the protein without affecting its structure or enzymatic activity. (Right) This decrease in charge transport efficiency can be monitored by standard electrochemical techniques, like cyclic voltammetry.

64 Oligonucleotide Preparation. All DNA substrates were purchased from IDT DNA
(Table 3.1). All single stranded DNA was purified with a reverse phase PLRP-S
column (Agilent) on an 1100 series HPLC (Agilent). A 50 mM ammonium
acetate/acetonitrile gradient was used to purify the DNA. The disulfide DNA was
incubated in 80% acetic acid/20% water for 25 minutes at room temperature.
Then, the disulfide modified DNA was reduced with 4M DTT in tris buffer (10 mM
tris-HCl, pH8.5) at room temperature for 45 minutes. Both the thiol DNA and the
unmodified DNA was purified by reverse phase chromatography. All single-
stranded DNA was precipitated with ethanol, and suspended in phosphate buffer
(5 mM sodium phosphate, 50 mM sodium chloride, pH 7).
The oligonucleotides were characterized with matrix assisted laser
desorption ionization time of flight mass spectrometry (Applied Biosystems
Voyager DE-PRO MALDI TOF-MS). The absorption spectrum of the purified single
stranded DNA was obtained on a Cary UV-visible absorption spectrometer. All
spectra were zeroed and baseline corrected with the absorption spectrum of
phosphate buffer. The molar concentration of DNA was estimated with the
absorption of the DNA at 260 nm and the extinction coefficient of the DNA as
predicted by the IDT DNA oligoanalyzer tool. The complementary single-stranded
DNA stocks were diluted in phosphate buffer such that the final concentration of
each strand was 50 μM. The DNA solutions were degassed with argon, and
annealed by heating to 90 °C followed by cooling to ambient temperature over
Table 3.1. Oligonucleotides for Electrochemistry
Oligonucleotide Name
Oligonucleotide Sequence
HMS2 disulfide
5’- disulfide*-GTGCTGCAACGTGTCTGCGC -3’
HMS2 thiol
5’- thiol-GTGCTGCAACGTGTCTGCGC -3’
HMS2 complement 5’- CAGACGAGAGCGCAGACACGTTGCAGCAC -3’
HMS2 abasic 5’-CAGACGAGAGCGCAGACACGTTGCA(Abasic)CAC -3’
*/5ThioMC6-D/ modification from IDT DNA.
65 ninety minutes. All DNA was annealed immediately prior to use in each
electrochemistry experiment.
Multiplex Chip Preparation, Assembly of DNA Self-Assembled Monolayers
(SAMs), and Electrochemical Measurements. The multiplex chips were made as
described previously by Dr. Catrina Pheeney and Phil Bartels (15). DNA SAMs
were assembled on the gold working electrodes of the multiplex chips using
previously described procedures (15). Only high density DNA self-assembled
monolayers were used for the studies described in this chapter. High density DNA
SAMs were formed by addition of 100 mM MgCl2 to the DNA that was deposited to
the gold working electrode. A platinum wire served as the auxiliary electrode. The
reference electrode was a solid state Ag/AgCl electrode (Warner Instruments). All
measurements were made with a BAS CV50W model electrochemical analyzer.
All data was analyzed with Ch Instruments software.
Direct Electrochemistry of Dna2 on DNA-Modified Gold Electrodes. 20 μM Dna2
was added to gold working electrodes that were modified with either HMS2 ssDNA
(HMS2 thiol) or HMS2 dsDNA (HMS2 thiol with HMS2 complement). All DNA
strands shown in parenthesis were annealed as described above to form the
indicated DNA substrates. The protein was in storage buffer (20 mM sodium
phosphate, pH 7.5, 0.5 mM EDTA, 100 mM NaCl, 20 % glycerol). Cyclic
voltammograms were acquired between -0.4V to 0.1V v. Ag/AgCl.
Direct Electrochemistry of Dna2 C771A on DNA-Modified Gold Electrodes. 8 μM
Dna2 C771A was added to gold working electrodes that were modified with
HMS2 ssDNA (HMS2 thiol), HMS2 dsDNA (HMS2 thiol with HMS2 complement),
or HMS2 abasic dsDNA (HMS2 thiol with HMS2 abasic). All DNA strands shown in
parenthesis were annealed as described above to form the indicated DNA
substrate. The protein assayed was stored in gel filtration buffer (20 mM trizma-
HCl, pH 8, 0.1 mM EDTA, 200 mM NaCl, 2 mM DTT). This Dna2 mutant was

66 prone to aggregation during purification on the Superdex200 size exclusion
column. The major peak, which corresponded to the first Dna2 fraction that eluted
from the column, was assayed in this experiment. Cyclic voltammograms were
acquired between -0.4V to 0.1V v. Ag/AgCl at the following time points following
Dna2 addition to the electrode surface: 0 hours, 1 hour, 3 hours, 7 hours, and 19
hours.
Direct Electrochemistry of Dna2 in Nuclease Assay Buffer on DNA-Modified Gold
Electrodes. In this experiment, 8 μM Dna2 was added to two identical gold working
electrodes that were modified with HMS2 well-matched duplex (HMS2 thiol with
HMS2 duplex. The protein was stored in gel filtration buffer (20 mM trizma-HCl, pH
8, 0.1 mM EDTA, 200 mM NaCl, 2 mM DTT). 2 mM MgCl2 in gel filtration buffer
was added to one of the multiplex chips to stimulate nuclease activity. Cyclic
voltammograms were acquired between -0.4V to 0.1V v. Ag/AgCl at the following
time points following Dna2 addition to the electrode surface: 0 hours, 3 hours, 18.5
hours, and 24 hours.
Direct Electrochemistry of Dna2 in ATPase Assay Buffer on DNA-Modified Gold
Electrodes. In this experiment, 20 μM Dna2 was added to two identical gold
working electrodes that were modified with HMS2 well-matched duplex (HMS2
thiol with HMS2 duplex). The protein was stored in gel filtration buffer (20 mM
trizma-HCl, pH 8, 0.1 mM EDTA, 200 mM NaCl, 2 mM DTT). 4 mM ATP and 2 mM
MgCl2 was added to one of the multiplex chips. Cyclic voltammograms were
acquired between -0.4V to 0.1V v. Ag/AgCl at the following time points after Dna2
addition to the electrode surface: 0 hours, 1 hour, 2 hours, 3 hours, and 6 hours.
Results
Cyclic voltammetry of Dna2 on DNA-modified Gold Electrodes. The redox activity
of Dna2 was monitored by cyclic voltammetry on gold working electrodes modified
with a variety of DNA substrates. Using this technique, the midpoint potential of the
67 protein was determined to be 60 ± 20 mV v. NHE (Figure 3.3). The signal
intensity was proportional to the square root of the scan rate, which suggested that
the observed redox process was diffusion-limited (21). Since this redox process
was diffusion-limited under all conditions assayed, the electron transfer rate could
not be estimated using the Laviron method (22).
The mechanism of electron transfer for the observed redox process was
investigated by studying electron transfer to the iron-sulfur cluster of Dna2 on gold
electrodes modified with different DNA substrates. These experiments were
performed to determine whether the redox process observed was due to electron
transfer from the gold working electrode through the DNA to the iron-sulfur cluster
of the protein. The DNA substrates that were used in these experiments included a
5’-tail DNA substrate that contained a nine nucleotide overhang and a twenty
nucleotide duplex region (HMS2 dsDNA), a twenty nucleotide single stranded DNA
substrate (HMS2 ssDNA), and a 5’-tail DNA substrate that contained a nine
nucleotide overhang and a twenty nucleotide duplex region with an abasic site
three base pairs from the site of DNA attachment to the gold electrode (HMS2
abasic dsDNA).
DNA-mediated charge transport cannot occur in single stranded DNA, so
the signal intensity on this substrate should be much less than the signal intensity
on dsDNA. DNA Charge transport to the iron-sulfur cluster of Dna2 should also be
attenuated by structural perturbation in the DNA that results from the presence of a
DNA lesion such as an abasic site (11,15). Thus, if the process observed by cyclic
voltammetry is a DNA-mediated process, the amount of charge that transfers from
the electrode through the DNA to the protein should be attenuated in the
electrodes modified with ssDNA or dsDNA abasic. This result would manifest itself
as a decrease in the signal intensity of the cathodic and anodic peaks on the cyclic
voltammogram (Figure 3.4). In addition to variation in DNA substrates, different types of self-assembled
DNA monolayers can also be assembled by changing the conditions under which
the DNA monolayers are formed by the addition of magnesium chloride. Previous
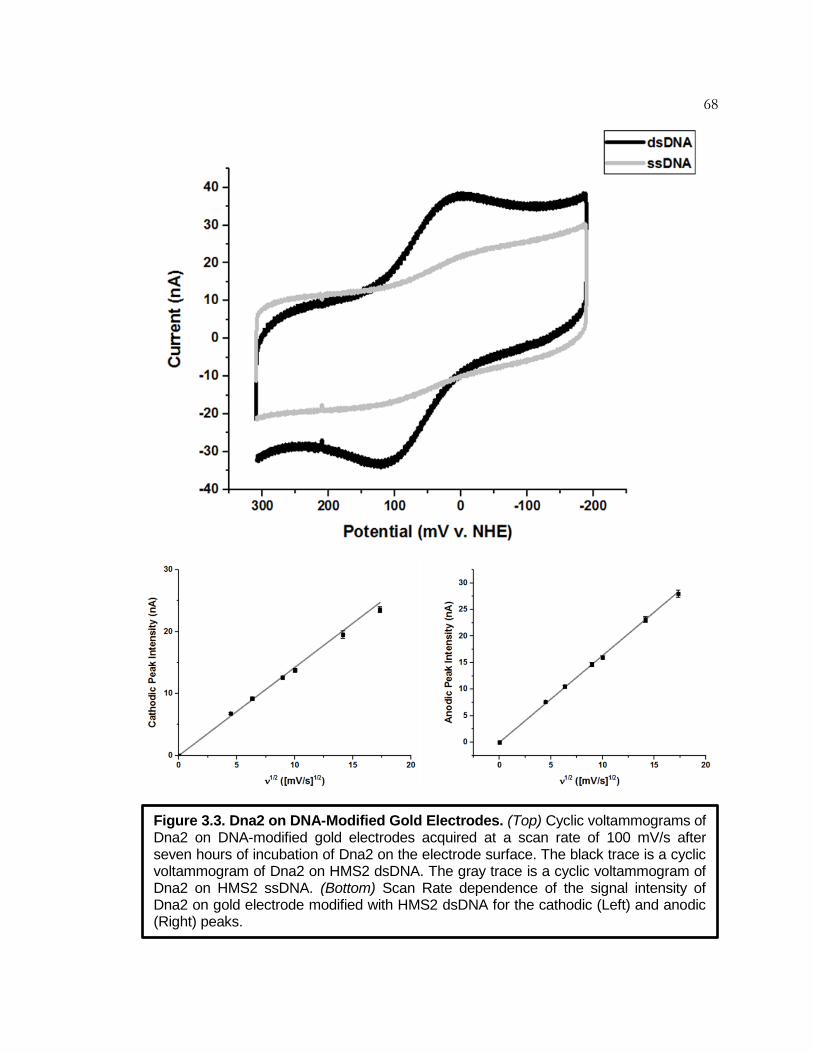
68
Figure 3.3. Dna2 on DNA-Modified Gold Electrodes. (Top) Cyclic voltammograms of Dna2 on DNA-modified gold electrodes acquired at a scan rate of 100 mV/s after seven hours of incubation of Dna2 on the electrode surface. The black trace is a cyclic voltammogram of Dna2 on HMS2 dsDNA. The gray trace is a cyclic voltammogram of Dna2 on HMS2 ssDNA. (Bottom) Scan Rate dependence of the signal intensity of Dna2 on gold electrode modified with HMS2 dsDNA for the cathodic (Left) and anodic (Right) peaks.
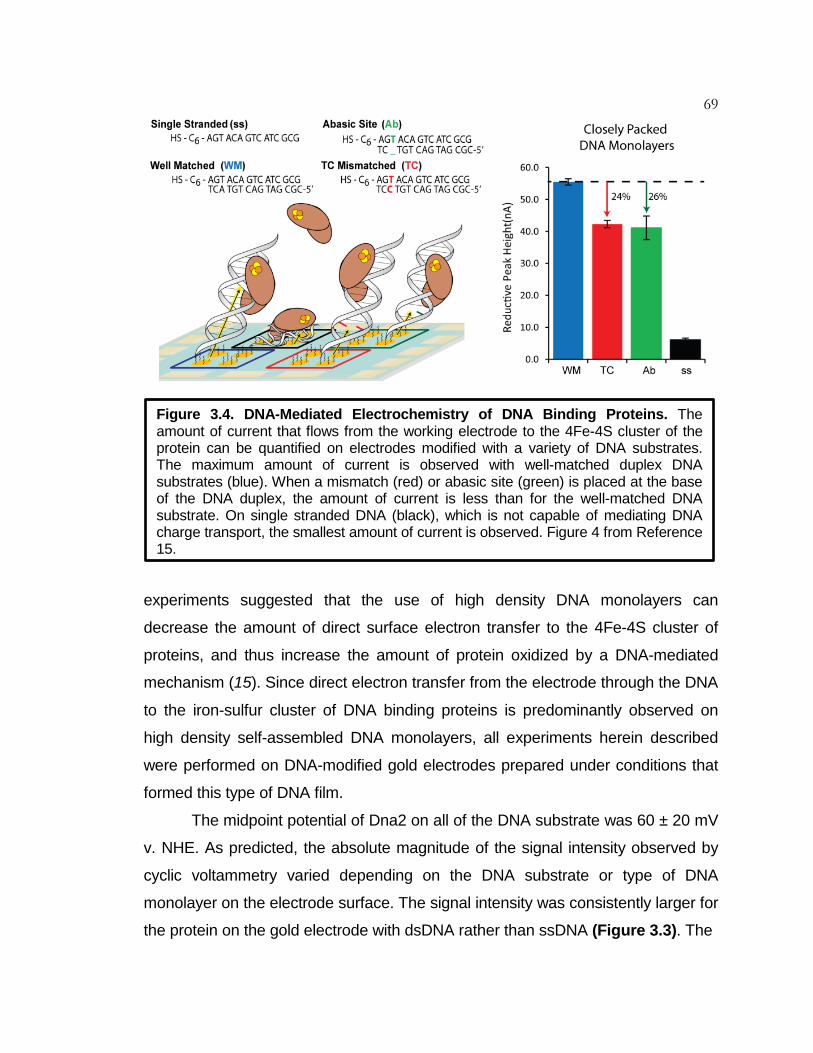
69
experiments suggested that the use of high density DNA monolayers can
decrease the amount of direct surface electron transfer to the 4Fe-4S cluster of
proteins, and thus increase the amount of protein oxidized by a DNA-mediated
mechanism (15). Since direct electron transfer from the electrode through the DNA
to the iron-sulfur cluster of DNA binding proteins is predominantly observed on
high density self-assembled DNA monolayers, all experiments herein described
were performed on DNA-modified gold electrodes prepared under conditions that
formed this type of DNA film.
The midpoint potential of Dna2 on all of the DNA substrate was 60 ± 20 mV
v. NHE. As predicted, the absolute magnitude of the signal intensity observed by
cyclic voltammetry varied depending on the DNA substrate or type of DNA
monolayer on the electrode surface. The signal intensity was consistently larger for
the protein on the gold electrode with dsDNA rather than ssDNA (Figure 3.3). The
Figure 3.4. DNA-Mediated Electrochemistry of DNA Binding Proteins. The amount of current that flows from the working electrode to the 4Fe-4S cluster of the protein can be quantified on electrodes modified with a variety of DNA substrates. The maximum amount of current is observed with well-matched duplex DNA substrates (blue). When a mismatch (red) or abasic site (green) is placed at the base of the DNA duplex, the amount of current is less than for the well-matched DNA substrate. On single stranded DNA (black), which is not capable of mediating DNA charge transport, the smallest amount of current is observed. Figure 4 from Reference 15.
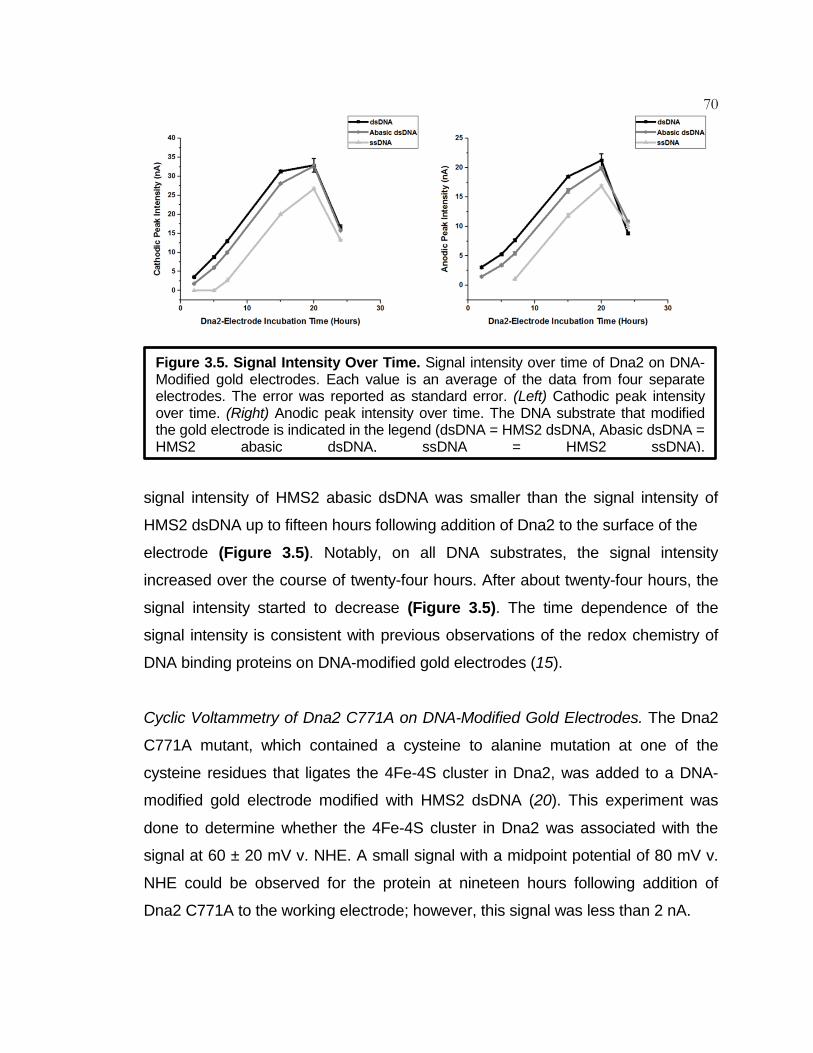
70
signal intensity of HMS2 abasic dsDNA was smaller than the signal intensity of
HMS2 dsDNA up to fifteen hours following addition of Dna2 to the surface of the
electrode (Figure 3.5). Notably, on all DNA substrates, the signal intensity
increased over the course of twenty-four hours. After about twenty-four hours, the
signal intensity started to decrease (Figure 3.5). The time dependence of the
signal intensity is consistent with previous observations of the redox chemistry of
DNA binding proteins on DNA-modified gold electrodes (15).
Cyclic Voltammetry of Dna2 C771A on DNA-Modified Gold Electrodes. The Dna2
C771A mutant, which contained a cysteine to alanine mutation at one of the
cysteine residues that ligates the 4Fe-4S cluster in Dna2, was added to a DNA-
modified gold electrode modified with HMS2 dsDNA (20). This experiment was
done to determine whether the 4Fe-4S cluster in Dna2 was associated with the
signal at 60 ± 20 mV v. NHE. A small signal with a midpoint potential of 80 mV v.
NHE could be observed for the protein at nineteen hours following addition of
Dna2 C771A to the working electrode; however, this signal was less than 2 nA.
Figure 3.5. Signal Intensity Over Time. Signal intensity over time of Dna2 on DNA-Modified gold electrodes. Each value is an average of the data from four separate electrodes. The error was reported as standard error. (Left) Cathodic peak intensity over time. (Right) Anodic peak intensity over time. The DNA substrate that modified the gold electrode is indicated in the legend (dsDNA = HMS2 dsDNA, Abasic dsDNA = HMS2 abasic dsDNA, ssDNA = HMS2 ssDNA).

71
To confirm that the electrode surface was intact, wild type Dna2 protein was
added to the chip at the same concentration as the mutant protein.
The signal intensity that was observed for wild type Dna2 was significantly larger
than that observed for the Dna2 C771A mutant as measured by cyclic voltammetry
(Figure 3.6). This experiment suggested that redox activity at the iron cofactor in
Dna2 was being monitored on the DNA-modified gold electrodes.
Cyclic voltammetry of Dna2 in Nuclease Assay Buffer on DNA-Modified Gold
Electrodes. The electronic coupling between the iron-sulfur cluster of Dna2 and the
DNA that modified the gold electrode was investigated under conditions that
Figure 3.6. Dna2 and Dna2 C771A on DNA-Modified Gold Electrodes. Cyclic voltammogram acquired at a scan rate of 100 mV/s after seven hour incubation of the protein on the electrode surface.
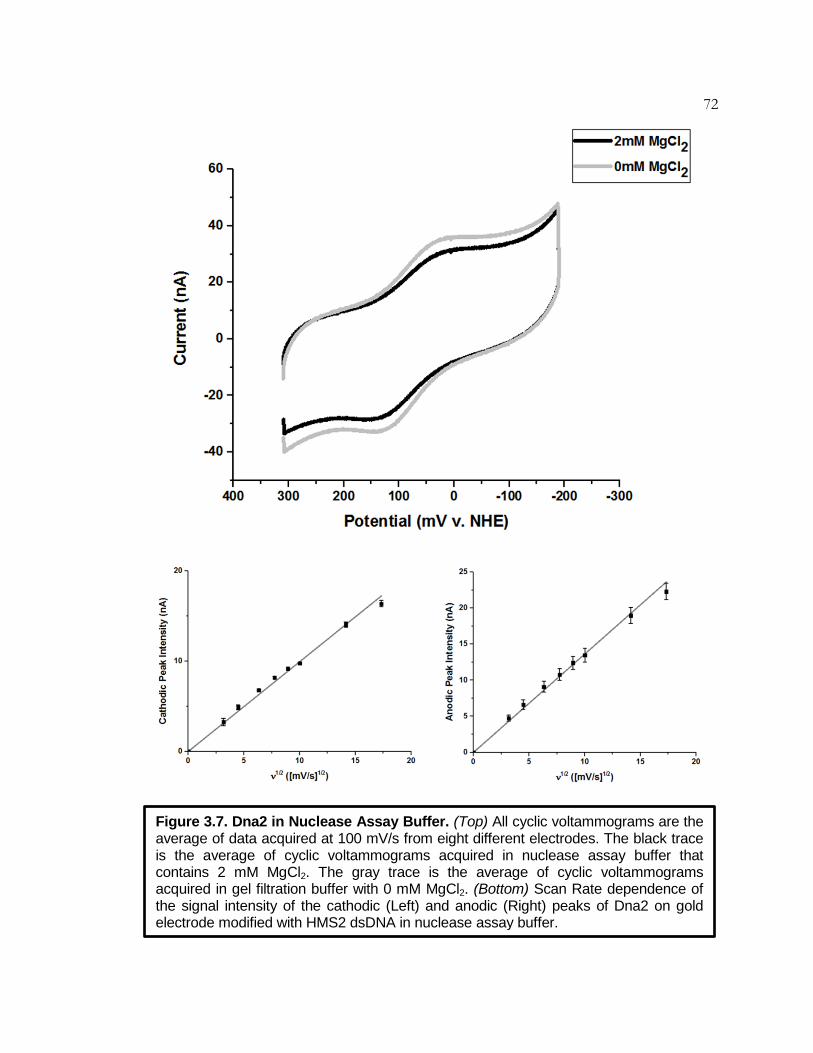
72
Figure 3.7. Dna2 in Nuclease Assay Buffer. (Top) All cyclic voltammograms are the average of data acquired at 100 mV/s from eight different electrodes. The black trace is the average of cyclic voltammograms acquired in nuclease assay buffer that contains 2 mM MgCl2. The gray trace is the average of cyclic voltammograms acquired in gel filtration buffer with 0 mM MgCl2. (Bottom) Scan Rate dependence of the signal intensity of the cathodic (Left) and anodic (Right) peaks of Dna2 on gold electrode modified with HMS2 dsDNA in nuclease assay buffer.

73 favored Dna2 nuclease activity. The signal intensity as measured with cyclic
voltammetry reports on the current that passes from the electrode to a redox-active
species. Therefore, a larger signal is synonymous with better electronic coupling
between the iron-sulfur cluster and the electrode via the DNA. Conversely, a
smaller signal indicates poor electronic coupling between the iron-sulfur cluster
and the electrode. Since the observed redox process is DNA-mediated, and thus
the current that passes from the electrode to the redox active species occurs via
the DNA, the signal intensity as measured by cyclic voltammetry also reports on
the electronic coupling between the iron cofactor and the DNA.
Dna2 is active as a nuclease only when magnesium chloride is present in
the assay buffer. Additionally, Dna2 is active as a nuclease on DNA substrates that
contain a 5’-ssDNA overhang, like the 5’-tail DNA substrate used in the previous
experiments (HMS2 dsDNA) (23). Thus, two multiplex chips were modified with the
HMS dsDNA substrate, and Dna2 was added to both chips. 2 mM magnesium
chloride was added to one chip to activate Dna2 nuclease activity, and the cyclic
voltammograms of Dna2 on the two chips were compared to evaluate the redox
chemistry of Dna2 when active as a nuclease. This experiment provided two
insights into the redox process occurring under these conditions (Figure 3.7). First,
the magnitude of the signal intensity of Dna2 in the presence of 2 mM MgCl2 on
the gold working electrode was smaller than that of the protein without MgCl2 in the
buffer. Second, the kinetics of the redox process observed under both conditions
was diffusion limited. These results suggest that although the kinetics of the redox
process are the same under both conditions assayed, activation of the nuclease
activity leads to a decrease in electronic coupling between Dna2 and the electrode.
Cyclic voltammetry of Dna2 in ATPase Assay Buffer on DNA-Modified Gold
Electrodes. To determine the extent of electronic coupling between the iron-sulfur
cluster in Dna2 and the DNA when Dna2 was active as a helicase, two multiplex
chips were modified with the HMS2 dsDNA substrate and side-by-side comparison
was made of the redox process occurring on the two chips upon
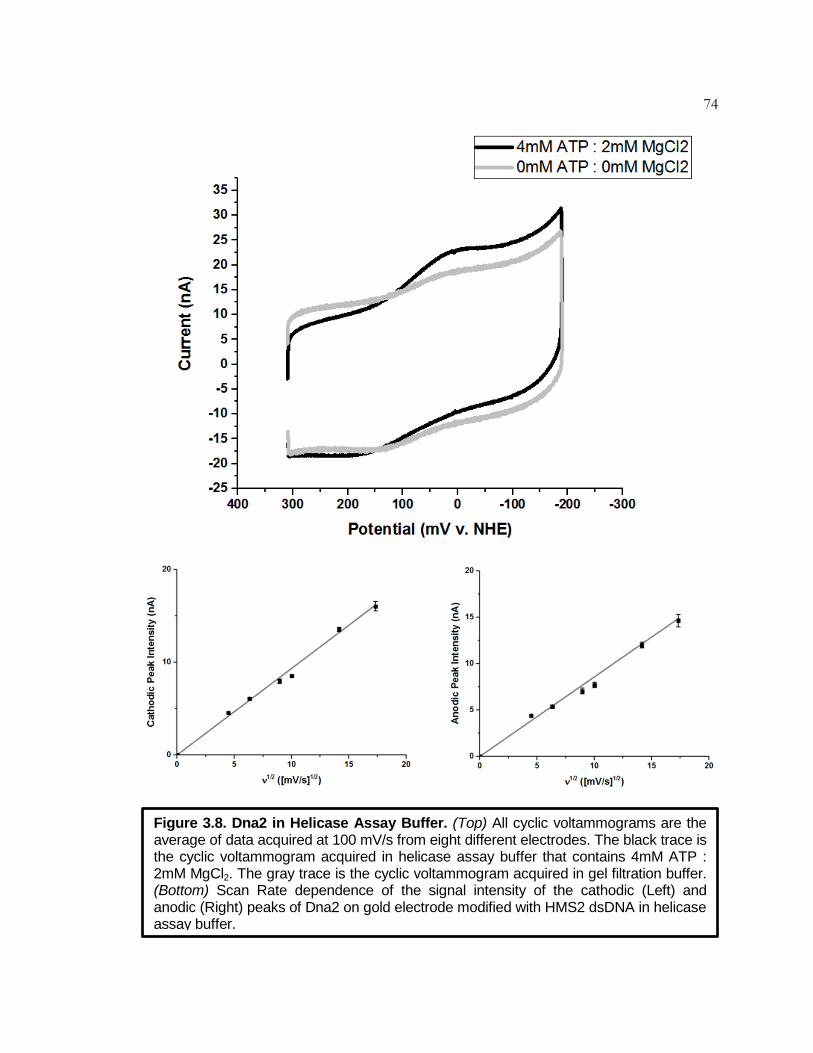
74
Figure 3.8. Dna2 in Helicase Assay Buffer. (Top) All cyclic voltammograms are the average of data acquired at 100 mV/s from eight different electrodes. The black trace is the cyclic voltammogram acquired in helicase assay buffer that contains 4mM ATP : 2mM MgCl2. The gray trace is the cyclic voltammogram acquired in gel filtration buffer. (Bottom) Scan Rate dependence of the signal intensity of the cathodic (Left) and anodic (Right) peaks of Dna2 on gold electrode modified with HMS2 dsDNA in helicase assay buffer.

75
addition of Dna2 and ATP. 4 mM ATP and 2 mM magnesium chloride were added
to one of the multiplex chips to activate Dna2 helicase activity while inhibiting
nuclease activity (23). Notably, the DNA-dependent ATPase activity was assayed
under these buffer conditions with the HMS2 dsDNA substrate in solution to
confirm that Dna2 did bind DNA under these assay conditions (data not shown).
The addition of ATP led to an increase in signal intensity and broadening of
the cathodic peak on the cyclic voltammogram of Dna2 (Figure 3.8). ATP addition
also increased the peak splitting on the cyclic voltammogram. The anodic peak
intensity did not immediately increase as rapidly as the cathodic peak intensity;
however, over time the anodic peak intensity increased such that it was about
equal in size to the cathodic peak intensity. Thus, although the signal intensity
increased upon activation of the helicase activity of the protein, the redox process
occurring at the electrode was less reversible than the same redox process in the
absence of ATP. Consistent with the other experiments performed in this study,
the redox process observed in the presence of ATP was diffusion limited. These
Figure 3.9. Electronic Coupling Between the Iron-Sulfur Cluster of Dna2 and the DNA on Gold Electrodes. (Left) The cathodic peak intensity of Dna2 under nuclease conditions after 18.5 hours of incubation on the electrode surface. Each bar represents the average data from seven electrodes. (Right) The cathodic peak intensity of Dna2 under Dna2 helicase assay conditions Each point represents the average of data from eight different electrodes. All cyclic voltammograms were acquired at a scan rate of 100 mV/s.
76 observations are consistent with the results obtained with the helicases DinG
and XPD, that ATP hydrolysis facilitates electronic coupling with the DNA (13,16).
Conclusion
Dna2, a eukaryotic helicase-nuclease that binds an iron-sulfur cluster, was
studied on DNA-modified gold electrodes to better characterize the redox
properties of the metal center in this enzyme. Cyclic voltammetry of Dna2 on DNA-
modified gold electrodes revealed that the iron-sulfur cluster in this protein has a
midpoint potential of 60 ± 20 mV v. NHE. Analysis of the Dna2 C771A mutant on
the DNA-modified electrodes showed that the redox couple observed by cyclic
voltammetry for wild type Dna2 was occurring at the iron cofactor. Furthermore,
the redox activity of the iron-sulfur cluster in Dna2 was assayed under conditions
that should activate either the helicase or the nuclease activity of this protein
(Figure 3.9). The nuclease activity of Dna2 was activated by addition of MgCl2 to
the reaction, which led to an overall decrease in electronic coupling between the
DNA and the iron-sulfur cluster. Conversely, addition of ATP to the reaction, which
stimulates helicase activity and inhibits nuclease activity, led to an increase in
electronic coupling between the DNA and the iron-sulfur cluster.
The electrochemical results presented in this chapter are consistent with
recent structural studies of mouse Dna2, a homolog of S. cerevisiae Dna2. These
studies revealed that the iron-sulfur cluster in Dna2 is positioned near the site of
DNA binding in the nuclease domain (24). Thus, the stabilization of the 3+
oxidation state through electrostatic interaction with the DNA could lead to a large
shift in midpoint potential of the 2+/3+ couple of the 4Fe-4S cluster. Additionally,
the structure revealed that the β-barrel domain in Dna2 could serve as a hinge that
mediates the interaction between the helicase and the nuclease domains where
the iron-sulfur cluster is located (Figure 2.2). This observation provides insight into
how ATP hydrolysis, which occurs at a different domain of Dna2, could regulate
electronic coupling between the iron-sulfur cluster and the DNA. In combination,
77 the electrochemical and structural studies of Dna2 provide support for a
mechanism in which Dna2 can participate in DNA-mediated redox chemistry while
active as a DNA helicase.
78 References
1. Kelley, S. O., Barton, J. K., Jackson, N., and Hill, M. G. (1997) Electrochemistry of Methylene Blue Bound to a DNA-Modified Electrode. Bioconjugate Chemistry. 8, 31-37.
2. Kelley, S. O., Jackson, N. M., Hill, M. G., and Barton, J. K. (1999) Long Range Electron Transfer Through DNA Films. Agnew Chem Int Ed Eng. 38, 941-945.
3. Kelley, S. O., Barton, J. K., Jackson, N. M., McPherson, L. D., Potter, A. B., Spain, E. M., Allen, M. J., and Hill, M. G. (1998) Orienting DNA Helices on Gold Using Applied Electric Fields. Langmuir.14, 6781-6784.
4. Kelley, S. O., Boon, E. M., Barton, J. K., Jackson, N. M., and Hill, M. G. (1999) Singe-Base Mismatch Detection Based on Charge Transduction Through DNA. Nucleic Acids Res. 27, 4830-4837.
5. Pheeney, C. G. and Barton, J. K. (2013) Intraduplex DNA-Mediated Electrochemistry of Covalently Tethered Redox-Active Reporters. J Am Chem Soc. 135, 14944-14947.
6. Pheeney, C. G. and Barton, J. K. (2012) DNA Electrochemistry with Tethered Methylene Blue. Langmuir. 28, 7063-7070.
7. Slinker, J. D., Muren, N. B., Gorodetsky, A. A., and Barton, J. K. (2010) Multiplexed DNA-Modified Electrodes. J Am Chem Soc. 132, 2769-2774.
8. Slinker, J. D., Muren, N. B., Renfrew, S. E., and Barton, J. K. (2011) DNA Charge Transport Over 34 nm. Nat Chem. 3, 230-235.
9. Drummond, T. G., Hill, M. G., and Barton, J. K. (2004) Electron Transfer Rates in DNA Films as a Function of Tether Length. J Am Chem Soc. 126, 15010-15011. .
10. Liu, T. and Barton, J. K. (2005) DNA Electrochemistry Through the Base Pairs Not the Sugar-Phosphate Backbone. J Am Chem Soc. 127, 10160-10161.

79 11. Boal, A. K., Yavin, E., Lukianova, O. A., O’Shea, V. L., David, S. S., and
Barton, J. K. (2005) DNA-Bound Redox Activity of DNA Repair Glycosylases Containing [4Fe-4S] Clusters. Biochem. 44, 8397-8407.
12. Romano, C. A.*, Sontz, P. A.*, and Barton, J. K. (2011) Mutants of the Base Excision Repair Glycosylase, Endonuclease III: DNA Charge Transport as a First Step in Lesion Detection. Biochem. 50, 6133-6145.
13. Mui, T. P., Fuss, J. O., Ishida, J. P., Tainer, J. A., and Barton, J. K. (2011) ATP-Stimulated, DNA-Mediated Redox Signaling by XPD, a DNA Repair and Transcription Helicase. J Am Chem Soc. 133, 16378-16381.
14. Gorodetsky, A. A., Boal, A. K., and Barton, J. K. (2006) Direct Electrochemistry of Endonuclease III in the Presence and Absence of DNA. J Am Chem Soc. 128, 12082-12083.
15. Pheeney, C. G., Arnod, A. R., Grodick, M. A., and Barton, J. K. (2013) Multiplexed Electrochemistry of DNA-Bound Metalloproteins. J Am Chem Soc. 135, 11869-11878.
16. Grodick, M. A., Segal, H. M., Zwang, T. J., and Barton, J. K. (2014) DNA-Mediated Signaling by Proteins with 4Fe-4S Clusters Is Necessary for Genomic Integrity. J Am Chem Soc. 136, 6470-6478.
17. Genereux, J. C., Boal, A. K., and Barton, J. K. (2010) DNA-Mediated
Charge Transport in Redox Sensing and Signaling. J Am Chem Soc. 132, 891-905.
18. Boal, A. K., et al. (2009) Redox Signaling Between DNA Repair Proteins for
Efficient Lesion Detection. Proc Natl Acad Sci USA. 106, 15237-15242.
19. Sontz, P. A., Mui, T. P., Fuss, J. O., Tainer, J. A., and Barton, J. K. (2012) DNA Charge Transport as a First Step in Coordinating the Detection of Lesions by Repair Proteins. Proc Natl Acad Sci USA. 109, 1856-1861.
20. Pokharel, S. and Campbell, J. L. (2012) Cross Talk Between the Nuclease and Helicase Activities of Dna2: Role of an Essential Iron-Sulfur Cluster Domain. Nucleic Acids Res. 40, 7821-7830.
21. Bard, A. J. and Faulkner, L. R. Electrochemical Methods – Fundamental and Application, 2nd ed.; Joh Wiley & Sons: New York, 2000; pp.580-631.
80 22. Laviron, E. (1979) General Expression of the Linear Potential Sweep
Voltammogram in the Case of Diffusionless Electrochemical Systems. J Electroanal Chem and Interfacial Electrochem. 101, 19-28.
23. Budd, M. E. and Campbell, J. L. (1995) A Yeast Gene Required for DNA
Replication Encodes a Protein with Homology to DNA Helicases. Proc Natl Acad Sci USA. 92, 7642-7646.
24. Zhou, C. Pourmal, S., and Pavletich, N. P. (2015) Dna2 Nuclease-Helicase Structure, Mechanism and Regulation by Rpa. eLIFE. 4, e09832.

81 C h a p t e r 4
ELECTROCHEMICAL ASSAY TO DETECT DNA2 NUCLEASE ACTIVITY
Abstract
Dna2 is a helicase-nuclease that prevents genomic instability through its
multifunctional roles in DNA replication and recombinational repair. Either aberrant
Dna2 expression or inactivating mutations in the gene that encodes Dna2 can lead
to the development of human diseases, such as cancer. Thus, an assay to
effectively detect the activity of this protein could prove to be an important
diagnostic tool. Herein a novel electrochemical assay is described for the detection
of Dna2 nuclease activity on a gold electrode modified with different DNA
substrates. This assay could reliably detect nanomolar differences in Dna2
concentrations. Additionally, nuclease activity could be detected for wild type
Dna2, but not for the nuclease-deficient E675A mutant, highlighting the specificity
of this assay. The system was further validated by testing Dna2 nuclease activity
on a variety of 5’-tail DNA substrates with different 5’-tail overhang lengths. This
assay provides a faster alternative to more traditional radioactivity-based Dna2
nuclease activity assays, and constitutes the first Dna2 nuclease activity assay that
does not rely on radioactivity. The simplicity, efficiency, and low cost of this assay
will make it an appropriate alternative for both research and diagnostic applications
aimed at monitoring Dna2 nuclease activity.
Introduction
Dna2 is a helicase-nuclease that is evolutionarily conserved in eukaryotes.
This protein has multiple roles in the cell, including Okazaki fragment maturation,
82 recombinational repair, mitochondrial genome maintenance, and telomere
maintenance (1-4). This protein is composed of a RecB-like nuclease domain that
has dual DNA nuclease activity (5’ to 3’ and 3’ to 5’) and a SF1B helicase domain
that has 5’ to 3’ DNA helicase activity (5,6).
In human cells, aberrant Dna2 activity has been implicated in the
development of disease since its nuclease activity helps repair double strand
breaks that result from either oncogenic or chemical stress, thereby alleviating
cellular stresses that would otherwise cause senescence (7). Therefore,
overexpression of Dna2 in cells that contain activated oncogenes could increase
cell proliferation, resulting in the neoplastic progression of tumors. Consistent with
this hypothesis, Dna2 expression is significantly increased in some human
cancers, such as breast and pancreatic cancer. In these contexts, Dna2
expression levels were inversely correlated with patient survival. Conversely, Dna2
deficiency resulted in cellular senescence (7). Together these findings suggest that
Dna2 enzymatic activity could be an important biomarker of cancer. In addition to
its role in cancer progression, mutations in Dna2 that inactivate nuclease activity
contribute to the development of genetic disorders that lead to progressive
myopathies and Seckel syndrome (8,9).
The role of Dna2 in disease development and progression make this protein
a potential biomarker of disease, so strategies for detecting Dna2 nuclease activity
out of complex patient samples could serve as a useful diagnostic tool.
Additionally, the role of Dna2 nuclease activity in cancer progression makes it a
potential chemotherapeutic target, requiring a high throughput way to screen
potential nuclease inhibitors. Despite the need for methodologies that can be
easily multiplexed to develop the aforementioned technologies, there is currently
only one known method for monitoring Dna2 nuclease activity in vitro. This
approach requires radioactive isotope labeling of DNA along with sequencing gel
analysis of DNA fragments, which makes the full assay both time consuming and
expensive. An electrochemical nuclease activity assay for Dna2 would provide a
more economical and higher throughput alternative to the radioactivity-based
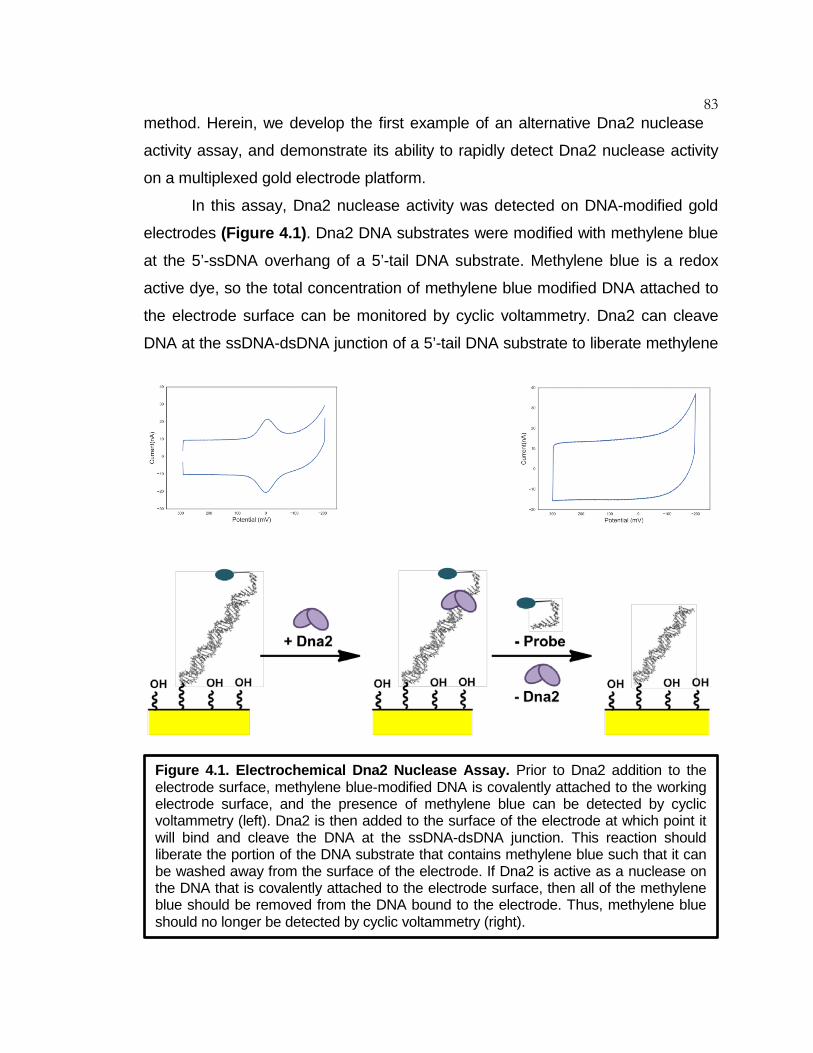
83 method. Herein, we develop the first example of an alternative Dna2 nuclease
activity assay, and demonstrate its ability to rapidly detect Dna2 nuclease activity
on a multiplexed gold electrode platform. In this assay, Dna2 nuclease activity was detected on DNA-modified gold
electrodes (Figure 4.1). Dna2 DNA substrates were modified with methylene blue
at the 5’-ssDNA overhang of a 5’-tail DNA substrate. Methylene blue is a redox
active dye, so the total concentration of methylene blue modified DNA attached to
the electrode surface can be monitored by cyclic voltammetry. Dna2 can cleave
DNA at the ssDNA-dsDNA junction of a 5’-tail DNA substrate to liberate methylene
Figure 4.1. Electrochemical Dna2 Nuclease Assay. Prior to Dna2 addition to the electrode surface, methylene blue-modified DNA is covalently attached to the working electrode surface, and the presence of methylene blue can be detected by cyclic voltammetry (left). Dna2 is then added to the surface of the electrode at which point it will bind and cleave the DNA at the ssDNA-dsDNA junction. This reaction should liberate the portion of the DNA substrate that contains methylene blue such that it can be washed away from the surface of the electrode. If Dna2 is active as a nuclease on the DNA that is covalently attached to the electrode surface, then all of the methylene blue should be removed from the DNA bound to the electrode. Thus, methylene blue should no longer be detected by cyclic voltammetry (right).
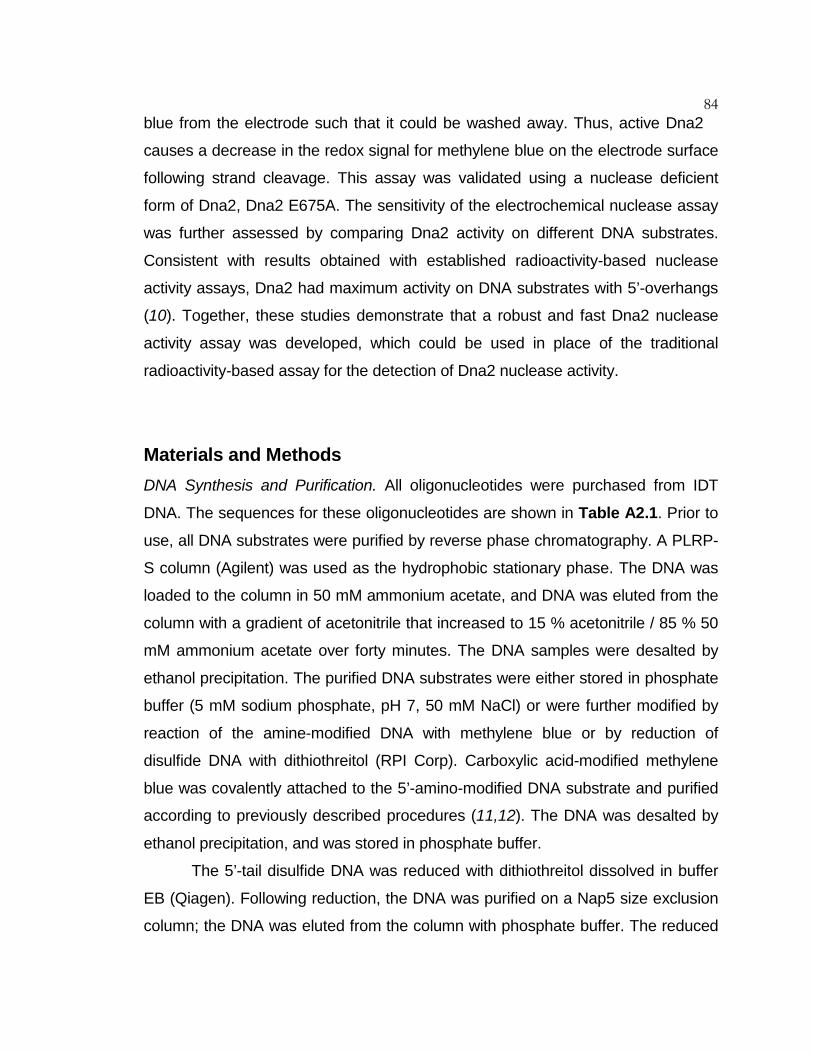
84 blue from the electrode such that it could be washed away. Thus, active Dna2
causes a decrease in the redox signal for methylene blue on the electrode surface
following strand cleavage. This assay was validated using a nuclease deficient
form of Dna2, Dna2 E675A. The sensitivity of the electrochemical nuclease assay
was further assessed by comparing Dna2 activity on different DNA substrates.
Consistent with results obtained with established radioactivity-based nuclease
activity assays, Dna2 had maximum activity on DNA substrates with 5’-overhangs
(10). Together, these studies demonstrate that a robust and fast Dna2 nuclease
activity assay was developed, which could be used in place of the traditional
radioactivity-based assay for the detection of Dna2 nuclease activity.
Materials and Methods DNA Synthesis and Purification. All oligonucleotides were purchased from IDT
DNA. The sequences for these oligonucleotides are shown in Table A2.1. Prior to
use, all DNA substrates were purified by reverse phase chromatography. A PLRP-
S column (Agilent) was used as the hydrophobic stationary phase. The DNA was
loaded to the column in 50 mM ammonium acetate, and DNA was eluted from the
column with a gradient of acetonitrile that increased to 15 % acetonitrile / 85 % 50
mM ammonium acetate over forty minutes. The DNA samples were desalted by
ethanol precipitation. The purified DNA substrates were either stored in phosphate
buffer (5 mM sodium phosphate, pH 7, 50 mM NaCl) or were further modified by
reaction of the amine-modified DNA with methylene blue or by reduction of
disulfide DNA with dithiothreitol (RPI Corp). Carboxylic acid-modified methylene
blue was covalently attached to the 5’-amino-modified DNA substrate and purified
according to previously described procedures (11,12). The DNA was desalted by
ethanol precipitation, and was stored in phosphate buffer.
The 5’-tail disulfide DNA was reduced with dithiothreitol dissolved in buffer
EB (Qiagen). Following reduction, the DNA was purified on a Nap5 size exclusion
column; the DNA was eluted from the column with phosphate buffer. The reduced
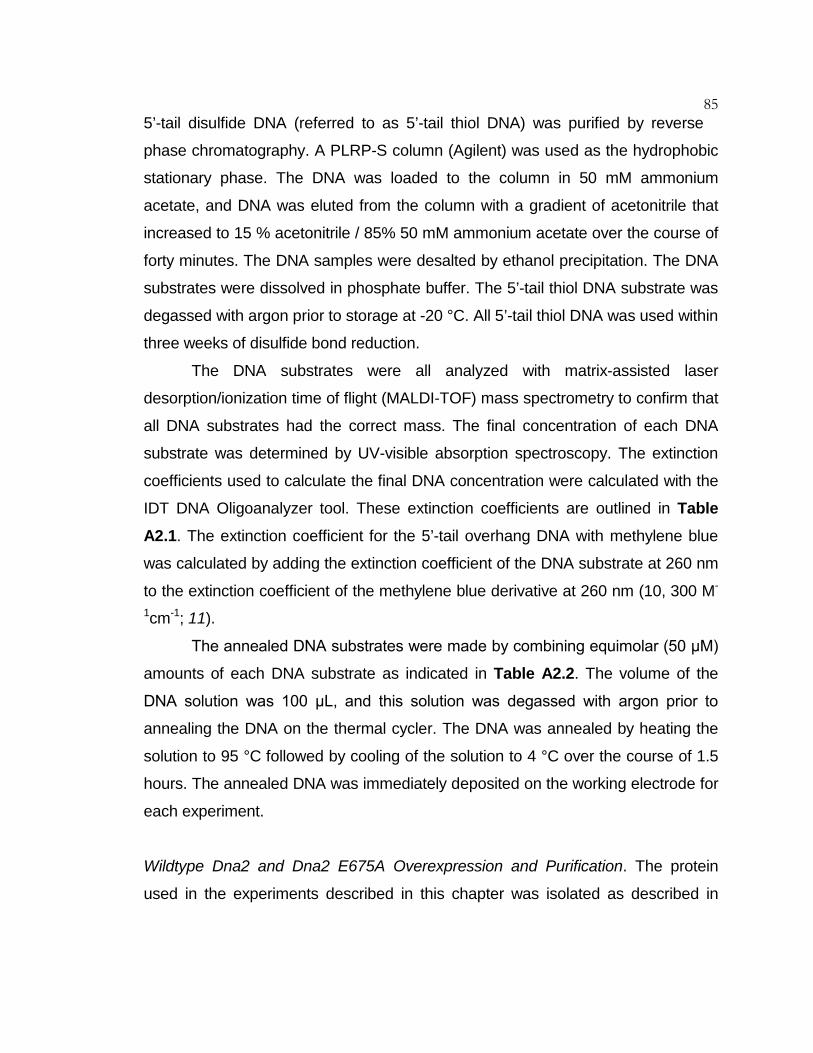
85 5’-tail disulfide DNA (referred to as 5’-tail thiol DNA) was purified by reverse
phase chromatography. A PLRP-S column (Agilent) was used as the hydrophobic
stationary phase. The DNA was loaded to the column in 50 mM ammonium
acetate, and DNA was eluted from the column with a gradient of acetonitrile that
increased to 15 % acetonitrile / 85% 50 mM ammonium acetate over the course of
forty minutes. The DNA samples were desalted by ethanol precipitation. The DNA
substrates were dissolved in phosphate buffer. The 5’-tail thiol DNA substrate was
degassed with argon prior to storage at -20 °C. All 5’-tail thiol DNA was used within
three weeks of disulfide bond reduction.
The DNA substrates were all analyzed with matrix-assisted laser
desorption/ionization time of flight (MALDI-TOF) mass spectrometry to confirm that
all DNA substrates had the correct mass. The final concentration of each DNA
substrate was determined by UV-visible absorption spectroscopy. The extinction
coefficients used to calculate the final DNA concentration were calculated with the
IDT DNA Oligoanalyzer tool. These extinction coefficients are outlined in Table A2.1. The extinction coefficient for the 5’-tail overhang DNA with methylene blue
was calculated by adding the extinction coefficient of the DNA substrate at 260 nm
to the extinction coefficient of the methylene blue derivative at 260 nm (10, 300 M-
1cm-1; 11).
The annealed DNA substrates were made by combining equimolar (50 μM)
amounts of each DNA substrate as indicated in Table A2.2. The volume of the
DNA solution was 100 μL, and this solution was degassed with argon prior to
annealing the DNA on the thermal cycler. The DNA was annealed by heating the
solution to 95 °C followed by cooling of the solution to 4 °C over the course of 1.5
hours. The annealed DNA was immediately deposited on the working electrode for
each experiment.
Wildtype Dna2 and Dna2 E675A Overexpression and Purification. The protein
used in the experiments described in this chapter was isolated as described in
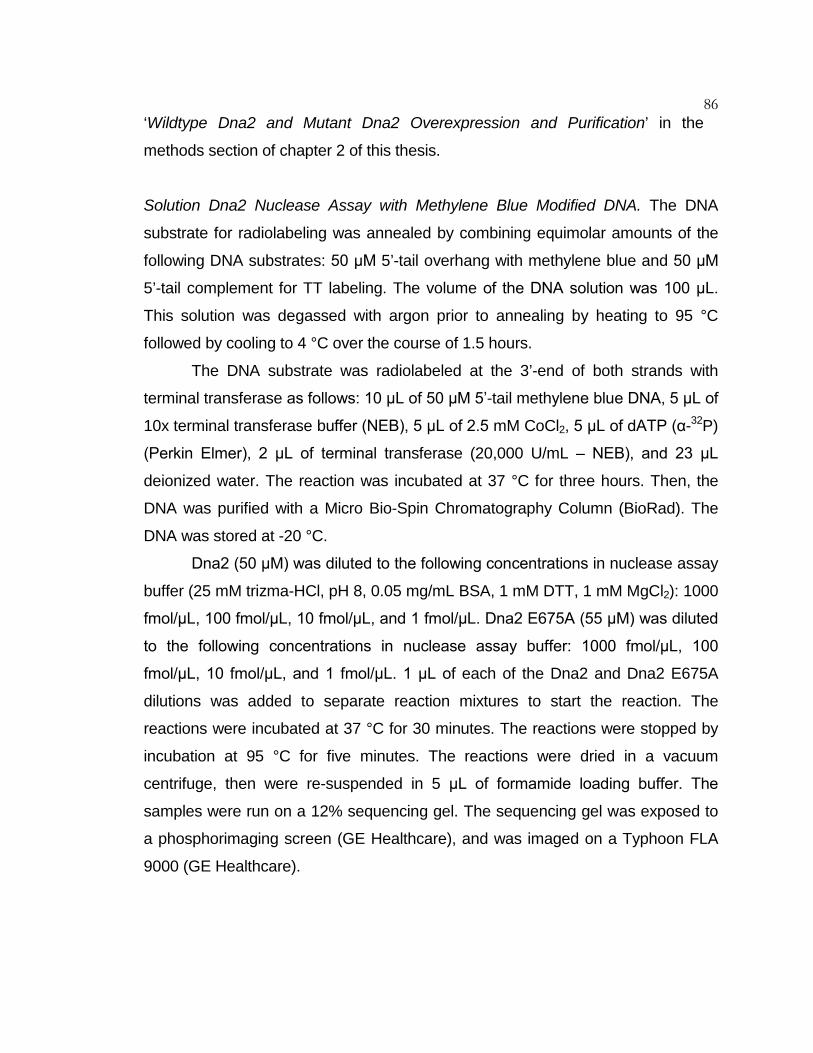
86 ‘Wildtype Dna2 and Mutant Dna2 Overexpression and Purification’ in the
methods section of chapter 2 of this thesis.
Solution Dna2 Nuclease Assay with Methylene Blue Modified DNA. The DNA
substrate for radiolabeling was annealed by combining equimolar amounts of the
following DNA substrates: 50 μM 5’-tail overhang with methylene blue and 50 μM
5’-tail complement for TT labeling. The volume of the DNA solution was 100 μL.
This solution was degassed with argon prior to annealing by heating to 95 °C
followed by cooling to 4 °C over the course of 1.5 hours.
The DNA substrate was radiolabeled at the 3’-end of both strands with
terminal transferase as follows: 10 μL of 50 μM 5’-tail methylene blue DNA, 5 μL of
10x terminal transferase buffer (NEB), 5 μL of 2.5 mM CoCl2, 5 μL of dATP (α-32P)
(Perkin Elmer), 2 μL of terminal transferase (20,000 U/mL – NEB), and 23 μL
deionized water. The reaction was incubated at 37 °C for three hours. Then, the
DNA was purified with a Micro Bio-Spin Chromatography Column (BioRad). The
DNA was stored at -20 °C.
Dna2 (50 μM) was diluted to the following concentrations in nuclease assay
buffer (25 mM trizma-HCl, pH 8, 0.05 mg/mL BSA, 1 mM DTT, 1 mM MgCl2): 1000
fmol/μL, 100 fmol/μL, 10 fmol/μL, and 1 fmol/μL. Dna2 E675A (55 μM) was diluted
to the following concentrations in nuclease assay buffer: 1000 fmol/μL, 100
fmol/μL, 10 fmol/μL, and 1 fmol/μL. 1 μL of each of the Dna2 and Dna2 E675A
dilutions was added to separate reaction mixtures to start the reaction. The
reactions were incubated at 37 °C for 30 minutes. The reactions were stopped by
incubation at 95 °C for five minutes. The reactions were dried in a vacuum
centrifuge, then were re-suspended in 5 μL of formamide loading buffer. The
samples were run on a 12% sequencing gel. The sequencing gel was exposed to
a phosphorimaging screen (GE Healthcare), and was imaged on a Typhoon FLA
9000 (GE Healthcare).
87 Chip Preparation and DNA Self Assembled Monolayer (SAM) Formation.
Integrated multiplex chips with an internal platinum reference electrode and an
internal platinum auxiliary electrode were prepared as described previously (13).
Multiplex chips were washed and assembled using previously described methods
(13). The chips were ozone cleaned for 15 minutes. DNA SAMs were assembled
on the gold working electrodes of the multiplex chips by incubating 25 μM of the 5’-
tail with methylene blue DNA duplex on the working electrode overnight at room
temperature in a humid environment.
Electrochemical Nuclease Assay. Following DNA SAM formation, the chip was
washed with phosphate buffer (5 mM sodium phosphate, pH 7, 50 mM NaCl). The
electrode was backfilled with 1 mM 6-mercaptohexanol in phosphate buffer that
contained 5 % glycerol for 45 minutes at room temperature. Then, the working
electrode was rinsed with phosphate buffer. A cyclic voltammogram was acquired
at a scan rate of 100 mV/s over a potential window of 0 to -0.5 mV v. platinum.
Experiments were performed only if there were no major redox peaks on the cyclic
voltammogram except for that characteristic of methylene blue. A second
background cyclic voltammogram was acquired after the chips were washed with
TBP buffer (5 mM sodium phosphate, pH 7, 50 mM NaCl, 4 mM MgCl2, 4 mM
spermidine, 50 μM EDTA, 10 % glycerol). The chips were washed with nuclease
assay buffer (20 mM trizma-HCl, pH 8, 0.05 mg/mL BSA, 2 mM MgCl2). All buffer
was removed from the chip prior to addition of the nuclease assay reactions on the
working electrode.
Dna2 was diluted in nuclease assay buffer. 1 μL of each protein stock
solution was added to 19 μL nuclease assay buffer such that the final protein
concentrations in the reactions were: 5 μM, 1 μM, 500 nM, 250 nM, 120 nM, 60
nM, and 30 nM. 20 μL nuclease assay buffer was added to one quadrant of the
integrated chip as a negative control. The reactions were started by addition of
Dna2, and the integrated chips were incubated at 30 °C for 30 minutes. The
reactions were removed from the multiplex chips, and the chips were washed five
88 times with TBP buffer. A cyclic voltammogram was acquired at a scan rate of
100 mV/s over a potential window of 0 to -0.5 mV v. platinum.
The percent of DNA cleaved by Dna2 was calculated by measuring the
area of the methylene blue cathodic and anodic peaks before and after the
nuclease assay. All data was analyzed with Ch Instruments software. All
measurements were made with a BAS CV50W model electrochemical analyzer.
Results Nuclease Activity Assay with 5’-Tail Methylene Blue DNA in Solution. Dna2 binds
DNA via a threading mechanism in which the 5’-tail of a DNA substrate is passed
through the enzyme prior to being cleaved (14). If there is a block on the 5’-tail of
the DNA substrate, such as a hybridized oligonucleotide or streptavidin, the DNA
substrate cannot be bound in this way. However, Dna2 can process DNA
substrates that are modified at the 5’-tail with a small molecule such as biotin.
Therefore, an assay was performed to confirm that DNA modified on the 5’-end
with methylene blue was a substrate for the nuclease domain of Dna2. As
expected, Dna2 was active as a nuclease on the methylene blue labeled DNA
substrate. Dna2 cleaved the DNA substrate at the ssDNA-dsDNA junction of the
5’-tail substrate with a ten nucleotide overhang to leave duplex DNA (Figure A2.1). Additionally, consistent with results from the literature, a Dna2 E675A mutant was
much less active as a nuclease than wild type Dna2 on this DNA substrate (5).
Self-Assembled Monolayer Formation of 5’-Tail DNA Substrates. In the
established radioactivity-based nuclease activity assay, the level of Dna2 activity is
dependent on the DNA substrate (10). Specifically, Dna2 displays maximal
nuclease activity on DNA substrates that have a 5’-tail ssDNA overhang greater
than fifteen nucleotides in length. Dna2 is progressively less active on 5’-tail
substrates with shorter overhangs, with essentially no Dna2 nuclease activity
observed on duplex DNA. The activity of Dna2 on 5’-tail DNA substrates with

89 different overhang lengths was assessed in the present assay to determine
whether the same trends were observed in the electrochemical nuclease assay.
To validate the electrochemical nuclease assay, four different DNA
substrates were synthesized to contain covalent methylene blue at the 5’-end of
the DNA distal from the gold electrode. The substrates used in this experiment
consisted of duplex DNA, 5’-tail DNA with a two nucleotide overhang, 5’-tail DNA
with a ten nucleotide overhang, and 5’-tail DNA with a twenty nucleotide overhang
(Table A2.2). These DNA substrates were all deposited onto a gold electrode to
form a self-assembled monolayer to determine whether monolayer formation was
affected with any of these substrates. The total amount of DNA adsorbed to the
working electrode surface was about the same regardless of the DNA substrate
that was being used to form monolayers. Furthermore, the amount of DNA
attached to the electrode was on the same order of magnitude as that used in the 32P nuclease activity assay (Figure A2.5). Therefore, direct comparison could be
made between Dna2 activity on gold electrodes modified with the different DNA
substrates, since the same amount of DNA was attached to the electrodes.
The self-assembled monolayers of the different methylene blue-modified
DNA substrates had slightly different characteristics as assessed by monitoring the
redox activity of methylene blue by cyclic voltammetry (Figure 1 and Figures A2.2-A2.4). Consistent with previous observations, the cathodic peak was more
diffuse for both the duplex DNA and 5’-tail DNA with a two nucleotide overhang.
This observation suggested that there may be multiple pathways for reduction of
methylene blue in these monolayers. Previously, it was suggested that in these
types of DNA assemblies, there are two routes for electron transfer, one through
the DNA and one directly from the electrode surface (12). The shape of the
cathodic peak for the 5’-tail DNA with a ten nucleotide overhang and the 5’-tail
DNA with a twenty nucleotide overhang suggested that direct electron transfer
from the working electrode to methylene blue was the major electron transfer
mechanism. Notably, reduction of methylene blue is thought to facilitate methylene
blue unbinding from the DNA, so the oxidation of this probe is always via the

90 surface of the electrode (12,15). Consistent with this observation, there was no
difference in the anodic peak shape for the different types of DNA monolayers.
It was confirmed that the methylene blue DNA substrates were covalently
bound to the electrode surface by monitoring changes in both the cathodic and
anodic current intensity with respect to the scan rate. Both the cathodic and anodic
current intensity increased linearly in response to increasing scan rate (Figures A2.6-A2.14). Thus, the DNA substrates were covalently linked to the gold
electrode rather than diffusing in solution (16).
Dna2 Nuclease Activity on Gold Electrodes Modified with 5’-Tail DNA Substrates.
In the assay described in this report, the amount of Dna2 nuclease activity was
quantified by measuring the percentage of DNA cleaved on the electrode surface.
This measurement was made by first evaluating the total amount of DNA present
on the electrode surfaces prior to addition of Dna2 based on the signal intensity of
the anodic peak for methylene blue. The amount of residual DNA on the electrode
was calculated based on the signal intensity of the anodic peak for methylene blue
after the nuclease assay reaction had been removed from the electrode. The
Figure 4.2. Electrochemical Nuclease Assay on a 5’-Tail DNA Substrate. (Left) Cyclic voltammograms of electrodes modified with 5’-tail DNA substrate with a ten nucleotide overhang following nuclease activity assay. The concentration of Dna2 used in each activity assay is shown in the top left corner of the voltammogram. (Right) Quantification of Dna2 nuclease activity on a 5’-tail DNA substrate with a ten nucleotide overhang. Error was calculated as standard error.

91 cathodic peak intensity could not be used to accurately determine the amount of
Dna2 activity due to both the broadening of this peak upon protein addition, as well
as interference from an oxygen-dependent signal at negative potentials.
As expected, Dna2 was active as a nuclease on DNA substrates covalently
attached to the working electrode surface. There was an increase in the amount of
DNA cleaved as Dna2 was titrated into the nuclease assay (Figure 4.2). These
results suggested that this assay could effectively distinguish differences in Dna2
concentrations. Notably, the maximum amount of DNA that was cleaved on the
surface was about 50% of the total methylene blue present on the electrode
surface. This observation is consistent with previous studies, and suggests that the
residual DNA was in a conformation that could not be processed by DNA binding
proteins (17).
In general, as was observed for the radioactivity-based nuclease assay,
Dna2 was more active on the 5’-tail DNA substrates that had longer overhangs
(Figure 4.3). However, there were two differences in DNA substrate preference
between the results obtained in the established radioactivity-based nuclease assay
versus the results obtained in the electrochemical nuclease assay that are
important to consider when developing this platform for diagnostic applications.
First, Dna2 had about the same activity on the 5’-tail with a ten nucleotide
overhang DNA substrate and the 5’-tail with a twenty nucleotide overhang DNA
substrate. In the radioactivity-based assay, Dna2 was significantly more active on
5’-tail DNA substrates with a twenty nucleotide overhang relative to an eight
nucleotide overhang.
The second unexpected result was that there was a significant amount of
Dna2 nuclease activity observed on the 5’-tail DNA substrate with a two nucleotide
overhang. This may have occurred because the presence of the covalently linked
methylene blue destabilized DNA duplex formation. If this destabilization
manifested itself at the top of the DNA duplex nearest the overhang, then the DNA
duplex may de-hybridize, forming a larger overhang than designed for this

92
substrate. These observations suggest that the maximum Dna2 nuclease activity,
which was unbiased by interaction of the DNA with the electrode or by chemical
modification, was observed on the 5’-tail DNA substrate with a ten nucleotide
overhang. Therefore, this DNA substrate should be used in the development of
this method for any diagnostic applications.
Dna2 E675A Nuclease Activity on DNA-Modified Gold Electrodes. To determine
the specificity of Dna2 nuclease activity, the electrochemical nuclease assay was
performed with a nuclease-deficient form of Dna2, Dna2 E675A. As expected, the
nuclease deficient Dna2 E675A mutant exhibited a decrease in nuclease activity
relative to the wildtype enzyme (Figure 4.4). This sensitivity is essential for
detection of mutant forms of human Dna2, such as the Arg284His, Lys313Glu, and
Val723Ile mutants. These mutant proteins have deficient nuclease
Figure 4.3. Dna2 Nuclease Activity on 5’-Tail DNA Substrates with Different Overhang Lengths. Comparison of Dna2 nuclease activity on different DNA-modified gold electrodes. The 5’-tail overhang length for each substrate assay is shown on the top right of the graph. Error was calculated as standard error.

93
activity, and are linked to the development of progressive myopathy (8). Thus, the
detection of the Dna2 E675A mutant suggests this assay can be used to detect the
types of defects in Dna2 nuclease activity that could serve as a biomarker of
disease
Conclusion A fast and robust nuclease activity assay for Dna2 was developed. This
constitutes the first Dna2 nuclease activity assay that does not require
radioactivity. With this assay, Dna2 nuclease activity could be detected at
nanomolar concentrations, with a wide dynamic range of detection. Therefore, this
assay could be used to measure differences in Dna2 concentration across
samples, which would be necessary to monitor Dna2 nuclease activity in cancer.
The specificity of this assay was confirmed with a nuclease deficient mutant, Dna2
E675A, suggesting that this assay could be used for the effective detection of
nuclease deficient mutants of Dna2. These types of mutants are often indicative of
Figure 4.4. Electrochemical Nuclease Assay with the Dna2 E675A Nuclease-Deficient Mutant. The total protein concentration for each assay was 500 nM. The DNA substrate was the 5’-tail with a ten nucleotide overhang. Error was calculated as standard error.
94 disease progression. Finally, the assay was further validated by comparison of
the relative amounts of nuclease activity on DNA substrates that were known to
have a distinct pattern of degradation based on established radioactivity assays.
The speed, simplicity, and reliability of this assay makes it a useful alternative for
the development of more high throughput methods for the screening of small
molecule inhibitors or the diagnosis of diseases associated with aberrant Dna2
nuclease activity.

95 References
1. Bae, S.-H., Bae, K.-H., Kim, J.-A., and Seo, Y.-S. (2001) RPA Governs Endonuclease Switching During Processing of Okazaki Fragments in Eukaryotes. Nature. 412, 456-461.
2. Zhu, Z., Chung, W.-H., Shim, E. Y., Lee, S. E., and Ira, G. (2008) Sgs1 Helicase and Two Nucleases Dna2 and Exo1 Resect DNA Double-Strand Break Ends. Cell. 134, 981-994.
3. Choe, W., Budd, M., Imamura, O., Hoopes, L., and Campbell, J. L. (2002)
Dynamic Localization of an Okazaki Fragment Processing Protein Suggests a Novel Role in Telomere Replication. Mol Cell Biol. 22, 4202-4217.
4. Duxin, J. P., Dao, B., Martinsson, P., Rajala, N., Guittat, L., Campbell, J.
L., Spelbrink, J. N., and Stewart, S. A. (2009) Human Dna2 is a Nuclear and Mitochondrial DNA Maintenance Protein. Mol Cell Biol. 29, 4274-4282.
5. Budd, M. E., Choe, W. C., Campbell, J. L. (2000) The Nuclease Activity of
the Yeast DNA2 Protein, which is Related to the RecB-Like Nucleases, is Essential In Vivo. J Biol Chem. 275, 16518-16529.
6. Stewart, J. A., Campbell, J. L., and Bambara, R. A. (2010) Dna2 is a Structure-Specific Nuclease, with Affinity for 5’-Flap Intermediates. Nucleic Acids Res. 38, 920-930.
7. Peng, G., et al. (2012) Human Nuclease/Helicase DNA2 Alleviates Replication Stress by Promoting DNA End Resection. Cancer Res. 72, 2802-2813.
8. Ronchi, D., et al. (2013) Mutations in DNA2 Link Progressive Myopathy to Mitochondrial DNA Instability. Am J Hum Genet. 92, 293-300.
9. Shaheen, R., et al. (2014) Genomics Analysis of Primordial Dwarfism Reveals Novel Disease Genes. Genome Res. 24, 291-299.
10. Levikova, M., Klaue, D., Seidel, R., and Cejka, P. (2013) Nuclease Activity
of Saccharomyces cerevisiae Dna2 Inhibits its Potent DNA Helicase Activity. Proc Natl Ac Sci USA. 110, E1992-E2001.
96 11. Pheeney, C. G. and Barton, J. K. (2012) DNA Electrochemistry with
Tethered Methylene Blue. Langmuir. 28, 7063-7070.
12. Pheeney, C. G. and Barton, J. K. (2013) Intraduplex DNA-Mediated Electrochemistry of Covalently Tethered Redox-Active Reporters. J Am Chem Soc. 135, 14944-14947.
13. Pheeney, C. G., Arnold, A. R., Grodick, M. A., and Barton, J. K. (2013)
Multiplexed Electrochemistry of DNA-Bound Metalloproteins. J Am Chem Soc. 135, 11869-11878.
14. Balakrishnan, L., Polaczek, P., Pokharel, S., Campbell, J. L., and Bambara,
R. A. (2010) Dna2 Exhibits a Unique Strand End-Dependent Helicase Function. J Biol Chem. 285, 38661-38868.
15. Boon, E. M., Barton, J. K., Bhaghat, V., Nerissian, M., Wang, W., and Hill,
M. G. (2003) Reduction of Ferricyanide by Methylene Blue at a DNA-Modified Rotating-Disk Electrode. Langmuir. 19, 9255-9259.
16. Bard, A. J. and Faulkner, L. R. Electrochemical Methods – Fundamental and Application, 2nd ed.; Joh Wiley & Sons: New York, 2000; pp.580-631.
17. Muren, N. B. and Barton, J. K. (2013) Electrochemical Assay for the Signal-On Detection of Human DNA Methyltransferase Activity. J Am Chem Soc. 135, 16632-16640.
97 C h a p t e r 5
ELECTROCHEMICAL AND STRUCTURAL CHARACTERIZATION OF AZOTOBACTER VINELANDII FLAVODOXIN II
Abstract In Azotobacter vinelandii, flavodoxin II is a biological reductant of the
nitrogenase Fe-protein. It has been proposed that this flavodoxin can donate two
low potential electrons to reduce the iron-sulfur cluster of the Fe-protein to its all
ferrous state. To better understand this process, the redox properties of flavodoxin
II were monitored on surfactant-modified basal plane graphite electrodes. These
studies revealed that flavodoxin II has two distinct redox couples as measured by
cyclic voltammetry at about -483 ± 1 mV v. NHE (at pH 7.5) and at about -187 ± 9
mV v. NHE (at pH 7.5). The first, low potential redox couple was assigned as the
hydroquinone/semiquinone couple while the second, high potential redox couple
was assigned as the semiquinone/quinone couple. However, this high potential
redox process was most likely due to a combination of electron transfer to the
flavodoxin and to free FMN. This study constitutes the first example of a direct
electrochemical method that could measure the midpoint potential of the
semiquinone/quinone redox couple. The kinetics of the flavodoxin II redox
processes were diffusion-limited, suggesting that the protein could diffuse in the
films with an approximate rate of 6.4 x 10⁻⁸ ± 5.1 x 10⁻⁸ cm2/s. Unexpectedly, the
pH dependence of the midpoint potential of the hydroquinone/semiquinone couple
was best fit as a proton-coupled two electron process with pKa of about 6.1,
suggesting that flavodoxin II may be capable of the concerted transfer of two low
potential electrons. X-ray crystallography was used to characterize the structure of
the flavodoxin in the oxidized quinone and two-electron reduced hydroquinone
98 oxidation states observed in the electrochemical experiments. These studies
revealed no major structural rearrangements upon reduction of the cofactor except
for an amide flip at Gly58 that facilitated hydrogen binding between the carbonyl of
the amide backbone of this residue and N5 of FMN. The structure of flavodoxin II
was used to build a model for how this protein might interact with and reduce the
Fe-protein in a biological context.
Introduction The formation of bioavailable ammonia from the reduction of atmospheric
dinitrogen is an important reaction in the nitrogen cycle. Nitrogenase is the enzyme
that catalyzes this process using energy derived from ATP hydrolysis to form two
molecules of ammonia and one molecule of H2 from N2. This enzyme consists of a
complex of two proteins: the Fe-protein and the MoFe-protein. The MoFe-protein is
the site of dinitrogen reduction while the Fe-protein serves as the reductant of the
MoFe-protein (1,2). Nitrogenase substrates can only bind to the FeMo-cofactor
when it has been reduced. Thus, prior to substrate reduction, multiple rounds of
electron transfer from the 4Fe-4S cluster of the Fe-protein to the P-cluster, and
from the P-cluster to the FeMo-cofactor must occur in a mechanism that is gated
by ATP hydrolysis. Although it is clear that reduction of dinitrogen to ammonia
requires that eight electrons be delivered from the reduced iron-sulfur cluster of the
Fe-protein to the MoFe-protein, the biological source of these electrons remains
less characterized. It has been proposed that two of the biological reductants of the
Fe-protein are a ferredoxin (3-5) and a flavodoxin, the latter is encoded in the nif
operon (6-9). In Azotobacter vinelandii, these reductants are ferredoxin I and
flavodoxin II (8).
Although there is redundancy in biological reductants of nitrogenase in
Azotobacter vinelandii, four observations suggest that flavodoxin II is one of the
predominant reductant of the Fe-protein in a variety of organisms. First, it was
observed that deletion of K. pneumoniae nifF resulted in a complete loss of
nitrogen reduction in that organism, suggesting that in some bacteria, flavodoxin II
99 is solely responsible for donating electrons to nitrogenase (11). Second, the
expression level of flavodoxin II in the cell is upregulated under nitrogen fixing
conditions (12). Third, the Fe-protein and nitrogenase-associated flavodoxin from
different organisms form a stable complex in vitro (5,7,10). Stopped-flow
spectrophotometry experiments suggested that R. capsulatus and K. pneumoniae
flavodoxin forms a complex with the K. pneumoniae Fe-protein with a KD of 0.44
μM and >730 μM, respectively. Notably, when the K. pneumoniae Fe-protein
bound nucleotides, such as MgATP, the KD of this complex dropped to 13 μM. For
both of these systems, electron transfer from the reduced flavodoxin to the Fe-
protein was rapid with electron transfer rates of greater than 106 M-1s-1. Finally, in
vitro nitrogenase activity assays using flavodoxin II as a source of electrons have
also suggested that this flavodoxin can act as an electron donor to nitrogenase
since there was an increase in nitrogenase activity when this protein was included
in in vitro nitrogenase activity assays (7,13). Furthermore, energy utilization by the
Fe-protein was enhanced when flavodoxin II was employed as a reductant in in
vitro assays rather than the chemical reductant sodium dithionite. Specifically, with
flavodoxin as the biological reductant the ATP/2e- ratio decreased from four to two
suggesting that flavodoxin II could reduce the Fe-protein to its unique all ferrous
state, allowing for two electrons to be transferred per ATP hydrolyzed by the Fe-
protein (13). The reduction of the Azotobacter vinelandii Fe-protein to the all
ferrous form by flavodoxin II has been shown with a variety of spectroscopic
experiments (14).
Despite the unique chemistry that has been proposed for Azotobacter
vinelandii flavodoxin II in which it is capable of reducing the Fe-protein to an all
ferrous state, this protein is a prototypical long chain flavodoxin, which non-
covalently binds a flavin mononucleotide (FMN) cofactor (15,17). This cofactor can
exist in three different oxidation states: oxidized quinone, one-electron reduced
semiquinone, and two-electron reduced hydroquinone. In solution, free FMN
cycles between the oxidized quinone and two-electron reduced hydroquinone due
to rapid disproportionation of the semiquinone state in aqueous solutions (16).

100 When bound by flavodoxin, the semiquinone form of FMN is stabilized, which
allows for the sequential transfer of one electron at low redox potentials. Thus, in
general, flavodoxin bound FMN cycles between the semiquinone and the
hydroquinone state in most low-potential redox reactions (15).
Although the general α/β fold of flavodoxin II is similar to other flavodoxins,
there are a couple of distinguishing structural features cited that could explain the
low midpoint potential observed for the semiquinone/hydroquinone couple
between -458 mV v. NHE and -515 mV v. NHE, as well as the relatively high
midpoint potential observed for the quinone/semiquinone couple (12,18,25-28).
These observations were initially made through studies of a mutant form
(Cys69Ala) of Azotobacter flavodoxin II purified from E. coli (19). Unlike most
known long-chain flavodoxins, there is no hydrogen bonding to N5 of FMN when
the protein is in its oxidized form. This would increase the midpoint potential of the
quinone/semiquinone couple through destabilization of the quinone form of FMN.
Additionally, negatively charged, acidic residues near N1 of FMN could decrease
the hydroquinone/semiquinone redox couple by destabilizing the fully reduced
hydroquinone FMN. A polar leucine on the re face of FMN rather than the
tryptophan present in other long-chain flavodoxins could further lower the midpoint
potential of the semiquinone/hydroquinone couple. Finally, the presence of glycine
at position 58 rather than an amino acid with a bulkier side chain is thought to
stabilize the semiquinone oxidation state by decreasing the energy of an amide
bond flip at that position. This rearrangement allows for hydrogen bonding to N5 of
FMN, which becomes protonated upon either one or two electron reduction of the
cofactor. This would lead to an overall decrease in the midpoint potential of the
semiquinone/hydroquinone couple of flavodoxin II relative to other long-chain
flavodoxins.
In this paper, a series of X-ray crystallography and electrochemistry
experiments were performed to better characterize the interaction of flavodoxin II
and the Fe-protein of nitrogenase with a focus on determining the molecular
interactions that facilitate reduction of the 4Fe-4S cluster of the Fe-protein to its all

101 ferrous state. First, a new method was developed to determine the redox
properties of Azotobacter vinelandii flavodoxin II on surfactant-modified basal
plane graphite electrodes. This method was designed to mimic the environment of
FMN upon binding to the Fe-protein. These studies were complemented with
studies to determine the structural changes occurring for the redox processes
observed using electrochemical methods. Finally, a structural model was built to
describe how flavodoxin II and the Fe-protein could interact to facilitate reduction
of the Fe-protein.
Methods Azotobacter Cell Growth and Flavodoxin II Purification. Cell growths and protein
purifications were carried out as previously described for isolation of Azotobacter
vinelandii nitrogenase (20,21). Cell lysis was performed under argon atmosphere
with an Avestin Emulsiflex C5 homogenizer. The cell lysate was cleared by
centrifugation, and was loaded to a 70mL HiTrapQ anion exchange column (GE
Healthcare). The nitrogenase component proteins were eluted from the ion
exchange column with a gradient from 150 mM NaCl to 1M NaCl over thirty
column volumes. The flavodoxin eluted from the column at conductivity values
between 39 to 40 mS/cm. The protein was further purified on a size exclusion
column (Superdex200, 26/60, GE Healthcare) to separate flavodoxin II from any
contaminating Fe-protein. The protein was quantified by Bradford assay using a
BSA standard curve.
Strain Construction for Overexpression of Flavodoxin II in E. coli. The flavodoxin II
overexpression plasmid was prepared by Genescript USA, Inc. In this plasmid, the
Azotobacter vinelandii nifF gene was cloned into the pET21b(+) vector between
the NdeI-BamHI restriction enzyme cut sites. A stop codon was included at the C-
terminus of the gene so that the protein was expressed without affinity tags. The

102 nifF gene was optimized for E. coli codon usage. The plasmid was transformed
into E. coli BL21 (DE3) cells for overexpression of flavodoxin II.
E. coli Cell Growth and Purification of Flavodoxin II. The protocol for purification of
Azotobacter vinelandii flavodoxin II was adapted from previously published
protocols (19,22). The following buffers were prepared, were adjusted to the
correct pH at room temperature, and were filtered with a glass fiber filter: anion
exchange buffer A (50 mM tris-HCl, pH 7.5, 150 mM NaCl, 2 mM DTT), anion
exchange buffer B (50 mM tris-HCl, pH 7.5, 1 M NaCl, 2 mM DTT), and size
exclusion buffer (50 mM tris-HCl, pH 7.5, 200 mM NaCl). Dithiothreitol (DTT) was
added to all buffers the day of each protein purification. Dioxygen was removed
from the size exclusion column buffer prior to use in the purification by iterative
cycles of vacuum followed by argon filling.
An overnight starter culture of the flavodoxin II overexpression strain
supplemented with 100 μg/mL ampicillin was incubated at room temperature with
shaking overnight. The starter culture was diluted 1:100 into 1 L of Luria Broth
medium containing 50 μg/mL ampicillin. The cultures were grown to late
exponential phase (OD600 ~ 0.6-0.8) at 37 °C with shaking. Overexpression of
flavodoxin II was induced by addition of IPTG to a final concentration of 0.5 mM in
each culture. The cultures were incubated for 16 hours at 37 °C with shaking. The
cells were pelleted via centrifugation at 6238 x g for ten minutes. The cell pellets
were stored at -80 °C until purification.
All lysis steps were carried out on ice at room temperature. The BL21 (DE3)
cell pellets were thawed on ice. The cell pellets were re-suspended in anion
exchange buffer A with a homogenizer. The lysis buffer also contained complete
protease inhibitor tablets (Roche) at a concentration of one tablet per 50 mL of
buffer. The cells were lysed with an Avestin Emulsiflex C5 homogenizer. The cell
debris was pelleted by centrifugation in a floor centrifuge at 13,000 x g at 4 °C for
35 minutes.

103 The cleared cell lysate was loaded to two 5 mL HiTrapQ HP anion
exchange columns connected in tandem using an Akta FPLC (GE Healthcare).
The protein was purified by anion exchange column as described previously
(19,22) Following the anion exchange column, the protein was loaded to a
Superdex200 size exclusion column. The protein that eluted from the column was
collected, and was concentrated in an Amicon filter centrifuge tube (10,000
MWCO) to a final concentration of about 10 μM. This protein was flash frozen in
liquid nitrogen. The protein was stored under liquid nitrogen.
The concentration of protein was estimated based on the absorption of the
sample at 452 nm. The extinction coefficient of the protein at 452 nm is 11,300 M-1
cm-1 (22). The concentration of protein that bound a flavin mononucleotide cofactor
was estimated from the ratio of the absorption of the sample at 274 nm to the
absorption of the sample at 452 nm. The ratio of Abs274/Abs452 was about 7, which
was higher than that cited previously for the purification of the oxidized form of this
protein (22). The protein concentration was also quantified by Bradford assay with
a BSA standard curve. The total protein yield was about 0.2 mg of protein per
gram of cell paste. The purity of the isolated protein was analyzed on a denaturing
polyacrylamide gel.
Preparation of Flavodoxin II for Electrochemistry Experiments. Prior to
electrochemistry experiments, sodium dithionite was removed from all protein
samples using a PD10 column (GE Healthcare). This procedure was performed in
a McCoy anaerobic chamber with a 95 % / 5 % Ar / H2 atmosphere with less than
0 ppm dioxygen. The column was first equilibrated in five column volumes of
electrochemistry buffer (50 mM potassium phosphate, pH 7.5, 150 mM NaCl) with
10 mM sodium dithionite. Then, the column was equilibrated in five column
volumes of electrochemistry buffer. All buffers were filtered with a 0.2 micron filter,
and all oxygen was removed from the buffer by iterative cycles of vacuum followed
by filling with argon. The protein was exchanged into electrochemistry buffer using
the PD10 column. UV-visible absorption spectroscopy was used to quantify protein

104 concentration, and to determine the extent of protein oxidation during the
course of sample preparation. Following this procedure, the protein was flash
frozen in liquid nitrogen, and was transported to Occidental College under liquid
nitrogen for experiments.
Preparation of DDAB Films on Basal Plane Graphite Electrodes. The basal plane
graphite electrodes were cut into cylinders with an area of 0.2 cm2. Prior to
experiments, the basal plane graphite electrodes were polished with 0.3 micron
and 0.05 micron alumina resin. The electrodes were cleaned by sonication for 10
minutes, then the electrodes were dried with a heat gun. 5 μL of 10 mM DDAB in
deionized water was deposited to the electrode. The 10 mM DDAB solution was
sonicated for 45 minutes prior to being deposited to the electrode. The films dried
slowly overnight on the electrode in a closed environment.
Electrochemistry with DDAB-Modified Basal Plane Graphite Electrodes. All
experiments were performed in a glovebox that had a nitrogen atmosphere.
Dioxygen was removed from buffers used in electrochemistry experiments by
iterative cycles of vacuum followed by filling with argon. The protein solution was
put in the central compartment of a two-compartment electrochemical cell. The
DDAB-modified basal plane graphite electrode was placed in the protein solution
along with the platinum auxiliary electrode. The solid state Ag/AgCl reference
electrode (Warner Instruments) was connected to the cell with the working
electrode via a luggin capillary.
Alternatively, the basal plane graphite electrode was soaked in a 200 μM
flavodoxin II solution for twenty minutes. Then, the electrode was transferred to
phosphate buffer (10 mM potassium phosphate, pH 7) along with a platinum
auxiliary electrode. All measurements were made with a Ch instruments
potentiostat. All data was analyzed with Ch instruments software.

105 pH Titration. The electrochemical cell was assembled, and the electrochemical
measurements were acquired as described above. The DDAB-modified basal
plane graphite electrode was soaked in a 200 μM flavodoxin II solution for twenty
minutes. The electrode was assayed in the following buffers: 10 mM potassium
phosphate (pH 7.9), 10 mM potassium phosphate (pH 7.6), 10 mM potassium
phosphate (pH 7), 10 mM potassium phosphate (pH 6.6), 10 mM potassium
phosphate (pH 6), 10 mM sodium phosphate (pH 5.6), 10 mM sodium phosphate
(pH 5.4), 10 mM sodium acetate (pH 4.3), and 10 mM sodium acetate (pH 3.9).
The electrodes were incubated for ten minutes in the buffer solution prior to square
wave voltammogram acquisition. The pH of all buffers was confirmed following the
experiment.
Crystallization and Data Collection. Flavodoxin II was crystallized using the sitting
drop vapor diffusion method in an anaerobic chamber containing a 90 % Ar / 10 %
H2 atmosphere. The reservoir solution contained 23-28 % PEG 3350 (v/v), 0.15-
0.3 M MgCl2·6H2O, and 100 mM tris-HCl, pH 8.5. Crystals were obtained between
3-6 months after setting up the crystallization experiment, and were bright yellow in
color indicating that the flavodoxin was in the oxidized quinone state. The
flavodoxin crystals were reduced by addition of 0.5 μL of a 50 mM sodium
dithionite solution to the 2 μL drop that contained the crystals. The chamber that
contained the crystals was sealed, and was incubated at room temperature for 1.5
hours. The oxidized flavodoxin crystals were cryo-protected by transferring the
crystals into a 5 μL drop of 7 % 2-methyl-2,4-pentanediol in the reservoir solution
(v/v). The reduced flavodoxin crystals were cryo-protected by transferring the
crystals into a 5 μL drop of 7 % 2-methyl-2,4-pentanediol in the reservoir solution
(v/v) that contained 5 mM sodium dithionite. Diffraction data were collected at
12,400 eV at the Stanford Synchrotron Radiation Lightsource (SSRL) beamline 12-
2 with a Dectris Pilatus 6M detector.
106 Structure Solution and Refinement. The data were indexed, integrated, and
scaled using XDS and Scala (23,24). Structural refinement and rebuilding was
done in REFMAC5 and Coot (24). All protein structures were rendered in PyMol.
Results Electrochemistry on DDAB-Modified Basal Plane Graphite Electrodes. The redox
properties of Azotobacter vinelandii flavodoxin II have been studied using both a
direct electrochemical method and by EPR-monitored redox titrations (Table A3.1) (12,18,25-28). With these methods, it was observed that the measured potentials
for the semiquinone/hydroquinone couple (E1) are the lowest observed for any
long chain flavodoxin, and range from -458 mV v. NHE to -524 mV v. NHE at pH 8,
depending on experiment type and purification method. The measured potential of
the quinone/semiquinone couple is -183 mV v. NHE, which has never been
observed using direct electrochemical methods. To better characterize the redox
behavior of Azotobacter vinelandii flavodoxin II, a new method for monitoring the
redox properties of this protein was developed on surfactant-modified basal plane
graphite electrodes.
Surfactant-modified electrodes have been extensively used to study the
redox chemistry of many proteins, like myoglobin and cytochrome P450 (29-31). In
this technique, synthetic or natural surfactants can be used to form ordered films of
stacked bilayers on an electrode, which mimic biological membranes found in
nature. Although these films were originally developed to study the redox behavior
of membrane proteins in a biologically relevant environment, the observation that
direct electron transfer for myoglobin was observed on electrodes modified with
these films, suggested that they could be used as a general tool for monitoring the
redox chemistry of proteins. Since that time, a number of studies have been
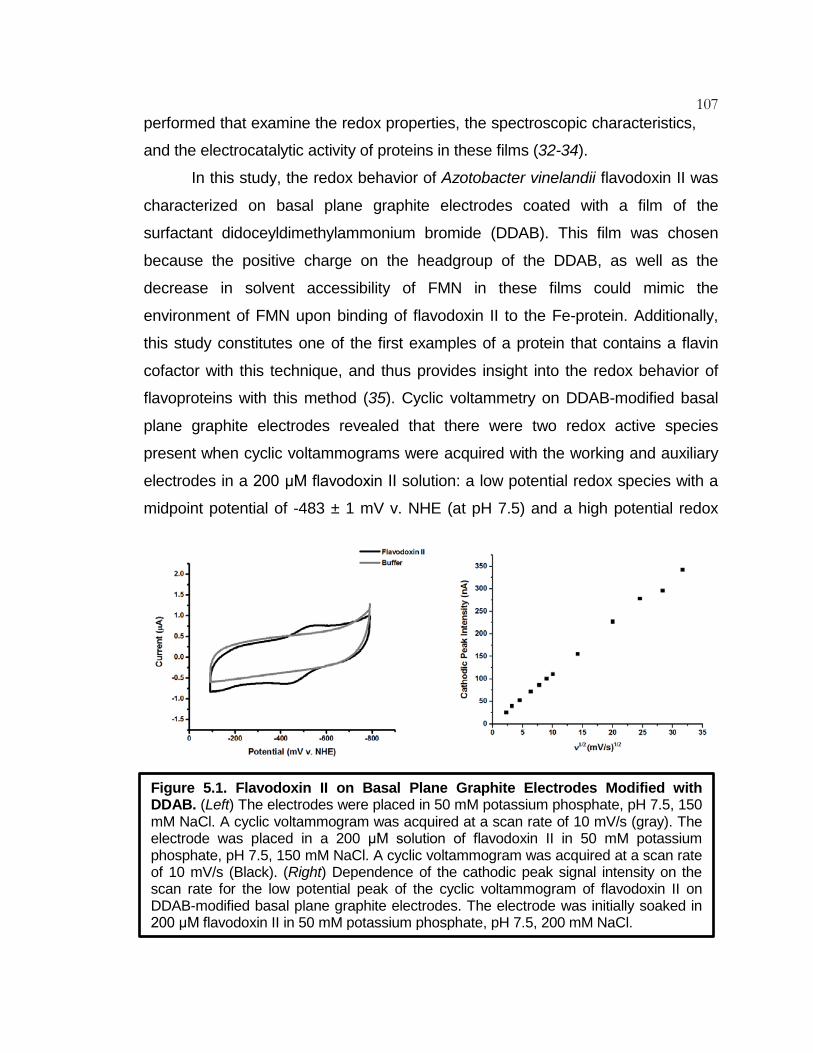
107 performed that examine the redox properties, the spectroscopic characteristics,
and the electrocatalytic activity of proteins in these films (32-34).
In this study, the redox behavior of Azotobacter vinelandii flavodoxin II was
characterized on basal plane graphite electrodes coated with a film of the
surfactant didoceyldimethylammonium bromide (DDAB). This film was chosen
because the positive charge on the headgroup of the DDAB, as well as the
decrease in solvent accessibility of FMN in these films could mimic the
environment of FMN upon binding of flavodoxin II to the Fe-protein. Additionally,
this study constitutes one of the first examples of a protein that contains a flavin
cofactor with this technique, and thus provides insight into the redox behavior of
flavoproteins with this method (35). Cyclic voltammetry on DDAB-modified basal
plane graphite electrodes revealed that there were two redox active species
present when cyclic voltammograms were acquired with the working and auxiliary
electrodes in a 200 μM flavodoxin II solution: a low potential redox species with a
midpoint potential of -483 ± 1 mV v. NHE (at pH 7.5) and a high potential redox
Figure 5.1. Flavodoxin II on Basal Plane Graphite Electrodes Modified with DDAB. (Left) The electrodes were placed in 50 mM potassium phosphate, pH 7.5, 150 mM NaCl. A cyclic voltammogram was acquired at a scan rate of 10 mV/s (gray). The electrode was placed in a 200 μM solution of flavodoxin II in 50 mM potassium phosphate, pH 7.5, 150 mM NaCl. A cyclic voltammogram was acquired at a scan rate of 10 mV/s (Black). (Right) Dependence of the cathodic peak signal intensity on the scan rate for the low potential peak of the cyclic voltammogram of flavodoxin II on DDAB-modified basal plane graphite electrodes. The electrode was initially soaked in 200 μM flavodoxin II in 50 mM potassium phosphate, pH 7.5, 200 mM NaCl.
108 species with a midpoint potential of -187 ± 9 mV v. NHE (at pH 7.5) (Figure 1). The low potential species underwent a reversible redox process whereas the high
potential redox species appeared to be quasi-reversible with oxidation occurring
more readily than reduction. These redox processes were observed immediately
upon submersion of the DDAB-modified electrode in protein solution. There was
no signal associated with either redox process on unmodified basal plane graphite
electrodes or on DDAB-modified electrodes placed in buffer (Figures 1 and A3.1). Recombinant flavodoxin II purified from E. coli rather than from the native
organism had the same redox-active species observed by cyclic voltammetry,
suggesting that the redox activity of flavodoxin II was being observed rather than
that of a contaminating protein (Figure A3.2). The low potential species was assigned to the hydroquinone/semiquinone
redox couple based on similarity to previously measured midpoint potentials.
Identification of the high potential redox-active species was challenging since the
magnitude and reversibility of this peak was more variable. The amount of this
species present in solution was inversely proportional to the amount of the low-
potential redox active species as monitored by cyclic voltammetry. This
observation was especially evident during the pH titrations when there was an
increase in the high potential redox active species at low pH where the protein is
less stable (28). Notably, the increase in this high potential peak was irreversible
when the electrode was re-submerged in a neutral buffer. This observation in
combination with the cyclic voltammogram of free FMN on DDAB-modified basal
plane graphite electrodes provided for the initial assignment of the high potential
peak as the two-electron hydroquinone/quinone couple of FMN in solution (Figure A3.3). However, given the similarity of the midpoint potential of the
hydroquinone/quinone couple of FMN and the semiquinone/quinone couple of
flavodoxin II, as well as results from the pH titration described later in this paper it
is possible that both redox-active species are present in solution. Notably, the
rapid disproportionation and slow electrode kinetics of the one-electron reduced
109 flavodoxin II semiquinone could explain why the high potential and low potential
redox peaks are not present at a 1:1 ratio on the cyclic voltammogram (36).
In addition to analyzing the redox activity of flavodoxin II directly in a
solution of this protein, the DDAB-modified basal plane graphite electrodes could
be loaded with the protein, and the electrode moved to a phosphate buffer
solution. The protein remained stable in the surfactant film during the course of the
experiment on the order of hours. However, slow diffusion of the protein out of the
films was responsible for a decrease in signal intensity over time at the electrode
surface. This method was used for all subsequent scan rate and pH experiments.
Under these conditions, the midpoint potentials of the two redox active species
were shifted to -454 ± 7 mV v. NHE for the low potential redox species and -164 ±
12 for the high potential redox species. This result is consistent with previous
observations that differences in ion concentration between the positively-charged
surfactant film and the solution result in a shift in the midpoint potential of
flavodoxin II (37,38).
The kinetics of the redox process were studied to determine if flavodoxin II
diffused in the DDAB films on the time scale of voltammogram acquisition. Only
the robust, low potential species was monitored with this method. The signal
intensity of the low potential redox process observed in these films was
proportional to the square root of the scan rate (Figure 1 and S6). Thus, the redox
process occurring at the electrode was diffusion-limited, suggesting that flavodoxin
II was diffusing in the surfactant film. This result was consistent with the kinetics
observed for other proteins, like myoglobin and cytochrome c (39,40). However,
there are also examples of proteins that are immobile in surfactant films, like
hemoglobin and cytochrome P450 (41,42). The Randles-Sevcik equation could be
used to estimate the diffusion constant of flavodoxin II in surfactant films as 6.4 x
10-8 ± 5.1 x 10⁻⁸ cm2/s (43). This estimate assumes that the protein concentration is
about the same in solution as in the surfactant film, and that it is a one electron
redox process. This diffusion rate is less than 1.3 x 10⁻⁶ cm2/s, which would be the

110
diffusion constant of a perfectly spherical protein the size of flavodoxin II
undergoing Brownian motion in solution.
The pH dependence of the midpoint potential of flavodoxin II was also
assessed on DDAB-modified basal plane graphite electrodes to further
characterize this system. The pH range evaluated in these studies was from pH
3.9 to 7.8. Consistent with previous studies using carbon electrodes modified with
neomycin, the pH dependence of the low potential redox species was largely
invariant up to pH 6 at which point there was a linear increase in potential with
decreasing pH that was best modeled as a one proton-coupled two electron
transfer process. When fit with the Nernst equation, this data was consistent with a
single one proton coupled two electron transfer reaction, with the pKa of this proton
estimated to be 6.1 (Figure 2). This was in contrast to a previous study, which
found two pKa values for the reduced (hydroquinone) flavodoxin (pKRed,1 = 5.39 ±
0.08 and pKRed,2 = 7.84 ± 0.14) and one pKa value for the oxidized flavodoxin
(semiquinone) of 7.84 ± 0.14. Analysis of the low potential peak suggested that
Figure 5.2. pH Titration of Flavodoxin II. (Top) Dependence of the midpoint potential of the low potential redox species on the solution pH. Each data point is the average of three separate experiments. Error is reported as standard error. The gray line is a simulation of the observed redox process using the Nernst equation with n=2. (Bottom) Dependence of the midpoint potential of the high potential redox species on the solution pH. Each data point is the average of three separate experiments. Error is reported as standard error.

111 this peak varied linearly with the pH at all pH values tested with a slope of 45
mV/pH unit (Figure 2). FMN has a pKa of about 6.4-6.7 for the protonation of
reduced molecules (44). Thus, the observed pH titration of the low potential redox
process is not consistent with the behavior of FMN, and instead is consistent with
the observed redox process being the quinone/semiquinone couple (45). The pH
titrations indicate that the potential of both the hydroquinone/semiquinone and the
semiquinone/quinone couples can be measured with the electrochemical method
developed in this paper. However, these studies in combination with previous
results suggest that at low pH less than 6, a proton coupled two electron transfer
reaction could occur at the flavodoxin, suggesting that flavodoxin II may be
capable of donating two low potential electrons at the electrode.
X-Ray Crystallography. The crystal structure of A. vinelandii flavodoxin II was
Figure 5.3. Structure of Oxidized Flavodoxin II. (Left) Ribbon structure of oxidized flavodoxin II. The FMN cofactor is shown in orange. The eight amino acid stretch proposed to be involved in mediating the flavodoxin Fe-protein interaction is shown in gray. The position of Cys69 is shown in orange. (RIght) Electrostatic surface potential diagram of flavodoxin II showing the two charged surfaces proposed to interact with the Fe-protein.
112 solved with the protein in different oxidation states. The structure of the protein
with a FMN cofactor in the quinone oxidation state was solved at 1.17 Å resolution.
Molecular replacement was performed with a model of the Cys69Ala mutant of
Azotobacter vinelandii flavodoxin II (19). The two-electron reduced protein, with an
FMN cofactor in the hydroquinone form, was solved using molecular replacement
with the model of oxidized flavodoxin II solved in this paper. The refinement
statistics for the two models are given in Table A3.2.
The overall three-dimensional fold of flavodoxin II in both oxidation states
was consistent with the prototypical α/β-fold of long chain flavodoxins. The N-
terminus of the protein is the location of the first β-strand of four parallel β-strands
that form the core of the protein. This β-sheet core is highly conserved in the
flavodoxin protein family (46). The structure of the wild type flavodoxin differs from
the structure of the Cys69Ala mutant in that the β2 and β5a strands from the
mutant structure are disordered in the wildtype structure of flavodoxin II. Like the
structure of the Cys69Ala mutant, the wildtype structure also consists of five α-
helices that pack against the β-sheet core. There are multiple disordered loop
regions within the structure, with the most important being the 50s loop and the
100s loop that connect the structured areas of the protein, and are involved in
hydrogen bonding interactions with FMN. There are two other structural features
that distinguish flavodoxin II from other flavodoxins. First, this protein has an
insertion of 22-amino acids that precedes the fourth β-strand, which is
characteristic of long chain flavodoxins, and provides the basis to classify this
protein in that family (47). Second, this protein has an insertion of eight amino acid
residues (amino acids 64-71) near the FMN cofactor preceding the third alpha
helix of this protein that is generally found in nitrogenase-associated flavodoxins.
These amino acids have been proposed to be involved in complex formation with
the Fe-protein of nitrogenase.
The FMN molecule is bound non-covalently by flavodoxin II in a flat
conformation that places the dimethyl benzene edge of the molecule at the edge of
the protein. The other half of FMN is buried in the interior of the protein where an

113 extensive network of hydrogen bonds to the pyrimidine and phosphate portions
of FMN bind this cofactor to the protein. Specifically, the hydroxyl groups in the
loop located from Ser9 to Thr14 are within hydrogen bonding distance of the
phosphate at the base of the ribosyl chain. Additionally, amino acid residues 56-60
in the 50s loop of flavodoxin II have been shown to form important hydrogen
bonding interactions with the alloaxazine ring of FMN. Although the identity of the
specific amino acid residues in this region vary, the interaction of these residues
with FMN not only hold the cofactor in place, but also help set the midpoint
potential of the redox couples of this cofactor. Furthermore, residues 58-59 in this
region are involved in a peptide flip during reduction of the cofactor, and will be the
topic of later discussion. Interactions between the 100s loop of flavodoxin II and
FMN between amino acid residues 98-107 also facilitate binding of FMN to the
apoprotein. These interactions are similar to those previously observed in the
structure of the Cys69Ala mutant of flavodoxin II (19).
The overall structures of both the wild type and Cys69Ala mutants of
flavodoxin II are similar. The major difference between the crystal structure of the
Cys69Ala flavodoxin II mutant and wildtype flavodoxin II is the identity of the side
chain position at residue 69 (Figure 3). In the wildtype flavodoxin II, the sulfur of
Figure 5.4. The FMN Binding Site of Flavodoxin II. (Left) The FMN binding site in oxidized flavodoxin II. The carbonyl of Gly58 is highlighted in stick form, and is pointing away from N5 of FMN. (Right) The FMN binding site in reduced flavodoxin II. The carbonyl of Gly58 is highlighted in stick form, and is within hydrogen bonding distance of N5 of FMN. FMN is shown in orange.

114 this amino acid residue is pointing toward the interior of the protein in a solvent-
exposed region of the protein near the FMN cofactor. This cysteine residue is
within the loop of flavodoxin II at which interaction of the flavodoxin and the Fe-
protein are proposed, and thus the identity of the position of this residue will be
important in determining the interactions that facilitate formation of this protein
complex.
The structural changes in flavodoxin II upon reduction of the FMN cofactor
with sodium dithionite were also studied by X-ray crystallography (Figure 4). The
reduction of the protein to the hydroquinone state was determined based on
bleaching of the yellow color in the crystal. Previously, it was observed that
structural changes in flavodoxins occur at positions 58-59 upon reduction (49-51).
In general, the residue at position 58, which in the case of flavodoxin II is glycine,
is in the “O-down” conformation with the carbonyl of the amide backbone pointing
away from FMN (49). Since the oxidized form does not contain a proton at the N5
of the isoalloxazine ring, H-bonding from other amino acid residues in the protein
stabilize this form of the cofactor. Upon reduction to the hydroquinone state, the
amide bond flips such that the carbonyl is placed in an “O-up” conformation that is
able to hydrogen bond with the protonated N5 position of FMN. Consistent with the
observations made of other flavodoxins, the structure of Azotobacter vinelandii
flavodoxin II revealed that there were no other major conformational changes the
peptide flip of the Gly58 carbonyl within 3.2 Å of the protonated N5 of FMN. This
conformational change allowed for hydrogen bonding between the protein and
FMN to stabilize the hydroquinone form of the cofactor. This structure provides
insight into the structure of flavodoxin II that can form a complex with the Fe-
protein capable of electron transfer.
Model of the Flavodoxin - Fe-Protein Complex. The ClusPro2.0 algorithm was
used to construct a model of the complex that the Fe-protein and the flavodoxin
form during Fe-protein reduction (52-55). This model suggested that the Fe-protein
and the flavodoxin come together such that the FMN cofactor and the Fe-

115
S cluster are positioned within 6-8 Å of one another. The two proteins bind via
electrostatic interactions with two strongly charged regions on the flavodoxin
facilitating this binding mode. Specifically, in the model of complex formation, the
overall negative charge of the flavodoxin surrounding FMN interacts with the
overall positive charge of the amino acids surrounding the iron-sulfur cluster of the
Fe-protein. Notably, the change in electrostatic environment around FMN could
shift the potential of this cofactor from that observed in the electrochemistry
experiments, lowering the midpoint potential of the semiquinone/quinone couple.
This shift in potential could decrease the gap between the two redox couples of
FMN, potentially making transfer of two low potential electrons feasible (56). There
is also a region of the flavodoxin that has a net positive charge, which can interact
Figure 5.5. Model of the Flavodoxin II-Iron Protein Complex. (Top) Ribbon diagram of the model of flavodoxin II (teal) binding to the Fe-protein (gray) bond to MgAMP-PCP. The FMN cofactor and the AMP-PCP molecules are shown in orange. The iron-sulfur cluster is shown in purple. (Bottom) Electrostatic surface potential diagram of the Fe-protein flavodoxin II complex.

116 with a negatively charged region at the base of Av2 during complex formation
(Figure 5.5). The binding mode in this model also brings the eight amino acid insertion
found in nitrogenase-associated flavodoxins to the interface of the two proteins,
facilitating their interaction. Of particular interest in the context of this model is
Asp68, which is positioned near the Fe-protein iron-sulfur cluster; however, the
exact position of the side chain of this residue could not be determined due to
disorder of this side chain. Cys69 and Glu70 although pointing away from the Fe-S
cluster is also located near this cofactor, and upon possible rearrangement of the
flexible loop during binding could be important in the mechanism of Fe-protein
reduction. In addition to these residues, there are a number of other amino acid
residues that could be involved in interactions that facilitate binding of the Fe-
protein and flavodoxin II (Table A3.3). The ClusPro algorithm was also used to build models of the flavodoxin II
interaction with nucleotide-bound forms of the Fe-protein that had originally been
solved in complex with the MoFe-protein. The models built with both the Fe-protein
bound to MgAMP-PCP, an ATP mimic, and the Fe-protein in a mixed nucleotide
form, binding one molecule of MgAMP-PCP and one molecule of MgADP, placed
the iron-sulfur cluster of the Fe-protein within 3-5Å of FMN. Furthermore,
electrostatic interactions in these models suggest that interaction of these forms of
the Fe-protein would bind the flavodoxin with higher affinity than the Fe-protein
with no nucleotide bound. These models provide insight into the mechanism by
which flavodoxin II could reduce the Fe-protein to drive nitrogen reduction in a
biological context.
Conclusion Flavodoxin II is a biological reductant of the Fe-protein of nitrogenase,
which donates electrons to the MoFe-protein during dinitrogen reduction. This
protein can cycle through three different oxidation states; however, it has been

117 proposed that only the hydroquinone/semiquinone couple of the FMN cofactor
has a sufficiently low midpoint potential to reduce the Fe-protein. A new technique
was developed for studying the redox properties of flavodoxin II on surfactant-
modified basal plane graphite electrodes. The results of these experiments
suggested that flavodoxin II is capable of donating two low potential electron to the
iron-sulfur cluster of the Fe-protein. Thus, depending on the true midpoint potential
of the Fe-protein, flavodoxin II could reduce the Fe-protein to its all ferrous state
(57,58). The structure of both the oxidized and reduced forms of flavodoxin II
revealed the structural changes that occur in this protein upon two electron
reduction to the hydroquinone form. As was observed for other long chain
flavodoxins, an amide bond flip occurs at Gly58 that leads to stabilization of the N5
position of FMN via hydrogen bonding in the reduced structure. The structural
studies provided a basis for a model describing complex formation between the
Fe-protein and flavodoxin II, which suggested that these proteins bind such that
the 4Fe-4S cluster in the Fe-protein is positioned within 6-8Å of the FMN of
flavodoxin II in the absence of nucleotide binding. Thus, electron transfer could
occur between these cofactors. Furthermore, this model suggested that residues
68-70 within the flexible eight amino acid insertion of flavodoxin II could be
important in this redox process given their proximity to the iron-sulfur cluster of the
Fe-protein. The electrochemical and structural studies presented in this chapter
provide insight into the mechanism by which flavodoxin II could reduce the Fe-
protein to an all ferrous state in a biological context.

118 References
1. Howard, J. B. and Rees, D. C. (2006) How Many Metals Does it Take to Fix N2? A Mechanistic Overview of Biological Nitrogen Fixation. Proc Natl Acad Sci USA. 103, 17088-17093.
2. Burgess, B. K. and Lowe, D. J. (1996) Mechanism of Molybdenum Nitrogenase. Chem Rev. 96, 2983-3011.
3. Benemann, J. R., Yoch, D. C., Valentine, R. C., and Arnon, D. I. (1971) The Electron Transport System in Nitrogen Fixation by Azotobacter. IV. Requirements for NADPH-Supported Nitrogenase Activity. Biochim Biophys Acta. 226, 206-212.
4. Yoch, D. C. and Arnon, D. I. (1972) Two Biologically Active Ferredoxins from the Aerobic Nitrogen-Fixing Bacterium Azotobacter vinelandii. J Biol Chem. 247, 4514-4520.
5. Hallenbeck, P. C. and Gennaro, G. (1998) Stopped-Flow Kinetic Studies of Low Potential Electron Carriers of the Photosynthetic Bacterium, Rhodobacter capsulatus: Ferredoxin I and NifF. Biochim Biophys Acta. 1365, 435-442.
6. Yates, M. G. (1972) Electron Transport to Nitrogenase in Azotobacter chroococcum: Azotobacter Flavodoxin Hydroquinone as an Electron Donor. FEBS Lett. 27, 63-67.
7. Thorneley, R. N. F. and Deistung, J. (1998) Electron-Transfer Studies Involving Flavodoxin and a Natural Redox Partner, the Iron Protein of Nitrogenase. Biochem J. 253, 587-595.
8. Martin, A. E., Burgess, B. K., Iismaa, S. E., Smartt, C. T., Jacobson, M. R., and Dean, D. R. (1989) Characterization of an Azotobacter vinelandii Strain with Mutations in the Genes Encoding Flavodoxin and Ferredoxin I. J Bacteriol. 171, 3162-3167.
9. Duyvis, M. G., Wassink, H., and Haaker, H. (1998) Nitrogenase of Azotobacter vinelandii: Kinetic Analysis of the Fe Protein Redox Cycle. Biochem. 37, 17345-17354.
10. Peelen, S., Wijmenga, S., Erbel, P. J., Robson, R. L., Eady, R. R., and Vervoort, J. (1996) Possible Role of a Short Extra Loop of the Long-Chain Flavodoxin from Azotobacter chroococcum in Electron Transfer to

119 Nitrogenase: Complete 1H, 15N, and 13C Backbone Assignments and Secondary Solution Structure of the Flavodoxin. J Biomol NMR. 7, 315-330.
11. Shah, V. K., Stacey, G., and Brill, W. J. (1983) Electron Transport to Nitrogenase: Characterization of Pyruvate:Flavodoxin Oxidoreductase, the nifJ Gene Product. J Biol Chem. 258, 12064-12068.
12. Klugkist, J., Voorberg, J., Haaker, H., and Veeger, C. (1986) Characterization of Three Different Flavodoxins from Azotobacter vinelandii. Eur J Biochem. 155, 33-40.
13. Erickson, J. A., Nyborg, A. C., Johnson, J. L., Truscott, S. M., Gunn, A., Nordmeyer, F. R., and Watt, G. D. (1999) Enhanced efficiency of ATP hydrolysis during nitrogenase catalysis utilizing reductants that form the all-ferrous redox state of the Fe protein. Biochem. 38, 14279-14285.
14. Lowery, T. J., Wilson, P. E., Zhang, B., Bunker, J., Harrison, P. G., Nyborg, A. C., Thiriot, D., and Watt, G. D. (2006) Flavodoxin Hydroquinone Reduces Azotobacter vinelandii Fe Protein to the All-Ferrous Redox State with a S=0 Spin State. Proc Natl Ac Sci USA. 103, 17131-17136.
15. Mayhew, S. G. and Ludwig, M. L. (1975) Flavodoxins and electron-transferring flavoproteins. Academic Press, New York, NY.
16. Anderson, R. F. (1983) Energetics of the One-Electron Reduction Steps of Riboflavin, FMN and FAD to Their Fully Reduced Forms. Biochim Biophys Acta. 722, 158-162.
17. Mayhew, S. G. and Tollin, G. (1992) General properties of flavodoxins, in Chemistry and biochemistry of flavoenzymes (Müller, F., ed.) vol. 3, pp. 389-426, CRC press, Boca Raton, FL.
18. Watt, G. D. (1979) An Electrochemical Method for Measuring Redox Potentials of Low Potential Proteins by Microcoulometry at Controlled Potentials. Anal Biochem. 99, 399-407.
19. Alagaratnam, S., van Pouderoyen, G., Pijning, T., Dijkstra, B. W., Cavazzini, D., Rossi, G. L., van Dongen, W. M. A. M., van Mierlo, C. P. M., Berkel, W. J. H., and Canters, G. W. (2005) A Crystallographic Study of Cys69Ala Flavodoxin II from Azotobacter vinelandii: Structural Determinants of Redox Potential. Protein Sci. 14, 284-2295.

120
20. Spatzal, T., Aksoyoglu, M., Zhang, L., Andrade, S. L. A., Schleicher, E., Weber, S., Rees, D. D., and Einsle, O. (2011) Evidence for Interstitial Carbon in Nitrogenase FeMo Cofactor. Science. 334, 940.
21. Spatzal, T., Perez, K. A., Einsle, O., Howard, J. B., and Rees, D. C. (2014) Ligand Binding to the FeMo-Cofactor: Structure of CO-Bound and Reactivated Nitrogenase. Science. 345, 1620-1623.
22. van Mierlo, C. P. M., van Dongen, W. M. A. M., Vergeldt, F., van Berkel, W. J. H., and Steensma, E. (1998) The Equilibrium Unfolding of Azotobacter vinelandii Apoflavodoxin II Occurs via a Relatively Stable Folding Intermediate. Protein Sci. 7, 2331-2344.
23. Kabsch, W. (2010) XDS. Acta Crystallographica Section D Biological Crystallography. 66, 125-132.
24. Winn, M. D., Ballard, C. C., Cowtan, K. D., Dodson, E. J., Emsley, P., Evans, P. R., Keegan, R. M., Krissinel, E. B., Leslie, A. G., McCoy, A., McNicholas, S. J., Murshudov, G. N., Pannu, N. S., Potterton, E. A., Powell, H. R., Read, R. J., Vagin, A., and Wilson, K. S. (2011) Overview of the CCP4 Suite and Current Developments. Acta Crystallography. D67, 235-242.
25. Taylor, M. F., Boylan, M. H., and Edmondson, D. E. (1990) Azotobacter vinelandii Flavodoxin: Purification and Properties of the Recombinant, Dephospho Form Expressed in Escherichia coli. Biochem. 29, 6911-6918.
26. Yoch, D. C. (1972) The Electron Transport System in Nitrogen Fixation by Azotobacter. IV. Some Oxidation-Reduction Properties of Azotoflavin. Biochem Biophys Res Commun. 49, 335-342.
27. Barman, B. G. and Tollin, G. (1972) Flavine-Protein Interactions in Flavoenzymes. Thermodynamics and Kinetics of Reduction of Azotobacter Flavodoxin. Biochem. 11, 4755-4759.
28. Steensma, E., Heering, H. A., Hagen, W. R., and Van Mierlo, C. P. M. (1996) Redox Properties of Wild-type, Cys69Ala, and Cys69Ser Azotobacter vinelandii Flavodoxin II as Measured by Cyclic Voltammetry and EPR Spectroscopy. Eur J Biochem. 235, 167-172.
29. Rusling, J. F. (1998) Enzyme Bioelectrochemistry in Cast Biomembrane-Like Films. Acc Chem Res. 31, 363-369.
121
30. Nassar, A.-E. F., Rusling, J. F., Tominaga, M., Yanagimoto, J., and Nakashima, N. (1996) Electrochemistry of Cast Films of Ferredoxin and Lipid Bilayers on Electrodes. J Electroanal Chem. 416, 183-185.
31. Fleming, B. D., Tian, Y., Bell, S. G., Wong, L.-L., Urlacher, V., and Hill, H. A. O. (2003) Redox Properties of Cytochrome P450BM3 Measured by Direct Methods. Eur J Biochem. 270, 4082-4088.
32. Nassar, A.-E. F., Rusling, J. F., and Kumosinkski, T. F. (1997) Salt and pH Effects on Electrochemistry of Myoglobin in Thick Films of a Bilayer-Forming Surfactant. Biophys Chem. 67, 107-116.
33. Udit, A. K., Hagen, K. D., Goldman, P. J., Star, A., Gillan, J. M., Gray, H. B., and Hill, M. G. (2006) Spectroscopy and Electrochemistry of Cytochrome P450 BM3-Surfactant Film Assemblies. J Am Chem Soc. 128, 10320-10325.
34. Blair, E., Greaves, J., and Farmer, P. J. (2004) High-Temperature Electrocatalysis Using Thermophilic P450 CYP119: Dehalogenation of CCl4 to CH4. J Am Chem Soc. 126, 8632-8633.
35. Fleming, B. D., Tian, Y., Bell, S. G., Wong, L.-L., Urlacher, V., and Hill, H. A. O. (2003) Redox Properties of Cytochrome P450BM3 Measured by Direct Methods. Eur J Biochem. 270, 4082-4088.
36. Heering, H. A. and Hagen, W. R. (1996) Complex Electrochemistry of Flavodoxin at Carbon-Based Electrodes Results from a Combination of Direct Electron Transfer, Flavin-Mediated Electron Transfer and Comproportionation. J Electroanal Chem. 404, 249-260.
37. Redepenning, J. and Anson, F. C. (1987) Permselectivities of Polyelectrolyte Electrode Coatings as Inferred from Measurements with Incorporated Redox Probes or Concentration Cells. J Phys Chem. 91, 4549-4553.
38. Ceres, D. M., Udit, A. K., Hill, H. D., Hill, M. G., and Barton, J. K. (2007) Differential Ionic Permeation of DNA-Modified Electrodes. J Phys Chem. 111, 663-668.
39. Tominaga, M., Yanagimoto, J., Nassar, A.-E. F., Rusling, J. F., and Nakashima, N. (1996) Incorporation and Direct Electron Transfer of
122 Chlorella Ferredoxin in the Bilayer Films of Cationic Lipids on Electrodes. Chem Lett. 7, 523-524.
40. Rusling, J. F. and Nassar, A.-E. F. (1993) Enhanced Electron Transfer for Myoglobin in Surfactant Films on Electrodes. J Am Chem Soc. 115, 11891-11897.
41. Udit, A. K., Hindoyan, N., Hill, M. G., Arnold, F. H., and Gray, H. B. (2005) Protein-Surfactant Film Voltammetry of Wild-Type and Mutant Cytochrome P450 BM3. Inorg Chem. 44, 4109-4111.
42. Lu, Z., Huang, Q., and Rusling, J. F. (1997) Films of Hemoglobin and Didodecyldimethylammonium Bromide with Enhanced Electron Transfer Rates. J Electroanal Chem. 423, 59-66.
43. Bard, A. J. and Faulkner, L. R. Electrochemical Methods – Fundamental and Application, 2nd ed.; Joh Wiley & Sons: New York, 2000; pp.580-631.
44. Draper, R. D. and Ingraham, L. L. (1968) A Potentiometric Study of the Flavin Semiquinone Equilibrium. Arch Biochem Biophys. 125, 802-808.
45. Astuti, Y., Topoglidis, E., Briscoe, P. B., Fantuzzi, A., Gilardi, G., and
Durrant, J. R. (2004) Proton-Coupled Electron Transfer of Flavodoxin Immobilized on Nanostructured Tin Dioxide Electrodes: Thermodynamics versus Kinetics Control of Protein Redox Function. J Am Chem Soc. 126, 8001-8009.
46. Ludwig, M. L. and Luschinsky, C. L. (1992) Structure and Redox Properties of Clostridial Flavodoxin. In Chemistry and biochemistry of flavoenzymes (ed. F. Müller), Vol. 3, p. 427-466. CRC Press, Boca Raton, FL.
47. Hoover, D. M. and Ludwig, m. L. (1997) A Flavodoxin that is Required for Enzyme Activation: The Structure of Oxidized Flavodoxin from Escherichia coli at 1.8 Å Resolution. Protein Sci. 6, 2525-2537.
48. Ludwig, M. L., Pattridge, K. A., Metzger, A. L., Dixon, M. M., Eren, M., Feng, Y., and Swenson, R. P. (1997) Control of Oxidation-Reduction Potentials in Flavodoxin from Clostridium beijerinckii: The Role of Conformation Changes. Biochem. 36, 1259-1280.
49. Hoover, D. M., Drennan, C. L., Metzger, A. L., Osborne, C., Weber, C. H., Pattridge, K. A., and Ludwig, M. L. (1999) Comparison of Wild-type and

123 Mutant Flavodoxins from Anacystis nidulans. Structural Determinants of the Redox Potential. J Mol Biol. 294, 725-743.
50. Watt, W., Tulinsky, A., Swenson, R. P., and Watenpaugh, K. D. (1991) Comparison of the Crystal Structures of a Flavodoxin in Its Three Oxidation States at Cryogenic Temperatures. J Mol Biol. 218, 195-208.
51. Boal, A. K., Cotruvo Jr., J. A., Stubbe, J., and Rosenzweig, A. C. (2010) Structural Basis for Activation of Class Ib Ribonucleotide Reductase. Science. 329, 1526-1530.
52. Kozakov, D., Beglov, D., Bohnuud, T., Mottarella, S. E., Xia, B., Hall, D. R., and Vajda, S. (2013) How Good is Automated Protein Docking? Proteins: Structure, Function, and Bioinformatics. 81, 2159-2166.
53. Kozakov, D., Brenke, R., Comeau, S. R., and Vajda, S. (2006) PIPER: An FFT-Based Protein Docking Program with Pairwise Potentials. Proteins: Structure, Function, and Bioinformatics. 65, 392-406.
54. Comeau, S. R., Gatchell, D. W., Vajda, S., and Camacho, C. J. (2004) ClusPro: An Automated Docking and Discrimination Method for the Prediction of Protein Complexes. Bioinformatics. 20, 45-50.
55. Comeau, S. R., Gatchell, D. W., Vajda, S., and Camacho, C. J. (2004) ClusPro: A Fully Automated Algorithm for Protein-Protein Docking. Nucleic Acids Res. 32, W96-W99.
56. Rivas, L, Soares, C. M., Baptista, A. M., Simaan, J., Di Paolo, R. E., Margida, D. H., and Hildebrandt, P. (2005) Electric-Field-Induced Redox Potential Shifts of Tetraheme Cytochromes c3 Immobilized on Self-Assembled Monolayers: Surface-Enhanced Resonance Raman Spectroscopy and Simulation Studies. Biophys J. 88, 4188-4199.
57. Watt, G. D. and Reddy, K. R. N. (1994) Formation of an All Ferrous Fe4S4 Cluster in the Iron Protein Component of Azotobacter vinelandii Nitrogenase. J Inorg Biochem. 53, 281-294.
58. Guo, M., Sulc, F., Ribbe, M. W., Farmer, P. J., and Burgess, B. K. (2002) Direct Assessment of the Reduction Potential of the [4Fe-4S]1+/0 Couple of the Fe Protein from Azotobacter vinelandii. J Am Chem Soc. 124, 12100-12101.
124 C h a p t e r 6
ELECTROCHEMICAL STUDIES OF THE AZOTOBACTER VINELANDII NITROGENASE IRON PROTEIN
Abstract The Fe-protein is the biological reductant of the MoFe-protein. In this
chapter, two electrochemical methods were developed to study the redox
chemistry occurring at the iron-sulfur cluster of the Fe-protein. These methods
were developed to answer two different questions regarding the nitrogenase
mechanism: 1) to determine the true midpoint potential of the 1+/0 couple of the
4Fe-4S cluster in the Fe-protein, and 2) to determine the midpoint potential of a
mixed-nucleotide form of the Fe-protein.
The first electrochemical method adapted to study the Fe-protein was edge-
plane pyrolytic graphite electrodes. This system was used to determine the
midpoint potential of the 1+/0 couple of the 4Fe-4S cluster. Although the [4Fe-
4S]1+/2+ couple could be studied with this method, the large charging current at low
potentials precluded measurement of the midpoint potential of the [4Fe-4S]0/1+
couple. Additionally, this method was used to study the [4Fe-4S]1+/2+ couple of the
Fe-protein bound to either MgATP or MgADP. However, unlike literature
precedence in which the midpoint potential of the Fe-protein shifted upon
nucleotide binding, nucleotide binding did not lead to a shift in the midpoint
potential of the 4Fe-4S cluster on edge-plane pyrolytic graphite electrodes. Thus,
this method was not used to study the Fe-protein in the mixed nucleotide state.
Single crystal gold electrodes modified with eight different types of self-
assembled monolayers (SAMs) were also used to study the redox chemistry of the
Fe-protein. These studies revealed a single reversible redox active species on the
gold electrodes with slow oxidation kinetics, and a midpoint potential ranging from -
36 to -119 mV v. NHE. The variation in midpoint potential between the different

125 electrodes was attributed to differences in protein binding affinity for the
electrodes. Although reproducible, the high potential of the observed redox
process suggested that it was not relevant to nitrogenase catalysis, and was
instead most likely a degradation product of the iron cofactor in the Fe-protein.
Thus, this method was not used to further study the Fe-protein. The series of
experiments presented in this chapter provide insight into ways to design future
electrochemical studies of the Fe-protein of nitrogenase. Introduction Nitrogenase, the protein that converts inert dinitrogen to bioavailable
ammonia, is composed of two different component proteins, the MoFe-protein and
the Fe-protein (1-3). The MoFe-protein contains two different metal centers,
including the FeMo-cofactor, the site of dinitrogen reduction. The Fe-protein is an
ATPase that serves as the reductase for the MoFe-protein with ATP hydrolysis at
the Fe-protein gating electron transfer to the active site in the MoFe-protein. This
mechanism is currently unknown; however, the discovery of specific structural
states that define how nitrogenase can exist during catalysis has aided in
investigations of this mechanism (4-7). One way to expand on how these
structures could be involved in nitrogen reduction is through the investigation of the
thermodynamic properties of the nitrogenase component proteins in these forms.
The structure and thermodynamic properties of different states of the Fe-
protein and the MoFe-protein have been determined, and are described in the
introduction of this thesis (Table 1.2). Of particular interest for the studies
described in this chapter is the observation that the Fe-protein can exist in three
different oxidation states: 2+, 1+, and 0. A second important observation was that
the Fe-protein can exist in a variety of conformations with different nucleotides
bound, which could provide insight into different intermediates in the nitrogenase
electron transfer mechanism. From these observations arise two questions: (1)

126 what is the contribution of the all ferrous state of the Fe-protein to the biological
mechanism of nitrogenase? (2) What is the role of the recently identified mixed
nucleotide conformation of the Fe-protein?
An answer to the first question would provide insight into the mechanism by
which nitrogenase delivers eight electrons to facilitate nitrogen reduction. In this
process, it is generally accepted that one electron is delivered from the [4Fe-4S]1+
of the Fe-protein to the FeMo-cofactor of the MoFe-protein. This process is
coupled to the hydrolysis of two molecules of ATP at the ATP binding sites of the
Fe-protein. The Thorneley-Lowe model predicts that eight consecutive electron-
transfer cycles that each involves a rate limiting protein-dissociation reaction
provides a mechanism by which nitrogenase is able to transfer eight electrons to
reduce dinitrogen (8). This mechanism relies on the prediction that the Fe-protein
of nitrogenase cycles between the 1+ and 2+ oxidation states to deliver one
electron at a time to the MoFe-protein. This process would consume sixteen ATP
molecules per molecule of nitrogen reduced. However, the observation that the
Fe-protein can reversibly cycle through three different oxidation states rather than
two, suggests that this model may be incorrect (9,10). Specifically, if the Fe-protein
accessed the all ferrous state during catalysis, two electrons could be donated per
ATP hydrolysis cycle. Thus, only eight ATP molecules would be consumed for
each molecule of dinitrogen that was reduced to ammonia during four separate
cycles of protein association and dissociation.
Experimental results have suggested that this mechanism could be
plausible since at relatively low potentials of -470 mV v. NHE, the number of ATP
molecules hydrolyzed by the Fe-protein per two electrons transferred to the MoFe-
protein (ATP/2e- ratio) was significantly less than the ATP/2e- ratio when
nitrogenase activity was monitored at higher solution potentials. Thus, at low
potentials, when the Fe-protein may be reduced to the all ferrous oxidation state,
the enzyme catalyzed reaction was more energy efficient (11). However, despite
these results, the observed midpoint potential for the 1+/0 redox couple of the Fe-
protein has left the involvement of the all-ferrous form of the Fe-protein in the

127
nitrogenase mechanism controversial. Specifically, depending on the method used
to measure this potential, it has been reported as ranging from -460 mV v. NHE to
-790 mV v. NHE (12,13). The former potential would be physiologically relevant
based on the potentials of known biological reductants whereas the potential of the
latter would not be accessible in a biological setting. Thus, the exact midpoint
potential of this redox process must be accurately determined to understand the
physiological role of the all ferrous oxidation state of the Fe-protein.
The second question presented above relates to the thermodynamic
properties of a recently discovered form of the Fe-protein that binds one ADP
molecule, and one ATP hydrolysis mimic, MgAMP-PCP (5). The structure of this
complex suggested that ATP hydrolysis occurs by a stepwise mechanism.
Furthermore, it was observed that the orientation of the peptide bond between
residues Asp129 and Val130, in the switch II region that connects nucleotide
binding to the 4Fe-4S cluster, is different in this structure relative to other
structures of the nitrogenase complex. This structural change suggested that there
may be a shift in the redox potential of the iron-sulfur cluster when the Fe-protein is
in that conformational state. The determination of the midpoint potential for this
state could provide insight into the role of the mixed nucleotide form of the Fe-
protein in the nitrogenase mechanism.
Figure 6.1. Methods for Studying the Redox Properties of Av2. (Left) Schematic depicting the use of SAM-modified single crystal gold electrodes for studying the redox properties of Av2. (Right) Schematic showing the use of edge-plane pyrolytic graphite electrodes to study the redox chemistry at the iron-sulfur cluster of Av2. The iron protein is shown in purple. The 4Fe-4S cluster is a yellow square.

128 To answer the questions presented above, two direct electrochemical
methods were developed to determine the midpoint potential of the 4Fe-4S cluster
in the Azotobacter vinelandii nitrogenase Fe-protein (Av2) (Figure 6.1). The first
method utilized edge-plane pyrolytic graphite electrodes. This method has been
widely applied to study the redox cofactors in enzymes (20,21). These electrodes
provide both a surface for proteins to adsorb to undergo interfacial electron
transfer, as well as a relatively wide potential window over which to study the redox
properties of proteins. These properties of edge plane graphite electrodes would
make it feasible to measure the midpoint potential of the all ferrous form of the
iron-sulfur cluster in Av2, as well as the midpoint potential of the mixed nucleotide
state of Av2.
The second method applied to studying the redox properties of Av2 was
single crystal gold electrodes modified with self-assembled monolayers (SAMs) of
organosulfur compounds. This experimental strategy has provided a versatile tool
for studies of electron transfer to redox active proteins (14). The stability of these
densely packed ω-derivatized alkane-thiol SAMs on gold electrodes have been
well characterized, and the specific chemical properties of these SAMs can be
varied by changing the ω-functional group to encourage adsorption of different
types of proteins. Furthermore, a variety of surface properties can be achieved by
mixing alkane-thiols of different lengths or different ω-functionalization, which
allows for the binding of a variety of proteins. Using this technique, well-defined
voltammetric responses have been observed for a number of redox-active
proteins, including azurin, the CuA domain, and cytochrome c (15-17). Despite the
utility of this method, due to its limited potential window of electrode stability, it
could not be used to study the redox properties of the all ferrous form of Av2.
Thus, this method was only developed to study the nucleotide-bound states of
Av2.
In summary, edge-plane pyrolytic graphite electrodes were used to examine
the midpoint potential of the 0/1+ couple of the iron-sulfur cluster in Av2. Then, a
combination of electrochemical studies with edge-plane pyrolytic graphite
129 electrodes and single crystal gold electrodes were used to study the midpoint
potential of the 1+/2+ couple of the iron-sulfur cluster in Av2 in different nucleotide-
bound forms. These studies provide a foundation to study the mechanism of ATP
hydrolysis-coupled electron transfer from the Fe-protein to the MoFe-protein
through the development of electrochemical methods to study Av2.
Methods
Nitrogenase Expression and Purification. The two nitrogenase component proteins
were purified from Azotobacter vinelandii as described previously (6,18). This
protocol is summarized below. The following buffers were prepared, were adjusted
to the correct pH at room temperature, and were filtered with a glass fiber filter: ion
exchange column wash buffer (50 mM tris-HCl, pH 7.5, 150 mM NaCl, 5mM
sodium dithionite), ion exchange column elution buffer (50 mM tris-HCl, pH 7.5, 1
M NaCl, 5 mM sodium dithionite), size exclusion column buffer (50 mM tris-HCl,
pH 7.5, 200 mM NaCl, 5 mM sodium dithionite), protein electrochemistry buffer (50
mM potassium phosphate, pH 7.5, 150 mM NaCl), and phosphate buffer (10 mM
potassium phosphate, pH 7.5). Dioxygen was removed from all buffers by iterative
cycles of vacuum followed by argon filling. All buffers were stored under argon
pressure following removal of dioxygen. Sodium dithionite was added to all buffers
the day of each purification. All purification steps were either performed in an
anaerobic chamber (McCoy) containing an atmosphere of 95 % Ar / 5 % H2 (< 0
ppm O2) or by using Schlenk line techniques with argon.
Azotobacter vinelandii were grown in Burke’s medium (pH 7.5) in a 100 %
air atmosphere. A 1 mL 25 % glycerol stock of Azotobacter vinelandii was used to
inoculate a 50 mL Burke’s medium culture supplemented with 10 mM ammonium
chloride. This culture was incubated at 30 °C with shaking for twenty-four hours.
This culture was diluted 1/100 into a 500 mL Burke’s medium culture
supplemented with 10 mM ammonium chloride. This culture was incubated at
30 °C with shaking for twenty-four hours, and then diluted 1/120 into a 60 L

130
Burke’s medium culture supplemented with 1.3 mM ammonium chloride. The
nitrogenase genes were expressed under these conditions due to ammonium
depletion in the media. Cells were grown with stirring at 30 °C, and were harvested
at an optical density of 1.5-2.0. The cells were pelleted via centrifugation at 6238 x
g for 20 minutes at 4 °C. The cell pellets were stored at -80 °C until purification.
The day of purification, Azotobacter vinelandii cell pellets were brought into
the anaerobic chamber to thaw at room temperature. The cell pellets were re-
suspended in ion exchange column wash buffer with 10 mM sodium dithionite in a
glass homogenizer. Once re-suspended, the cells were lysed with an Avestin
Emulsiflex C5 homogenizer under argon. The cell debris was pelleted by
centrifugation in a floor centrifuge at 30,000 x g at 4 °C.
The clarified cell lysate was loaded to a 70 mL HiTrapQ HP anion exchange
column (GE Healthcare). The column was attached to an Akta FPLC (GE
Figure 6.2. Analysis of Purified Nitrogenase Component Proteins. (Left) Coomassie-stained denaturing polyacrylamide gel of the nitrogenase component proteins after purification. Lane 1 = Protein Ladder, Lane 2 = stored Av1, Lane 3 = 1/10 dilution of stored Av1, Lane 4 = stored Av2, Lane 5 = 1/10 dilution of stored Av2. (Right) UV-visible absorption spectrum of Av2 following buffer exchange of the protein into protein electrochemistry buffer.

131 Healthcare). The column was washed with ion exchange column wash buffer
until the absorbance at 410 nm trace was at baseline levels. Then, a gradient was
performed that went from 0 to 100% ion exchange column elution buffer over
fourteen column volumes. The MoFe-protein eluted in the first peak almost
immediately after beginning the salt gradient. The Fe-protein eluted as the second
major peak on the chromatogram. The protein was collected, and was
concentrated in an Amicon ultrafiltration cell under an argon overpressure of 35 psi
to a final volume of between 8-10 mL. The protein was flash frozen in liquid
nitrogen, and was stored under liquid nitrogen until purification by size exclusion
chromatography.
The protein purified through the HiTrapQ column was thawed at room
temperature in an anaerobic chamber, and was loaded to the Superdex200 26/60
column (GE Healthcare) equilibrated in size exclusion column buffer (450 mL total
column volume). The maximum volume of protein loaded to the column was 10
mL. The protein was run through the column with size exclusion column buffer,
and the protein eluted from the column at the expected retention time based on the
size of the protein. The MoFe-protein eluted at about 235mL following injection of
the protein to the size exclusion column. The Fe-protein eluted at about 280 mL
following injection of the protein to the size exclusion column. The protein was
collected as it eluted from the column, and was concentrated in an Amicon
ultrafiltration cell under an argon overpressure of 35 psi to a final concentration of
10-50 mg/mL. This protein was flash frozen in liquid nitrogen. The protein was
stored under liquid nitrogen.
The concentration of both proteins was estimated based off of the
absorption of the sample at 410 nm (7). The extinction coefficient of the MoFe-
protein (Av1) at 410 nm is 76,000 M-1 cm-1. The extinction coefficient of the Fe-
protein (Av2) at 410 nm is 9,400 M-1 cm-1. The purity of the purified protein was
analyzed on a denaturing polyacrylamide gel stained with coomassie blue (Figure 6.2).

132 Acetylene Reduction Assay. The activity of all purified protein was confirmed by
monitoring acetylene reduction to ethylene by nitrogenase. The following reaction
components were assembled in a 9 mL vial: 50 mM tris-HCl, pH 7.5, 20 mM
creatine phosphate, 5 mM ATP, 5 mM MgCl2, 25 units/mL phosphocreatine
kinase, and 25 mM sodium dithionite. The final volume of this reaction mixture was
1 mL. All dioxygen was removed from the reaction mixture by iterative cycles of
vacuum followed by argon filling. The final solutions were kept under argon
pressure, and all acetylene reduction assays were performed using anaerobic
Schlenk line technique under an argon atmosphere. 1 mL of argon headspace was
replaced by 1 mL acetylene, and the solution was incubated at 30 °C for five
minutes with shaking. The nitrogenase component proteins were added to the
reaction mixture along with extra size exclusion column buffer if necessary to keep
the total volume of the reaction constant at 1.3 mL. The component protein for
which the specific activity was being measured was added last to initiate the
reaction. The reactions were incubated at 30 °C for ten minutes with shaking. The
reactions were stopped by addition of 1 mL 3 M citric acid. The amount of ethylene
produced during the course of the reaction was measured by gas chromatography
(activated alumina 60/80 mesh column, flame ionization detector). The total
amount of ethylene produced was estimated using an acetylene standard curve.
Figure 6.3. Acetylene Reduction Assay. Each point is the average of four assays. Error is reported as standard error. The gray curve indicates the best fit of the data with the Michaelis-Menten equation.
133 The specific activity of Av1 was 2785 (nmoles ethylene/(min*mg Av1)). The
specific activity of Av2 was 2680 (nmoles ethylene/(min*mg Av1)) (Figure 6.3). The component ratio (CR) was defined as:
CR = (1.82*[Av2])/[Av1], when the units of concentration are mg/mL.
Preparation of Av2 for Electrochemistry Experiments. Prior to electrochemistry
experiments, sodium dithionite was removed from all protein samples using a
PD10 column (GE Healthcare). This procedure was performed in a McCoy
anaerobic chamber with a 95 % / 5 % Ar / H2 atmosphere with less than 0 ppm
dioxygen. The column was first equilibrated in 5 column volumes of protein gold
electrochemistry buffer (50 mM potassium phosphate, pH 7.5, 150 mM NaCl) with
10 mM sodium dithionite. Then, the column was equilibrated in 5 column volumes
of protein gold electrochemistry buffer. All buffers were filtered with a 0.2 micron
filter, and all dioxygen was removed from the buffer by iterative cycles of vacuum
followed by filling with argon. The protein was exchanged into protein gold
electrochemistry buffer using the PD10 column. UV-visible absorption
spectroscopy was used to quantify protein concentration, and to determine the
extent of protein oxidation during the course of sample preparation. Following this
procedure, the protein was flash frozen in liquid nitrogen, and was brought to
Occidental College under liquid nitrogen for experiments.
Av2 Direct Electrochemistry on Edge-Plane Pyrolytic Graphite Electrodes. Edge-
plane pyrolytic graphite electrodes were polished with 0.3 micron alumina resin. An
electrochemical cell was degassed with argon, and all work was performed using
Schlenk line technique under argon. The electrode was submerged in a 400-800
μM Av2 solution in the electrochemical cell. The protein used in these experiments
was stored in ion exchange column wash buffer without sodium dithionite (50 mM
tris-HCl, pH 7.5, 150 mM NaCl). A platinum auxiliary electrode was also
submerged in the protein solution. A Ag/AgCl electrode (made at Occidental
College) was used as a reference electrode, and was connected to the chamber of

134 the electrochemical cell with the working and auxiliary electrodes via a luggin
capillary. The Ag/AgCl reference electrode was calibrated with potassium
ferricyanide. The electrochemical cell was sealed, and was kept under argon
pressure for the entirety of the experiment. Cyclic voltammograms and square
wave voltammograms were acquired using a CH instruments potentiostat. All data
analysis was performed with the CH instruments software.
Preparation of Single Crystal Gold Electrodes Modified with ω-Functionalized
Alkane-Thiols. The single crystal gold electrodes were prepared by Dr. Keiko
Yokoyama as described previously (14-16).
Av2 Electrochemistry on Single Crystal Gold Electrodes Modified with ω-
Functionalized Alkane-Thiols. The protein was brought into a glovebox along with
the single crystal gold electrodes submerged in phosphate buffer. The atmosphere
in the glovebox was N2 with less than 0 ppm dioxygen. The electrodes were
soaked in a 200 μM Av2 solution for 16-20 hours. Then, the electrode was
transferred to phosphate buffer for voltammetry studies. A platinum auxiliary
electrode and a solid state Ag/AgCl reference electrode (Warner Instruments)
were used for all experiments. The Ag/AgCl reference electrode was calibrated
with potassium ferricyanide. The total amount of alkane-thiol coating the electrode
surface was determined by cathodic stripping voltammetry in 0.5M KOH solution
from -0.5 to -1.3V v. Ag/AgCl. Cyclic voltammograms and square wave
voltammograms were acquired using a CH instruments potentiostat. All data
analysis was performed with the CH instruments software.

135 Results Preparation of Active Fe-Protein for Electrochemistry. Robust electrochemical
methods require that no contaminating redox active species be present in solution
that interfere with the redox process occurring at the electrode. Thus, the reductant
sodium dithionite was removed from all preparations of the Fe-protein prior to
electrochemical studies. Sodium dithionite was removed from the protein by buffer
Figure 6.4. Nitrogenase Activity Following Preparation for Electrochemistry Experiments. Acetylene reduction assays were performed to monitor nitrogenase activity. The designation ‘as purified’ indicated that the protein was assayed following isolation from Azotobacter vinelandii. There was 25 mM sodium dithionite added to the acetylene reduction assays performed with this protein. The designation ‘No DT’ indicates that sodium dithionite was removed from the purified protein with a PD10 column, and there was 0 mM sodium dithionite added to the acetylene reduction assay reaction. The designation ‘No DT in Protein Stock’ indicated that the sodium dithionite had been removed from the protein, but the acetylene reduction assay was prepared with 25 mM sodium dithionite to determine whether the purification procedure affected protein activity. The letters A-D indicate the component ratio (CR) used for the assay: A = CR 0, B = CR 0.5, C = CR 2, and D = CR 10. Each point is the average of two assays. Error is reported as standard error.

136 exchange with a PD10 size exclusion column. The removal of sodium dithionite
was confirmed by UV-visible absorption spectroscopy and by an acetylene
reduction assay for nitrogenase activity (Figure 6.2 and 6.4). Sodium dithionite
has a characteristic absorption band at about 310 nm, so the absence of sodium
dithionite was confirmed by disappearance of this band (19). Furthermore, UV-
visible absorption spectroscopy was used to determine that the protein was not
oxidized during the course of the experiment by comparing the absorption
spectrum of the desalted protein to both the absorption spectrum of the air-
oxidized protein and the absorption spectrum of the protein isolated during
purification. Acetylene reduction assays to test nitrogenase activity performed with the
protein for electrochemistry experiments revealed that this protein was as active as
the protein purified in the presence of sodium dithionite, suggesting that the 4Fe-
4S cluster in the protein was intact for electrochemistry experiments. Additionally,
the lack of acetylene reduction in the absence of added sodium dithionite
suggested that there was no contaminating sodium dithionite in the protein
prepared for electrochemistry experiments.
Direct Electrochemistry of the Fe-Protein on Edge-Plane Pyrolytic Graphite
Electrodes. The redox properties of Av2 were studied on edge-plane pyrolytic
graphite electrodes to determine the midpoint potential of both the 1+/2+ couple
and the 1+/0 couple of the iron-sulfur cluster. Edge-plane pyrolytic graphite
electrodes were chosen for this study because they have been shown to be a
good material for protein adsorption for electrochemical measurements (20,21).
Additionally, the potential range accessible with this type of electrode would make
it possible to measure the low midpoint potential of the all-ferrous form of the 4Fe-
4S cluster in Av2.
The high charging current observed with these electrodes precluded the
use of cyclic voltammetry for the study of the Fe-protein since the background was
too large to observe the faradaic current associated with the iron cofactor in Av2.
137 Therefore, square wave voltammetry was used to study the electrochemical
response of the Fe-protein on edge-plane pyrolytic graphite electrodes. There
were two redox active species that were reproducibly observed only when the
electrodes were soaked in Av2. The first species had an oxidation potential of 63 ±
38 mV v. NHE, and was hypothesized to be a degradation product of the 4Fe-4S
cluster in Av2 (Figure 6.5). The second redox-active species had a midpoint
potential of -270 ± 20 mV v. NHE, and this was assigned as the oxidation potential
of the [4Fe4S]1+/2+ couple. The [4Fe-4S]1+/0 couple was not observed during the
course of these experiments. Upon addition of MgADP or MgATP in five-fold molar
excess over the concentration of Av2, the oxidation potential of the [4Fe-4S]1+/2+
couple did not shift (Figure 6.5). This result is in disagreement with previous
studies using chemical redox titrations, which suggested that the midpoint potential
of the [4Fe-4S]1+/2+ couple shifted -160 mV upon MgADP binding by Av2 or -120
mV upon MgATP binding by Av2 (22,23). Due to the absence of the expected
potential shift upon nucleotide binding in the context of this experiment, this
method was not used to study the proposed mixed nucleotide state of Av2.
Cyclic Voltammetry of the Fe-Protein on Single Crystal Gold Electrodes Modified
with Alkane-Thiol SAMs. Single crystal gold electrodes modified with self-
assembled monolayers of ω-functionalized alkane-thiols are a versatile method for
studying the direct electrochemistry of a variety of redox active proteins, such as
azurins (14-17). This electrode system was used to study the redox properties of
the 4Fe-4S cluster of Av2. Notably, the potential window for this technique is
limited since scanning to negative potentials less than about -0.45 V v. NHE would
drive the reduction of the gold-sulfur bond attaching the alkane-thiols at the
electrode surface. Thus, this technique was not used to determine the midpoint
potential of the 1+/0 couple of Av2. However, this technique could be used to study
the proposed mixed nucleotide state of Av2.
In this study, eight different SAMs of ω-derivatized alkane thiols (ω-C10-SH)
on single crystal gold electrodes were assayed to determine the best system to

138 monitor the redox chemistry of Av2. The redox chemistry of Av2 on these
different monolayers is summarized in Table 6.1, and is described below.
Three types of alkane thiols were combined in different ratios to form SAMs
on single crystal gold electrodes to make eight different types of electrodes in total.
All SAMs were formed with an alkane thiol that consisted of a ten carbon linker that
connected the thiol functional group that covalently linked this molecule to the
electrode and the head group that formed a non-covalent interaction with Av2 to
bind the protein to the electrode. The alkane-thiols only differed by the head group,
which was either an alcohol, an amine, or a methyl functional group. The only self-
assembled monolayers that did not have a redox-active species adsorbed were
those formed with a ratio of 1:1 HS-C10-OH: HS-C10-CH3 and 1:2:1 HS-C10-NH2 :
HS-C10-CH3: HS-C10-OH. Thus, it could be concluded that the amine functional
group at the terminus of the alkane-thiol favored binding of Av2 to the electrodes.
This observation is consistent with the overall negative charge on Av2.
On all single crystal gold electrodes, there was generally a reversible redox
process observed with a midpoint potential between -36 and -119 mV v. NHE
Figure 6.5. Av2 Direct Electrochemistry on Edge-Plane Pyrolytic Graphite Electrodes. (Left) Square wave voltammogram of 250 μM Av2 in ion exchange column wash buffer with 10 mM MgCl2. Potential Increment = 2 mV, Amplitude = 25 mV, Frequency = 2 Hz. (Right) Square wave voltammogram of 400 μM Av2 in ion exchange column wash buffer with 10 mM MgCl2 and 10 mM ADP. Potential Increment = 4 mV, Amplitude = 25 mV, Frequency = 2 Hz.
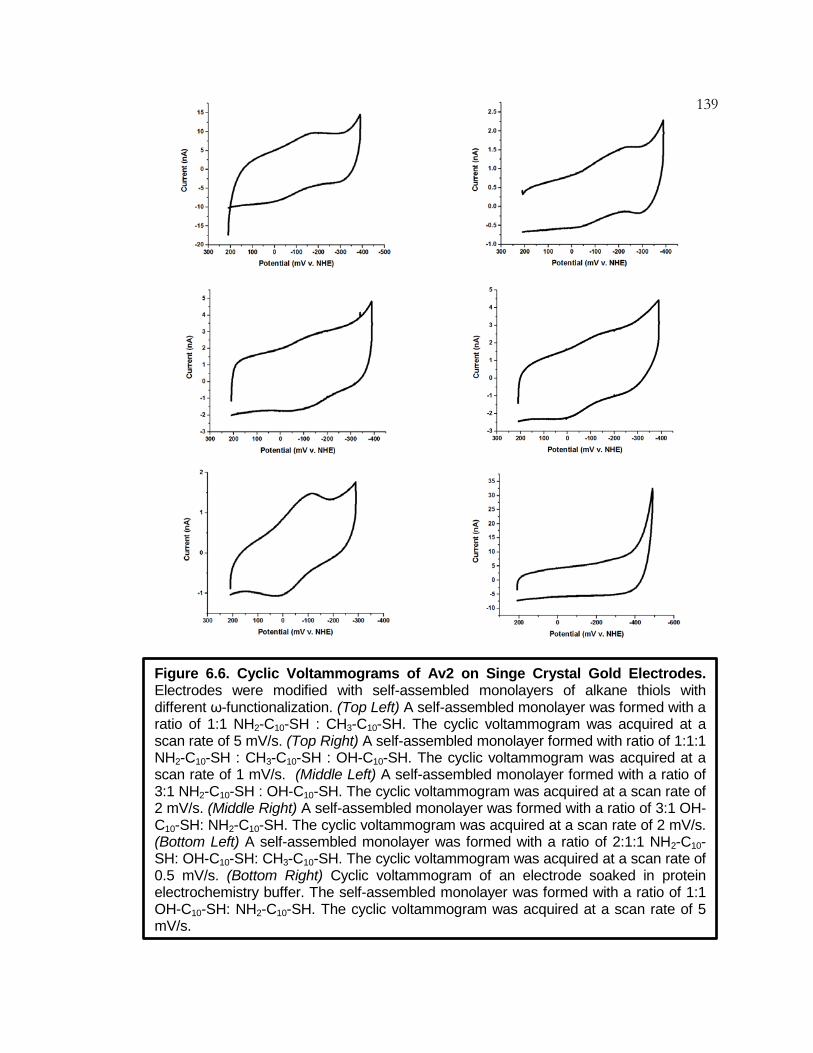
139
Figure 6.6. Cyclic Voltammograms of Av2 on Singe Crystal Gold Electrodes. Electrodes were modified with self-assembled monolayers of alkane thiols with different ω-functionalization. (Top Left) A self-assembled monolayer was formed with a ratio of 1:1 NH2-C10-SH : CH3-C10-SH. The cyclic voltammogram was acquired at a scan rate of 5 mV/s. (Top Right) A self-assembled monolayer formed with ratio of 1:1:1 NH2-C10-SH : CH3-C10-SH : OH-C10-SH. The cyclic voltammogram was acquired at a scan rate of 1 mV/s. (Middle Left) A self-assembled monolayer formed with a ratio of 3:1 NH2-C10-SH : OH-C10-SH. The cyclic voltammogram was acquired at a scan rate of 2 mV/s. (Middle Right) A self-assembled monolayer was formed with a ratio of 3:1 OH-C10-SH: NH2-C10-SH. The cyclic voltammogram was acquired at a scan rate of 2 mV/s. (Bottom Left) A self-assembled monolayer was formed with a ratio of 2:1:1 NH2-C10-SH: OH-C10-SH: CH3-C10-SH. The cyclic voltammogram was acquired at a scan rate of 0.5 mV/s. (Bottom Right) Cyclic voltammogram of an electrode soaked in protein electrochemistry buffer. The self-assembled monolayer was formed with a ratio of 1:1 OH-C10-SH: NH2-C10-SH. The cyclic voltammogram was acquired at a scan rate of 5 mV/s.

140 Table 6.1. Midpoint Potential of Av2 on Gold Electrodes.
Self-Assembled Monolayer
Midpoint Potential (mV v. NHE)
1:1:1 CH3-C10-SH : NH2-C10-SH : OH-C10-SH
-113
1:1:2 CH3-C10-SH : OH-C10-SH : NH2-C10-SH
-42 ± 6
1 : 1 OH-C10-SH : NH2-C10-SH
-111 ± 64
1 : 1 OH-C10-SH : CH3-C10-SH
No Redox Process Observed
1 : 1 NH2-C10-SH : CH3-C10-SH
-76
2:1:1 CH3-C10-SH : OH-C10-SH : NH2-C10-SH
No Redox Process Observed
1 : 3 OH-C10-SH : NH2-C10-SH
-119
3 : 1 OH-C10-SH : NH2-C10-SH
-61
depending on the electrode type (Figure 6.6). The difference in midpoint potential
on different ω-derivatized alkane-thiol modified electrodes suggested that the
protein has a different affinity depending on the electrode type (24,25). The
kinetics of both of the redox processes observed for Av2 on single crystal gold
electrodes was very slow, with reversibility only observed on cyclic
voltammograms acquired at scan rates less than 5 mV/s. This observation was
consistent with the finding that upon slow oxidation of the protein bound to the
electrode by square wave voltammetry, the reductive peak potential shifted by
about -60 mV v. NHE, and increased in size (Figure 6.7). This result was
reversible, and suggested that there could be some sort of conformational change
occurring upon oxidation of the iron-sulfur cluster in the Av2 that is the rate limiting
step in the re-oxidation of this protein. In a biological context, the slow oxidation
kinetics of Av2 could be rationalized since, under optimal conditions, protein
oxidation should be regulated such that the Fe-protein is only oxidized when
donating electrons to the MoFe-protein.

141 In addition to the general features outlined above describing Av2 redox
chemistry on single crystal gold electrodes, there were also distinguishing features
of the redox process observed on the different alkane-thiol modified gold
electrodes. Specifically, under certain conditions the reductive redox process
appeared to have two overlapping peaks as observed by cyclic voltammetry on
gold electrodes modified with a ratio of 1:1:1 HS-C10-CH3 :HS-C10-NH2 :HS-C10-OH
and 2:1:1 HS-C10-NH2: HS-C10-CH3: HS-C10-OH. Thus, on these monolayers,
there may have been multiple orientations of Av2 that each had different midpoint
potentials. This finding is consistent with the variation observed in redox potential
between the different types of alkane-thiol modified electrodes. Since the cathodic
peaks on these voltammograms could not be easily distinguished when
determining the midpoint potential of the redox process, the potential of the
combined cathodic peak was used to calculate this value. The monolayers
composed of either a 1:1 HS-C10-OH: HS-C10-NH2, 1:3 HS-C10-OH: HS-C10-NH2,
or 3:1 HS-C10-OH: HS-C10-NH2 monolayer had very large anodic peaks at slow
scan rates, suggesting that oxidation of Av2 on these monolayers was more facile
Figure 6.7. Oxidation of Av2 on Single Crystal Gold Electrodes. Comparison of cyclic voltammograms of Av2 (Left) and Av2 after slow oxidation with square wave voltammogram (Potential Increment = 2mV, amplitude = 25mV, Frequency = 2Hz) from -0.6V v. Ag/AgCl to 0 V v. Ag/AgCl. (Right). The cyclic voltammograms were acquired at 50 mV/s.

142
than on the other monolayers. Thus, the alkane-thiol monolayer formed on the
gold electrode seemed to affect both the electron transfer kinetics and midpoint
potential of the observed redox process, suggesting that the redox chemistry of
Av2 can be affected by environmental factors.
To further study the redox process observed at the single crystal gold
electrode, the midpoint potential of Av2 was determined under two different
conditions in which Av2 was expected to bind MgATP. First, the protein was
adsorbed to the electrode. Then, the electrode was soaked in a solution of
phosphate buffer with 1 mM MgATP for cyclic voltammogram acquisition. Second,
the electrode was soaked in a solution of the Fe-protein with 1 mM MgATP to
adsorb the ATP-bound protein to the electrode. Under both of these conditions, the
midpoint potential of the observed redox-active species did not shift as predicted
by literature precedence (Figure 6.8) (24,25). Thus, it was concluded that the
redox-active species being monitored on single crystal gold electrodes was not
relevant to nitrogen fixation, and was more likely a degradation product of this iron
cofactor.
Figure 6.8. Redox Chemistry of Av2 Bound to MgATP on Single Crystal Gold Electrodes. Comparison of Cyclic Voltammograms of Av2 in phosphate buffer (Left) and Av2 bound to MgATP in phosphate buffer with 1 mM MgATP (Right). The cyclic voltammograms were acquired at 2 mV/s.
143 Conclusion The Fe-protein is the biological reductant of nitrogenase, and uses energy
derived from ATP hydrolysis to drive electron transfer to the metal clusters of the
MoFe-protein to catalyze substrate reduction (1-3). The redox properties of this
protein have been extensively characterized by redox titration with chemical
mediators (12,13,22,23). Although these methods have provided insight into the
thermodynamic properties of the iron-sulfur cluster bound by the Fe-protein, these
techniques were not able to conclusively determine the midpoint potential of the all
ferrous form of the iron-sulfur cluster in the Fe-protein. This ambiguity in midpoint
potential has left open the question of the biological relevance of the all ferrous
form of the Fe-protein in nitrogenase catalysis. To gain additional insight into the
midpoint potential in this electronic transition, as well as to better determine the
shift in midpoint potential of the iron-sulfur cluster in the Fe-protein in different
nucleotide bound states, two direct electrochemical methods were developed. The
first method used edge-plane pyrolytic graphite electrodes to monitor redox
chemistry occurring at the iron-sulfur cluster in Av2. This system was employed to
study the all ferrous state of the iron-sulfur cluster of the Fe-protein, as well as to
study the Fe-protein bound to different nucleotides. Single crystal gold electrodes
were employed to study the redox chemistry of the Fe-protein in different
nucleotide-bound forms.
Square wave voltammetry on edge-plane pyrolytic graphite electrodes
revealed two redox active species on the electrode surface. Using this method, a
redox species was observed at -270 ± 20 mV v. NHE that was consistent with the
potential of the [4Fe-4S]1+/2+ of the Fe-protein based on similarity to previous
measurements of this redox couple using redox titrations with chemical mediators.
However, unlike in previous solution studies, the midpoint potential of this couple
did not shift when the electrode was submerged in a solution of Fe-protein with
MgADP or MgATP. Thus, using this method, there was no potential shift observed
for the Fe-protein upon binding of nucleotides. Therefore, the midpoint potential of
the mixed nucleotide form of the Fe-protein was not measured with this technique.
144 The large background charging current most likely precluded observation of the
1+/0 couple in either the nucleotide-free or nucleotide-bound forms of the protein.
Cyclic voltammetry of Av2 on single crystal gold electrodes revealed a
redox active species at -36 to -119 mV v. NHE. The positive potential of this
species, as well as an absence in midpoint potential shift upon nucleotide binding
suggested that it was most likely a degradation product of the iron-sulfur cluster.
Thus, this method did not accurately measure the redox potential of the iron-sulfur
cluster in Av2, and this method could not be used to determine the redox
chemistry of Av2 in different nucleotide-bound forms. Although unsuccessful, these
studies provide insight into direct electrochemical methods to study the redox
chemistry of the Fe-protein.
145 References
1. Howard, J. B. and Rees, D. C. (2006) How Many Metals Does it Take to Fix N2? A Mechanistic Overview of Biological Nitrogen Fixation. Proc Natl Acad Sci USA. 103, 17088-17093.
2. Burgess, B. K. and Lowe, D. J. (1996) Mechanism of Molybdenum
Nitrogenase. Chem Rev. 96, 2983-3011.
3. Spatzal, T. (2015) The Center of Biological Nitrogen Fixation: FeMo Cofactor. Z Anorg Allg Chem. 1, 10-17.
4. Tezcan, F. A., Kaiser, J. T., Mustafi, D., Walton, M. Y., Howard, J. B.,
and Rees, D. C. (2005) Nitrogenase Complexes: Multiple Docking Sites for a Nucleotide Switch Protein. Science. 309, 1377-1380.
5. Tezcan, F. A., Kaiser, J. T., Howard, J. B., and Rees, D. C. (2015)
Structural Evidence for Asymmetrical Nucleotide Interactions in Nitrogenase. J Am Chem Soc. 137, 146-149.
6. Spatzal, T., Perez, K. A., Einsle, O., Howard, J. B., and Rees, D. C.
(2014) Ligand Binding to the FeMo-Cofactor: Structure of CO-Bound and Reactivated Nitrogenase. Science. 345, 1620-1623.
7. Spatzal, T., Perez, K. A., Howard, J. B., and Rees, D. C. (2015)
Catalysis-Dependent Selenium Incorporation and Migration in the Nitrogenase Active Site Iron-Molybdenum Cofactor. Elife. E11620.
8. Thorneley, R. N. F.; Lowe, D. J. In Molybdenum Enzymes; Spiro, T. G.,
Ed.; Wiley-Interscience: New York, 1985; p 221. 9. Angrove, H. C., Yoo, S. J., Münck, E., and Burgess, B. K. (1998) An
All-Ferrous State of the Fe Protein of Nitrogenase. Interaction with Nucleotides and Electron Transfer to the MoFe Protein. J Biol Chem. 273, 26330-26337.
10. Strop, P., Takahara, P. M., Chiu, H., Angove, H. C., Burgess, B. K.,
and Rees, D. C. (2001) Crystal Structure of the All-Ferrous [4Fe-4S]0 Form of the Nitrogenase Iron Protein from Azotobacter vinelandii. Biochem. 40, 651-656.
146 11. Hallenbeck, P. C. (1983) Nitrogenase Reduction by Electron
Carriers: Influence of Redox Potential on Activity and the ATP/2e- Ratio. Archives of Biochem and Biophys. 220, 657-660.
12. Watt, G. D. and Reddy, K. R. N. (1994) Formation of an All Ferrous
Fe4S4 Cluster in the Iron Protein Component of Azotobacter vinelandii Nitrogenase. J Inorg Biochem. 53, 281-294.
13. Guo, M., Sulc, F., Ribbe, M. W., Farmer, P. J., and Burgess, B. K.
(2002) Direct Assessment of the Reduction Potential of the [4Fe-4S]1+/0 Couple of the Fe Protein from Azotobacter vinelandii. J Am Chem Soc. 124, 12100-12101.
14. Yokoyama, K., Leigh, B. S., Sheng, Y., Niki, K., Nakamura, N., Ohno,
H., Winkler, J. R., Gray, H. B., and Richards, J. H. (2008) Electron Tunneling through Pseudomonas aeruginosa Azurins on SAM Gold Electrodes. Inorganica Chim Acta. 361, 1095-1099.
15. Fujita, K., Nakamura, N., Ohno, H., Leigh, B. S., Niki, K., Gray, H. B.,
and Richards, J. H. (2004) Mimicking Protein-Protein Electron Transfer: Voltammetry of Pseudomonas aeruginosa Azurin and the Thermus thermophilus CuA Domain of ω-Derivatized Self-Assembled-Monolayer Gold Electrodes. J Am Chem Soc. 126, 13954-13961.
16. Katsumi, N., Hardy, W. R., Hill, M. G., Li, H., Sprinkle, J. R.,
Margoliash, E., Fujita, K., Tanimura, R., Nakamura, N., Ohno, H., Richards, J. H., and Gray, H. B. (2003) Coupling to Lysine-13 Promotes Electron Tunneling through Carboxylate-Terminated Alkanethiol Self-Assembled Monolayers to Cytochrome c. J Phys Chem B. 107, 9947-9949.
17. Gaigalas, A. K. and Niaura, G. (1997) Measurement of Electron
Transfer Rates between Adsorbed Azurin and a Gold Electrode Modified with a Hexanethiol Layer. J. Colloid Interface Sci. 193, 60-70.
18. Spatzal, T., Aksoyoglu, M., Zhang, L., Andrade, S. L. A., Schleicher,
E., Weber, S., Rees, D. D., and Einsle, O. (2011) Evidence for Interstitial Carbon in Nitrogenase FeMo Cofactor. Science. 334, 940.
19. Mayhew, S. G. and Massey, V. (1973) Studies on the Kinetics and
Mechanism of Reduction of Flavodoxin from Peptostreptococcus Elsdenii by Sodium Dithionite. Biochim et Biophys Acta. 315, 181-190.
147 20. Armstrong, F. A., George, S. J., Cammack, R., Hatchikian, E. C.,
and Thomson, A. J. (1989) Electrochemical and Spectroscopic Characterization of the 7Fe Form of Ferredoxin III from Desulfovibrio africanus. Biochem J. 264, 265-273.
21. Maiocco, S. J., Grove, T. L., Booker, S. J., and Elliott, S. J. (2015)
Electrochemical Resolution of the [4Fe-4S] Centers of the AdoMet Radical Enzyme BtrN: Evidence of Proton Coupling and an Unusual, Low-Potential Auxiliary Cluster. J Am Chem Soc. 137, 8664-8667.
22. Ryle, M. J. and Seefeldt, L. C. (1996) Elucidation of a MgATP Signal
Transduction Pathway in the Nitrogenase Iron Protein: Formation of a Conformation Resembling the MgATP-Bound State by Protein Engineering. Biochem. 35, 4766-4775.
23. Ryle, M. J. and Seefeldt, L. C. (1996) The [4Fe-4S] Cluster Domain of
the Nitrogenase Iron Protein Facilitates Conformational Changes Required for the Cooperative Binding of Two Nucleotides. Biochem. 35, 15654-15662.
24. Rivas, L, Soares, C. M., Baptista, A. M., Simaan, J., Di Paolo, R. E.,
Margida, D. H., and Hildebrandt, P. (2005) Electric-Field-Induced Redox Potential Shifts of Tetraheme Cytochromes c3 Immobilized on Self-Assembled Monolayers: Surface-Enhanced Resonance Raman Spectroscopy and Simulation Studies. Biophys J. 88, 4188-4199.
25. Genereux, J. C., Boal, A. K., and Barton, J. K. (2010) DNA-Mediated
Charge Transport in Redox Sensing and Signaling. J Am Chem Soc. 132, 891-905.

148 A p p e n d i x 1
MATERIALS FOR S. CEREVISIAE DNA2 EXPRESSION IN E.COLI
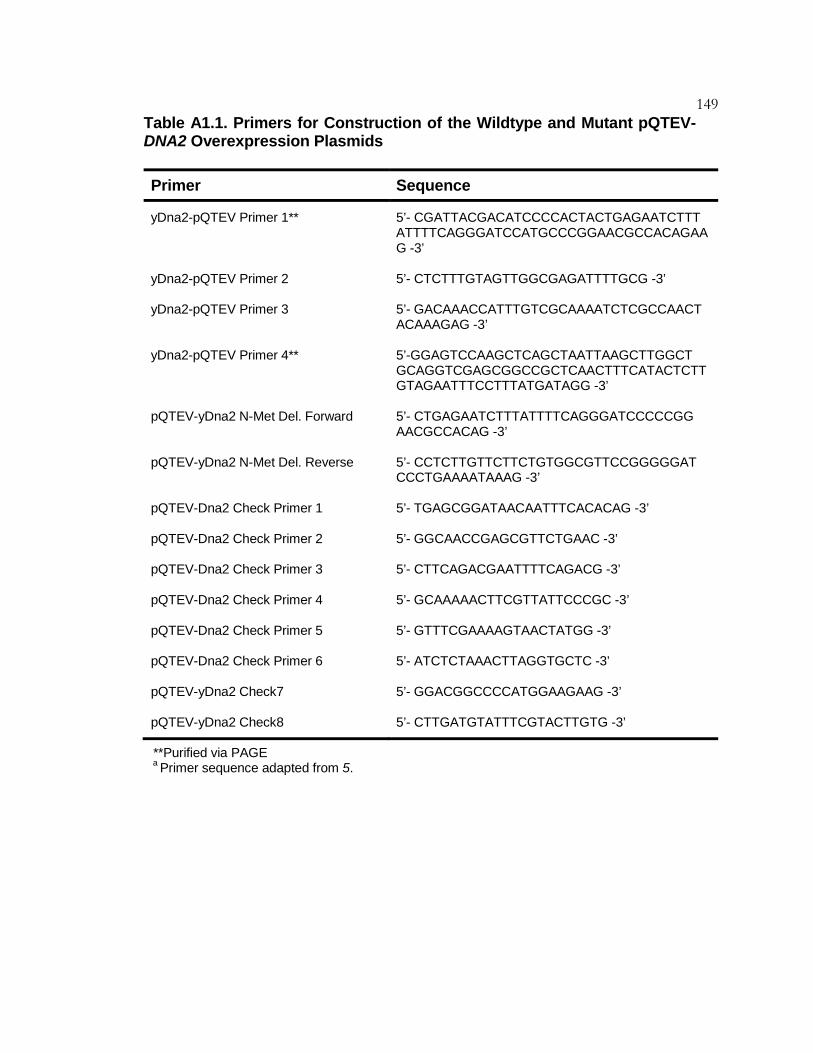
149 Table A1.1. Primers for Construction of the Wildtype and Mutant pQTEV-DNA2 Overexpression Plasmids
Primer
Sequence
yDna2-pQTEV Primer 1**
5’- CGATTACGACATCCCCACTACTGAGAATCTTT ATTTTCAGGGATCCATGCCCGGAACGCCACAGAAG -3’
yDna2-pQTEV Primer 2 5’- CTCTTTGTAGTTGGCGAGATTTTGCG -3’ yDna2-pQTEV Primer 3
5’- GACAAACCATTTGTCGCAAAATCTCGCCAACT ACAAAGAG -3’
yDna2-pQTEV Primer 4**
5’-GGAGTCCAAGCTCAGCTAATTAAGCTTGGCT GCAGGTCGAGCGGCCGCTCAACTTTCATACTCTTGTAGAATTTCCTTTATGATAGG -3’
pQTEV-yDna2 N-Met Del. Forward
5’- CTGAGAATCTTTATTTTCAGGGATCCCCCGG AACGCCACAG -3’
pQTEV-yDna2 N-Met Del. Reverse
5’- CCTCTTGTTCTTCTGTGGCGTTCCGGGGGAT CCCTGAAAATAAAG -3’
pQTEV-Dna2 Check Primer 1 5’- TGAGCGGATAACAATTTCACACAG -3’
pQTEV-Dna2 Check Primer 2 5’- GGCAACCGAGCGTTCTGAAC -3’
pQTEV-Dna2 Check Primer 3 5’- CTTCAGACGAATTTTCAGACG -3’
pQTEV-Dna2 Check Primer 4 5’- GCAAAAACTTCGTTATTCCCGC -3’
pQTEV-Dna2 Check Primer 5 5’- GTTTCGAAAAGTAACTATGG -3’
pQTEV-Dna2 Check Primer 6 5’- ATCTCTAAACTTAGGTGCTC -3’
pQTEV-yDna2 Check7 5’- GGACGGCCCCATGGAAGAAG -3’
pQTEV-yDna2 Check8 5’- CTTGATGTATTTCGTACTTGTG -3’
**Purified via PAGE a Primer sequence adapted from 5.

150 Table A1.2. Primers for Site-Directed Mutagenesis of the Dna2 Overexpression Plasmid
Primer
Sequence
Dna2 E675A Forward
5’- GTTGAAAACAATAAAAAACACATCGTTCCTTTAGCAGTGAAA ACTG -3’
Dna2 E675A Reverse 5’- CGCTTCTGGATTTTCCAGTTTTCACTGCTAAAGGAACGAT GTG -3’
Dna2 K1080E Forward
5’-CAGGGACTGGTGAGACTACTGTTATCGCAGAAATTATTAAA ATTCTCG -3’
Dna2 K1080E Reverse
5’- CTGCGATAACAGTAGTCTCACCAGTCCCTGGCATTCCCAA TATCAATG -3’
Dna2 P504S Forward
5’- CTGTTGGTGCTAAACTCTGATGTATTATTTTCG -3’
Dna2 P504S Reverse
5’- CGAAAATAATACATCAGAGTTTAGCACCAACAG -3’
Dna2 C771S Forward 5’- CATCTTGTGATTCATCTTTCATCAAAGAATC -3’
Dna2 C771S Reverse 5’- GATTCTTTGATGAAAGATGAATCACAAGATG -3’
yDna2 C771A Forwarda 5’- CATCTTGTGATTCAGCTTTCATCAAAGAATC -3’
yDna2 C771A Reversea 5’- GATTCTTTGATGAAAGCTGAATCACAAGATG -3’
Dna2 C519A Forwarda 5’- GGAAGTTCAGTAGGTGCTTTAAGACGTTCAATTC -3’
Dna2 C519A Reversea 5’- GAATTGAACGTCTTAAAGCACCTACTGAACTTCC -3’
Dna2 C768A Forwarda 5’- CTGCGCGATTCATCTGCTGATTCATGTTTCATC -3’
Dna2 C768A Reversea 5’- GATGAAACATGAATCAGCAGATGAATCGCGCAG -3’
Dna2 C777A Forwarda 5’- GTTTCATCAAAGAATCAGCCATGGTGTTGAATAAGCTAC -3’
Dna2 C777A Reversea
5’- GTAGCTTATTCAACACCATGGCTGATTCTTTGATGAAAC -3’
a Primer sequence from Pokharel, S. and Campbell, J. L. (2012) Nucleic Acids Res. 40, 7821-7830. .

151 Table A1.3. Plasmids for Dna2 Overexpression
Plasmid
Description
pQTEV-Δ1-107 DNA2
Plasmid for Dna2 Δ1-107 Dna2 Overexpression in E. coli
pQTEV-DNA2 (with N-terminal Methionine)
Plasmid for Dna2 Overexpression in E. coli (with N-terminal Methionine)
pQTEV-DNA2* Plasmid for Dna2 Overexpression in E. coli (without N-terminal Methionine)*
pQTEV-DNA2 E675A Plasmid for Dna2 E675A Overexpression in E. coli
pQTEV-DNA2 K1080E Plasmid for Dna2 K1080E Overexpression in E. coli
pQTEV-DNA2 P504S Plasmid for Dna2 P504S Overexpression in E. coli
pQTEV-DNA2 C771S Plasmid for Dna2 C771S Overexpression in E. coli
pQTEV-DNA2 C771A Plasmid for Dna2 C771A Overexpression in E. coli
pQTEV-DNA2 C519A Plasmid for Dna2 C519A Overexpression in E. coli
pQTEV-DNA2 C768A Plasmid for Dna2 C768A Overexpression in E. coli
pQTEV-DNA2 C777A Plasmid for Dna2 C777A Overexpression in E. coli
a Construct used as template to make mutant Dna2 overexpression plasmids.

152 Table A1.4. E. coli Strains for Wildtype and Mutant Dna2 Overexpression
Strain
Genotype
Rosetta2 (DE3) pLysS pQTEV-Δ1-107 DNA2
F-ompT hsdSB(rB-mB
-) gal dcm (DE3) pLysSRARE2 (CamR) pQTEV-Δ1-107 DNA2 (AmpR)
Rosetta2 (DE3) pLysS pQTEV-DNA2 (with N-terminal Methionine)
F-ompT hsdSB(rB-mB
-) gal dcm (DE3) pLysSRARE2 (CamR) pQTEV-DNA2 (with N-terminal Methionine) (AmpR)
Rosetta2 (DE3) pLysS pQTEV-DNA2
F-ompT hsdSB(rB-mB
-) gal dcm (DE3) pLysSRARE2 (CamR) pQTEV-DNA2 (AmpR)
Rosetta2 (DE3) pLysS pQTEV-DNA2 E675A
F-ompT hsdSB(rB-mB
-) gal dcm (DE3) pLysSRARE2 (CamR) pQTEV-DNA2 E675A (AmpR)
Rosetta2 (DE3) pLysS pQTEV-DNA2 K1080E
F-ompT hsdSB(rB-mB
-) gal dcm (DE3) pLysSRARE2 (CamR) pQTEV-DNA2 K1080E (AmpR)
Rosetta2 (DE3) pLysS pQTEV-DNA2 P504S
F-ompT hsdSB(rB-mB
-) gal dcm (DE3) pLysSRARE2 (CamR) pQTEV-DNA2 P504S (AmpR)
Rosetta2 (DE3) pLysS pQTEV-DNA2 C771S
F-ompT hsdSB(rB-mB
-) gal dcm (DE3) pLysSRARE2 (CamR) pQTEV-DNA2 C771S (AmpR)
Rosetta2 (DE3) pLysS pQTEV-DNA2 C771A
F-ompT hsdSB(rB-mB
-) gal dcm (DE3) pLysSRARE2 (CamR) pQTEV-DNA2 C771A (AmpR)
Rosetta2 (DE3) pLysS pQTEV-DNA2 C519A
F-ompT hsdSB(rB-mB
-) gal dcm (DE3) pLysSRARE2 (CamR) pQTEV-DNA2 C519A (AmpR)
Rosetta2 (DE3) pLysS pQTEV-DNA2 C768A
F-ompT hsdSB(rB-mB
-) gal dcm (DE3) pLysSRARE2 (CamR) pQTEV-DNA2 C768A (AmpR)
Rosetta2 (DE3) pLysS pQTEV-DNA2 C777A
F-ompT hsdSB(rB-mB
-) gal dcm (DE3) pLysSRARE2 (CamR) pQTEV-DNA2 C777A (AmpR)

153 Table A1.5. E. coli Strains for Storage of the Dna2 Overexpression Plasmids
Strain
Genotype
TOP10 pQTEV-Δ1-107 DNA2
F- mcrA Δ(mrr-hsdRMS-mcrBC) Φ80lacZΔM15 ΔlacX74 recA1 araD139 Δ(ara-leu)7697 galU galK rpsL endA1 nupG pQTEV-Δ1-107 DNA2 (AmpR)
TOP10 pQTEV-DNA2 (with N-terminal Methionine)
F- mcrA Δ(mrr-hsdRMS-mcrBC) Φ80lacZΔM15 ΔlacX74 recA1 araD139 Δ(ara-leu)7697 galU galK rpsL endA1 nupG pQTEV-DNA2 (with N-terminal Methionine) (AmpR)
TOP10 pQTEV-DNA2 F- mcrA Δ(mrr-hsdRMS-mcrBC) Φ80lacZΔM15 ΔlacX74 recA1 araD139 Δ(ara-leu)7697 galU galK rpsL endA1 nupG pQTEV-DNA2 (AmpR)
TOP10 pQTEV F- mcrA Δ(mrr-hsdRMS-mcrBC) Φ80lacZΔM15 ΔlacX74 recA1 araD139 Δ(ara-leu)7697 galU galK rpsL endA1 nupG pQTEV (AmpR)
TOP10 pGal18-DNA2 F- mcrA Δ(mrr-hsdRMS-mcrBC) Φ80lacZΔM15 ΔlacX74 recA1 araD139 Δ(ara-leu)7697 galU galK rpsL endA1 nupG pGal18-DNA2 (AmpR)
TOP10 pQTEV-DNA2 E675A F- mcrA Δ(mrr-hsdRMS-mcrBC) Φ80lacZΔM15 ΔlacX74 recA1 araD139 Δ(ara-leu)7697 galU galK rpsL endA1 nupG pQTEV-DNA2 E675A (AmpR)
TOP10 pQTEV-DNA2 K1080E F- mcrA Δ(mrr-hsdRMS-mcrBC) Φ80lacZΔM15 ΔlacX74 recA1 araD139 Δ(ara-leu)7697 galU galK rpsL endA1 nupG pQTEV-DNA2 K1080E (AmpR)
TOP10 pQTEV-DNA2 P504S F- mcrA Δ(mrr-hsdRMS-mcrBC) Φ80lacZΔM15 ΔlacX74 recA1 araD139 Δ(ara-leu)7697 galU galK rpsL endA1 nupG pQTEV-DNA2 P504S (AmpR)
TOP10 pQTEV-DNA2 C771S F- mcrA Δ(mrr-hsdRMS-mcrBC) Φ80lacZΔM15 ΔlacX74 recA1 araD139 Δ(ara-leu)7697 galU galK rpsL endA1 nupG pQTEV-DNA2 C771S(AmpR)
TOP10 pQTEV-DNA2 C771A F- mcrA Δ(mrr-hsdRMS-mcrBC) Φ80lacZΔM15 ΔlacX74 recA1 araD139 Δ(ara-leu)7697 galU galK rpsL endA1 nupG pQTEV-DNA2 C771A(AmpR)
TOP10 pQTEV-DNA2 C519A F- mcrA Δ(mrr-hsdRMS-mcrBC) Φ80lacZΔM15 ΔlacX74 recA1 araD139 Δ(ara-leu)7697 galU galK rpsL endA1 nupG pQTEV-DNA2 C519A (AmpR)

154 A p p e n d i x 2
DNA2 ELECTROCHEMICAL NUCLEASE ASSAY SUPPORTING FIGURES AND TABLES

155 Figure A2.1. Comparison of Wildtype Dna2 and Dna2 E675A Nuclease Activity with Methylene Blue DNA. A) Radiolabeling method for methylene blue modified DNA. B) Phosphoradiogram of the 12% sequencing gel to analyze the nuclease activity assay reaction products. (Lane 1 = No Dna2, Lanes 2 = 20 μM Dna2, Lane 3 = 5nM Dna2, Lane 4 = 0.5nM Dna2, Lanes 5 = 0.05nM Dna2, Lanes 6 = 5nM Dna2 E675A, Lanes 7 = 0.5nM Dna2 E675A, Lanes 8 = 0.05nM Dna2 E675A)
A)
B)
1 2 3 4 5 6 7 8
Dna2 Dna2 E675A
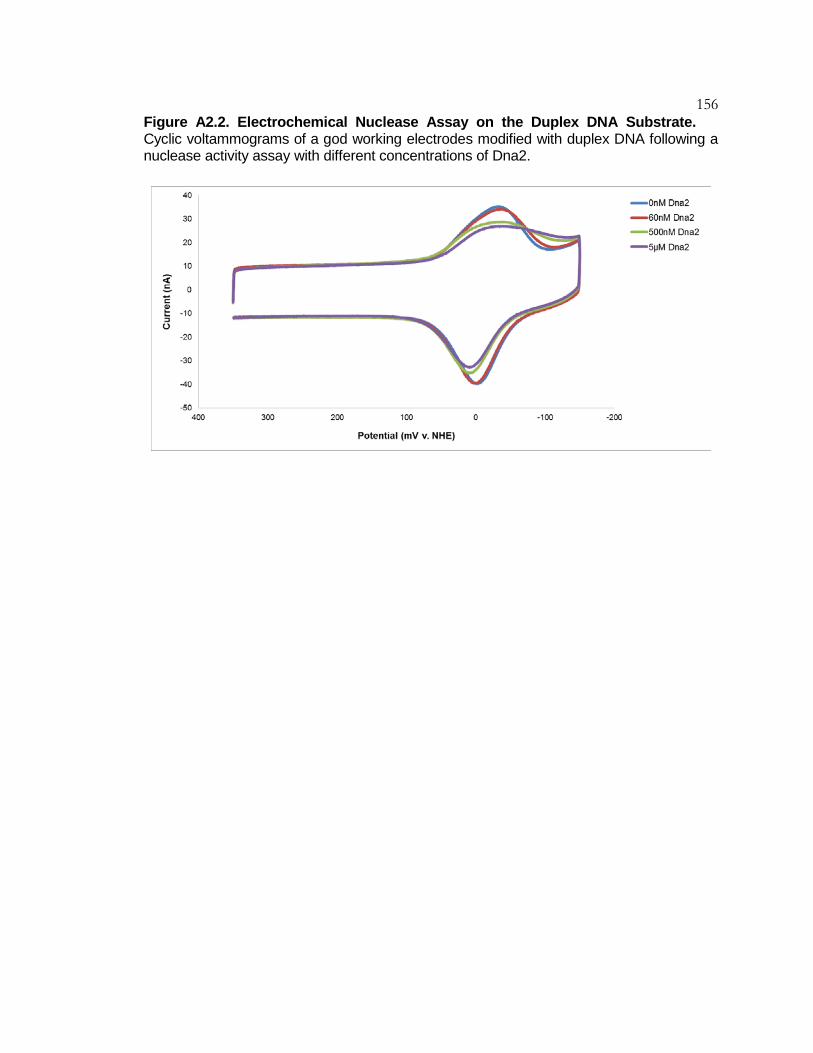
156 Figure A2.2. Electrochemical Nuclease Assay on the Duplex DNA Substrate. Cyclic voltammograms of a god working electrodes modified with duplex DNA following a nuclease activity assay with different concentrations of Dna2.
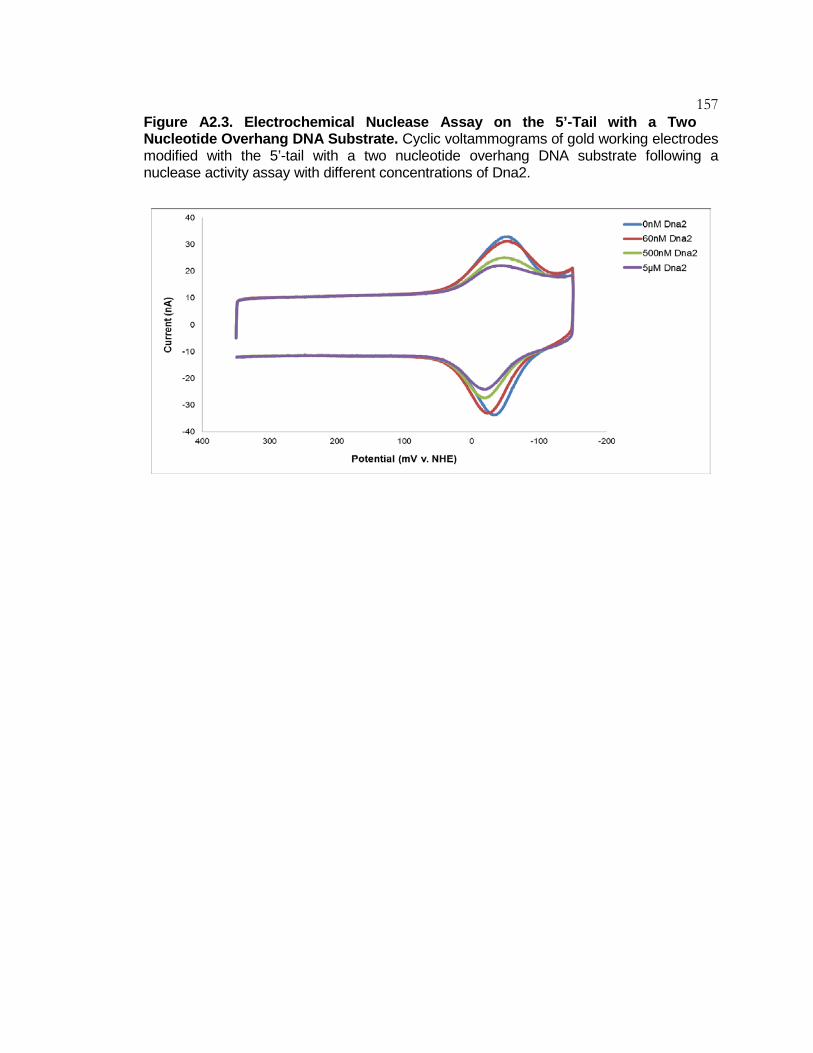
157 Figure A2.3. Electrochemical Nuclease Assay on the 5’-Tail with a Two Nucleotide Overhang DNA Substrate. Cyclic voltammograms of gold working electrodes modified with the 5’-tail with a two nucleotide overhang DNA substrate following a nuclease activity assay with different concentrations of Dna2.

158 Figure A2.4. Electrochemical Nuclease Assay on the 5’-Tail with a Twenty Nucleotide Overhang. Cyclic voltammograms of gold working electrodes modified with the 5’-tail with a twenty nucleotide overhang following a nuclease activity assay with different concentrations of Dna2.

159 Figure A2.5. Quantification of DNA on the Working Electrode. To confirm that the same concentration of DNA was present on the electrodes modified with the different DNA substrates, the amount of DNA deposited on the surface in each experiment was calculated with the following equation: Г = Q/nF
where Г=surface coverage in moles of adsorbate, Q=charge, n=number of electrons, F=Faraday’s constant. All values for the amount of DNA on the electrode surface were an average of the amount of DNA calculated from cyclic voltammograms acquired at different scan rates. The error was the standard deviation of the amount of DNA calculated for the same electrode surface based on cyclic voltammograms acquired at different scan rates. A) DNA quantification based off of integration of the total charge under the cathodic peak. B) DNA quantification based off of integration of the total charge under the anodic peak.
A)
B)

160 Figure A2.6. Scan Rate Analysis 1. Scan rate analysis of a gold working electrode modified with the duplex DNA Substrate. Each data point on the graph is the average of data collected from two DNA-modified electrodes. (Top Left) Plot of scan rate versus cathodic peak intensity. (Top Right) Plot of scan rate versus anodic peak intensity. (Bottom Left) Plot of scan rate1/2 versus cathodic peak intensity. (Bottom Right) Plot of scan rate1/2 versus anodic peak intensity.

161 Figure A2.7. Scan Rate Analysis 2. Scan rate analysis of a gold working electrode modified with the 5’-tail DNA Substrate with a two nucleotide overhang. Each data point on the graph is the average of data collected from two DNA-modified electrodes. (Top Left) Plot of scan rate versus cathodic peak intensity. (Top Right) Plot of scan rate versus anodic peak intensity. (Bottom Left) Plot of scan rate1/2 versus cathodic peak intensity. (Bottom Right) Plot of scan rate1/2 versus anodic peak intensity.

162 Figure A2.8. Scan Rate Analysis 3. Scan rate analysis of a gold working electrode modified with the 5’-tail DNA substrate with a ten nucleotide overhang. Each data point on the graph is the data collected from one DNA-modified electrode. (Top Left) Plot of scan rate versus cathodic peak intensity. (Top Right) Plot of scan rate versus anodic peak intensity. (Bottom Left) Plot of scan rate1/2 versus cathodic peak intensity. (Bottom Right) Plot of scan rate1/2 versus anodic peak intensity.
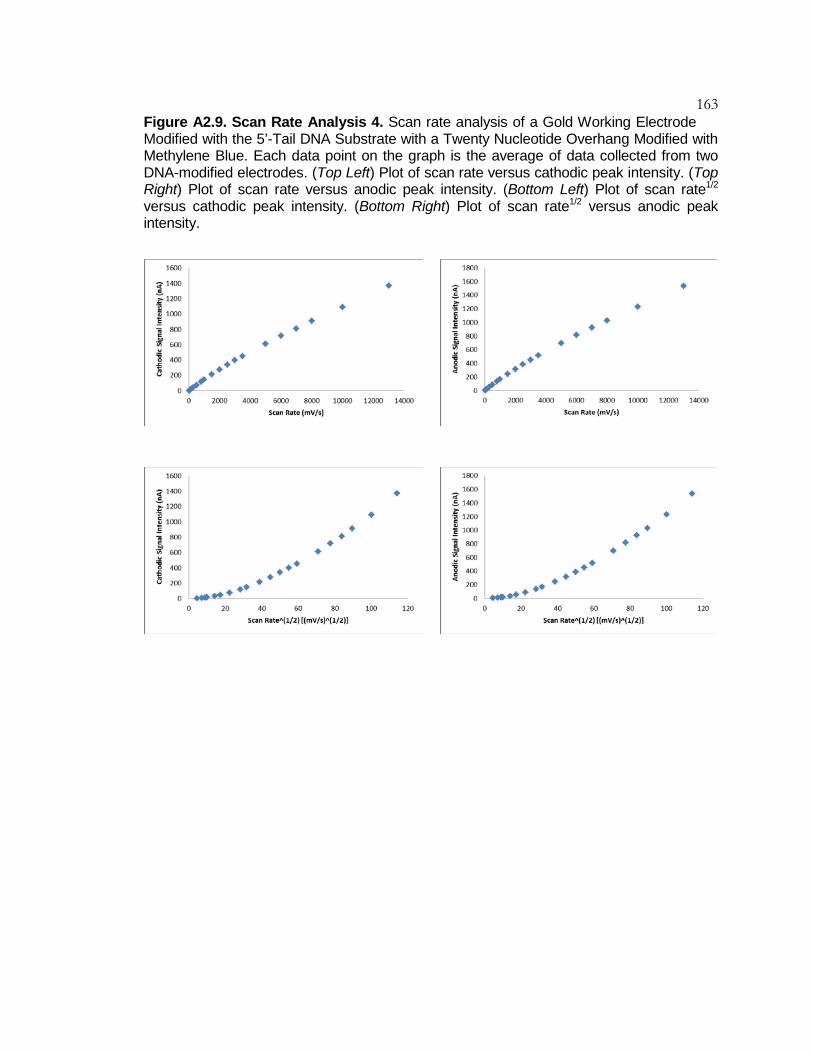
163 Figure A2.9. Scan Rate Analysis 4. Scan rate analysis of a Gold Working Electrode Modified with the 5’-Tail DNA Substrate with a Twenty Nucleotide Overhang Modified with Methylene Blue. Each data point on the graph is the average of data collected from two DNA-modified electrodes. (Top Left) Plot of scan rate versus cathodic peak intensity. (Top Right) Plot of scan rate versus anodic peak intensity. (Bottom Left) Plot of scan rate1/2 versus cathodic peak intensity. (Bottom Right) Plot of scan rate1/2 versus anodic peak intensity.

164 Figure A2.10. Scan Rate Analysis 5. Scan rate analysis of a gold working electrode modified with the duplex DNA Substrate following the electrochemical nuclease assay. Each data point on the graph is the average of data collected from two DNA-modified electrodes. (Top Left) Plot of scan rate versus cathodic peak intensity. (Top Right) Plot of scan rate versus anodic peak intensity. (Bottom Left) Plot of scan rate1/2 versus cathodic peak intensity. (Bottom Right) Plot of scan rate1/2 versus anodic peak intensity.

165 Figure A2.11. Scan Rate Analysis 6. Scan rate analysis of a gold working electrode modified with the 5’-tail DNA substrate with a two nucleotide overhang following the electrochemical nuclease assay. Each data point on the graph is the data collected from one DNA-modified electrode. (Top Left) Plot of scan rate versus cathodic peak intensity. (Top Right) Plot of scan rate versus anodic peak intensity. (Bottom Left) Plot of scan rate1/2 versus cathodic peak intensity. (Bottom Right) Plot of scan rate1/2 versus anodic peak intensity.
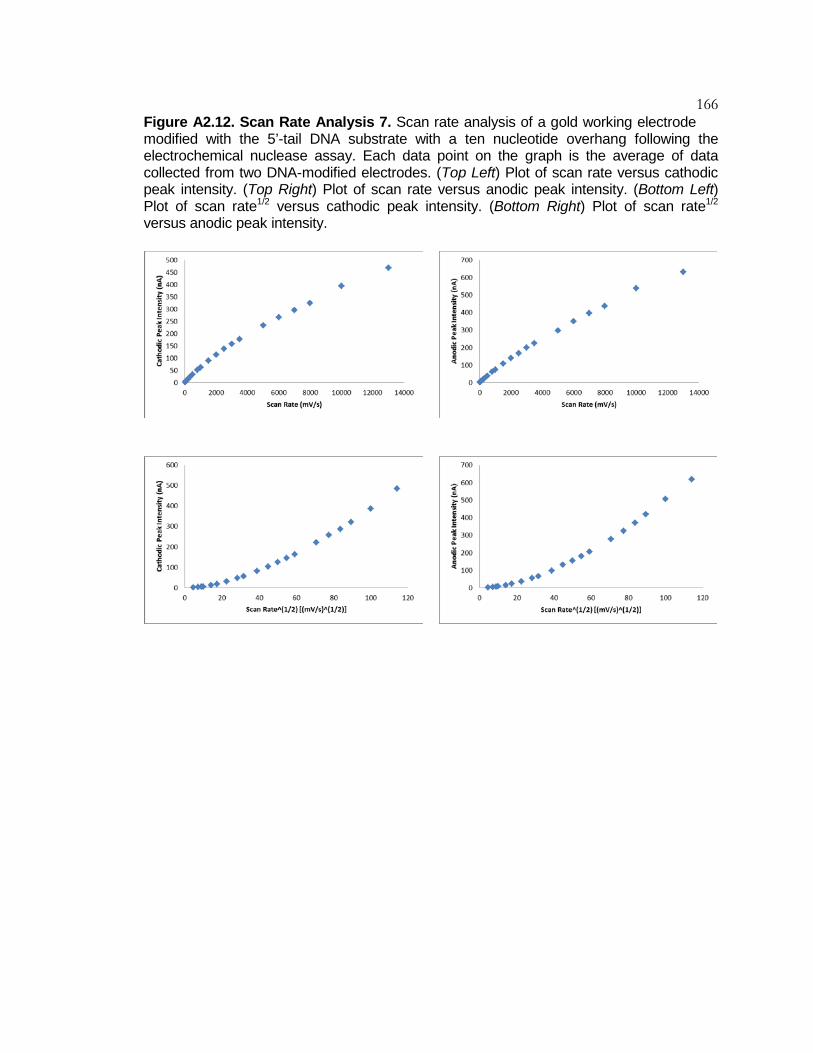
166 Figure A2.12. Scan Rate Analysis 7. Scan rate analysis of a gold working electrode modified with the 5’-tail DNA substrate with a ten nucleotide overhang following the electrochemical nuclease assay. Each data point on the graph is the average of data collected from two DNA-modified electrodes. (Top Left) Plot of scan rate versus cathodic peak intensity. (Top Right) Plot of scan rate versus anodic peak intensity. (Bottom Left) Plot of scan rate1/2 versus cathodic peak intensity. (Bottom Right) Plot of scan rate1/2 versus anodic peak intensity.
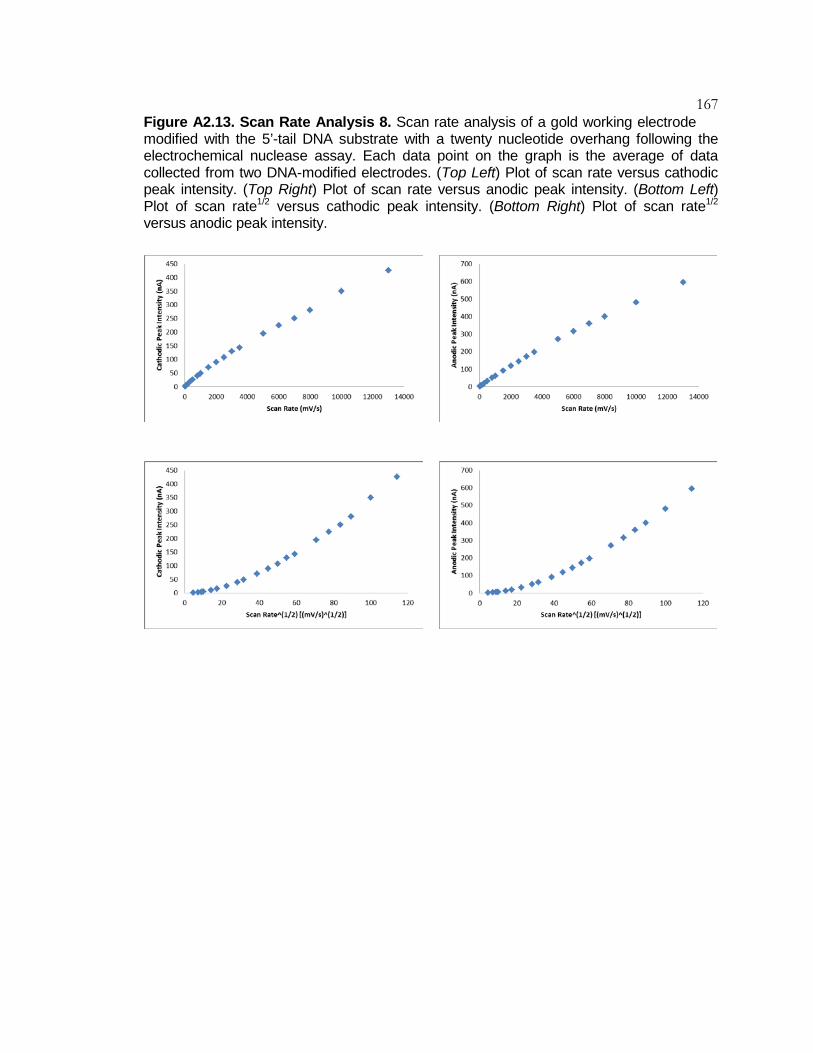
167 Figure A2.13. Scan Rate Analysis 8. Scan rate analysis of a gold working electrode modified with the 5’-tail DNA substrate with a twenty nucleotide overhang following the electrochemical nuclease assay. Each data point on the graph is the average of data collected from two DNA-modified electrodes. (Top Left) Plot of scan rate versus cathodic peak intensity. (Top Right) Plot of scan rate versus anodic peak intensity. (Bottom Left) Plot of scan rate1/2 versus cathodic peak intensity. (Bottom Right) Plot of scan rate1/2 versus anodic peak intensity.

168 Table A2.1. Oligonucleotides for the Electrochemical Nuclease Assay
*/5AmMC6T/ = Amino Modifier dT C6 on the IDT DNA website **/5MBC6T/ = Methylene Blue dT C6 ***/5ThioMC6-D/ = 5’ Thiol Modifier C6 S-S (Disulfide) ****HS = Thiol
Name
Sequence (5’-3’)
Extinction Coefficient at 260nm (M-1cm-1)
5’-Tail 5’-Amino 2mer Overhang Complement
/5AmMC6T/TGTAGGGTTCGCGACATGATGCATCGTTAGGCAC
336,000
5’-Tail 5’-Methylene Blue 2mer Overhang Complement
/5MBC6T/TGTAGGGTTCGCGACATGATGCATCGTTAGGCAC
346,300
5’-Tail 5’-Amino 10mer Overhang Complement
/5AmMC6T/ACTGTGGCTGTAGGGTTCGCGACATGATGCATCGTTAGGCAC
409,300
5’-Tail 5’-Methylene Blue 10mer Overhang Complement
/5MBC6T/ACTGTGGCTGTAGGGTTCGCGACATGATGCATCGTTAGGCAC
419,600
5’-Tail 5’-Amino 20mer Overhang Complement
/5AmMC6T/TACTTATTTCACTGTGGCTGTAGGGTTCGCGACATGATGCATCGTTAGGCAC
498,700
5’-Tail 5’-Methylene Blue 20mer Overhang Complement
/5MBC6T/TACTTATTTCACTGTGGCTGTAGGGTTCGCGACATGATGCATCGTTAGGCAC
509,000
5’-Tail Disulfide 33
/5ThioMC6-D/GTGCCTAACGATGCATCATGT CGCGAACCCTAC
309,700
5’-Tail Thiol 33
HS – GTGCCTAACGATGCATCATGTCGCG AACCCTAC
309,700
5’-Tail Disulfide 35 /5ThioMC6-D/GTGCCTAACGATGCATCATGTC GCGAACCCTACAA
335,500
5’-Tail Thiol 35
HS – GTGCCTAACGATGCATCATGTCGCGA ACCCTACAA
335,500
5’-Tail Comp for TT labeling
TGTGCCTAACGATGCATCATGTCGCGAACCCTAC
317,200

169 Table A2.2. DNA Substrates for the Electrochemical Nuclease Assay
5’-Tail DNA Substrate
Complement DNA
Thiol DNA
duplex
5’-Tail 5’-Methylene Blue 2mer Overhang Complement
5’-Tail Thiol 35
5’-tail with a two nucleotide overhang 5’-Tail 5’-Methylene Blue 2mer Overhang Complement
5’-Tail Thiol 33
5’-tail with a ten nucleotide overhang 5’-Tail 5’-Methylene Blue 10mer Overhang Complement
5’-Tail Thiol 33
5’-tail with a twenty nucleotide overhang 5’-Tail 5’-Methylene Blue 20mer Overhang Complement
5’-Tail Thiol 33

170 A p p e n d i x 3
ELECTROCHEMICAL AND STRUCTURAL CHARACTERIZATION OF AZOTOBACTER VINELANDII FLAVODOXIN II
SUPPORTING FIGURES AND TABLES
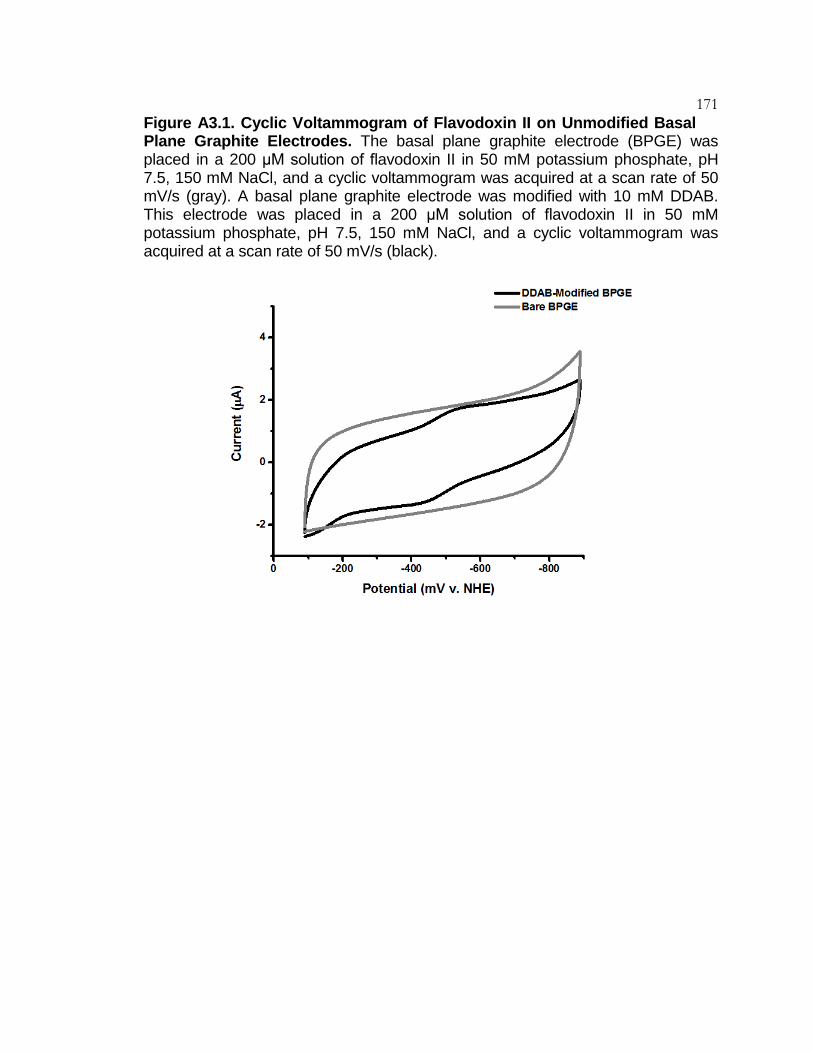
171 Figure A3.1. Cyclic Voltammogram of Flavodoxin II on Unmodified Basal Plane Graphite Electrodes. The basal plane graphite electrode (BPGE) was placed in a 200 μM solution of flavodoxin II in 50 mM potassium phosphate, pH 7.5, 150 mM NaCl, and a cyclic voltammogram was acquired at a scan rate of 50 mV/s (gray). A basal plane graphite electrode was modified with 10 mM DDAB. This electrode was placed in a 200 μM solution of flavodoxin II in 50 mM potassium phosphate, pH 7.5, 150 mM NaCl, and a cyclic voltammogram was acquired at a scan rate of 50 mV/s (black).

172 Figure A3.2. Cyclic Voltammogram of Flavodoxin II Purified from E. coli. The DDAB-modified basal plane graphite electrode was soaked in a 200 μM solution of flavodoxin II purified from E. coli for twenty minutes. The electrode was transferred to phosphate buffer, and a cyclic voltammogram was acquired at a scan rate of 50 mV/s. The low potential peak was at -427 ± 3 mV v. NHE. The high potential peak was at -151 ± 3 mV v. NHE.

173 Figure A3.3. Cyclic Voltammogram of FMN. The basal plane graphite electrode was placed in a 200 μM solution of FMN in 50 mM potassium phosphate, pH 7.5, 150 mM NaCl, and a cyclic voltammogram was acquired at a scan rate of 20 mV/s. The high potential peak on the voltammogram had a midpoint potential of -138 ± 3. The low potential peak on the voltammogram had a midpoint potential of -303 ± 1. The scan rate dependence of the signal intensity for free FMN in solution indicated that this molecule diffused in the DDAB films at a diffusion rate of 5.7 x 10⁻⁷ ± 1.4 x 10⁻⁷ cm2/s. This calculation assumed that the concentration of FMN was the same in solution as it was in the surfactant film, and that the redox process observed was a two electron process.

174 Figure A3.4. Cyclic Voltammogram of Flavodoxin II with the High and Low Potential Species. The electrode was soaked in 200 μM flavodoxin II in 50 mM potassium phosphate, pH 7.5, 150 mM NaCl for 20 minutes. The electrode was transferred to 10 mM phosphate buffer, pH 7, and a cyclic voltammogram was acquired at a scan rate of 20 mV/s.

175 Figure A3.5. Flavodoxin II Scan Rate Analysis (Top) Dependence of the signal intensity on the scan rate of the low potential peak of flavodoxin II on DDAB-modified basal plane graphite electrodes. The cyclic voltammogram was acquired in a 200 μM flavodoxin II solution in 50 mM tris-HCl, pH 7.5, 200 mM NaCl. (Bottom) Dependence of the signal intensity on the scan rate of the low potential peak of the cyclic voltammogram of flavodoxin II on DDAB-modified basal plane graphite electrodes. The electrode was initially soaked in 200 μM flavodoxin II in 50 mM tris-HCl, pH 7.5, 200 mM NaCl. The electrode was moved to phosphate buffer for cyclic voltammetry.
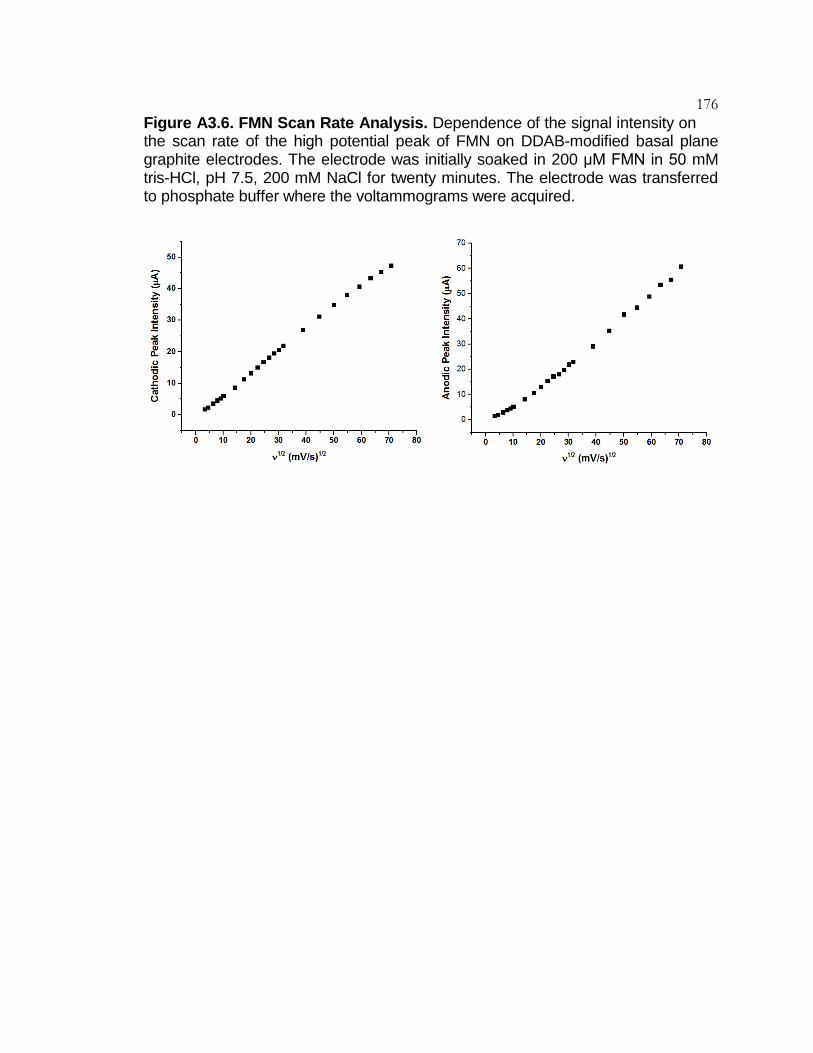
176 Figure A3.6. FMN Scan Rate Analysis. Dependence of the signal intensity on the scan rate of the high potential peak of FMN on DDAB-modified basal plane graphite electrodes. The electrode was initially soaked in 200 μM FMN in 50 mM tris-HCl, pH 7.5, 200 mM NaCl for twenty minutes. The electrode was transferred to phosphate buffer where the voltammograms were acquired.
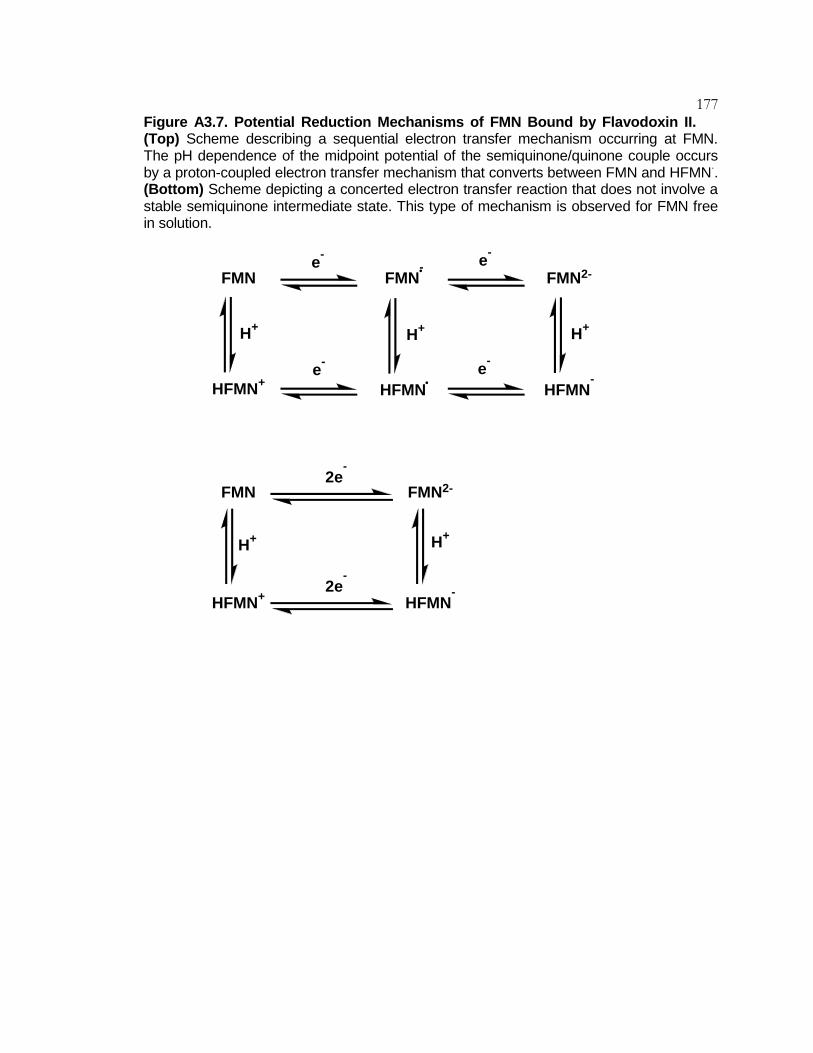
177 Figure A3.7. Potential Reduction Mechanisms of FMN Bound by Flavodoxin II. (Top) Scheme describing a sequential electron transfer mechanism occurring at FMN. The pH dependence of the midpoint potential of the semiquinone/quinone couple occurs by a proton-coupled electron transfer mechanism that converts between FMN and HFMN·. (Bottom) Scheme depicting a concerted electron transfer reaction that does not involve a stable semiquinone intermediate state. This type of mechanism is observed for FMN free in solution.
FMN FMN2-
HFMN+ HFMN HFMN-
H+ H+ H+
FMN-e- e-
e-e-
FMN
HFMN+ HFMN-
FMN2-2e
-
H+ H+
2e-
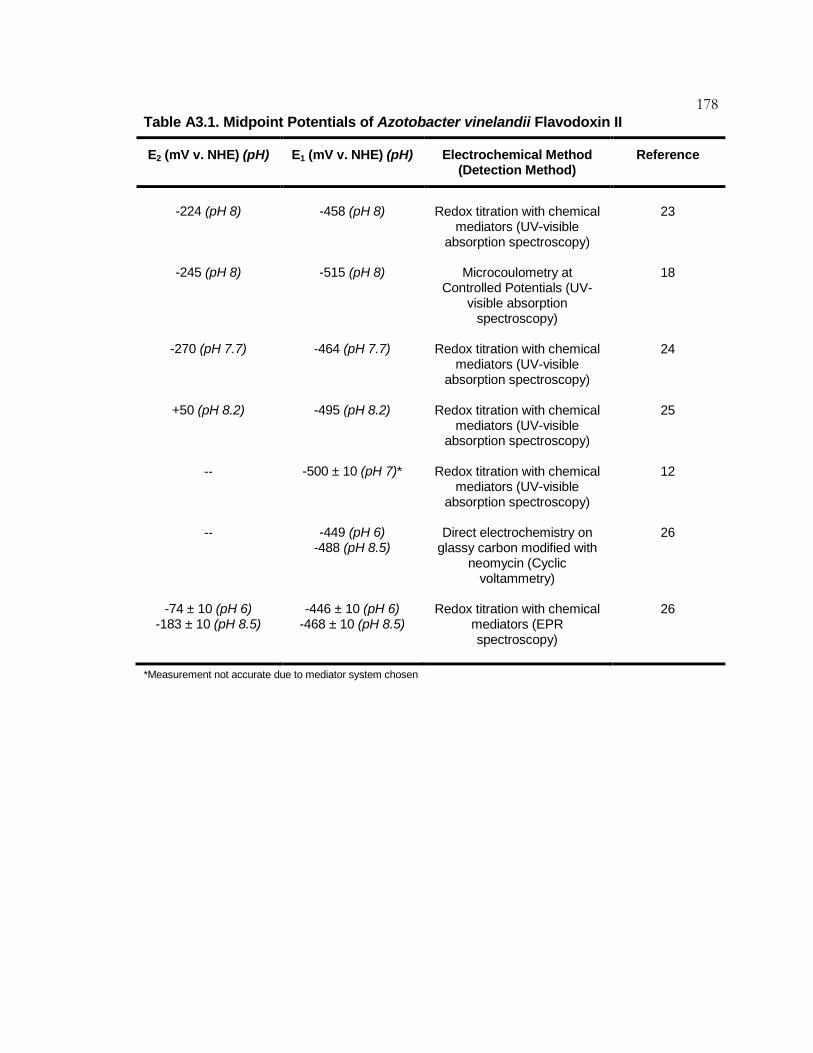
178 Table A3.1. Midpoint Potentials of Azotobacter vinelandii Flavodoxin II
E2 (mV v. NHE) (pH)
E1 (mV v. NHE) (pH)
Electrochemical Method (Detection Method)
Reference
-224 (pH 8)
-458 (pH 8)
Redox titration with chemical
mediators (UV-visible absorption spectroscopy)
23
-245 (pH 8) -515 (pH 8) Microcoulometry at Controlled Potentials (UV-
visible absorption spectroscopy)
18
-270 (pH 7.7) -464 (pH 7.7) Redox titration with chemical mediators (UV-visible
absorption spectroscopy)
24
+50 (pH 8.2) -495 (pH 8.2) Redox titration with chemical mediators (UV-visible
absorption spectroscopy)
25
-- -500 ± 10 (pH 7)* Redox titration with chemical mediators (UV-visible
absorption spectroscopy)
12
-- -449 (pH 6) -488 (pH 8.5)
Direct electrochemistry on glassy carbon modified with
neomycin (Cyclic voltammetry)
26
-74 ± 10 (pH 6) -183 ± 10 (pH 8.5)
-446 ± 10 (pH 6) -468 ± 10 (pH 8.5)
Redox titration with chemical mediators (EPR spectroscopy)
26
*Measurement not accurate due to mediator system chosen

179 Table A3.2. Data Collection and Refinement Statistics for A. vinelandii Flavodoxin II (nifF). Values in brackets represent the highest resolution shell.
Data collection statistics Oxidized (Quinone)
Reduced (Hydroquinone)
Wavelength (Å)
0.99987
0.99987 Resolution range (Å) 35.73 – 1.17 (1.24 – 1.17) 35.62 – 1.38 (1.46 – 1.38)
Unique reflections 56,103 (7,613) 34,606 (4,689)
Completeness (%) 99.2 (95.0) 99.1 (94.2)
Multiplicity 18.4 (15.3) 18.1 (14.7)
Space group P31211 P31211
Unit cell parameters
a, b, c 39.87, 39.87, 178.66 39.82, 39.82, 178.09
α, β, γ 90.0, 90.0, 120.0 90.0, 90.0, 120.0
Rmerge 0.069 (0.686) 0.077 (0.782)
Rp.i.m.
CC1/2 0.016 (0.177)
0.999 (0.885)
0.018 (0.205)
1.000 (0.843)
Mn (I / σ(I)) 24.8 (4.4) 22.1 (4.1)
Refinement statistics
Rcryst (%)
13.22
17.42
Rfree (%) 16.56 20.10
r.m.s.d. bond lengths (Å) 0.029 0.014
r.m.s.d. bond angles (°) 2.431 1.280
Average B-factor (Å2) Ramachandran: allowed (outliers) (%)
9.33
99.4 (0.6)
18.00
99.4 (0.6)
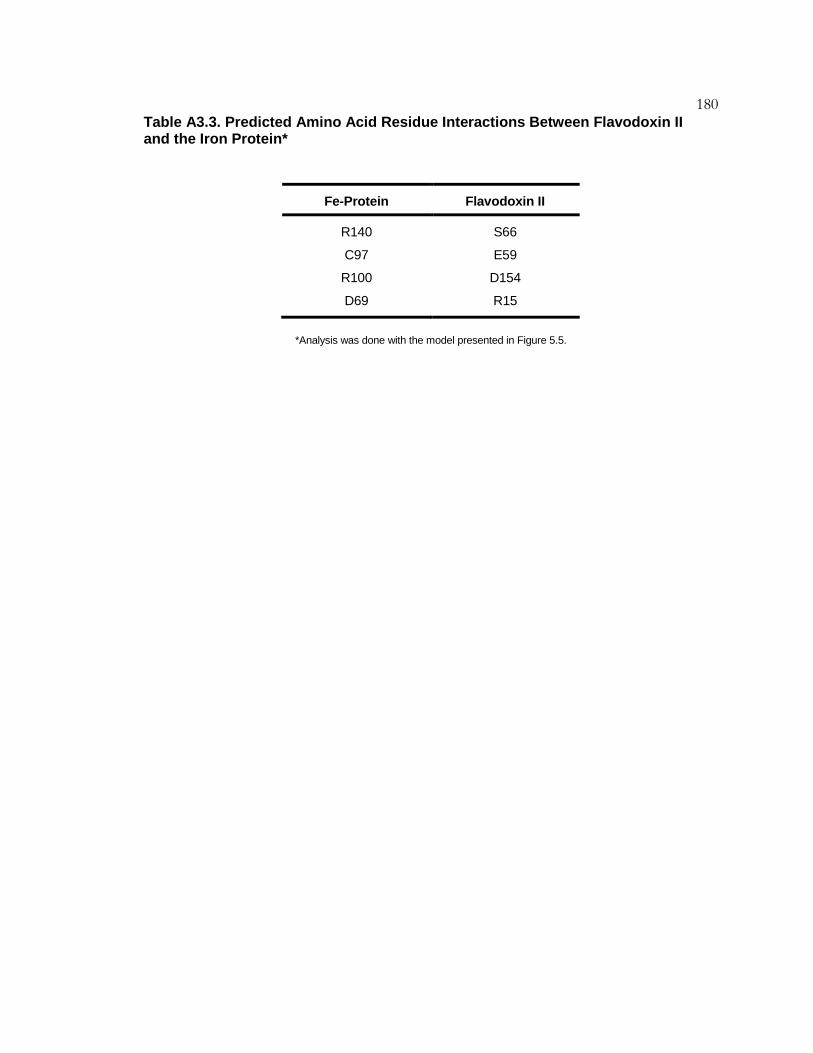
180 Table A3.3. Predicted Amino Acid Residue Interactions Between Flavodoxin II and the Iron Protein*
Fe-Protein
Flavodoxin II
R140
S66
C97 E59
R100 D154
D69 R15
*Analysis was done with the model presented in Figure 5.5.

181 A p p e n d i x 4
A METHOD FOR MONITORING DNA CHARGE TRANSPORT SIGNALING BETWEEN DNA REPAIR PROTEINS
Adapted from: Grodick, M. A., Segal, H.M., Zwang, T. J., and Barton, J. K. (2014) DNA-Mediated Signaling by Proteins with 4Fe-4S Clusters is Necessary for Genomic Integrity. J Am Chem Soc. 136, 6570-6478. doi: 10.1021/ja501973c.

182 Abstract An assay was developed to study DNA Charge Transport (DNA CT)
signaling between DinG, Endonuclease III (EndoIII), and MutY, three DNA repair
proteins with 4Fe-4S clusters. It was observed that inactivation of DinG within the
E. coli genome led to an increase in the number of GC to TA transversion
mutations. These mutations occur when MutY does not excise 8-oxoguanine from
the E. coli genome, so it was hypothesized that DinG helped target MutY to 8-
oxoguanine. Furthermore, it was shown that expression of EndoIII D138A, a
catalytically inactive form of EndoIII that could participate in DNA CT signaling can
partially rescue the mutagenic phenotype of the DinG knockout strain. It was also
shown that expression of EndoIII Y82A, a form of EndoIII that is catalytically active,
but DNA CT deficient, showed no significant difference in the levels of
mutagenesis relative to both the DinG knockout strain and the DinG knockout
strain with EndoIII D138A. Thus, DNA CT could be used by the DNA repair
proteins in E. coli to coordinate the repair of 8-oxoguanine.
Introduction
A variety of in vitro experiments have suggested that DNA CT has an
important biological role; however, finding evidence for DNA CT in vivo still
remains a major challenge. Toward this end, an E.coli lac+ forward reversion assay
has been developed to probe whether EndoIII, MutY, and DinG use a redox-active
4Fe-4S clusters bound by these enzymes to signal via long range DNA CT as a
first step in DNA damage detection (1,2). This assay will herein be referred to as
the Helper Function Assay.
The Helper Function Assay is adapted from an experiment designed to
identify E. coli proteins involved in the repair of 8-oxoguanine (8-OxoG) (3,4). For
these experiments, an E. coli strain was constructed that contains a version of lacZ
with an internal AT to CG point mutation (LacZ-) in the codon that corresponds to
amino acid residue 461, an essential catalytic residue in β-galactosidase (Figure
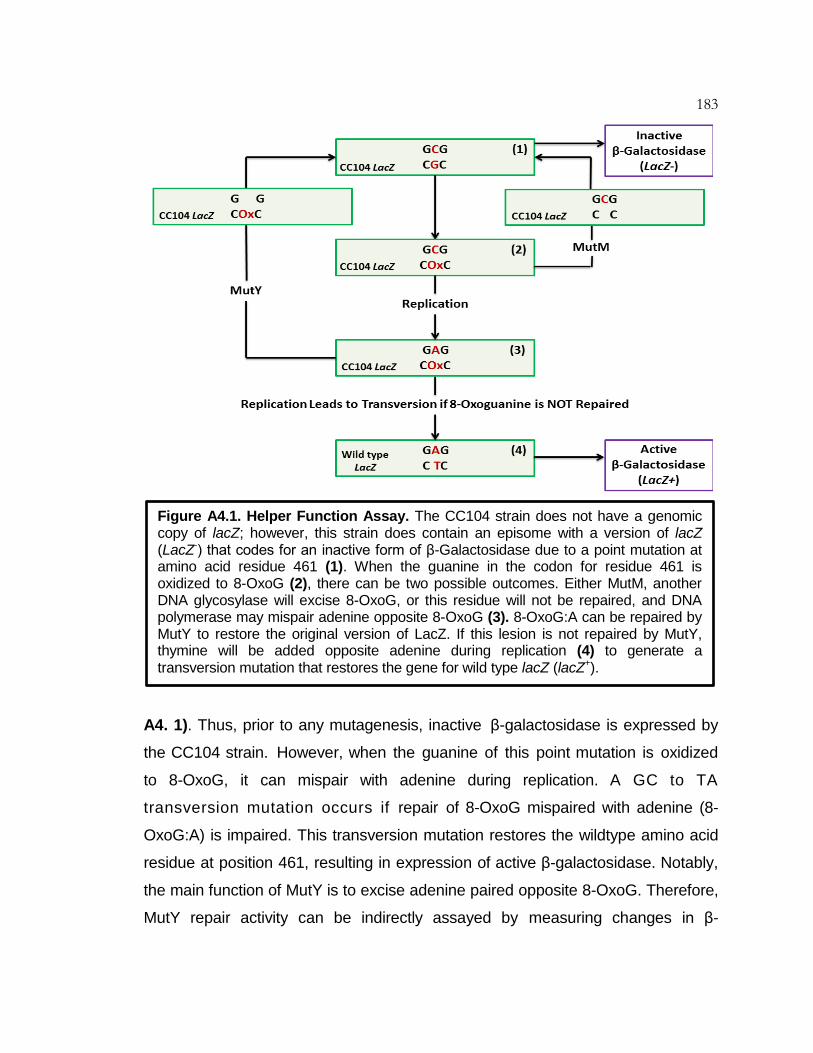
183
A4. 1). Thus, prior to any mutagenesis, inactive β-galactosidase is expressed by
the CC104 strain. However, when the guanine of this point mutation is oxidized
to 8-OxoG, it can mispair with adenine during replication. A GC to TA
transversion mutation occurs if repair of 8-OxoG mispaired with adenine (8-
OxoG:A) is impaired. This transversion mutation restores the wildtype amino acid
residue at position 461, resulting in expression of active β-galactosidase. Notably,
the main function of MutY is to excise adenine paired opposite 8-OxoG. Therefore,
MutY repair activity can be indirectly assayed by measuring changes in β-
Figure A4.1. Helper Function Assay. The CC104 strain does not have a genomic copy of lacZ; however, this strain does contain an episome with a version of lacZ (LacZ-) that codes for an inactive form of β-Galactosidase due to a point mutation at amino acid residue 461 (1). When the guanine in the codon for residue 461 is oxidized to 8-OxoG (2), there can be two possible outcomes. Either MutM, another DNA glycosylase will excise 8-OxoG, or this residue will not be repaired, and DNA polymerase may mispair adenine opposite 8-OxoG (3). 8-OxoG:A can be repaired by MutY to restore the original version of LacZ. If this lesion is not repaired by MutY, thymine will be added opposite adenine during replication (4) to generate a transversion mutation that restores the gene for wild type lacZ (lacZ+).
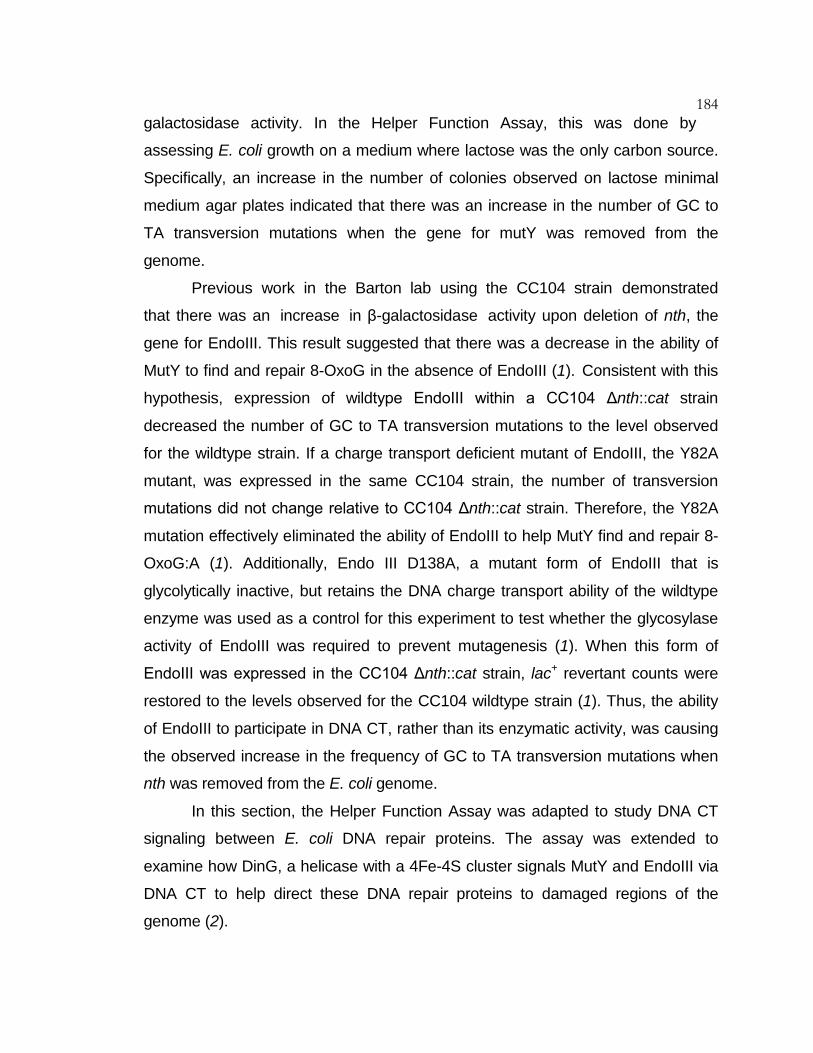
184 galactosidase activity. In the Helper Function Assay, this was done by
assessing E. coli growth on a medium where lactose was the only carbon source.
Specifically, an increase in the number of colonies observed on lactose minimal
medium agar plates indicated that there was an increase in the number of GC to
TA transversion mutations when the gene for mutY was removed from the
genome. Previous work in the Barton lab using the CC104 strain demonstrated
that there was an increase in β-galactosidase activity upon deletion of nth, the
gene for EndoIII. This result suggested that there was a decrease in the ability of
MutY to find and repair 8-OxoG in the absence of EndoIII (1). Consistent with this
hypothesis, expression of wildtype EndoIII within a CC104 Δnth::cat strain
decreased the number of GC to TA transversion mutations to the level observed
for the wildtype strain. If a charge transport deficient mutant of EndoIII, the Y82A
mutant, was expressed in the same CC104 strain, the number of transversion
mutations did not change relative to CC104 Δnth::cat strain. Therefore, the Y82A
mutation effectively eliminated the ability of EndoIII to help MutY find and repair 8-
OxoG:A (1). Additionally, Endo III D138A, a mutant form of EndoIII that is
glycolytically inactive, but retains the DNA charge transport ability of the wildtype
enzyme was used as a control for this experiment to test whether the glycosylase
activity of EndoIII was required to prevent mutagenesis (1). When this form of
EndoIII was expressed in the CC104 Δnth::cat strain, lac+ revertant counts were
restored to the levels observed for the CC104 wildtype strain (1). Thus, the ability
of EndoIII to participate in DNA CT, rather than its enzymatic activity, was causing
the observed increase in the frequency of GC to TA transversion mutations when
nth was removed from the E. coli genome.
In this section, the Helper Function Assay was adapted to study DNA CT
signaling between E. coli DNA repair proteins. The assay was extended to
examine how DinG, a helicase with a 4Fe-4S cluster signals MutY and EndoIII via
DNA CT to help direct these DNA repair proteins to damaged regions of the
genome (2).
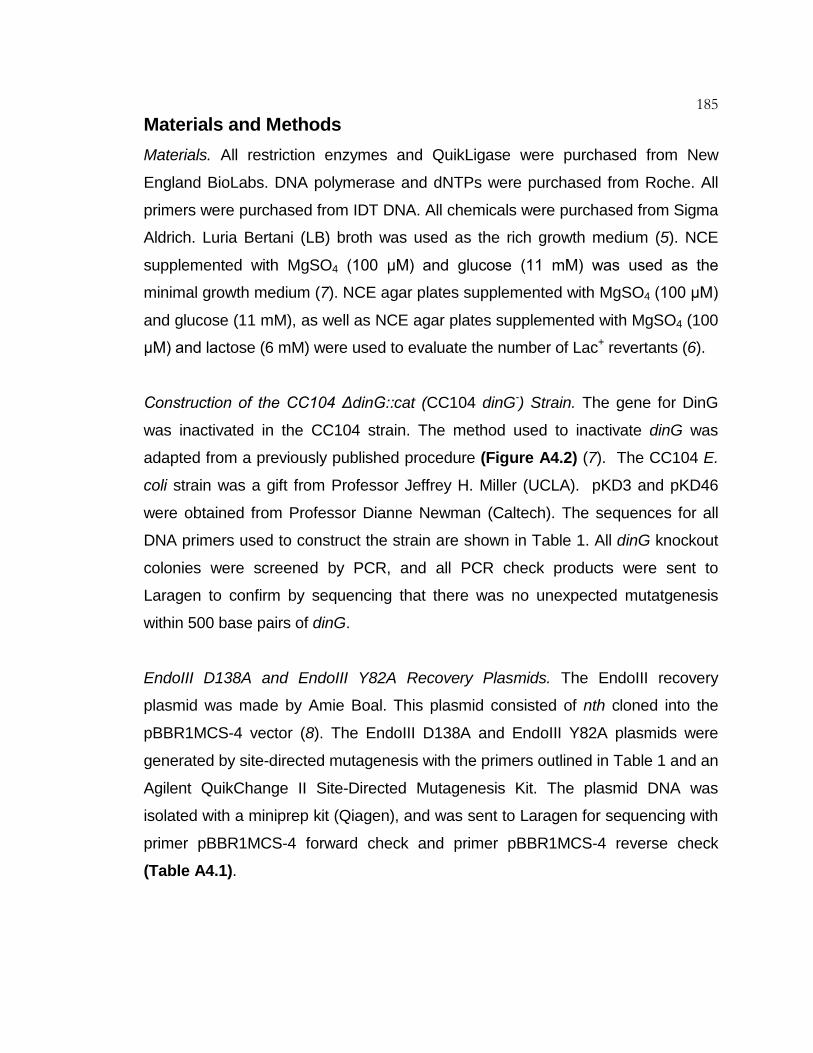
185 Materials and Methods
Materials. All restriction enzymes and QuikLigase were purchased from New
England BioLabs. DNA polymerase and dNTPs were purchased from Roche. All
primers were purchased from IDT DNA. All chemicals were purchased from Sigma
Aldrich. Luria Bertani (LB) broth was used as the rich growth medium (5). NCE
supplemented with MgSO4 (100 μM) and glucose (11 mM) was used as the
minimal growth medium (7). NCE agar plates supplemented with MgSO4 (100 μM)
and glucose (11 mM), as well as NCE agar plates supplemented with MgSO4 (100
μM) and lactose (6 mM) were used to evaluate the number of Lac+ revertants (6).
Construction of the CC104 ΔdinG::cat (CC104 dinG-) Strain. The gene for DinG
was inactivated in the CC104 strain. The method used to inactivate dinG was
adapted from a previously published procedure (Figure A4.2) (7). The CC104 E.
coli strain was a gift from Professor Jeffrey H. Miller (UCLA). pKD3 and pKD46
were obtained from Professor Dianne Newman (Caltech). The sequences for all
DNA primers used to construct the strain are shown in Table 1. All dinG knockout
colonies were screened by PCR, and all PCR check products were sent to
Laragen to confirm by sequencing that there was no unexpected mutatgenesis
within 500 base pairs of dinG.
EndoIII D138A and EndoIII Y82A Recovery Plasmids. The EndoIII recovery
plasmid was made by Amie Boal. This plasmid consisted of nth cloned into the
pBBR1MCS-4 vector (8). The EndoIII D138A and EndoIII Y82A plasmids were
generated by site-directed mutagenesis with the primers outlined in Table 1 and an
Agilent QuikChange II Site-Directed Mutagenesis Kit. The plasmid DNA was
isolated with a miniprep kit (Qiagen), and was sent to Laragen for sequencing with
primer pBBR1MCS-4 forward check and primer pBBR1MCS-4 reverse check
(Table A4.1).
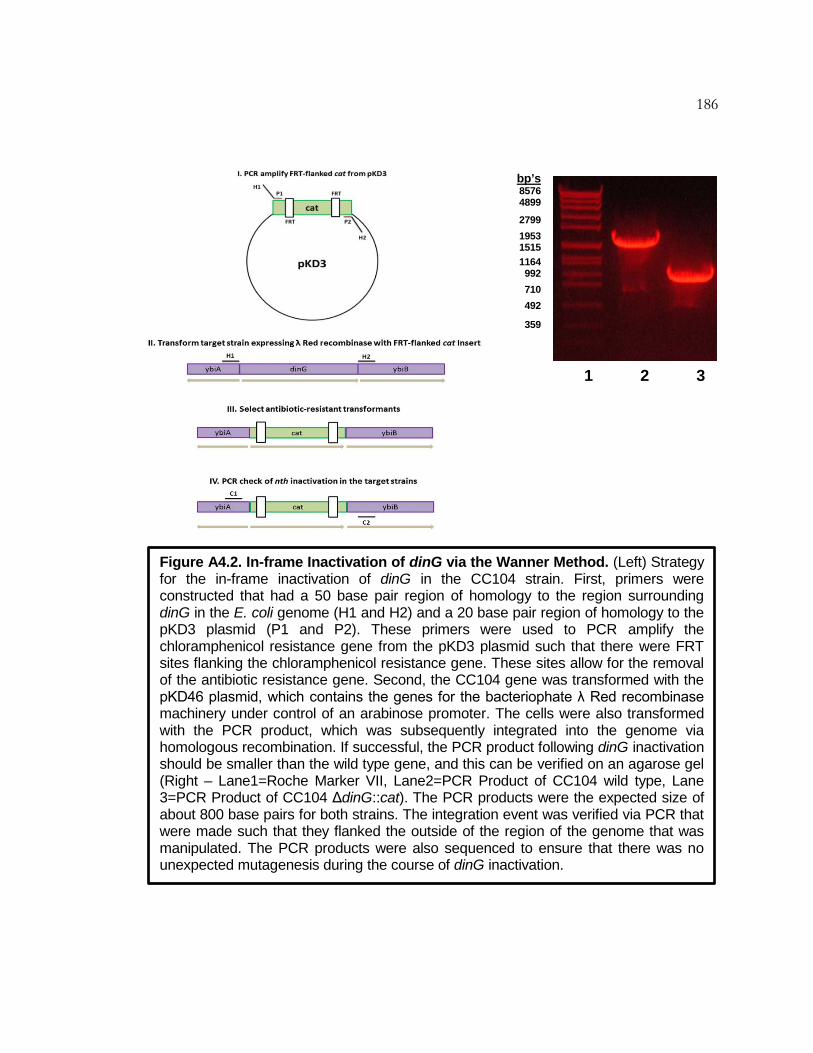
186
1 2 3
bp’s 8576 4899
2799
1953 1515
1164 992
710
492
359
Figure A4.2. In-frame Inactivation of dinG via the Wanner Method. (Left) Strategy for the in-frame inactivation of dinG in the CC104 strain. First, primers were constructed that had a 50 base pair region of homology to the region surrounding dinG in the E. coli genome (H1 and H2) and a 20 base pair region of homology to the pKD3 plasmid (P1 and P2). These primers were used to PCR amplify the chloramphenicol resistance gene from the pKD3 plasmid such that there were FRT sites flanking the chloramphenicol resistance gene. These sites allow for the removal of the antibiotic resistance gene. Second, the CC104 gene was transformed with the pKD46 plasmid, which contains the genes for the bacteriophate λ Red recombinase machinery under control of an arabinose promoter. The cells were also transformed with the PCR product, which was subsequently integrated into the genome via homologous recombination. If successful, the PCR product following dinG inactivation should be smaller than the wild type gene, and this can be verified on an agarose gel (Right – Lane1=Roche Marker VII, Lane2=PCR Product of CC104 wild type, Lane 3=PCR Product of CC104 ΔdinG::cat). The PCR products were the expected size of about 800 base pairs for both strains. The integration event was verified via PCR that were made such that they flanked the outside of the region of the genome that was manipulated. The PCR products were also sequenced to ensure that there was no unexpected mutagenesis during the course of dinG inactivation.
187 DinG Recovery Plasmid. Mike Grodick isolated and restriction enzyme digested
the pBBR1MCS-4 cloning vector (8) with XbaI and SacI. Mike Grodick also
prepared and restriction enzyme (XbaI and SacI) digested the dinG insert
generated by colony PCR in E. coli K12 MG1655. The dinG insert was ligated into
pBBR1MCS-4, and was transformed into TOP10 electrocompetent cells
(Invitrogen). The plasmid DNA was isolated from the transformed cells with a
Qiagen miniprep kit. All plasmids were sent to Laragen for sequencing with the
sequencing primers: primer pBBR1MS-4 forward check, primer pBBR1MCS-4
reverse check, primer dinG internal forward check, and primer dinG internal
reverse check (Table A4.1).
Lac+ Reversion Assay (without plasmid transformation). Strains were streaked to
LB agar plates with the appropriate antibiotic:
Strain Antibiotic Resistance (Concentration in media)
CC104 None
CC104 ΔdinG::cat Chloramphenicol (25 μg/mL)
The plates were incubated at 37 °C for 12 hours. Then, one colony was
suspended in 1 mL LB, and incubated with shaking at 37 °C for 16 hours. 250 μL
of this culture was spread to NCE lactose (0.2% w/v) ampicillin (40 μg/mL) agar
plates, and incubated at 37 °C. The number of lac+ revertants was counted after
48 hours and 72 hours.
Lac+ Reversion Assay (with plasmid transformation). Strains were streaked to LB
agar plates with the appropriate antibiotic:
Strain Antibiotic Resistance (Concentration in media)
CC104 None
CC104 ΔdinG::cat Chloramphenicol (25 μg/mL)
188 The plates were incubated at 37 °C for 12 hours. Then, one colony was
suspended in 1 mL LB, and incubated with shaking at 37 °C for 12 hours. The next
day the cells were transformed with the appropriate plasmid. First, 50 μL of the
starter culture was used to inoculate a 10 mL LB culture, and these cultures were
incubated at 37 °C with shaking until the OD600 was between 0.6 and 0.8. Then,
the cells were pelleted via centrifugation, and were washed with 10 % glycerol five
times to make them electrocompetent. The cells were re-suspended in 300 μL 10
% glycerol. Then, 75 μL of these cells were transformed with 25 ng of the desired
plasmid via electroporation (1.8 kV). Following electroporation, the cells were
recovered in 1 mL LB for 2 hours, then the cells were spread onto LB ampicillin
agar (100 μg/mL) plates to select for successful transformants. These plates were
incubated for 16 hours. The cells were re-streaked onto fresh LB ampicillin (100
μg/mL) agar plates. These plates were incubated at 37 °C for 12 hours. One
colony from each plate was suspended in a 1 mL LB ampicillin (100 μg/mL)
culture. These cultures were incubated with shaking at 37 °C for 16 hours. 250 μL
of each culture was spread onto NCE lactose (0.2% w/v) ampicillin (40 μg/mL)
agar plates, and the plates were incubated at 37 °C. The number of lac+ revertants
was counted after 48 hours and 72 hours.
Cell growth between strains was monitored by evaluating the total number
of colony forming units on NCE glucose (0.2% w/v) ampicillin (40 μg/mL) agar
plate. The agar plates were incubated at 37 °C for 24 hours. Three replicates were
performed for each sample. One sample was chosen from each strain to assay for
cell growth.
Growth Curves. The CC104 and CC104 dinG- strains were transformed with
plasmid according to the procedure outlined above in ‘Lac+ Reversion Assay for
DinG (with Plasmid Transformation)’. The transformed strains were streaked to
fresh LB ampicillin (100 μg/mL) agar plates, and then these plates were incubated
at 37 °C for 12 hours. Three separate colonies from each plate were suspended in
189 an LB ampicillin (100 μg/mL). These cultures were incubated at 37 °C with
shaking (200 RPM) for about 13 hours.
The next day, 20 μL of each overnight culture was used to inoculate a fresh
10 mL LB ampicillin (100 μg/mL) culture. These cultures were incubated at 37 °C
with shaking (200 RPM, Multitrion Shaking Incubator (Model #AJ150 from ATR
Biotech)). At different time points, a sample was removed from each culture, and
was placed in a plastic cuvette. The OD600 of each culture was obtained on a UV-
Visible absorption spectrometer (Beckman-Coulter). 500 μL total volume was
assayed for each time reading. 500 μL of LB was used to blank the instrument.
The amount of culture used was diluted appropriately such that all OD600
measurements were between 0.2 and 1.0 absorbance units (AU).
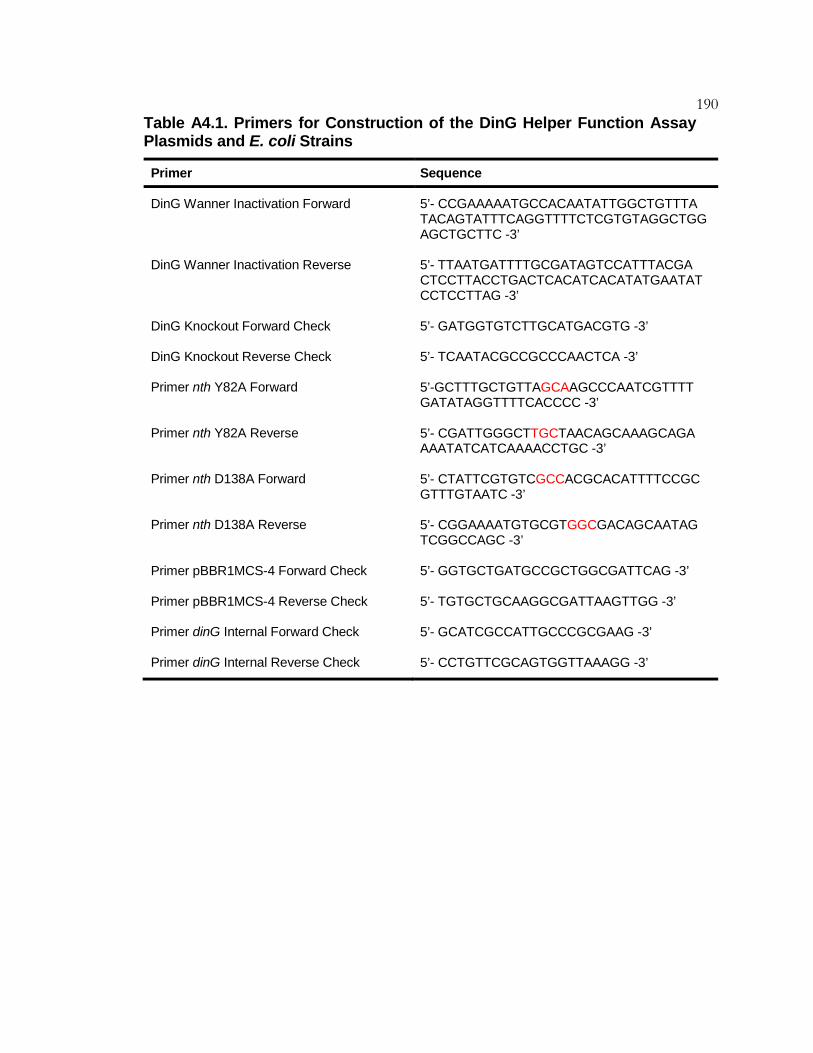
190 Table A4.1. Primers for Construction of the DinG Helper Function Assay Plasmids and E. coli Strains
Primer
Sequence
DinG Wanner Inactivation Forward
5’- CCGAAAAATGCCACAATATTGGCTGTTTA TACAGTATTTCAGGTTTTCTCGTGTAGGCTGGAGCTGCTTC -3’
DinG Wanner Inactivation Reverse 5’- TTAATGATTTTGCGATAGTCCATTTACGA CTCCTTACCTGACTCACATCACATATGAATATCCTCCTTAG -3’
DinG Knockout Forward Check 5’- GATGGTGTCTTGCATGACGTG -3’
DinG Knockout Reverse Check 5’- TCAATACGCCGCCCAACTCA -3’
Primer nth Y82A Forward 5’-GCTTTGCTGTTAGCAAGCCCAATCGTTTT GATATAGGTTTTCACCCC -3’
Primer nth Y82A Reverse 5’- CGATTGGGCTTGCTAACAGCAAAGCAGA AAATATCATCAAAACCTGC -3’
Primer nth D138A Forward 5’- CTATTCGTGTCGCCACGCACATTTTCCGC GTTTGTAATC -3’
Primer nth D138A Reverse 5’- CGGAAAATGTGCGTGGCGACAGCAATAG TCGGCCAGC -3’
Primer pBBR1MCS-4 Forward Check 5’- GGTGCTGATGCCGCTGGCGATTCAG -3’
Primer pBBR1MCS-4 Reverse Check 5’- TGTGCTGCAAGGCGATTAAGTTGG -3’
Primer dinG Internal Forward Check 5’- GCATCGCCATTGCCCGCGAAG -3’
Primer dinG Internal Reverse Check 5’- CCTGTTCGCAGTGGTTAAAGG -3’

191 Results and Discussion
The CC104 ΔdinG::cat (CC104 dinG-) strain was assayed to determine if
the absence of dinG in the E. coli genome led to an increase in the frequency of
GC to TA transversion mutations relative to the wild type CC104 strain. This result
would suggest that DinG helps MutY find 8-OxoG:A. Initial results showed that the
absence of dinG did result in an increase in the frequency of GC to TA
transversion mutations (Figure A4.3). However, this result could not distinguish
between a general increase in mutagenesis as a result of deletion of DinG, a DNA
repair protein, or whether deletion of DinG led to an increase in the amount of
unrepaired 8-OxoG.
Furthermore, the observation that knocking out dinG has an effect on the
frequency of GC to TA transversion mutations does not allow for definitive
conclusions to be drawn regarding whether DinG uses DNA-mediated CT to help
MutY find its target lesion within the genome of E. coli. To more directly investigate
this process, the dinG knockout strain was transformed with a plasmid that allowed
for constitutive expression of a mutant form of EndoIII, EndoIII D138A. EndoIII
D138A retains its CT properties, but is enzymatically inactive. It was hypothesized
that this mutant form of EndoIII could substitute for the missing CT-signaling
Figure A4.3. Results of the Helper Function Assay for MutY Activity. Table 1 from Reference 2. CC104 ΔdinG is synonymous with CC104 dinG-. b Values for lac+ revertants per 109 cells are reported for at least twenty independent trials ± standard error. c Relative to CC104 is defined as the ratio of lac+ revertants for the CC104 dinG knockout strain to the number of lac+ revertants for the wild type CC104 strain containing the sample plasmid as the dinG knockout strain. d p < 0.01 as calculated with a two-tailed Student’s t-test.

192 capacity of DinG. This experiment suggested that the presence of this plasmid
did in fact decrease the number of lac+ revertants observed for the CC104 dinG-
strain (Figure 4). However, when the CT-deficient mutant of EndoIII, EndoIII Y82A,
was introduced into the strain there was not a statistically significant change in the
number of lac+ revertants, suggesting that the decrease in GC to TA transversion
mutations upon introduction of the pBBR1MCS-4 nth D138A plasmid was not due
to the CT proficiency of the version of EndoIII that was introduced into the CC104
strain.
The wild type CC104 strain was also transformed with the plasmids that
contained the gene for Endonuclease III Y82A and Endonuclease III D138A.
Based on previous results, it was expected that all of the strains should have the
same number of lac+ revertants (1). In contrast to this expectation, the number of
lac+ revertants was slightly different for the wild type CC104 strain transformed
with the different types of plasmid DNA. Thus, when the CC104 wild type strain
that was transformed with a specific plasmid was compared with the CC104 dinG-
strain transformed with that same plasmid, the trends predicted by the
redistribution model were observed. Specifically, EndoIII D138A rescued the
mutagenic phenotype of the CC104 dinG- strain while EndoIII Y82A could not
rescue this phenotype.
To confirm that disruption of dinG was responsible for the mutagenic
phenotype of the strain, the gene for this DNA helicase was introduced into the
CC104 dinG- strain on a plasmid with the pBBR1MCS-4 backbone (dinG recovery
plasmid). This recovery plasmid contained both dinG, and the region upstream of
dinG in the E. coli genome that contained transcriptional regulatory elements.
Introduction of DinG on this medium copy number plasmid led to a decrease in
overall cell viability as measured by the total number of colony forming units on
NCE glucose agar plates. This result is consistent with previous observations that,
expression of DinG at levels above those natural for the cell is toxic. Growth
curves were also performed to confirm this growth deficiency (Figure A4.4). Due
to the differences in cell viability between the CC104 dinG- strain and the CC104
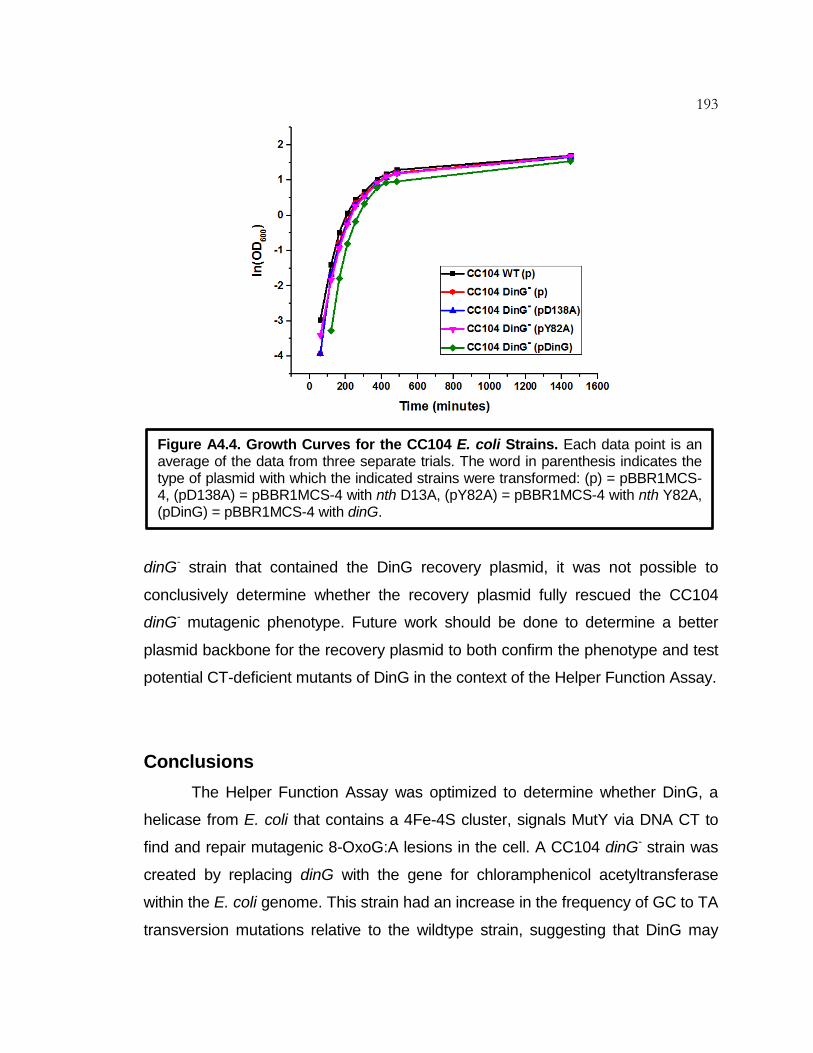
193
dinG- strain that contained the DinG recovery plasmid, it was not possible to
conclusively determine whether the recovery plasmid fully rescued the CC104
dinG- mutagenic phenotype. Future work should be done to determine a better
plasmid backbone for the recovery plasmid to both confirm the phenotype and test
potential CT-deficient mutants of DinG in the context of the Helper Function Assay.
Conclusions
The Helper Function Assay was optimized to determine whether DinG, a
helicase from E. coli that contains a 4Fe-4S cluster, signals MutY via DNA CT to
find and repair mutagenic 8-OxoG:A lesions in the cell. A CC104 dinG- strain was
created by replacing dinG with the gene for chloramphenicol acetyltransferase
within the E. coli genome. This strain had an increase in the frequency of GC to TA
transversion mutations relative to the wildtype strain, suggesting that DinG may
Figure A4.4. Growth Curves for the CC104 E. coli Strains. Each data point is an average of the data from three separate trials. The word in parenthesis indicates the type of plasmid with which the indicated strains were transformed: (p) = pBBR1MCS-4, (pD138A) = pBBR1MCS-4 with nth D13A, (pY82A) = pBBR1MCS-4 with nth Y82A, (pDinG) = pBBR1MCS-4 with dinG.

194 signal MutY via DNA CT to help MutY more effectively find and repair sites of
damage in the genome. To investigate this process further a plasmid was
introduced into the DinG knockout strain that contained the gene for an EndoIII
mutant, EndoIII D138A, that was catalytically inactive, but CT proficient. It was
shown that this strain led to a decrease in the total number of GC to TA
transversion mutations relative to the DinG knockout strain transformed with an
empty plasmid. When a CT deficient form of EndoIII was introduced into the DinG
knockout strain the rate of mutagenesis was the same as that observed for CC104
dinG-. These results suggest that DinG, MutY, and EndoIII all participate in DNA
CT signaling as a first step in DNA damage detection and repair.

195 References
1. Boal, A. K., et al. (2009) Redox Signaling Between DNA Repair Proteins for Efficient Lesion Detection. Proc Natl Ac Sci USA. 106, 15237-15242.
2. Grodick, M. A., Segal, H. M., Zwang, T. J., and Barton, J. K. (2014) DNA-Mediated Signaling by Proteins with 4Fe-4S Clusters Is Necessary for Genomic Integrity. J Am Chem Soc. 136, 6470-6478.
3. Cupples, C. G. and Miller, J. H. (1989) A Set of lacZ Mutations in
Escherichia coli that Allow Rapid Detection of Each of the Six Base Substitutions. Proc Natl Acad Sci USA. 86, 5345-5349.
4. Michaelis, M. L., Cruz, C., Grollman, A. P., and Miller, J. H. (1992) Evidence
that MutY and MutM Combine to Prevent Mutations by an Oxidatively Damaged Form of Guanine in DNA. Proc Natl Ac Sci USA. 89, 7022-7025.
5. Davis, R.W.; Botstein, D.; Roth, J.R. (1980) Advanced Bacterial Genetics. A Manual for Genetic Engineering Cold Spring Harbor Laboratory.
6. Miller, J. H. (1992) A Short Course in Bacterial Genetics: A Laboratory Manual and Handbook for Escherichia coli and Related Bacteria. Cold Spring Harbor Laboratory.
7. Datsenko, K. A. and Wanner, B. L. (2000) One-Step Inactivation of Chromosomal Genes in Escherichia coli K-12 using PCR Products. Proc. Natl. Ac. Sci. USA. 97, 6640-6645.
8. Kovach, M. E., Elzer, P. H., Hill, D. S., Robertson, G. T., Farris, M. A., Roop II, R. M., and Peterson, K. M. (1995) Four New Derivatives of the Broad-Host-Range Cloning Vector pBBR1MCS, Carrying Different Antibiotic-Resistance Cassettes. Gene. 166, 175-176.